c o r p o r a t i o n examination of recent deployment ... · examination of recent deployment...
TRANSCRIPT
Examination of Recent Deployment Experience Across the Services and Components
Jennie W. Wenger, Caolionn O’Connell, Linda Cottrell
SUM M ARY ■ Over the past 15 years, deploy-
ments have represented a key aspect of U.S. military
service, with many service members completing mul-
tiple tours. Given the disruption that they pose, it is not
surprising that deployments are associated with numer-
ous service member and family outcomes. For example,
spouses of deployed service members reported that their
children experienced behavioral and peer-related problems
during deployments (Meadows et al., 2016). Therefore,
accrued time deployed constitutes a relevant metric for
measuring military experience, but also for measuring
service member and family well-being. In this research,
we compare deployments (in terms of the total number
of deployments, and the total amount of time deployed) across the services and components. We
also examine the transitions of soldiers between Army components to determine whether the Army
retains soldiers with the largest amounts of deployments.1
To date, all of the services have contributed substantially to the 3.1 million troop-years of deploy-
ments since September 2001. The Army has provided the bulk of deployment experience. The vast
majority of soldiers who have deployed over the past 15 years are no longer serving in the Army. How-
ever, the Selected Reserve (SELRES) continues to retain deployments acquired in the Regular Army;
about one-quarter of the deployment experience in the SELRES was acquired by soldiers who deployed
while serving in the Regular Army. Also, a substantial proportion of the soldiers with the most intensive
deployment experience (those who have served at least three deployments) remain in the Army.
Since previous studies have shown the correlations between deployments and service member
and family well-being, it is important to characterize not only the deployments, but also the ser-
vice members who deploy. Enlisted personnel made up the bulk of those who have deployed, as did
personnel from the active component of their service. Most service members who deployed were
married at the time; nearly half had children. Average time spent in a single deployment varies across
the services. A typical deployment for soldiers in the Regular Army lasted about 12 months, whereas
other active service members’ deployments are about five to seven months.2 Very short deploy-
C O R P O R A T I O N
• Between 9/11 and September 2015, 2.77 million
service members served on more than 5.4 million
deployments.
• Soldiers across the Army’s components have provided
the majority of the deployments.
• The Selected Reserve provides one way to retain some
of the Army’s deployment experience.
Key findings

2
ments also occurred; they are somewhat more common in the Regular Army than in the SELRES. Given the
variation in length of a single deployment across the services, the same amount of total time deployed could
have different impacts depending on how that total deployment time was accumulated. Also, service mem-
bers’ individual resilience to deployments may vary. Given such variation, deployment experience may need
to be managed differently across services and personnel. Tracking deployment experience carefully, in terms
of total number of deployments and total time deployed, would likely assist in managing these differences.
INTRODUCTION
Deployments are a key aspect of military service, especially in the post-9/11 era, and experience acquired while
deployed represents a specialized type of experience within the services. However, deployments vary across the
services, components, and years. Tracking these differences has value, especially since deployments have been
linked to the well-being of service members and their families. Indeed, both the number of deployments and
the cumulative time spent deployed are associated with a wide variety of relevant outcomes; examples include
service members’ physical and mental health, but also postdeployment earnings of reservists, well-being and
academic performance of service members’ children, the quality of marital relationships, and spouses’ labor
force participation.3 Prior research also suggests that deployments are related to the willingness to reenlist, but
that the relationship is not straightforward.4 Characterizing deployments by service and component, as well as
determining the number of personnel with key levels of deployment experience, could be helpful in determining
how best to manage the effects of multiple deployments or cumulative time deployed.
In the first section of this report we detail the number of service members deployed during the period
since the terrorist attacks of September 11, 2001, as well as the average length of these deployments and the
deployment experience accrued. We include information about service- and component-level differences.
In the next section, we focus on the Army, which provided the bulk of the deployments. Many who were
deployed have since left the Regular Army, but past research has found that the SELRES (U.S. Army Reserve
[USAR] and the Army National Guard of the United States [ARNGUS]) serves an important function in
retaining some personnel with accrued deployment experience (O’Connell, Wenger, and Hansen, 2014).5 Given
these findings, it is helpful to understand more about the flow of personnel and deployment experience into and
out of the Regular Army and the SELRES. To this end, we determine the number of soldiers with intensive
deployment experience; we also update previous analyses by documenting in detail the net flow of soldiers and
deployment experience into and out of the Regular Army and the SELRES (Bonds, Baiocchi, and McDonald,
2010; Baiocchi, 2013; O’Connell, Wenger, and Hansen, 2014).
CHARACTERIZING DEPLOYMENTS BY SERVICE
In the years since 9/11, some 2.77 million service members have served on more than 5.4 million deploy-
ments. Table 1 includes some descriptive information about those who deployed between September 2001
and September 2015.6
Both the number of deployments and the cumulative time
spent deployed are associated with a wide variety of
relevant outcomes.

3
Table 1. Characteristics of Deployed Service Members
Characteristics Army Air Force Marine Corps Navy All Services
Individuals deployed by component, and by service
Regular 855,000 397,000 333,000 515,000 2,100,000
Reserve 156,000 47,000 38,000 55,000 295,000
National Guard 344,000 84,000 N/A N/A 428,000
Totala 1,326,000 518,000 367,000 563,000 2,774,000
Number of deployments by rank, gender, and family structure
Commissioned Officer 325,000 284,000 73,000 172,000 854,000
Warrant Officer 73,000 0 6,000 7,000 86,000
Enlisted 1,938,000 968,000 597,000 1,009,000 4,512,000
Male 2,096,000 1,089,000 652,000 1,034,000 4,871,000
(90.0%) (87.2%) (96.6%) (87.5%) (89.6%)
Female 232,000 160,000 23,000 148,000 563,000
(10.0%) (12.8%) (3.4%) (12.5%) (10.4%)
Age at time of deployment
(Average, in years) 29.3 31.1 25.0 28.7 29.0
Married at 1,389,000 768,000 305,000 622,000 3,085,000
time of deployment (59.7%) (61.5%) (45.2%) (52.7%) (56.8%)
Had children at 1,164,000 606,000 198,000 492,000 2,460,000
time of deployment (50.0%) (48.5%) (29.4%) (41.6%) (45.3%)
Totala
2,335,972
1,252,424
676,351
1,187,932
5,452,679
Average number of cumulative months deployed, among those who have deployed
Regular 17.8 12.0 12.0 9.9
Reserveb 12.5 8.8 8.1 8.9
National Guardb 12.8 7.3 N/A N/A
SOURCE: RAND Arroyo Center Analysis of DMDC’s Contingency Tracking System Deployment File (September 2001 through September 2015; 2001 and 2015
represent partial calendar years). a Total figures are lower than the sum across rows because some service members deployed with multiple components or ranks. b As illustrated on p. 6, nearly 25 percent of cumulative months deployed in USAR and ARNG were accrued in the RA.
At the time of the deployment, about 57 percent of service
members were married, and 45 percent had children. Those
deployed were typically about 29 years of age. We note that
deployed reservists are, on average, substantially older than
those who deploy with the Regular services, although this is
less true in the Marine Corps, where the age difference is quite
small (age by component figures are excluded from Table 1 for
brevity).
Roughly 10 percent of those deployed were women,
although this percentage varies substantially across the services,
with women making up a larger proportion of those deployed
in the Air Force and Navy and a much smaller proportion in
the Marine Corps. To some extent, these patterns reflect the
breakdown of each service by gender. About 86 percent of
those deployed were enlisted at the time of deployment, while
13 percent were commissioned officers, and just over 1 percent
were warrant officers. Approximately three-quarters were serv-
ing in the Regular (rather than the Reserve or National Guard)
component of their service.
4
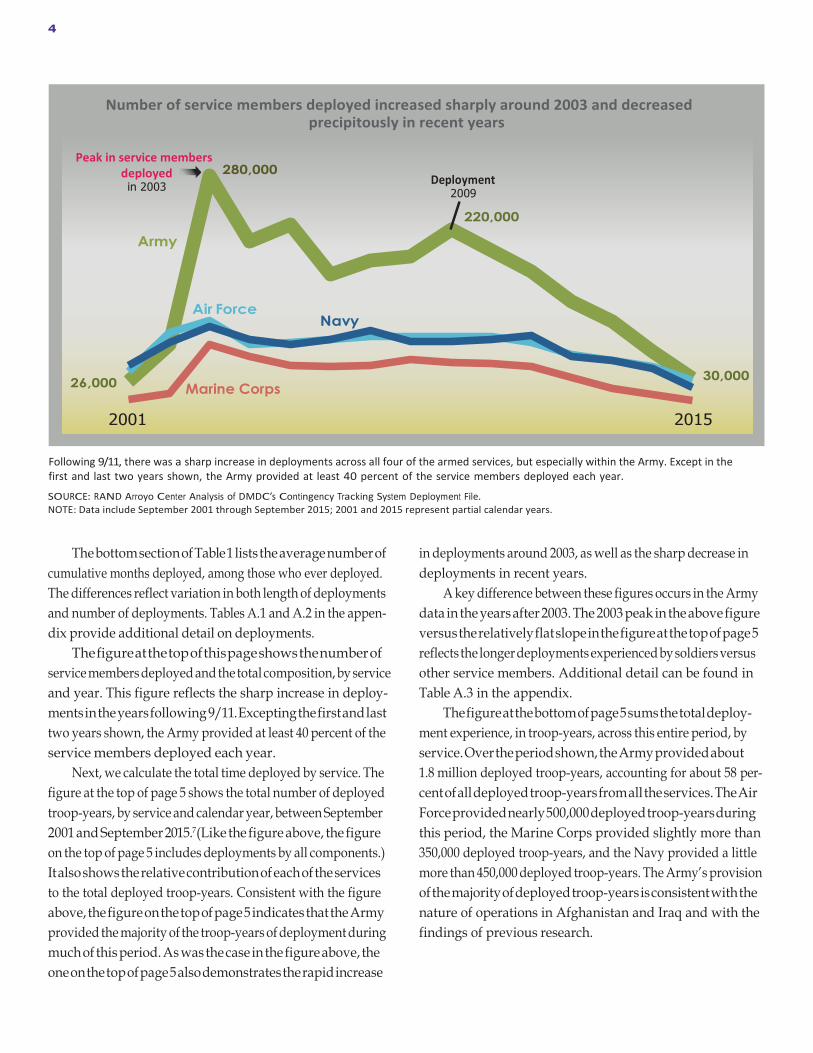
Following 9/11, there was a sharp increase in deployments across all four of the armed services, but especially within the Army. Except in the first and last two years shown, the Army provided at least 40 percent of the service members deployed each year.
SOURCE: RAND Arroyo Center Analysis of DMDC’s Contingency Tracking System Deployment File. NOTE: Data include September 2001 through September 2015; 2001 and 2015 represent partial calendar years.
The bottom section of Table 1 lists the average number of
cumulative months deployed, among those who ever deployed.
The differences reflect variation in both length of deployments
and number of deployments. Tables A.1 and A.2 in the appen-
dix provide additional detail on deployments.
The figure at the top of this page shows the number of
service members deployed and the total composition, by service
and year. This figure reflects the sharp increase in deploy-
ments in the years following 9/11. Excepting the first and last
two years shown, the Army provided at least 40 percent of the
service members deployed each year.
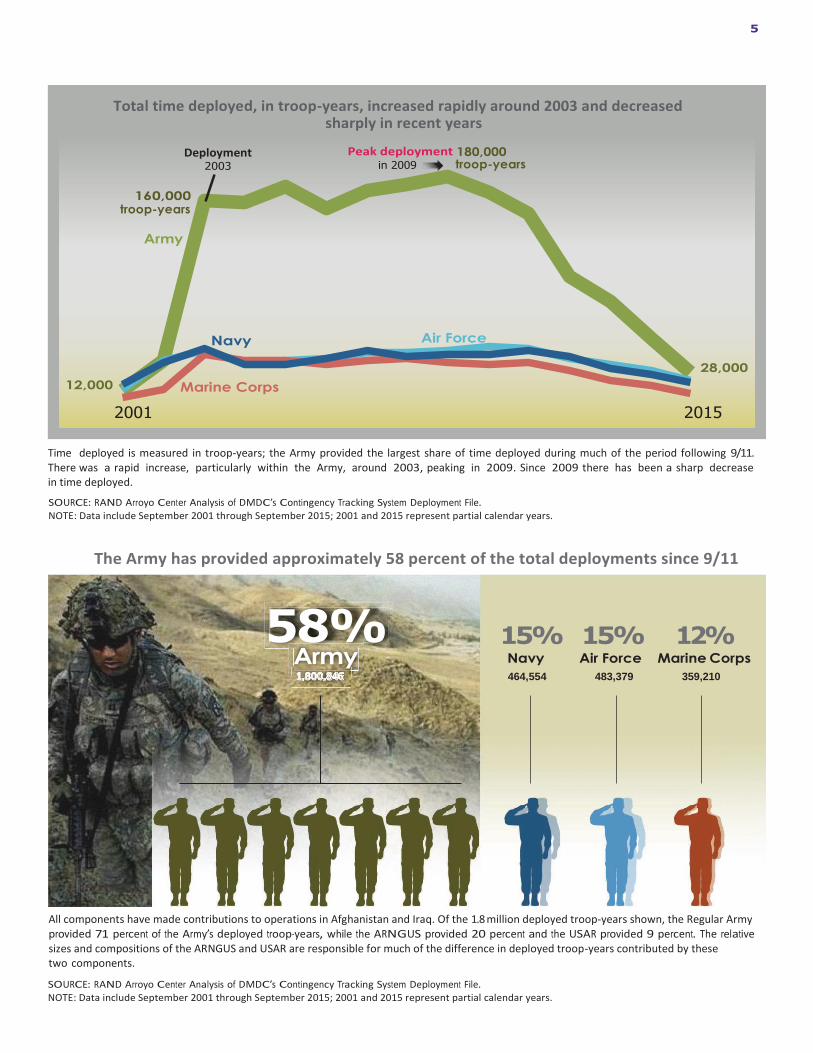
Next, we calculate the total time deployed by service. The
figure at the top of page 5 shows the total number of deployed
troop-years, by service and calendar year, between September
2001 and September 2015.7 (Like the figure above, the figure
on the top of page 5 includes deployments by all components.)
It also shows the relative contribution of each of the services
to the total deployed troop-years. Consistent with the figure
above, the figure on the top of page 5 indicates that the Army
provided the majority of the troop-years of deployment during
much of this period. As was the case in the figure above, the
one on the top of page 5 also demonstrates the rapid increase
in deployments around 2003, as well as the sharp decrease in
deployments in recent years.
A key difference between these figures occurs in the Army
data in the years after 2003. The 2003 peak in the above figure
versus the relatively flat slope in the figure at the top of page 5
reflects the longer deployments experienced by soldiers versus
other service members. Additional detail can be found in
Table A.3 in the appendix.
The figure at the bottom of page 5 sums the total deploy-
ment experience, in troop-years, across this entire period, by
service. Over the period shown, the Army provided about
1.8 million deployed troop-years, accounting for about 58 per-
cent of all deployed troop-years from all the services. The Air
Force provided nearly 500,000 deployed troop-years during
this period, the Marine Corps provided slightly more than
350,000 deployed troop-years, and the Navy provided a little
more than 450,000 deployed troop-years. The Army’s provision
of the majority of deployed troop-years is consistent with the
nature of operations in Afghanistan and Iraq and with the
findings of previous research.
2015 2001
30,000 Marine Corps 26,000
Navy Air Force
Army
Deployment 2009
220,000
280,000 deployed in 2003
Number of service members deployed increased sharply around 2003 and decreased precipitously in recent years
Peak in service members
5
Time deployed is measured in troop-years; the Army provided the largest share of time deployed during much of the period following 9/11. There was a rapid increase, particularly within the Army, around 2003, peaking in 2009. Since 2009 there has been a sharp decrease in time deployed.
SOURCE: RAND Arroyo Center Analysis of DMDC’s Contingency Tracking System Deployment File. NOTE: Data include September 2001 through September 2015; 2001 and 2015 represent partial calendar years.
The Army has provided approximately 58 percent of the total deployments since 9/11
All components have made contributions to operations in Afghanistan and Iraq. Of the 1.8 million deployed troop-years shown, the Regular Army provided 71 percent of the Army’s deployed troop-years, while the ARNGUS provided 20 percent and the USAR provided 9 percent. The relative sizes and compositions of the ARNGUS and USAR are responsible for much of the difference in deployed troop-years contributed by these two components.
SOURCE: RAND Arroyo Center Analysis of DMDC’s Contingency Tracking System Deployment File. NOTE: Data include September 2001 through September 2015; 2001 and 2015 represent partial calendar years.
2015 2001
Marine Corps 12,000
28,000
Air Force Navy
160,000 troop-years
Army
troop-years in 2009
Peak deployment 180,000 Deployment 2003
Total time deployed, in troop-years, increased rapidly around 2003 and decreased sharply in recent years
58% Army 1,800,846
15% 15% 12% Navy Air Force Marine Corps
464,554 483,379 359,210
6
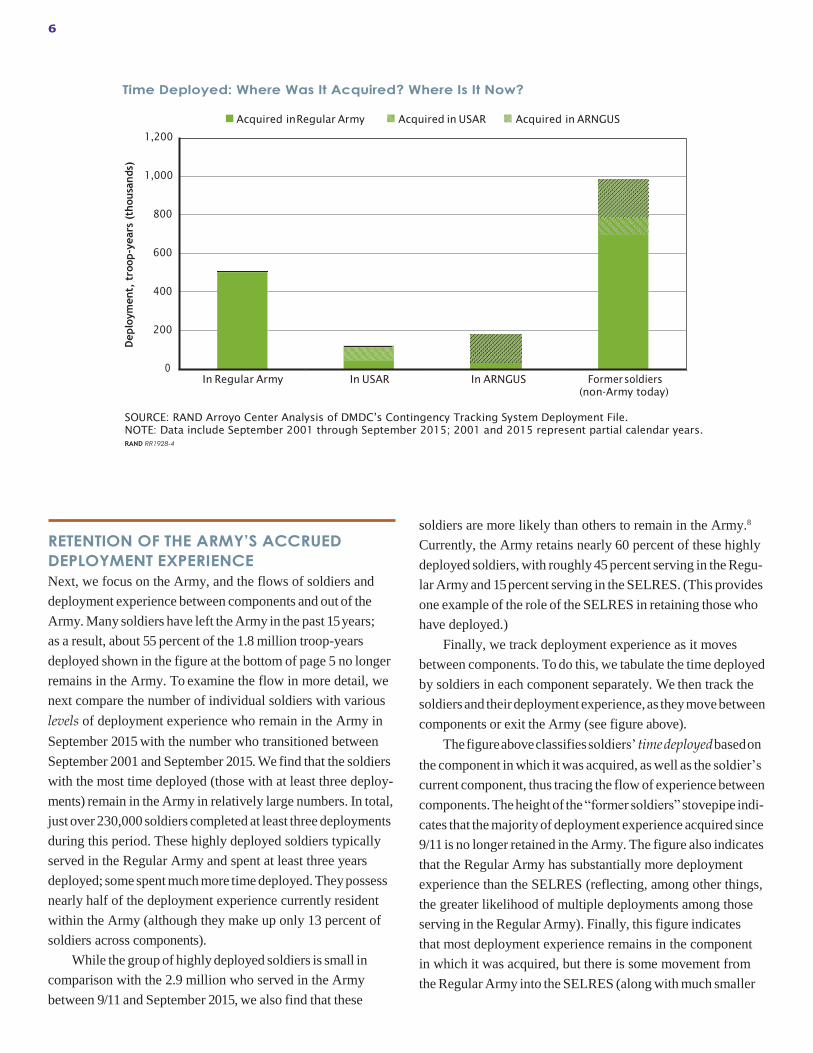
Time Deployed: Where Was It Acquired? Where Is It Now?
Acquired in Regular Army Acquired in USAR Acquired in ARNGUS
1,200
1,000
800
600
400
200
0
In Regular Army In USAR In ARNGUS Former soldiers
(non-Army today)
SOURCE: RAND Arroyo Center Analysis of DMDC’s Contingency Tracking System Deployment File.
NOTE: Data include September 2001 through September 2015; 2001 and 2015 represent partial calendar years.
RAND RR1928-4
RETENTION OF THE ARMY’S ACCRUED
DEPLOYMENT EXPERIENCE
Next, we focus on the Army, and the flows of soldiers and
deployment experience between components and out of the
Army. Many soldiers have left the Army in the past 15 years;
as a result, about 55 percent of the 1.8 million troop-years
deployed shown in the figure at the bottom of page 5 no longer
remains in the Army. To examine the flow in more detail, we
next compare the number of individual soldiers with various
levels of deployment experience who remain in the Army in
September 2015 with the number who transitioned between
September 2001 and September 2015. We find that the soldiers
with the most time deployed (those with at least three deploy-
ments) remain in the Army in relatively large numbers. In total,
just over 230,000 soldiers completed at least three deployments
during this period. These highly deployed soldiers typically
served in the Regular Army and spent at least three years
deployed; some spent much more time deployed. They possess
nearly half of the deployment experience currently resident
within the Army (although they make up only 13 percent of
soldiers across components).
While the group of highly deployed soldiers is small in
comparison with the 2.9 million who served in the Army
between 9/11 and September 2015, we also find that these
soldiers are more likely than others to remain in the Army.8
Currently, the Army retains nearly 60 percent of these highly
deployed soldiers, with roughly 45 percent serving in the Regu-
lar Army and 15 percent serving in the SELRES. (This provides
one example of the role of the SELRES in retaining those who
have deployed.)
Finally, we track deployment experience as it moves
between components. To do this, we tabulate the time deployed
by soldiers in each component separately. We then track the
soldiers and their deployment experience, as they move between
components or exit the Army (see figure above).
The figure above classifies soldiers’ time deployed based on
the component in which it was acquired, as well as the soldier’s
current component, thus tracing the flow of experience between
components. The height of the “former soldiers” stovepipe indi-
cates that the majority of deployment experience acquired since
9/11 is no longer retained in the Army. The figure also indicates
that the Regular Army has substantially more deployment
experience than the SELRES (reflecting, among other things,
the greater likelihood of multiple deployments among those
serving in the Regular Army). Finally, this figure indicates
that most deployment experience remains in the component
in which it was acquired, but there is some movement from
the Regular Army into the SELRES (along with much smaller
Deplo
ym
ent,
tro
op-y
ears
(th
ousa
nds)

7
movements from the SELRES into the Regular Army). Only
about 5 percent of all of the time deployed acquired in the
Regular Army is now resident in the SELRES, but this fraction
makes up about one-quarter of the total deployment experience
in the SELRES. (Recall that deployment patterns vary across
the components, with those in the SELRES spending less time
deployed than those in the Regular Army). The movement of
soldiers with deployment experience from the Regular Army to
the SELRES is consistent with prior research, but these updated
findings suggest that as soldiers with deployment experience
continue to leave the Army and the overall deployment levels
continue to fall, the SELRES may play an increasingly impor-
tant role in retaining deployment experience—and the experi-
ence of former Regular Army soldiers in the SELRES is likely
to make up an increasing proportion of the total deployment
experience resident in these components.
CONCLUSIONS
Between 9/11 and September 2015, 2.77 million service mem-
bers served on more than 5.4 million deployments. About 86
percent of those deployed were enlisted personnel, while about
10 percent were women. Deployed personnel were less than 30
years of age, on average; more than half were married at the
time of the deployment, and nearly half had children. The aver-
age length of a deployment varies across the services; multiple
deployments are not uncommon. As such, service members and
families have experienced substantial disruption over the past
15 years. The number of deployments and total time deployed
have been found to be linked to service member and family
well-being (see, e.g., Chandra et al., 2010). This, along with the
differing lengths of deployments across the services, suggests
that the same amount of total time deployed could have differ-
ent effects on members of different services and may need to
be managed differently across the services. As a first step, we
suggest tracking both the number of deployments and the total
time deployed carefully.
Soldiers across the Army’s three components provided the
majority of deployments, some 1.8 million troop-years, between
9/11 and September 2015. As of September 2015, the majority
of soldiers with deployment experience were no longer serving
in the Army; however, the majority of heavily deployed sol-
diers (those with three or more deployments) did remain in the
Army. Across the Army, these heavily deployed soldiers make
up about 13 percent of all soldiers, but they possess about half
of the deployment experience currently resident in the Army.
Some of these soldiers transitioned from the Regular Army to the
SELRES at some point during their careers, and the SELRES
continues to provide an avenue for retaining deployment experi-
ence. Indeed, the deployment experience of soldiers formerly
serving in the Regular Army makes up about one-quarter of the
total experience resident within the SELRES. This suggests that
continuing to encourage soldiers to consider the SELRES as an
option upon leaving the Regular Army also provides a method of
retaining deployment experience.
Across the services, a small group of service members has
served at least three deployments. These service members and
their families may be quite resilient, as many have chosen to
remain in the Army. However, given the evidence that both the
number of deployments and the total time spent deployed influ-
ence service member and family outcomes, carefully tracking
the resilience of this group appears to be a sensible approach.
Indeed, it may be appropriate to focus key resources and ser-
vices on these service members and their families. Finally, the
deployment experience of the most intensely deployed service
members represents a unique resource. Both time and changes
in the operational environment are likely to make deployment
experience less relevant over time. However, managing this
experience and seeking additional ways to transfer the knowl-
edge and skills obtained during deployment before those service
members choose to leave military service have the potential to
increase the effectiveness of training.
8
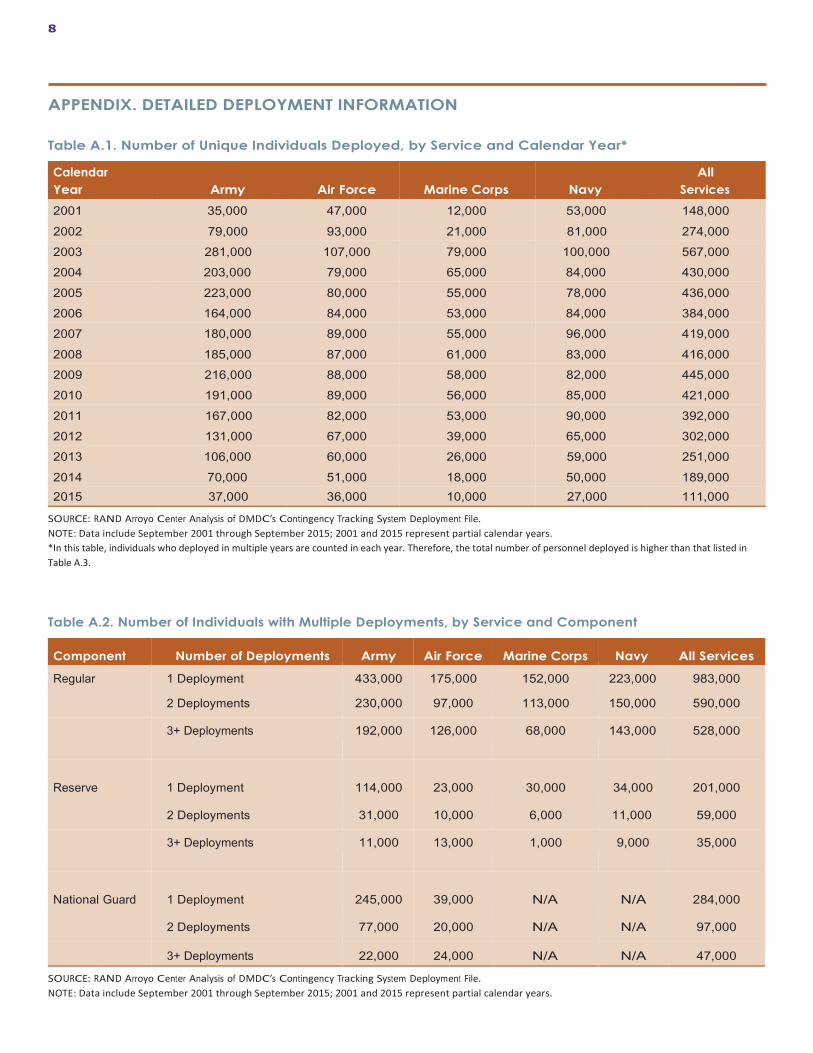
APPENDIX. DETAILED DEPLOYMENT INFORMATION
Table A.1. Number of Unique Individuals Deployed, by Service and Calendar Year*
Calendar
Year
Army
Air Force
Marine Corps
Navy
All
Services
2001 35,000 47,000 12,000 53,000 148,000
2002 79,000 93,000 21,000 81,000 274,000
2003 281,000 107,000 79,000 100,000 567,000
2004 203,000 79,000 65,000 84,000 430,000
2005 223,000 80,000 55,000 78,000 436,000
2006 164,000 84,000 53,000 84,000 384,000
2007 180,000 89,000 55,000 96,000 419,000
2008 185,000 87,000 61,000 83,000 416,000
2009 216,000 88,000 58,000 82,000 445,000
2010 191,000 89,000 56,000 85,000 421,000
2011 167,000 82,000 53,000 90,000 392,000
2012 131,000 67,000 39,000 65,000 302,000
2013 106,000 60,000 26,000 59,000 251,000
2014 70,000 51,000 18,000 50,000 189,000
2015 37,000 36,000 10,000 27,000 111,000
SOURCE: RAND Arroyo Center Analysis of DMDC’s Contingency Tracking System Deployment File.
NOTE: Data include September 2001 through September 2015; 2001 and 2015 represent partial calendar years.
*In this table, individuals who deployed in multiple years are counted in each year. Therefore, the total number of personnel deployed is higher than that listed in
Table A.3.
Table A.2. Number of Individuals with Multiple Deployments, by Service and Component
Component Number of Deployments Army Air Force Marine Corps Navy All Services
Regular
1 Deployment 433,000 175,000 152,000 223,000 983,000
2 Deployments 230,000 97,000 113,000 150,000 590,000
3+ Deployments 192,000 126,000 68,000 143,000 528,000
Reserve
1 Deployment
114,000
23,000
30,000
34,000
201,000
2 Deployments 31,000 10,000 6,000 11,000 59,000
3+ Deployments 11,000 13,000 1,000 9,000 35,000
National
Guard
1 Deployment
245,000
39,000
N/A
N/A
284,000
2 Deployments 77,000 20,000 N/A N/A 97,000
3+ Deployments 22,000 24,000 N/A N/A 47,000
SOURCE: RAND Arroyo Center Analysis of DMDC’s Contingency Tracking System Deployment File.
NOTE: Data include September 2001 through September 2015; 2001 and 2015 represent partial calendar years.

9
Table A.3. Total Deployments in Troop-Years, by Service, Component, and Calendar Year
Component CY Army Air Force Marine Corps Navy All Services
Regular Total 1,271,395 397,502 333,920 423,992 2,426,809
Regular 2001 6,002 6,980 2,276 12,176 27,435
Regular 2002 26,639 24,828 7,975 30,256 89,699
Regular 2003 116,063 30,205 32,668 38,770 217,706
Regular 2004 94,874 24,704 29,109 26,255 174,942
Regular 2005 100,710 26,608 29,560 25,751 182,629
Regular 2006 113,269 28,621 28,745 30,132 200,767
Regular 2007 130,696 31,931 32,318 36,459 231,404
Regular 2008 133,331 32,202 31,843 33,061 230,437
Regular 2009 127,100 33,397 27,818 32,335 220,650
Regular 2010 123,244 35,248 27,810 33,344 219,645
Regular 2011 110,682 35,142 28,553 36,511 210,888
Regular 2012 71,343 26,789 22,864 31,913 152,908
Regular 2013 58,822 24,816 15,044 23,843 122,525
Regular 2014 39,566 21,299 11,730 20,011 92,606
Regular 2015 19,053 14,732 5,607 13,176 52,569
Reserve Total 163,042 34,377 25,290 40,562 263,271
Reserve 2001 463 393 15 210 1,081
Reserve 2002 2,162 2,465 242 1,047 5,916
Reserve 2003 21,572 4,105 5,227 2,500 33,404
Reserve 2004 23,481 2,773 3,206 2,269 31,729
Reserve 2005 19,143 2,627 2,898 3,052 27,720
Reserve 2006 12,668 2,335 1,192 4,018 20,213
Reserve 2007 11,785 2,319 696 4,136 18,936
Reserve 2008 11,500 2,847 2,337 2,762 19,445
Reserve 2009 13,261 2,926 3,416 4,077 23,680
Reserve 2010 13,735 2,815 1,858 4,437 22,845
Reserve 2011 12,437 2,659 2,240 3,602 20,938
Reserve 2012 8,127 2,371 1,151 2,849 14,497
Reserve 2013 6,593 1,892 544 2,854 11,883
Reserve 2014 4,887 1,447 224 1,905 8,463
Reserve 2015 1,227 406 42 846 2,521
National Guard Total 366,410 51,500 N/A N/A 417,909
National Guard 2001 1,036 803 N/A N/A 1,839
National Guard 2002 3,778 4,309 N/A N/A 8,086
National Guard 2003 25,411 6,522 N/A N/A 31,933
National Guard 2004 43,009 3,093 N/A N/A 46,102
National Guard 2005 54,741 3,013 N/A N/A 57,754
National Guard 2006 31,019 3,451 N/A N/A 34,469
National Guard 2007 28,299 3,907 N/A N/A 32,206
National Guard 2008 30,426 4,019 N/A N/A 34,445
National Guard 2009 42,278 4,416 N/A N/A 46,695

10
Table A.3—Continued
Component CY Army Air Force Marine Corps Navy All Services
National Guard 2010 33,280 4,760 N/A N/A 38,040
National Guard 2011 28,502 3,905 N/A N/A 32,407
National Guard 2012 21,378 4,055 N/A N/A 25,433
National Guard 2013 15,295 2,927 N/A N/A 18,222
National Guard 2014 5,978 1,684 N/A N/A 7,662
National Guard 2015 1,980 636 N/A N/A 2,616
All components Total 1,800,846 483,379 359,210 464,554 3,107,989
All components 2001 7,501 8,176 2,291 12,386 30,355
All components 2002 32,580 31,602 8,218 31,303 103,701
All components 2003 163,046 40,832 37,895 41,270 283,042
All components 2004 161,365 30,570 32,315 28,524 252,773
All components 2005 174,595 32,248 32,458 28,802 268,103
All components 2006 156,956 34,407 29,937 34,150 255,449
All components 2007 170,780 38,157 33,014 40,595 282,546
All components 2008 175,257 39,069 34,180 35,823 284,328
All components 2009 182,639 40,740 31,234 36,412 291,025
All components 2010 170,260 42,822 29,668 37,781 280,530
All components 2011 151,620 41,706 30,793 40,113 264,233
All components 2012 100,848 33,214 24,015 34,762 192,838
All components 2013 80,710 29,635 15,588 26,697 152,630
All components 2014 50,431 24,429 11,954 21,916 108,730
All components 2015 22,260 15,774 5,650 14,022 57,706
SOURCE: RAND Arroyo Center Analysis of DMDC’s Contingency Tracking System Deployment File.
NOTE: Data include September 2001 through September 2015; 2001 and 2015 represent partial calendar years.
Notes
1 We are grateful to Laurie McDonald and Christine DeMartini for
their assistance in preparing the data for analysis. We are grateful to
Michael Hansen for his guidance throughout this project. We thank
our reviewers: Al Robbert of RAND, Terri Tanielian of RAND,
and Michelle Dolfini-Reed of the Center for Naval Analyses; their
comments and suggestions strengthened this document.
2 Due to the existence of very short deployments, the median
deployment is longer than the mean. The difference is especially
large in the Army; the mean Regular Army deployment in our
sample is nine months in length and one-to-two-month deploy-
ments make up 11 percent of all deployments. Deployments of 12
months or more are also more common in the Regular Army than
in the USAR or ARNGUS. We ran all analyses after excluding
one-to-two-month deployments; the results are very similar to
those shown here.
3 See, especially, Meadows et al., (2016), but also Loughran, Kler-
man, and Martin (2006), which focuses on reservists’ postdeploy-
ment earnings; Loughran and Klerman (2008) examines UCX
usage; Chandra et al. (2010) and Richardson et al. (2011) analyze
child well-being and school outcomes; Savaych (2008) analyzes
spousal labor force participation rates.
4 See Hosek, Kavanagh, and Miller (2006); Hosek and Martorell
(2009).
5 Throughout this report, we refer to the Army or Total Army to
include all Army components: the Regular Army, ARNGUS, and
USAR. We refer to the two reserve components (ARNGUS and
USAR) together as SELRES (Selected Reserve).
6 A deployment is defined as a service member physically located
within a combat zone or area of operations or a service member
specifically identified by his or her service as “directly supporting”
a contingency mission. This definition ensures our data are consis-
tent with data used by Defense Manpower Data Center (DMDC),
Office of the Secretary of Defense, and the services. Calculations
are based on data from DMDC’s Contingency Tracking System
Deployment File, September 2001 through September 2015.

11
The file includes all personnel who deployed; this includes personnel
in such specialized categories as full-time support. The year of each
deployment is defined as the year in which the deployment began.
In the figure at the bottom of page 5, service members who deploy
more than once in a single year are counted once (such deployments
occur infrequently). For more information, see the appendix.
7 As in previous analyses, we form a metric of troop-years by taking
the sum of the total number of months each service member has
been deployed, and expressing the number in years. Thus an indi-
vidual deployed for 12 months contributes one troop-year; three
individuals deployed for four months each also contribute one
troop-year. While this metric does not indicate the total number of
deployments, it allows us to compare the collective deployment expe-
rience across each service, even when average deployment length varies
across the services. As in previous analyses, we use this metric to
measure aggregate deployment experience and to compare experience
across services and components.
8 To some extent, this reflects the fact that those who remain in
the Army are more likely to obtain additional deployment experi-
ence. However, those who have deployment experience at the
end of their initial term of service are more likely than others to
reenlist; see Wenger et al., 2016.
References
Baiocchi, Dave, Measuring Army Deployments to Iraq and Afghanistan,
Santa Monica, Calif.: RAND Corporation, RR-145-A, 2013. As of
July 5, 2016:
http://www.rand.org/pubs/research_reports/RR145.html
Bonds, Timothy M., Dave Baiocchi, and Laurie L. McDonald,
Army Deployments to OIF and OEF, Santa Monica, Calif.: RAND
Corporation, DB-587-A, 2010. As of July 5, 2016:
http://www.rand.org/pubs/documented_briefings/DB587.html
Chandra, Anita, Laurie T. Martin, Stacy Hawkins, and Amy
Richardson, “The Impact of Parental Deployment on Child Social
and Emotional Functioning: Perspectives of School Staff,” Journal of
Adolescent Health, Vol. 146, No. 3, March 2010, pp. 218–223.
Hosek, James, Jennifer Kavanagh, and Laura L. Miller, Deployment,
Stress, and Intention to Stay in the Military, Santa Monica, RAND
Corporation, RB-9150-RC, 2006. As of March 6, 2017:
http://www.rand.org/pubs/research_briefs/RB9150.html
Hosek, James, and Paco Martorell, How Have Deployments During
the War on Terrorism Affected Reenlistment? Santa Monica, RAND
Corporation, MG-873-OSD, 2009. As of March 6, 2017:
http://www.rand.org/pubs/monographs/MG873.html
Loughran, David S., and Jacob Alex Klerman, Explaining the Increase
in Unemployment Compensation for Ex-Servicemembers During the
Global War on Terror, Santa Monica, Calif.: RAND Corporation,
TR-588-OSD, 2008. As of March 6, 2017:
http://www.rand.org/pubs/technical_reports/TR588.html
Loughran, David S., Jacob Alex Klerman, and Craig Martin, Effect
of Activation on Reservist Earnings, Santa Monica, Calif.: RAND
Corporation, RB-9183-OSD, 2006. As of March 6, 2017:
http://www.rand.org/pubs/research_briefs/RB9183.html
Meadows, Sarah O., Terri Tanielian, Benjamin Karney, Terry Schell,
Beth Ann Griffin, Lisa H. Jaycox, Esther M. Friedman, Thomas E.
Trail, Robin Beckman, Rajeev Ramchand, Natalie Hengstebeck,
Wendy M. Troxel, Lynsay Ayer, and Christine Anne Vaughan, The
Deployment Life Study: Longitudinal Analysis of Military Families Across
the Deployment Cycle, Santa Monica, Calif.: RAND Corporation,
RR-1388-A/OSD, 2016. As of March 6, 2017:
http://www.rand.org/pubs/research_reports/RR1388.html
O’Connell, Caolionn, Jennie W. Wenger, and Michael L. Hansen,
Measuring and Retaining the U.S. Army’s Deployment Experience, Santa
Monica, Calif.: RAND Corporation, RR-570-A, 2014. As of July 5,
2016:
www.rand.org/pubs/research_reports/RR570.html
Richardson, Amy, Anita Chandra, Laurie T. Martin, Claude Messan
Setodji, Bryan W. Hallmark, Nancy F. Campbell, Stacy Hawkins,
and Patrick Grady, Effect of Soldiers’ Deployment on Children’s
Academic Performance and Behavioral Health, Santa Monica, Calif.:
RAND Corporation, MG-1095-A, 2011. As of March 6, 2017:
http://www.rand.org/pubs/monographs/MG1095.html
Savych, Bogdan, “Effects of Deployments on Spouses of Military
Personnel,” Pardee RAND Graduate School dissertation, August
2008.
Wenger, Jennie W., Bruce R. Orvis, David M. Stebbins, Eric
Apaydin, and James Syme, Strengthening Prior Service–Civil Life
Gains and Continuum of Service Accessions into the Army’s Reserve
Components, Santa Monica, Calif.: RAND Corporation, RR-1376-A,
2016. As of March 6, 2017:
http://www.rand.org/pubs/research_reports/RR1376.html

About This Report
This report describes the differences in deployment experience across the U.S. Department of Defense, by service and com-
ponent, as well as the accrual of deployment experience by year and statistics describing those service members who were
deployed over the past 15 years. Finally, we include information tracking the flow of personnel and deployment experience
into and out of the Regular Army and the Selected Reserve (SELRES).
This research was sponsored by the Office of the Deputy Chief of Staff, G-8, Army Quadrennial Defense Review Office,
and conducted within RAND Arroyo Center’s Personnel, Training, and Health Program. RAND Arroyo Center, part of the
RAND Corporation, is a federally funded research and development center sponsored by the U.S. Army.
The Project Unique Identification Code (PUIC) for the project that produced this document is RAN167267.
About the Authors
Jennie W. Wenger is a Senior Economist at the RAND Corporation, where she studies education and training, military
compensation, and recruiting. Some of her recent projects have examined the implications of integrating women into combat
arms occupations, changes in diversity in the military over time, factors that influence the decision to transition to the Reserve
Components, and the effectiveness of the Beyond Yellow Ribbon programs which assist servicemembers transitioning back
to the civilian world after deployments.
Caolionn O’Connell is a senior physical scientist at the RAND Corporation and an Associate Director of RAND Arroyo
Center’s Forces and Logistics Program. She primarily works in the national security sector, with a focus on cyber systems,
manpower issues, and resource management.
Linda Cottrell is a research programmer in the RAND Corporation’s Information Services department. Her work focuses
on health and health care, health care delivery, population health, and manpower and training.
Limited Print and Electronic Distribution Rights
This document and trademark(s) contained herein are protected by law. This representation of RAND intellectual property
is provided for noncommercial use only. Unauthorized posting of this publication online is prohibited. Permission is given to
duplicate this document for personal use only, as long as it is unaltered and complete. Permission is required from RAND
to reproduce, or reuse in another form, any of our research documents for commercial use. For information on reprint and
linking permissions, please visit www.rand.org/pubs/permissions.html.
For more information on this publication, visit www.rand.org/t/RR1928.
© Copyright 2018 RAND Corporation
Library of Congress Cataloguing-in-Publication Data is available for this publication.
ISBN: 978-0-8330-9794-1
The RAND Corporation is a research organization that develops solutions to public policy challenges to help make communities
throughout the world safer and more secure, healthier and more prosperous. RAND is nonprofit, nonpartisan, and committed to the
public interest.
RAND’s publications do not necessarily reflect the opinions of its research clients and sponsors. R® is a registered trademark.
www.rand.org
ARROYO CENTER
RR-1928-A