by: nayef s. al-utaibi abqaiq plants abqaiq plants experience in implementing lean six sigma
Post on 22-Dec-2015
221 views
TRANSCRIPT
by:by:
Nayef S. Al-UtaibiNayef S. Al-Utaibi
Abqaiq PlantsAbqaiq Plants
Abqaiq Plants Experience in Implementing
Lean Six Sigma
Abqaiq Plants Experience in Implementing
Lean Six Sigma
2
Abqaiq Plants Initiated the Abqaiq Plants Initiated the in-house in-house Lean Six Sigma Projects in 2005Lean Six Sigma Projects in 2005
Lean Six Sigma Training was Provided by Lean Six Sigma Training was Provided by OCDOCD
IntroductionIntroduction
3
Lean Six SigmaLean Six Sigma is is a data-driven business process optimization methodology which aims to reduce variation, eliminate non-value added activities, and significantly improve process quality.
11stst Introduced by Motorola in 1980’s Introduced by Motorola in 1980’s
BackgroundBackground
4
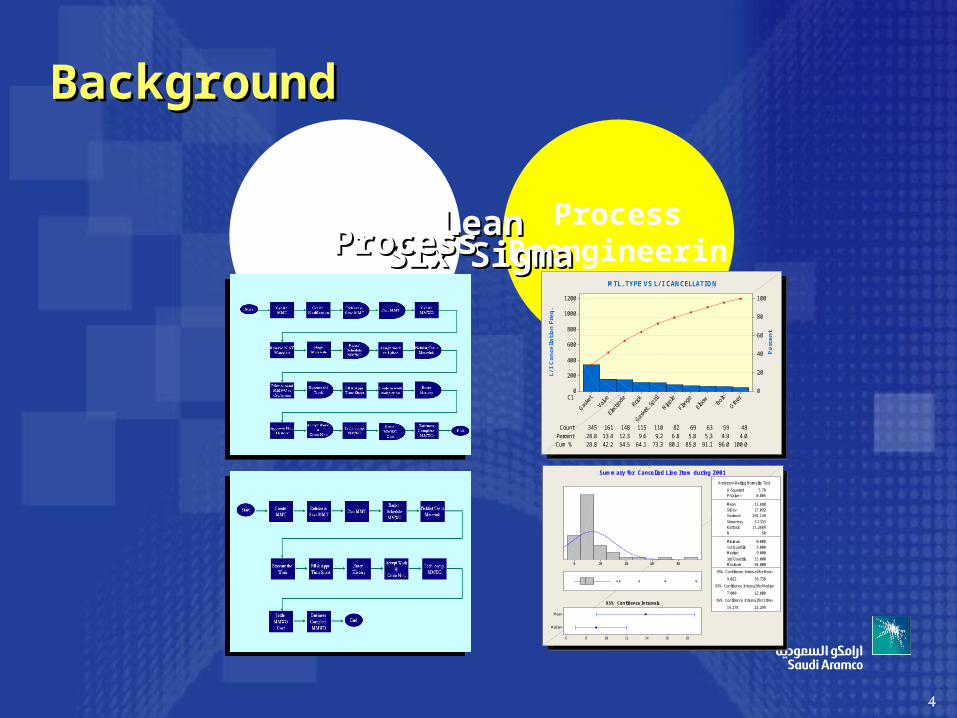
BackgroundBackground
Total Quality Management
Process Reengineering
L/I
Ca
nce
lla
tio
n F
req
.
Pe
rce
nt
C1
Count 59 48Percent 28.8 13.4 12.3 9.6 9.2 6.8 5.8
3455.3 4.9 4.0
Cum % 28.8 42.2 54.5 64.1 73.3 80.1
161
85.8 91.1 96.0 100.0
148 115 110 82 69 63
1200
1000
800
600
400
200
0
100
80
60
40
20
0
MTL. TYPE VS L/ I CANCELLATION
L/I
Ca
nce
lla
tio
n F
req
.
Pe
rce
nt
C1
Count 59 48Percent 28.8 13.4 12.3 9.6 9.2 6.8 5.8
3455.3 4.9 4.0
Cum % 28.8 42.2 54.5 64.1 73.3 80.1
161
85.8 91.1 96.0 100.0
148 115 110 82 69 63
1200
1000
800
600
400
200
0
100
80
60
40
20
0
MTL. TYPE VS L/ I CANCELLATION
806040200
Median
Mean
181614121086
Anderson-Darling Normality Test
Variance 292.149
Skewness 3.1333Kurtosis 11.2609N 50
Minimum 0.000
A-Squared
1st Quartile 5.000Median 9.000
3rd Quartile 15.000Maximum 94.000
95% Confidence Interval for Mean
9.022
5.78
18.738
95% Confidence Interval for Median
7.000 12.000
95% Confidence Interval for StDev
14.278 21.299
P-Value < 0.005
Mean 13.880StDev 17.092
95% Confidence Intervals
Summary for Cancelled Line Item during 2001
LeanLeanSix SigmaSix SigmaProcessProcess
5
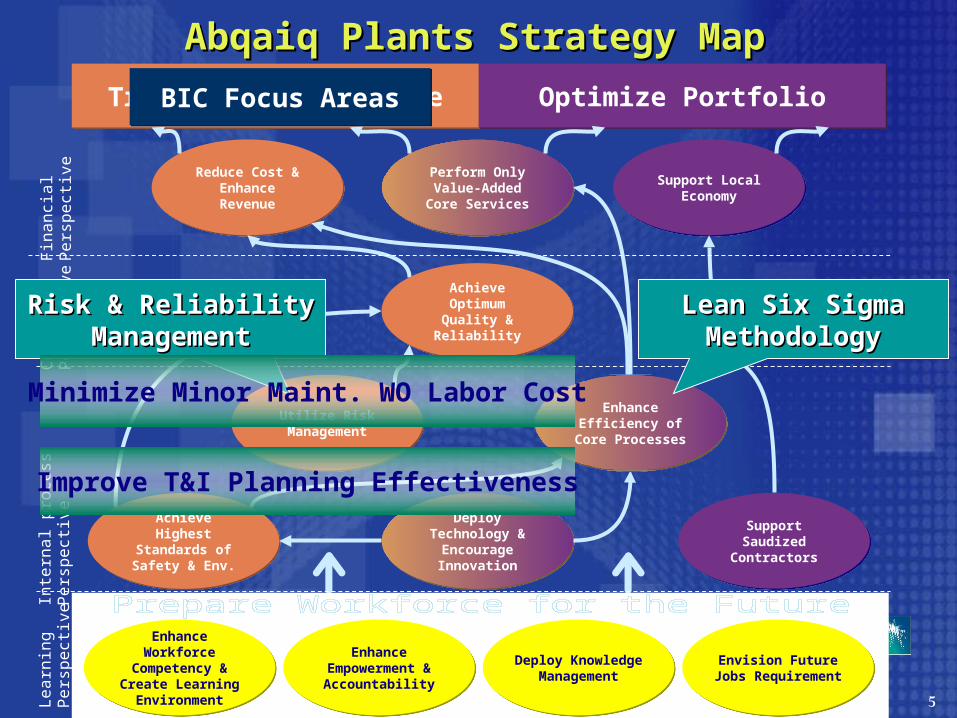
Transform PerformanceTransform Performance
Support Local Economy
Support Local Economy
Optimize PortfolioOptimize Portfolio
Utilize Risk ManagementUtilize Risk
Management
Achieve Highest
Standards of Safety & Env.
Achieve Highest
Standards of Safety & Env.
Deploy Technology &
Encourage Innovation
Deploy Technology &
Encourage Innovation
Support Saudized
Contractors
Support Saudized
Contractors
Perform Only Value-Added Core Services
Perform Only Value-Added Core Services
Reduce Cost & Enhance Revenue
Reduce Cost & Enhance Revenue
Envision Future Jobs RequirementEnvision Future
Jobs Requirement
Deploy Knowledge
Management
Deploy Knowledge
Management
Abqaiq Plants Strategy MapAbqaiq Plants Strategy MapF
ina
nci
al
Pe
rsp
ect
ive
Cu
sto
me
rP
ers
pe
ctiv
eL
ea
rnin
g
Pe
rsp
ect
ive
Inte
rna
l pro
cess
Pe
rsp
ect
ive
Achieve Optimum Quality & Reliability
Achieve Optimum Quality & Reliability
Enhance Empowerment & Accountability
Enhance Empowerment & Accountability
Enhance Workforce
Competency & Create Learning
Environment
Enhance Workforce
Competency & Create Learning
Environment
Risk & Reliability Risk & Reliability ManagementManagement
Enhance Efficiency of
Core Processes
Enhance Efficiency of
Core Processes
BIC Focus AreasBIC Focus Areas
Lean Six Sigma Lean Six Sigma MethodologyMethodology
Minimize Minor Maint. WO Labor Cost
Improve T&I Planning Effectiveness
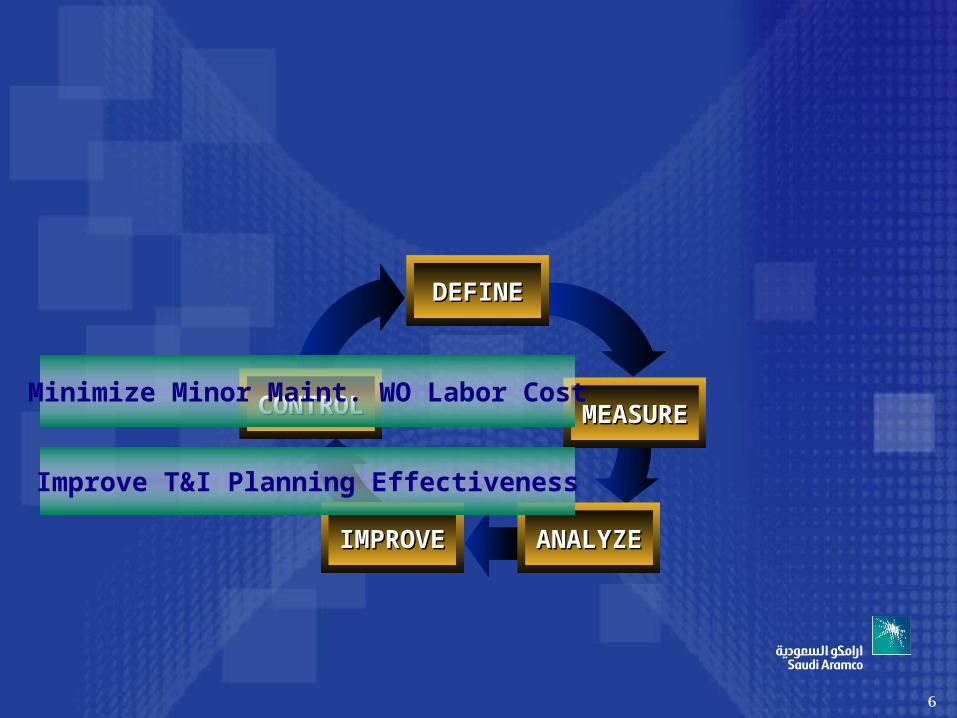
6
DEFINEDEFINE
ANALYZEANALYZE
CONTROLCONTROL
IMPROVEIMPROVE
MEASUREMEASUREMinimize Minor Maint. WO Labor Cost
Improve T&I Planning Effectiveness
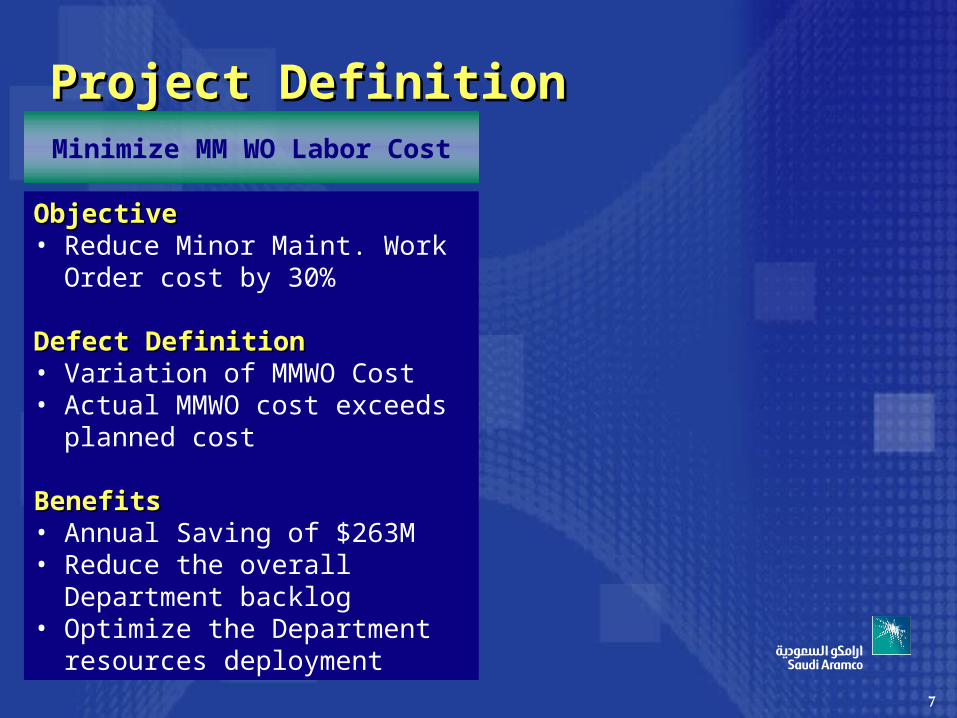
7
Project DefinitionProject DefinitionMinimize MM WO Labor Cost
ObjectiveObjective• Reduce Minor Maint. Work
Order cost by 30%
Defect DefinitionDefect Definition• Variation of MMWO Cost• Actual MMWO cost exceeds
planned cost
BenefitsBenefits• Annual Saving of $263M• Reduce the overall
Department backlog• Optimize the Department
resources deployment
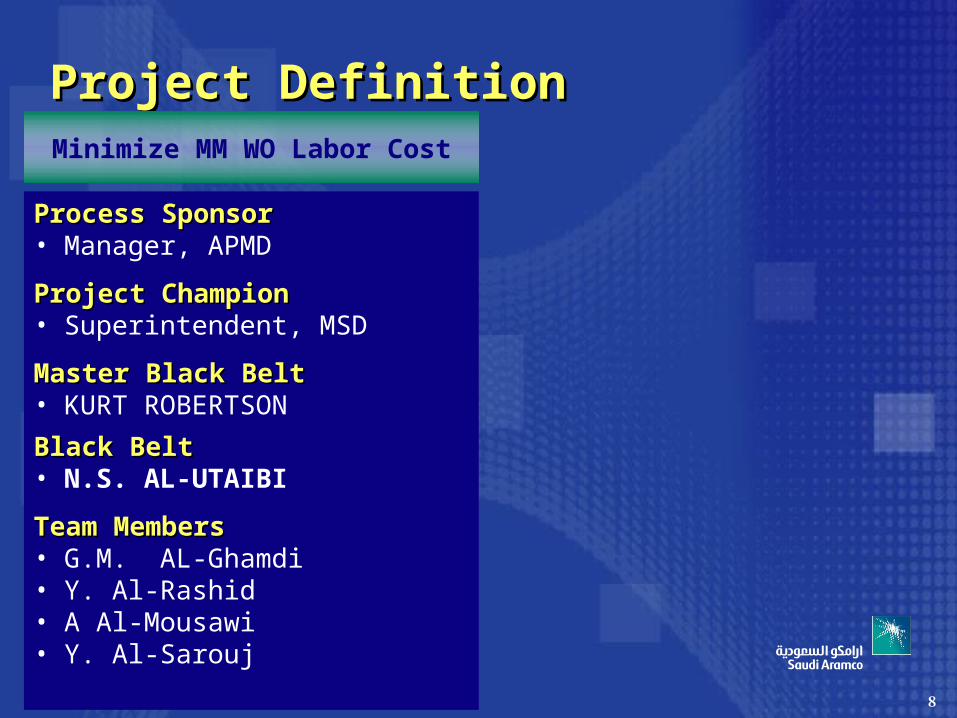
8
Project DefinitionProject DefinitionMinimize MM WO Labor Cost
Process SponsorProcess Sponsor• Manager, APMD
Project ChampionProject Champion• Superintendent, MSD
Master Black BeltMaster Black Belt• KURT ROBERTSON
Black BeltBlack Belt• N.S. AL-UTAIBI
Team MembersTeam Members• G.M. AL-Ghamdi• Y. Al-Rashid• A Al-Mousawi• Y. Al-Sarouj
9
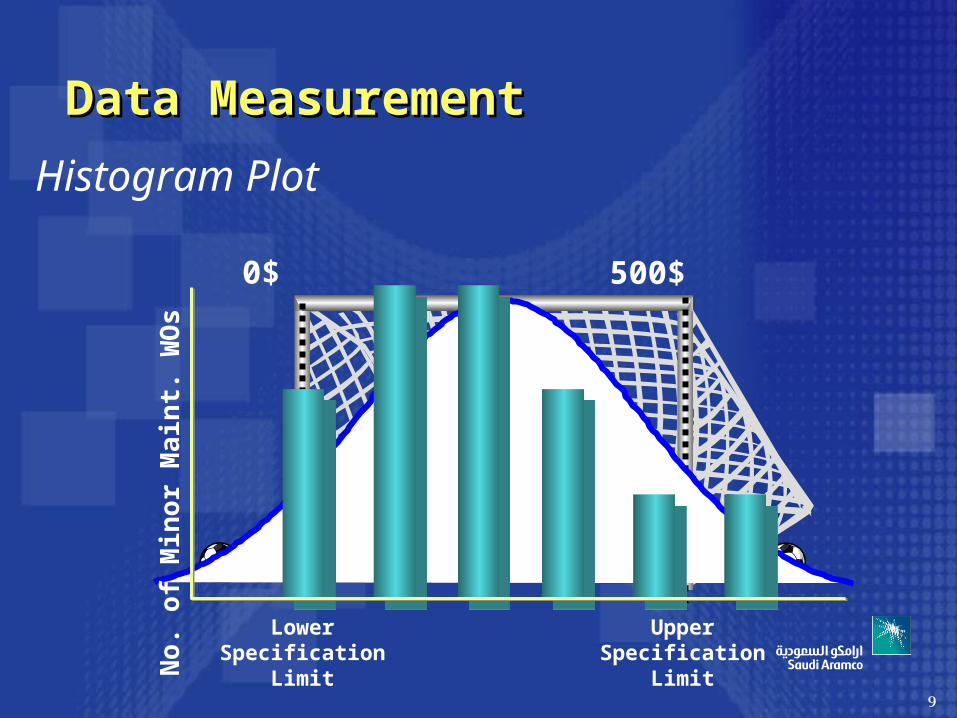
Data MeasurementData Measurement
Lower Specification Limit
Upper Specification Limit
Histogram Plot
0$ 500$
No.
of M
inor
Mai
nt. W
Os
10
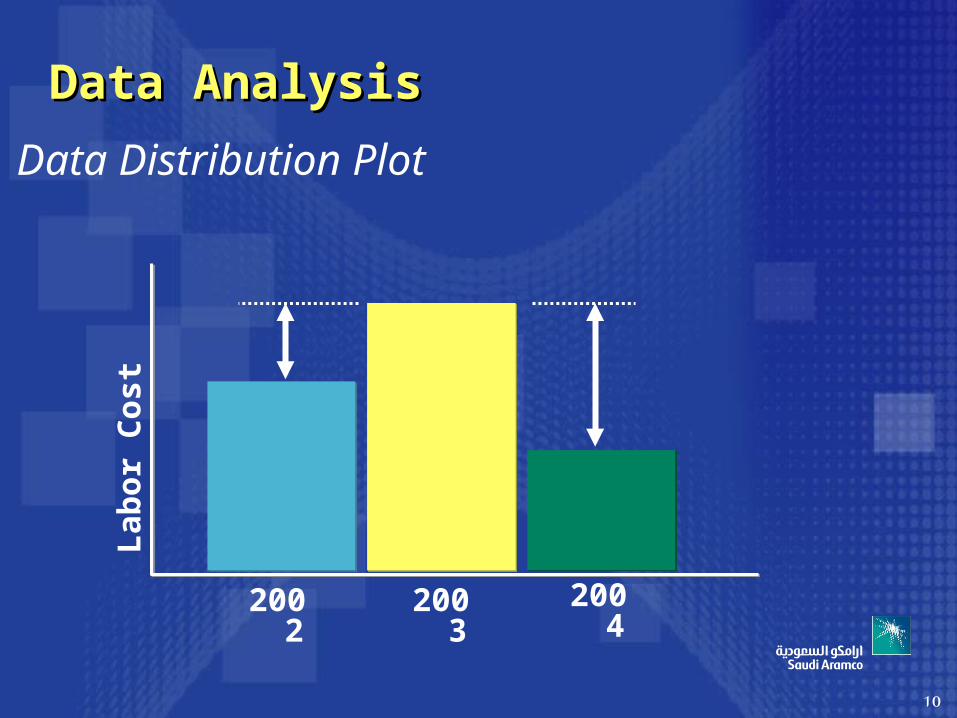
Data AnalysisData Analysis
Data Distribution Plot
2004
Labo
r Cos
t
2002 2003
11
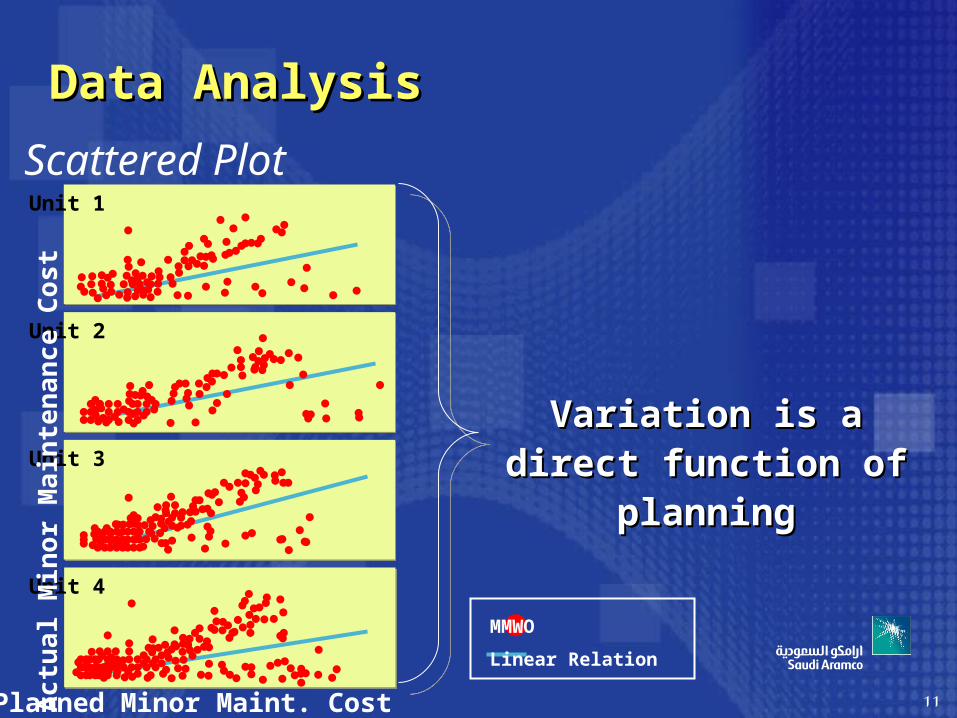
Data AnalysisData Analysis
Scattered Plot
Variation is a Variation is a direct function of direct function of
planningplanning
Unit 1
Unit 2
Unit 3
Unit 4
Ac
tua
l Min
or
Ma
inte
na
nc
e C
ost
Planned Minor Maint. Cost
MMWO
Linear Relation
12
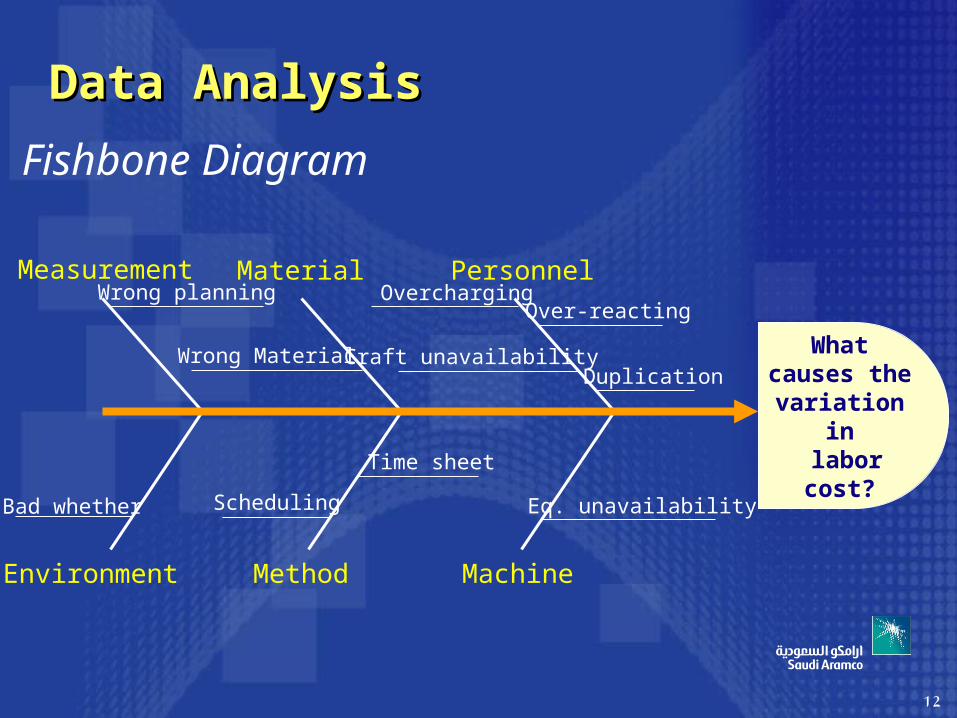
Data AnalysisData Analysis
Measurement Material
Environment
Personnel
MachineMethod
Scheduling
What causes
the variation
in labor cost?
Wrong planning
Eq. unavailability
Time sheet
Wrong Material
Over-reacting
Duplication
Overcharging
Craft unavailability
Bad whether
Fishbone Diagram
13
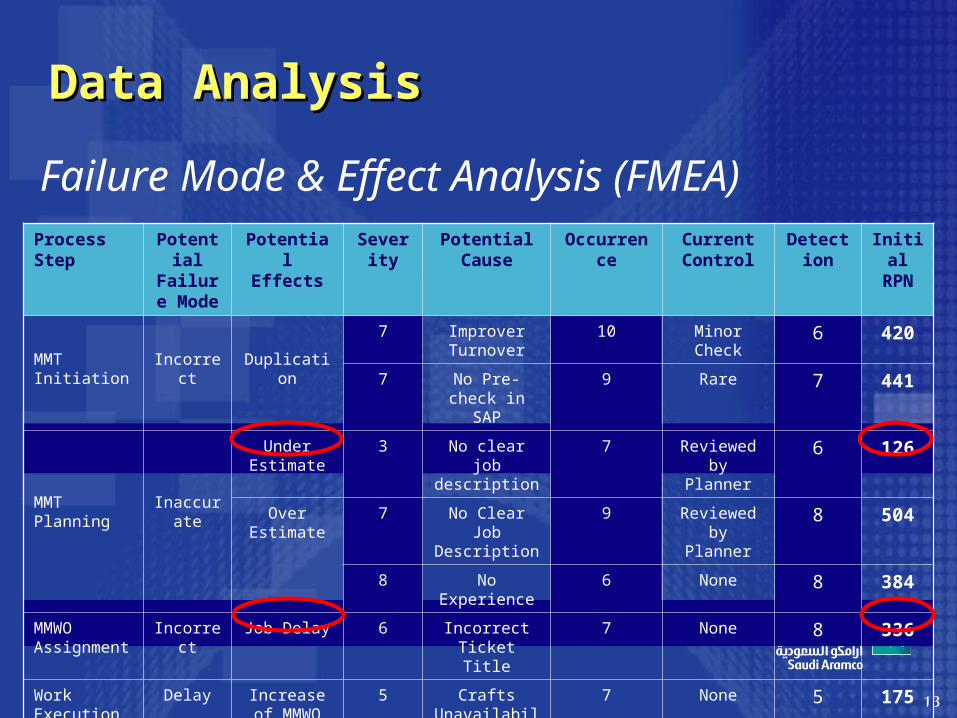
Data AnalysisData Analysis
Process Step Potential Failure Mode
Potential Effects
Severity Potential Cause Occurrence Current Control
Detection Initial RPN
MMT Initiation Incorrect Duplication
7 Improver Turnover 10 Minor Check 6 420
7 No Pre-check in SAP
9 Rare 7 441
MMT Planning Inaccurate
Under Estimate 3 No clear job description
7 Reviewed by Planner
6 126
Over Estimate 7 No Clear Job Description
9 Reviewed by Planner
8 504
8 No Experience 6 None 8 384
MMWO Assignment
Incorrect Job Delay 6 Incorrect Ticket Title
7 None 8 336
Work Execution Delay Increase of MMWO
5 Crafts Unavailability
7 None 5 175
Timesheet Filling & Approving
Inaccurate Overcharging 9 Bad Scheduling 10 Rare 9 810
Failure Mode & Effect Analysis (FMEA)
14
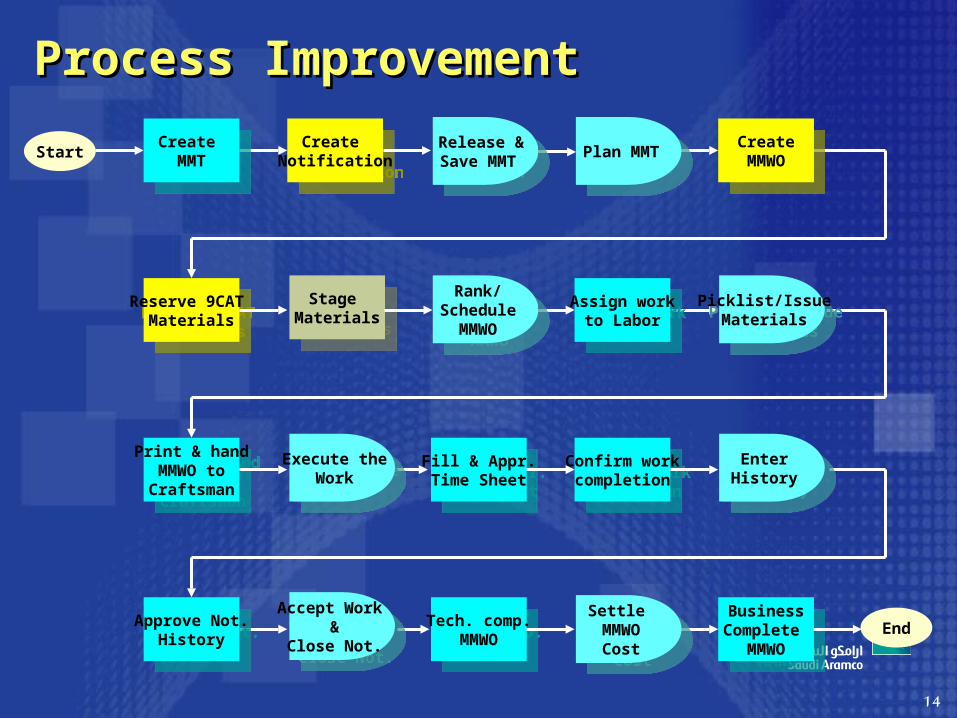
Process ImprovementProcess Improvement
Start Create Notification
Create Notification
Stage Materials
Stage Materials Assign work
to Labor
Assign workto Labor
Print & handMMWO toCraftsman
Print & handMMWO toCraftsman
Approve Not.History
Approve Not.History
End
Reserve 9CAT Materials
Reserve 9CAT Materials
CreateMMWO
CreateMMWO
Fill & Appr.Time Sheet
Fill & Appr.Time Sheet Confirm work
completion
Confirm workcompletion
Tech. comp.MMWO
Tech. comp.MMWO
BusinessComplete
MMWO
BusinessComplete
MMWO
Create MMT
Create MMT Release &
Save MMT
Release &Save MMT Plan MMT
Plan MMT
Rank/ScheduleMMWO
Rank/ScheduleMMWO
Picklist/IssueMaterials
Picklist/IssueMaterials
Execute theWork
Execute theWork Enter
History
EnterHistory
Accept Work &
Close Not.
Accept Work &
Close Not.
Settle MMWO
Cost
Settle MMWO
Cost
15
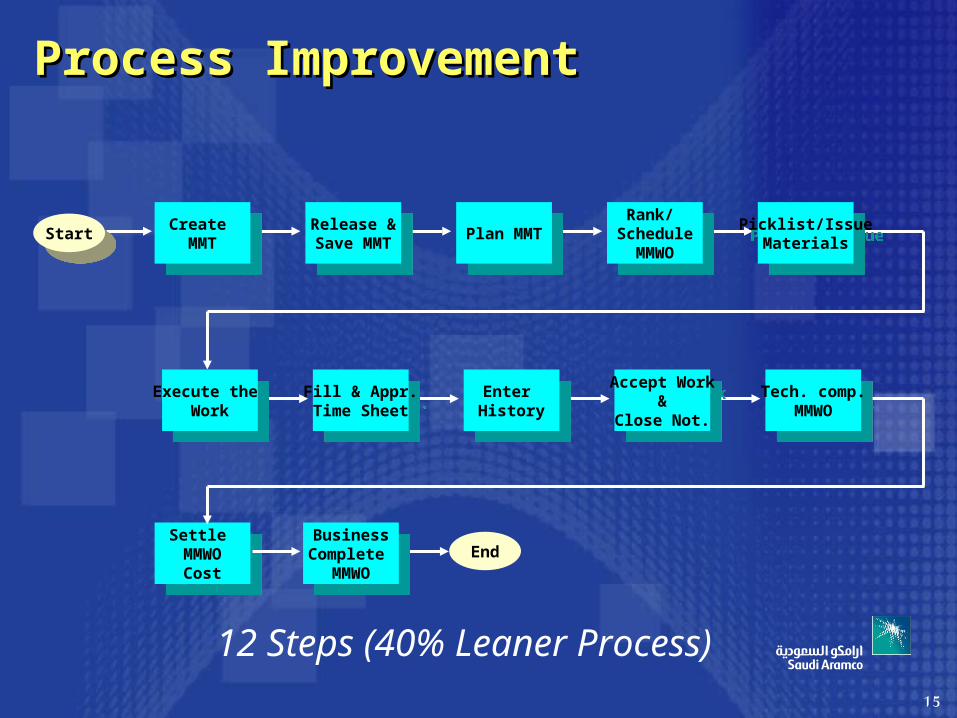
Process ImprovementProcess Improvement
Enter History
Enter History
Settle MMWO
Cost
Settle MMWO
Cost
Fill & Appr.Time Sheet
Fill & Appr.Time Sheet
Accept Work&
Close Not.
Accept Work&
Close Not.Tech. comp.
MMWO
Tech. comp.MMWO
BusinessComplete
MMWO
BusinessComplete
MMWO
Create MMT
Create MMT Release &
Save MMT
Release &Save MMT Plan MMT
Plan MMT Rank/ ScheduleMMWO
Rank/ ScheduleMMWO
Picklist/IssueMaterials
Picklist/IssueMaterials
Execute the Work
Execute the Work
StartStart
End
12 Steps (40% Leaner Process)
16
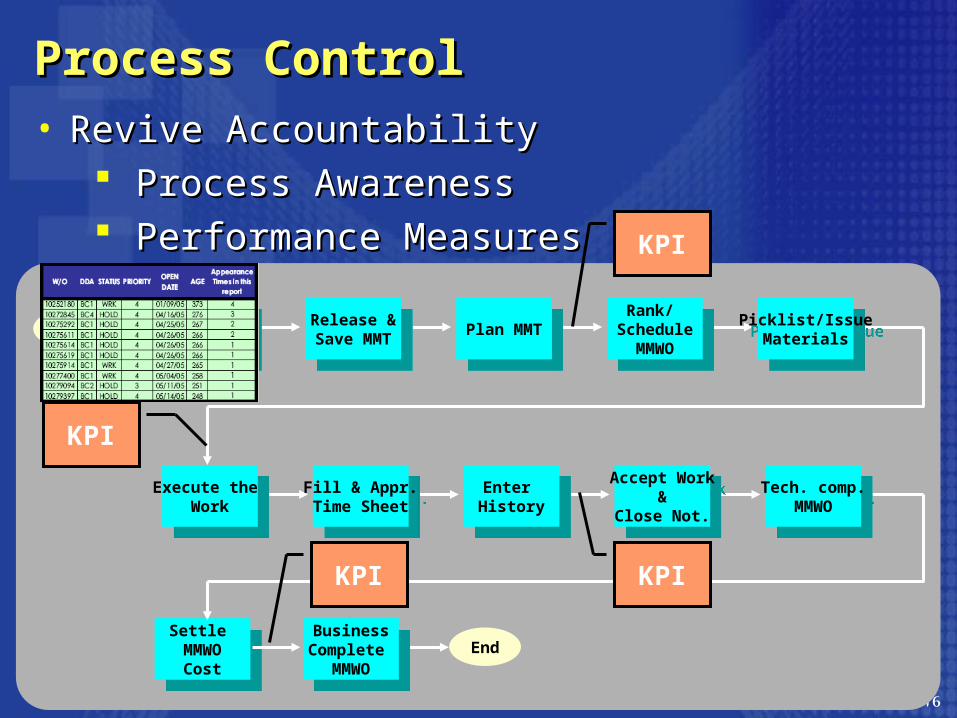
• Revive AccountabilityRevive Accountability Process AwarenessProcess Awareness Performance MeasuresPerformance Measures
• Re-define SAP Role Assignment Re-define SAP Role Assignment • Enhance SAP-PM04 Enhance SAP-PM04
Alert in case of MMWO duplicationAlert in case of MMWO duplication Alert in case of exceeding planned hoursAlert in case of exceeding planned hours
Process ControlProcess Control
Enter History
Enter History
Settle MMWO
Cost
Settle MMWO
Cost
Fill & Appr.Time Sheet
Fill & Appr.Time Sheet
Accept Work&
Close Not.
Accept Work&
Close Not.Tech. comp.
MMWO
Tech. comp.MMWO
BusinessComplete
MMWO
BusinessComplete
MMWO
Create MMT
Create MMT Release &
Save MMT
Release &Save MMT Plan MMT
Plan MMT Rank/ ScheduleMMWO
Rank/ ScheduleMMWO
Picklist/IssueMaterials
Picklist/IssueMaterials
Execute the Work
Execute the Work
StartStart
End
KPI
KPI
KPI
KPI
17
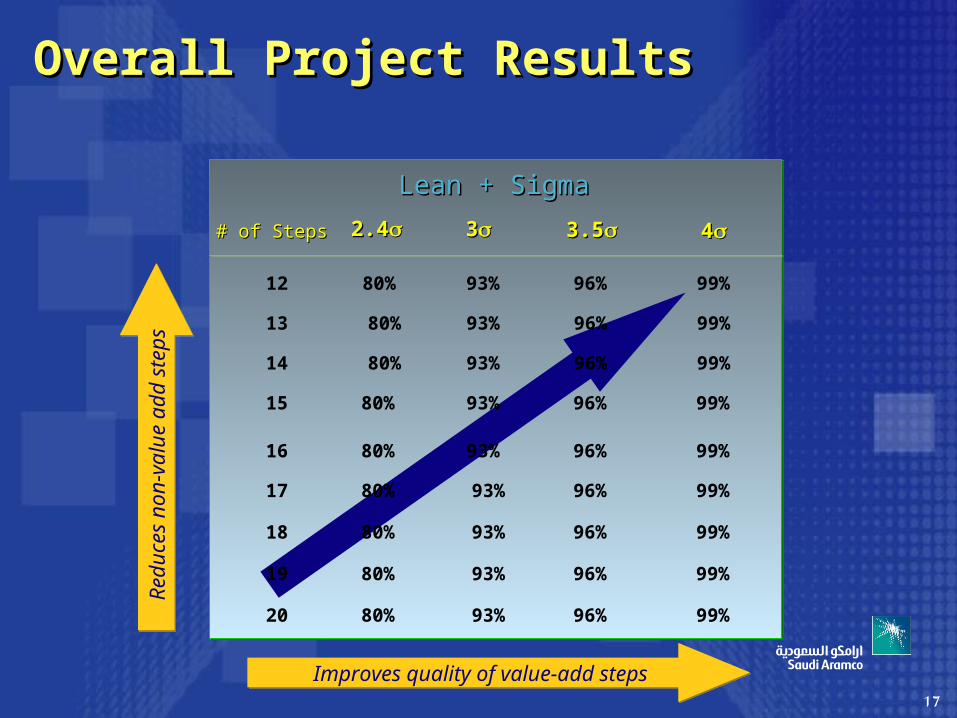
Overall Project ResultsOverall Project Results
Lean + SigmaLean + Sigma
# of Steps# of Steps 3.53.5 44332.42.4
12
13
14
15
16
17
18
19
20
80%
80%
80%
80%
80%
80%
80%
80%
80%
93%
93%
93%
93%
93%
93%
93%
93%
93%
96%
96%
96%
96%
96%
96%
96%
96%
96%
99%
99%
99%
99%
99%
99%
99%
99%
99%Reduce
s non-v
alu
e a
dd s
teps
Reduce
s non-v
alu
e a
dd s
teps
Improves quality of value-add stepsImproves quality of value-add steps
18
SummarySummary
• Lean Sigma is an effective work processes Lean Sigma is an effective work processes enhancement toolenhancement tool
• Promising results are guaranteed with Promising results are guaranteed with proper implementationproper implementation
• Knowledge gain and individual Knowledge gain and individual development is an added benefitdevelopment is an added benefit

19
Thank YouThank You