energy tidbits - saf group · 1. saudi aramco’s announces intention to ipo, hopefully marketing...
TRANSCRIPT

The Disclaimer: Energy Tidbits is intended to provide general information only and is written for an institutional or sophisticated investor audience. It is not a recommendation of, or solicitation for the purchase of securities, an offer of securities, or intended as investment research or advice. The information presented, while obtained from sources we believe reliable as of the publishing date, is not guaranteed against errors or omissions and no representation or warranty, express or implied, is made as to their accuracy, completeness or correctness. This publication is proprietary and intended for the sole use of direct recipients from Dan Tsubouchi and SAF Group. Energy Tidbits are not to be copied, transmitted, or forwarded without the prior written permission Dan Tsubouchi and SAF Group. Please advise if you have received Energy Tidbits from a source other than Dan Tsubouchi and SAF Group.
Energy Tidbits
Dan Tsubouchi
Principal, Chief Market Strategist
Aaron Bunting
Principal, COO, CFO
Ryan Dunfield
Principal, CEO [email protected]
Alan Cooper
Vice President
Ryan Haughn
Principal, Energy
Hope Aramco IPO Marketing Gives Insight Into Abqaiq Repairs,
OPEC+ Cuts, Permian Oil Growth Views And Houthis Risk
Welcome to new Energy Tidbits memo readers. We are continuing to add new readers to our Energy Tidbits
memo and energy blogs. The focus and concept for the memo was set in 1999 with input from PMs, who were
looking for research (both positive and negative items) that helped them shape their investment thesis to the energy
space, and not focusing on day to day trading. Our priority was and still is to not just report on events, but interpret
and point out implications therefrom. The best example is our review of investor days, conferences and earnings calls
focusing on sector developments that are relevant to the sector and not just a specific company results/guidance.
Our target is to write on 48 to 50 weekends per year and to send out by noon mountain time.
This week’s memo highlights:
1. Saudi Aramco’s announces intention to IPO, hopefully marketing provides insights into Saudi view on Permian
growth potential, Abqaiq repair (diffs), Houthis and OPEC+ extension potential. (Click Here)
2. Continuing to see oil industry and analysts lower US oil growth expectations for 2020. (Click Here)
3. Denmark signs off, subject to 30 day comment period, on Gazprom’s 5.3 bcf/d pipeline to Germany. (Click Here)
4. Bloomberg “berth” data shows China LNG imports down YoY in Oct. (Click Here)
5. BP expects it to be tough for US LNG projects to run at capacity in 2020/2021. (Click Here)
6. Please follow us on Twitter at [LINK] for breaking news that ultimately ends up in the weekly Energy Tidbits memo
that doesn’t get posted until Sunday noon MT.
7. For new readers to our Energy Tidbits and our blogs, you will need to sign up at our blog sign up to receive future
Energy Tidbits memos. The sign up is available at [LINK].
Produced by: Dan Tsubouchi
Nov 3, 2019

The Disclaimer: Energy Tidbits is intended to provide general information only and is written for an institutional or sophisticated investor audience. It is not a recommendation of, or solicitation for the purchase of securities, an offer of securities, or intended as investment research or advice. The information presented, while obtained from sources we believe reliable as of the publishing date, is not guaranteed against errors or omissions and no representation or warranty, express or implied, is made as to their accuracy, completeness or correctness. This publication is proprietary and intended for the sole use of direct recipients from Dan Tsubouchi and SAF Group. Energy Tidbits are not to be copied, transmitted, or forwarded without the prior written permission Dan Tsubouchi and SAF Group. Please advise if you have received Energy Tidbits from a source other than Dan Tsubouchi and SAF Group.
2
Energy Tidbits
Table of Contents Natural Gas – Natural gas injection of 89 bcf, storage now +559 bcf YoY surplus ..................................................5
Figure 1: US Natural Gas Storage ....................................................................................................................5
Natural Gas – US gas production in August +8.5 bcf/d YoY ....................................................................................5
Figure 2: US Dry Natural Gas Production ........................................................................................................5
Natural Gas – US August LNG exports +1.5 bcf/d YoY, ..........................................................................................5
Figure 3: US LNG Exports (bcf/d) .....................................................................................................................6
Figure 4: Natural Gas Flows To Sabine Pass LNG ..........................................................................................6
Natural Gas – US August pipeline exports to Mexico +0.4 bcf/d YoY ......................................................................6
Figure 5: US Pipeline Exports To Mexico (bcf/d)..............................................................................................6
Figure 6: Mexico Gas Pipelines Map ........................................................................................................................7
Natural Gas – Mexico’s natural gas production finally breaks above 5 bcf/d in Sept ..............................................7
Figure 7: Mexico Natural Gas Production (bcf/d) .............................................................................................7
Natural Gas – Looks like a warm start to winter in Japan ........................................................................................7
Figure 8: Japan Winter Temperature Forecast For Nov Thru Jan ...................................................................8
Natural Gas – China “berth” data shows LNG import data in Oct down 17.4% YoY ...............................................8
Figure 9: China LNG imports ............................................................................................................................8
Natural Gas – Baker Hughes LNG supply needs to be >15% more than demand ..................................................8
Figure 10: Excess Supply Capacity Is Needed To Support LNG Contract Volumes .......................................9
Natural Gas – Gazprom’s 8.9 bcf/d of new export pipeline to start up soon ............................................................9
Denmark signs off on 5.3 bcf/d Nord Stream 2 to Germany ......................................................................... 10
Figure 11: Nord Stream and Nord Stream 2 Gas Pipelines .......................................................................... 10
3.6 bcf/d Power of Siberia pipeline to China now filled up natural gas ......................................................... 10
Figure 12: Gazprom’s 3.6 bcf/d Power of Siberia Natural Gas Pipeline To China ........................................ 11
Natural Gas – BP says be tough to find customers for all US LNG in 2020/2021 ................................................ 11
Natural Gas – Will Shell’s cash shortfall cause a delay in LNG Canada Phase 2? .............................................. 11
Figure 13: Canadian LNG, Potential For Multi Year Runway If Continuous Construction Cycle .................. 12
Natural Gas – Cheniere sees better LNG markets in 2021 ................................................................................... 13
Oil – US oil rigs down 5 to 691 oil rigs ................................................................................................................... 13
Figure 14: Baker Hughes Total US Oil Rigs .................................................................................................. 14

The Disclaimer: Energy Tidbits is intended to provide general information only and is written for an institutional or sophisticated investor audience. It is not a recommendation of, or solicitation for the purchase of securities, an offer of securities, or intended as investment research or advice. The information presented, while obtained from sources we believe reliable as of the publishing date, is not guaranteed against errors or omissions and no representation or warranty, express or implied, is made as to their accuracy, completeness or correctness. This publication is proprietary and intended for the sole use of direct recipients from Dan Tsubouchi and SAF Group. Energy Tidbits are not to be copied, transmitted, or forwarded without the prior written permission Dan Tsubouchi and SAF Group. Please advise if you have received Energy Tidbits from a source other than Dan Tsubouchi and SAF Group.
3
Energy Tidbits
Oil – Total Cdn rigs -5 to 142 total rigs .................................................................................................................. 14
Figure 15: Baker Hughes Total Canadian Oil Rigs ....................................................................................... 14
Oil – US oil production unchanged at 12.6 mmb/d, matching the all time high ..................................................... 14
Figure 16: Weekly US Oil Production ............................................................................................................ 15
Figure 17: US Weekly Oil Production ............................................................................................................ 15
Figure 18: YoY Change in US Weekly Oil Production ................................................................................... 16
Oil – EIA Form 914, US Aug oil production up vs July, rebound after Hurricane Barry ........................................ 16
Figure 19: EIA Form 914 US Oil Production .................................................................................................. 16
Figure 20: EIA Form 914 US Oil Production vs Weekly Estimates ............................................................... 16
Oil – Permian base oil decline rates around 40% ................................................................................................. 17
Concho’s Permian base oil declines in low 40’s but to 30’s at yr end 2020 .................................................. 17
Matador says they have a 38% to 40% base Permian oil decline rate ......................................................... 17
Figure 21: Increasing Permian Decline Rates ............................................................................................... 18
Oil – More pointing to lower US oil growth in 2020 ............................................................................................... 18
BoA/Merrill expect to lower their +800,000 b/d US oil growth in 2020 .......................................................... 19
Chevron and Exxon buck the trend, both delivering on Permian growth plans ............................................. 19
Liberty Oilfield says “we may see US oil production plateau in early 2020” .................................................. 19
US Silica Q3 – Taking out capacity, points to lesser US oil growth potential ................................................ 19
Oil – Trans Mountain and contractors have hired 2,200 people ........................................................................... 20
Oil – Reports Keystone shut in for another week or so ......................................................................................... 20
Oil – Alberta provides curtailment relief for crude by rail volumes ........................................................................ 20
Figure 22: WCS-WTI Differential ................................................................................................................... 21
Oil – Oil input into refineries up 133,000 b/d to 15.998 mmb/d ............................................................................. 21
Figure 23: US Refinery Crude Oil Inputs (thousand b/d) ............................................................................... 21
Oil – US “NET” oil imports up 1.196 mmb/d to 3.370 mmb/d ................................................................................ 21
Figure 24: US Weekly Preliminary Oil Imports By Major Countries .............................................................. 22
Oil – Mexico Q3/19 oil production was 1.694 mmb/d, UP 1.2% QoQ ................................................................... 22
Figure 25: Mexico Crude Oil Production ........................................................................................................ 22
Figure 26: Mexico Oil Production – From Pemex Q3 Presentation............................................................... 23
Oil – Mexico Sept oil exports were 995,000 b/d .................................................................................................... 23
Figure 27: Mexico Crude Oil Exports ............................................................................................................. 23
Oil – Johan Sverdrup loadings to already hit ~400,000 b/d in Dec ...................................................................... 23
Oil – Russia at 11.229 mmb/d in Oct, still slightly above OPEC+ quota ............................................................... 24

The Disclaimer: Energy Tidbits is intended to provide general information only and is written for an institutional or sophisticated investor audience. It is not a recommendation of, or solicitation for the purchase of securities, an offer of securities, or intended as investment research or advice. The information presented, while obtained from sources we believe reliable as of the publishing date, is not guaranteed against errors or omissions and no representation or warranty, express or implied, is made as to their accuracy, completeness or correctness. This publication is proprietary and intended for the sole use of direct recipients from Dan Tsubouchi and SAF Group. Energy Tidbits are not to be copied, transmitted, or forwarded without the prior written permission Dan Tsubouchi and SAF Group. Please advise if you have received Energy Tidbits from a source other than Dan Tsubouchi and SAF Group.
4
Energy Tidbits
Oil – Reuters OPEC for Oct production: +693,000 b/d to 29.593 mmb/d ............................................................. 24
Figure 28: Reuters Survey of Oct 2019 production ....................................................................................... 24
Oil – Bloomberg OPEC survey for Sept, Saudi down 1.47 mmb/d ave over month ............................................. 24
Figure 29: Bloomberg Survey of Sept 2019 production ................................................................................ 25
Oil – Saudi Aramco announces intention to proceed with IPO.............................................................................. 25
IPO likely to give indications on OPEC+ cuts, Houthis/Iran, diffs, etc ........................................................... 25
Also if Saudi agrees with Falih view on lower than expected Permian growth ............................................. 26
Oil – Saudi to cut govt spending, the biggest (least painful) cut would be Houthis war ........................................ 26
Don’t forget Saudi has reportedly been talking to the Houthis ...................................................................... 27
Oil – Saudi helps build the case that peak oil demand hits sooner than expected ............................................... 27
Makes us wonder about nuclear power, especially mini nukes..................................................................... 27
Figure 30: Saudi Arabia Primary Energy Consumption By Fuel ................................................................... 28
Oil – Khamenei reminds to negotiations with US .................................................................................................. 28
Oil – Sounds like lingering concerns for a Druzhba pipeline quality problem ....................................................... 28
Oil – HSFO demand likely higher with IMO 2020 non compliance ....................................................................... 28
Oil and Natural Gas – sector/play/market insights from Q3 calls .......................................................................... 29
BP – priority is Eagle Ford over the Permian ................................................................................................ 29
Concho – Reaffirmed the move to wider well spacing .................................................................................. 29
GATX – Analyst raises risk that Union Pacific may ban retrofit DOT-117R cars .......................................... 30
Liberty Oilfield – Drilling slowdown in Q4; smoother industry drilling in 2020 ............................................... 30
Nabors – Customers stretching out bill payment ................................................................................................... 31
Oil & Natural Gas – Encana’s new branding announcement ................................................................................ 31
Energy Tidbits – Now on Twitter ............................................................................................................................ 32
Energy Tidbits – Sign up on our email distribution for tidbits and blogs ................................................................ 32
LinkedIn – Look for quick energy items from me on LinkedIn ............................................................................... 32
Misc Facts and Figures.......................................................................................................................................... 32
Iran’s taking 52 US hostages was 40 years ago tomorrow ........................................................................... 32
30 year anniversary of the falling of the Berlin wall ....................................................................................... 33
Early retirement may speed up cognitive decline .......................................................................................... 33

The Disclaimer: Energy Tidbits is intended to provide general information only and is written for an institutional or sophisticated investor audience. It is not a recommendation of, or solicitation for the purchase of securities, an offer of securities, or intended as investment research or advice. The information presented, while obtained from sources we believe reliable as of the publishing date, is not guaranteed against errors or omissions and no representation or warranty, express or implied, is made as to their accuracy, completeness or correctness. This publication is proprietary and intended for the sole use of direct recipients from Dan Tsubouchi and SAF Group. Energy Tidbits are not to be copied, transmitted, or forwarded without the prior written permission Dan Tsubouchi and SAF Group. Please advise if you have received Energy Tidbits from a source other than Dan Tsubouchi and SAF Group.
5
Energy Tidbits
Natural Gas – Natural gas injection of 89 bcf, storage now +559 bcf YoY surplus
The EIA reported an 89 bcf natural gas injection, which was in line with expectations of a 85 bcf injection to bring storage to 3.695 as of Oct 25. This is a widening of the YoY surplus to 559 bcf vs 519 bcf surplus last week and storage is now 52 bcf above vs the 5 yr average. The continued expectation is for the YoY storage surplus to keep widening from higher YoY production which is holding HH prices around $2.25-$2.50. There is only 1 week to get to Nov 1, the official start of the winter heating season and it looks like storage should reach the estimate of +580 bcf YoY. Below is the EIA’s storage table from its Weekly Natural Gas Storage Report. [LINK] Figure 1: US Natural Gas Storage
Source: EIA
Natural Gas – US gas production in August +8.5 bcf/d YoY
The EIA released its Natural Gas Monthly, which includes its estimates for “actuals” for August gas production. The big negative to natural gas has been higher YoY natural gas supply, and this continues to be the case in August. August YoY increase of +8.5 bcf/d is higher than the July YoY increase of 7.9 bcf/d, but down significantly from the ~10.0 bcf/d YoY increases we saw at the beginning of 2019. They are still huge YoY, but just less. The EIA estimates US natural gas dry production in August at 93.7 bcf/d, +8.5 bcf/d YoY. Higher YoY natural gas production is the primary factor keeping HH gas prices low. Our Supplementary Documents package includes excerpts from the EIA Natural Gas Monthly. [LINK] Figure 2: US Dry Natural Gas Production
Source: EIA
Natural Gas – US August LNG exports +1.5 bcf/d YoY,
The EIA Natural Gas Monthly also reported “actuals” for US LNG exports, which were 4.5 bc/d in August, +1.5 bcf/d YoY but -0.6 bcf/d MoM vs July. The decrease in August was expected, as trains 3 and 4 at Cheniere’s Sabine Pass were offline for a majority of Aug for
bcf/d 2010 2011 2012 2013 2014 2015 2016 2017 2018 2019
Jan 56.0 60.0 65.9 65.3 67.8 72.6 73.8 71.0 77.9 88.7
Feb 57.3 58.8 65.2 65.9 67.5 73.7 74.7 71.6 79.4 89.5
March 57.3 61.5 65.1 65.4 68.2 74.1 74.0 73.3 80.2 90.0
Apr 57.6 62.3 65.4 66.0 68.6 75.0 73.8 73.4 80.4 90.5
May 58.0 62.4 65.6 66.3 69.5 74.2 73.5 73.3 81.3 90.0
June 57.2 62.1 65.4 66.3 69.8 74.3 72.5 73.8 81.8 91.0
July 58.3 62.5 65.8 67.0 70.6 74.3 73.1 74.7 83.4 91.3
Aug 58.9 63.2 65.4 67.0 71.6 74.3 72.3 74.7 85.2 93.7
Sept 59.1 63.1 66.2 67.2 71.7 75.0 71.9 75.8 86.4
Oct 60.1 65.1 66.5 67.6 72.2 74.1 71.4 76.9 87.2
Nov 60.1 65.9 66.6 68.6 73.1 74.1 72.1 79.0 88.6
Dec 61.0 65.6 65.8 66.6 74.7 74.0 71.2 79.5 88.9
Average 58.4 62.7 65.7 66.7 70.4 74.1 72.8 74.8 83.4
YoY storage at
559 bcf YoY
surplus
US Aug gas
production +8.5
bcf/d YoY
US Aug LNG
exports +1.5 bcf/d
YoY

The Disclaimer: Energy Tidbits is intended to provide general information only and is written for an institutional or sophisticated investor audience. It is not a recommendation of, or solicitation for the purchase of securities, an offer of securities, or intended as investment research or advice. The information presented, while obtained from sources we believe reliable as of the publishing date, is not guaranteed against errors or omissions and no representation or warranty, express or implied, is made as to their accuracy, completeness or correctness. This publication is proprietary and intended for the sole use of direct recipients from Dan Tsubouchi and SAF Group. Energy Tidbits are not to be copied, transmitted, or forwarded without the prior written permission Dan Tsubouchi and SAF Group. Please advise if you have received Energy Tidbits from a source other than Dan Tsubouchi and SAF Group.
6
Energy Tidbits
scheduled maintenance. Note, the EIA’s new STEO has forecast Q4 LNG exports at 5.35 bcf/d. Below is our table of EIA’s monthly LNG exports, and our graph of natural gas flows to Sabine Pass LNG, which shows the decrease in Aug.
Figure 3: US LNG Exports (bcf/d)
Source: EIA
Figure 4: Natural Gas Flows To Sabine Pass LNG
Source: EIA
Natural Gas – US August pipeline exports to Mexico +0.4 bcf/d YoY
The EIA Natural Gas Monthly also estimates gas pipeline exports to Mexico were 5.4 bcf/d in Aug, which is +0.4 bcf/d YoY vs 5.0 bcf/d in Aug 2018, and it was up marginally MoM from 5.3 bcf/d in July 2019. Gas pipeline exports to Mexico will be even higher in Sept, with the start of TC Energy’s 2.6 bcf/d Sur de Texas-Tuxpan export pipeline (running just off the east coast of Mexico), as Platts reported volumes began flowing on Sept 3 [LINK]. The Below is our table of the EIA’s monthly gas exports to Mexico.
Figure 5: US Pipeline Exports To Mexico (bcf/d)
Source: EIA
(bcf/d) 2016 2017 2018 2019
Jan 0.0 1.7 2.3 4.1
Feb 0.1 1.9 2.6 3.7
March 0.3 1.4 3.0 4.2
Apr 0.3 1.7 2.9 4.2
May 0.3 2.0 3.1 4.7
June 0.5 1.7 2.5 4.7
July 0.5 1.7 3.2 5.1
Aug 0.9 1.5 3.0 4.5
Sept 0.6 1.8 2.7
Oct 0.1 2.6 2.9
Nov 1.1 2.7 3.6
Dec 1.3 2.7 4.0
Full Year 0.5 1.9 3.0
Full Year bcf 186 708 1,084
bcf/d 2014 2015 2016 2017 2018 2019
Jan 1.7 2.2 3.2 3.9 4.4 4.9
Feb 1.8 2.3 3.4 4.1 4.5 4.8
March 1.9 2.4 3.3 4.2 4.3 4.8
Apr 1.9 2.6 3.5 3.9 4.4 4.6
May 2.0 2.8 3.7 4.2 4.4 4.9
June 2.2 3.0 3.9 4.5 4.6 5.2
July 2.2 3.3 4.0 4.4 4.9 5.3
Aug 2.1 3.3 4.3 4.4 5.0 5.4
Sept 2.2 3.3 4.1 4.2 5.0
Oct 1.9 3.2 4.2 4.3 4.9
Nov 1.9 3.0 4.0 4.5 4.7
Dec 2.1 3.2 3.7 4.4 4.5
Full Year 2.0 2.9 3.8 4.2 4.6
US Aug pipeline
exports to Mexico
+0.4 bcf/d YoY

The Disclaimer: Energy Tidbits is intended to provide general information only and is written for an institutional or sophisticated investor audience. It is not a recommendation of, or solicitation for the purchase of securities, an offer of securities, or intended as investment research or advice. The information presented, while obtained from sources we believe reliable as of the publishing date, is not guaranteed against errors or omissions and no representation or warranty, express or implied, is made as to their accuracy, completeness or correctness. This publication is proprietary and intended for the sole use of direct recipients from Dan Tsubouchi and SAF Group. Energy Tidbits are not to be copied, transmitted, or forwarded without the prior written permission Dan Tsubouchi and SAF Group. Please advise if you have received Energy Tidbits from a source other than Dan Tsubouchi and SAF Group.
7
Energy Tidbits
Figure 6: Mexico Gas Pipelines Map
Source: Platts
Natural Gas – Mexico’s natural gas production finally breaks above 5 bcf/d in Sept
One of the key Mexican energy themes continues to be their inability to grow domestic natural gas production, which means increasing natural gas imports from the US as Mexico natural gas production has been stuck below 5.0 bcf/d since Sept 2017. Although not a huge increase, Pemex reported its Sept natural gas production and Mexico natural gas production in Sept was 5.017 bcf/d and means Mexico finally broke above 5.0 bcf/d. Sept was +2.1% YoY vs Sept 2018 and +1.6% MoM from Aug 2019. Below is our ongoing table of Pemex reported monthly natural gas production. [LINK]
Figure 7: Mexico Natural Gas Production (bcf/d)
Source: Pemex
Natural Gas – Looks like a warm start to winter in Japan
The big negative to LNG prices in 2019 was the mild Asian winter led to surplus LNG cargos in peak demand season for natural gas/LNG. The surplus LNG had to find a home and ended up in Europe storage. Just like in North America, if Asian natural gas demand is weaker from a mild winter, it means that it is difficult for LNG prices to catch up over the non peak season. Last week, we saw the Japan Meteorological Agency’s updated Oct 25 forecast [LINK] for Japan winter temperatures. Unfortunately, it calls for another warmer than normal winter, and Nov thru Jan temperatures look to be well above normal. If the forecast proves accurate, it means that we wouldn’t expect to see any boost to LNG prices, at least from Japan weather. Below is the JMA temperature map for the Nov thru Jan period.
Natural Gas Production bcf/d 2015 2016 16/15 2017 17/16 2018 18/17 2019 19/18
Jan 6.584 6.162 -6.4% 5.326 -13.6% 4.910 -7.8% 4.648 -5.3%
Feb 6.676 6.122 -8.3% 5.299 -13.4% 4.853 -8.4% 4.869 0.3%
Mar 6.558 6.030 -8.1% 5.383 -10.7% 4.646 -13.7% 4.857 4.5%
Apr 6.257 5.921 -5.4% 5.334 -9.9% 4.869 -8.7% 4.816 -1.1%
May 6.202 5.841 -5.8% 5.299 -9.3% 4.827 -8.9% 4.841 0.3%
June 6.390 5.881 -8.0% 5.253 -10.7% 4.840 -7.9% 4.843 0.1%
July 6.374 5.785 -9.2% 5.216 -9.8% 4.856 -6.9% 4.892 0.7%
Aug 6.366 5.686 -10.7% 5.035 -11.4% 4.898 -2.7% 4.939 0.8%
Sept 6.477 5.619 -13.2% 4.302 -23.4% 4.913 14.2% 5.017 2.1%
Oct 6.397 5.583 -12.7% 4.759 -14.8% 4.895 2.9%
Nov 6.316 5.515 -12.7% 4.803 -12.9% 4.776 -0.6%
Dec 6.236 5.380 -13.7% 4.811 -10.6% 4.881 1.5%
Mexico natural
gas production
breaks above 5
bcf/d
Warmer start t
winter in Japan

The Disclaimer: Energy Tidbits is intended to provide general information only and is written for an institutional or sophisticated investor audience. It is not a recommendation of, or solicitation for the purchase of securities, an offer of securities, or intended as investment research or advice. The information presented, while obtained from sources we believe reliable as of the publishing date, is not guaranteed against errors or omissions and no representation or warranty, express or implied, is made as to their accuracy, completeness or correctness. This publication is proprietary and intended for the sole use of direct recipients from Dan Tsubouchi and SAF Group. Energy Tidbits are not to be copied, transmitted, or forwarded without the prior written permission Dan Tsubouchi and SAF Group. Please advise if you have received Energy Tidbits from a source other than Dan Tsubouchi and SAF Group.
8
Energy Tidbits
Figure 8: Japan Winter Temperature Forecast For Nov Thru Jan
Source: Japan Meteorological Agency
Natural Gas – China “berth” data shows LNG import data in Oct down 17.4% YoY
Notwithstanding we are more bullish on others that LNG markets rebalance sooner than expected, we have been, and continue to be, negative on LNG in 2020. This was reinforced by the Bloomberg estimated China LNG important data for Oct. On Friday morning, we tweeted [LINK] “#LNG negative tone to continue unless there is very cold start to Asian and Europe winter. Bloomberg terminal just reported on “berth” data for China LNG imports in Oct would be 5.9 bcf/d, 1st YoY decrease since July 2016. <6 bcf/d for 1st time since shoulder season Apr 2016.” There was a good Bloomberg terminal story early Friday morning “China LNG Imports Slide 1st Time in 3 Years on Outage, Stocks” reporting on “berth data” for China LNG imports in Oct. This is not the official China customs data, but we have to believe the data will be pretty accurate. Its hard to think they missed a LNG tanker, and the only variance is likely to be small ie. on the load volume. Below is our running table of China LNG imports that includes the Bloomberg berth data for Oct. Our Supplemental Documents package includes the Bloomberg terminal story.
Figure 9: China LNG imports
Source: Bloomberg, LNG World News
Natural Gas – Baker Hughes LNG supply needs to be >15% more than demand
Baker Hughes held its Q3 call on Wed and reminded of a key LNG supply/demand fundamental that tends to get overlooked – LNG markets are balanced when supply exceeds
bcf/d 2016 2017 17/16 2018 18/17 2019 19/18
Jan 3.8 5.4 39.3% 8.0 50.0% 10.2 27.1%
Feb 3.1 4.1 32.3% 6.8 66.9% 7.5 9.1%
Mar 2.6 3.1 17.7% 5.0 64.5% 6.3 24.8%
Apr 3.0 3.4 14.7% 5.4 57.8% 7.3 34.0%
May 2.2 4.5 104.5% 6.4 41.9% 6.9 7.6%
June 3.5 4.9 38.2% 6.3 30.1% 7.3 14.9%
July 2.5 4.8 95.1% 6.4 33.4% 7.6 18.1%
Aug 3.5 4.9 37.4% 7.3 49.2% 8.0 10.8%
Sept 4.1 5.5 36.8% 7.0 26.3% 8.2 16.7%
Oct 2.9 5.5 93.0% 7.1 29.6% 5.9 -17.4%
Nov 4.3 6.5 52.6% 9.6 47.5% Bloomberg Oct "berth" estimate
Dec 5.8 7.8 34.5% 9.7 25.0%
LNG supply needs
to be more than
demand
China Oct LNG
imports possibly
down 17% YoY

The Disclaimer: Energy Tidbits is intended to provide general information only and is written for an institutional or sophisticated investor audience. It is not a recommendation of, or solicitation for the purchase of securities, an offer of securities, or intended as investment research or advice. The information presented, while obtained from sources we believe reliable as of the publishing date, is not guaranteed against errors or omissions and no representation or warranty, express or implied, is made as to their accuracy, completeness or correctness. This publication is proprietary and intended for the sole use of direct recipients from Dan Tsubouchi and SAF Group. Energy Tidbits are not to be copied, transmitted, or forwarded without the prior written permission Dan Tsubouchi and SAF Group. Please advise if you have received Energy Tidbits from a source other than Dan Tsubouchi and SAF Group.
9
Energy Tidbits
demand by >15%. We tweeted [LINK] “Baker Hughes Q3 call today: Need 650 mm tons #LNG nameplate capacity for demand 550 mm tons by 2030. Fits SAF why LNG markets rebalance earlier than expected, "LNG markets reach a balance when demand is within +/- 15% of LNG supply capacity”. On the Q3 call, mgmt. said “And as you look at LNG overall, over the course of the next few years that's going to be increasing project activity you've got an outlook of the demands of 550 million tons by 2030. And to put that in perspective, you're going to need to have about 650 million tons of nameplate capacity in place to actually provide that.” Ie. 650 is 18.2% more than 550, basically in line with our +/- 15%. This was a key factor in our LNG call in our SAF Group 2020 Energy Market Outlook webcast on Oct 7. In our webcast, we said the following to the below slide “We also think there is a big factor that is overlooked by markets when they look at the math to see if LNG markets are oversupplied. Its that there needs to be more LNG capacity than LNG demand. LNG suppliers have to have some excess capacity somewhere in their supply chain to meet contract volumes. It could be extra train capacity somewhere in their portfolio, or storage or some way that they felt comfortable they could deliver the LNG volumes even with normal turnarounds and maintenance. There is no firm % but we suspect with the increasing role of spot and short term contracts, its probably something like up to 15% to provide a cushion to meet deliveries. In other words, LNG markets are effectively balanced if LNG capacity is approximately 15% greater than LNG demand+’
Figure 10: Excess Supply Capacity Is Needed To Support LNG Contract Volumes
Source: SAF
Natural Gas – Gazprom’s 8.9 bcf/d of new export pipeline to start up soon
It was a good week for Gazprom on its major new natural gas export pipelines to China and Germany. And that means it’s a bad week for LNG prices in 2020 and 2021 because Gazprom’s two new pipelines (3.6 bcf/d Nord Stream 2 to Germany and 5.3 bcf/d Power of Siberia to China) are on track to start delivering natural gas in the coming months. There isn’t yet a formal timeline to how fast the volumes will ramp up in the each pipeline, but these are significant low risk pipeline additions for incremental Russia natural gas to reach the key global natural gas markets. The developments are in line with our fear for LNG prices in 2020 and 2021, which we detailed in our March 30, 2019 blog “LNG Price Pressures
Gazprom 8.9
bcfd new
pipeline capacity

The Disclaimer: Energy Tidbits is intended to provide general information only and is written for an institutional or sophisticated investor audience. It is not a recommendation of, or solicitation for the purchase of securities, an offer of securities, or intended as investment research or advice. The information presented, while obtained from sources we believe reliable as of the publishing date, is not guaranteed against errors or omissions and no representation or warranty, express or implied, is made as to their accuracy, completeness or correctness. This publication is proprietary and intended for the sole use of direct recipients from Dan Tsubouchi and SAF Group. Energy Tidbits are not to be copied, transmitted, or forwarded without the prior written permission Dan Tsubouchi and SAF Group. Please advise if you have received Energy Tidbits from a source other than Dan Tsubouchi and SAF Group.
10
Energy Tidbits
2020/2021 With Gazprom Adding ~8.9 Bcf/D Export Gas Pipeline Capacity Into Europe And China”. Our Supplemental Documents package includes the March 30 blog. [LINK]
Denmark signs off on 5.3 bcf/d Nord Stream 2 to Germany Last week’s (Oct 27, 2019) Energy Tidbits memo (and our Oct 26 tweet [LINK]) highlighted the breaking news last weekend that Denmark approved Poland’s Baltic Pipe natural gas pipeline that runs thru Danish territorial waters very close to the Nord Stream 2 route. It proved Denmark was not anti natural gas pipelines running thru its territorial waters. And we thought that meant that Denmark would sign off on Nord Stream 2 in the very near future, within the next few months. It turns out, it was only a matter of a few days for Denmark to sign off on a route. The approval is critical as it points to Nord Stream 2 moving head. There is one key caveat- the Danish approval is still subject to a 30 day period for comment. The best timing commentary was from Russian news, Vedomosti ,who noted the day comment period, the approx. 5 weeks to completed the Danish pipeline section, and the approx. 2 months for the natural gas line fill in the pipeline (see below item on line fill) and concluded the earliest possible start date is spring 2020. We agree with that timeline assuming nothing goes awry in the 30 day comment period. Our Supplemental Documents package includes a GoogleTranslate version of the Vedmosti story. [LINK]
Figure 11: Nord Stream and Nord Stream 2 Gas Pipelines
Source: Gazprom
3.6 bcf/d Power of Siberia pipeline to China now filled up natural gas Gazprom issued a short release on Tues “Power of Siberia pipeline filled up with gas” [LINK] indicating it had completed feeding natural gas in to the 3.6 bcf/d export pipeline to China. Gazprom said “gas from the Chayandinskoye field in Yakutia has reached the near-border gas metering station in the proximity of Blagoveshchensk. Power of Siberia's linear part is thus ready for the commencement of Russian pipeline gas supplies to China. The next step is to feed gas into the transborder crossing under the Amur River.” The Amur River is at the China crossing point noted on the below map. This means that Gazprom is ready to ship natural gas to China ahead of its planned Dec 1 start date. Its not clear what the expected throughput will be in the early months of the pipeline. But Power of Siberia is a key reason why we expect LNG markets to be weak in 2020 as this is a reason why

The Disclaimer: Energy Tidbits is intended to provide general information only and is written for an institutional or sophisticated investor audience. It is not a recommendation of, or solicitation for the purchase of securities, an offer of securities, or intended as investment research or advice. The information presented, while obtained from sources we believe reliable as of the publishing date, is not guaranteed against errors or omissions and no representation or warranty, express or implied, is made as to their accuracy, completeness or correctness. This publication is proprietary and intended for the sole use of direct recipients from Dan Tsubouchi and SAF Group. Energy Tidbits are not to be copied, transmitted, or forwarded without the prior written permission Dan Tsubouchi and SAF Group. Please advise if you have received Energy Tidbits from a source other than Dan Tsubouchi and SAF Group.
11
Energy Tidbits
China’s LNG imports could show only marginal growth in 2020. Please refer to our March 30, 2019 blog “
Figure 12: Gazprom’s 3.6 bcf/d Power of Siberia Natural Gas Pipeline To China
Source: Gazprom
Natural Gas – BP says be tough to find customers for all US LNG in 2020/2021
On Tues, we tweeted [LINK] on BP Q3 call that day and their global LNG outlook that points to pressure points on HH prices in 2020 and 2021. BP went thru their global LNG/natural gas outlook of oversupply in 2020 and 2021 that noted many of our LNG market themes – Europe storage full (didn’t say because of it started with a warm Asian winter), Russia gas pipeline risk, LNG cargoes needing to find a home, but low Europe gas prices means math doesn’t work for US LNG even though US source gas is low priced. As a result, US LNG facilities may not be able to find markets for all volumes in 2020/2021. Mgmt said “We've now creates the series of export terminals and more there is still no question that United States gas is the lowest cost of production in the world. It's going to be hard for you to find a market anytime soon in the next two years, probably and you probably looking at the back end of 2021 before you start see this massive supply overhang clear out and then [ph]we of LNG projects coming on stream in Australia, Middle East and around the globe, which is simply going to exacerbate the situation”. This is the argument we have been making that Europe storage is the dumping ground for LNG cargos especially in non peak season. If Europe storage is full, LNG cargos are slowing moving looking for a home or in floating storage or export facilities work at less than capacity. If US LNG can’t export at full capacity, then the US natural gas goes into storage unless the wells get shut in. This is where there is added risk to HH gas prices as most assume that US LNG projects ship at capacity adjusted for turnarounds. We say that the gas gets produced and sent into storage because a good portion of it is associated natural gas from Permian and Eagle Ford. And that natural gas doesn’t get shut in unless you shut in the oil well especially as the associated gas is still not the significant part of the well economics. Our Supplemental Documents package includes excerpts from the BP Q3 call transcript.
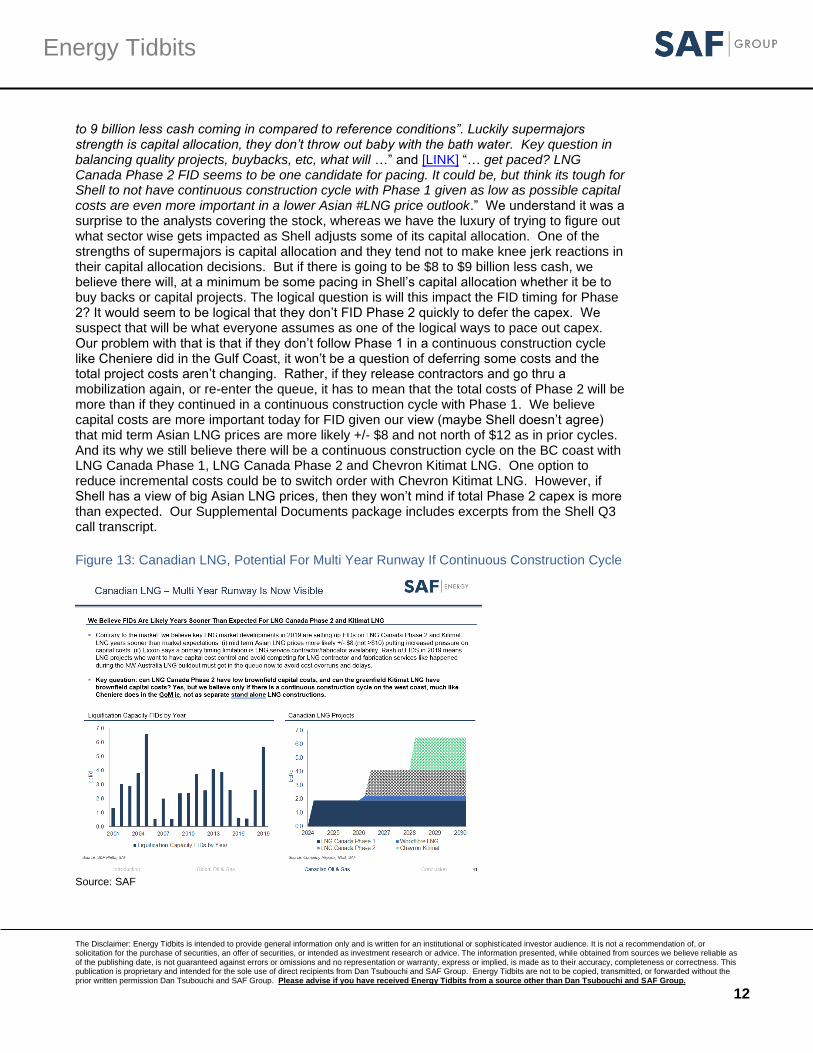
Natural Gas – Will Shell’s cash shortfall cause a delay in LNG Canada Phase 2?
Shell’s shares were down >3% following its Q3 release on Thurs morning. The headlines were similar to the FT “Shell warns economic weakness could hit investor payouts”. This was the big issue on the call for analysts. On Thurs we tweeted [LINK] “ Shell CEO on Q3 call “$8
BP sees
oversupplied
LNG market in
2020 and 2021
Risk for LNG
Canada Phase 2
delays?
The Disclaimer: Energy Tidbits is intended to provide general information only and is written for an institutional or sophisticated investor audience. It is not a recommendation of, or solicitation for the purchase of securities, an offer of securities, or intended as investment research or advice. The information presented, while obtained from sources we believe reliable as of the publishing date, is not guaranteed against errors or omissions and no representation or warranty, express or implied, is made as to their accuracy, completeness or correctness. This publication is proprietary and intended for the sole use of direct recipients from Dan Tsubouchi and SAF Group. Energy Tidbits are not to be copied, transmitted, or forwarded without the prior written permission Dan Tsubouchi and SAF Group. Please advise if you have received Energy Tidbits from a source other than Dan Tsubouchi and SAF Group.
12
Energy Tidbits
to 9 billion less cash coming in compared to reference conditions”. Luckily supermajors strength is capital allocation, they don’t throw out baby with the bath water. Key question in balancing quality projects, buybacks, etc, what will …” and [LINK] “… get paced? LNG Canada Phase 2 FID seems to be one candidate for pacing. It could be, but think its tough for Shell to not have continuous construction cycle with Phase 1 given as low as possible capital costs are even more important in a lower Asian #LNG price outlook.” We understand it was a surprise to the analysts covering the stock, whereas we have the luxury of trying to figure out what sector wise gets impacted as Shell adjusts some of its capital allocation. One of the strengths of supermajors is capital allocation and they tend not to make knee jerk reactions in their capital allocation decisions. But if there is going to be $8 to $9 billion less cash, we believe there will, at a minimum be some pacing in Shell’s capital allocation whether it be to buy backs or capital projects. The logical question is will this impact the FID timing for Phase 2? It would seem to be logical that they don’t FID Phase 2 quickly to defer the capex. We suspect that will be what everyone assumes as one of the logical ways to pace out capex. Our problem with that is that if they don’t follow Phase 1 in a continuous construction cycle like Cheniere did in the Gulf Coast, it won’t be a question of deferring some costs and the total project costs aren’t changing. Rather, if they release contractors and go thru a mobilization again, or re-enter the queue, it has to mean that the total costs of Phase 2 will be more than if they continued in a continuous construction cycle with Phase 1. We believe capital costs are more important today for FID given our view (maybe Shell doesn’t agree) that mid term Asian LNG prices are more likely +/- $8 and not north of $12 as in prior cycles. And its why we still believe there will be a continuous construction cycle on the BC coast with LNG Canada Phase 1, LNG Canada Phase 2 and Chevron Kitimat LNG. One option to reduce incremental costs could be to switch order with Chevron Kitimat LNG. However, if Shell has a view of big Asian LNG prices, then they won’t mind if total Phase 2 capex is more than expected. Our Supplemental Documents package includes excerpts from the Shell Q3 call transcript.
Figure 13: Canadian LNG, Potential For Multi Year Runway If Continuous Construction Cycle
Source: SAF
The Disclaimer: Energy Tidbits is intended to provide general information only and is written for an institutional or sophisticated investor audience. It is not a recommendation of, or solicitation for the purchase of securities, an offer of securities, or intended as investment research or advice. The information presented, while obtained from sources we believe reliable as of the publishing date, is not guaranteed against errors or omissions and no representation or warranty, express or implied, is made as to their accuracy, completeness or correctness. This publication is proprietary and intended for the sole use of direct recipients from Dan Tsubouchi and SAF Group. Energy Tidbits are not to be copied, transmitted, or forwarded without the prior written permission Dan Tsubouchi and SAF Group. Please advise if you have received Energy Tidbits from a source other than Dan Tsubouchi and SAF Group.
13
Energy Tidbits
Natural Gas – Cheniere sees better LNG markets in 2021
Cheniere held its Q3 call on Friday. (i) LNG market is “very rapidly self-correcting”. It wasn’t 100% clear from this comments and they didn’t have LNG supply/demand graph, but they seem to be saying the LNG markets get out of their oversupply situation by then end of 2020. In the Q&A, they highlighted LNG markets are “very rapidly self-correcting. They noted in the slides and comments that LNG markets are just coming thru a period of major LNG supply growth. In the Q&A, mgmt. replied “Our gas supply team takes about 5.5 Bcf of gas to our plants alone. The US is 7.5 so number one, I think we're much closer to the end of the supply of wave, obviously the question of how quickly world absorbs that is in part weather, but certainly we fully expect that the emerging markets and actually old world Europe to continue to grow and have fundamental demand growth and over to you switch off 15% of global supply is going to have quite an impact on the Henry Hub here and LNG prices globally. So we don't expect that to happen. We think it's very rapidly self-correcting and of course that the LNG world does not run off the spot spread neither physically more financially. So we think there is a good chance that we are in another nine to 12 months of a steep contango and as Michael discussed in Jack discussed earlier, we'll take advantage of that Contango and secure margins for ourselves.” (ii) We are more negative on LNG prices in 2020, but they seemed to qualify their call by adding in a bit of weather caveat. Later in the Q&A, they do a bit of a qualifier that need a decent winter, but then suggest the supply glut is gone post 2020 ie. a year or two ahead of our outlook presentation. Mgmt replied “yeah, a great question. Fair point. Right. We don't, reset to zero and have Europe able to grow from this base by another 20 million tonnes plus that's very fair point. One of the things that has played out is fewer lower volumes on pipes, as a function of North African and European supply Norway has been down pretty significantly. We need a winter cleans us out faster. We have had very robust demand growth on the Power Gen side. So that is something that is not dependent on seasonality and it's back half of 2019 weighted as everything was put in place and as Europe continues to grow that demand function. So all of those health again 2020 will be a very big supply year right, there is no question big supply year on a run rate basis and of course you get the full year effect of the 40 million tonnes coming on in 2019. So we are -- not as you can tell we're not that optimistic on 2020 hence as as Michael said, we've got more or less everything we can have put away for the way. My point is that that's beyond 2020 there really is no meaningful supply it's literally a couple of trains for a number of years with most of those being our trains. So, fairly confident that 2020 is the, transition year and 21 through 23 look much better.” (ii) One trend we have to watch (and one that is a logical negative) to the LNG supply call is the view that LNG facilities can produce above nameplate capacity. We have noted this specifically in Exxon’s Papua New Guinea, but Cheniere talks about adding capacity by debottlenecking. This makes sense, why shouldn’t LNG facilities be like refineries or other plants. The negative is that it means that we wouldn’t need some of the excess capacity that we say is needed to meet demand. IN the outlook presentation, we put that LNG markets are balanced when LNG demand is within +/- 15% of LNG supply capacity. In the Q&A, mgmt. replied “Yeah, I do think having worked closely with the operational team recently on our debottlenecking initiatives. I think the debottlenecking plan that they've put before us for some additional capital, we could achieve over 5 million tonnes. If necessary, but I think what you're hearing from Michael is we're trying to do all of the low hanging fruit first, due to the debottlenecking that gets us as much LNG as we possibly can without having to invest large quantities of capital.” Our Supplemental Documents package include excepts from the Cheniere Q3 call and Q3 call slide deck.
Oil – US oil rigs down 5 to 691 oil rigs
Baker Hughes reported its weekly rig data on Friday which was positive for WTI. US oil rigs were down again this week, with a decrease of 5 to 691 oil rigs as of Nov 1. There were no
US oil rigs
were -5 this
week
Cheniere sees
better LNG
markets in 2021

The Disclaimer: Energy Tidbits is intended to provide general information only and is written for an institutional or sophisticated investor audience. It is not a recommendation of, or solicitation for the purchase of securities, an offer of securities, or intended as investment research or advice. The information presented, while obtained from sources we believe reliable as of the publishing date, is not guaranteed against errors or omissions and no representation or warranty, express or implied, is made as to their accuracy, completeness or correctness. This publication is proprietary and intended for the sole use of direct recipients from Dan Tsubouchi and SAF Group. Energy Tidbits are not to be copied, transmitted, or forwarded without the prior written permission Dan Tsubouchi and SAF Group. Please advise if you have received Energy Tidbits from a source other than Dan Tsubouchi and SAF Group.
14
Energy Tidbits
increases this week, and decreases were in Others -2, Permian -1, Mississippian -1, and Granite Wash -1. Major US service companies have been reporting Q3 earnings over the past two weeks, and the general consensus is for drilling activity to move lower and reach a bottom in Q4, and then modestly increase in Q1 with fresh 2020 budgets. Below is our graph of total US oil rigs.
Figure 14: Baker Hughes Total US Oil Rigs
Source: Baker Hughes
Oil – Total Cdn rigs -5 to 142 total rigs
Baker Hughes reported total Cdn rigs were -5 to 142 total rigs as of Nov 1. Cdn oil rigs were down 9 to 93 Cdn oil rigs. Cdn gas rigs were up 4 to 49 gas rigs with the higher AECO spot prices. Alberta rigs were up 2, BC rigs were up 1, and Sask was down 7. Cdn rigs are now -2 compared to where they were a month ago at 144 total rigs. Despite the decrease this week, Cdn rigs are close to where they should be at this time of year – normally relatively flat going into the winter drilling season. The feedback is unchanged – producers are going to be very careful with capex spending in Q4/19 given the continued weak share prices and no real access to equity. The expectation is that we will have an earlier and extended Xmas break for drilling compared to prior years.
Figure 15: Baker Hughes Total Canadian Oil Rigs
Source: Baker Hughes
Oil – US oil production unchanged at 12.6 mmb/d, matching the all time high
EIA reported US oil production was unchanged at the all time high of 12.6 mmb/d for the Oct 25 week. Lower 48 production was also unchanged at the all time high of 12.1 mmb/d. US oil production has been unchanged for 4 weeks now, but should continue ramping up with the new Permian egress that has come onstream in H2/19, and should continue increasing in Q4 to the EIA’s forecast of 12.87 mmb/d which is 270,000 b/d above the current production level. Below we pasted an excerpt from the EIA weekly oil production data. [LINK]
US production
at 12.6 mmb/d
Total Cdn rigs -5
this week

The Disclaimer: Energy Tidbits is intended to provide general information only and is written for an institutional or sophisticated investor audience. It is not a recommendation of, or solicitation for the purchase of securities, an offer of securities, or intended as investment research or advice. The information presented, while obtained from sources we believe reliable as of the publishing date, is not guaranteed against errors or omissions and no representation or warranty, express or implied, is made as to their accuracy, completeness or correctness. This publication is proprietary and intended for the sole use of direct recipients from Dan Tsubouchi and SAF Group. Energy Tidbits are not to be copied, transmitted, or forwarded without the prior written permission Dan Tsubouchi and SAF Group. Please advise if you have received Energy Tidbits from a source other than Dan Tsubouchi and SAF Group.
15
Energy Tidbits
Figure 16: Weekly US Oil Production
Source: EIA
Figure 17: US Weekly Oil Production
Source: EIA, SAF

The Disclaimer: Energy Tidbits is intended to provide general information only and is written for an institutional or sophisticated investor audience. It is not a recommendation of, or solicitation for the purchase of securities, an offer of securities, or intended as investment research or advice. The information presented, while obtained from sources we believe reliable as of the publishing date, is not guaranteed against errors or omissions and no representation or warranty, express or implied, is made as to their accuracy, completeness or correctness. This publication is proprietary and intended for the sole use of direct recipients from Dan Tsubouchi and SAF Group. Energy Tidbits are not to be copied, transmitted, or forwarded without the prior written permission Dan Tsubouchi and SAF Group. Please advise if you have received Energy Tidbits from a source other than Dan Tsubouchi and SAF Group.
16
Energy Tidbits
Figure 18: YoY Change in US Weekly Oil Production
Source: EIA, SAF
Oil – EIA Form 914, US Aug oil production up vs July, rebound after Hurricane Barry
The EIA released its Form 914 data [LINK] on Thursday, which is the EIA’s “actuals” for Aug US oil and natural gas production. The headline was that US oil production was up 600,000 b/d in Aug vs July, but the big increase is due to a rebound in Gulf of Mexico oil production following the Hurricane Barry shut in during July. Form 914 shows Aug of 12.365 mmb/d, up 599,000 b/d vs July of 11.766 mmb/d for the US in total, but also shows GoM was +469,000 b/d to 2.006 mmb/d in Aug vs 1.537 mmb/d in July. Putting the GoM variance aside, US oil production was +305,000 b/d in Sept vs June (pre-Hurricane Barry) which represents very strong growth, considering the average 2019 MoM increases up to June was just +41,000 b/d. Below is the EIA Form 914 data for oil, and our graph of
Figure 19: EIA Form 914 US Oil Production
Source: EIA
Figure 20: EIA Form 914 US Oil Production vs Weekly Estimates
Source: EIA
U.S. Total Jan Feb Mar Apr May Jun Jul Aug Sep Oct Nov Dec
2019 11,856 11,669 11,892 12,123 12,113 12,060 11,766 12,365
2018 10,018 10,281 10,504 10,510 10,460 10,649 10,891 11,361 11,498 11,631 11,999 12,038
2017 8,863 9,103 9,162 9,100 9,183 9,107 9,235 9,248 9,512 9,653 10,071 9,973
2016 9,197 9,056 9,089 8,869 8,823 8,654 8,646 8,676 8,534 8,834 8,897 8,798
2015 9,383 9,507 9,585 9,655 9,474 9,354 9,442 9,415 9,478 9,396 9,322 9,263
2014 8,072 8,152 8,291 8,522 8,644 8,747 8,846 8,914 9,078 9,256 9,317 9,561
2013 7,081 7,147 7,203 7,371 7,325 7,276 7,523 7,531 7,836 7,757 7,916 7,928
Notes: The sum of individual s tates may not equal tota l U.S. volumes due to independent rounding. A zero may indicate volume of less
than 0.5 thousand barrels per day. Previous months ' production volumes may have been revised for a l l s tates/areas .
US Aug oil
production up
post Hurricane
Barry

The Disclaimer: Energy Tidbits is intended to provide general information only and is written for an institutional or sophisticated investor audience. It is not a recommendation of, or solicitation for the purchase of securities, an offer of securities, or intended as investment research or advice. The information presented, while obtained from sources we believe reliable as of the publishing date, is not guaranteed against errors or omissions and no representation or warranty, express or implied, is made as to their accuracy, completeness or correctness. This publication is proprietary and intended for the sole use of direct recipients from Dan Tsubouchi and SAF Group. Energy Tidbits are not to be copied, transmitted, or forwarded without the prior written permission Dan Tsubouchi and SAF Group. Please advise if you have received Energy Tidbits from a source other than Dan Tsubouchi and SAF Group.
17
Energy Tidbits
Oil – Permian base oil decline rates around 40%
We continue to recommend investors look to the Q&A section of oil earnings calls for typically is the best insight and often unplanned insight. As noted below, one of our key calls from our Oct 7 webcast detailing the SAF Energy Outlook is that it was inevitable for analysts and agencies to lower their Permian oil growth forecasts for 2020, which means that US oil growth forecasts are also lowered. Our thesis is that all forecast models use the same basic inputs and that the math problem is because every input into their Permian oil growth equations are worse (lower) today than at the beginning of the year. The starting point for Permian oil growth forecasts is base decline rate. As a general rule, the US players do not disclose base decline rates, but no so this week. The challenge is that higher decline rates mean more oil production has to be added every year just to keep production flat. Our webcast slide (see below) included some excellent work from BTU on play overall base declines and it looks like the BTU estimates are being validated by the Q3 calls. BTU estimated the base Permian oil decline was in the high 30’s. Our last comment on base decline rates is that we recall how Cdn oil producers used to be hammered by investors if their oil base decline rates were over 30%. A base decline of ~40% is supportive of why we believed US oil growth rates would be lowered.
Concho’s Permian base oil declines in low 40’s but to 30’s at yr end 2020 On Wed, we tweeted [LINK] on the Concho Resources Q3 call was on Wed. Recall Concho stock was hammered after the Q2 reporting when it advised it’s downspacing wasn’t’ working and they would have to move to wider spacing. This followed the Q1 reporting that had the initial producing rates showing good rates, but markets learned the reminder that you need to get past the first 60 to 90 days to see how good the wells will be. This week, Concho’s move to a more conservative model (wider well spacing, less aggressive drilling, moving to free cash flow, etc) was leading to more predictable results going forward. In the Q3 call Q&A, mgmt. replied “Sure. Yeah, the our overall base decline is in the high 30s and oil is in the low 40s and as we move through 2020 and move into 2021, we see that oil declined moving back into the 30s.” We believe the vast majority of CEOs would say a 40% base decline is a big challenge for any oil producer to deliver sustainable, significantly oil growth. Matador says they have a 38% to 40% base Permian oil decline rate On Thurs, we tweeted [LINK] on the Matador Rsources Q3 call on Wed. Matador hasn’t had the same issues as Concho and is actually increasing intis production guidance. However, Matador also confirmed its estimate of base Permian oil decline rates as being 38% to 40%. In the Q&A, mgmt. replied ““Well, I think is we've answered that question in the past. I said, I think for 2019, the base decline was 38% to 40%, and that for the company as a whole and I would help and that would continue to shallow as we become a more mature organization, and also I do think that as we drill more of the longer laterals. I think that our observation has been that those wells tend to exhibit a bit shallower declines early. And so as a result, I'm hopeful that will also contribute to the improvement in the base decline rate going forward”
Permian base decline ~40%

The Disclaimer: Energy Tidbits is intended to provide general information only and is written for an institutional or sophisticated investor audience. It is not a recommendation of, or solicitation for the purchase of securities, an offer of securities, or intended as investment research or advice. The information presented, while obtained from sources we believe reliable as of the publishing date, is not guaranteed against errors or omissions and no representation or warranty, express or implied, is made as to their accuracy, completeness or correctness. This publication is proprietary and intended for the sole use of direct recipients from Dan Tsubouchi and SAF Group. Energy Tidbits are not to be copied, transmitted, or forwarded without the prior written permission Dan Tsubouchi and SAF Group. Please advise if you have received Energy Tidbits from a source other than Dan Tsubouchi and SAF Group.
18
Energy Tidbits
Figure 21: Increasing Permian Decline Rates
Source: SAF
Oil – More pointing to lower US oil growth in 2020
Last week’s (Oct 27, 2019) Energy Tidbits memo started to group the increasing number of of analyst forecasts and industry comments calling for, or point to, a lowering of US oil growth in 2020. This is in line with our expectations this summer, although we had expected analysts to lower the US oil growth forecasts after Labor Day and not necessarily wait until the Q3 reporting period. Soon we will not be able to say this is a lowering of US oil growth expectations because it seems like almost everyone is lowering US oil growth forecasdts. This was one of our major themes in our recent Oct 7, 2019 SAF Energy Outlook, we highlighted our view that the math says it is inevitable for agencies and analysts to lower their Permian growth forecasts and therefore their US oil growth forecasts for 2020. To be clear, we still see Permian growth, just at a lot lower rate. Anyone with a detailed model for estimating Permian oil growth has to include at least these basic inputs into their equation - Annual decline rates on the existing production base ie. how much production needs to be added to stay flat. how much capital is available, to fund drilling and completion of new wells, and for completion of the inventory of DUCs. to add production based on the well productivity rates. We think the math problem comes about because every input into this Permian oil growth equation is worse now. A big one is how capital available for producers is less. Its not just the lower well productivity rates, its all of these inputs into any model are worse so we think it is inevitable that Permian (and therefore total US) oil growth forecasts have to be lowered. And we believe a lowering of US oil growth forecast will be the key driver to a change in market sentiment to oil. Here are some of this week’s views/forecasts calling for lower US oil growth in 2020.
Baker Hughes sees decelerating growth in US oil production Baker Hughes held its Q3 call on Wednesday and noted its view on decelerating US oil production growth. Baker Hughes didn’t give a forecast for US oil growth, rather they just noted that its decelerating. In the Q3 earnings call, mgmt. said “On the supply side, we agree with the view that OPEC may have to consider additional cuts as non-OPEC non-US production at is poised for solid growth in 2020 as new
More calling for lower 2020 US oil growth

The Disclaimer: Energy Tidbits is intended to provide general information only and is written for an institutional or sophisticated investor audience. It is not a recommendation of, or solicitation for the purchase of securities, an offer of securities, or intended as investment research or advice. The information presented, while obtained from sources we believe reliable as of the publishing date, is not guaranteed against errors or omissions and no representation or warranty, express or implied, is made as to their accuracy, completeness or correctness. This publication is proprietary and intended for the sole use of direct recipients from Dan Tsubouchi and SAF Group. Energy Tidbits are not to be copied, transmitted, or forwarded without the prior written permission Dan Tsubouchi and SAF Group. Please advise if you have received Energy Tidbits from a source other than Dan Tsubouchi and SAF Group.
19
Energy Tidbits
offshore developments come online. In the US production growth is likely to decelerate it should remain resilient despite the expectation of E&P CapEx cuts next year when these factors together we expect an adequately supplied market and the most economic scenarios, resulting in the range bound oil price environment 2020”. BoA/Merrill expect to lower their +800,000 b/d US oil growth in 2020 On Tues, we attended an excellent presentation BoA/Merrill “Global Energy Outlook” presentation by Dr. Francisco Blanch (Head of Global Commodities and Derivatives Research). During the presentation, he said “for US supply growth, we are at 800,000 b/d for next year but maybe we are too high. we are waiting for q3 reporting for US producers to finish”. In the short q&a, I confirmed what he said that they were currently at +800,000 b/d for 2020 US oil growth, they are looking to lower the growth forecast, and that they are looking for what they see on capital allocation ie. the keeping to free cash flow models before making any adjustment. I asked on if lower well productivity was a factor in why they are expecting to lower US oil growth or just the capital allocation item. He said that they are seeing well productivity gains come down, but still are assuming 5% to 10% gains in well productivity. Ie. the reduction in growth will be driven by capital allocation. Our Supplemental Documents package includes the notes we took of the slide deck. Chevron and Exxon buck the trend, both delivering on Permian growth plans We didn’t get a chance to write up the Exxon and Chevron Q3 calls this week, but the main message from both was that they are on track with their Permian growth plans. We remind that Chevron and Exxon only make up about 15% of total Permian oil production so they can’t carry the Permian oil growth by themselves. Liberty Oilfield says “we may see US oil production plateau in early 2020” This week, we saw the most pessimistic call so far on US oil growth in 2020 from the Liberty Oilfield services Q3 call on Wed. On Wed, we tweeted [LINK] “Big plus for #Oil in 2019 if Liberty Q3 call views are right, “rate of growth in US oil production has also declined significantly. With this trend, we may see US oil production plateau in early 2020” #OOTT More in Sunday Nov 3, 2019 Energy Tidbits memo”. If this view plays out, it will more than tighten the market. This has been the most pessimistic call we have seen so far on US oil growth. In the prepared comments, mgmt. said “The US rig count has declined roughly 20% over the last year not surprisingly, the rate of growth in US oil production has also declined significantly. With this trend, we may see US oil production plateau in early 2020, which could help tighten oil markets and provide upward bias on oil prices. While timing is uncertain, we appear to be making progress towards a healthier US oil and gas industry as supply of frac fleets in Oil are both facing significant downward pressure”. US Silica Q3 – Taking out capacity, points to lesser US oil growth potential US Silica reported Q3 earnings on Thursday, and mgmt. comments supports the view of lower US growth. Similar to other service companies, they are taking out capacity, which points to the view that there is lesser oil growth potential than previously expected. Less capacity shouldn’t impact 2020 very much, but less service sector capacity means less ultimate growth potential. US Silica reduced frac sand capacity by 5 million tons, but the reduction was in the traditional Northern White mines and not the Permian. Mgmt said “We've been effectively executing all year on our playbook for capacity management, over the past few months we've taken approximately 5 million tons of Northern white and regional sand capacity

The Disclaimer: Energy Tidbits is intended to provide general information only and is written for an institutional or sophisticated investor audience. It is not a recommendation of, or solicitation for the purchase of securities, an offer of securities, or intended as investment research or advice. The information presented, while obtained from sources we believe reliable as of the publishing date, is not guaranteed against errors or omissions and no representation or warranty, express or implied, is made as to their accuracy, completeness or correctness. This publication is proprietary and intended for the sole use of direct recipients from Dan Tsubouchi and SAF Group. Energy Tidbits are not to be copied, transmitted, or forwarded without the prior written permission Dan Tsubouchi and SAF Group. Please advise if you have received Energy Tidbits from a source other than Dan Tsubouchi and SAF Group.
20
Energy Tidbits
offline through a combination of reducing hours worked for completely idling plants are also increasingly coupling sandbox our industry-leading last mile full service logistics solution with US special sand with a goal of doubling company directs and sales to the well site blender to 20% of overall sand sales”. This is what we would have expected, ie. the more likely reductions are first in Northern White as opposed to local Permian, as local Permian has lower transportation costs. Ultimately, this commentary fits our view of lower US oil production growth and is similar to other service companies reducing drilling and frack capacity, reduced capacity means lower than expected forecasts for US oil growth.
Oil – Trans Mountain and contractors have hired 2,200 people
Last week, we noted Trudeau’s clear comments that TMX is continuing, and this week brought another positive for the Trans Mountain expansion. On Monday, JWN Energy [LINK] reported that Trans Mountain and its have hired more than 2,200 people for the project. JWS quoted Trans Mountain saying “As of September 30, Trans Mountain and our contractors have hired more than 2,200 people for the Project, with a focus on Indigenous, local and regional workers … This includes heavy equipment operators, trades people, environment and safety roles, engineers and construction managers”. We see this as a big positive for the project, especially with the hiring of heavy equipment operators, trades and construction managers.
Oil – Reports Keystone shut in for another week or so
As of our news cut off of 8am MT today, Keystone has not posted an update on its Edinburgh Incident website [LINK] since Oct 31 at noon MT, which was “Our on-site team is focused on responding to the release and has begun recovering oil, using specialized equipment. The approximate size of the impacted area is 2,500 yd2 or less than half the size of a football field. We continue to inform regulatory agencies and local stakeholders of our progress. We have provided an initial estimate that 9,120 barrels of oil was released; approximately half the size of an Olympic-sized swimming pool. Our crews remain focused on oil recovery as they plan to make repairs to the pipeline. We will provide updates as they become available.” However on Friday, Bloomberg terminal reported “TC Energy’s Keystone oil pipeline is expected to be down for between 7 to 12 days from Friday, pending a full excavation of the area around the leak in North Dakota, according to people familiar with the matter. * Bulk of excavation work set to this weekend * Timeline could change depending on what is found during excavation, people say”. Keystone’s capacity is 590,000 b/d.
Oil – Alberta provides curtailment relief for crude by rail volumes
This week, the Alberta gov announced [LINK] it will allow companies to exceed oil production limits if they ship the incremental production by rail. This move was expected, and in our Sept 22, 2019 Energy Tidbits memo we said [LINK] “This move seems likely given the fact that Alberta is attempting to offload the crude by rail contracts signed by the NDP government. Our assumption is that large producers weren’t interested in taking on crude by rail contracts without the ability to ramp up production due to curtailment”. In the announcement, AB Energy Minister Savage said “The special allowance program will protect the value of our oil by ensuring that operators are only producing what they are able to move to market. Pipeline delays ultimately have constrained market access and dampened investment in our oil sector. This program will lead to more production and increased investment, benefitting industry, our province’s bottom line, and, ultimately, Alberta taxpayers”. The WCS-WTI differential is ultimately a driver for CBR volumes, and the diff was $21.50 as of Friday, which puts crude by rail in the money. Note, the special allowance
Trans Mountain
has hired 2,200
people
AB gov
provides curtail
relief for CBR
Keystone shut
in for another
week or so

The Disclaimer: Energy Tidbits is intended to provide general information only and is written for an institutional or sophisticated investor audience. It is not a recommendation of, or solicitation for the purchase of securities, an offer of securities, or intended as investment research or advice. The information presented, while obtained from sources we believe reliable as of the publishing date, is not guaranteed against errors or omissions and no representation or warranty, express or implied, is made as to their accuracy, completeness or correctness. This publication is proprietary and intended for the sole use of direct recipients from Dan Tsubouchi and SAF Group. Energy Tidbits are not to be copied, transmitted, or forwarded without the prior written permission Dan Tsubouchi and SAF Group. Please advise if you have received Energy Tidbits from a source other than Dan Tsubouchi and SAF Group.
21
Energy Tidbits
takes effect in December. Below is the WCS-WTI differential graph, and our Supplemental Documents package includes the Alberta announcement.
Figure 22: WCS-WTI Differential
Source: Bloomberg
Oil – Oil input into refineries up 133,000 b/d to 15.998 mmb/d
For the Oct 25 week, EIA estimates crude oil inputs to refineries were up 133,000 b/d to 15.865 mmb/d. Overall crude inputs are now 419,000 b/d lower YoY, which is largely driven by PADD 3 refinery maintenance, along with the closure of the PES Philadelphia refinery complex (335,000 b/d) following the Q2 fire. Without the PES refinery fire, crude inputs would have been -84,000 b/d YoY which is reasonable considering the higher than usual refinery maintenance in preparation for IMO 2020. We would expect to crude inputs to rise higher as we move into year end. Refinery utilization was up 2.5% this week to 87.7%. Below is our graph of the EIA weekly crude oil input to refineries.
Figure 23: US Refinery Crude Oil Inputs (thousand b/d)
Source: EIA, SAF
Oil – US “NET” oil imports up 1.196 mmb/d to 3.370 mmb/d
US “NET” imports were up 1.196 mmb/d to 3.370 mmb/d this week. US imports were up 840,000 b/d to 6.697 mmb/d and US exports were down 356,000 b/d to 3.327 mmb/d. Some items to note on the by country data. (i) Canada was up 289,000 b/d to 3.758 mmb/d for the Oct 25 week, which is supported by the WTI-WCS differential sitting above $15 for last 2.5 weeks. (ii) Saudi Arabia was up 153,000 b/d to 605,000 b/d for the Oct 25 week, which puts the country above its 2019 average of 520,000 b/d. (iii) Colombia was basically flat, down 8,000 b/d to 66,000 b/d. (iv) Iraq was -158,000 b/d to 123,000 b/d. (v) Venezuela remained
Oil input into
refineries up
133,000 b/d
US NET oil
imports up 1.196
mmb/d
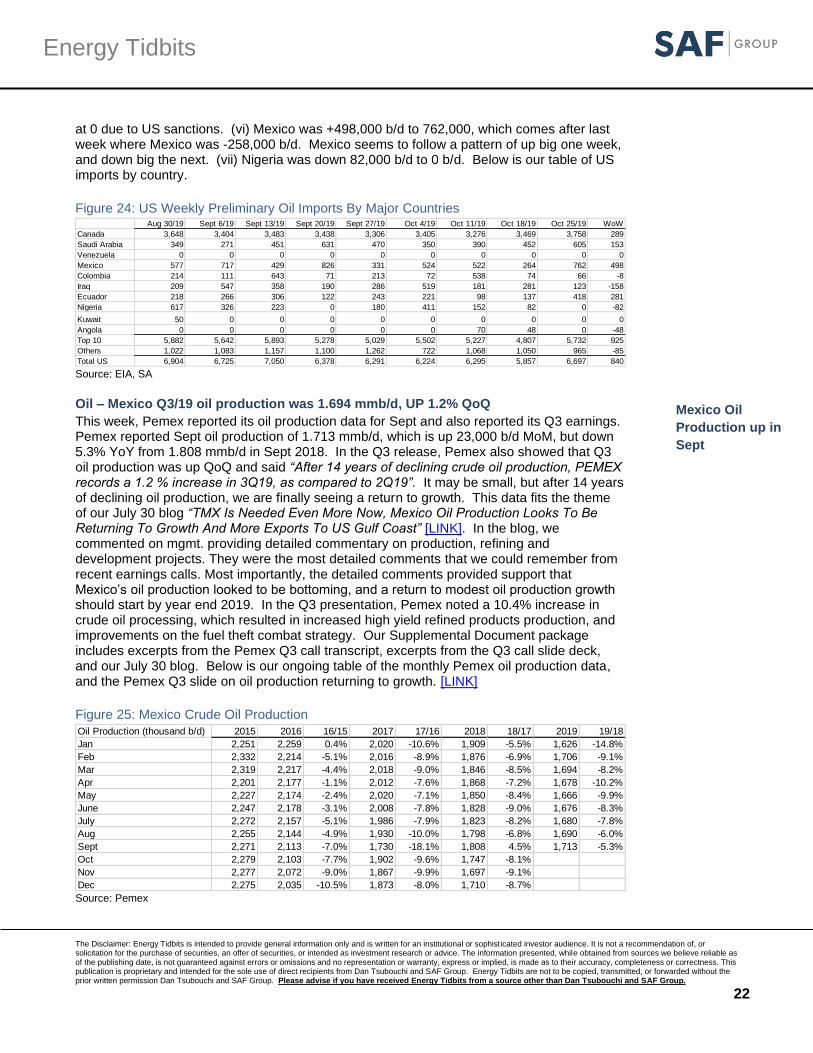
The Disclaimer: Energy Tidbits is intended to provide general information only and is written for an institutional or sophisticated investor audience. It is not a recommendation of, or solicitation for the purchase of securities, an offer of securities, or intended as investment research or advice. The information presented, while obtained from sources we believe reliable as of the publishing date, is not guaranteed against errors or omissions and no representation or warranty, express or implied, is made as to their accuracy, completeness or correctness. This publication is proprietary and intended for the sole use of direct recipients from Dan Tsubouchi and SAF Group. Energy Tidbits are not to be copied, transmitted, or forwarded without the prior written permission Dan Tsubouchi and SAF Group. Please advise if you have received Energy Tidbits from a source other than Dan Tsubouchi and SAF Group.
22
Energy Tidbits
at 0 due to US sanctions. (vi) Mexico was +498,000 b/d to 762,000, which comes after last week where Mexico was -258,000 b/d. Mexico seems to follow a pattern of up big one week, and down big the next. (vii) Nigeria was down 82,000 b/d to 0 b/d. Below is our table of US imports by country.
Figure 24: US Weekly Preliminary Oil Imports By Major Countries
Source: EIA, SA
Oil – Mexico Q3/19 oil production was 1.694 mmb/d, UP 1.2% QoQ
This week, Pemex reported its oil production data for Sept and also reported its Q3 earnings. Pemex reported Sept oil production of 1.713 mmb/d, which is up 23,000 b/d MoM, but down 5.3% YoY from 1.808 mmb/d in Sept 2018. In the Q3 release, Pemex also showed that Q3 oil production was up QoQ and said “After 14 years of declining crude oil production, PEMEX records a 1.2 % increase in 3Q19, as compared to 2Q19”. It may be small, but after 14 years of declining oil production, we are finally seeing a return to growth. This data fits the theme of our July 30 blog “TMX Is Needed Even More Now, Mexico Oil Production Looks To Be Returning To Growth And More Exports To US Gulf Coast” [LINK]. In the blog, we commented on mgmt. providing detailed commentary on production, refining and development projects. They were the most detailed comments that we could remember from recent earnings calls. Most importantly, the detailed comments provided support that Mexico’s oil production looked to be bottoming, and a return to modest oil production growth should start by year end 2019. In the Q3 presentation, Pemex noted a 10.4% increase in crude oil processing, which resulted in increased high yield refined products production, and improvements on the fuel theft combat strategy. Our Supplemental Document package includes excerpts from the Pemex Q3 call transcript, excerpts from the Q3 call slide deck, and our July 30 blog. Below is our ongoing table of the monthly Pemex oil production data, and the Pemex Q3 slide on oil production returning to growth. [LINK]
Figure 25: Mexico Crude Oil Production
Source: Pemex
Aug 30/19 Sept 6/19 Sept 13/19 Sept 20/19 Sept 27/19 Oct 4/19 Oct 11/19 Oct 18/19 Oct 25/19 WoW
Canada 3,648 3,404 3,483 3,438 3,306 3,405 3,276 3,469 3,758 289
Saudi Arabia 349 271 451 631 470 350 390 452 605 153
Venezuela 0 0 0 0 0 0 0 0 0 0
Mexico 577 717 429 826 331 524 522 264 762 498
Colombia 214 111 643 71 213 72 538 74 66 -8
Iraq 209 547 358 190 286 519 181 281 123 -158
Ecuador 218 266 306 122 243 221 98 137 418 281
Nigeria 617 326 223 0 180 411 152 82 0 -82
Kuwait 50 0 0 0 0 0 0 0 0 0
Angola 0 0 0 0 0 0 70 48 0 -48
Top 10 5,882 5,642 5,893 5,278 5,029 5,502 5,227 4,807 5,732 925
Others 1,022 1,083 1,157 1,100 1,262 722 1,068 1,050 965 -85
Total US 6,904 6,725 7,050 6,378 6,291 6,224 6,295 5,857 6,697 840
Oil Production (thousand b/d) 2015 2016 16/15 2017 17/16 2018 18/17 2019 19/18
Jan 2,251 2,259 0.4% 2,020 -10.6% 1,909 -5.5% 1,626 -14.8%
Feb 2,332 2,214 -5.1% 2,016 -8.9% 1,876 -6.9% 1,706 -9.1%
Mar 2,319 2,217 -4.4% 2,018 -9.0% 1,846 -8.5% 1,694 -8.2%
Apr 2,201 2,177 -1.1% 2,012 -7.6% 1,868 -7.2% 1,678 -10.2%
May 2,227 2,174 -2.4% 2,020 -7.1% 1,850 -8.4% 1,666 -9.9%
June 2,247 2,178 -3.1% 2,008 -7.8% 1,828 -9.0% 1,676 -8.3%
July 2,272 2,157 -5.1% 1,986 -7.9% 1,823 -8.2% 1,680 -7.8%
Aug 2,255 2,144 -4.9% 1,930 -10.0% 1,798 -6.8% 1,690 -6.0%
Sept 2,271 2,113 -7.0% 1,730 -18.1% 1,808 4.5% 1,713 -5.3%
Oct 2,279 2,103 -7.7% 1,902 -9.6% 1,747 -8.1%
Nov 2,277 2,072 -9.0% 1,867 -9.9% 1,697 -9.1%
Dec 2,275 2,035 -10.5% 1,873 -8.0% 1,710 -8.7%
Mexico Oil
Production up in
Sept

The Disclaimer: Energy Tidbits is intended to provide general information only and is written for an institutional or sophisticated investor audience. It is not a recommendation of, or solicitation for the purchase of securities, an offer of securities, or intended as investment research or advice. The information presented, while obtained from sources we believe reliable as of the publishing date, is not guaranteed against errors or omissions and no representation or warranty, express or implied, is made as to their accuracy, completeness or correctness. This publication is proprietary and intended for the sole use of direct recipients from Dan Tsubouchi and SAF Group. Energy Tidbits are not to be copied, transmitted, or forwarded without the prior written permission Dan Tsubouchi and SAF Group. Please advise if you have received Energy Tidbits from a source other than Dan Tsubouchi and SAF Group.
23
Energy Tidbits
Figure 26: Mexico Oil Production – From Pemex Q3 Presentation
Source: Pemex
Oil – Mexico Sept oil exports were 995,000 b/d
On Monday, Pemex also reported Mexico oil exports in Sept 2019 were 995,000 b/d, down 17.5% YoY from 1.206 mmb/d in Sept 2018, and down 8% MoM from 1.082 mmb/d in Aug 2019. Monthly Mexico oil exports have only dipped below 1 mmb/d 3 times in the last several years, but increasing domestic oil production should be supportive of Mexico’s oil exports. Pemex also reported that its oil exports to the US in Sept were 539,000 b/d, which was down YoY from 748,000 b/d in Sept 2018, and down MoM from 625,000 b/d in Aug 2019. Below is our table of the Pemex oil export data.
Figure 27: Mexico Crude Oil Exports
Source: Pemex
Oil – Johan Sverdrup loadings to already hit ~400,000 b/d in Dec
The Johan Sverdrup oil field continues to surprise to the upside, with first oil two months earlier than expected and significantly lower full-field development costs since FID. This week, Bloomberg Terminal story “Johan Sverdrup Oil Loads to Average 395k B/D in Dec. (Correct)” reported that Johan Sverdrup crude shipments will be 20 cargoes in December to average 395,000 b/d. On Wed we tweeted [LINK] “#Oil negative going into seasonally low Q1 oil demand period, Bloomberg terminal "Johan Sverdrup Oil Loads to Average 395k B/D in Dec". Great start, 1st #Oil on Oct 5. phase 1 plateau 440,000 b/d, increasing to 660,000 b/d phase 2 plateau yr end 2022 #OOTT”. This is impressive, as the estimated Dec loadings
Oil Exports (thousand b/d) 2015 2016 16/15 2017 17/16 2018 18/17 2019 19/18
Jan 1,261 1,119 -11.3% 1,085 -3.0% 1,107 2.0% 1,071 -3.3%
Feb 1,305 1,241 -4.9% 1,217 -1.9% 1,451 19.2% 1,475 1.7%
Mar 1,228 1,062 -13.5% 1,001 -5.7% 1,176 17.5% 1,150 -2.2%
Apr 1,035 1,081 4.4% 1,017 -5.9% 1,266 24.5% 1,023 -19.2%
May 1,114 1,204 8.1% 958 -20.4% 1,222 27.6% 1,205 -1.4%
June 1,047 1,098 4.9% 1,157 5.4% 1,110 -4.1% 995 -10.4%
July 1,187 1,146 -3.5% 1,255 9.5% 1,156 -7.9% 1,079 -6.7%
Aug 1,261 1,261 0.0% 1,114 -11.7% 1,181 6.0% 1,082 -8.4%
Sept 1,169 1,425 21.9% 1,159 -18.7% 1,206 4.1% 995 -17.5%
Oct 1,280 1,312 2.5% 1,342 2.3% 1,027 -23.5%
Nov 1,178 1,273 8.1% 1,388 9.0% 1,135 -18.2%
Dec 1,008 1,115 10.6% 1,401 25.7% 1,198 -14.5%
Mexico Sept oil
exports 995,000
b/d
Johan Sverdrup
up to ~400,000
b/d

The Disclaimer: Energy Tidbits is intended to provide general information only and is written for an institutional or sophisticated investor audience. It is not a recommendation of, or solicitation for the purchase of securities, an offer of securities, or intended as investment research or advice. The information presented, while obtained from sources we believe reliable as of the publishing date, is not guaranteed against errors or omissions and no representation or warranty, express or implied, is made as to their accuracy, completeness or correctness. This publication is proprietary and intended for the sole use of direct recipients from Dan Tsubouchi and SAF Group. Energy Tidbits are not to be copied, transmitted, or forwarded without the prior written permission Dan Tsubouchi and SAF Group. Please advise if you have received Energy Tidbits from a source other than Dan Tsubouchi and SAF Group.
24
Energy Tidbits
is only 40,000 b/d below the expected Phase 1 peak production of 440,000 b/d that was supposed to be reached by summer 2020. Meaning we should expect to see the 440,000 b/d level much sooner than expected and will be a negative to the oil supply/demand balance in 2020.
Oil – Russia at 11.229 mmb/d in Oct, still slightly above OPEC+ quota
Yesterday, the Bloomberg terminal On Friday reported on the preliminary data for Russia oil production for Oct was 11.229 mmb/d, which means that Russia was still over quota. Bloomberg reported “Russia’s average daily oil production remained above its OPEC+ target in October, though the compliance gap is the smallest since the Druzhba crude-contamination crisis earlier this year. The country pumped 47.49 million tons of crude and condensate last month, according to preliminary data from the Energy Ministry’s CDU-TEK unit. That equals a daily average of 11.229 million barrels, based on the standard 7.33 barrels-per-ton conversion ratio, Bloomberg calculations show. That means Russia produced an average 39,000 barrels a day more than its OPEC+ cap.”
Oil – Reuters OPEC for Oct production: +693,000 b/d to 29.593 mmb/d
Reuters released it’s survey of Oct 2019 OPEC production on Thurs. We didn’t see any particular takeaway from the Reuters survey. (i) Overall, OPEC was up 693,000 b/d to 29.593 mmb/d, but that is all due to Saudi Arabia bringing back production post the Abqaiq attack. Overall OPEC is now down 3.077 mmb/d YoY. (ii) Saudi Arabia was up 850,000 b/d to 9.900 mmb/d and back to pre-Abqaiq levels. (ii) Ecuador was down 120,000 b/d to 420,000 b/d. This was due to protests as we have been highlighting in recent Energy Tidbits memos, but should be back to regular levels in Nov. As a reminder, Ecuador is leaving OPEC at Dec 31. (iii) Iran was only down 20,000 b/d to 2.050 mmb/d. Iran’s oil production is holding in there considering the US is still holding strong on cutting Iran exports to zero. Note, Iran is down 1.3 mmb/d YoY, and its still unclear where Iran’s barrels are ending up. (iv) Iraq was down 50,000 b/d to 4.650 mmb/d but is still 138,000 b/d above its quota, even after saying they are determined to get down to quota. (v) Nigeria is at 1.930 mmb/d, relatively unchanged. (vi) Venezuela was up 50,000 b/d to 650,000 b/d, but note Sept for Venezuela was revised down 50,000 b/d, so without the revision it would have been flat MoM. Venezuela is now -530,000 b/d YoY. Below is our running table of Reuters survey data.
Figure 28: Reuters Survey of Oct 2019 production
Source: Reuters, SAF
Oil – Bloomberg OPEC survey for Sept, Saudi down 1.47 mmb/d ave over month
Bloomberg released it’s survey of Oct OPEC production on Friday morning (i) We had a similar takeaway as the Reuters survey – there weren’t any really surprises one way or
Thousand b/d Oct Nov Dec Jan Feb Mar Apr May June July Aug Sept Oct MoM Quota
Oct -
Quota Oct YoY
Algeria 1,060 1,060 1,070 1,060 1,030 1,025 1,025 1,025 1,010 1,030 1,030 1,030 1,020 -10 1,025 -5 -40
Angola 1,530 1,510 1,470 1,450 1,440 1,450 1,420 1,500 1,400 1,390 1,360 1,410 1,390 -20 1,481 -91 -140
Congo 310 320 320 320 330 330 340 330 330 340 340 330 350 20 315 35 40
Ecuador 530 520 520 520 520 530 530 530 530 530 540 540 420 -120 508 -88 -110
Equatorial G. 120 120 120 120 120 130 120 110 110 110 110 110 110 0 123 -13 -10
Gabon 190 200 190 190 200 200 200 190 200 210 200 210 210 0 181 29 20
Iran 3,350 2,900 2,800 2,750 2,800 2,750 2,600 2,200 2,150 2,150 2,100 2,070 2,050 -20 -1,300
Iraq 4,650 4,550 4,700 4,650 4,580 4,500 4,530 4,650 4,650 4,700 4,760 4,700 4,650 -50 4,512 138 0
Kuwait 2,730 2,730 2,800 2,710 2,700 2,710 2,690 2,710 2,650 2,650 2,600 2,630 2,650 20 2,724 -74 -80
Libya 1,220 1,200 950 880 900 1,100 1,150 1,250 1,220 1,100 1,130 1,200 1,190 -10 -30
Nigeria 1,880 1,840 1,890 1,840 1,820 1,850 1,920 1,820 1,860 1,850 1,930 1,950 1,930 -20 1,685 245 50
Saudi Arabia 10,650 11,000 10,600 10,250 10,120 9,800 9,850 10,050 9,800 9,650 9,750 9,050 9,900 850 10,311 -411 -750
UAE 3,270 3,350 3,240 3,070 3,050 3,045 3,050 3,055 3,046 3,068 3,065 3,070 3,073 3 3,072 1 -197
Venezuela 1,180 1,230 1,200 1,170 1,050 900 800 750 740 750 730 600 650 50 -530
Total OPEC 14 32,670 32,530 31,870 30,980 30,660 30,320 30,225 30,170 29,696 29,528 29,645 28,900 29,593 693 -234 -3,077
Bloomberg OPEC
at 29.7 mmb/d in
Oct
Reuters OPEC
+693,000 b/d in
Oct
Russia still
slightly above
quota
The Disclaimer: Energy Tidbits is intended to provide general information only and is written for an institutional or sophisticated investor audience. It is not a recommendation of, or solicitation for the purchase of securities, an offer of securities, or intended as investment research or advice. The information presented, while obtained from sources we believe reliable as of the publishing date, is not guaranteed against errors or omissions and no representation or warranty, express or implied, is made as to their accuracy, completeness or correctness. This publication is proprietary and intended for the sole use of direct recipients from Dan Tsubouchi and SAF Group. Energy Tidbits are not to be copied, transmitted, or forwarded without the prior written permission Dan Tsubouchi and SAF Group. Please advise if you have received Energy Tidbits from a source other than Dan Tsubouchi and SAF Group.
25
Energy Tidbits
another. (ii) Bloomberg had OPEC production +1.110 mmb/d to 29.70 mmb/d in Oct. The increase was all due to Saudi Arabia increasing production post Abqaiq. Bloomberg had Saudi +1.230 mm/b in Oct to 9.880 mmb/d. (iii) Ecuador was down 120,000 b/d to 420,000 b/d. This was due to protests as we have been highlighting in recent Energy Tidbits memos, but should be back to regular levels in Nov. As a reminder, Ecuador is leaving OPEC at Dec 31. (iv) Iran was only down 20,000 b/d to 2.110 mmb/d. Iran’s oil production is holding in there considering the US is still holding strong on cutting Iran exports to zero. Note, Iran is down 1.21 mmb/d YoY, and its still unclear where Iran’s barrels are ending up. (iv) Iraq was down 100,000 b/d to 4.680 mmb/d but is still 168,000 b/d above its quota, even after saying they are determined to get down to quota. (v) Nigeria was down 20,000 b/d to 1.910 mmb/d. (vi) Venezuela was up 30,000 b/d to 690,000 b/d. Below is our running table of Bloomberg survey data.
Figure 29: Bloomberg Survey of Sept 2019 production
Source: Bloomberg, SAF
Oil – Saudi Aramco announces intention to proceed with IPO
There should be plenty of analyst views tomorrow on this morning’s (local time) Saudi Aramco short release that “today announces its intention to proceed with an initial public offering on the Main Market of Tadawul” [LINK]. Note there is a link to IPO documents but if you try to access the IPO documents from Canada, this message pops up “Sorry We regret that, due to regulatory restrictions, we are unable to provide you with access to this section of our website.” On the big stumbling block of getting to the MBS $2 trillion valuation, we have to believe the Saudis have given in on their $2 trillion valuation. So when we look at all the reports Sat that the bankers were thinking more towards $1.5 trillion, it made us remember our banking 101 lessons and that this is the trying to change the narrative from a failure to get to $2 trillion to set the bar lower such that a deal that ultimately prices Aramco at $1.7 or $1.8 trillion ends up being a surprise to the upside and not a disappointment. They are going out marketing and will have the price discussion later. It would be interesting to hear what the bankers are saying in their one on one meetings, there has to be some sort of indicative pricing range as is normally the case for an IPO. The preliminary prospectus is reported to be available on Nov 9/10. There aren’t many details publicly available on the offering ie. no pricing range, no approximate allocation internationally vs domestic, etc. Reports are that they are still looking to IPO 1% to 2%. One interesting story is that it sounds like some type of warrant for Saudi retail investors that gives them the right to one extra share for every10 shares (to a maximum of 100 bonus shares) if the initial shares are held for 180 days.
IPO likely to give indications on OPEC+ cuts, Houthis/Iran, diffs, etc
No question,, the market focus will be on the IPO marketing and valuation,. However, we look at the IPO launch as likely giving some clearer indications of where the Saudis are on key oil market issues. We have to believe analysts and
thousand b/d Oct Nov Dec Jan Feb Mar Apr May June July Aug Sept Oct MoM YoY Quota
Oct vs
Quota
Algeria 1,070 1,070 1,060 1,050 1,030 1,025 1,020 1,010 1,010 1,010 1,020 1,030 1,080 50 10 1,025 55
Angola 1,530 1,490 1,470 1,450 1,440 1,440 1,380 1,450 1,410 1,360 1,400 1,360 1,340 -20 -190 1,481 -141
Congo 320 320 320 330 330 350 350 340 330 320 330 320 330 10 10 315 15
Ecuador 520 520 510 520 530 520 520 520 530 540 530 540 420 -120 -100 508 -88
Equatorial Guinea 120 110 120 110 110 120 120 110 110 120 120 120 120 0 0 123 -3
Gabon 180 180 170 210 200 190 180 200 200 190 200 190 220 30 40 181 39
Iran 3,320 3,040 2,890 2,740 2,740 2,710 2,550 2,380 2,280 2,210 2,210 2,130 2,110 -20 -1,210
Iraq 4,660 4,570 4,700 4,690 4,620 4,550 4,630 4,730 4,750 4,750 4,780 4,780 4,680 -100 20 4,512 168
Kuwait 2,790 2,800 2,810 2,750 2,710 2,700 2,720 2,700 2,690 2,680 2,640 2,690 2,670 -20 -120 2,724 -54
Libya 1,200 1,110 1,000 900 900 1,100 1,190 1,150 1,150 1,100 1,070 1,120 1,180 60 -20
Nigeria 1,800 1,760 1,770 1,790 1,830 1,870 1,900 1,860 1,890 1,890 1,950 1,930 1,910 -20 110 1,685 225
Saudi Arabia 10,680 11,070 10,650 10,200 10,100 9,820 9,790 9,830 9,820 9,780 9,830 8,650 9,880 1,230 -800 10,311 -431
UAE 3,120 3,270 3,260 3,090 3,070 3,050 3,070 3,070 3,060 3,060 3,070 3,070 3,070 0 -50 3,072 -2
Venezuela 1,220 1,230 1,220 1,230 1,070 830 840 780 770 780 760 660 690 30 -530
Total OPEC 14 32,530 32,540 31,950 31,060 30,680 30,275 30,260 30,130 30,000 29,790 29,910 28,590 29,700 1,110 -2,830 25,937 -217
Aramco IPO to
proceed

The Disclaimer: Energy Tidbits is intended to provide general information only and is written for an institutional or sophisticated investor audience. It is not a recommendation of, or solicitation for the purchase of securities, an offer of securities, or intended as investment research or advice. The information presented, while obtained from sources we believe reliable as of the publishing date, is not guaranteed against errors or omissions and no representation or warranty, express or implied, is made as to their accuracy, completeness or correctness. This publication is proprietary and intended for the sole use of direct recipients from Dan Tsubouchi and SAF Group. Energy Tidbits are not to be copied, transmitted, or forwarded without the prior written permission Dan Tsubouchi and SAF Group. Please advise if you have received Energy Tidbits from a source other than Dan Tsubouchi and SAF Group.
26
Energy Tidbits
investors will be probing on issues such as Abqaiq processing capability and that there will be reports from these meetings. (i) OPEC#+ extension. The Saudis have been pretty clear that they are prepared to do more if needed. The OPEC+ meetings are Dec 4-6. We should see more comments that Saudis will do more to support markets. This is critical as markets move into the seasonally oil demand period in Q1/20. (ii) Diffs. This may be the most significant near term oil price issue that will be resolved or at least clarified in the one on one meetings, or by analysts ie. has the damage to all the equipment at Abqaiq been fixed/replaced so that Saudi Aramco is able to produce oil at the processed quality ie. light sweet. Saudi has clearly stated that it has been back at full production volumes, but we have seen differentials have been pointing to a continued issue. (iii) Houthis. As noted below and from a few weeks ago, the reports that Saudi was having discussions with the Houthis. The problem is that Aramco can’t really speak on behalf of the govt on Houthis policy. Rather perhaps the best indicator we will see is if the Houthis continue to be relatively silent on the attack front. If the Houthis really wanted to hit the Saudis, there could be no better time than to launch missile attacks during the IPO marketing.
Also if Saudi agrees with Falih view on lower than expected Permian growth
Perhaps the most significant insight may come if analysts/investors ask Saudi’s view on the Permian. Our Oct 6, 2019 Energy Tidbits noted the Bloomberg reporting [LINK] “There are some concerns about recessionary forces,” said Saudi Energy Minister Prince Abdulaziz Bin Salman, who was appearing alongside Novak at the Russian Energy Week conference in Moscow. “There is a gloomy picture that has been drawn.” However, the minister added that many assumptions about the economy were too pessimistic. “There are things that are real, and things that are perceived. We are driven by negative expectations,” Prince Abdulaziz said. “On the demand side, yes it’s been lower, but people need to understand that supply also may become lower” than current forecasts.” We tweeted on the story and wondered if he was teasing Saudi may reduce supply by adding cuts to balance oil markets? Almost as a cover to ongoing issues post Abqaiq. But immediately one of our Twitter followers suggested “I think he may be referring to US shale growth rate slowing”. We then immediately remembered our July 3 blog on then Saudi Energy Minister Falih’s comments on the Permian and wondered if Abdulaziz was also teasing something about US shale oil growth. We then tweeted [LINK] “Thx @davidk2017 maybe thinking US shale. Yes, likely part of the equation. this is a key theme in our outlook webcast on mon. links to july 3 blog A Big Plus To Post 2020 Oil If Saudi Is Even Directionally Right That Permian Plateau Is “In A Year Or Two Years Or Four Years”. Our energy outlook webcast tomorrow will feature our views on Permian oil growth. Either way, lower supply would be a big support oil prices. Our Supplemental Documents package includes our July 3 blog.
Oil – Saudi to cut govt spending, the biggest (least painful) cut would be Houthis war
On Friday morning, we tweeted [LINK] on the FT story “Saudi Arabia reins in spending as it puts faith in reform” [LINK]. FT reported on the Saudi Finance Ministeral-Jadaan’s pre-budget statement “the finance minister, said sentiment was turning positive as he announced in his pre-budget statement that government expenditure for 2020 would be reduced to SR1.02tn ($320bn) from an estimated SR1.05tn this year. It would fall progressively to SR955bn in 2022, he added.” FT also noted that “Saudi Arabia is reining in government spending for the first time in three years”. Although there is no mention in the FT story, we have to believe that one of the areas for the biggest (and least painful) spending cuts is to sign a peace deal with the Houthis. We spent some time looking for an official estimate of
Saudi to cut govt
spending

The Disclaimer: Energy Tidbits is intended to provide general information only and is written for an institutional or sophisticated investor audience. It is not a recommendation of, or solicitation for the purchase of securities, an offer of securities, or intended as investment research or advice. The information presented, while obtained from sources we believe reliable as of the publishing date, is not guaranteed against errors or omissions and no representation or warranty, express or implied, is made as to their accuracy, completeness or correctness. This publication is proprietary and intended for the sole use of direct recipients from Dan Tsubouchi and SAF Group. Energy Tidbits are not to be copied, transmitted, or forwarded without the prior written permission Dan Tsubouchi and SAF Group. Please advise if you have received Energy Tidbits from a source other than Dan Tsubouchi and SAF Group.
27
Energy Tidbits
how much Saudi Arabia has spent fighting the Houthis in the 4 ½ year war. No surprise, there isn’t one. It seems that the most common estimates or views on how much the Saudis have spent are over $30 billion per year, which, if correct, would be about 10% of Saudi govt spending. Then throw that on top of the other reasons (ie. reduce risk of Houthi attacks support to Aramco valuation), it just seems like another reason why Saudi Arabia is likley to push for a deal with the Houthis sooner than later. Our Supplemental Documents package include the FT story.
Don’t forget Saudi has reportedly been talking to the Houthis
Our Oct 13, 2019 Energy Tidbits noted the FT story “Riyadh holds talks with Houthis in effort to break Yemen deadlock” [LINK] FT wrote “Saudi Arabia has been holding talks with Houthi rebels for the first time in more than two years in a sign Riyadh wants to de-escalate hostilities in Yemen in the wake of last month’s attacks on its oil facilities. The “back-channel” negotiations began after the Iran-aligned Houthis announced on September 20 that they would cease drone and missile attacks on the kingdom, people briefed on the talks said”.
Oil – Saudi helps build the case that peak oil demand hits sooner than expected
On Wed, we tweeted [LINK] on Saudi energy minister Abdulaziz’s address to the Future Investment Initiative in Riyadh that was posted by the Saudi Press Agency posted [LINK]. We think this Saudi speech helps build the case that peak oil demand happens sooner than expected. This is a short address and it is almost 100% focused on efficiency items. We have been in the camp that says its sometime after 2030, likely maybe 2035 or so. But this Saudi speech can move that forward to closer to 2030. Its worth noting the Saudi Energy Minister speech today highlighting Saudi Arabia’s push on energy efficiency and that “We believe that these efforts combined will reduce Saudi Arabia’s local demand by as much as 2 million barrels per day of oil equivalent by 2030 compared to previous projections”. The speech is short and no question he wants to leave the impression that this cut is basically due to energy efficiency. This is a big cut to boe consumption, basically a 1/3 cut in energy consumption in 10 years. On the surface, we think it sounds highly unlikely from efficiency type items. It is “boe” and not just oil. However, it is a reminder of the impact of efficiency (a bigger factor than EVs potentially to 2030 and that it is another factor that is likely to push peak oil demand sooner than expected. Saudi’s energy consumption (see below) is approx. 5.93 mmboe/d. vs the reduction of as much as 2 mmboe/d. Saudi’s domestic oil and energy consumption is (i) BP data shows Saudi’s domestic oil and NGLs consumption is was 3.724 mmb/d in 2018. (ii) OPEC’s Annual Statistical Bulletin 2019 has Saudi “oil” consumption at 3.105 mmb/d ie. excluded the NGLs portion. (iii) BP data shows Saudi oil/NGLs consumption is 62.8% of total energy consumption, balance is natural gas in 2018. Our Supplemental Documents package includes the Abdulaziz remarks.
Makes us wonder about nuclear power, especially mini nukes
We just find it hard to believe Saudi can get to this target by efficiency type measure. But if we are to accept that Saudi is going to reach this target, it has to point to two other initiatives. The speech is almost 100% on efficiency items, except for the inclusion of “the diversification of the Kingdom’s energy mix”. There is no further color on the changing energy mix. But we believe the two key potential changes to the energy mix are nuclear power and solar power teamed with battery storage. Of the two, we think the one that could make the most difference is nuclear power. Saudi is ideally position for solar, but that has yet to take off despite big capital allocation and announcements over the past two years. It means that battery storage developments haven’t been strong enough to finally push solar to play a bigger role
Saudi says can
cut 2 mmboe/d in
demand

The Disclaimer: Energy Tidbits is intended to provide general information only and is written for an institutional or sophisticated investor audience. It is not a recommendation of, or solicitation for the purchase of securities, an offer of securities, or intended as investment research or advice. The information presented, while obtained from sources we believe reliable as of the publishing date, is not guaranteed against errors or omissions and no representation or warranty, express or implied, is made as to their accuracy, completeness or correctness. This publication is proprietary and intended for the sole use of direct recipients from Dan Tsubouchi and SAF Group. Energy Tidbits are not to be copied, transmitted, or forwarded without the prior written permission Dan Tsubouchi and SAF Group. Please advise if you have received Energy Tidbits from a source other than Dan Tsubouchi and SAF Group.
28
Energy Tidbits
in the future. We expect them to keep looking at solar. But to us, we think that they have to be looking hard at nuclear as the key dependable item for this oil displacement. Below is the BP estimate of Saudi’s energy mix in 2018.
Figure 30: Saudi Arabia Primary Energy Consumption By Fuel
Source: BP
Oil – Khamenei reminds to negotiations with US
Ayatollah Khamenei made a major speech today before tomorrow’s 40th anniversary of the US hostage taking. One of his key themes was no negotiations with the US. In the Iranian news reporting, we didn’t see any indication of his being against negotiations with other, whether it be the Saudis or other members of the JOCPA. Although he did disparage the Macron initiatives. Some of his quotes were “Some who see negotiating with the US as the solution to problems are a hundred percent wrong. Nothing will come out of negotiation with the Americans, because they will certainly and definitely not make any concessions.“ He also reminded of a key non-negotiable – Iran’s cruise/ballistics missiles. He said “Today, by the grace of God and thanks to the efforts of our youths, we have precision missiles with a range of 2,000 kilometers that can hit any target with a margin of error of just one meter” “and “"If we had gone to negotiations, the Americans would have expected the missiles to be included too. For example, they would ask that the Iranian missiles should have a maximum range of 150 kilometers. If the officials had accepted it, it would have wrecked the country and if not, the status quo would have continued." He also noted the futility of what Cuba and North Korea have done with their agreements with the US - "US and North Korean officials mutually exchanged so many pleasantries, but in the end, the Americans did not drop a single boycott and gave no concessions." Then his comments on Macro “The French president, who says a meeting will end all the problems between Tehran and America, is either naive or complicit with America," Our Supplemental Documents package includes the PressTV reporting. [LINK]
Oil – Sounds like lingering concerns for a Druzhba pipeline quality problem
This week, TASS reported [LINK] that Minsk is looking for ways to replace Russian oil supplies via Ukrainian and Baltic ports. Belneftekhim Deputy Chairwoman Gurina said "We have been looking for alternative crude supplies for quite a while. We are considering the possibility of supplies from CIS countries, the Middle East and Africa to our refineries both through Ukrainian ports and through the ports of the Baltic states". Gurina attributed the decision to ongoing tax maneuvers in the Russian oil sector and the Russian oil price approaching the global price. Notwithstanding the commentary, we have to believe this is mostly driven by concerns about a repeat of the Druzbha oil quality issue from the spring. The Chairwoman confirmed that Russia oil supplies to Belarusian refineries will continued as planned thru the end of 2019, but the question is how will supplies from Russia change in 2020, especially as this week Kazakhstan’s Minister of Energy revealed his plans for an agreement to supply oil and oil products to Belarus. [LINK]
Oil – HSFO demand likely higher with IMO 2020 non compliance
We are starting to see signs that HSFO and heavy oil demand should be a little higher than expected in 2020, as more countries announce they won’t be enforcing IMO 2020 regulations
2018
Million tonnes oil equivalent
Oil Natural
Gas
Coal Nuclear
energy
Hydro
electric
Renew-
ables
Total
Saudi Arabia 162.6 96.4 0.1 - - ^ 259.2
% of Total All Fuel 62.8% 37.2% 0.0% - - - 100.0%
Lingering
concerns for
Druzhba
quality?
HSFO demand
likely higher
Khamenei says
no negotiations
with US
The Disclaimer: Energy Tidbits is intended to provide general information only and is written for an institutional or sophisticated investor audience. It is not a recommendation of, or solicitation for the purchase of securities, an offer of securities, or intended as investment research or advice. The information presented, while obtained from sources we believe reliable as of the publishing date, is not guaranteed against errors or omissions and no representation or warranty, express or implied, is made as to their accuracy, completeness or correctness. This publication is proprietary and intended for the sole use of direct recipients from Dan Tsubouchi and SAF Group. Energy Tidbits are not to be copied, transmitted, or forwarded without the prior written permission Dan Tsubouchi and SAF Group. Please advise if you have received Energy Tidbits from a source other than Dan Tsubouchi and SAF Group.
29
Energy Tidbits
on domestic shipping. (i) Last Sunday, Bloomberg Terminal story “Russia May Throttle Back in Adopting Rules for Cleaner Ship Fuel” reported that Russia is looking to delay the stricter standards for ships operating within the country. Energy Minister Novak said IMO 2020 “will lead to a sharp hike in the price of fuel for the river fleet and river-sea vessels, which operate mainly in Russia’s territorial waters” and the Russian ministries are seeking “to prevent a higher financial pressure on the nation’s shipowners”. The Russia announcement made us think about other countries who could follow Russia’s plans, ie the countries with a big enough water network, and those with refineries that produce HSFO. (ii) We had not noticed that in July Indonesia announced thy were not enforcing IMO regulations on domestic shipping [LINK]. (iii) We have to wonder about others But what about China? We recognize that the Chinese ports were quick to adopt lower emissions, but the bigger question comes down to cost, especially with the economy being hit. We also thought about other countries like the US, and the conclusion is that heavy oil and HSFO demand surprises to the upside in 2020. Our Supplemental Documents package includes the Bloomberg story on Russia and the Indonesia July story.
Oil and Natural Gas – sector/play/market insights from Q3 calls
This is our favorite time each time of each quarter as it is quarterly reporting and this is when we get the best insights into a range of oil and gas themes/trends, sectors and plays. As a reminder, our Energy Tidbits memo does not get into the quarterly results, forecasts or valuation. Rather the purpose of highlighting a company is to note themes/trends and plays that will help shape a reader’s investment thesis to the energy sector. In the conference calls, we also tend to find the best insights from the Q&A portion as opposed to the prepared remarks. Plus we tend to get the best E&P sector insights from services, pipelines, refineries and utilities and that was the case again this week.
BP – priority is Eagle Ford over the Permian
BP held its Q!3 call on Tues. (i) Earlier we noted BP’s LNG call that highlighted their view that the oversupplied LNG market will mean that US LNG export facilities will not be able to find customers for all their capacity. (ii) In the Q&A, mgmt. was asked on their Lower 48 shale strategy in light of public data showing their Eagle Ford appeared to be top quartile. BP does not have the big dominant Permian land positions as Exxon and Chevron, but replied “So I would say in terms of BPX capital wise, we're still allocation just over $2 billion of capital into those assets. I think they give us huge flexibility in terms of the ability to ramp-up and it is actually in the priority you said it's Eagle Ford its Permian and Haynesville we've ramped down significantly, which is natural given where you can see the gas prices and in some respect to do in a minimum of what we need to do inside that basin. But I think pretty much it is. Eagle Ford Permian Haynesville” for their play ranking.
Concho – Reaffirmed the move to wider well spacing
Concho held its Q3 call on Wed. (i) Earlier in the memo we commented on Concho’s overall base decline rates. (ii) Focus is on wider spacing. Recall Concho stock was hammered with the Q2 results on downspacing not working in key Permian properties. This followed the Q1 reporting that showed the initial producing rates looked solid, but markets were reminded that you need to get past the first 60 to 90 days to see how good the wells will be. Concho reaffirmed they are moving to wider spacing for their future drilling, and this is the big change in their drilling program. Remember the basic math that wider spacing = less potential locations = less potential growth. (ii)i Mgmt said they are living within cash flow to generate free cash
Sector insights
from Q3 calls
The Disclaimer: Energy Tidbits is intended to provide general information only and is written for an institutional or sophisticated investor audience. It is not a recommendation of, or solicitation for the purchase of securities, an offer of securities, or intended as investment research or advice. The information presented, while obtained from sources we believe reliable as of the publishing date, is not guaranteed against errors or omissions and no representation or warranty, express or implied, is made as to their accuracy, completeness or correctness. This publication is proprietary and intended for the sole use of direct recipients from Dan Tsubouchi and SAF Group. Energy Tidbits are not to be copied, transmitted, or forwarded without the prior written permission Dan Tsubouchi and SAF Group. Please advise if you have received Energy Tidbits from a source other than Dan Tsubouchi and SAF Group.
30
Energy Tidbits
flow and provide cash back to shareholders. This is their revised business plan, and note they wont automatically chase growth even in a rising oil price scenario. (vi) Mgmt reminded that New Mexico has large federal lands, which would be exposed to any potential fracking ban. In the Q&A, mgmt. replied “Yeah. I come on that my prepared remarks that, we can move rigs and our capital around pretty efficiently. It's obvious that the federal lands are in Mexico and the permits on federal lands take longer to get so if they're more lead time, so the things that we are doing to mitigate that are we have quite a bit of activity on them right now and then we've always run a program where we have properties right across the state line where you can move Rigs back and forth. So that's those some of the of having assets in both the Delaware and the Midland Basin and in New Mexico and the Texas side the Delaware Basin”. Our Supplemental Documents package includes excerpts from the Concho Q3 call transcript.
GATX – Analyst raises risk that Union Pacific may ban retrofit DOT-117R cars
GATX held its Q3 call last week. One of our concerns remains that the retrofit DOC 117R and their equivalent jacketed CPC 1232 tank cares are phased out earlier than expected by the Liberal govt,. But we have to remember that the rail companies could disallowThere was an interesting question from the GATX Q3 cal. It wasn’t so much a GATX point but a Union Pacific point as one analyst says he hears Union Pacific may be moving to only allow the new build DOT-117J , like Burlington did last year. ie. no longer letting the Retrofit DOT-117R tank cars. GATX did not confirm that, rather it was in the question. The analyst question was “Good morning. Thank you. Tom, you mentioned customers' preference for the DOT-117 tank car. Is that strictly for the DOT-117J, the newly built variety? Because we're hearing that Union Pacific maybe -- may start demanding the use of DOT-117J specifically for highly flammable liquids like BNSF did a while back. Is that something you guys are hearing? And does it mean that it -- this makes you hesitant to invest in any retrofitted variety of the DOT-117?” Management didn’t clearly address the part of the question on Unon Pacific. We double checked the Union Pacific Q3 call and there was no mention of this potential move to ban retrofit DOT 117R tank cars.
Liberty Oilfield – Drilling slowdown in Q4; smoother industry drilling in 2020
Liberty Oilfield held its Q3 call on Wed. (i) Earlier in the memo we commented on Liberty’s very bearish comments on US oil production growth. (ii) Efficiency gains are growing at a lower rate. In the Q&A, mgmt. replied “Yeah, I would say we're definitely coming into a period of diminishing returns the low hanging fruit frankly to stop, people should have enduring years ago. Most of that is gone, I think good growth in efficiency from here going forward it's certainly at a significantly slower rate than it's been in the past few years. We've got a huge run up in that, we pushed out a lot of the older less confident fleets that itself with no operational changes raises the average efficiency of frac fleets”. (iii) Expect Q4 drilling slowdown to be more than seen in previous years, but pick up in Q1 with the fresh budgets. This commentary is consistent with other service company views. Mgmt said “We expect that the industry slowdown in Q4 completions may be more severe this year than it was last year as operators based capital constraints and managed completions to fixed capital expenditure budgets. This will cause gaps in the completion schedule and negatively affect overall fleet utilization. Future activity projections in the industry are dependent on multiple factors including commodity price availability of capital and offtake capacity in each basis. Based on visibility into our customers initial thoughts, but the activity pipeline for 2020, we believe demand for Liberty fleets will be strong in the

The Disclaimer: Energy Tidbits is intended to provide general information only and is written for an institutional or sophisticated investor audience. It is not a recommendation of, or solicitation for the purchase of securities, an offer of securities, or intended as investment research or advice. The information presented, while obtained from sources we believe reliable as of the publishing date, is not guaranteed against errors or omissions and no representation or warranty, express or implied, is made as to their accuracy, completeness or correctness. This publication is proprietary and intended for the sole use of direct recipients from Dan Tsubouchi and SAF Group. Energy Tidbits are not to be copied, transmitted, or forwarded without the prior written permission Dan Tsubouchi and SAF Group. Please advise if you have received Energy Tidbits from a source other than Dan Tsubouchi and SAF Group.
31
Energy Tidbits
start of the new budget year”. Building on the comment of an uptick in Q1 activity, Liberty thinks E&P will have a smoother activity year in 2020 vs 2019 when there was way more activity in H1 vs H2. They attribute some of the smoothing impact to the supermajor and private companies. (iv) Liberty noted the New Mexico federal lands as a potential risk area for a fracking ban. Mgmt was asked about Colorado’s tougher o&g rules and Warren fracking ban, and if producers are changing plans yet. Mgmt said no change in plans yet, but producers are looking at plan B just in case. They were also asked about the bigger risk areas in terms of federal lands ie. New Mexico Delaware, mgmt. replied “Everybody consider certainly our customers consider what could happen with wild cards are out there. And certainly that is one of them, I would say actively considered the places with meaningful federal lands, you know the Powder River Basin in the New Mexico part of the Delaware fortunately, certainly in the Delaware and in the vast majority of the shale basins. They are dominant on private land. So there are federal land they're not trivial and scope, but they're not -- there is no there a large part of activity, except in the Powder River Basin … So certainly, it would be a negative, certainly it will be a sentiment problem and certainly planning would have to evolve around that, but we saw a meaningful change on federal lands, I think that takes some time to come in at people will shift to their activity on to non-federal land. It opens up a big battle, but does it cause collapse in industry activity soon after election, I think that's highly unlikely”. Our Supplemental Documents package includes excerpts from the Liberty Oilfield Q3 call transcript.
Nabors – Customers stretching out bill payment
Nabors reported Q3 earnings on Thurs, and there were a few good items to note. (i) The most interesting commentary which took up a portion of the Q&A was on how US customers aren’t paying their bills on time. We don’t take a deep dive on the debt levels of US producers, but dragging out payables is typically a bad sign. This started in 2019, and Nabors says that producers being forced to live within cash flow are stretching the cash flow by not paying their bills on time. Mgmt said “I hate to say this, but our customers have been delaying payments more than usual this year. Basically not meeting their payment commitments and paying on time and that started pretty early this year. So I guess those delays have something to do with a push on cash flow that they're getting from their shareholders.” “As a result, we deteriorate every quarter this So obviously, we're not just using this account receivable sales to mitigate the impact, we're also countering these customer tactics by trying to improve our internal DSO. So we're trying to get our invoice this out quicker out the door and get them approved by clients”. (ii) Similar view as the rest of the service sector on low Q3 activity and going lower in Q4. Also, their Sept survey of customers that make up 39% of Lower 48 said they expect lower drilling and completion in Q4/19. (iii) Mgmt highlighted underperforming basins, which included the Rockies, East Texas and Mid Con. Mgmt said “Although our high-spec utilization is also extremely high in the North Dakota and Marcellus markets, some gas markets have underperformed. These include the Rockies, East Texas, and the MidCon, where we have seen drops in activity and some pricing pressure”. Our Supplemental Documents package includes excerpts from the Nabors Q3 call transcript..
Oil & Natural Gas – Encana’s new branding announcement
One of the big Cdn oil news items this week was Encana announcing it was moving its domicile to the US from Canada and its new name Ovintiv. We should say that attracting
Encana rebranded
to Ovintiv

The Disclaimer: Energy Tidbits is intended to provide general information only and is written for an institutional or sophisticated investor audience. It is not a recommendation of, or solicitation for the purchase of securities, an offer of securities, or intended as investment research or advice. The information presented, while obtained from sources we believe reliable as of the publishing date, is not guaranteed against errors or omissions and no representation or warranty, express or implied, is made as to their accuracy, completeness or correctness. This publication is proprietary and intended for the sole use of direct recipients from Dan Tsubouchi and SAF Group. Energy Tidbits are not to be copied, transmitted, or forwarded without the prior written permission Dan Tsubouchi and SAF Group. Please advise if you have received Energy Tidbits from a source other than Dan Tsubouchi and SAF Group.
32
Energy Tidbits
capital should be a priority for any oil and gas company and that we agree with Encana that passive funds are increasing boll trend that isn’t likely to stop. Encana’s move to the US seems reasonable as way to attract increased passive funds to Encana. It was interesting to listen to the closing last half Encana’s new domicile and brand announcement video [LINK]. If you didn’t know Encana, you might think it is a clean energy company. Plus it also clearly shows how the old days are long gone where producers would aspire to be low cost producers, best drillers, capture the best plays, etc. Here is the transcript we created of the last half and closing to the new domicile and branding. Encana CEO said “As the world transitions to more sustainable energy solutions, we will continue to bring together the brightest minds and best technologies to fuel innovations, maximizing operational and environmental performance. Change will always be inevitable in our business. We are committed to our vision and have the discipline and the agility required to lead the way in an industry at the cusp of a transformation. To better represent the spirit of our organization and the role we play in the world, I’m excited to share our new brand – Ovintiv. Our new name communicates our commitment to continuous innovation, and our logo symbolizes the human connection made possible by the safe, reliable and affordable energy we produce. Together we are making modern life possible, for all.”
Energy Tidbits – Now on Twitter
For new followers to our Twitter, we are trying to tweet on breaking news or early views on energy items, most of which are followed up in detail in the Energy Tidbits memo or in separate blogs. Our Twitter handle is @Energy_Tidbits and can be followed at [LINK]. We wanted to use Energy Tidbits in our name since I have been writing Energy Tidbits memos for over 19 consecutive years. Please take a look thru our tweets and you can see we aren’t just retweeting other tweets. Rather we are trying to use Twitter for early views on energy items. Our Supplemental Documents package includes our tweets this week.
Energy Tidbits – Sign up on our email distribution for tidbits and blogs
Please note that we have set up our Energy Tidbits memo on our SAF website alongside our blogs. The distribution for the Energy Tidbits memo will be via the same notification system used for our blogs. To ensure you receive Energy Tidbits memos, please go to our blog sign up. We will be using the blog notification list for Energy Tidbits. The blog sign up is available at [LINK].
LinkedIn – Look for quick energy items from me on LinkedIn
I can also be reached on Linkedin and plan to use it as another forum to pass on energy items in addition to our weekly Energy Tidbits memo and our blogs that are posted on the SAF Energy website [LINK].
Misc Facts and Figures.
During our weekly review of items for Energy Tidbits, we come across a number of miscellaneous facts and figures that are more general in nature
Iran’s taking 52 US hostages was 40 years ago tomorrow We continue to be surprised that a game changing event in history doesn’t get much attention in the west every year – on Nov 4, 1979, Iran took 52 US hostages and held them for 444 days in Tehran. On Nov 4, 1979, Iranians (many of which were students) stormed the US embassy in Tehran and took 52 US diplomats and citizens and held them hostage for 444 days until Jan 20, 1981. Separately, 6 US diplomats made it to the Cdn embassy, hid there until Canada and the CIA were able to get them out of Iran as Canadians in 1980 in the “Canadian Caper”. A pretty amazing
Look for energy
items on LinkedIn
Sign up to receive
future Energy
Tidbits memos
Energy Tidbits now
on Twitter

The Disclaimer: Energy Tidbits is intended to provide general information only and is written for an institutional or sophisticated investor audience. It is not a recommendation of, or solicitation for the purchase of securities, an offer of securities, or intended as investment research or advice. The information presented, while obtained from sources we believe reliable as of the publishing date, is not guaranteed against errors or omissions and no representation or warranty, express or implied, is made as to their accuracy, completeness or correctness. This publication is proprietary and intended for the sole use of direct recipients from Dan Tsubouchi and SAF Group. Energy Tidbits are not to be copied, transmitted, or forwarded without the prior written permission Dan Tsubouchi and SAF Group. Please advise if you have received Energy Tidbits from a source other than Dan Tsubouchi and SAF Group.
33
Energy Tidbits
and heartwarming story that reflected the strength of Canada and US relationship and the people involved at that time. This day is celebrated in Iran as National Student Day. IRNA says its to “commemorate the occasion that marks the anniversary of the takeover of the US embassy in Tehran by the Iranian students in 1979. National Student Day is celebrated in Iran on 13 Aban (the 8th month of the Iranian year) marking the day of the fight against the global arrogance”. 30 year anniversary of the falling of the Berlin wall I had the good fortune to be in Germany about 10 days after the Berlin wall fell on Nov 9 1989. Even though I was in Frankfurt (and not Berlin), there was unbelievable buzz and excitement throughout the country. After all, the wall had been up for almost 30 years dividing West vs East Berlin and was really the symbol for communism. Early retirement may speed up cognitive decline Good news, bad news if you retire young. Good news is that you are retired and free to do what you want. Bad news is that early retirement may speed up cognitive decline. Studyfinds.org story this week “If You Rest, You Rust? Study Finds Early Retirement May Speed Up Cognitive Decline” [LINK] was on a Binghamton University study on early retirement. They wrote “After going over all of the data, the research team noted a clear trend: individuals receiving pension benefits were experiencing much more rapid mental decline than their counterparts still on the workforce. The most prominent indicator of mental decline among retirees was delayed recall, a trait widely considered to be an accurate predictor of dementia. Surprisingly, females seemed to experience even sharper mental decline after retiring early. Overall, the results support the hypothesis that decreased mental activity accelerates cognitive decline.”