by : maritje hutapea director for bioenergy hutapea (2).pdf · pontianak ptpn xiii ipp palm waste...
TRANSCRIPT

Ministry of Energy and Mineral Resources oh the Republic of Indonesia
Directorate General of New, Renewable Energy, and Mineral Resources
© DGNREEC MEMR - 2012
By :
Maritje Hutapea
Director for Bioenergy
Presented at :
Clean Power Asia Conference and Expo
Bali, 16 May 2012
DIRECTORATE GENERAL OF NEW, RENEWABLE ENERGY, AND ENERGY CONSERVATION
MINISTRY OF ENERGY AND MINERAL RESOURCES OF THE REPUBLIC OF INDONESIA

Ministry of Energy and Mineral Resources oh the Republic of Indonesia
Directorate General of New, Renewable Energy, and Mineral Resources
© DGNREEC MEMR - 2012
OUTLINE
I. Condition of Energy (2011)
II. Indonesian Energy Policy
III. Bioenergy Based Power Plant Development in Indonesia
IV. Policy And Regulation Related To Bioenergy Based
Power Plant
V. Conclusion
2

Ministry of Energy and Mineral Resources oh the Republic of Indonesia
Directorate General of New, Renewable Energy, and Mineral Resources
© DGNREEC MEMR - 2012 3
I. CONDITION OF ENERGY (2011)
National Energy Mix Total
(2011)
1176 million BOE
Elasticity of Energy = 1,65
Share of Non Fossil Energy 5%
1. High dependence on fossil energy;
2. The utilization of renewable energy is still low;
3. The average of growth rate of energy consumption is 7% per
year ;
4. Public access to energy (modern) is still limited:
a. Electrification ratio of year 2011 is 72.95 % (27.05 % of
households not yet electrified);
b. Less of development of energy infrastructure particularly
in rural / remote areas and outer islands ;
5. Linkage to environmental issues:
a. Mitigation of climate change;
b. Carbon trading;
c. National commitment to reducing emissions 26% by 2020.
Coal 23.91%
Crude Oil
46.77%
Natural Gas
24.29%
NRE 5.03%

Ministry of Energy and Mineral Resources oh the Republic of Indonesia
Directorate General of New, Renewable Energy, and Mineral Resources
© DGNREEC MEMR - 2012
II. Indonesia Energy Policy

Ministry of Energy and Mineral Resources oh the Republic of Indonesia
Directorate General of New, Renewable Energy, and Mineral Resources
© DGNREEC MEMR - 2012
Oil 20%
Coal 33%
Gas 30%
NRE 17%
Oil 42%
Coal 34%
Gas 21%
NRE 3%
POLICY DIRECTION
NRE
Gas
Coal
Oil
24,%
24 %
47,%
5,0 %
NRE
Gas
Coal
Oil
2011 2015 2020
2025
Primary Energi
Conservation
(15.6%)
En
ergy D
iversification
BAU
Note: 1 TOE = 7,33 SBM
PRESIDENTIAL
REGULATION 5/2006 VISION 25/25
25 %
32%
23%
20%
2785
Million BOE
1176
MillionBOE
3200
Million BOE
20%
30%
33%
17%
23% Oil
32% Coal
20% Gas
25% NRE
2419
MBOE
1649
MBOE
20,6%
34.6%
41.7%
3,1%
3298
MBOE
Coal 23.91%
Crude Oil 46.77%
Natural Gas
24.29%
NRE 5.03%
5

Ministry of Energy and Mineral Resources oh the Republic of Indonesia
Directorate General of New, Renewable Energy, and Mineral Resources
© DGNREEC MEMR - 2012
ENERGY POLICIES
1. Energy Conservation to improve efficiency in energy utilization
from up-stream up to down-stream (Demand Side) i.e industrial,
transportation, household and commercial sector
2. Energy Diversification to increase new renewable energy share
in national energy mix (Supply Side). i.e
New Energy
a. Liquefied Coal,
b. Coal Bed Methane,
c. Gasified Coal,
d. Nuclear,
e. Hydrogen,
f. Other Methanes.
Renewable Energy
a. Geothermal,
b. Bioenergy,
c. Hydro,
d. Solar,
e. Wind,
f. Ocean.
6

Ministry of Energy and Mineral Resources oh the Republic of Indonesia
Directorate General of New, Renewable Energy, and Mineral Resources
© DGNREEC MEMR - 2012
III. Bioenergy Based Power Plant
Development in Indonesia

Ministry of Energy and Mineral Resources oh the Republic of Indonesia
Directorate General of New, Renewable Energy, and Mineral Resources
© DGNREEC MEMR - 2012
WHY BIOENERGY ?
• Indonesia as an archipelago consist of 17.000 islands (big and small
islands). As an archipelago, many of areas can not reached by national grid;
or difficult to reached by modern energy;
• Bioenergy potential (agriculture waste, animal waste, municipal solid waste,
biomass) is available throught Indonesia that prospective to be developed
for both electricity and non electricity to fulfill the people’s energy demand;
• Many bioenergy technology has proven.
• Most of power plant are fossil based power plants which is release
greenhouse gases emission;
• Climate change has been a global issue – the more use of bionergy, the
more emission reduction can be achieved.
• The Government of Indonesia commit to reduce the National Greenhouse
gases
• It’s time to move from fossil energy to renewable energy especially
bioenergy;
8

Ministry of Energy and Mineral Resources oh the Republic of Indonesia
Directorate General of New, Renewable Energy, and Mineral Resources
© DGNREEC MEMR - 2012
BIOENERGI SUPPLY AND UTILIZATION SYSTEM
Liquid
Gas
Solid
Electromagnetic
(Green
Electricity)
(1) Bioenergy products consist of:
1. Bio Fuel (Green Fuels)
2. Bio-Electricity (Green Electricity)
Raw
Materials/
Feedstock
Bio-Refinery Distribution Biofuel
Oil
Biofuel
Solid
Bio-
Electricity
Bio-
Gassification Distribution
Biofuel
Gas
Bio-
Briquettes Distribution
Bio-
Cook Stove
Integrated
Generator
BIOENERGY CONVERSION INSTALLATION
(2) Biofuels in point 1.1. consist of:
1. Liquid Biofuel / Green Gasoline
2. Gas Biofuel, or Gas Plant / Green Gas
3. Solid Biofuel, or Bio-Briquette
9

Ministry of Energy and Mineral Resources oh the Republic of Indonesia
Directorate General of New, Renewable Energy, and Mineral Resources
© DGNREEC MEMR - 2012
25 POPI
980 ton
FFB/Hour
92 POPI
3815 ton
FFB/Hour
26 POPI
1645 ton
FFB/Hour
140
POPI
6660 ton
FFB/Ho
ur
1 POPI
40 ton
FFB/Hour
42 POPI
2245 ton
FFB/Hour
19 POPI
990 ton
FFB/Hour
10 POPI
375 ton
FFB/Hour
1 POPI
30 ton
FFB/Hour
1 POPI
60 ton
FFB/Hour
65 POPI
5475 ton
FFB/Hour
43 POPI
3100 ton
FFB/Hou
r
15 POPI
770 ton
FFB/Hour
29 POPI
1545 ton
FFB/Hour
6 POPI
260 ton
FFB/Hou
r
7 POPI
590 ton
FFB/Hour
3 POPI
260 ton
FFB/Hour
2 POPI
150 ton
FFB/Hour
3 POMs
140 TPH
4 POPI
360 ton
FFB/Hour
16 POPI
1235 ton
FFB/Ho
ur 58 POPI
3555 ton
FFB/Ho
ur
Source : BPS (Badan Pusat Statistik) Indonesia dan Kementerian Pertanian Tahun 2009
Potential of Bioenergy/Palm Oil Waste Based Power Plant … (1)
10

Ministry of Energy and Mineral Resources oh the Republic of Indonesia
Directorate General of New, Renewable Energy, and Mineral Resources
© DGNREEC MEMR - 2012
Potential of Bioenergy/Municipal Solid Waste Based Power Plant … (2)
No. City Final Waste Disposal Site
Location
Potential of City
Waste (ton/day) Potensi (MW)
1 DKI Jakarta Bandar Gebang, Sumur Batu 8.733 361,77
2 Batam Telaga Punggur 450 18,64
3 Kota Semarang Jatibarang 1.345 55,72
4 Kota Palembang Sukawinata, Karya Jaya 1.171 48,51
5 Kota Surabaya Benowo 2.562 106,13
6 Kota Padang Air Dingin 682 28,25
7 Kota Pontianak Batu Layang 340 14,09
8 Kota Medan Namo Bintang, Terjun 1.812 75,06
9 Kota Bogor Galuga 3.24 0,13
10 Kota Malang Supit Urang 761 31,53
11 Kota Depok Cipayung 1.217 50,42
12 Kota Jogya,Sleman,Bantul Ngablak-Piyung 2 0,08
13 Bali 445 18,43
14 Kota Madiun 612 25,35
15 Kota Jember 2112 87,49
11

Ministry of Energy and Mineral Resources oh the Republic of Indonesia
Directorate General of New, Renewable Energy, and Mineral Resources
© DGNREEC MEMR - 2012
Potential of Bioenergy/Municipal Solid Waste Based Power Plant … (3)
No. City
Final Waste
Disposal Site
Location
Potential of City Waste
(ton/day) Potensi (MW)
16 Kota Cianjur 1762 72,99
17 Kab. Sidoarjo 1568 64,96
18 Kota Balikpapan 400 16,57
19 Kab. Banyuwangi 1503 62,26
20 Kota Bandung 2114 87,57
21 Kota & Kab. Tegal Sarimukti 3.519 145,78
22 Kota & Kab. Cirebon 2.012 83,35
23 Kota Tangerang Rawakucing 1.352 56,01
24 Surakarta, Klaten & Boyolali 2.447 101,37
25 Kota & Kab. Tegal 1.485 61,52
26 Kota & Kab. Pasuruan 1.215 50,33
27 Kota & Kab. Probolinggo 1,3 0,05
28 Kota & Kab. Kediri 1.224 50,71
29 Kota Pakanbaru 603 24,98
30 Kota Bandar Lampung 703 29,12
31 Kota Makasar 1029 42,63 12

Ministry of Energy and Mineral Resources oh the Republic of Indonesia
Directorate General of New, Renewable Energy, and Mineral Resources
© DGNREEC MEMR - 2012
POTENTIAL PROJECT DEVELOPMENT OF BIOENERGY
BASED POWER PLANT UNTIL 2014 ......(1)
No Province City Developer Status Development Plan
Type of Biomass 2011 2012 2013 2014
1 DI Aceh, Panangkalan, Aceh PTPN I Excess power 2 5 Palm waste
Langsa, Aceh Private IPP 2 Biogass POME
2 Sumatera Utara Medan PT Growth Asia Excess power 10 10 Palm waste
PTPN II 4 Palm waste / Biogass
POME
Sei Mangkei, Perdagangan PT PN III Excess power 1.8 4.6 Palm waste
Medan PT PN IV Excess power 1.6 18 Palm waste
PT Victorindo Excess power 5 Palm waste
PT Nubika Jaya Excess power 6 Palm waste
PT PN III Excess power 2 Palm waste
Medan Private IPP/Ecess
Power 25 25 MSW (sampah)
3 Riau Pekan Baru PT PN V Internal Use dan
Excess power 10 10 Palm waste
Kampar, Riau PT PN V Internal Use 1 5 5 Biogas POME
Kampar, Rokan Hilir dan
Rokan Hulu, Indragiri Hilir
dan Indragiri Hulu, Kuantan
Senggigi, Bengkalis, Siak,
dan Pelalawan
Private Palm Oil
Mill
Internal Use dan
Excess Power
80 170 Palm waste
4 Riau Kepulauan Batam Private IPP / Excess
Power 5 6 MSW (sampah)
5 Sumatera Barat Padang Private IPP / Excess
Power 5 8 MSW (sampah)
6 Jambi Jambi PT PN VII IPP / Excess
Power 5 8 Palm waste
7 Sumatera Selatan Palembang Private IPP / Excess
Power 15 15 MSW (sampah)
PT Gikoko IPP 3 MSW (sampah)
8 Bengkulu Bengkulu Private IPP Palm waste
9 Lampung PTPN VII 5 Palm waste 13
Ministry of Energy and Mineral Resources oh the Republic of Indonesia
Directorate General of New, Renewable Energy, and Mineral Resources
© DGNREEC MEMR - 2012
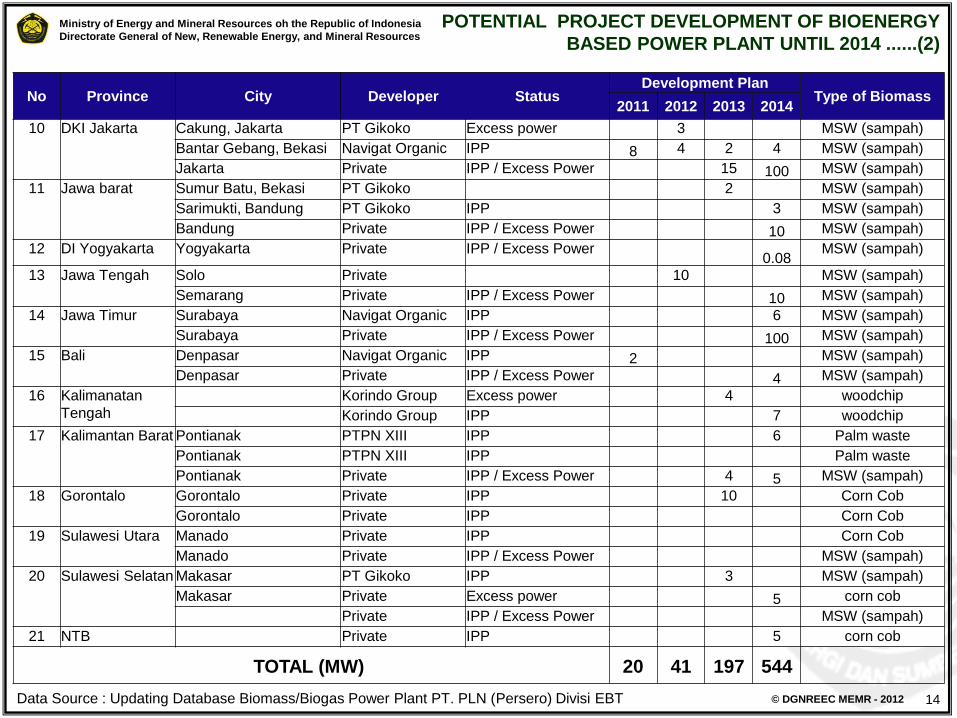
No Province City Developer Status Development Plan
Type of Biomass 2011 2012 2013 2014
10 DKI Jakarta Cakung, Jakarta PT Gikoko Excess power 3 MSW (sampah)
Bantar Gebang, Bekasi Navigat Organic IPP 8 4 2 4 MSW (sampah)
Jakarta Private IPP / Excess Power 15 100 MSW (sampah)
11 Jawa barat Sumur Batu, Bekasi PT Gikoko 2 MSW (sampah)
Sarimukti, Bandung PT Gikoko IPP 3 MSW (sampah)
Bandung Private IPP / Excess Power 10 MSW (sampah)
12 DI Yogyakarta Yogyakarta Private IPP / Excess Power
0.08
MSW (sampah)
13 Jawa Tengah Solo Private 10 MSW (sampah)
Semarang Private IPP / Excess Power 10 MSW (sampah)
14 Jawa Timur Surabaya Navigat Organic IPP 6 MSW (sampah)
Surabaya Private IPP / Excess Power 100 MSW (sampah)
15 Bali Denpasar Navigat Organic IPP 2 MSW (sampah)
Denpasar Private IPP / Excess Power 4 MSW (sampah)
16 Kalimanatan
Tengah
Korindo Group Excess power 4 woodchip
Korindo Group IPP 7 woodchip
17 Kalimantan Barat Pontianak PTPN XIII IPP 6 Palm waste
Pontianak PTPN XIII IPP Palm waste
Pontianak Private IPP / Excess Power 4 5 MSW (sampah)
18 Gorontalo Gorontalo Private IPP 10 Corn Cob
Gorontalo Private IPP Corn Cob
19 Sulawesi Utara Manado Private IPP Corn Cob
Manado Private IPP / Excess Power MSW (sampah)
20 Sulawesi Selatan Makasar PT Gikoko IPP 3 MSW (sampah)
Makasar Private Excess power 5 corn cob
Private IPP / Excess Power MSW (sampah)
21 NTB Private IPP 5 corn cob
TOTAL (MW) 20 41 197 544
14
POTENTIAL PROJECT DEVELOPMENT OF BIOENERGY
BASED POWER PLANT UNTIL 2014 ......(2)
Data Source : Updating Database Biomass/Biogas Power Plant PT. PLN (Persero) Divisi EBT

Ministry of Energy and Mineral Resources oh the Republic of Indonesia
Directorate General of New, Renewable Energy, and Mineral Resources
© DGNREEC MEMR - 2012
No Company Name COD Type of
Contract Location
Buyer (Regional
PLN Area) Type of
Biomass
Capacity
Contract
(MW)
1 PT Riau Prima Energy 2001 Excess power Riau PLN Riau Region Palm waste 5
2 PT Listrindo Kencana 2006 IPP Bangka PLN Bangka Region Palm waste 5
3 PT Growth Sumatra 2006 Excess power Sumatera Utara PLN Sumut Region Palm waste 6
4 PT Indah Kiat Pulp & Paper 2006 Excess power Riau PLN Riau Region palm waste 2
7 PT Belitung Energy 2010 IPP Belitung PLN Babel Region Palm waste 7
8 PT Growth Sumatra 2010 Excess power Sumatera Utara PLN Sumut Region Palm waste 9
9 PT Pelita Agung 2010 Excess power Riau PLN Riau Region Palm waste 5
10 Permata Hijau Sawit 2010 Excess power Riau PLN Riau Region Palm waste 2
11 PT Navigat Organic 2011 IPP Bali PLN Dist Bali MSW 2
12 PT Navigat Organic 2011 IPP Bekasi PLN Dist Jabar MSW 8
13 PT Growth Asia 2011 Excess power Sumatera Utara PLN Sumut Region Palm waste 10
Total Capacity - On Grid (MW) 61
14 PTPN V 2011 Riau Own Use POME 1
The Existing Capacity Of Biomass, Biogas And Municipal Solid
Waste Power Plant – On Grid Connected (until February 2012)
Data Source : Updating Database Biomass/Biogas Power Plant PT. PLN (Persero) Divisi EBT 15

Ministry of Energy and Mineral Resources oh the Republic of Indonesia
Directorate General of New, Renewable Energy, and Mineral Resources
© DGNREEC MEMR - 2012
IV. Policy and Regulation Related To
Bioenergy Based Power Plant

Ministry of Energy and Mineral Resources oh the Republic of Indonesia
Directorate General of New, Renewable Energy, and Mineral Resources
© DGNREEC MEMR - 2012
Policy And Regulation Related To
Bioenergy Based Power Plant
1. LAW NO. 30 YEAR 2007 concerning on Energy.
2. LAW NO. 30 YEAR 2009 concerning on Electricity
3. PRESIDENTIAL REGULATION NO. 5 YEAR 2006 concerning on National Energy Policy.
4. MINISTRY OF FINANCE REGULATION NO. 21/PMK.011/2010 concerning on Tax and Custom
Facilities for Renewable Energy Utilization.
5. MINISTRY OF FINANCE REGULATION NO. 130/PMK.011/2011 concerning on Provision of Exemption
Facilities or Reduction of Income Tax.
6. MINISTRY OF ENERGY AND MINERAL RESOURCES REGULATION NO. 4 YEAR 2012 concerning
on Electricity Price Purchased by PT. PLN from Small Scale and Medium Scale Renewable Energy
Electricity Generation or Excess Power.
17

Ministry of Energy and Mineral Resources oh the Republic of Indonesia
Directorate General of New, Renewable Energy, and Mineral Resources
© DGNREEC MEMR - 2012
LAW NO. 30 YEAR 2007 Concerning On Energy
• Regulates among others :
Prioritizes the provision and utilization of new and renewable
energy;
All people have right to acces to energy;
Central and Regional Government prioritize the utilization of new
renewable energy;
Central and Regional Government provide incentives for new
and renewable energy.
18

Ministry of Energy and Mineral Resources oh the Republic of Indonesia
Directorate General of New, Renewable Energy, and Mineral Resources
© DGNREEC MEMR - 2012
LAW NO. 30 YEAR 2009
Concerning on Electricity
• Regulated among others :
The state controls provision of electricity , to be
implemented by the Central and Local Government
based on decentralization principle.
Sustainable supply of electricity shall prioritize the use of
renewable energy sources.
19

Ministry of Energy and Mineral Resources oh the Republic of Indonesia
Directorate General of New, Renewable Energy, and Mineral Resources
© DGNREEC MEMR - 2012
PRESIDENTIAL REGULATION NO. 5 YEAR 2006 concerning on National Energy Policy
Energy Mix (2025)
Energy Elasticity < 1
The Main Target :
Energy Elasticity less than 1 at 2025
Optimizing Primary Energy Sources :
Non Fossil Energy/NRE: 17 %
Coal 33%
Oil
20%
NRE,17%
Biofuel 5%
Geothermal 5%
Biomass, Nuclear, Hydro
Power, Solar, Wind Power 5%
Liquefaction Coal 2%
Gas 30%
20

Ministry of Energy and Mineral Resources oh the Republic of Indonesia
Directorate General of New, Renewable Energy, and Mineral Resources
© DGNREEC MEMR - 2012
MINISTRY OF FINANCE REGULATION NUMBER 21/PMK.011/2010 Regulation of tax and customs facility for renewable energy resources utilization activities
Income Tax
FINANCIAL INSTRUMENTS
SUPPORT
Value Added
Tax
• Reduced net income for
30% of total investment
• accelerated depreciation
• Imposition
of Income Tax on dividend p
aid
to Foreign Taxable at 10%
• compensation for losses in
certain circumstances
Exemptions of VAT for
Taxable Goods,
machinery and
equipment for RE
utilization (not
included spare parts)
Regulated in State
Annual Budget
Law and its
implementing
regulations
Import Duty Tax Borne by
Government
Exemptions for Import Duty
of
Goods and Machinery
for development and
capital investment
Capital Goods Imports
for construction and
development of electricity
industry
21

Ministry of Energy and Mineral Resources oh the Republic of Indonesia
Directorate General of New, Renewable Energy, and Mineral Resources
© DGNREEC MEMR - 2012
*) The facility can be utilized if:
1. Had executed the entire capital investment
2. Has been produced commercially
MINISTRY OF FINANCE REGULATION NUMBER 130/PMK.011/2011 CONCERNING ON PROVISION OF EXEMPTION FACILITIES OR REDUCTION OF INCOME TAX
can get facilities:
EXEMPTION OR REDUCTION OF
CORPORATE INCOME TAX
Minister of Finance may provide facilities Corporate Income Tax exemption or reduction for a period EXCEED
predetermined period of time
REDUCTION OF CORPORATE INCOME TAX
50% of Income Tax Payable for 2 tax yearh
After the end of Corporate Income Tax exemption facility
EXEMPTION OF CORPORATE INCOME TAX
5 - 10 tax year
CORPORATE
TAXPAYERS
• PIONEER INDUSTRIES
• Having a new investment plan min. IDR 1 trillion
• Placing funds in the Indonesian banking min 10% from the total capital investment plan
• Existed as ENTITY INDONESIA
• Industry of Basic Metals Manufacutre
• Industry of Oil Refining and / or Basic Organic Chemicals
sourced from Oil and Natural Gas
• Industry of Machinery
• INDUSTRY OF RENEWABLE
RESOURCES FIELD • Industry of Communications Equipment
PIONEER INDUSTRIES
22

Ministry of Energy and Mineral Resources oh the Republic of Indonesia
Directorate General of New, Renewable Energy, and Mineral Resources
© DGNREEC MEMR - 2012
MINISTRY OF ENERGY AND MINERAL RESOURCES NUMBER 4 YEAR 2012 Concerning On Electricity Price Purchased by PT. PLN from Small Scale and Medium Scale Renewable Energy Electricity
Generation or Excess Power
Note : *) Based on Act No. 18 Year 2008 concerning to Waste Management.
F as an incentive factor based on the region where the power plant installed, as follows:
Jawa, Bali, and Sumatera region : F = 1
Kalimantan, Sulawesi , NTB and NTT region : F = 1,2
Maluku and Papua region : F = 1,3
23
No. Energy Capacity Electricity Tariff Note
Medium Voltage
1. Biomassa until 10 MW Rp. 975,- / kWh X F
2. Biogas until 10 MW Rp. 975,- / kWh X F Non Municipal Solid
Waste
3. Municipal Solid Waste (MSW) until 10 MW Rp. 1050,- / kWh Zero waste *)
4. Municipal Solid Waste (MSW) until 10 MW Rp. 850,- / kWh Landfill *)
Low Voltage
1 Biomassa until 10 MW Rp. 1.325,- / kWh X F
2 Biogas until 10 MW Rp. 1.325,- / kWh X F Non Municipal Solid
Waste
3 Municipal Solid Waste (MSW) until 10 MW Rp. 1.398,- / kWh Zero waste *)
4 Municipal Solid Waste (MSW) until 10 MW Rp. 1.198,- / kWh Landfill *)

Ministry of Energy and Mineral Resources oh the Republic of Indonesia
Directorate General of New, Renewable Energy, and Mineral Resources
© DGNREEC MEMR - 2012
IV. CONCLUSIONS
• Indonesia is the right place to develop business of
bioenergy based power plant due to the availability of huge
of bioenergy potential and high growth demand of
electricity.
• Bioenergy is a clean energy
• Government has issued some regulations to make the
bioenergy business more conducive.
• Government will continue to up date the regulations to
attract the investors to come.
• It’s time to move from fossil energy to renewable energy
particularly Bioenergy. Welcome to the investor.
24

Kementerian Energi dan Sumber Daya Mineral
E n e r g i d a n S u m b e r D a y a M i n e r a l u n t u k K e s e j a h t e r a a n R a k y a t
© DJEBTKE KESDM - 2012
Go Green Indonesia ! green energy, future energy
- www.esdm.go.id - www.ebtke.esdm.go.id -
Jalan Jenderal Gatot Subroto, Kav. 49 Jakarta 12950; Telp: 021-52904235; 5250575; Faks: 021-25529106; 25529212
Email: [email protected] ; [email protected]
MINISTRY OF ENERGY AND MINERAL RESOURCES OF THE REPUBLIC OF INDONESIA
DIRECTORATE GENERAL OF NEW, RENEWABLE ENERGY, AND ENERGY CONSERVATION
Thank You
25 E n e r g y a n d M i n e r a l R e s o u r c e s f o r t h e P e o p l e ’ s W e l f a r e

Ministry of Energy and Mineral Resources oh the Republic of Indonesia
Directorate General of New, Renewable Energy, and Mineral Resources
© DGNREEC MEMR - 2012
ELECTRIFICATION RATIO 2011
Year
1980 1985 1990 1995 2000 2005 2006 2007 2008 2009 2010 2011
Electrification
Ratio8% 16% 28% 43% 53% 62% 63% 64.34% 65.10% 65.79% 67.15% 72.95%
NAD 87,72%
Sumut 83,98%
Sumbar 77,72%
Riau 78.17%
Sumsel 72,71%
Bengkulu 71,15%
Babel 82,26%
Lampung 70,40%
Jakarta
99,99%
Banten 68,18%
Jabar 70,72%
Jateng 77,31%
Jambi 76,54%
DIY 75,19% Jatim
72,05%
Bali 69,77%
NTB 52,88%
NTT 39,92%
Kalbar 65,37%
Kalteng 67,28%
Kalsel 75,65%
Kaltim 63,44%
Sulut 73,21% Gorontalo
54,69%
Sulteng 64,84%
Sultra 54,46%
Sulsel
74,18%
Malut 70,34%
Maluku 70,80%
Papua 29,25%
Category :
> 60 %
41 - 60 %
20 - 40 %
Sulbar 64,12%
Kepri 91,52%
Papua Barat 58,24%
26

Ministry of Energy and Mineral Resources oh the Republic of Indonesia
Directorate General of New, Renewable Energy, and Mineral Resources
© DGNREEC MEMR - 2012 27
Through new renewable
energy development and
energy conservation
implementation in all sector
President Commitment in G-20 Pittsburgh and COP15 to reduce greenhouse
gasses emission by 2020
and
Presidential Regulation Number 61 Year 2011 concerning on National Action
Plan for Reducing Greenhouse Gas Emissions
26% (767 million Ton)
41% Domestic
efforts
Domestic efforts and international
support
Forestry and Peat 672 million Ton
Agriculture 8 million Ton
Industry 1 million Ton
Energy 30 million Ton
Transportation 8 million Ton
Wastes 48 million Ton
NATIONAL COMMITMENT TO REDUCE GREENHOUSE GASSES