bv wecc transcostreport final
DESCRIPTION
hhTRANSCRIPT
CAPITAL COSTS FOR TRANSMISSION AND SUBSTATIONS Recommendations for WECC Transmission Expansion Planning
B&V PROJECT NO. 176322
PREPARED FOR
Western Electricity Coordinating Council
OCTOBER 2012
®
®
©Bl
ack
& V
eatc
h H
oldi
ng C
ompa
ny 2
012.
All
righ
ts re
serv
ed.
Principal Investigators:
Tim Mason, Project Manager
Trevor Curry
Dan Wilson
Western Electricity Coordinating Council | CAPITAL COSTS FOR TRANSMISSION AND SUBSTATIONS
BLACK & VEATCH | Assumptions and Limitations Disclaimer i
Assumptions and Limitations Disclaimer This report was prepared for the Western Electric Coordinating Council (WECC) by Black & Veatch Corporation (Black & Veatch) and is based on information not within the control of Black & Veatch. Black & Veatch has assumed that the information both verbal and written, provided by others is complete and correct; however, Black & Veatch does not guarantee the accuracy of the information, data, or opinions contained herein. Any information shared with the Company prior to the release of the report is superseded by the Report. Black & Veatch owes no duty of care to any third party and none is created by this report. Use of this report, or any information contained therein, by a third party shall be at the risk of such party and constitutes a waiver and release of Black & Veatch its directors, officers, partners, employees and agents by such third party from and against all claims and liability, including, but not limited to, claims for breach of contract, breach of warranty, strict liability, negligence, negligent misrepresentation, and/or otherwise, and liability for special, incidental, indirect, or consequential damages, in connection with such use.
Western Electricity Coordinating Council | CAPITAL COSTS FOR TRANSMISSION AND SUBSTATIONS
BLACK & VEATCH | Assumptions and Limitations Disclaimer TOC-1
Table of Contents Assumptions and Limitations Disclaimer ...................................................................................................... i 1.0 Introduction .......................................................................................................................................... 1-1
1.1 Approach ................................................................................................................................................. 1-1 1.2 Peer Review Process ........................................................................................................................... 1-2 1.3 Variability of Costs............................................................................................................................... 1-2
2.0 Transmission Capital Costs.............................................................................................................. 2-1 2.1 New Transmission ............................................................................................................................... 2-1 2.2 Re-conductoring ................................................................................................................................... 2-4 2.3 Terrain Multiplier ................................................................................................................................ 2-5 2.4 Right of Way Costs ............................................................................................................................... 2-6
2.4.1 Right of Way Widths ........................................................................................................ 2-6 2.4.2 Right of Way Costs Per Acre ......................................................................................... 2-7
2.5 Transmission Calculation Methodology ..................................................................................... 2-9 3.0 Substation Capital Costs .................................................................................................................... 3-1
3.1 New Substation Base Cost ................................................................................................................ 3-1 3.2 Line and Transformer Positions .................................................................................................... 3-1 3.3 Transformers ......................................................................................................................................... 3-2 3.4 Reactive Components ......................................................................................................................... 3-3 3.5 High Voltage Direct Current Converter Station ....................................................................... 3-5 3.6 Substation Calculation Methodology ........................................................................................... 3-5
4.0 Summary of Capital Costs ................................................................................................................. 4-1 4.1 Transmission Capital Costs .............................................................................................................. 4-1 4.2 Substation Capital Costs .................................................................................................................... 4-3 4.3 Allowance for Funds Used During Construction and Overhead Costs ........................... 4-4
5.0 Cost Calculator...................................................................................................................................... 5-1 5.1 Transmission Cost Calculator ......................................................................................................... 5-1 5.2 Substation Cost Calculator ............................................................................................................... 5-2 5.3 Cost Totals............................................................................................................................................... 5-3
6.0 Scenario Analysis ................................................................................................................................ 6-1 6.1 PacifiCorp: Gateway Central Line (Populus – Terminal Segment) .................................. 6-3 6.2 NV Energy: One Nevada Line .......................................................................................................... 6-3 6.3 Bonneville Power Administration (BPA): McNary – John Day Line ................................ 6-4 6.4 Xcel Energy: Comanche – Daniels Park Line ............................................................................. 6-5 6.5 Summary ................................................................................................................................................. 6-6
7.0 Discussion of Stakeholder Comments ......................................................................................... 7-1
Western Electricity Coordinating Council | CAPITAL COSTS FOR TRANSMISSION AND SUBSTATIONS
BLACK & VEATCH | Assumptions and Limitations Disclaimer TOC-2
LIST OF TABLES Table 1-1 Transmission and Substation Facilities Included in This Study ....................................... 1-1Table 1-2 Transmission Cost Peer Review Group Participants ............................................................. 1-2Table 2-1 Baseline Transmission Costs ........................................................................................................... 2-2Table 2-2 Conductor Cost Multipliers .............................................................................................................. 2-3Table 2-3 Transmission Structure Type Cost Multipliers ........................................................................ 2-4Table 2-4 Transmission Length Cost Multipliers ........................................................................................ 2-4Table 2-5 Terrain Cost Multipliers .................................................................................................................... 2-5Table 2-6 FERC Nationwide Survey of Right of Way Widths (2004) .................................................. 2-6Table 2-7 Right of Way Widths by Voltage Class and Data Source ...................................................... 2-7Table 2-8 BLM Land Rental and Land Capital Costs by Zone ................................................................. 2-8Table 3-1 New Base Substation Capital Costs ............................................................................................... 3-1Table 3-2 Line/Transformer Position Cost and Multipliers ................................................................... 3-2Table 3-3 Transformer Capital Costs ............................................................................................................... 3-3Table 3-4 Shunt Reactor and Series Capacitor Capital Costs ................................................................. 3-4Table 3-5 SVC Capital Costs .................................................................................................................................. 3-4Table 3-6 HVDC Converter Station Costs ........................................................................................................ 3-5Table 4-1 Transmission Capital Cost Summary ........................................................................................... 4-2Table 4-2 Substation Capital Cost Summary ................................................................................................. 4-3Table 4-3 Survey of AFUDC and Overhead Costs and Recommended Values ................................. 4-4Table 6-1 Transmission Project Characteristics Used in Scenario Analysis .................................... 6-2Table 6-2 Miles in Each Terrain Type for Transmission Projects in Scenario Analysis .............. 6-2Table 6-3 Scenario Analysis Results for PacifiCorp: Gateway Central Line ..................................... 6-3Table 6-4 Scenario Analysis Results for NV Energy: One Nevada Line .............................................. 6-4Table 6-5 Scenario Analysis Results for BPA: McNary – John Day Line ............................................. 6-5Table 6-6 Scenario Analysis Results for Xcel Energy: Comanche – Daniels Park Line ................ 6-5Table 6-7 Summary of Scenario Analysis Results for All Four Projects ............................................. 6-6Table 7-1 Summary of Stakeholder Comments and Responses ............................................................ 7-1
LIST OF FIGURES Figure 2-1 Pole Structures: Steel Pole (Populus-Terminal 345 kV) vs. Lattice (Path 26) ............ 2-3Figure 3-1 Substation Configurations ................................................................................................................ 3-2Figure 5-1 Transmission Cost Calculator Sheet of Cost Calculator Workbook ................................. 5-1Figure 5-2 Substation Cost Calculator Sheet of Cost Calculator Workbook ....................................... 5-3Figure 5-3 Cost Totals Sheet of Cost Calculator Workbook ...................................................................... 5-4Figure 6-1 Map of the Four Transmission Projects Selected for Scenario Analysis ....................... 6-1
Western Electricity Coordinating Council | CAPITAL COSTS FOR TRANSMISSION AND SUBSTATIONS
BLACK & VEATCH | Introduction 1-1
1.0 Introduction As part of the Western Electricity Coordinating Council (WECC) transmission planning process, Black & Veatch assisted WECC to develop updated assumptions on transmission line and substation costs, as well as to develop a process to ensure that these costs can be readily updated in the future. The effort was completed under the auspices of a peer review workgroup composed of regional transmission experts to ensure that the resulting costs and cost development methodology is robust and appropriate for WECC’s current and future requirements.
This report details the transmission and substation costs and development efforts, including the assumptions, methodology, and results. Additionally, it describes the tool developed by Black & Veatch for WECC to be used to estimate transmission and substation costs that will be integrated into WECC’s planning process. Finally, the report discusses the benchmarking of this methodology to several recent transmission project examples. This was completed to ensure that the theoretical costs reasonably reflect actual transmission development costs in the WECC region.
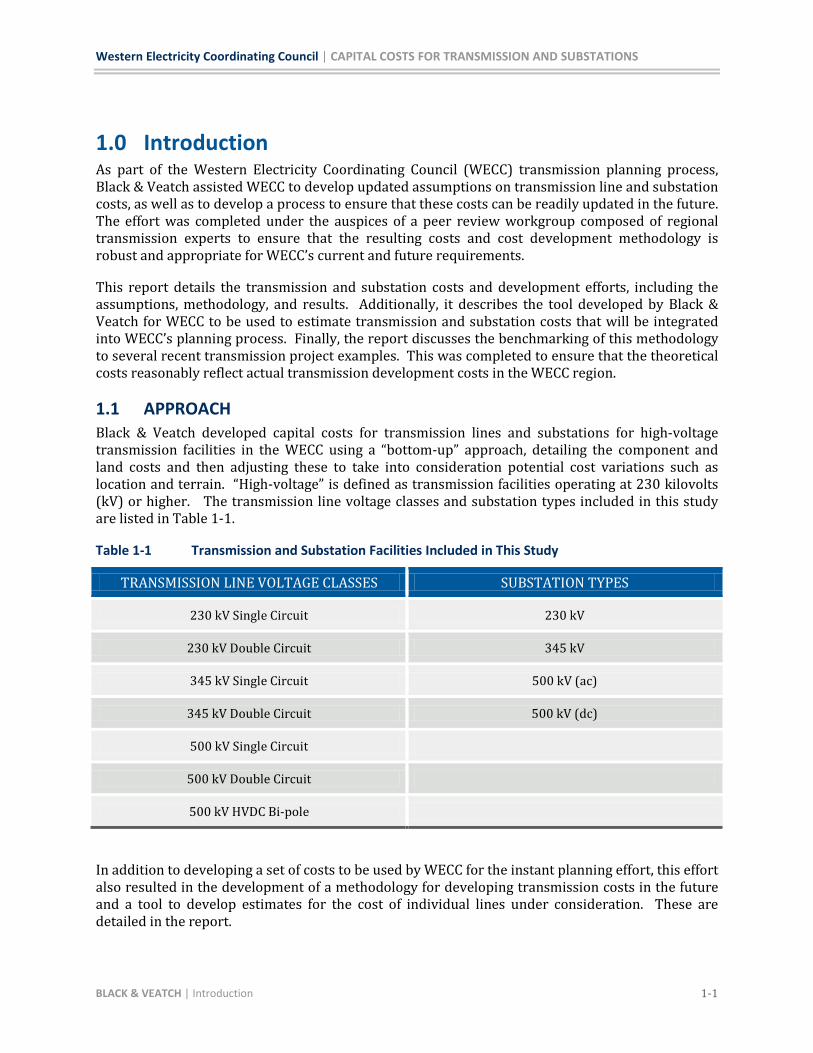
1.1 APPROACH Black & Veatch developed capital costs for transmission lines and substations for high-voltage transmission facilities in the WECC using a “bottom-up” approach, detailing the component and land costs and then adjusting these to take into consideration potential cost variations such as location and terrain. “High-voltage” is defined as transmission facilities operating at 230 kilovolts (kV) or higher. The transmission line voltage classes and substation types included in this study are listed in Table 1-1.
Table 1-1 Transmission and Substation Facilities Included in This Study
TRANSMISSION LINE VOLTAGE CLASSES SUBSTATION TYPES
230 kV Single Circuit 230 kV
230 kV Double Circuit 345 kV
345 kV Single Circuit 500 kV (ac)
345 kV Double Circuit 500 kV (dc)
500 kV Single Circuit
500 kV Double Circuit
500 kV HVDC Bi-pole
In addition to developing a set of costs to be used by WECC for the instant planning effort, this effort also resulted in the development of a methodology for developing transmission costs in the future and a tool to develop estimates for the cost of individual lines under consideration. These are detailed in the report.
Western Electricity Coordinating Council | CAPITAL COSTS FOR TRANSMISSION AND SUBSTATIONS
BLACK & VEATCH | Introduction 1-2
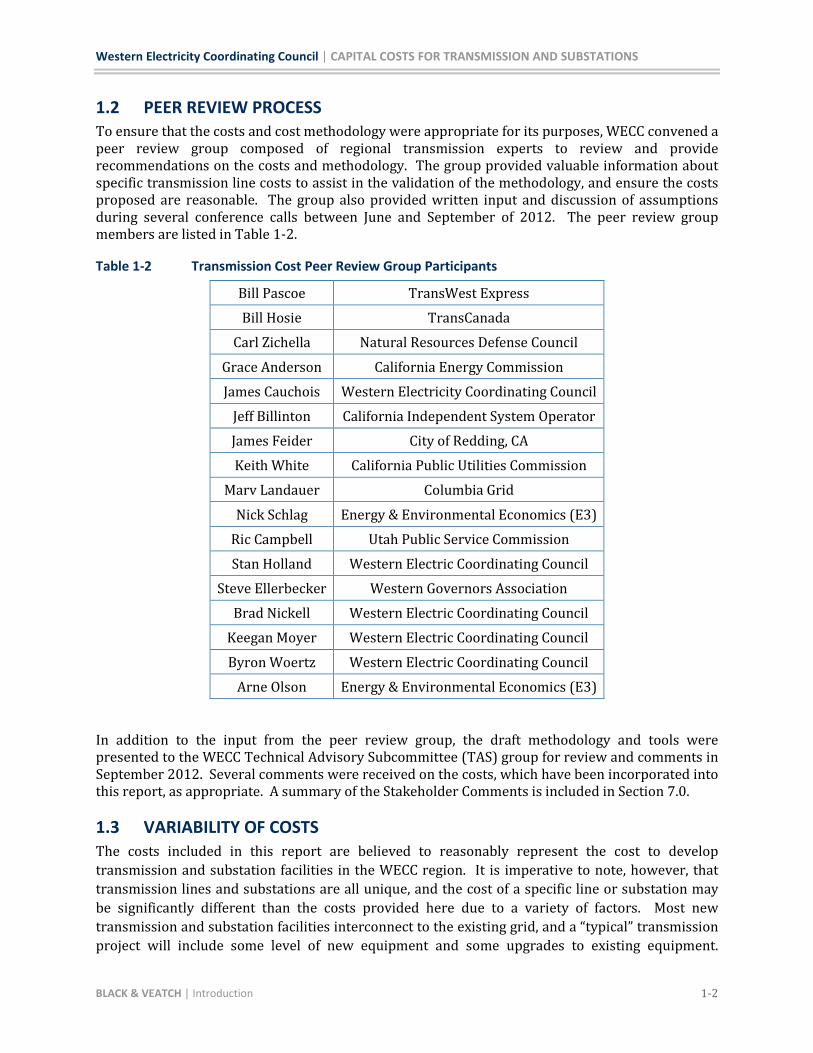
1.2 PEER REVIEW PROCESS To ensure that the costs and cost methodology were appropriate for its purposes, WECC convened a peer review group composed of regional transmission experts to review and provide recommendations on the costs and methodology. The group provided valuable information about specific transmission line costs to assist in the validation of the methodology, and ensure the costs proposed are reasonable. The group also provided written input and discussion of assumptions during several conference calls between June and September of 2012. The peer review group members are listed in Table 1-2.
Table 1-2 Transmission Cost Peer Review Group Participants
Bill Pascoe TransWest Express
Bill Hosie TransCanada
Carl Zichella Natural Resources Defense Council
Grace Anderson California Energy Commission
James Cauchois Western Electricity Coordinating Council
Jeff Billinton California Independent System Operator
James Feider City of Redding, CA
Keith White California Public Utilities Commission
Marv Landauer Columbia Grid
Nick Schlag Energy & Environmental Economics (E3)
Ric Campbell Utah Public Service Commission
Stan Holland Western Electric Coordinating Council
Steve Ellerbecker Western Governors Association
Brad Nickell Western Electric Coordinating Council
Keegan Moyer Western Electric Coordinating Council
Byron Woertz Western Electric Coordinating Council
Arne Olson Energy & Environmental Economics (E3)
In addition to the input from the peer review group, the draft methodology and tools were presented to the WECC Technical Advisory Subcommittee (TAS) group for review and comments in September 2012. Several comments were received on the costs, which have been incorporated into this report, as appropriate. A summary of the Stakeholder Comments is included in Section 7.0.
1.3 VARIABILITY OF COSTS The costs included in this report are believed to reasonably represent the cost to develop transmission and substation facilities in the WECC region. It is imperative to note, however, that transmission lines and substations are all unique, and the cost of a specific line or substation may be significantly different than the costs provided here due to a variety of factors. Most new transmission and substation facilities interconnect to the existing grid, and a “typical” transmission project will include some level of new equipment and some upgrades to existing equipment.
Western Electricity Coordinating Council | CAPITAL COSTS FOR TRANSMISSION AND SUBSTATIONS
BLACK & VEATCH | Introduction 1-3
Furthermore, transmission facilities are developed not only to transmit incremental power generation, but also to provide additional system reliability and serve load. It is often impossible to segregate “capacity costs” from the cost to provide reliability and serve load. The costs here should be used as a guide to develop approximate costs for new transmission, but should not be used to measure the cost or cost-effectiveness of any specific transmission facility.
Western Electricity Coordinating Council | CAPITAL COSTS FOR TRANSMISSION AND SUBSTATIONS
BLACK & VEATCH | Transmission Capital Costs 2-1
2.0 Transmission Capital Costs Black & Veatch developed a methodology and tool to calculate indicative capital costs for transmission infrastructure projects throughout the WECC region. This methodology begins with using the current cost of specified transmission equipment and the expected cost of land. The costs are then adjusted to identify the differential cost of developing on different land with different terrain factor adjustments. Black & Veatch identified the following categories and sub-categories to consider from a capital cost perspective:
Voltage Class
● Alternating Current (AC) - 230 kV, 345 kV, and 500 kV (single and double circuit)
● High Voltage Direct Current (HVDC) 500 kV Bi-Pole
Line Characteristics
● Conductor Type
● Pole Structure
● Length of line
New Construction or Re-conductor
Terrain Type
Location
Black & Veatch utilized its internal knowledge of transmission equipment component costs as a starting point for the cost assumptions. The sections below key in on each of the specific costs identified while gaining a more granular understanding of the capital costs for transmission.
2.1 NEW TRANSMISSION Black & Veatch only considered voltages 230 kV and above, as these were indicative of the majority of transmission infrastructure projects being proposed on the bulk electric transmission network in the WECC region. In addition to AC transmission, 500 kV Bi-Pole HVDC transmission was also considered, which would be more appropriate for long, high capacity transmission projects.
For AC transmission lines, there are many components that make up the entire line cost. First, Black & Veatch identified the initial physical considerations. Without engineering a detailed design, there were many components that could be broken apart into individual cost multipliers. Three key components were determined to be the most important cost considerations for transmission line designs:
Conductor type
Structure
Length of line
Starting from the transmission capital costs developed in the Western Renewable Energy Zones (WREZ) project for the Western Governors Association, Black & Veatch identified a baseline assumption for capital costs per mile based on these three key components. The initial costs per
Western Electricity Coordinating Council | CAPITAL COSTS FOR TRANSMISSION AND SUBSTATIONS
BLACK & VEATCH | Transmission Capital Costs 2-2
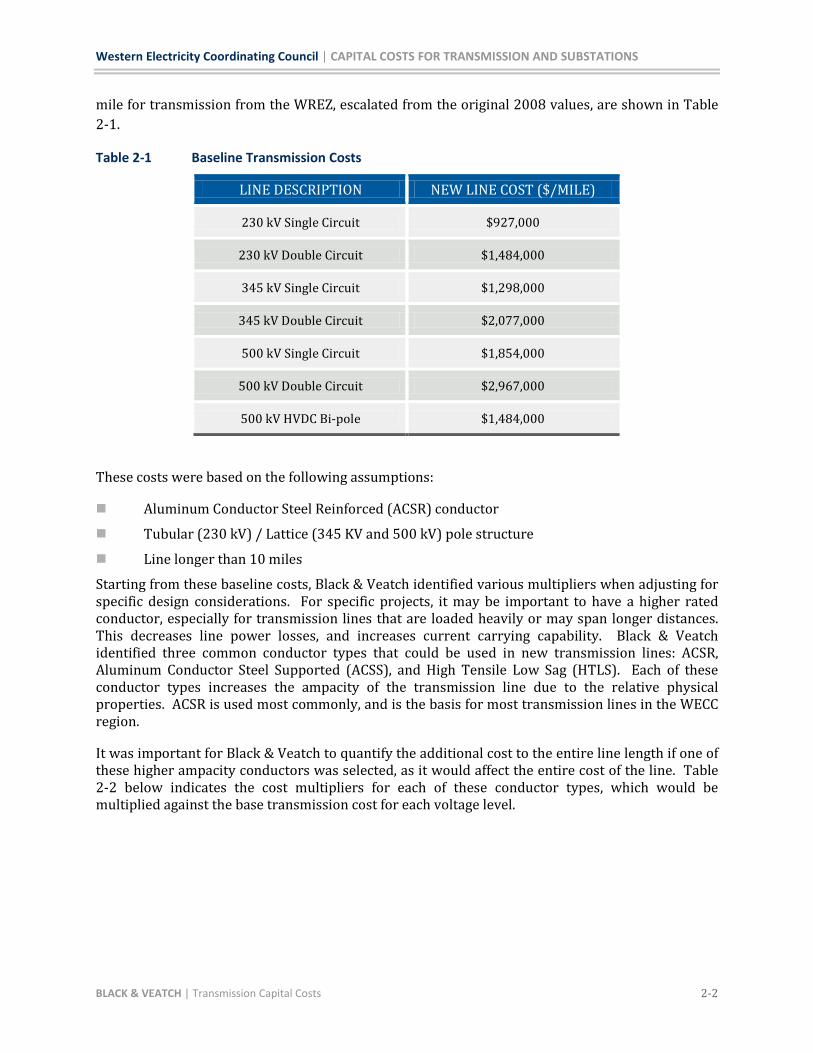
mile for transmission from the WREZ, escalated from the original 2008 values, are shown in Table 2-1.
Table 2-1 Baseline Transmission Costs
LINE DESCRIPTION NEW LINE COST ($/MILE)
230 kV Single Circuit $927,000
230 kV Double Circuit $1,484,000
345 kV Single Circuit $1,298,000
345 kV Double Circuit $2,077,000
500 kV Single Circuit $1,854,000
500 kV Double Circuit $2,967,000
500 kV HVDC Bi-pole $1,484,000
These costs were based on the following assumptions:
Aluminum Conductor Steel Reinforced (ACSR) conductor
Tubular (230 kV) / Lattice (345 KV and 500 kV) pole structure
Line longer than 10 miles
Starting from these baseline costs, Black & Veatch identified various multipliers when adjusting for specific design considerations. For specific projects, it may be important to have a higher rated conductor, especially for transmission lines that are loaded heavily or may span longer distances. This decreases line power losses, and increases current carrying capability. Black & Veatch identified three common conductor types that could be used in new transmission lines: ACSR, Aluminum Conductor Steel Supported (ACSS), and High Tensile Low Sag (HTLS). Each of these conductor types increases the ampacity of the transmission line due to the relative physical properties. ACSR is used most commonly, and is the basis for most transmission lines in the WECC region.
It was important for Black & Veatch to quantify the additional cost to the entire line length if one of these higher ampacity conductors was selected, as it would affect the entire cost of the line. Table 2-2 below indicates the cost multipliers for each of these conductor types, which would be multiplied against the base transmission cost for each voltage level.
Western Electricity Coordinating Council | CAPITAL COSTS FOR TRANSMISSION AND SUBSTATIONS
BLACK & VEATCH | Transmission Capital Costs 2-3
Table 2-2 Conductor Cost Multipliers
CONDUCTOR 230 KV SINGLE
230 KV DOUBLE
345 KV SINGLE
345 KV DOUBLE
500 KV SINGLE
500 KV DOUBLE
500 KV HVDC BI-
POLE
ACSR 1.00 1.00 1.00 1.00 1.00 1.00 1.00
ACSS 1.08 1.08 1.08 1.08 1.08 1.08 1.08
HTLS 3.60 3.60 3.60 3.60 3.60 3.60 3.60
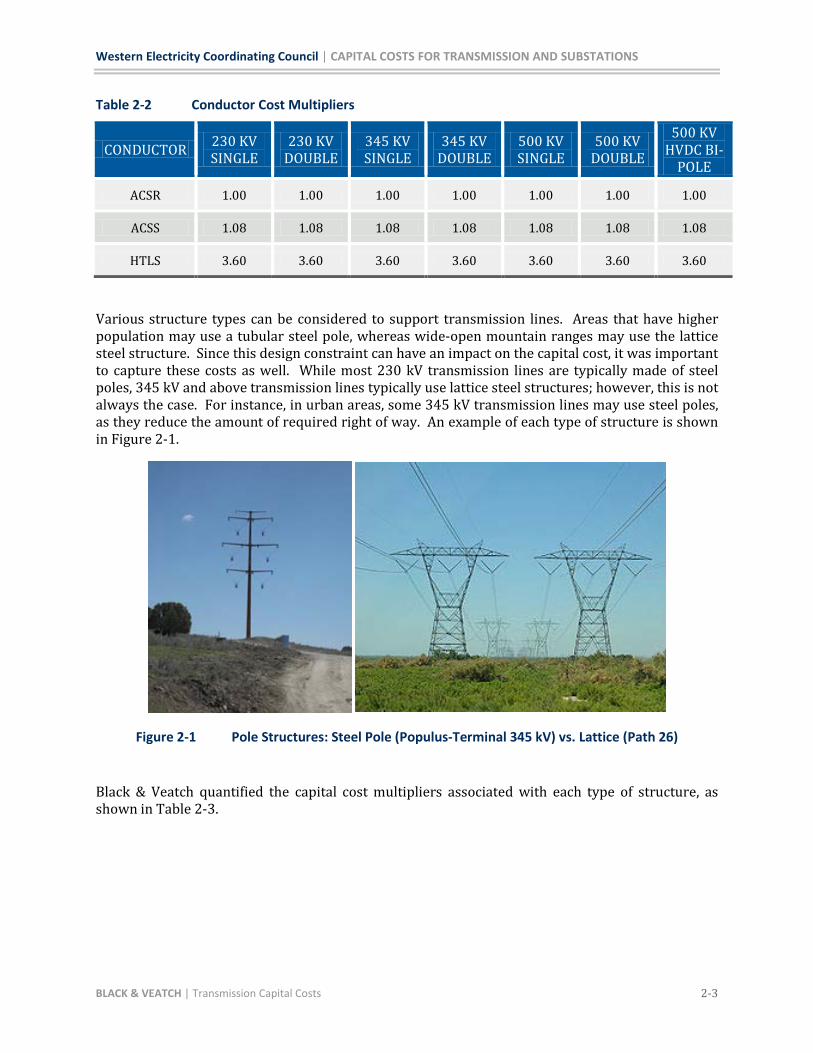
Various structure types can be considered to support transmission lines. Areas that have higher population may use a tubular steel pole, whereas wide-open mountain ranges may use the lattice steel structure. Since this design constraint can have an impact on the capital cost, it was important to capture these costs as well. While most 230 kV transmission lines are typically made of steel poles, 345 kV and above transmission lines typically use lattice steel structures; however, this is not always the case. For instance, in urban areas, some 345 kV transmission lines may use steel poles, as they reduce the amount of required right of way. An example of each type of structure is shown in Figure 2-1.
Figure 2-1 Pole Structures: Steel Pole (Populus-Terminal 345 kV) vs. Lattice (Path 26)
Black & Veatch quantified the capital cost multipliers associated with each type of structure, as shown in Table 2-3.
Western Electricity Coordinating Council | CAPITAL COSTS FOR TRANSMISSION AND SUBSTATIONS
BLACK & VEATCH | Transmission Capital Costs 2-4
Table 2-3 Transmission Structure Type Cost Multipliers
STRUCTURE 230 KV SINGLE
230 KV DOUBLE
345 KV SINGLE
345 KV DOUBLE
500 KV SINGLE
500 KV DOUBLE
500 KV HVDC BI-
POLE
Lattice 0.90 0.90 1.00 1.00 1.00 1.00 1.00
Tubular Steel 1.00 1.00 1.30 1.30 1.50 1.50 1.50
Finally, it is important to consider the length of the transmission line. In general, the longer the transmission line, the less it costs per mile. The primary reason for this is that design and engineering, costs are non-linear—it takes almost as much to design and approve a short line as it does a long line. The capital cost multipliers associated with various transmission line lengths are indicated in Table 2-4 below.
Table 2-4 Transmission Length Cost Multipliers
LENGTH 230 KV SINGLE
230 KV DOUBLE
345 KV SINGLE
345 KV DOUBLE
500 KV SINGLE
500 KV DOUBLE
500 KV HVDC BI-
POLE
> 10 miles 1.00 1.00 1.00 1.00 1.00 1.00 1.00
3-10 miles 1.20 1.20 1.20 1.20 1.20 1.20 1.20
< 3 miles 1.50 1.50 1.50 1.50 1.50 1.50 1.50
2.2 RE-CONDUCTORING In areas where there are existing transmission lines, it may be necessary or more cost-effective to re-conductor an existing transmission rather than to build a new line. Re-conductoring can be defined many different ways, but for simplicity re-conductoring in this effort is defined as replacing an existing conductor to increase ampacity. This assumes that the new conductor would be of similar size and weight, hence no upgrading of poles or insulators is required.
To quantify the capital costs associated with re-conductoring a transmission line, Black & Veatch assumed the following:
230 kV Transmission Conductors
● 2 conductors per phase
● Conductor assumed to be 35% of total capital cost
345 kV Transmission Conductors
● 3 conductors per phase
● Conductor assumed to be 45% of total capital cost
500 kV Transmission Conductors
Western Electricity Coordinating Council | CAPITAL COSTS FOR TRANSMISSION AND SUBSTATIONS
BLACK & VEATCH | Transmission Capital Costs 2-5
● 4 conductors per phase
● Conductor assumed to be 55% of total capital cost
500 kV Bi-Pole Transmission Conductors
● 3 conductors per phase
● Conductor assumed to be 55% of total capital cost
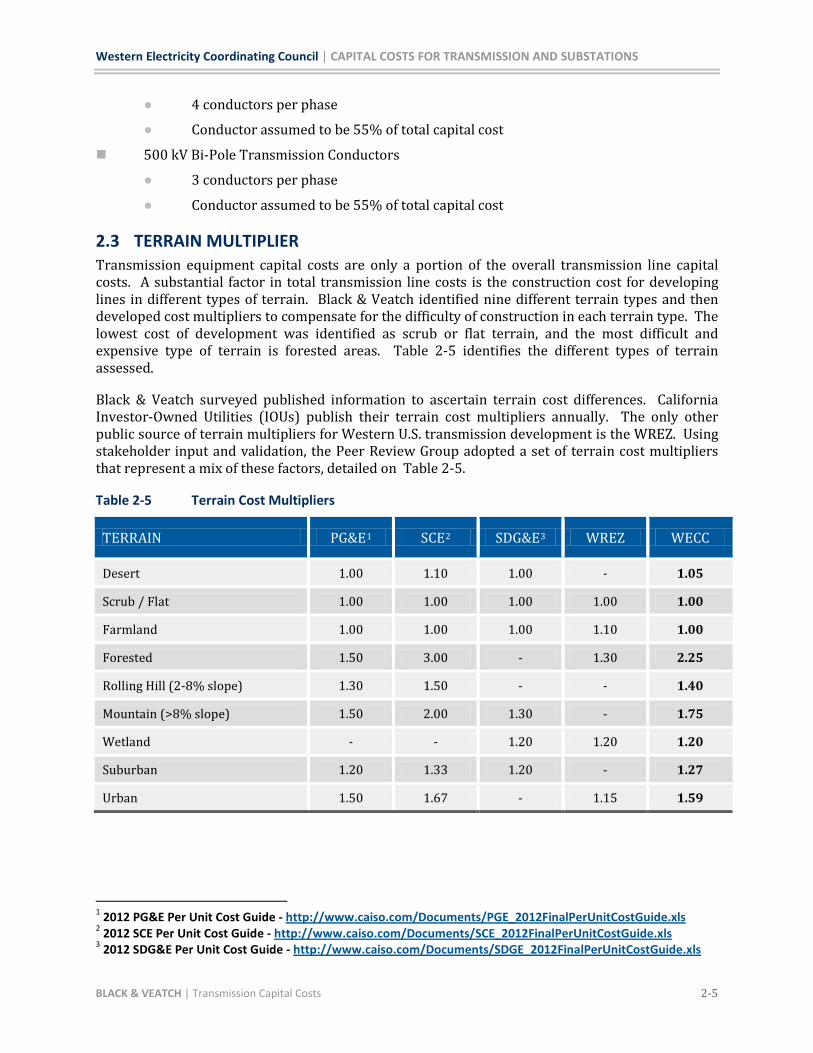
2.3 TERRAIN MULTIPLIER Transmission equipment capital costs are only a portion of the overall transmission line capital costs. A substantial factor in total transmission line costs is the construction cost for developing lines in different types of terrain. Black & Veatch identified nine different terrain types and then developed cost multipliers to compensate for the difficulty of construction in each terrain type. The lowest cost of development was identified as scrub or flat terrain, and the most difficult and expensive type of terrain is forested areas. Table 2-5 identifies the different types of terrain assessed.
Black & Veatch surveyed published information to ascertain terrain cost differences. California Investor-Owned Utilities (IOUs) publish their terrain cost multipliers annually. The only other public source of terrain multipliers for Western U.S. transmission development is the WREZ. Using stakeholder input and validation, the Peer Review Group adopted a set of terrain cost multipliers that represent a mix of these factors, detailed on Table 2-5.
Table 2-5 Terrain Cost Multipliers
TERRAIN PG&E1 SCE 2 SDG&E 3 WREZ WECC
Desert 1.00 1.10 1.00 - 1.05
Scrub / Flat 1.00 1.00 1.00 1.00 1.00
Farmland 1.00 1.00 1.00 1.10 1.00
Forested 1.50 3.00 - 1.30 2.25
Rolling Hill (2-8% slope) 1.30 1.50 - - 1.40
Mountain (>8% slope) 1.50 2.00 1.30 - 1.75
Wetland - - 1.20 1.20 1.20
Suburban 1.20 1.33 1.20 - 1.27
Urban 1.50 1.67 - 1.15 1.59
1 2012 PG&E Per Unit Cost Guide - http://www.caiso.com/Documents/PGE_2012FinalPerUnitCostGuide.xls 2 2012 SCE Per Unit Cost Guide - http://www.caiso.com/Documents/SCE_2012FinalPerUnitCostGuide.xls 3 2012 SDG&E Per Unit Cost Guide - http://www.caiso.com/Documents/SDGE_2012FinalPerUnitCostGuide.xls
Western Electricity Coordinating Council | CAPITAL COSTS FOR TRANSMISSION AND SUBSTATIONS
BLACK & VEATCH | Transmission Capital Costs 2-6
2.4 RIGHT OF WAY COSTS In addition to the capital costs for transmission line equipment and difficulty of construction based on terrain, there are costs associated with acquiring land for the transmission line. In some cases, right of way costs can come to 10% of total project costs, although this proportion varies significantly between projects. In order to estimate per-mile right of way costs for generic transmission projects, two pieces of information are needed:
Right of way widths for each voltage class (from which one can calculate the number of acres required per mile of transmission line)
Right of way costs per acre
With these pieces of information, one can simply multiply the acres per mile by the cost per acre to calculate the total right of way cost per mile of transmission line. Black & Veatch developed estimates for both right of way widths and right of way costs per acre which can be applied across the WECC region; the methodology and results are discussed separately below.
2.4.1 Right of Way Widths In order to develop generic right of way width estimates for each voltage class considered in this study, Black & Veatch surveyed available information from a variety of industry sources—FERC and NERC documents, individual utility estimates, and actual project right of way widths from existing and proposed projects throughout the WECC region. This survey revealed that transmission project right of way widths vary significantly, even within the same voltage class. Table 2-6 below shows the results of a comprehensive survey that FERC conducted in 2004 to quantify right of way widths by utility (note that this survey included utilities nationwide, not just those in the WECC region).4
Table 2-6 FERC Nationwide Survey of Right of Way Widths (2004)
MINIMUM WIDTH 230 KV (# OF
UTILITIES) 345 KV (# OF
UTILITIES) 500 KV (# OF
UTILITIES)
< 125 ft. 40 6 4
126 - 175 ft. 36 36 21
> 175 ft. 30 30 13
Note
: This survey included utilities nationwide, not only those in the WECC region.
However, the FERC data were only one of the many sources investigated. Table 2-7 below shows the larger set of data sources that Black & Veatch drew from (which focused on utilities and projects in the WECC region), and the right of way widths specified for each voltage class in each data source. In the “WECC Assumption” row, the right of way width assumption for each voltage class is shown; this was based on adopting the most common value from the various data sources for each voltage class, and also ensuring a logical progression so that widths increased at successively higher voltages and double circuit line widths were greater than those for single
4 http://www.ferc.gov/industries/electric/indus-act/reliability/veg-mgmt-rpt-final.pdf
Western Electricity Coordinating Council | CAPITAL COSTS FOR TRANSMISSION AND SUBSTATIONS
BLACK & VEATCH | Transmission Capital Costs 2-7
circuits. The bottom row shows the acres of right of way per mile of transmission. These “acre/mile” values were the values used in all subsequent right of way cost calculations for this study.
Table 2-7 Right of Way Widths by Voltage Class and Data Source
SOURCE
230-KV SINGLE CIRCUIT
230-KV DOUBLE CIRCUIT
345-KV SINGLE CIRCUIT
345-KV DOUBLE CIRCUIT
500-KV SINGLE CIRCUIT
500-KV DOUBLE CIRCUIT
500-KV DC BI-POLE
FERC Nation-wide Utility Survey 100 ft. - 125 ft. - 175 ft. - -
DRECP (SCE/LADWP) 100 ft. - - - 200 ft. - -
SDG&E - 300 ft. - - 200 ft. - -
PG&E 75 ft. - - - - - -
PacifiCorp 125/150 ft. - 150 ft. - 250/300
ft. 300 -
BPA 125/225 ft. - - - 150 ft. - -
Idaho Power - - - - 250 ft. - -
Xcel Energy - - - 225/250 ft. - - -
WREZ 150 ft. 150 ft. 160 ft. 160 ft. 175 ft. 175 ft. 200 ft.
WECC Assumption 125 ft. 150 ft. 175 ft. 200 ft. 200 ft. 250 ft. 200 ft.
Acres/mile* 15.14 18.17 21.20 24.23 24.23 30.29 24.23
*Acres/mile values were calculated by multiplying the right of way width by 5,280 feet per mile and dividing by 43,560 sq. ft. per acre.
2.4.2 Right of Way Costs Per Acre To develop estimates of right of way costs, the Peer Review Group adopted a methodology based on the Bureau of Land Management’s (BLM) Linear Right of Way Schedule for Year 2015 (taken from 43 CFR Parts 2800, 2880, 2920).5
5
This document provides estimates of land rental costs in each U.S. county, developed specifically for the purpose of linear right of way uses such as transmission lines. Although these rental costs do not differentiate between different land uses (e.g. farmland, pasture land, urban or suburban land, etc.) and may not accurately predict the cost of any particular parcel of land, they do provide the following advantages:
http://www.blm.gov/pgdata/etc/medialib/blm/wo/MINERALS__REALTY__AND_RESOURCE_PROTECTION_/ cost_recovery.Par.47392.File.dat/RentLinearRentSchedule2009-2015-NoHighlight.pdf
Western Electricity Coordinating Council | CAPITAL COSTS FOR TRANSMISSION AND SUBSTATIONS
BLACK & VEATCH | Transmission Capital Costs 2-8
Consistent data across all states and counties
Transparent, public data source
Costs designed for the purpose of right of way leases
Capture the relative cost differences between different regions and land uses
Because these costs are given in rental terms (dollars per acre per year) and the WECC transmission costs are expressed in capital costs it is necessary to convert the lease costs to capital costs (dollars per acre). The following formula was used for this conversion:
6
Black & Veatch assumed a Capitalization Rate of ten percent and assumed that Land Taxes are equal to one percent of the Land Rental Cost.
In addition to providing per-acre rental costs for each U.S. county, the BLM right of way schedule also categorizes all counties into twelve different cost “zones”. For simplicity, Black & Veatch used the zone data rather than individual county-level cost data. Table 2-8 lists the BLM land rental costs by zone and the equivalent capital cost by zone.
Table 2-8 BLM Land Rental and Land Capital Costs by Zone
BLM ZONE NUMBER
LAND RENTAL COST ($/ACRE-YEAR)
LAND CAPITAL COST ($/ACRE)
1 $ 9 $ 85
2 $ 17 $ 171
3 $ 34 $ 341
4 $ 52 $ 512
5 $ 69 $ 683
6 $ 103 $ 1,024
7 $ 172 $ 1,707
8 $ 345 $ 3,414
9 $ 690 $ 6,828
10 $ 1,035 $ 10,242
11 $ 1,724 $ 17,071
12 $ 3,449 $ 34,141
6 Land Rental Value is the annual fee individuals are willing to pay for the exclusive right to use a land site for a period of time. Land Taxes is the portion of the land rental value that is claimed for the community. Capitalization Rate is a market determined rate of return that would attract individuals to invest in the use of land, considering all of the risks and benefits which could be realized.

Western Electricity Coordinating Council | CAPITAL COSTS FOR TRANSMISSION AND SUBSTATIONS
BLACK & VEATCH | Transmission Capital Costs 2-9
2.5 TRANSMISSION CALCULATION METHODOLOGY Multiplying the right of way acres per mile by the land cost per acre yields the total right of way cost per mile of transmission line. This value was then added to the base transmission costs discussed in Sections 2.1, 2.2, and 2.3 to develop the total transmission line capital cost. The exact equation used to calculate the total transmission cost is explained in Section 2.5.
Total Transmission Line Cost =
[(Base Transmission Cost) x (Conductor Multiplier) x (Structure Multiplier) x (Re-conductor Multiplier) x (Terrain Multiplier) + (ROW Acres/Mile) x (Land Cost/Acre)] x (# of Miles)
Western Electricity Coordinating Council | CAPITAL COSTS FOR TRANSMISSION AND SUBSTATIONS
BLACK & VEATCH | Substation Capital Costs 3-1
3.0 Substation Capital Costs Transmission cost estimates often only consider the conductor cost, without consideration of the requirements for new substation facilities needed to connect the transmission to the existing grid. This section quantifies the substation costs associated with transmission infrastructure development.
There are numerous considerations that go into the design of a substation that will significantly impact the cost of the facility. For the purpose of this effort, however, the Peer Review Group adopted a methodology that was simple enough to be repeatable, but granular enough to estimate a capital cost for various sized substations with different line and transformer positions, additional reactive equipment, or new transformers. Since HVDC lines were also identified in the transmission capital costs, HVDC converter station equipment and costs were also estimated. The following cost components were identified to calculate the substation cost:
Base Substation Cost
Line/Transformer Positions
Transformer
HVDC Converter Station
Static VAR Compensator, Shunt Reactors and Series Capacitors
3.1 NEW SUBSTATION BASE COST Black & Veatch first identified a set of base substation costs, which excludes all major equipment. Since substations can be built in very remote areas, it was important to note that the substation costs in this methodology assume flat, barren land with relatively easy site access. The new substation costs, which include land, substation fence, control building, etc are identified in Table 3-1 below.
Table 3-1 New Base Substation Capital Costs
EQUIPMENT 230 KV
SUBSTATION 345 KV
SUBSTATION 500 KV
SUBSTATION
Base Cost (New Substation) $1,648,000 $2,060,000 $2,472,000
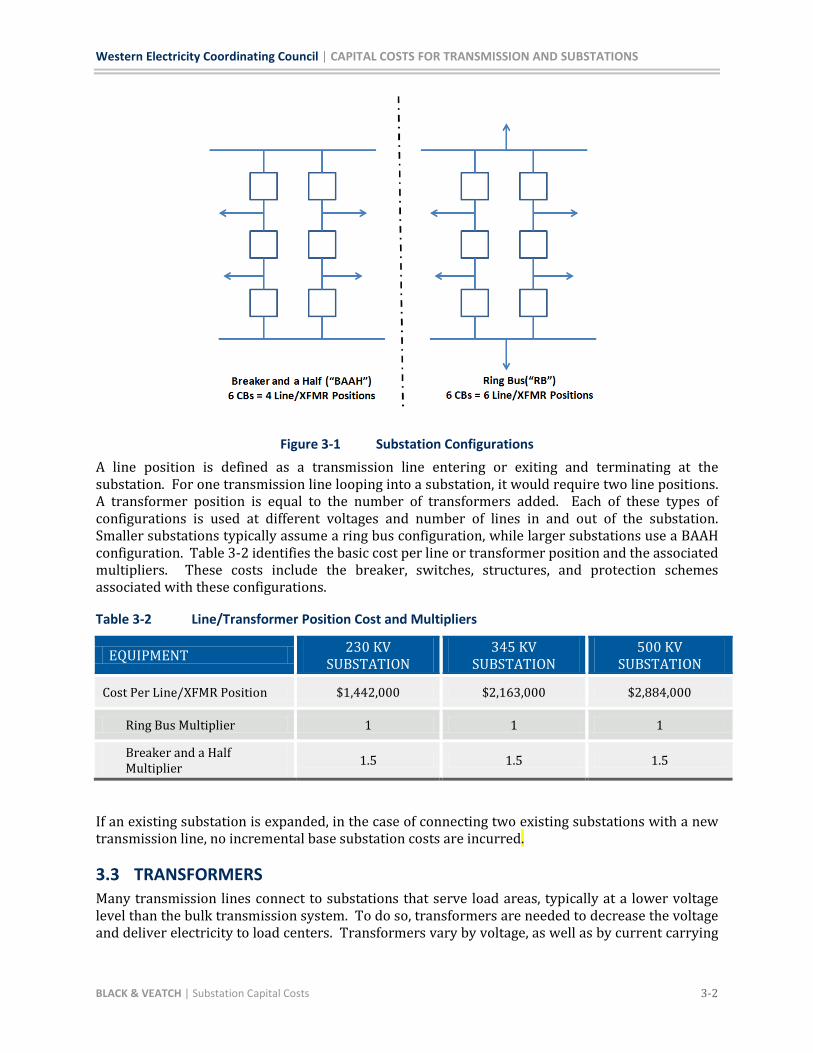
3.2 LINE AND TRANSFORMER POSITIONS In addition to the substation base cost Black & Veatch considered the cost of breaker postions necessary to interconnect lines and transformers for new and existing substations. All of these require circuit breakers and switches for isolation of equipment. This isolation can be designed in multiple configurations; however, two are most common: ring bus and breaker-and-a-half (BAAH).
A ring bus configuration assumes one breaker for each line or transformer position; whereas, a BAAH configuration assumes one and a half breakers for every line or transformer configuration (e.g. 4 lines equates to 6 breakers); see Figure 3-1 for a diagram of each configuration.
Western Electricity Coordinating Council | CAPITAL COSTS FOR TRANSMISSION AND SUBSTATIONS
BLACK & VEATCH | Substation Capital Costs 3-2
Figure 3-1 Substation Configurations
A line position is defined as a transmission line entering or exiting and terminating at the substation. For one transmission line looping into a substation, it would require two line positions. A transformer position is equal to the number of transformers added. Each of these types of configurations is used at different voltages and number of lines in and out of the substation. Smaller substations typically assume a ring bus configuration, while larger substations use a BAAH configuration. Table 3-2 identifies the basic cost per line or transformer position and the associated multipliers. These costs include the breaker, switches, structures, and protection schemes associated with these configurations.
Table 3-2 Line/Transformer Position Cost and Multipliers
EQUIPMENT 230 KV SUBSTATION
345 KV SUBSTATION
500 KV SUBSTATION
Cost Per Line/XFMR Position $1,442,000 $2,163,000 $2,884,000
Ring Bus Multiplier 1 1 1
Breaker and a Half Multiplier 1.5 1.5 1.5
If an existing substation is expanded, in the case of connecting two existing substations with a new transmission line, no incremental base substation costs are incurred.
3.3 TRANSFORMERS Many transmission lines connect to substations that serve load areas, typically at a lower voltage level than the bulk transmission system. To do so, transformers are needed to decrease the voltage and deliver electricity to load centers. Transformers vary by voltage, as well as by current carrying
Western Electricity Coordinating Council | CAPITAL COSTS FOR TRANSMISSION AND SUBSTATIONS
BLACK & VEATCH | Substation Capital Costs 3-3
capability. Transformers can vary in cost substantially based on variables such as copper commodity prices, as well as cost of freight; however, the costs considered and vetted by the WECC stakeholders are typical in the industry. The costs considered include foundation and oil containment for the transformer.
Table 3-3 below identifies the capital costs associated with each voltage class in a cost per mega-volt ampere (MVA), which is dependent on the amount of current carrying capability necessary to deliver from the high voltage side to the low voltage side of the transformer.
Table 3-3 Transformer Capital Costs
TRANSFORMER COST ($/MVA)
230 KV SUBSTATION
345 KV SUBSTATION
500 KV SUBSTATION
115/230 kV XFMR $7,000 - -
115/345 kV XFMR - $10,000 -
115/500 kV XFMR - - $10,000
138/230 kV XFMR $7,000 - -
138/345 kV XFMR - $10,000 -
138/500 kV XFMR - - $10,000
230/345 kV XFMR $10,000 -
230/500 kV XFMR $11,000 - $11,000
345/500 kV XFMR - $13,000 $13,000
3.4 REACTIVE COMPONENTS An ideal transmission system does not require any reactive support; however, this is rarely the case. Many transmission networks are integrated in a manner that supports voltage dips across the network; however, some weaker systems may require additional reactive power support to maintain grid reliability. The amount of reactive support, and the speed with which the support needs to be transferred to the grid, will determine what type of reactive component is required at the substation.
Black & Veatch identified three key reactive components commonly used for transmission level grid support. Each piece of equipment has its own level of complexity, size, and cost.
Shunt Reactor
Series Capacitor
Static VAr Compensator (SVC)
Western Electricity Coordinating Council | CAPITAL COSTS FOR TRANSMISSION AND SUBSTATIONS
BLACK & VEATCH | Substation Capital Costs 3-4
Shunt reactors are commonly used to reduce voltages due to high line charging on lightly loaded transmission networks. Series capacitors do the exact opposite – they increase voltages by providing additional reactive charging to the transmission network to maintain system voltages.
Black & Veatch worked with stakeholders to assume a “turnkey” installation, which includes with engineering, design, and construction support for a site that “has been rough-graded and has access to a source of medium voltage auxiliary power”7
Table 3-4 Shunt Reactor and Series Capacitor Capital Costs
. Table 3-4 identifies the typical costs for shunt reactors and series capacitors.
EQUIPMENT 230 KV SUBSTATION
345 KV SUBSTATION
500 KV SUBSTATION
Shunt Reactor ($/MVAR) $20,000 $20,000 $20,000
Series Capacitor ($/MVAR) $30,000 $10,000 $10,000
Static VAr Compensators (SVCs) combine both technologies, while adding speed of support. SVCs are constantly connected to the grid, whereas capacitors and reactors typically have to be switched. SVCs are more expensive than their static counterparts; however, they offer more flexibility in resources. The costs for SVCs vary based on size and the assumptions made about the ease of installation. Table 3-5 below shows SVC costs identified by HydroOne, Arizona Public Service Company (APS), and the Peer Review Group adopted costs. Like Shunt Reactor and Series Capacitor capital costs, SVC costs assume a “turnkey” installation.
Table 3-5 SVC Capital Costs
VOLTAGE CLASS HYDRO ONE8 APS 9 WECC
500 kV - - $85,000
345 kV - - $85,000
230 kV $94,500 $75,000 $85,000
115 kV $141,000 - -
Medium Voltage $142,000 - -
Low Voltage $250,000 - -
7 Stakeholder comment from Eric John of ABB, regarding turnkey SC turnkey installation. 8 http://www.appro.org/docs/HONIconnectionsJan2009/Naren_Pattani_%20-_Tx_presentation_at_%20APPrO-CanWEA-OWA_workshop,_Jan_22_2009.pdf 9http://www.wecc.biz/committees/BOD/TEPPC/020209/Lists/Agendas/1/Reactors%20%20Capacitors%20%20SVC%20%20PSS.pdf
Western Electricity Coordinating Council | CAPITAL COSTS FOR TRANSMISSION AND SUBSTATIONS
BLACK & VEATCH | Substation Capital Costs 3-5
3.5 HIGH VOLTAGE DIRECT CURRENT CONVERTER STATION HVDC converter stations are required at both ends of a HVDC transmission line. The converter stations change the HVDC power to AC power and then interconnect it to the AC transmission network. There are benefits to using HVDC transmission lines for very long transmission segments, as line losses are substantially lower due to the lack of reactive losses, which make up the majority of AC transmission line losses. For shorter distances, HVDC lines are generally not cost-effective, as the converter substation costs are substantially higher than the cost of an AC substation.
There are various costs associated with a HVDC converter station, and the most variable cost is the reactive component. The costs on Table 3-6 are indicative of a typical transmission system, and what is needed to provide reliable power to the AC transmission network.
Table 3-6 HVDC Converter Station Costs
HVDC 500 KV CONVERTER STATION
MW Rating 3000 MW
Cost Components
Converter Terminal (including DC switching station equipment) $275,000,000
Reactive Support (synchronous condensers, SVCs, etc.) $150,000,000
AC Switchyard $20,000,000
Total Cost $445,000,000
3.6 SUBSTATION CALCULATION METHODOLOGY Using the substation components detailed above, the total substation cost is calculated using the following equation:
Total Individual Substation Cost =
[(Substation Base Cost) + (Line/XFMR Position Base Cost) x (# of Line/XFMR Positions) x (RB or BAAH Multiplier) + (XFMR Cost/MVA) x (XFMR MVA Rating) x (# of XFMRs) + (SVC Cost/MVAR) (# MVARs) + (Series Cap. Cost/MVAR) x (# MVARs) + (Shunt Reactor Cost/MVAR) x (# MVARs) + (HVDC Converter Station Cost)]
If the substation has a high side and a low side voltage, both Line/XFMR Position costs have to be calculated; however, the Substation Base Cost does not have to be added again. The highest voltage of the substation will be the basis for the Substation Base Cost.
Western Electricity Coordinating Council | CAPITAL COSTS FOR TRANSMISSION AND SUBSTATIONS
BLACK & VEATCH | Summary of Capital Costs 4-1
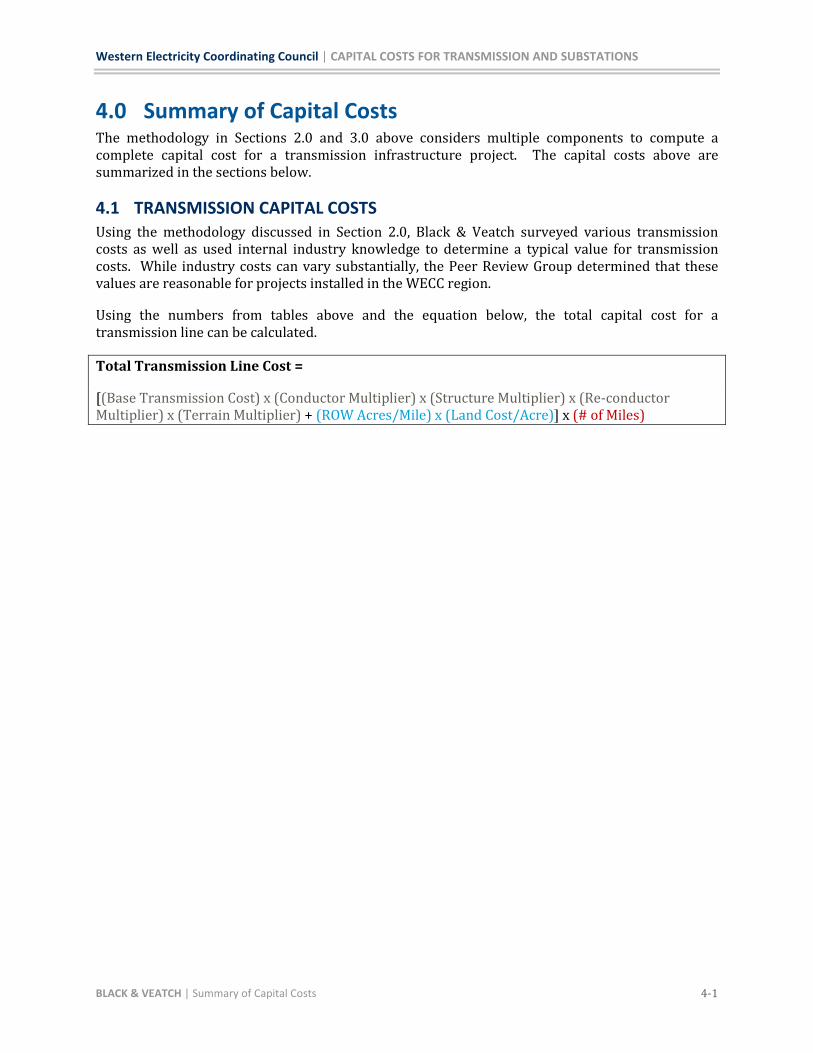
4.0 Summary of Capital Costs The methodology in Sections 2.0 and 3.0 above considers multiple components to compute a complete capital cost for a transmission infrastructure project. The capital costs above are summarized in the sections below.
4.1 TRANSMISSION CAPITAL COSTS Using the methodology discussed in Section 2.0, Black & Veatch surveyed various transmission costs as well as used internal industry knowledge to determine a typical value for transmission costs. While industry costs can vary substantially, the Peer Review Group determined that these values are reasonable for projects installed in the WECC region.
Using the numbers from tables above and the equation below, the total capital cost for a transmission line can be calculated.
Total Transmission Line Cost =
[(Base Transmission Cost) x (Conductor Multiplier) x (Structure Multiplier) x (Re-conductor Multiplier) x (Terrain Multiplier) + (ROW Acres/Mile) x (Land Cost/Acre)] x (# of Miles)
Western Electricity Coordinating Council | CAPITAL COSTS FOR TRANSMISSION AND SUBSTATIONS
BLACK & VEATCH | Summary of Capital Costs 4-2
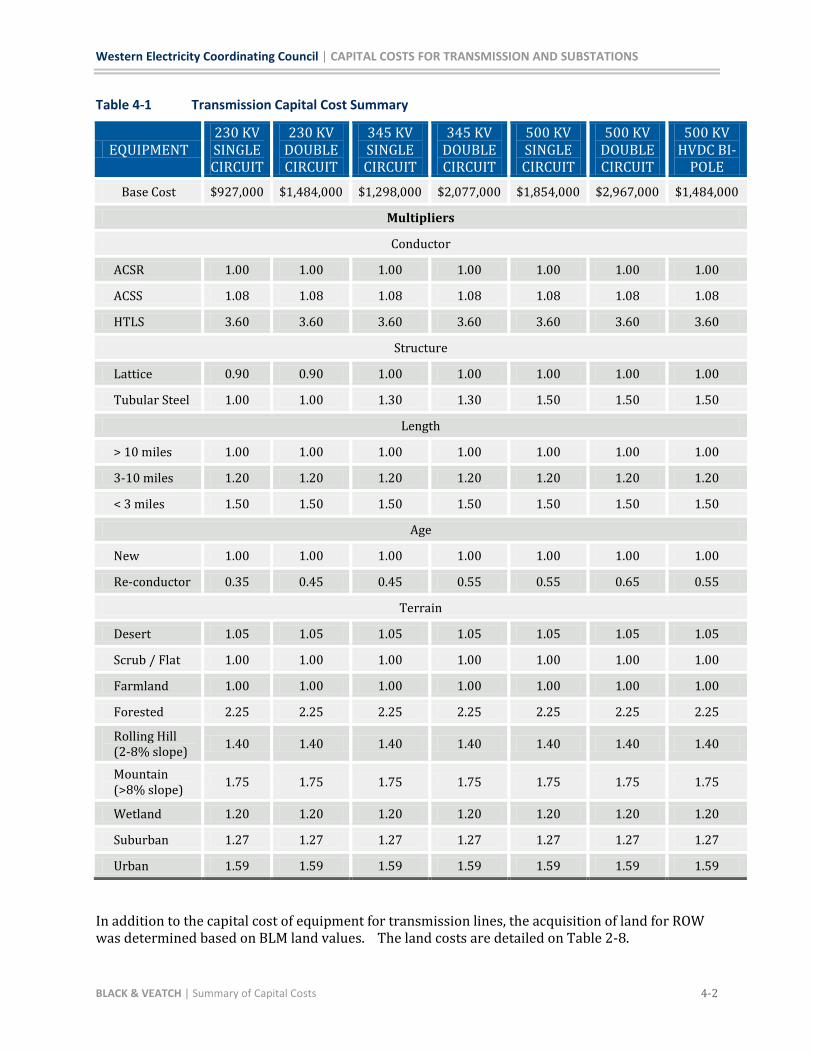
Table 4-1 Transmission Capital Cost Summary
EQUIPMENT 230 KV SINGLE CIRCUIT
230 KV DOUBLE CIRCUIT
345 KV SINGLE CIRCUIT
345 KV DOUBLE CIRCUIT
500 KV SINGLE CIRCUIT
500 KV DOUBLE CIRCUIT
500 KV HVDC BI-
POLE
Base Cost $927,000 $1,484,000 $1,298,000 $2,077,000 $1,854,000 $2,967,000 $1,484,000
Multipliers
Conductor
ACSR 1.00 1.00 1.00 1.00 1.00 1.00 1.00
ACSS 1.08 1.08 1.08 1.08 1.08 1.08 1.08
HTLS 3.60 3.60 3.60 3.60 3.60 3.60 3.60
Structure
Lattice 0.90 0.90 1.00 1.00 1.00 1.00 1.00
Tubular Steel 1.00 1.00 1.30 1.30 1.50 1.50 1.50
Length
> 10 miles 1.00 1.00 1.00 1.00 1.00 1.00 1.00
3-10 miles 1.20 1.20 1.20 1.20 1.20 1.20 1.20
< 3 miles 1.50 1.50 1.50 1.50 1.50 1.50 1.50
Age
New 1.00 1.00 1.00 1.00 1.00 1.00 1.00
Re-conductor 0.35 0.45 0.45 0.55 0.55 0.65 0.55
Terrain
Desert 1.05 1.05 1.05 1.05 1.05 1.05 1.05
Scrub / Flat 1.00 1.00 1.00 1.00 1.00 1.00 1.00
Farmland 1.00 1.00 1.00 1.00 1.00 1.00 1.00
Forested 2.25 2.25 2.25 2.25 2.25 2.25 2.25 Rolling Hill (2-8% slope) 1.40 1.40 1.40 1.40 1.40 1.40 1.40
Mountain (>8% slope) 1.75 1.75 1.75 1.75 1.75 1.75 1.75
Wetland 1.20 1.20 1.20 1.20 1.20 1.20 1.20
Suburban 1.27 1.27 1.27 1.27 1.27 1.27 1.27
Urban 1.59 1.59 1.59 1.59 1.59 1.59 1.59
In addition to the capital cost of equipment for transmission lines, the acquisition of land for ROW was determined based on BLM land values. The land costs are detailed on Table 2-8.
Western Electricity Coordinating Council | CAPITAL COSTS FOR TRANSMISSION AND SUBSTATIONS
BLACK & VEATCH | Summary of Capital Costs 4-3
4.2 SUBSTATION CAPITAL COSTS Using the methodology discussed in Section 3.0, Black & Veatch surveyed various substation costs as well as used internal industry knowledge to determine a typical value for substation costs. While industry costs can vary substantially, the Peer Review Group determined that these values are reasonable for projects installed in the WECC region, with the key assumption that the substation would be constructed on flat, barren land.
Table 4-2 Substation Capital Cost Summary
EQUIPMENT 230 KV SUBSTATION
345 KV SUBSTATION
500 KV SUBSTATION
Base Cost (New Substation) $1,648,000 $2,060,000 $2,472,000
Cost Per Line/XFMR Position $1,442,000 $2,163,000 $2,884,000
Ring Bus Multiplier 1 1 1
Breaker and a Half Multiplier 1.5 1.5 1.5
500 kV HVDC Converter Station - - $445,000,000
Shunt Reactor ($/MVAR) $20,000 $20,000 $20,000
Series Capacitor ($/MVAR) $30,000 $10,000 $10,000
SVC Cost ($/MVAR) $85,000 $85,000 $85,000
Transformer Cost ($/MVA) 115/230 kV XFMR $7,000 - -
115/345 kV XFMR - $10,000 -
115/500 kV XFMR - - $10,000
138/230 kV XFMR $7,000 - -
138/345 kV XFMR - $10,000 -
138/500 kV XFMR - - $10,000
230/345 kV XFMR $10,000 -
230/500 kV XFMR $11,000 - $11,000
345/500 kV XFMR - $13,000 $13,000
Western Electricity Coordinating Council | CAPITAL COSTS FOR TRANSMISSION AND SUBSTATIONS
BLACK & VEATCH | Summary of Capital Costs 4-4
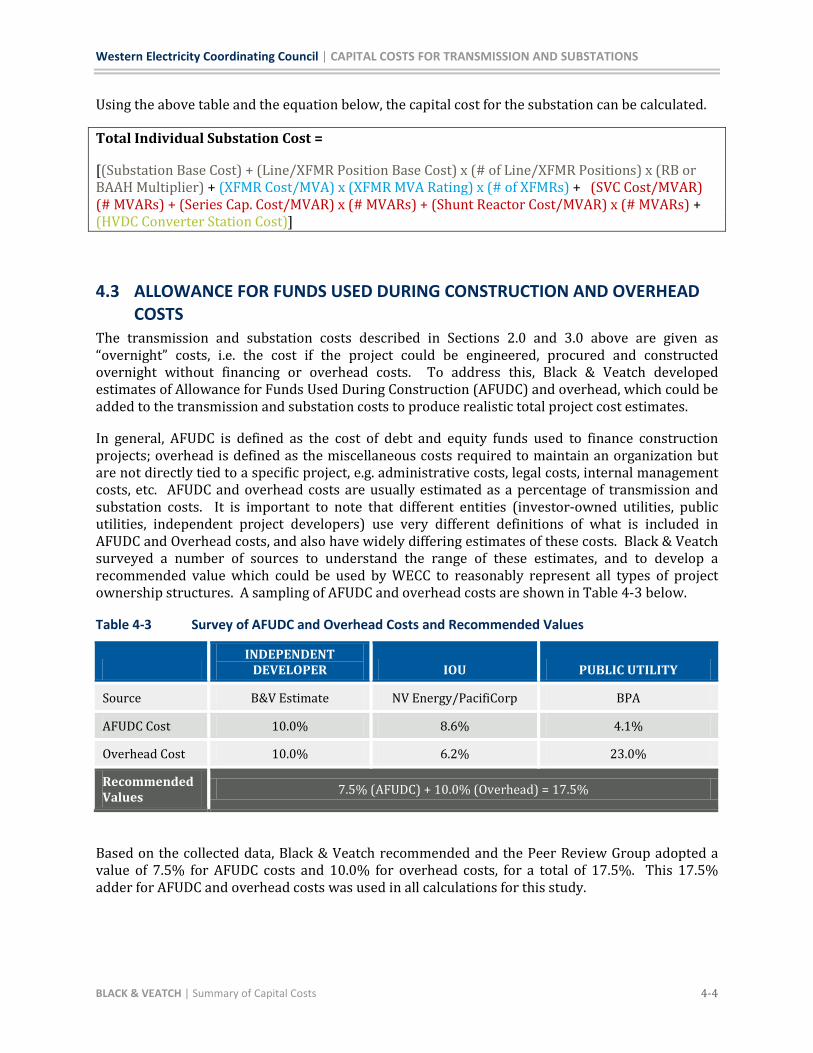
Using the above table and the equation below, the capital cost for the substation can be calculated.
Total Individual Substation Cost =
[(Substation Base Cost) + (Line/XFMR Position Base Cost) x (# of Line/XFMR Positions) x (RB or BAAH Multiplier) + (XFMR Cost/MVA) x (XFMR MVA Rating) x (# of XFMRs) + (SVC Cost/MVAR) (# MVARs) + (Series Cap. Cost/MVAR) x (# MVARs) + (Shunt Reactor Cost/MVAR) x (# MVARs) + (HVDC Converter Station Cost)]
4.3 ALLOWANCE FOR FUNDS USED DURING CONSTRUCTION AND OVERHEAD COSTS
The transmission and substation costs described in Sections 2.0 and 3.0 above are given as “overnight” costs, i.e. the cost if the project could be engineered, procured and constructed overnight without financing or overhead costs. To address this, Black & Veatch developed estimates of Allowance for Funds Used During Construction (AFUDC) and overhead, which could be added to the transmission and substation costs to produce realistic total project cost estimates.
In general, AFUDC is defined as the cost of debt and equity funds used to finance construction projects; overhead is defined as the miscellaneous costs required to maintain an organization but are not directly tied to a specific project, e.g. administrative costs, legal costs, internal management costs, etc. AFUDC and overhead costs are usually estimated as a percentage of transmission and substation costs. It is important to note that different entities (investor-owned utilities, public utilities, independent project developers) use very different definitions of what is included in AFUDC and Overhead costs, and also have widely differing estimates of these costs. Black & Veatch surveyed a number of sources to understand the range of these estimates, and to develop a recommended value which could be used by WECC to reasonably represent all types of project ownership structures. A sampling of AFUDC and overhead costs are shown in Table 4-3 below.
Table 4-3 Survey of AFUDC and Overhead Costs and Recommended Values
INDEPENDENT
DEVELOPER IOU PUBLIC UTILITY
Source B&V Estimate NV Energy/PacifiCorp BPA
AFUDC Cost 10.0% 8.6% 4.1%
Overhead Cost 10.0% 6.2% 23.0%
Recommended Values
7.5% (AFUDC) + 10.0% (Overhead) = 17.5%
Based on the collected data, Black & Veatch recommended and the Peer Review Group adopted a value of 7.5% for AFUDC costs and 10.0% for overhead costs, for a total of 17.5%. This 17.5% adder for AFUDC and overhead costs was used in all calculations for this study.
Western Electricity Coordinating Council | CAPITAL COSTS FOR TRANSMISSION AND SUBSTATIONS
BLACK & VEATCH | Summary of Capital Costs 4-5
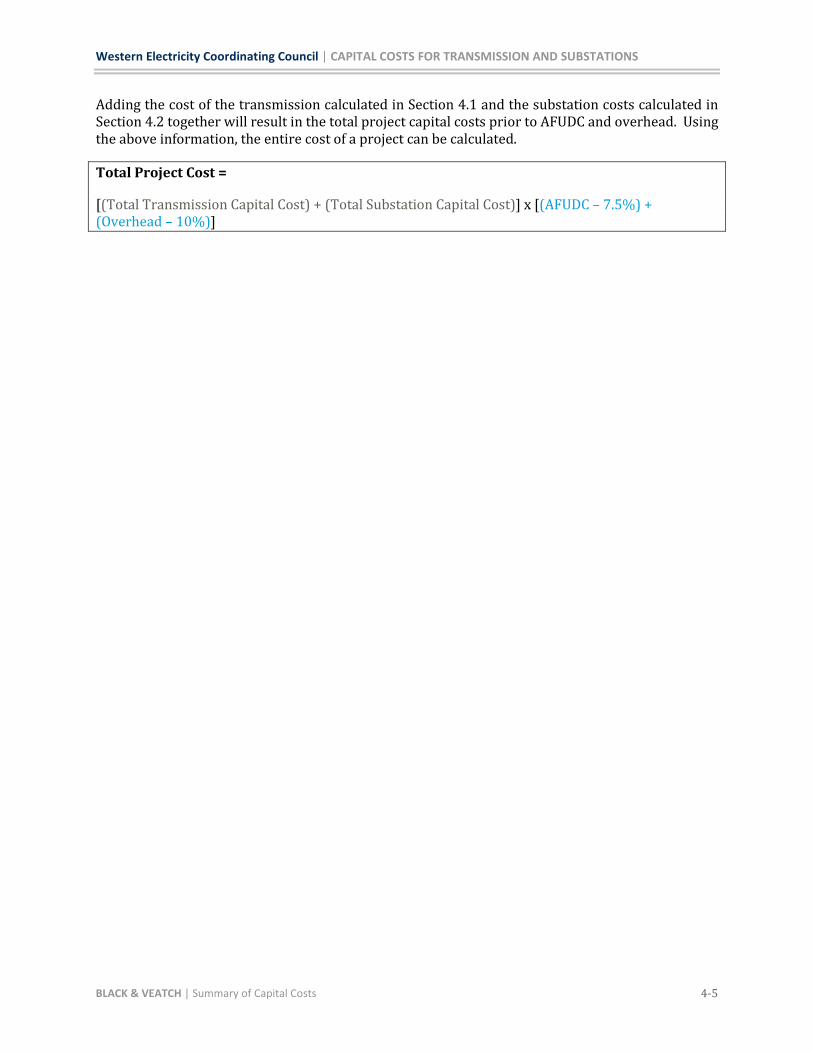
Adding the cost of the transmission calculated in Section 4.1 and the substation costs calculated in Section 4.2 together will result in the total project capital costs prior to AFUDC and overhead. Using the above information, the entire cost of a project can be calculated.
Total Project Cost =
[(Total Transmission Capital Cost) + (Total Substation Capital Cost)] x [(AFUDC – 7.5%) + (Overhead – 10%)]
Western Electricity Coordinating Council | CAPITAL COSTS FOR TRANSMISSION AND SUBSTATIONS
BLACK & VEATCH | Cost Calculator 5-1
5.0 Cost Calculator After developing the capital cost estimates for transmission and substations described in Section 4.0, Black & Veatch created a cost calculator which incorporated all of the cost estimates for transmission and substations cost components into a single, user-friendly Excel-based tool. The cost calculator is simple but flexible, and can be used to estimate the costs of any hypothetical transmission project and associated substations within the WECC region. The calculator employs the cost formulas for transmission and substations to calculate total project costs (for the entire line length and on a per-mile basis), and is automated to the extent possible to allow for quick estimates. The cost calculator workbook is split into three different sheets, each of which is described below:
Transmission Cost Calculator
Substation Cost Calculator
Cost Totals
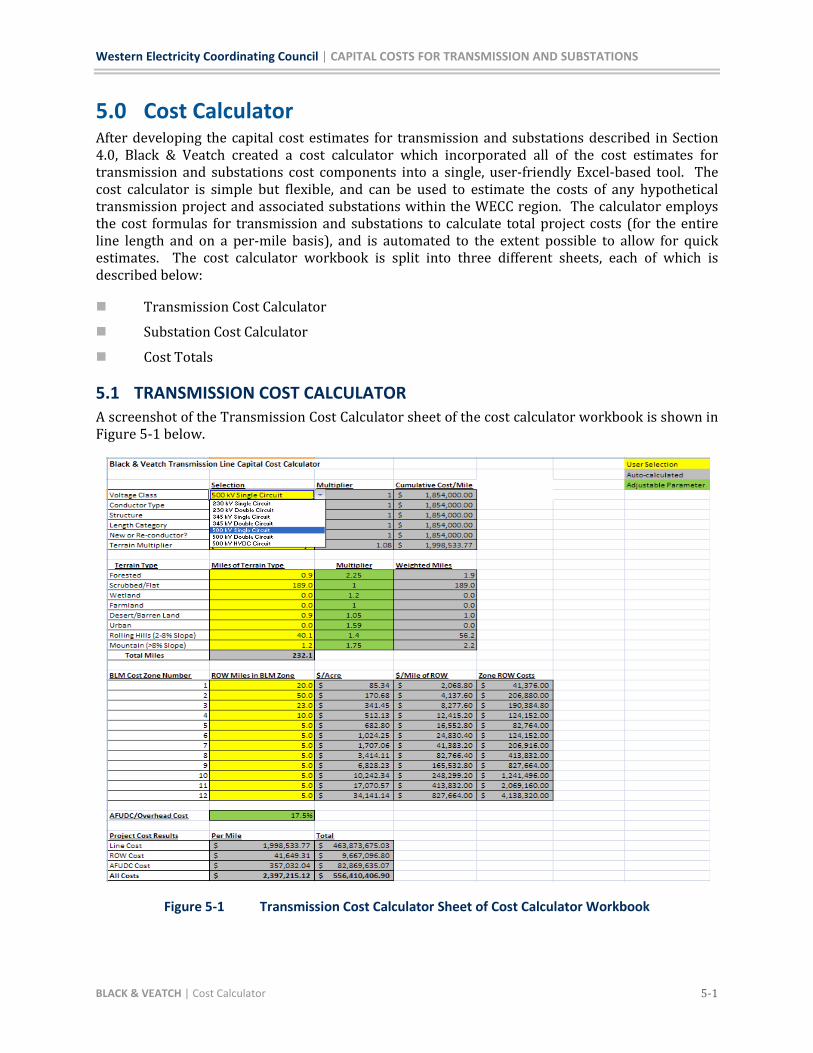
5.1 TRANSMISSION COST CALCULATOR A screenshot of the Transmission Cost Calculator sheet of the cost calculator workbook is shown in Figure 5-1 below.
Figure 5-1 Transmission Cost Calculator Sheet of Cost Calculator Workbook
Western Electricity Coordinating Council | CAPITAL COSTS FOR TRANSMISSION AND SUBSTATIONS
BLACK & VEATCH | Cost Calculator 5-2
On this sheet, the user first selects the basic transmission line characteristics from a series of drop-down menus. The options for each follow the different equipment types and specifications described in Section 2.1. After that, the user must enter information about the line routing. This information consists of the number of miles of line which pass through each terrain type described in Section 2.3, and the number of miles of line which pass through each BLM cost zone described in Section 2.4. These line routing values are not calculated within this sheet—rather, the user must obtain these values by performing a separate Geographic Information System (GIS) analysis.
Once all selections are made and all values are entered, the transmission line, right of way, and AFUDC/overhead costs for the project are automatically calculated at the bottom of the sheet in the “Project Cost Results” section, for the entire line length and on a per-mile basis.
The calculator is also flexible. In addition to the cells highlighted in yellow, which indicate places where the user must select from a drop-down menu or enter a value, a number of cells are highlighted green, to indicate that the values in those cells are parameters that can be adjusted by the user. Adjusting these values allows the user to test the sensitivity of the project cost results to certain parameters. The following are parameters which can be adjusted on this sheet:
Terrain type multipliers
AFUDC/overhead cost adder
Transmission base costs
Conductor type multipliers
Structure type multipliers
Length category multipliers
New vs. re-conductor multipliers
Right of way width assumptions
BLM Zone Land Rental Costs
Land Tax Rate
Capitalization Rate
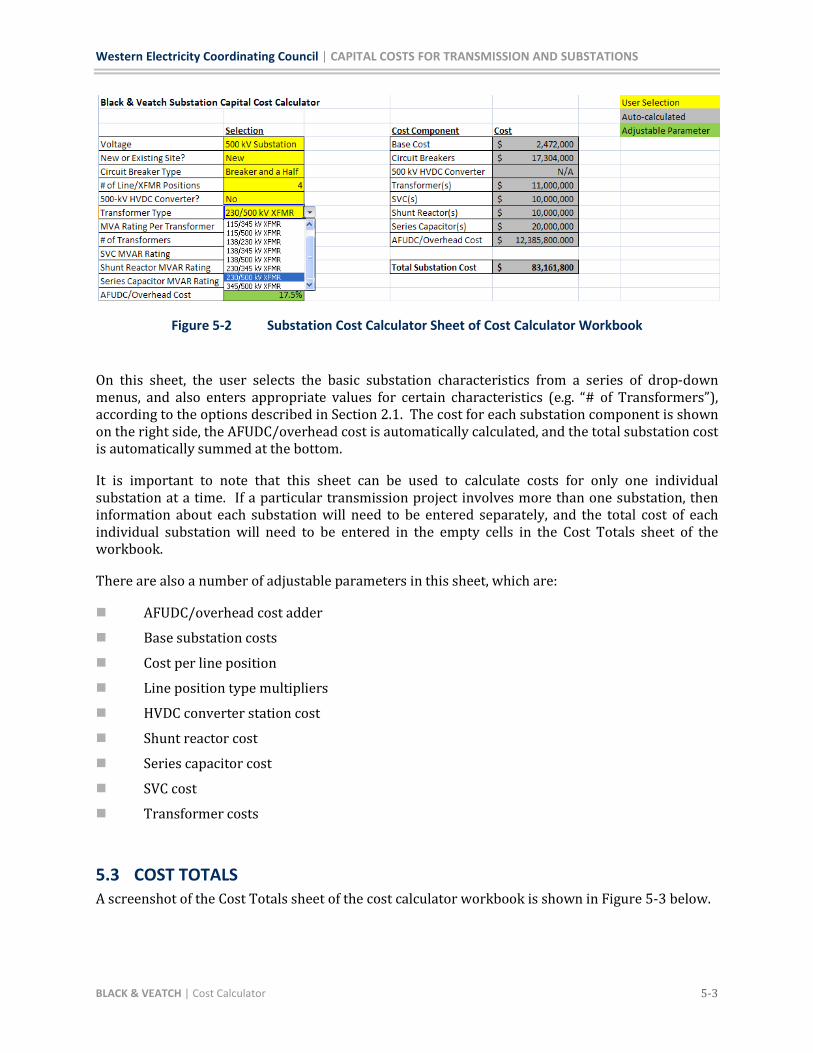
5.2 SUBSTATION COST CALCULATOR A screenshot of the Substation Cost Calculator sheet of the cost calculator workbook is shown in Figure 5-2 below.
Western Electricity Coordinating Council | CAPITAL COSTS FOR TRANSMISSION AND SUBSTATIONS
BLACK & VEATCH | Cost Calculator 5-3
Figure 5-2 Substation Cost Calculator Sheet of Cost Calculator Workbook
On this sheet, the user selects the basic substation characteristics from a series of drop-down menus, and also enters appropriate values for certain characteristics (e.g. “# of Transformers”), according to the options described in Section 2.1. The cost for each substation component is shown on the right side, the AFUDC/overhead cost is automatically calculated, and the total substation cost is automatically summed at the bottom.
It is important to note that this sheet can be used to calculate costs for only one individual substation at a time. If a particular transmission project involves more than one substation, then information about each substation will need to be entered separately, and the total cost of each individual substation will need to be entered in the empty cells in the Cost Totals sheet of the workbook.
There are also a number of adjustable parameters in this sheet, which are:
AFUDC/overhead cost adder
Base substation costs
Cost per line position
Line position type multipliers
HVDC converter station cost
Shunt reactor cost
Series capacitor cost
SVC cost
Transformer costs
5.3 COST TOTALS A screenshot of the Cost Totals sheet of the cost calculator workbook is shown in Figure 5-3 below.
Western Electricity Coordinating Council | CAPITAL COSTS FOR TRANSMISSION AND SUBSTATIONS
BLACK & VEATCH | Cost Calculator 5-4
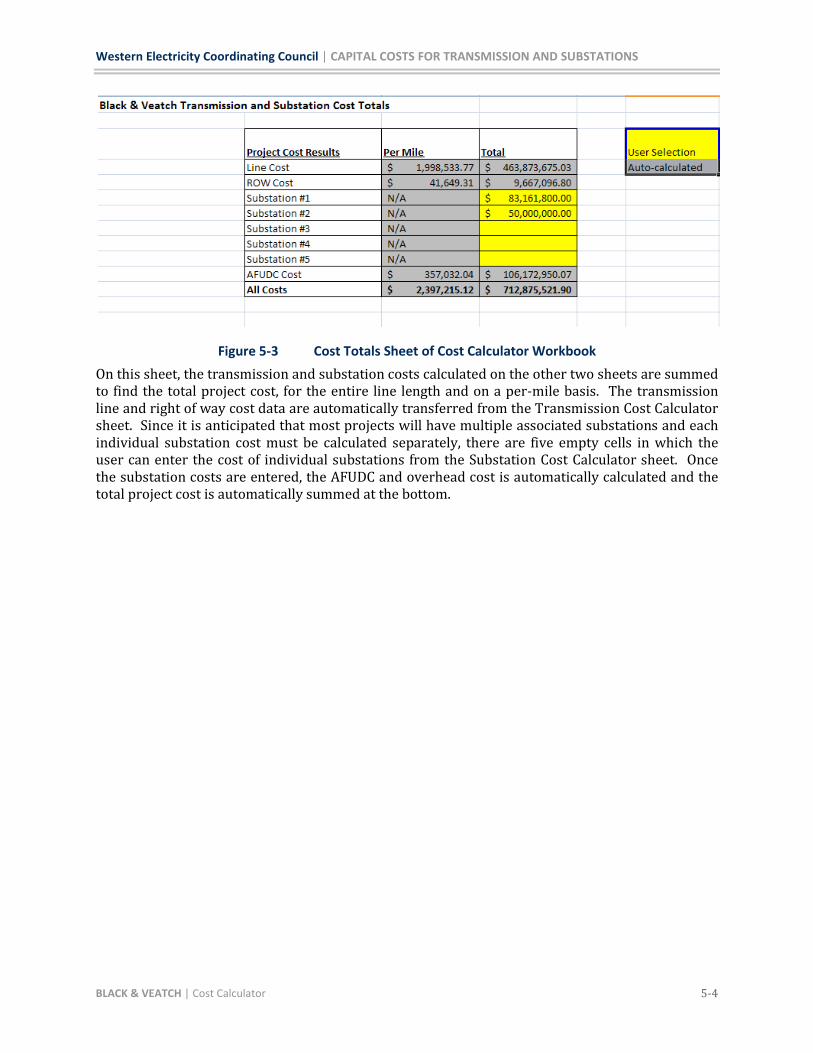
Figure 5-3 Cost Totals Sheet of Cost Calculator Workbook
On this sheet, the transmission and substation costs calculated on the other two sheets are summed to find the total project cost, for the entire line length and on a per-mile basis. The transmission line and right of way cost data are automatically transferred from the Transmission Cost Calculator sheet. Since it is anticipated that most projects will have multiple associated substations and each individual substation cost must be calculated separately, there are five empty cells in which the user can enter the cost of individual substations from the Substation Cost Calculator sheet. Once the substation costs are entered, the AFUDC and overhead cost is automatically calculated and the total project cost is automatically summed at the bottom.
Western Electricity Coordinating Council | CAPITAL COSTS FOR TRANSMISSION AND SUBSTATIONS
BLACK & VEATCH | Scenario Analysis 6-1
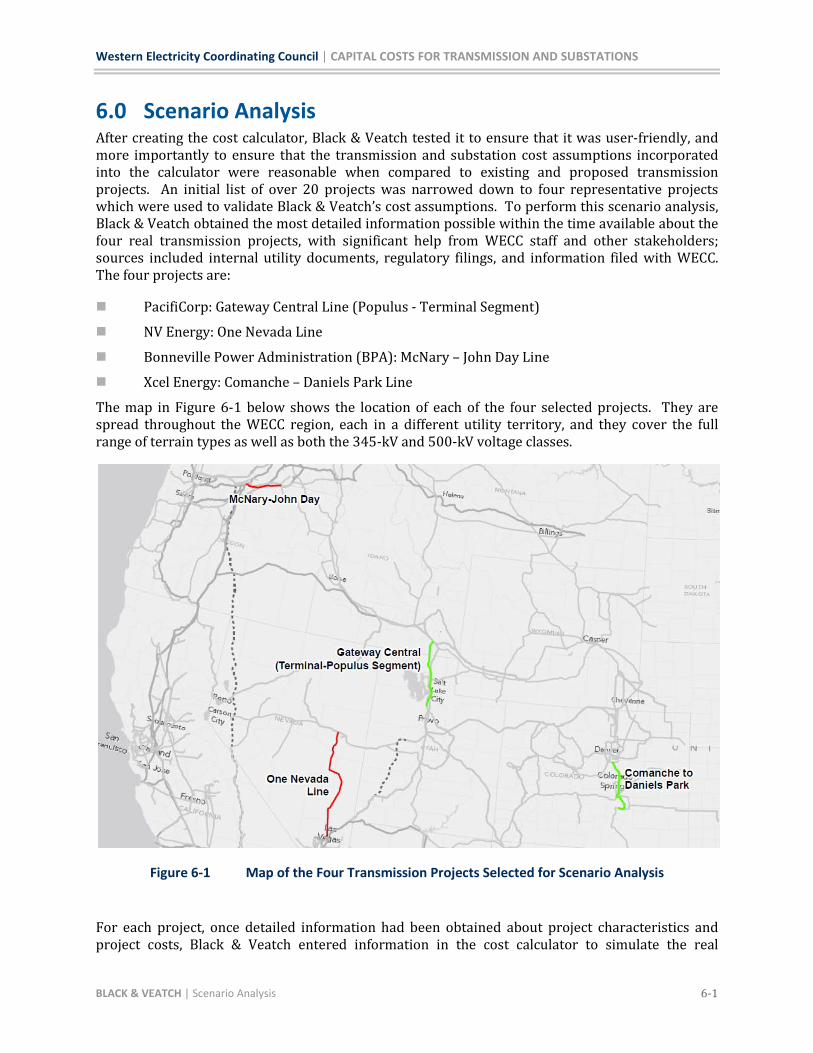
6.0 Scenario Analysis After creating the cost calculator, Black & Veatch tested it to ensure that it was user-friendly, and more importantly to ensure that the transmission and substation cost assumptions incorporated into the calculator were reasonable when compared to existing and proposed transmission projects. An initial list of over 20 projects was narrowed down to four representative projects which were used to validate Black & Veatch’s cost assumptions. To perform this scenario analysis, Black & Veatch obtained the most detailed information possible within the time available about the four real transmission projects, with significant help from WECC staff and other stakeholders; sources included internal utility documents, regulatory filings, and information filed with WECC. The four projects are:
PacifiCorp: Gateway Central Line (Populus - Terminal Segment)
NV Energy: One Nevada Line
Bonneville Power Administration (BPA): McNary – John Day Line
Xcel Energy: Comanche – Daniels Park Line
The map in Figure 6-1 below shows the location of each of the four selected projects. They are spread throughout the WECC region, each in a different utility territory, and they cover the full range of terrain types as well as both the 345-kV and 500-kV voltage classes.
Figure 6-1 Map of the Four Transmission Projects Selected for Scenario Analysis
For each project, once detailed information had been obtained about project characteristics and project costs, Black & Veatch entered information in the cost calculator to simulate the real
Western Electricity Coordinating Council | CAPITAL COSTS FOR TRANSMISSION AND SUBSTATIONS
BLACK & VEATCH | Scenario Analysis 6-2
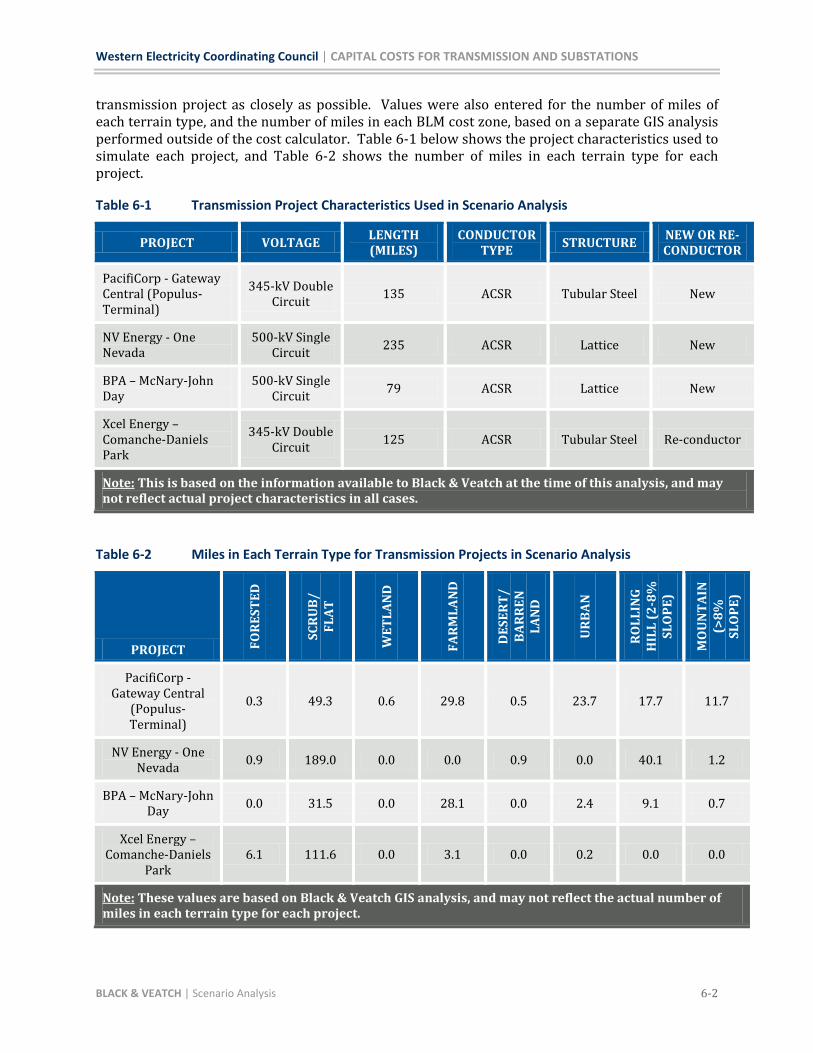
transmission project as closely as possible. Values were also entered for the number of miles of each terrain type, and the number of miles in each BLM cost zone, based on a separate GIS analysis performed outside of the cost calculator. Table 6-1 below shows the project characteristics used to simulate each project, and Table 6-2 shows the number of miles in each terrain type for each project.
Table 6-1 Transmission Project Characteristics Used in Scenario Analysis
PROJECT VOLTAGE LENGTH (MILES)
CONDUCTOR TYPE STRUCTURE NEW OR RE-
CONDUCTOR
PacifiCorp - Gateway Central (Populus-Terminal)
345-kV Double Circuit 135 ACSR Tubular Steel New
NV Energy - One Nevada
500-kV Single Circuit 235 ACSR Lattice New
BPA – McNary-John Day
500-kV Single Circuit 79 ACSR Lattice New
Xcel Energy – Comanche-Daniels Park
345-kV Double Circuit 125 ACSR Tubular Steel Re-conductor
Note:
This is based on the information available to Black & Veatch at the time of this analysis, and may not reflect actual project characteristics in all cases.
Table 6-2 Miles in Each Terrain Type for Transmission Projects in Scenario Analysis
PROJECT FOR
EST
ED
SCR
UB
/ FL
AT
WET
LAN
D
FAR
MLA
ND
DES
ERT
/ B
AR
RE
N
LAN
D
UR
BA
N
RO
LLIN
G
HIL
L (2
-8%
SL
OP
E)
MO
UN
TA
IN
(>8
%
SLO
PE)
PacifiCorp - Gateway Central
(Populus-Terminal)
0.3 49.3 0.6 29.8 0.5 23.7 17.7 11.7
NV Energy - One Nevada 0.9 189.0 0.0 0.0 0.9 0.0 40.1 1.2
BPA – McNary-John Day 0.0 31.5 0.0 28.1 0.0 2.4 9.1 0.7
Xcel Energy – Comanche-Daniels
Park 6.1 111.6 0.0 3.1 0.0 0.2 0.0 0.0
Note:
These values are based on Black & Veatch GIS analysis, and may not reflect the actual number of miles in each terrain type for each project.
Western Electricity Coordinating Council | CAPITAL COSTS FOR TRANSMISSION AND SUBSTATIONS
BLACK & VEATCH | Scenario Analysis 6-3
For each project scenario, the analysis output from the calculator was the project transmission line costs, ROW costs, substation costs, and AFUDC/overhead costs. These costs were then summed to find the total project cost, and this estimated project cost was compared to the total cost of the actual project. Black & Veatch did not attempt to match the actual project costs component-by-component (e.g. estimated right of way costs were not intended or expected to closely match actual right of way costs)—rather, Black & Veatch attempted to match the estimated total project cost to the actual total project cost. This was because for some projects cost data was not available at this detailed level, and also because projects often differ in what is included in each cost component. Thus, the total project cost was considered the key metric for testing the cost calculator.
6.1 PACIFICORP: GATEWAY CENTRAL LINE (POPULUS – TERMINAL SEGMENT) This 345-kV double circuit line segment is part of PacifiCorp’s Gateway Central project, centered in Utah, and extends from the new Populus substation in southeastern Idaho to the existing Terminal substation in the Salt Lake City area. It was completed in 2010. The most notable characteristic of this line is that it crosses a significant amount of mountainous terrain and urban and suburban terrain around Salt Lake City, which the other three lines do not. Table 6-3 shows the results of the scenario analysis.
Table 6-3 Scenario Analysis Results for PacifiCorp: Gateway Central Line
COST COMPONENT
ACTUAL COST B&V ESTIMATED COST DIFFERENCE (ACTUAL –
ESTIMATED COST)
Line Cost (including wires, poles, etc.)
$ 498,439,614 $ 443,071,335 11%
ROW Cost $ 70,183,253 $ 2,774,370 96%
Substation Cost $ 126,054,613 $ 187,689,000 - 49%
AFUDC/Overhead Cost $ 122,152,660 $ 110,868,573 9%
Total Cost $ 816,830,140 $ 744,403,278 9%
Note
: These results are not meant as a comment on the actual project costs listed; they are simply meant to provide a test of the cost calculator developed by Black & Veatch.
The estimated and actual project costs match within 9%, which indicates that the cost calculator provides a relatively close approximation of actual project costs in this case. Black & Veatch was able to obtain detailed cost information for this project, which provides more confidence in the accuracy of the estimate.
6.2 NV ENERGY: ONE NEVADA LINE This 500-kV single circuit project extends from the Robinson Summit substation in northern Nevada to the Harry Allen substation near Las Vegas in southern Nevada; its purpose is to connect the two different grids operated by NV Energy’s subsidiaries Sierra Pacific Power Company and Nevada Power Company. It is currently under construction and is expected to be completed in 2013. The most notable characteristic of this line is that it crosses land that is almost entirely
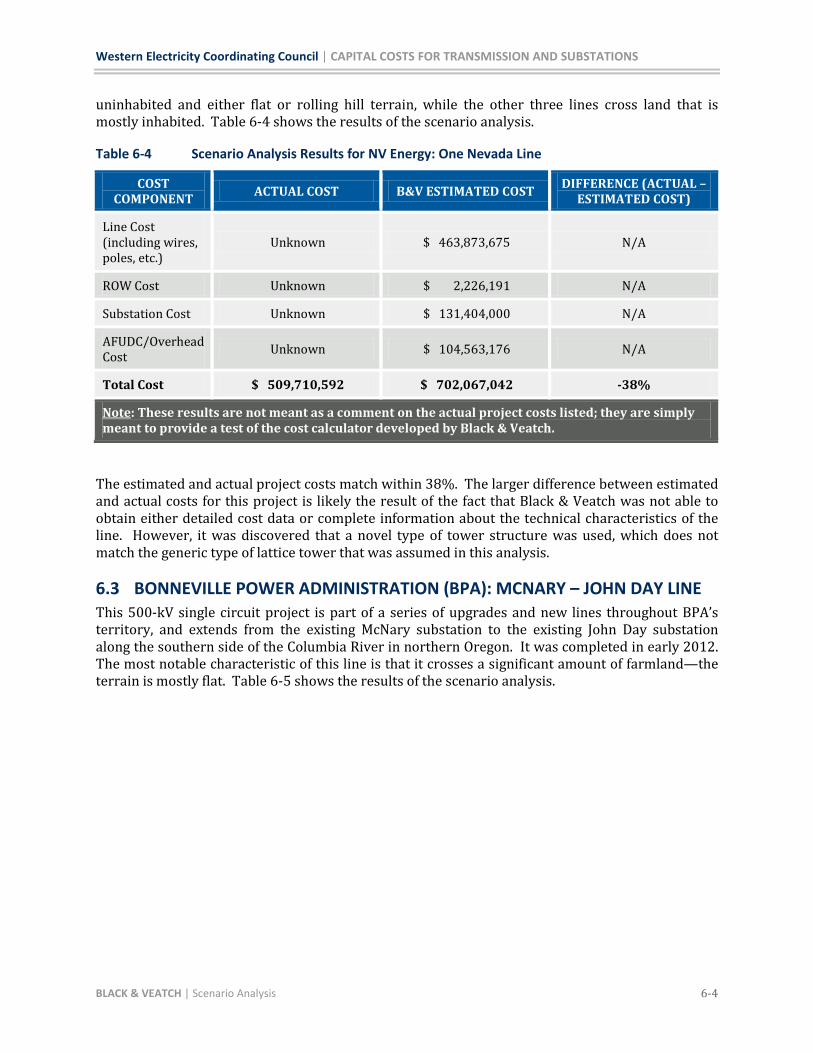
Western Electricity Coordinating Council | CAPITAL COSTS FOR TRANSMISSION AND SUBSTATIONS
BLACK & VEATCH | Scenario Analysis 6-4
uninhabited and either flat or rolling hill terrain, while the other three lines cross land that is mostly inhabited. Table 6-4 shows the results of the scenario analysis.
Table 6-4 Scenario Analysis Results for NV Energy: One Nevada Line
COST COMPONENT ACTUAL COST B&V ESTIMATED COST
DIFFERENCE (ACTUAL – ESTIMATED COST)
Line Cost (including wires, poles, etc.)
Unknown $ 463,873,675 N/A
ROW Cost Unknown $ 2,226,191 N/A
Substation Cost Unknown $ 131,404,000 N/A
AFUDC/Overhead Cost Unknown $ 104,563,176 N/A
Total Cost $ 509,710,592 $ 702,067,042 -38%
Note
: These results are not meant as a comment on the actual project costs listed; they are simply meant to provide a test of the cost calculator developed by Black & Veatch.
The estimated and actual project costs match within 38%. The larger difference between estimated and actual costs for this project is likely the result of the fact that Black & Veatch was not able to obtain either detailed cost data or complete information about the technical characteristics of the line. However, it was discovered that a novel type of tower structure was used, which does not match the generic type of lattice tower that was assumed in this analysis.
6.3 BONNEVILLE POWER ADMINISTRATION (BPA): MCNARY – JOHN DAY LINE This 500-kV single circuit project is part of a series of upgrades and new lines throughout BPA’s territory, and extends from the existing McNary substation to the existing John Day substation along the southern side of the Columbia River in northern Oregon. It was completed in early 2012. The most notable characteristic of this line is that it crosses a significant amount of farmland—the terrain is mostly flat. Table 6-5 shows the results of the scenario analysis.
Western Electricity Coordinating Council | CAPITAL COSTS FOR TRANSMISSION AND SUBSTATIONS
BLACK & VEATCH | Scenario Analysis 6-5
Table 6-5 Scenario Analysis Results for BPA: McNary – John Day Line
COST COMPONENT ACTUAL COST B&V ESTIMATED COST DIFFERENCE (ACTUAL – ESTIMATED COST)
Line Cost (including wires, poles, etc.) $126,814,842 $ 143,288,287 -13%
ROW Cost Unknown $ 265,993 N/A
Substation Cost $17,484,816 $ 14,420,000 18%
AFUDC/Overhead Cost $39,105,207 $ 27,645,499 29%
Total Cost $183,404,865 $ 185,619,780 -1%
Note
: These results are not meant as a comment on the actual project costs listed; they are simply meant to provide a test of the cost calculator developed by Black & Veatch.
The estimated and actual project costs match within 1%, which indicates that the cost calculator provides a very close approximation of actual project costs in this case. Black & Veatch was able to obtain detailed cost and technical information about the project, which provides confidence about the accuracy of the estimate.
6.4 XCEL ENERGY: COMANCHE – DANIELS PARK LINE This 345-kV double circuit project extends from the substation at the Comanche coal plant near Pueblo, CO to the Daniels Park substation in the southern part of the Denver metro area. It was completed in 2009. The most notable characteristic of this project is that it mostly consisted of re-conductoring existing lines, re-energizing them at a higher voltage, and constructing some new line parallel to existing lines on existing right of way. Table 6-6 shows the results of the scenario analysis.
Table 6-6 Scenario Analysis Results for Xcel Energy: Comanche – Daniels Park Line
COST COMPONENT ACTUAL COST B&V ESTIMATED COST
DIFFERENCE (ACTUAL – ESTIMATED COST)
Line Cost (including wires, poles, etc.)
Unknown $ 191,146,222 N/A
ROW Cost Unknown $ 1,188,954 N/A
Substation Cost Unknown $ 12,978,000 N/A
AFUDC/Overhead Cost Unknown $ 35,929,805 N/A
Total Cost $ 151,950,000 $ 241,242,982 -59%
Note
: These results are not meant as a comment on the actual project costs listed; they are simply meant to provide a test of the cost calculator developed by Black & Veatch.
Western Electricity Coordinating Council | CAPITAL COSTS FOR TRANSMISSION AND SUBSTATIONS
BLACK & VEATCH | Scenario Analysis 6-6
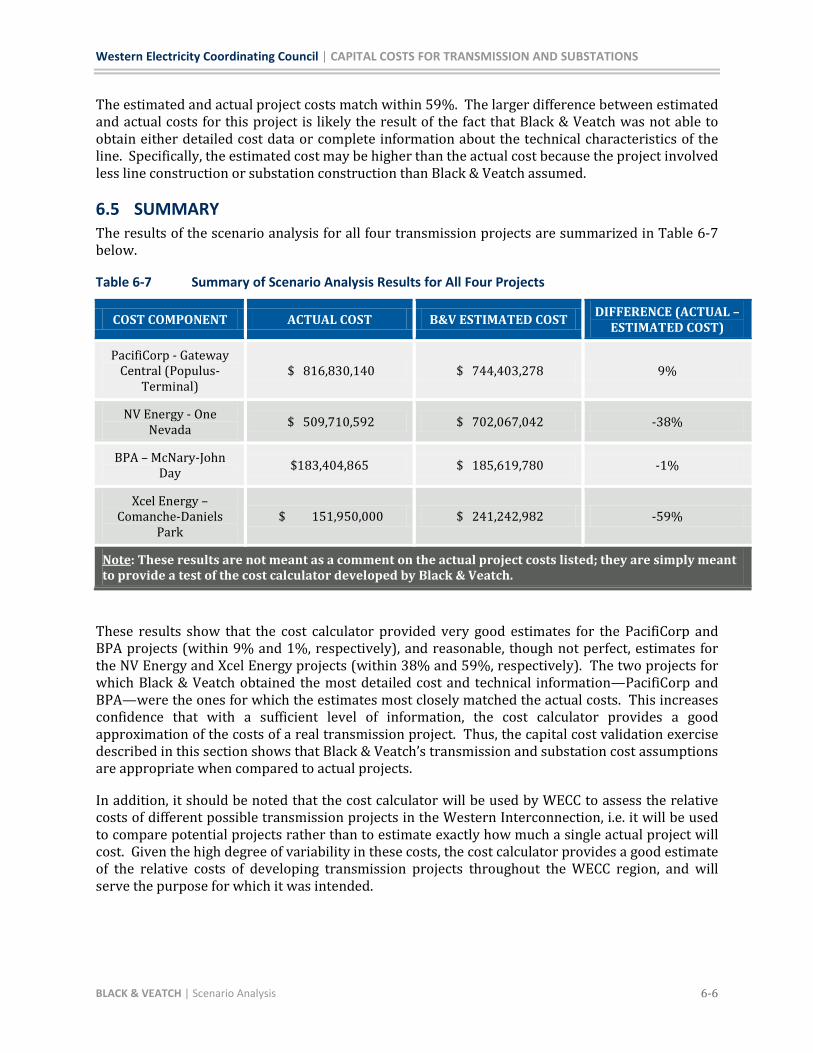
The estimated and actual project costs match within 59%. The larger difference between estimated and actual costs for this project is likely the result of the fact that Black & Veatch was not able to obtain either detailed cost data or complete information about the technical characteristics of the line. Specifically, the estimated cost may be higher than the actual cost because the project involved less line construction or substation construction than Black & Veatch assumed.
6.5 SUMMARY The results of the scenario analysis for all four transmission projects are summarized in Table 6-7 below.
Table 6-7 Summary of Scenario Analysis Results for All Four Projects
COST COMPONENT ACTUAL COST B&V ESTIMATED COST DIFFERENCE (ACTUAL –
ESTIMATED COST)
PacifiCorp - Gateway Central (Populus-
Terminal) $ 816,830,140 $ 744,403,278 9%
NV Energy - One Nevada $ 509,710,592 $ 702,067,042 -38%
BPA – McNary-John Day $183,404,865 $ 185,619,780 -1%
Xcel Energy – Comanche-Daniels
Park $ 151,950,000 $ 241,242,982 -59%
Note
: These results are not meant as a comment on the actual project costs listed; they are simply meant to provide a test of the cost calculator developed by Black & Veatch.
These results show that the cost calculator provided very good estimates for the PacifiCorp and BPA projects (within 9% and 1%, respectively), and reasonable, though not perfect, estimates for the NV Energy and Xcel Energy projects (within 38% and 59%, respectively). The two projects for which Black & Veatch obtained the most detailed cost and technical information—PacifiCorp and BPA—were the ones for which the estimates most closely matched the actual costs. This increases confidence that with a sufficient level of information, the cost calculator provides a good approximation of the costs of a real transmission project. Thus, the capital cost validation exercise described in this section shows that Black & Veatch’s transmission and substation cost assumptions are appropriate when compared to actual projects.
In addition, it should be noted that the cost calculator will be used by WECC to assess the relative costs of different possible transmission projects in the Western Interconnection, i.e. it will be used to compare potential projects rather than to estimate exactly how much a single actual project will cost. Given the high degree of variability in these costs, the cost calculator provides a good estimate of the relative costs of developing transmission projects throughout the WECC region, and will serve the purpose for which it was intended.
Western Electricity Coordinating Council | CAPITAL COSTS FOR TRANSMISSION AND SUBSTATIONS
BLACK & VEATCH | Discussion of Stakeholder Comments 7-1
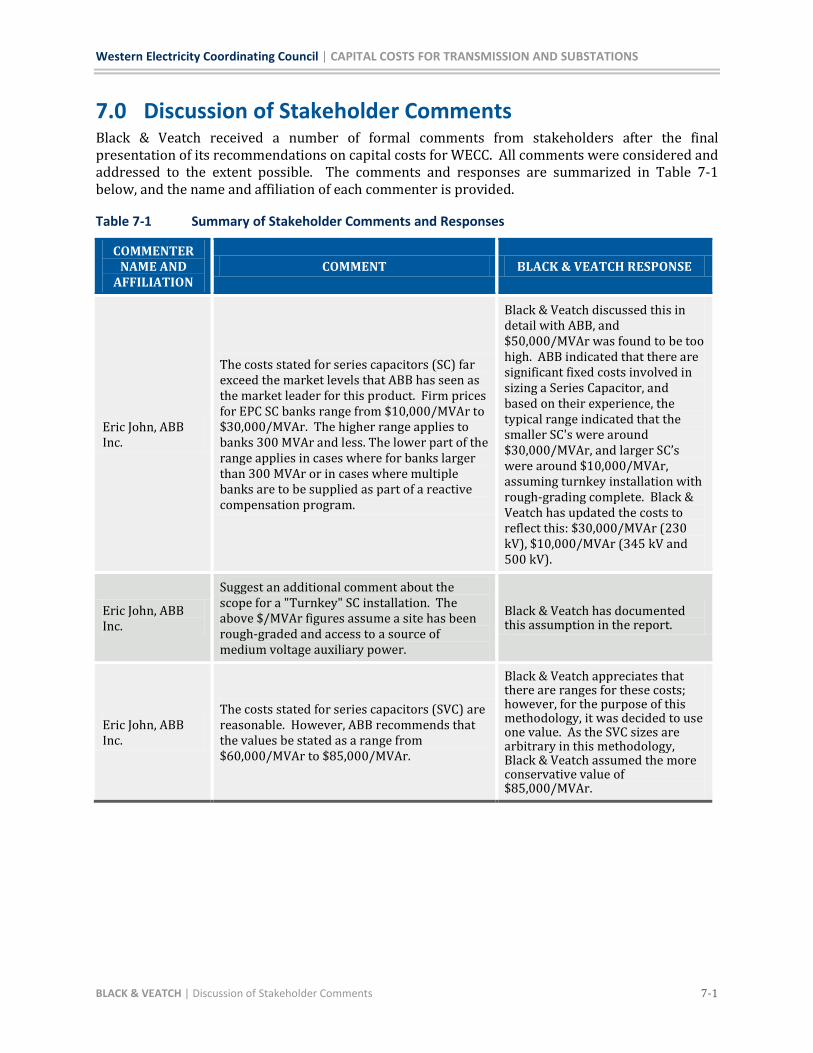
7.0 Discussion of Stakeholder Comments Black & Veatch received a number of formal comments from stakeholders after the final presentation of its recommendations on capital costs for WECC. All comments were considered and addressed to the extent possible. The comments and responses are summarized in Table 7-1 below, and the name and affiliation of each commenter is provided.
Table 7-1 Summary of Stakeholder Comments and Responses
COMMENTER NAME AND
AFFILIATION COMMENT BLACK & VEATCH RESPONSE
Eric John, ABB Inc.
The costs stated for series capacitors (SC) far exceed the market levels that ABB has seen as the market leader for this product. Firm prices for EPC SC banks range from $10,000/MVAr to $30,000/MVAr. The higher range applies to banks 300 MVAr and less. The lower part of the range applies in cases where for banks larger than 300 MVAr or in cases where multiple banks are to be supplied as part of a reactive compensation program.
Black & Veatch discussed this in detail with ABB, and $50,000/MVAr was found to be too high. ABB indicated that there are significant fixed costs involved in sizing a Series Capacitor, and based on their experience, the typical range indicated that the smaller SC's were around $30,000/MVAr, and larger SC’s were around $10,000/MVAr, assuming turnkey installation with rough-grading complete. Black & Veatch has updated the costs to reflect this: $30,000/MVAr (230 kV), $10,000/MVAr (345 kV and 500 kV).
Eric John, ABB Inc.
Suggest an additional comment about the scope for a "Turnkey" SC installation. The above $/MVAr figures assume a site has been rough-graded and access to a source of medium voltage auxiliary power.
Black & Veatch has documented this assumption in the report.
Eric John, ABB Inc.
The costs stated for series capacitors (SVC) are reasonable. However, ABB recommends that the values be stated as a range from $60,000/MVAr to $85,000/MVAr.
Black & Veatch appreciates that there are ranges for these costs; however, for the purpose of this methodology, it was decided to use one value. As the SVC sizes are arbitrary in this methodology, Black & Veatch assumed the more conservative value of $85,000/MVAr.
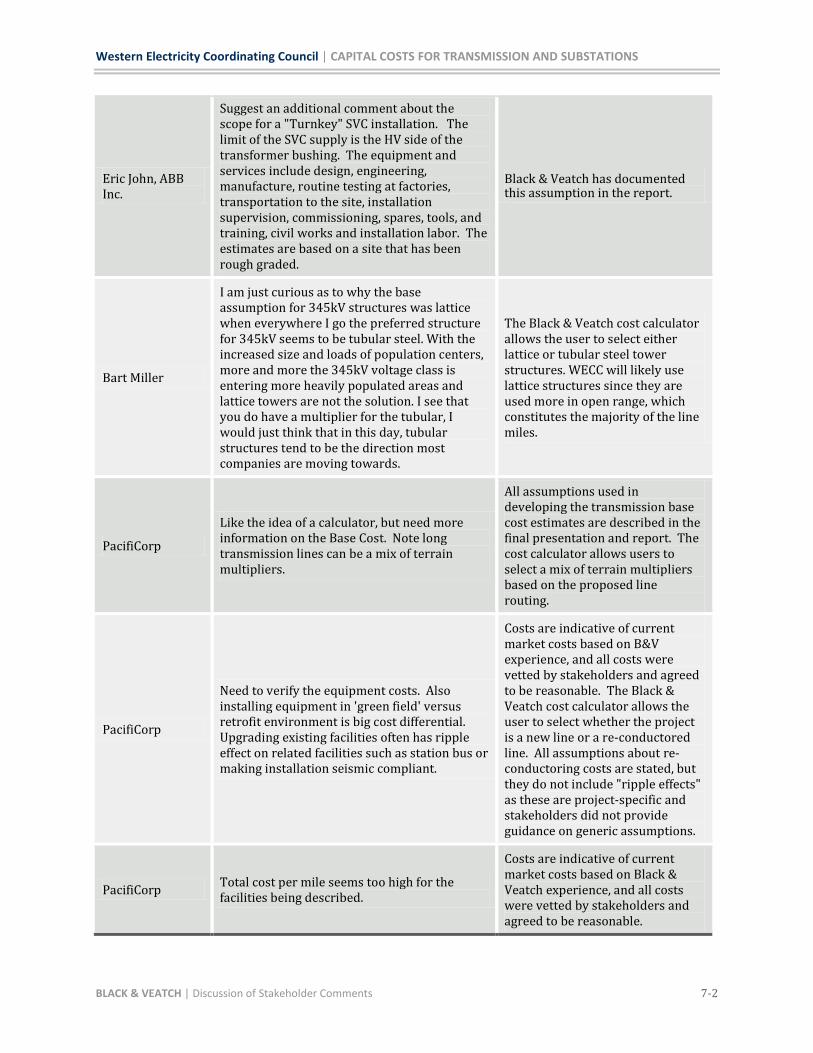
Western Electricity Coordinating Council | CAPITAL COSTS FOR TRANSMISSION AND SUBSTATIONS
BLACK & VEATCH | Discussion of Stakeholder Comments 7-2
Eric John, ABB Inc.
Suggest an additional comment about the scope for a "Turnkey" SVC installation. The limit of the SVC supply is the HV side of the transformer bushing. The equipment and services include design, engineering, manufacture, routine testing at factories, transportation to the site, installation supervision, commissioning, spares, tools, and training, civil works and installation labor. The estimates are based on a site that has been rough graded.
Black & Veatch has documented this assumption in the report.
Bart Miller
I am just curious as to why the base assumption for 345kV structures was lattice when everywhere I go the preferred structure for 345kV seems to be tubular steel. With the increased size and loads of population centers, more and more the 345kV voltage class is entering more heavily populated areas and lattice towers are not the solution. I see that you do have a multiplier for the tubular, I would just think that in this day, tubular structures tend to be the direction most companies are moving towards.
The Black & Veatch cost calculator allows the user to select either lattice or tubular steel tower structures. WECC will likely use lattice structures since they are used more in open range, which constitutes the majority of the line miles.
PacifiCorp
Like the idea of a calculator, but need more information on the Base Cost. Note long transmission lines can be a mix of terrain multipliers.
All assumptions used in developing the transmission base cost estimates are described in the final presentation and report. The cost calculator allows users to select a mix of terrain multipliers based on the proposed line routing.
PacifiCorp
Need to verify the equipment costs. Also installing equipment in 'green field' versus retrofit environment is big cost differential. Upgrading existing facilities often has ripple effect on related facilities such as station bus or making installation seismic compliant.
Costs are indicative of current market costs based on B&V experience, and all costs were vetted by stakeholders and agreed to be reasonable. The Black & Veatch cost calculator allows the user to select whether the project is a new line or a re-conductored line. All assumptions about re-conductoring costs are stated, but they do not include "ripple effects" as these are project-specific and stakeholders did not provide guidance on generic assumptions.
PacifiCorp Total cost per mile seems too high for the facilities being described.
Costs are indicative of current market costs based on Black & Veatch experience, and all costs were vetted by stakeholders and agreed to be reasonable.
Western Electricity Coordinating Council | CAPITAL COSTS FOR TRANSMISSION AND SUBSTATIONS
BLACK & VEATCH | Discussion of Stakeholder Comments 7-3
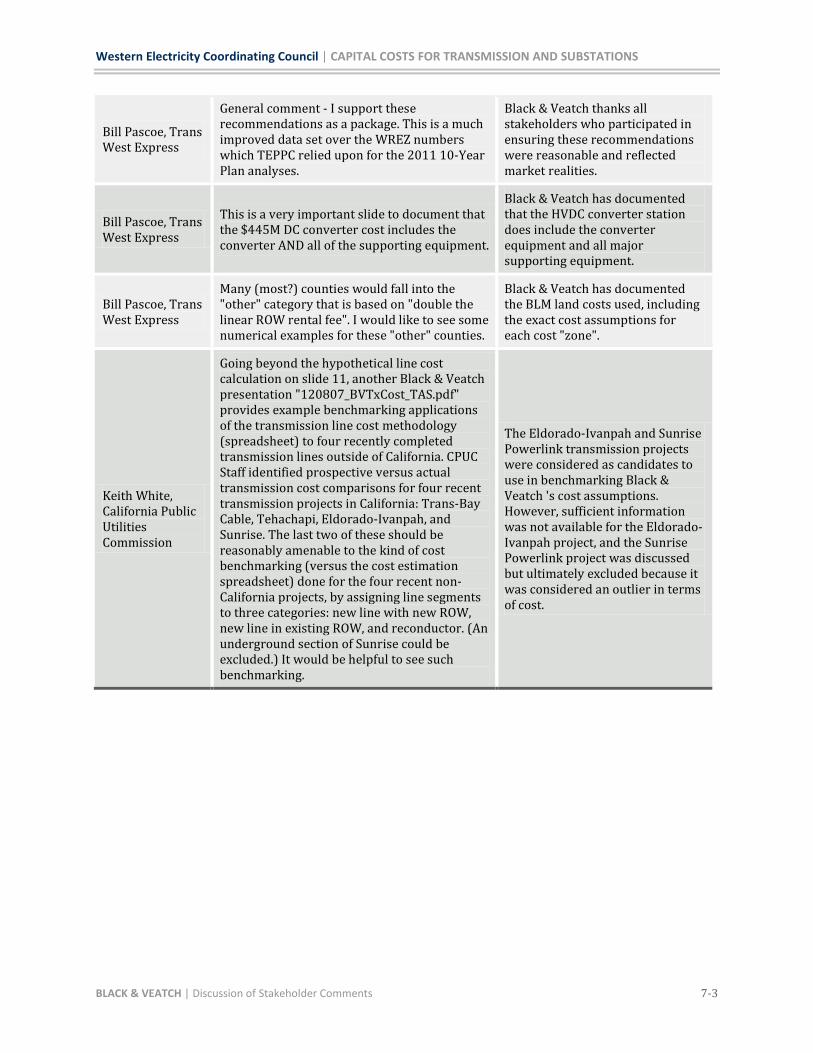
Bill Pascoe, Trans West Express
General comment - I support these recommendations as a package. This is a much improved data set over the WREZ numbers which TEPPC relied upon for the 2011 10-Year Plan analyses.
Black & Veatch thanks all stakeholders who participated in ensuring these recommendations were reasonable and reflected market realities.
Bill Pascoe, Trans West Express
This is a very important slide to document that the $445M DC converter cost includes the converter AND all of the supporting equipment.
Black & Veatch has documented that the HVDC converter station does include the converter equipment and all major supporting equipment.
Bill Pascoe, Trans West Express
Many (most?) counties would fall into the "other" category that is based on "double the linear ROW rental fee". I would like to see some numerical examples for these "other" counties.
Black & Veatch has documented the BLM land costs used, including the exact cost assumptions for each cost "zone".
Keith White, California Public Utilities Commission
Going beyond the hypothetical line cost calculation on slide 11, another Black & Veatch presentation "120807_BVTxCost_TAS.pdf" provides example benchmarking applications of the transmission line cost methodology (spreadsheet) to four recently completed transmission lines outside of California. CPUC Staff identified prospective versus actual transmission cost comparisons for four recent transmission projects in California: Trans-Bay Cable, Tehachapi, Eldorado-Ivanpah, and Sunrise. The last two of these should be reasonably amenable to the kind of cost benchmarking (versus the cost estimation spreadsheet) done for the four recent non-California projects, by assigning line segments to three categories: new line with new ROW, new line in existing ROW, and reconductor. (An underground section of Sunrise could be excluded.) It would be helpful to see such benchmarking.
The Eldorado-Ivanpah and Sunrise Powerlink transmission projects were considered as candidates to use in benchmarking Black & Veatch 's cost assumptions. However, sufficient information was not available for the Eldorado-Ivanpah project, and the Sunrise Powerlink project was discussed but ultimately excluded because it was considered an outlier in terms of cost.
Western Electricity Coordinating Council | CAPITAL COSTS FOR TRANSMISSION AND SUBSTATIONS
BLACK & VEATCH | Discussion of Stakeholder Comments 7-4
Keith White, California Public Utilities Commission
It should be explicitly and prominently stated that these are base substation costs for the most straightforward circumstances including flat terrain without access challenges, and without needing to design for subsequent needs. For example, a 500 kV substation under construction in California in large part to support new wind generation in a hilly area, having two 500 kV, one 230 kV and one 138 KV lines, mostly breaker-and-a-half design (with additional breakers for possible future needs) and four 500 kV shunt reactors, has a publicly estimated cost of about $150-200M excluding contingency and AFUDC, whereas the standard per unit cost factors from slide 13 would give less than half this cost, even when very conservatively multiplying the "per line/XFMR Position" costs by a factor of three to account for the additional breakers included for subsequent needs.
Black & Veatch has documented all assumptions related to the base substation costs, including the fact that they apply to substations sited on flat terrain with easy access.
Keith White, California Public Utilities Commission
Generally, it will be important to attach reasonable uncertainty ranges to major infrastructure investment costs. Useful long-term planning studies will need to find some way to communicate risks and opportunities (option values), not just mid-point estimates.
Black & Veatch was asked to provide single "mid-point estimates" for all costs rather than uncertainty ranges. Uncertainty ranges could be generated by selecting different values and adjusting various parameters within the cost calculator if desired.