final project report wecc wind generator development · final project report wecc wind generator...
TRANSCRIPT
FINAL PROJECT REPORT
WECC WIND GENERATOR DEVELOPMENT
Appendix V MODEL VALIDATION OF
WIND TURBINE GENERATOR
Prepared for CIEE By:
National Renewable Energy Laboratory
A CIEE Report

- i -

- ii -
Acknowledgments
This work is part of a larger project called WECC Wind Generator Modeling. The support of
the U.S. Department of Energy, the Western Electric Coordinating Council, and the California
Energy Commissionʹs PIER Program are gratefully acknowledged.
The author expresses his gratitude to the members WECC WGMG and MVWG, General
Electric, and Siemens PTI who have been instrumental in providing technical support and
reviews, and, in particular to Dr. Abraham Ellis of Sandia National Laboratory, who works with
us on this project as the Chair of WECC‐WGMG, and continuously provides technical guidance
during the development of this project.

‐ iii ‐
‐ iv ‐
Table of Contents
Abstract and Keywords .................................................................................................................... .v
Executive Summary ........................................................................................................................... .1
1.0 Introduction and Scope ...................................................................................................... .4
2.0 Background .......................................................................................................................... .6
3.0 Wind Turbine Dynamic Model ......................................................................................... .8
3.1. Type 1 – Induction Generator ....................................................................................... .8
3.2. Type 2 – Wound Rotor Induction Generator with Adjustable External Rotor
Resistance. ....................................................................................................................... 10
3.3. Type 3 – Variable Speed Wind Turbine Generator with Doubly Fed Induction
Generator ......................................................................................................................... 9
3.4. Type 4 – Variable Speed Wind Turbine Generator with Full Conversion
Power Converter ............................................................................................................ 10
4.0 Wind Power Plant Representation .................................................................................... 11
4.1. Single‐Machine Equivalent Representation ............................................................... 12
4.2. Representation of Wind Turbine Dynamic Model .................................................... 13
4.3. Representation Wind Turbine Equivalent Rating ..................................................... 14
4.4. Representation of Wind Turbine and Wind Plant Voltage Controller ................... 14
4.5. Remote voltage definition: ............................................................................................ 17
5.0 Wind Power Plant Model Validation ............................................................................... 23
5.1. Network and disturbance representation ................................................................... 23
5.2. Data for the Simulation ................................................................................................. 24
5.3. Measured data ................................................................................................................ 24
5.4. Equivalent circuit of the network ................................................................................ 27
5.5. Dynamic data .................................................................................................................. 28
5.6. Event representation ...................................................................................................... 29
6.0 Simulation Results ............................................................................................................... 30
6.1. Dynamic Simulation ...................................................................................................... 30
6.2. Comparison of simulation response and measurements ......................................... 31
7.0 Summary .............................................................................................................................. 33
References ........................................................................................................................................... 34
Glossary ............................................................................................................................................... 35
‐ v ‐
List of Figures
Figure 1. Four types of wind turbine generator models ....................................................................... 8
Figure 2. Physical diagram of a typical wind power plant. ............................................................... 12
Figure 3. Single‐machine equivalent power flow representation for a WPP. ................................. 13
Figure 4. Block diagram of converter control model with different settings .................................. 16
Figure 5. Simplified single line diagram describing voltage control at a remote node ................. 18
Figure 6. Type 3 WTG pitch control ...................................................................................................... 19
Figure 7. Type 3 WTG turbine model with one‐mass model ............................................................. 19
Figure 8. Pitch angle versus wind speed initialization ....................................................................... 19
Figure 9. Simplified single‐line diagram of the WPP network .......................................................... 22
Figure 10. Phase‐voltage wave form during fault event .................................................................... 23
Figure 11. Input (voltage and frequency) and output (real and reactive power) of the
dynamic simulation ......................................................................................................................... 25
Figure 12. Single‐machine equivalent representation for reference WPP ........................................ 27
Figure 13. Block diagram of WECC generic DFIG model .................................................................. 27
Figure 14. The WPP is represented by a two turbine representation ............................................... 28
Figure 15. The control block diagram for the system being validated ............................................. 29
Figure 17. Reactive Power Comparison ................................................................................................ 30
Figure 18. Simplified diagram of full system representation of the WPP ........................................ 31
Figure 19. Terminal voltage of different WTGs and the voltage at the POI .................................... 31

‐ vi ‐
Abstract and Keywords
For the most part, wind turbine generator (WTG) manufacturers have sponsored the
development of WTG dynamic models. Models developed under this paradigm tend to be
proprietary and manufacturer‐specific. The models are often disclosed under confidential terms
for interconnection studies and design of individual projects. However, the use of proprietary
models to represent installed wind power plants is incompatible with critical grid planning
activities that are conducted by regional reliability organizations as a collaborative effort among
many stakeholders. In this context, the use of generic or simplified models is desirable.
To address this industry need, the Western Electricity Coordinating Council (WECC) has
embarked on the development of generic positive sequence WTG models for large‐scale power
system transient stability analysis. As an integral part of this WECC activity, the National
Renewable Energy Laboratory (NREL) is engaged in this model validation effort.
The dynamic models developed are sometimes referred to as “generic” WECC models because
of the non‐proprietary nature of these models. The objective of this report was to provide a
methodology for validating dynamic models of wind turbine generators for power system
studies. This report discusses the process of model validation against field measurements. The
procedure is illustrated with a specific example.
Keywords: Dynamic model, power system, renewable energy, variable‐speed
generation, weak grid, wind energy, wind farm, wind power plant, wind turbine, wind
integration, systems integration, WECC, wind turbine model, validation.
‐ 1 ‐
Executive Summary
Within the next 3 – 5 years, it is expected that a large amount of wind capacity will be added to
the power system. The size of individual turbines has increased dramatically from a mere
several hundred kilowatts to multi megawatt turbines. The size of individual wind power
plants has also increased significantly. In the past, a typical wind power plant consisted of
several turbines. Today, wind power plant ratings can be as high as 300 MW or more. By some
projections, as much as 20 GW of additional wind generation capacity may be added in the
Western Electricity Coordinating Council (WECC) footprint within the next 10 – 15 years. The
increase in the level of penetration of renewable energy generation in the WECC region, and
California in particular (20% by 2010), poses significant questions concerning the ability of the
power system to maintain reliable operation.
While the use of induction generators or negative loads to represent wind power plants has
been acceptable in the past (during the era of low wind penetration), the increased use of this
energy source necessitates a more accurate representation of a modern wind turbine.
Misrepresentation of a wind power plant in a dynamic model may lead the transmission
planners to erroneous conclusions.
The Wind Generation Modeling Group (WGMG) has initiated and will complete the research
and development of standard wind turbine models of four different types of wind turbines.
These four types of turbines currently hold the largest market share in the North American
region. WECC is interested in providing accurate and validated models of standard wind
turbines that will be made available in their database, including the data sets to be used for
testing the models, and the methods of representing a wind power plant in power system
studies. These goals will be accomplished through the development and validation of standard
models, development of an equivalent method for an array of wind generators, and
recommended practices for modeling a wind power plant. The WECC models will be generic
in nature, that is, they do not require nor reveal proprietary data from the turbine
manufacturers.
These improved standard (generic, non‐proprietary) dynamic models enable planners,
operators and engineers to design real time controls or Remedial Action Schemes (RAS) that
take into account the capability of modern wind turbines (for example, dynamic, variable,
reactive power compensation, dynamic generation shedding capability, and soft‐
synchronization with the grid) to avoid threats to reliability associated with the operation of a
significant amount of wind energy systems. In addition, researchers at universities and national
laboratories will have access to wind turbine models, and will be able to conduct research
without the need to provide for non‐disclosure agreements from turbine manufacturers.
With the tasks proposed, planners could more accurately study transmission congestion or
other major grid operating constraints, either from a real time grid operation or transmission
planning perspective. These models could be used by transmission planners in expanding the
capacity of existing transmission facilities to accommodate wind energy development in a
manner that benefits electricity consumers.

‐ 2 ‐
Failure to address this modeling problem either increases the risk to California’s electricity
supply, grid instabilities and outages or reduced amounts of power that can be imported into
and transported within California and the region within the WECC footprint.
Wind Turbine Model Validation is one of the final reports for the Wind Generator Development
Project, contract number #500‐02‐004, work authorization number MR‐065, a project sponsored
by Western Electric Coordinating Council – Wind Generator Modeling Group, California
Energy Commission, and National Renewable Energy Laboratory.

‐ 3 ‐
1.0 Introduction and Scope Modern wind turbine generators (WTGs) utilize power electronics and state‐of‐the‐art real and
reactive power controls that allow wind power plants to have much better steady‐state and
dynamic performance compared to wind power plants of the past. For reliability and cost
reasons, it is very important to properly represent steady and dynamic characteristics in large‐
scale positive‐sequence simulations. For the most part, the development of WTG positive‐
sequence dynamic models has been sponsored by WTG manufacturers. Simulation models
developed under this paradigm tend to be proprietary and manufacturer‐specific.
The models are often disclosed under confidential terms for interconnection studies and design
of individual projects. However, the use of proprietary and manufacturer‐specific models to
represent installed wind power plants is incompatible with critical grid planning activities that
are conducted by regional reliability organizations as a collaborative effort among many
stakeholders. In this context, the use of generic or simplified models is desirable.
To address this industry need, the Wind Generation Modeling Group (WGMG) of the Western
Electricity Coordinating Council (WECC) has embarked on the development of generic
positive‐sequence WTG models for large‐scale power system transient stability analysis. This
effort is based on the premise that it is technically feasible to develop a generic model for each
of the four basic WTG configurations that are currently in use: 1) squirrel‐cage induction
generator, 2) wound‐rotor induction generator with adjustable rotor resistance, 3) doubly fed
asynchronous generator (DFAG), also known as doubly fed induction generator (DFIG), and 4)
a full‐power conversion wind turbine generator. Although additional work is required to
achieve the stated goals, substantial progress has been made. As an integral part of this WCC
WGMG activity, the National Renewable Energy Laboratory (NREL) is engaged in an extensive
model validation project aimed at testing the models against field measurements and refining
the WECC generic models as needed.
The dynamic model developed by WECC is referred to as a generic WECC model with the
understanding that the model does not contain proprietary information specific to any turbine
manufacturers. To simulate a particular turbine from a turbine manufacturer, this generic
model requires non‐proprietary input data that is available from the WECC database or from
the turbine manufacturer.
The validation of the dynamic model is intended to examine if the model produces the same
characteristics of the actual wind turbine. The best scenario is to compare field measurements
taken during transient events to the response of the dynamic model to the same events
performed by simulation. However, field data is not easy to access. The next best scenario is to
use the detailed model (including all the proprietary information) developed by the wind
turbine manufacturers as the baseline turbine. The detailed model is usually validated with
field data (in some cases, considered to be proprietary by the turbine manufacturers).
The scope of this document is focused on the methodology of wind turbine model validation.
The method of validation can be applied to different types of generators, however, in this report
‐ 4 ‐
the type 3 wind turbine generator model validation is presented based on data measurements
taken at the New Mexico Wind Energy Center. This report is organized as follows:
Section 1 – Introduction and Scope
o Section 1 is devoted to the introduction and project scope.
Section 2 – Background
o This section provides historical background and the requirement for a generic
dynamic model of a wind turbine generator.
Section 3 – Wind Turbine Dynamic Model
o In this section, the general discussion of wind turbine dynamic model is
presented. The four types of generic models are also discussed. The detail of the
model is not presented, but there are many other publications available in the
public domain to describe each individual wind turbines.
Section 4 – Wind Power Plant Representation
o This section describes the wind power plant in the context of modern wind
turbine technology, with a particular emphasis on electrical characteristics. The
difference between a conventional power plant and wind power plant are
described. Single‐machine equivalent representation, representation of the
dynamic model, wind turbine equivalent rating, voltage controller, and pitch
control are presented in this section.
Section 5 – Wind Power Plant Model Validation
o The method to represent the network and the disturbance are presented. The
comparison between the simulation and measurement will be discussed in detail.
The measured raw data is processed before it is used in the simulation.
Equivalent circuit, dynamic data, and event representation are described in this
section.
Section 6 – Simulation Results
o In this section, the comparison between the simulation results and the field
measurements is presented. Both a single turbine representation and the
complete (136 turbines) representation are discussed.
Section 7 – Summary
o This section summarizes the model validation methodology for the wind turbine
generator.
‐ 5 ‐
2.0 Background
Initially, the size of wind power plants was small compared to conventional power plants. The
process of integrating wind power plants into the power system grid was accomplished by
representing the wind power plant as an induction generator or as a negative load. This
representation works fine as long as the size of the wind power plant is relatively small
compared to the short circuit capability at the point of interconnection (POI). However, wind
power development in the mid nineties started to see a phenomenal increase in quantity.
Numerous wind power plants were built one after another within a short time. The size of the
wind power plant started to grow from small sizes (under 50 MW to 600 MW). The impact of
wind power plants can no longer be ignored. New wind turbine types were developed, and
power electronics were added to improve the control of the wind turbines.
As a consequence of the large influx of wind energy into the power grid, and the new type of
generators that were introduced to the generation mix, a lot of efforts were geared toward
improving planning tools to help wind energy to integrate into the power system network.
Turbine manufacturers, utilities, system operators (e.g., ERCOT) developed dynamic models of
wind turbine generators. Many of the manufacturers developed models using their own
software for their turbines. Most of the turbine models available at that time contained
proprietary data and information, and many users had to sign a non‐disclosure agreement
(NDA) to use the dynamic models.
In June 2005, WECC convened the Wind Generator Modeling Group (WGMG) under the
auspices of the WECC Modeling and Validation Work Group (MVWG) to develop a set of
generic, non‐proprietary wind generator models suitable for positive‐sequence dynamic
simulations. It was envisioned that four standard models are required to represent the basic
types wind turbine generator technologies available in the market: conventional induction
machines, wound rotor induction machines with variable rotor resistance, doubly‐fed induction
machines, and full converter machines. Although the standard models are being developed for
use in the WECC, it is anticipated that the models will be embraced as the industry standard.
The WECC Wind Turbine Dynamic Model of four different wind turbine types represents the
wind turbine types with the major market share in the United States. These wind turbine
models were written to work with two major software platforms used by the majority of
utilities in the United States. The model is simplified to make it possible that the manufacturers
do not have to reveal their proprietary information, yet this model is accurate enough to
simulate real wind turbines. The objective was to provide a model to the general public without
the need for non‐disclosure agreements between the user and the turbine manufacturers.
WGMG has defined the technical requirements of standard models. There is strong consensus
within WGMG and externally that the following functional specifications are reasonable.
Additional specifications were developed by WGMG consensus, as required.

‐ 6 ‐
The models should be suitable for implementation in positive‐sequence power system
simulation programs such as PSLF and PSS/E, and should be consistent with existing
models for other rotating machine generators in terms of accuracy, complexity, and
numerical stability.
The models should be suitable for assessing, on a preliminary basis, voltage ride‐
through and reactive compensation requirements. As with any other power system
component, additional studies using a more detailed system representation and higher‐
order models may be required to refine the results of planning studies.
The generic models should reproduce wind‐turbine generator performance reasonably
well in the range of 0 (DC) to 6 Hz, and in response to electrical disturbances such as
close‐in and remote electrical system faults, assuming constant wind speed during the
transient stability simulation.
The models should correctly reflect performance differences with respect to a range of
initial wind speed assumptions (cut‐in to rated output). However, since traditional
transient stability simulations are concerned with performance over short periods of
time, wind speed can be considered constant during the simulation.
‐ 7 ‐
3.0 Wind Turbine Dynamic Model Dynamic models are very important in modern power system studies. A few percent of design
error could cost millions of dollars and/or compromise reliability. Overly pessimistic models
will slow down the development of wind energy and cause unnecessary additional supporting
infrastructure at potentially significant cost. On the other hand, overly optimistic models may
produce wrong conclusions, resulting in inadequate infrastructures to support wind generation.
Any reliability issues can cause service disruptions or blackouts, which cost millions of dollars
to the customers who were affected, the utilities for not producing power, and to workers’ loss
of time for not being productive. Different aspects of dynamic simulation studies can be found
in the references [3‐5].
The use of wind turbine dynamic models in power system studies includes the following:
Transmission planners, operators, wind plant developers, turbine manufacturers, utility
engineers, researchers, and consultants use dynamic models to study the dynamic
behavior of power system.
To study the impact of the wind turbine generator (WTG) on the power system and vice
versa (i.e., to keep voltage and frequency as stable as possible for customers connected
to the grid).
To study the impact of expansion, reduction, and outages in areas such as the
transmission line, transformer, switch gear, generator, new wind power plant,
repowering or resizing wind plants, and additional reactive compensation.
To study the reliability of a power system during transient events such as loss of line,
loss of load, short circuits, loss of generation, loss of wind, and voltage ride through of
generators, etc.
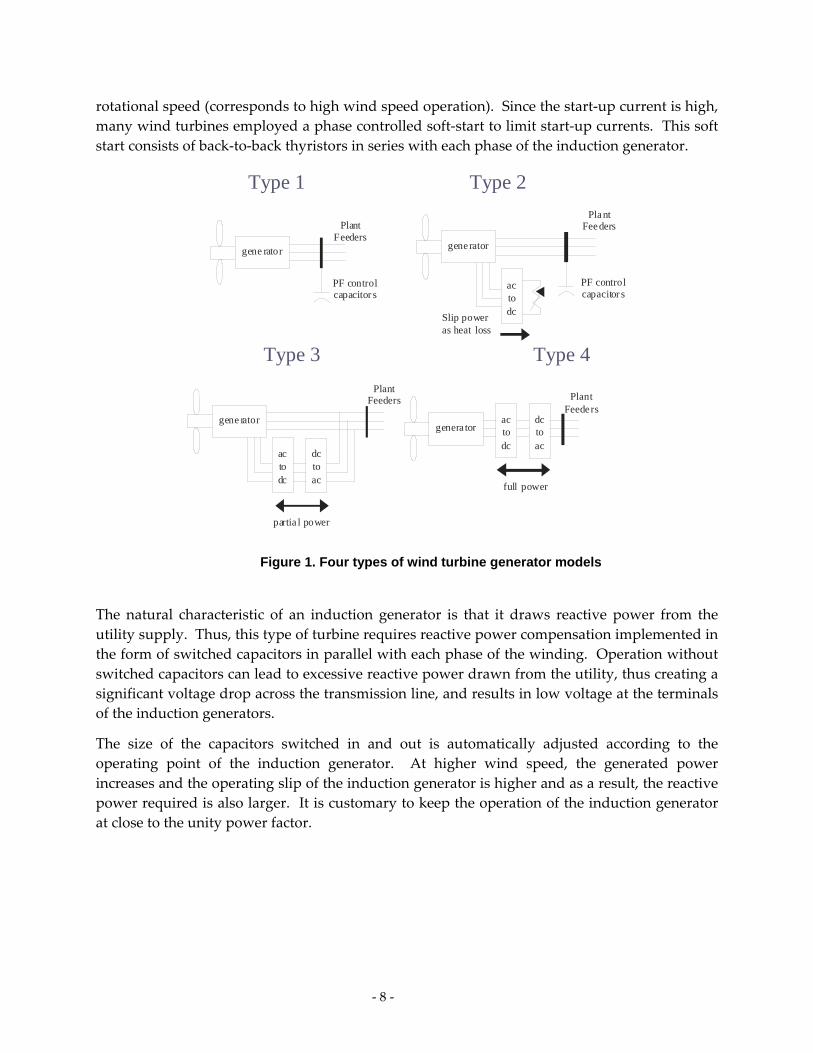
There are four types of wind turbines that are currently used for wind power plants. In the
future, new wind turbine types may become available. The four types of wind turbine models
are shown in Figure 1.
3.1. Type 1 – Induction Generator
Wind turbine type 1 is one of the oldest technologies used in wind turbine generators. It
consists of an induction generator connected to the rotor blades via a gearbox. This type of
turbine is very rugged and very simple in its construction. The induction generator used in
most of the turbines is usually type A or type B, operating in a low slip range between 0 ‐ 1%.
Many turbines use dual‐speed induction generators where two sets of windings are used within
the same stator frame. The first set is designed to operate in a low rotational speed
(corresponds to low wind speed operation), and the second set is designed to operate in a high
‐ 8 ‐
rotational speed (corresponds to high wind speed operation). Since the start‐up current is high,
many wind turbines employed a phase controlled soft‐start to limit start‐up currents. This soft
start consists of back‐to‐back thyristors in series with each phase of the induction generator.
genera tor
full power
PlantFeeders
actodc
dctoac
gene rator
partia l power
PlantFeeders
actodc
dctoac
generator
Slip poweras heat loss
PlantFeeders
PF controlcapacitor s
actodc
gene rator
PlantFeeders
PF controlcapacitor s
Type 1 Type 2
Type 3 Type 4
Figure 1. Four types of wind turbine generator models
The natural characteristic of an induction generator is that it draws reactive power from the
utility supply. Thus, this type of turbine requires reactive power compensation implemented in
the form of switched capacitors in parallel with each phase of the winding. Operation without
switched capacitors can lead to excessive reactive power drawn from the utility, thus creating a
significant voltage drop across the transmission line, and results in low voltage at the terminals
of the induction generators.
The size of the capacitors switched in and out is automatically adjusted according to the
operating point of the induction generator. At higher wind speed, the generated power
increases and the operating slip of the induction generator is higher and as a result, the reactive
power required is also larger. It is customary to keep the operation of the induction generator
at close to the unity power factor.

‐ 9 ‐
3.2. Type 2 – Wound Rotor Induction Generator with Adjustable External Rotor Resistance.
Wind turbine type 2 is a wound rotor induction generator with adjustable external resistors.
The adjustable external resistor is implemented by a combination of external (three phase)
resistors connected in parallel with power electronics circuit (diode‐bridge and DC chopper).
Both the resistors and the power electronics circuit are connected to the rotor winding. To
adjust the effective values of the external rotor resistance, the duty ratio of the DC chopper.
The wind turbine starts to generate when the rotor speed is above synchronous speed. As the
wind speed increases, the input aerodynamic power increases, the rotor slip increases, and the
electrical output power increases. In this region (P < P rated), the external rotor resistors are
short circuited (duty ratio =1). Once the output power reaches its rated output, the external
rotor resistance is adjusted to keep the output of the turbine constant. This is done by keeping
the effective total rotor resistance constant at the value of R2/sliprated.
R2total = R2 + R2ext
R2total/slip = R2/sliprated
To keep the rotor speed from run‐away conditions and to reduce the mechanical loads on the
blades and the turbine structures, the aerodynamic power is also controlled by controlling the
pitch angle of the blades in the high wind speed regions. The blade pitch is controlled to keep
the rotor speed below its maximum speed (up to 10% slip above synchronous speed).
3.3. Type 3 – Variable Speed Wind Turbine Generator with Doubly Fed Induction Generator
Wind turbine type 3 is a variable speed wind turbine generator employing a wound rotor
induction generator. It is usually design to operate at + 30% slip. A variable frequency power
converter is connected to the rotor winding. The power converter is ac‐dc‐ac system. The
power converter connected to the rotor winding is a variable frequency three‐phase power
converter, and the power converter connected to the line is a 60‐Hz power converter. The
power converter is usually the current‐regulated pulse‐width modulation (CRPWM) type. The
size of the power converter is smaller than the rating of the induction generator because it is
designed only to carry the slip‐power. Thus, for operation of 30% slips, the size of the power
converter is about 30% of the rating of the induction generator. A larger operating slip range is
possible, however, larger slip operation requires a larger power converter (added cost, reduced
efficiency, etc). Below synchronous speed, the rotor power flows from the line to the rotor
winding, and above synchronous speed, the rotor power flows from the rotor winding to the
lines.

‐ 10 ‐
The wind turbine is usually controlled to generate optimum aerodynamic power for low wind
speed up to rated wind speed. Above rated wind speed, the pitch controller adjusts the pitch
angle to limit the aerodynamic power, thus, the rotor speed is limited.
3.4. Type 4 – Variable Speed Wind Turbine Generator with Full Conversion Power Converter
Wind turbine type 4 is a variable‐speed wind turbine generator. The output of the generator is
passed through the power converter to the grid. Thus, the rating of the power converter is the
same as the rating of the electric machine used. The electric machine used can be an induction
machine, wound field synchronous generator, or permanent magnet synchronous generator.
The power converter completely separates the generator from the grid. The generator generates
power at different rotor speeds. It is directly converted by the power converter to a three phase
60‐Hz alternating currents. The same type of power converter is used for the type 4 wind
turbine generator. It is able to control the real and reactive power independently. It is
controlled to optimize the operation of the turbine by controlling the real power, and to provide
a constant power factor or constant reactive power, or voltage control at the line side.
‐ 11 ‐
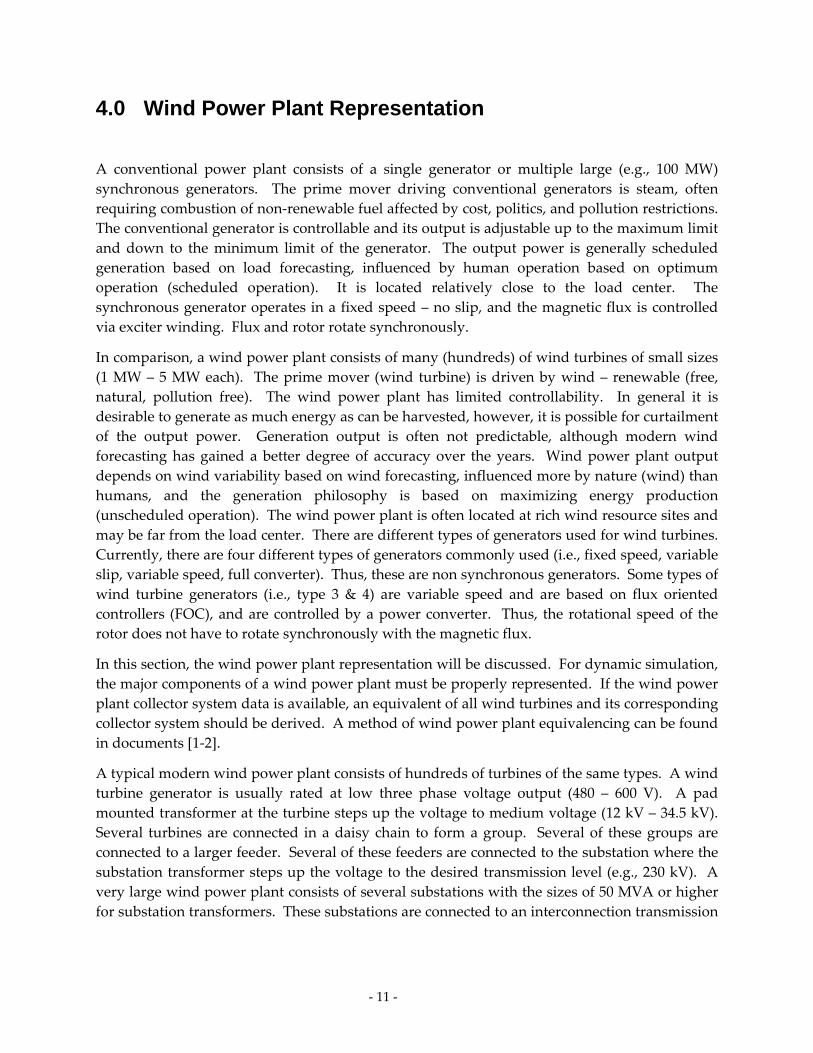
4.0 Wind Power Plant Representation
A conventional power plant consists of a single generator or multiple large (e.g., 100 MW)
synchronous generators. The prime mover driving conventional generators is steam, often
requiring combustion of non‐renewable fuel affected by cost, politics, and pollution restrictions.
The conventional generator is controllable and its output is adjustable up to the maximum limit
and down to the minimum limit of the generator. The output power is generally scheduled
generation based on load forecasting, influenced by human operation based on optimum
operation (scheduled operation). It is located relatively close to the load center. The
synchronous generator operates in a fixed speed – no slip, and the magnetic flux is controlled
via exciter winding. Flux and rotor rotate synchronously.
In comparison, a wind power plant consists of many (hundreds) of wind turbines of small sizes
(1 MW – 5 MW each). The prime mover (wind turbine) is driven by wind – renewable (free,
natural, pollution free). The wind power plant has limited controllability. In general it is
desirable to generate as much energy as can be harvested, however, it is possible for curtailment
of the output power. Generation output is often not predictable, although modern wind
forecasting has gained a better degree of accuracy over the years. Wind power plant output
depends on wind variability based on wind forecasting, influenced more by nature (wind) than
humans, and the generation philosophy is based on maximizing energy production
(unscheduled operation). The wind power plant is often located at rich wind resource sites and
may be far from the load center. There are different types of generators used for wind turbines.
Currently, there are four different types of generators commonly used (i.e., fixed speed, variable
slip, variable speed, full converter). Thus, these are non synchronous generators. Some types of
wind turbine generators (i.e., type 3 & 4) are variable speed and are based on flux oriented
controllers (FOC), and are controlled by a power converter. Thus, the rotational speed of the
rotor does not have to rotate synchronously with the magnetic flux.
In this section, the wind power plant representation will be discussed. For dynamic simulation,
the major components of a wind power plant must be properly represented. If the wind power
plant collector system data is available, an equivalent of all wind turbines and its corresponding
collector system should be derived. A method of wind power plant equivalencing can be found
in documents [1‐2].
A typical modern wind power plant consists of hundreds of turbines of the same types. A wind
turbine generator is usually rated at low three phase voltage output (480 – 600 V). A pad
mounted transformer at the turbine steps up the voltage to medium voltage (12 kV – 34.5 kV).
Several turbines are connected in a daisy chain to form a group. Several of these groups are
connected to a larger feeder. Several of these feeders are connected to the substation where the
substation transformer steps up the voltage to the desired transmission level (e.g., 230 kV). A
very large wind power plant consists of several substations with the sizes of 50 MVA or higher
for substation transformers. These substations are connected to an interconnection transmission
‐ 12 ‐
line to a larger substation where the voltage is stepped up to a higher voltage level (e.g., 500
kV). An example of a wind power plant layout is shown in Figure 2.
Within a wind power plant, there are a lot of diversities in the line feeder and the wind speed at
each turbine. The line impedance in the line feeder connecting each wind turbine to the point of
interconnection differs from each other. The wind speed experienced by one turbine can be
significantly different from another turbine located at another part of the wind power plant.
The diversity of wind power plants is a good attribute in many ways. For example, the
interaction between the wind power plant and the grid is determined by the collective behavior
of the wind power plant. In contrast, a conventional power plant interacts with the grid as a
single large generator. During disturbances, a conventional power plant may be disconnected
from the grid and it may lead to a cascading effect. On the other hand, a wind power plant may
loose a small percentage of total generation, depending on the location of each wind turbine
with respect to the fault origin.
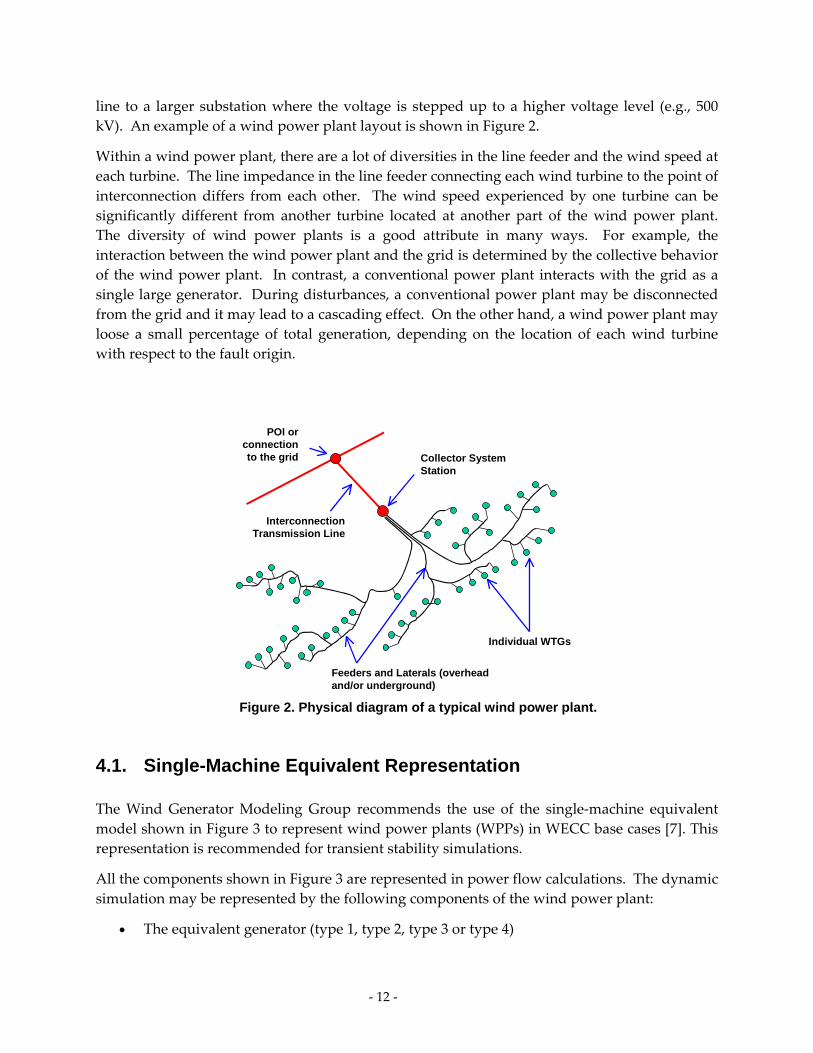
Figure 2. Physical diagram of a typical wind power plant.
4.1. Single-Machine Equivalent Representation The Wind Generator Modeling Group recommends the use of the single‐machine equivalent
model shown in Figure 3 to represent wind power plants (WPPs) in WECC base cases [7]. This
representation is recommended for transient stability simulations.
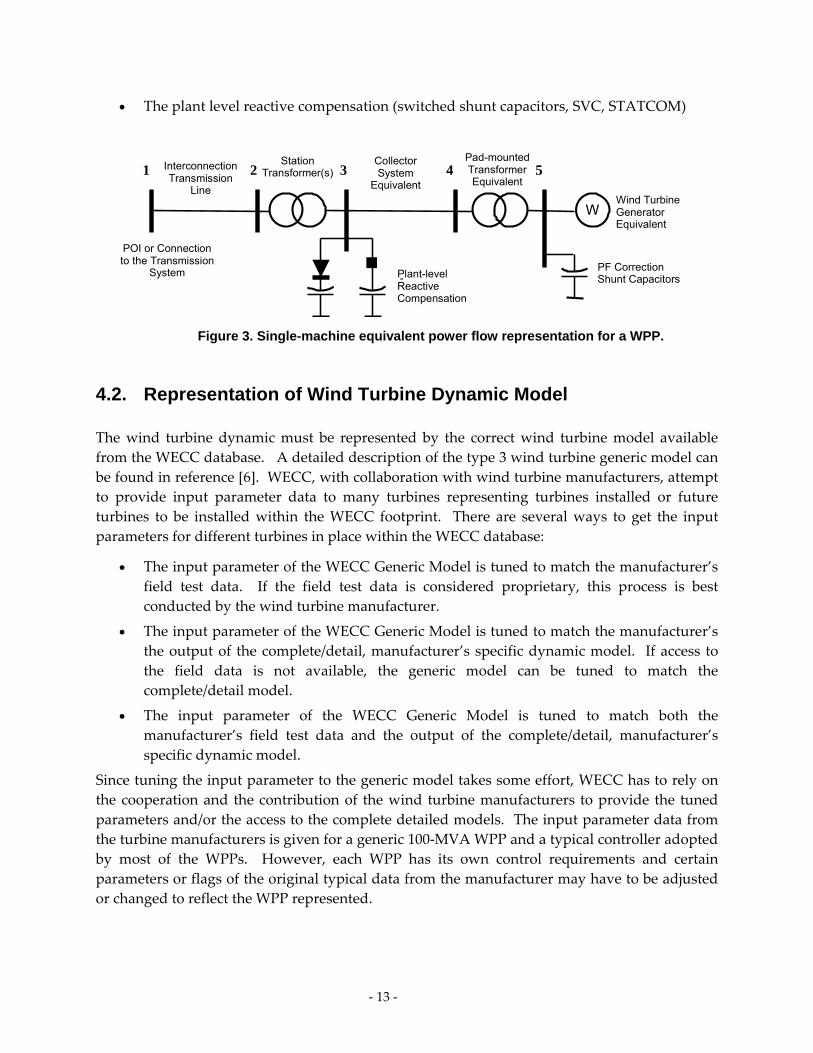
All the components shown in Figure 3 are represented in power flow calculations. The dynamic
simulation may be represented by the following components of the wind power plant:
The equivalent generator (type 1, type 2, type 3 or type 4)
POI or connection to the grid Collector System
Station
Feeders and Laterals (overhead and/or underground)
Individual WTGs
Interconnection Transmission Line
‐ 13 ‐
The plant level reactive compensation (switched shunt capacitors, SVC, STATCOM)
W
Pad-mounted Transformer Equivalent
Wind Turbine Generator Equivalent
PF CorrectionShunt Capacitors
Collector System
Equivalent
Interconnection Transmission
Line
-Plant-level Reactive Compensation
POI or Connection to the Transmission
System
Station Transformer(s)1 2 3 4 5
Figure 3. Single-machine equivalent power flow representation for a WPP.
4.2. Representation of Wind Turbine Dynamic Model The wind turbine dynamic must be represented by the correct wind turbine model available
from the WECC database. A detailed description of the type 3 wind turbine generic model can
be found in reference [6]. WECC, with collaboration with wind turbine manufacturers, attempt
to provide input parameter data to many turbines representing turbines installed or future
turbines to be installed within the WECC footprint. There are several ways to get the input
parameters for different turbines in place within the WECC database:
The input parameter of the WECC Generic Model is tuned to match the manufacturer’s
field test data. If the field test data is considered proprietary, this process is best
conducted by the wind turbine manufacturer.
The input parameter of the WECC Generic Model is tuned to match the manufacturer’s
the output of the complete/detail, manufacturer’s specific dynamic model. If access to
the field data is not available, the generic model can be tuned to match the
complete/detail model.
The input parameter of the WECC Generic Model is tuned to match both the
manufacturer’s field test data and the output of the complete/detail, manufacturer’s
specific dynamic model.
Since tuning the input parameter to the generic model takes some effort, WECC has to rely on
the cooperation and the contribution of the wind turbine manufacturers to provide the tuned
parameters and/or the access to the complete detailed models. The input parameter data from
the turbine manufacturers is given for a generic 100‐MVA WPP and a typical controller adopted
by most of the WPPs. However, each WPP has its own control requirements and certain
parameters or flags of the original typical data from the manufacturer may have to be adjusted
or changed to reflect the WPP represented.

‐ 14 ‐
4.3. Representation Wind Turbine Equivalent Rating WPP size must be incorporated into the dynamic model for type 3 and type 4. The size of the
WPP is used to calculate the per unit values for the WPP under investigation.
For type 1 and type 2:
The WPP size is derived from the information provided by the power flow (i.e. Pmax).
For type 3:
The wind power plant size is used in the following sub‐modules:
WT3G: Generator/Converter Model for the WT3 Generic Wind Model
wt3g [<n>] {<name> <kv>} <id>} : #<rl> {mva=<value>}
o Example:
wt3g 5 ʺBUS5ʺ 0.575 ʺ1 ʺ : #9 mva=33.3 /
o Where:
mva = Rated MVA
WT3E: Converter Control Model
wt3e [<n>] {<name> <kv>} <id> ! ! ! ! ! [<mon_i>] {<namei> <kvi>}
[<mon_j>] {<namej> <kvj>} <ck> <sec> : [mwcap=<value>]
o Example:
wt3e 5 ʺBUS5ʺ 0.575 ʺ1 ʺ 3 ʺBUS3ʺ 34.5 ʺ1 ʺ 1 : #9 mwcap=33.3 /
o Where:
mwcap = Rated MW capability
4.4. Representation of Wind Turbine and Wind Plant Voltage Controller
For type 1 and type 2:
The wind turbine reactive power is compensated by a capacitor. It is represented by the power
flow data as a shunt capacitor (see WECC Power Flow Guide for detail).
Note, that for type 1 and type 2 WTG, the Qgen is set constant by setting Qmax=Qmin, thus, the
voltage is not controllable by the generator.
‐ 15 ‐
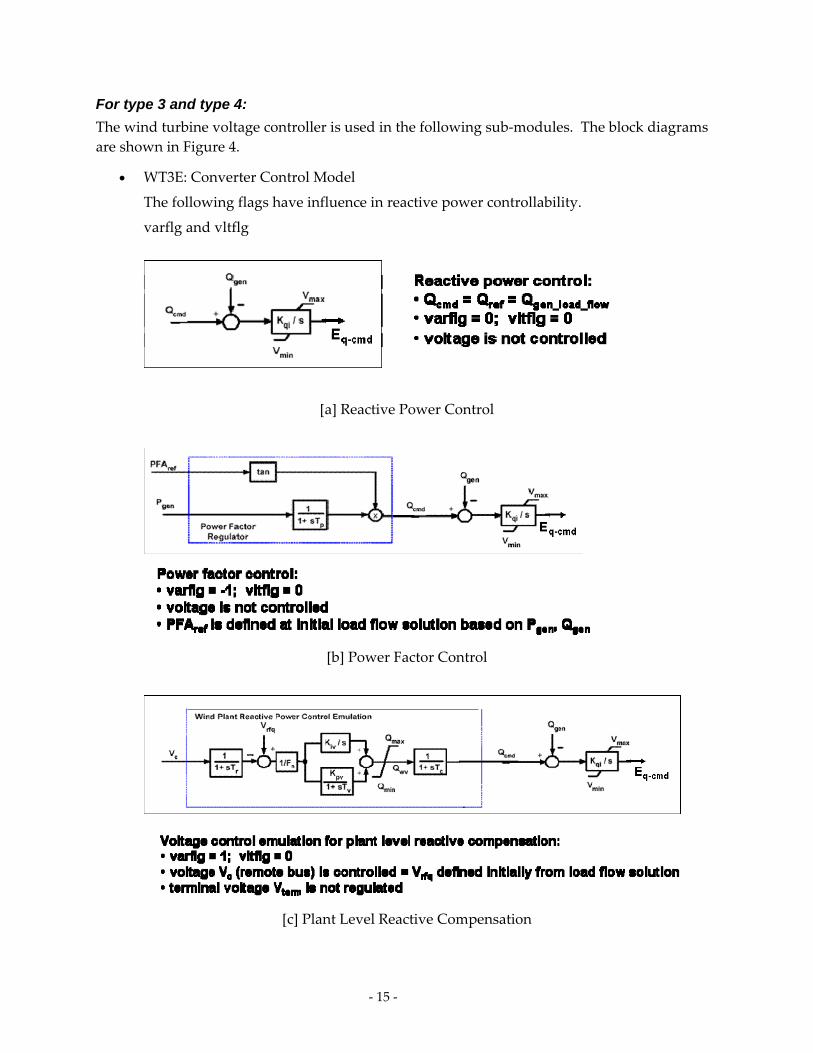
For type 3 and type 4:
The wind turbine voltage controller is used in the following sub‐modules. The block diagrams
are shown in Figure 4.
WT3E: Converter Control Model
The following flags have influence in reactive power controllability.
varflg and vltflg
[a] Reactive Power Control
[b] Power Factor Control
[c] Plant Level Reactive Compensation
‐ 16 ‐
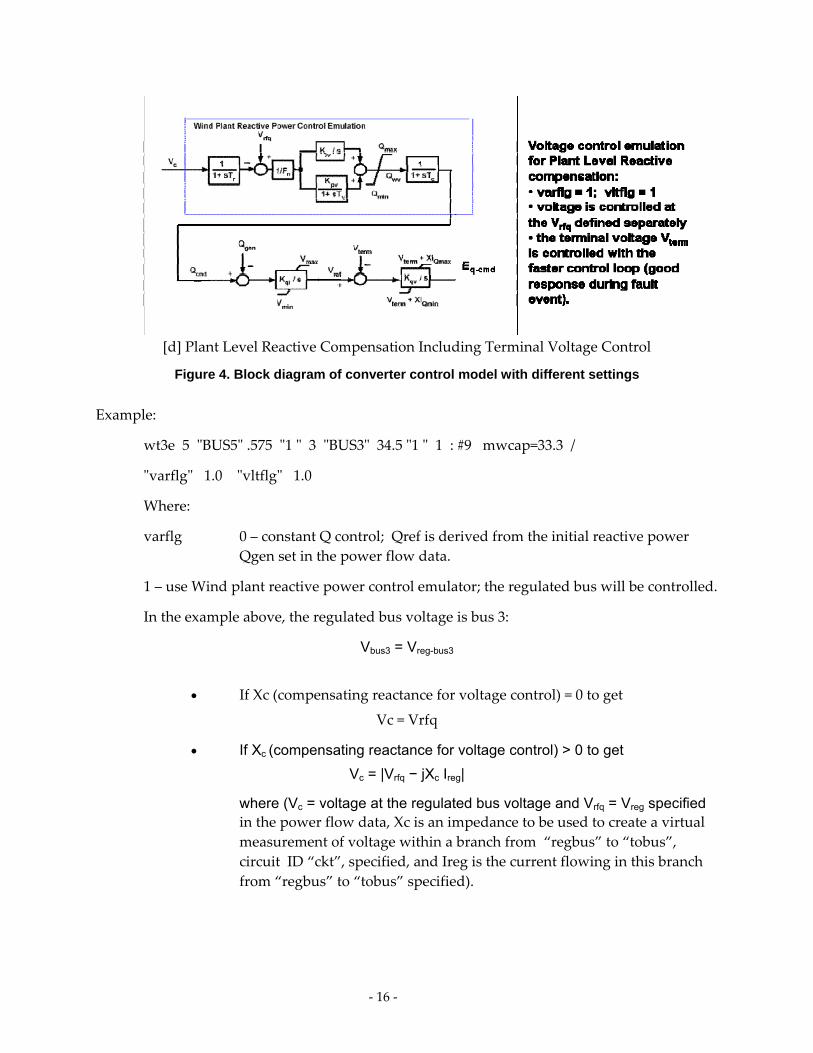
[d] Plant Level Reactive Compensation Including Terminal Voltage Control
Figure 4. Block diagram of converter control model with different settings
Example:
wt3e 5 ʺBUS5ʺ .575 ʺ1 ʺ 3 ʺBUS3ʺ 34.5 ʺ1 ʺ 1 : #9 mwcap=33.3 /
ʺvarflgʺ 1.0 ʺvltflgʺ 1.0
Where:
varflg 0 – constant Q control; Qref is derived from the initial reactive power
Qgen set in the power flow data.
1 – use Wind plant reactive power control emulator; the regulated bus will be controlled.
In the example above, the regulated bus voltage is bus 3:
Vbus3 = Vreg-bus3
If Xc (compensating reactance for voltage control) = 0 to get
Vc = Vrfq
If Xc (compensating reactance for voltage control) > 0 to get
Vc = |Vrfq − jXc Ireg|
where (Vc = voltage at the regulated bus voltage and Vrfq = Vreg specified in the power flow data, Xc is an impedance to be used to create a virtual
measurement of voltage within a branch from “regbus” to “tobus”,
circuit ID “ckt”, specified, and Ireg is the current flowing in this branch
from “regbus” to “tobus” specified).
‐ 17 ‐
Example:
wt3e 5 ʺBUS5ʺ .575 ʺ1 ʺ 3 ʺBUS3ʺ 34.5 ʺ1 ʺ 2 ʺBUS2ʺ 230 ʺ1 ʺ 1 : #9 mwcap=33.3 /
In the example above, the regulated bus voltage is bus 3:
VbusX = |Vreg-bus3 – j Xc Ireg_3-2|
Where VbusX is a voltage at a bus away from the regulated bus 3 in
the direction to bus 2. Thus, it is possible to control the voltage at
a virtual bus X in the middle of the transformer. The distance
from the regulated bus 3, depends on the size of impedance Xc.
‐1 – constant power factor control; in this case Qgen will be
controlled to keep PF=PFAref
vltflg 1 – use closed loop terminal voltage control.
0 – no terminal voltage control
The closed‐loop voltage control (vltflg) is a fast controller to
restore the terminal voltage during transient. The vltflg should be
set to 1 only if the terminal voltage of the generator needs to be
controlled to a set value of Vref. Otherwise, if a remote bus
voltage is to be regulated, vltflg can be set to 0.
Fn Fraction of WTG in wind plant that are on-line. 1.0 = 100% of the total WTG is in operation
0.8 = 80% of the total WTG is in operation and 20% is off‐line
(maintenance, decommission, etc)
4.5. Remote voltage definition:
Figure 5 shows a simplified diagram of a wind power plant with remove voltage control
capability.
XC = compensating reactance for voltage control (in p.u.)
VC = voltage at a remote point
VC = Vf – jXC Ift Vf = voltage at busfrom Ift = current flowing from busfrom to busto
Vrfq = VC computed from the load flow solution at initial condition.

‐ 18 ‐
WWind TurbineGeneratorEquivalent
3 4 5Line 1 (“1”)
Line 2 (“2”)
I21_2
VCVC’
I43
VC”
1 2
WWWind TurbineGeneratorEquivalent
3 4 5Line 1 (“1”)
Line 2 (“2”)
I21_2
VCVC’
I43
VC”
1 2
Figure 5. Simplified single line diagram describing voltage control at a remote node
Examples:
wt3e 5 "BUS5" 0.575 "1 " 1 : #9 mwcap=33.3 / monitored bus is not defined; Thus terminal voltage (bus 5) is controlled.
wt3e 5 "BUS5" 0.575 "1 " 4 "BUS4" 34.5 "1 " 1 : #9 mwcap=33.3 /
Thus bus 4 (VC) will be controlled
wt3e 5 "BUS5" 0.575 "1 " 4 "BUS4" 34.5 3 "BUS3" 34.5 “1 " 1 : #9 mwcap=33.3 /
Thus remote node (VC’) on branch 4-3 is controlled. VC
’ = V4 – jXC I43 XC < X43
wt3e 5 "BUS5" 0.575 "1 " 2 "BUS2" 138 1 "BUS1" 138 “2 " 1 : #9 mwcap=33.3 /
Thus remote node (VC”) on branch 2-1 is controlled. VC
” = V2 – jXC I21 XC < X21
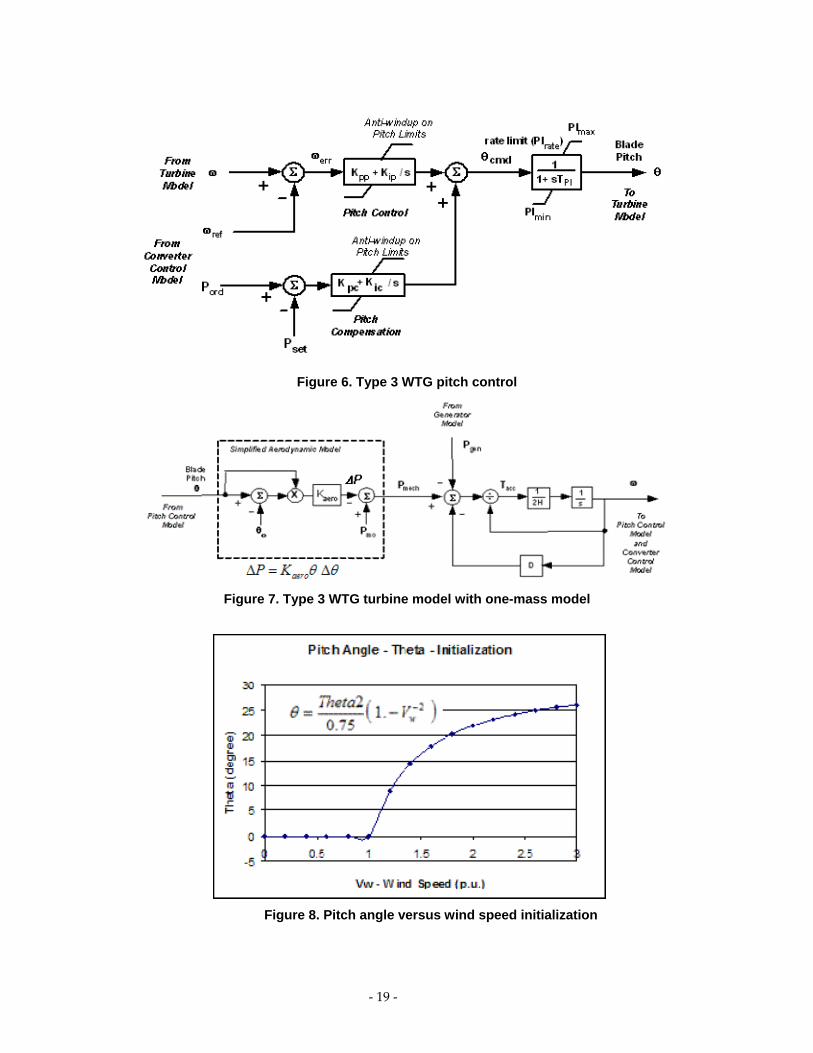
Turbine model (WT3T – module) and pitch model (WT3P – module) The block diagrams to describe the pitch control function are shown in Figures 6, 7, and 8.
General input setting:
Initialize the blade pitch when the wind speed Vw > 1.0 p.u. Unless we specify that the wind speed Vw > 1.0 p.u. The initial (pre‐fault) pitch angle =
0.
‐ 19 ‐
Figure 6. Type 3 WTG pitch control
Figure 7. Type 3 WTG turbine model with one-mass model
Figure 8. Pitch angle versus wind speed initialization
‐ 20 ‐
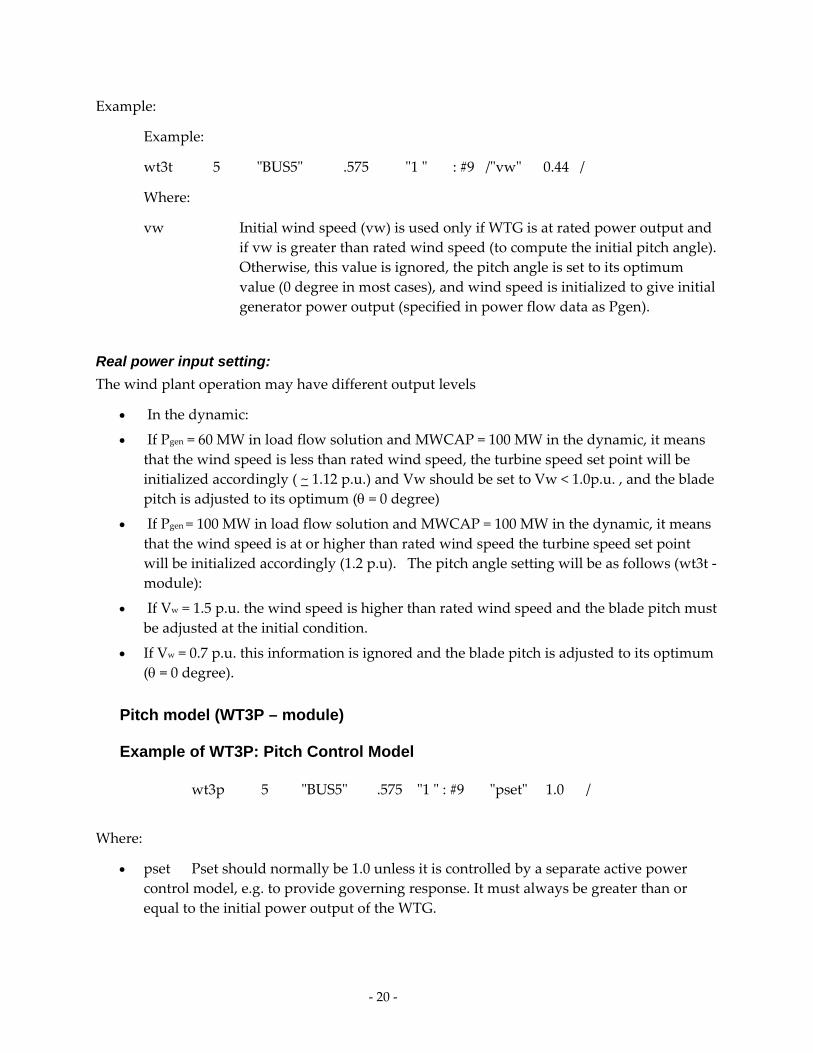
Example:
Example:
wt3t 5 ʺBUS5ʺ .575 ʺ1 ʺ : #9 /ʺvwʺ 0.44 /
Where:
vw Initial wind speed (vw) is used only if WTG is at rated power output and
if vw is greater than rated wind speed (to compute the initial pitch angle).
Otherwise, this value is ignored, the pitch angle is set to its optimum
value (0 degree in most cases), and wind speed is initialized to give initial
generator power output (specified in power flow data as Pgen).
Real power input setting:
The wind plant operation may have different output levels
In the dynamic:
If Pgen = 60 MW in load flow solution and MWCAP = 100 MW in the dynamic, it means
that the wind speed is less than rated wind speed, the turbine speed set point will be
initialized accordingly ( ~ 1.12 p.u.) and Vw should be set to Vw < 1.0p.u. , and the blade
pitch is adjusted to its optimum ( = 0 degree)
If Pgen = 100 MW in load flow solution and MWCAP = 100 MW in the dynamic, it means
that the wind speed is at or higher than rated wind speed the turbine speed set point
will be initialized accordingly (1.2 p.u). The pitch angle setting will be as follows (wt3t ‐
module):
If Vw = 1.5 p.u. the wind speed is higher than rated wind speed and the blade pitch must
be adjusted at the initial condition.
If Vw = 0.7 p.u. this information is ignored and the blade pitch is adjusted to its optimum
( = 0 degree).
Pitch model (WT3P – module)
Example of WT3P: Pitch Control Model
wt3p 5 ʺBUS5ʺ .575 ʺ1 ʺ : #9 ʺpsetʺ 1.0 /
Where:
pset Pset should normally be 1.0 unless it is controlled by a separate active power
control model, e.g. to provide governing response. It must always be greater than or
equal to the initial power output of the WTG.

‐ 21 ‐
Potentially, this setting can be used to curtail the maximum output of the wind turbine,
so that under normal situations the blade pitch is set to produce P < Prated. Thus, for
example, when pset =0.8, the output of the wind turbine is scaled back to generate 0.8
p.u. at rated wind speed by adjusting pitch angle.
During a fault event, the pitch mechanism has some headroom to adjust its pitch angle
to resume to the pre‐fault condition.
‐ 22 ‐
5.0 Wind Power Plant Model Validation
The goal of this validation effort is to match the output of the dynamic model against actual
measurements captured at the transmission station, where disturbance recordings can be
obtained relatively easily. The disturbance used as an example in this report consists of a line‐
to‐ground fault in the vicinity of the transmission station, which resulted in a voltage transient
large enough to excite a significant dynamic response from the wind power plant, within the
design response capability of the generic model (up to about 5 Hz). Data before the fault
occurred is required to establish the pre‐disturbance power flow conditions that are used to
initialize the model. The disturbance record should extend several seconds after the
contingency, consistent with the time frame of interest of positive‐sequence transient stability
analysis.
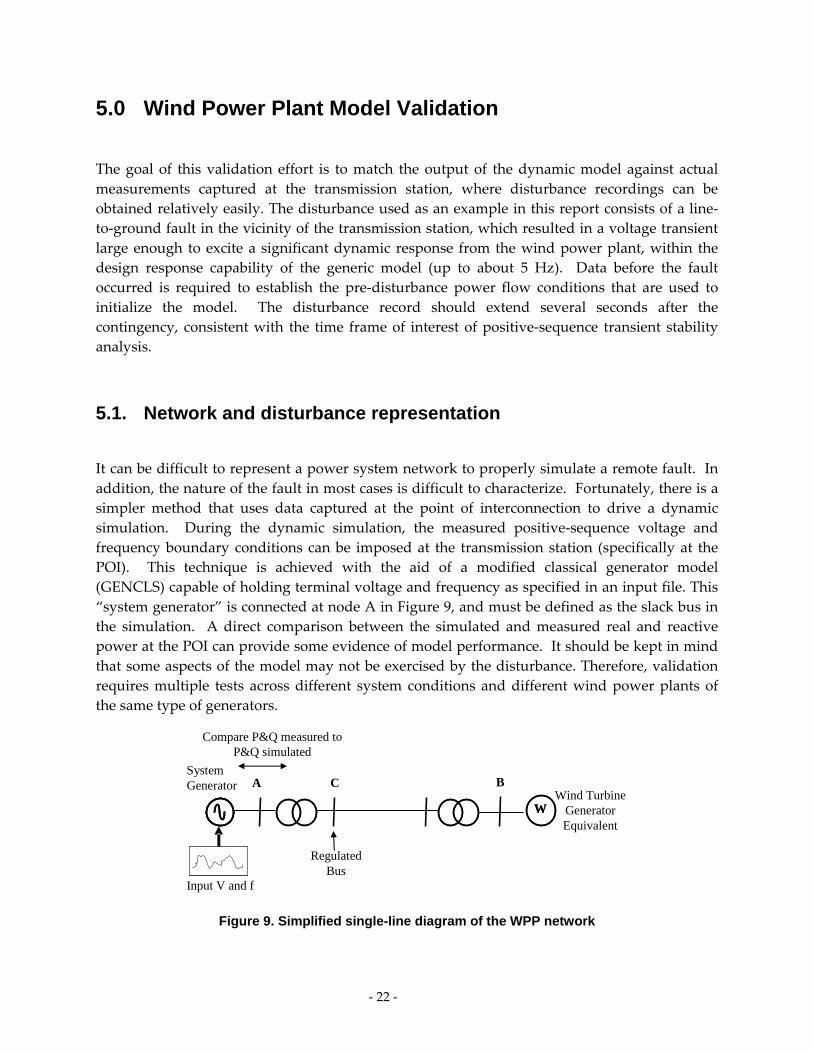
5.1. Network and disturbance representation
It can be difficult to represent a power system network to properly simulate a remote fault. In
addition, the nature of the fault in most cases is difficult to characterize. Fortunately, there is a
simpler method that uses data captured at the point of interconnection to drive a dynamic
simulation. During the dynamic simulation, the measured positive‐sequence voltage and
frequency boundary conditions can be imposed at the transmission station (specifically at the
POI). This technique is achieved with the aid of a modified classical generator model
(GENCLS) capable of holding terminal voltage and frequency as specified in an input file. This
“system generator” is connected at node A in Figure 9, and must be defined as the slack bus in
the simulation. A direct comparison between the simulated and measured real and reactive
power at the POI can provide some evidence of model performance. It should be kept in mind
that some aspects of the model may not be exercised by the disturbance. Therefore, validation
requires multiple tests across different system conditions and different wind power plants of
the same type of generators.
Compare P&Q measured to P&Q simulated
WWWind Turbine
GeneratorEquivalent
Input V and f
A C BSystem Generator
Regulated Bus
Figure 9. Simplified single-line diagram of the WPP network
‐ 23 ‐
5.2. Data for the Simulation To perform the validation, it is important that we simulate the system to be as accurate as
possible. The simulation should represent the actual WPP and the actual events we tried to
simulate. There are several types of data required.
Measured data (voltage, currents, and real/reactive power if any)
Equivalent circuit of the network
Dynamic data
Sequence of events
5.3. Measured data
The data was measured at the high side of the substation transformer (node A in Figure 9). All
the three‐phase voltages and currents are measured at high sampling rates (about 5 kHz). The
record is triggered by the transient events during faults at the transmission lines or in power
system network surrounding the wind power plant. In general, the fault is removed from the
power system network within 4 – 9 cycles, depending on the relay protection set‐up. The data
is recorded before the fault occurs, during the fault, and after the fault. It is important to note
that the model should capture the entire sequence of events. A five‐second record or longer is
desirable to get a good representation of what actually happens.
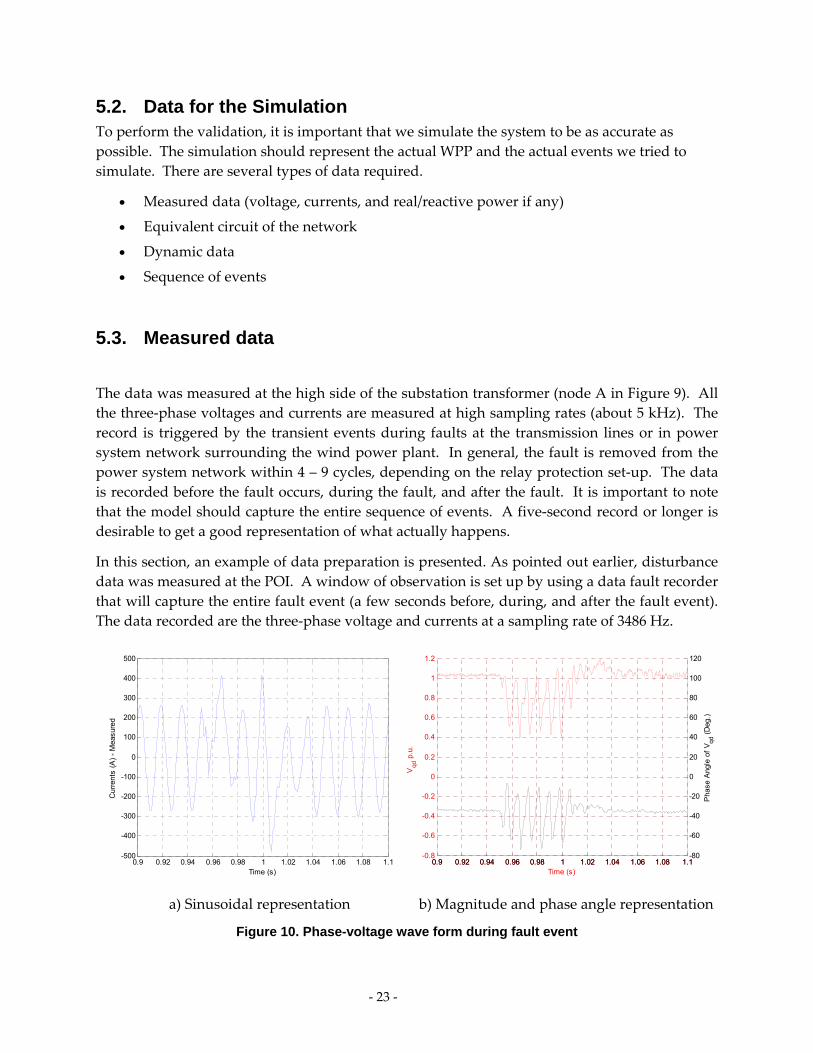
In this section, an example of data preparation is presented. As pointed out earlier, disturbance
data was measured at the POI. A window of observation is set up by using a data fault recorder
that will capture the entire fault event (a few seconds before, during, and after the fault event). The data recorded are the three‐phase voltage and currents at a sampling rate of 3486 Hz.
a) Sinusoidal representation b) Magnitude and phase angle representation
Figure 10. Phase-voltage wave form during fault event
0.9 0.92 0.94 0.96 0.98 1 1.02 1.04 1.06 1.08 1.1-500
-400
-300
-200
-100
0
100
200
300
400
500
Time (s)
Cur
rent
s (A
) -
Mea
sure
d
0.9 0.92 0.94 0.96 0.98 1 1.02 1.04 1.06 1.08 1.1-0.8
-0.6
-0.4
-0.2
0
0.2
0.4
0.6
0.8
1
1.2
Time (s)
Vqd
p.u
.
0.9 0.92 0.94 0.96 0.98 1 1.02 1.04 1.06 1.08 1.1-80
-60
-40
-20
0
20
40
60
80
100
120
Pha
se A
ngle
of
Vqd
(D
eg.)
‐ 24 ‐
An example of the per‐phase voltage waveform is shown in Figure 10a. The time series of the
voltage presented in Figure 10a is shown in a “stationary reference frame.” To integrate this
information in a positive‐sequence simulation, we need to have the positive‐sequence
magnitude of the voltage, frequency, as well as the real and reactive power magnitude as a
function of time. Most station instrumentation software tools have the capability to make the
conversion easily. However, the procedure is not difficult. First, we convert the voltages and
currents from a, b, c representation into a d‐q axis representation in a stationary reference
frame. The equation used to perform this transformation is presented in equation [1].
[1]
From a stationary reference frame, we convert these variables into its representation in
synchronous reference frame by using equation [2].
[2]
[3]
The traces shown in Figure 10b are the voltage phasor quantities (magnitude and phase angle)
obtained from the measured per‐phase voltage and current waveform data recorded at node A
in Figure 9.
In this case, the variable f can be substituted with v for voltage or i for current. The subscript s
represents the stationary reference frame and the subscript e represents the synchronous
reference frame. Under normal conditions, the quantities in the synchronous reference frame
will show constant values in the d and q axis. Finally, we can convert the voltage or current
into its phasor form as shown in equation (3). Thus, we convert the voltages and currents from
a three‐phase a, b, and c representation into its magnitude and phase angle (in phasor form) to
follow the progression of the fault and to show how the voltage phasor changes during the
fault. The methods described in this section can be found in more detail in reference [8].
2 1 1
3 3 31 1
03 3
1 1 1
3 3 3
qs as
ds bs
os cs
f f
f f
f f
cos( ) sin( ) 1
sin( ) cos( ) 1
0 0 1
qe qse o e o
de e o e o ds
oe os
f ft t
f t t f
f f
2 2
1atan
qde qe de qde
deqde
qe
V V V
V
V
‐ 25 ‐
The frequency change at each step can be derived from the phase angle changes in each time
step by using equation 4:
f(t) qdet)
Instantaneous real and reactive power can be computed from the measured voltages and
currents with the following equations:
[5]
The lower case indicates that these quantities are instantaneous values.
V and f
0.2
0.4
0.6
0.8
1
1.2
0 0.5 1 1.5 2
Time (s)
Vo
ltag
e (p
.u.)
0.95
0.99
1.03
1.07
1.11
1.15
Fre
qu
enc
y (p
.u.)
Vf
a) Per unit voltage and frequency at the POI
Real and Reactive Power
0
20
40
60
80
100
120
140
160
0 0.5 1 1.5 2 2.5 3 3.5 4Time (s)
Rea
l Po
wer
(M
W)
-50
-10
30
70
110
150
Re
act
ive
Po
wer
(M
VA
R)
P-measured (MW)
Q-measured (MVAR)
115 MW
- 23 MVAR
9% reduction
MW
Real and Reactive Power
0
20
40
60
80
100
120
140
160
0 0.5 1 1.5 2 2.5 3 3.5 4Time (s)
Rea
l Po
wer
(M
W)
-50
-10
30
70
110
150
Re
act
ive
Po
wer
(M
VA
R)
P-measured (MW)
Q-measured (MVAR)
115 MW
- 23 MVAR
9% reduction
MW
b) Real and reactive power measured at the POI
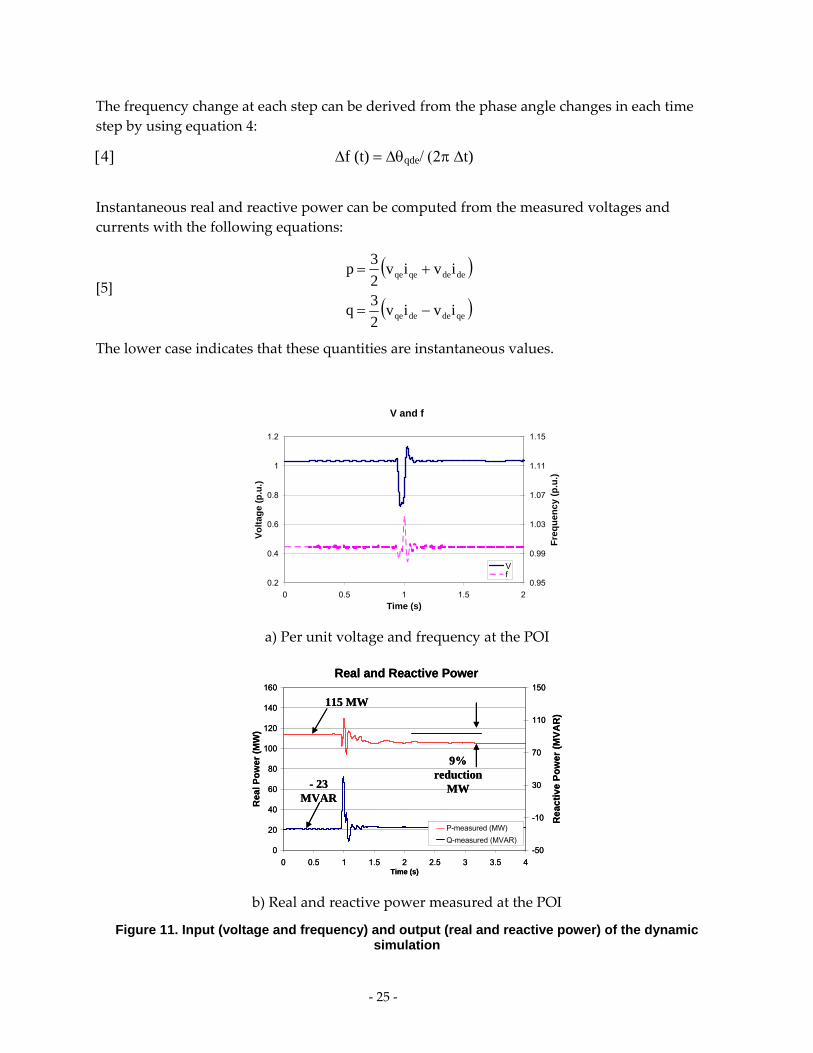
Figure 11. Input (voltage and frequency) and output (real and reactive power) of the dynamic simulation
qededeqe
dedeqeqe
iviv2
3 q
iviv2
3 p
‐ 26 ‐
The traces presented in Figure 11a show the voltage phasor magnitude and frequency as time
varies. Both the voltage magnitude and the frequency are passed through a low pass filter to
remove the higher frequency component, and the resulting voltage and frequency are used as
the input to the GENCLS model. Note, that during the fault, the voltage dips to 0.73 p.u.
Figure 11b shows the measured real and reactive power. It can be seen that, prior to the
disturbance, the wind power plant was operating at an output level of 115 MW, about 56% of
rated output (ignoring losses). It can also be seen that the WPP output goes down by
approximately 9% after the disturbance. Since wind speed can be assumed to be constant over
the time frame of this event (a few seconds), this reduction is an indication that some turbines
tripped as a result of the fault. With respect to reactive power, it is noted that there is a
significant response during the fault.
5.4. Equivalent circuit of the network The power system network data can be obtained from the actual equipment installed (i.e., the
substation transformer, the pad mounted transformer, and the underground and overhead
wire). Usually, the collector system is a complex circuit interconnecting hundreds of turbines to
the POI. Generally, the collector system schedule is provided using an Excel file consisting the
resistance, capacitance, and inductance of the feeders within the WPP. A method of
equivalencing should be used to find the equivalent of the WPP. This method can be found in
reference [1] and will not be repeated here.
Although the method described here is generic in nature, a specific WPP will be used as an
illustration. The reference WPP has a nameplate rating of 204 MW and consists of 136 1.5‐MW
DFIG WTGs. It is connected the transmission system operated by Public Service Company of
New Mexico (PNM), at 345 kV. There are a total of eight 34.5‐kV feeders, two of them are
overhead and the rest are underground. The collector system station is adjacent to the
transmission station. The WPP is equipped with a voltage regulator that controls voltage at the
transmission station, relying on the reactive capability of the WTGs only. There is no additional
reactive compensation within the WPP.
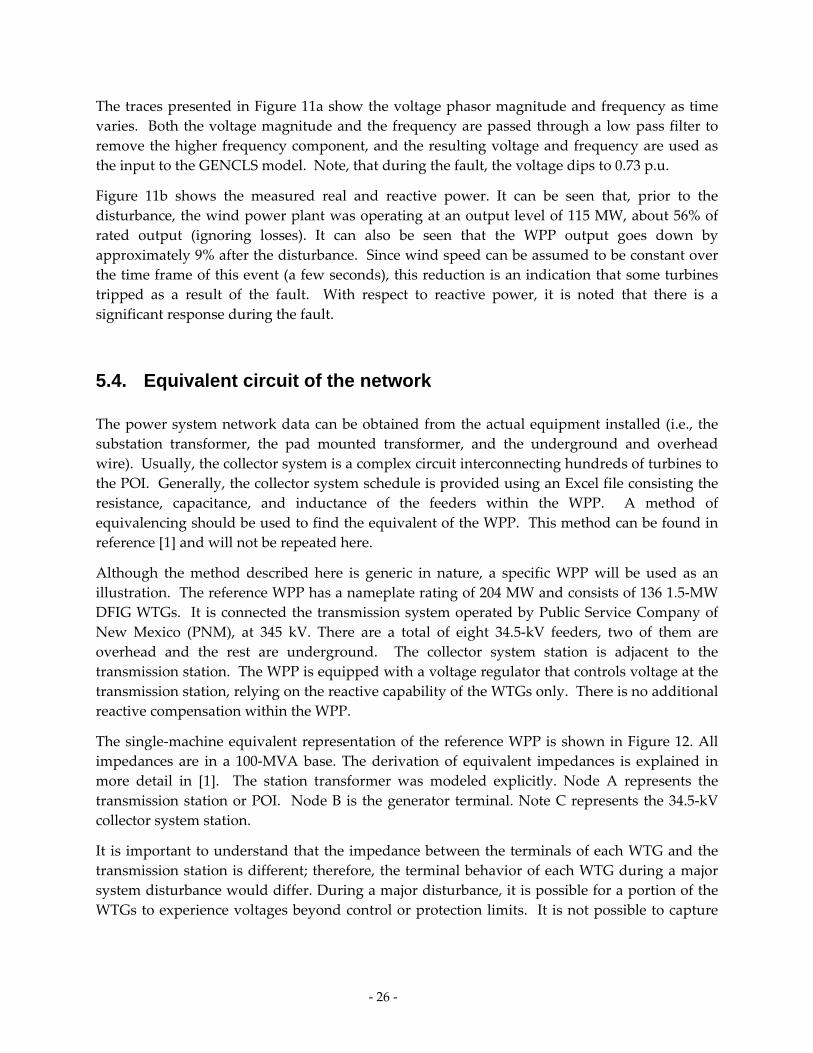
The single‐machine equivalent representation of the reference WPP is shown in Figure 12. All
impedances are in a 100‐MVA base. The derivation of equivalent impedances is explained in
more detail in [1]. The station transformer was modeled explicitly. Node A represents the
transmission station or POI. Node B is the generator terminal. Note C represents the 34.5‐kV
collector system station.
It is important to understand that the impedance between the terminals of each WTG and the
transmission station is different; therefore, the terminal behavior of each WTG during a major
system disturbance would differ. During a major disturbance, it is possible for a portion of the
WTGs to experience voltages beyond control or protection limits. It is not possible to capture
‐ 27 ‐
these differences with the single‐machine equivalent representation. The equivalent WTG is
meant to represent the aggregate terminal behavior of the “average” WTG in the WPP.
W
Pad-mounted Transformer Equivalent
Wind Turbine Generator Equivalent
Collector System
Equivalent
Station Transformer
BWTG
Terminals
A Transmission
Station
Req = 0.0135 Xes = j0.0497 Beq = j0.1004
C
R = 0.0027 X = j0.0245
R = 0.014 X = j0.0828
Figure 12. Single-machine equivalent representation for reference WPP
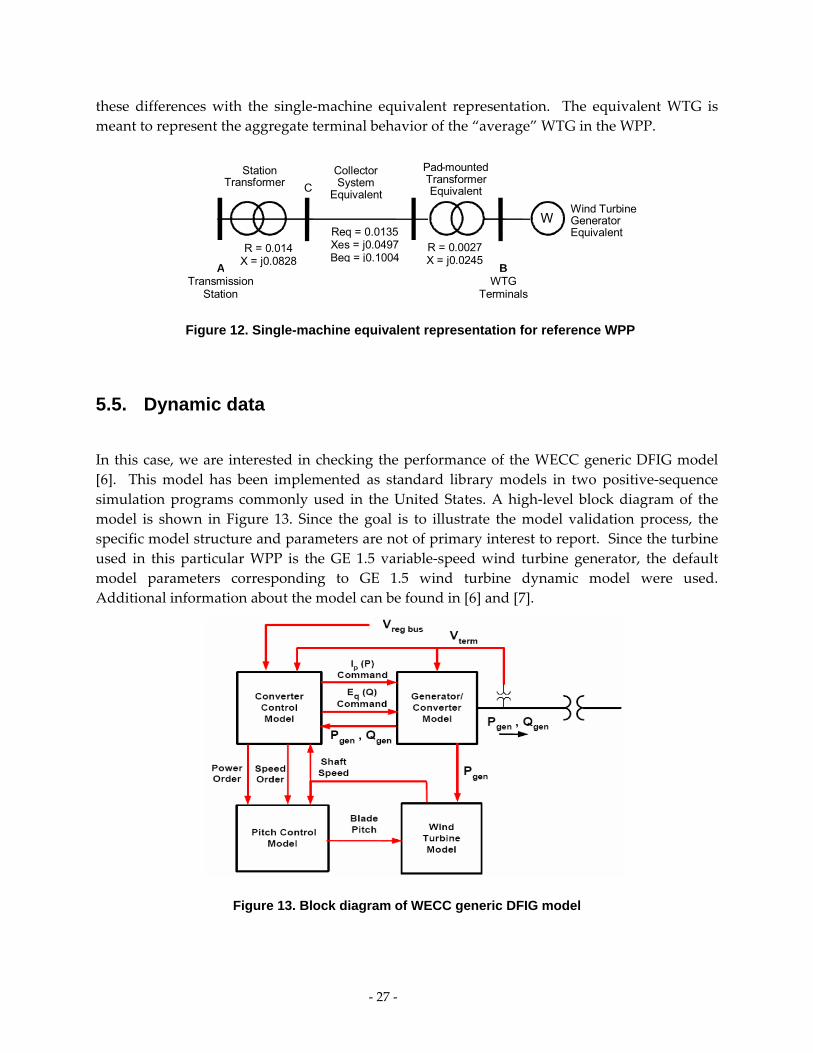
5.5. Dynamic data
In this case, we are interested in checking the performance of the WECC generic DFIG model
[6]. This model has been implemented as standard library models in two positive‐sequence
simulation programs commonly used in the United States. A high‐level block diagram of the
model is shown in Figure 13. Since the goal is to illustrate the model validation process, the
specific model structure and parameters are not of primary interest to report. Since the turbine
used in this particular WPP is the GE 1.5 variable‐speed wind turbine generator, the default
model parameters corresponding to GE 1.5 wind turbine dynamic model were used.
Additional information about the model can be found in [6] and [7].
Figure 13. Block diagram of WECC generic DFIG model
‐ 28 ‐
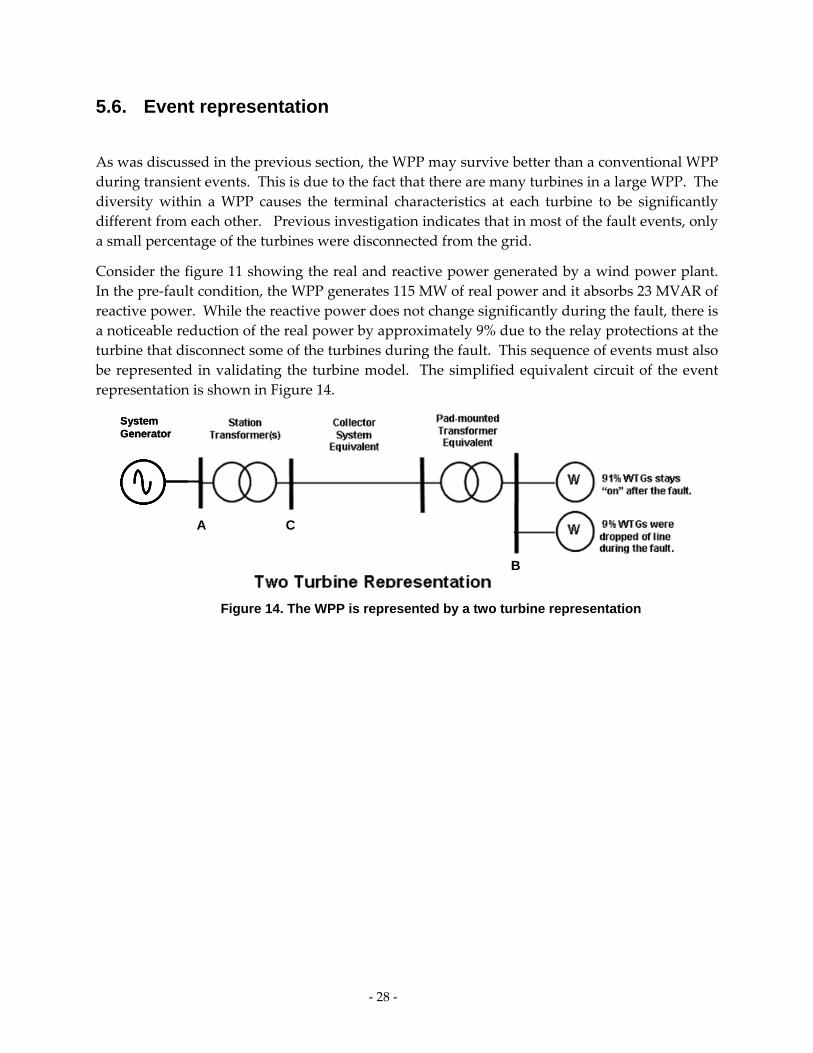
5.6. Event representation
As was discussed in the previous section, the WPP may survive better than a conventional WPP
during transient events. This is due to the fact that there are many turbines in a large WPP. The
diversity within a WPP causes the terminal characteristics at each turbine to be significantly
different from each other. Previous investigation indicates that in most of the fault events, only
a small percentage of the turbines were disconnected from the grid.
Consider the figure 11 showing the real and reactive power generated by a wind power plant.
In the pre‐fault condition, the WPP generates 115 MW of real power and it absorbs 23 MVAR of
reactive power. While the reactive power does not change significantly during the fault, there is
a noticeable reduction of the real power by approximately 9% due to the relay protections at the
turbine that disconnect some of the turbines during the fault. This sequence of events must also
be represented in validating the turbine model. The simplified equivalent circuit of the event
representation is shown in Figure 14.
B
A C
System Generator
B
A C
System Generator
Figure 14. The WPP is represented by a two turbine representation
‐ 29 ‐
6.0 Simulation Results
To account for the portion of the WPP that may have tripped as a result of the disturbance, two
generators at node B were used to represent the equivalent generator, as shown in Figure 14.
This event representation allows for tripping of part of the WPP during the simulation.
In power flow, node A is the slack bus, and the scheduled voltage is set to the measured pre‐
fault voltage (i.e., 1.0325 p.u.). The output power of the equivalent generators was adjusted to
match the total output power measured at the POI (i.e., 115 MW) as shown in the pre‐fault
event. The equivalent generators are set up to control voltage at node C. The scheduled voltage
at node C is adjusted until the reactive flow matches the measured flow (i.e., ‐23 MVAR). Once
the power flow is set up and initialized, the dynamic transient can be simulated.
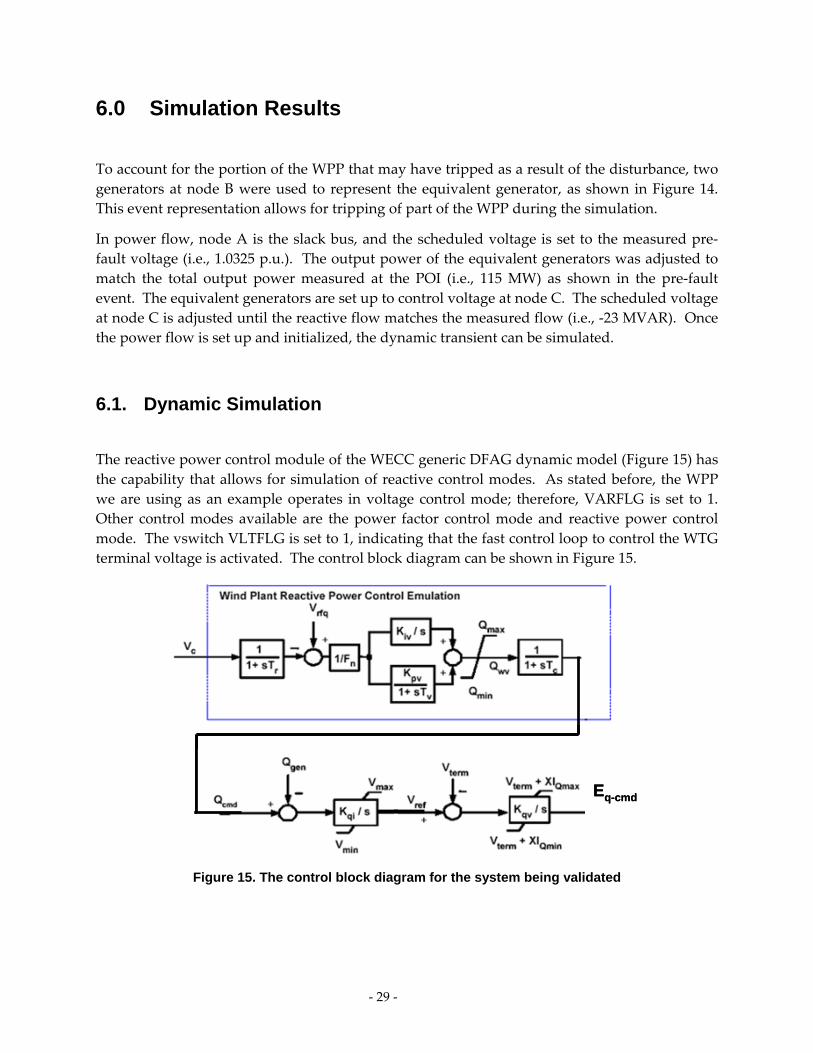
6.1. Dynamic Simulation
The reactive power control module of the WECC generic DFAG dynamic model (Figure 15) has
the capability that allows for simulation of reactive control modes. As stated before, the WPP
we are using as an example operates in voltage control mode; therefore, VARFLG is set to 1.
Other control modes available are the power factor control mode and reactive power control
mode. The vswitch VLTFLG is set to 1, indicating that the fast control loop to control the WTG
terminal voltage is activated. The control block diagram can be shown in Figure 15.
Eq-cmdEq-cmd
Figure 15. The control block diagram for the system being validated
‐ 30 ‐
Note that a WECC generic model is required for each of the equivalent wind power plant
generators represented at node B. As explained before, a GENCLS model was used for the
system generator, with instructions to hold the voltage and frequency in accordance with the
disturbance measurements.
A 4‐second dynamic simulation was conducted with the system setup explained above. The
smaller equivalent generator was taken off line during the fault to simulate the observed
tripping. The timing at which these turbines trip off line is not recorded, thus, the tripping
timing was estimated to be at t = 0.99 seconds.
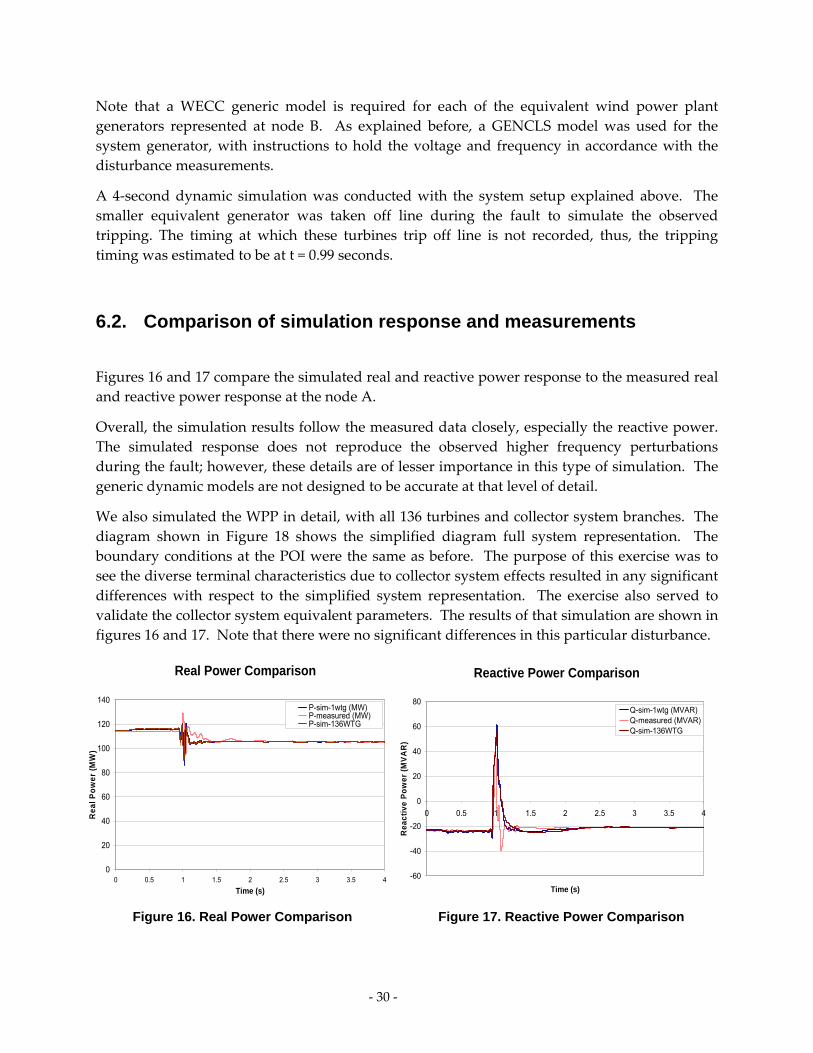
6.2. Comparison of simulation response and measurements
Figures 16 and 17 compare the simulated real and reactive power response to the measured real
and reactive power response at the node A.
Overall, the simulation results follow the measured data closely, especially the reactive power.
The simulated response does not reproduce the observed higher frequency perturbations
during the fault; however, these details are of lesser importance in this type of simulation. The
generic dynamic models are not designed to be accurate at that level of detail.
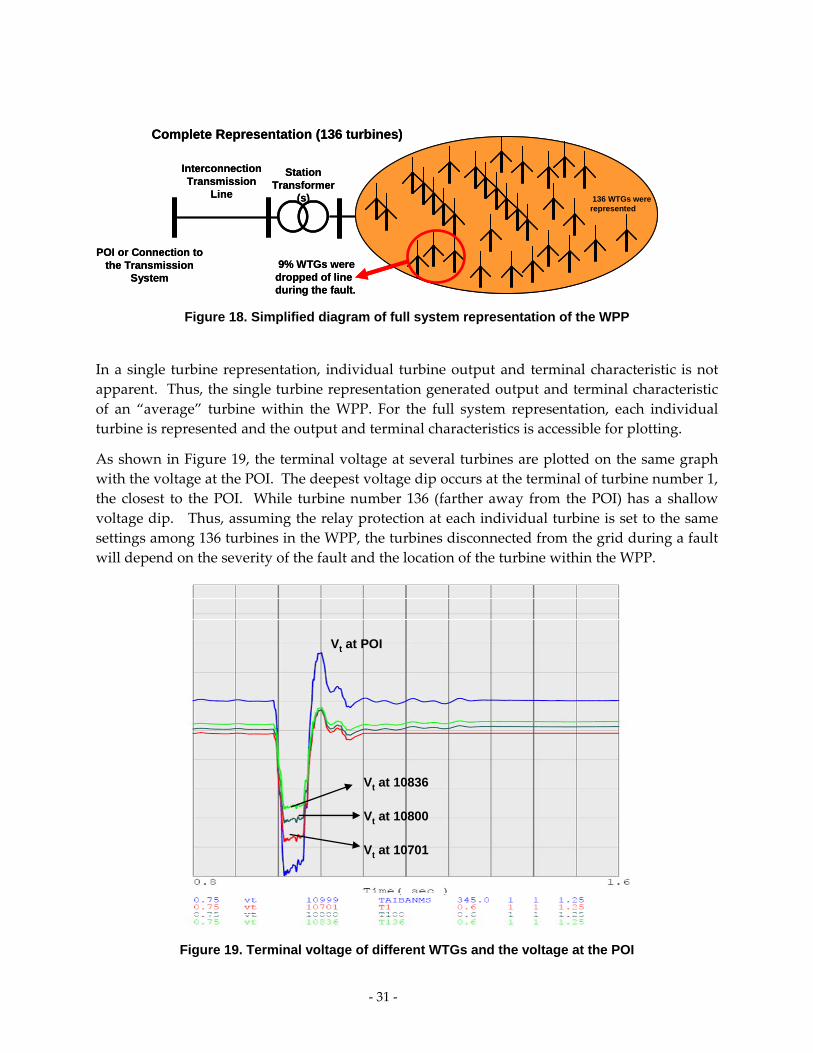
We also simulated the WPP in detail, with all 136 turbines and collector system branches. The
diagram shown in Figure 18 shows the simplified diagram full system representation. The
boundary conditions at the POI were the same as before. The purpose of this exercise was to
see the diverse terminal characteristics due to collector system effects resulted in any significant
differences with respect to the simplified system representation. The exercise also served to
validate the collector system equivalent parameters. The results of that simulation are shown in
figures 16 and 17. Note that there were no significant differences in this particular disturbance.
Reactive Power Comparison
-60
-40
-20
0
20
40
60
80
0 0.5 1 1.5 2 2.5 3 3.5 4
Time (s)
Rea
cti
ve P
ow
er (
MV
AR
)
Q-sim-1wtg (MVAR)Q-measured (MVAR)Q-sim-136WTG
Figure 16. Real Power Comparison Figure 17. Reactive Power Comparison
Real Power Comparison
0
20
40
60
80
100
120
140
0 0.5 1 1.5 2 2.5 3 3.5 4
Time (s)
Re
al P
ow
er
(MW
)
P-sim-1wtg (MW)P-measured (MW)P-sim-136WTG
‐ 31 ‐
Interconnection Transmission
Line
POI or Connection to the Transmission
System
Station Transformer
(s) 136 WTGs were represented
9% WTGs were dropped of line during the fault.
Complete Representation (136 turbines)
Interconnection Transmission
Line
POI or Connection to the Transmission
System
Station Transformer
(s) 136 WTGs were represented
9% WTGs were dropped of line during the fault.
Complete Representation (136 turbines)
Figure 18. Simplified diagram of full system representation of the WPP
In a single turbine representation, individual turbine output and terminal characteristic is not
apparent. Thus, the single turbine representation generated output and terminal characteristic
of an “average” turbine within the WPP. For the full system representation, each individual
turbine is represented and the output and terminal characteristics is accessible for plotting.
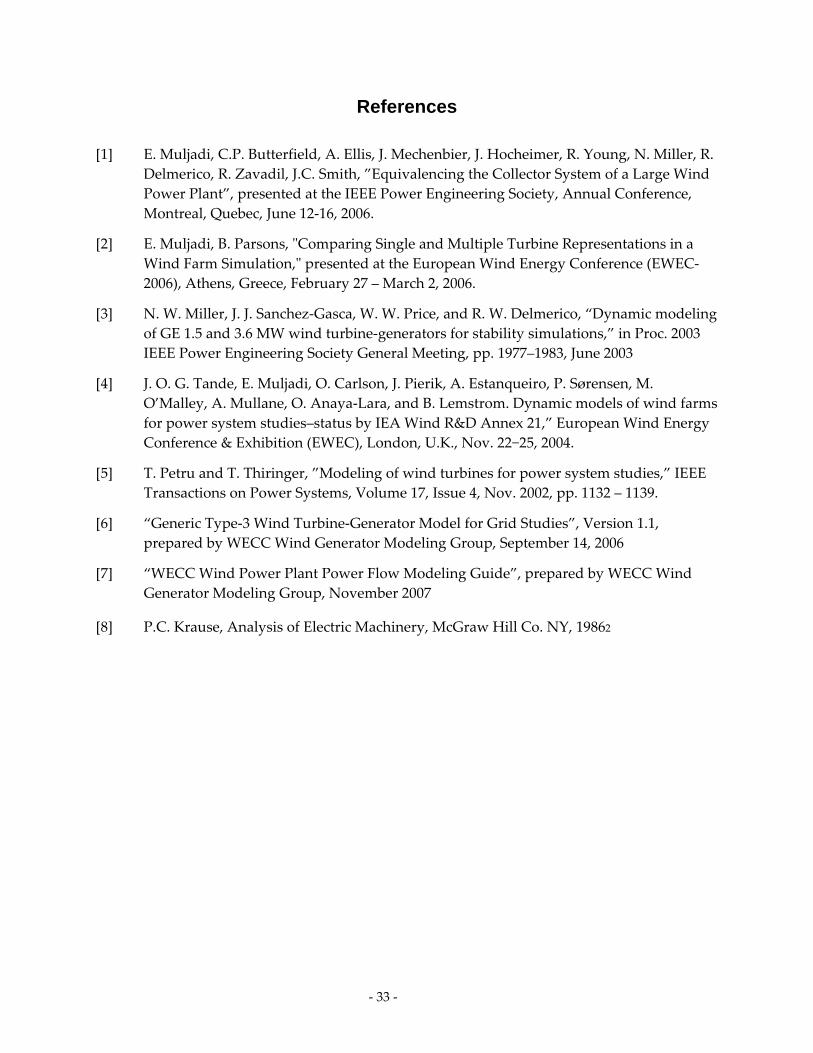
As shown in Figure 19, the terminal voltage at several turbines are plotted on the same graph
with the voltage at the POI. The deepest voltage dip occurs at the terminal of turbine number 1,
the closest to the POI. While turbine number 136 (farther away from the POI) has a shallow
voltage dip. Thus, assuming the relay protection at each individual turbine is set to the same
settings among 136 turbines in the WPP, the turbines disconnected from the grid during a fault
will depend on the severity of the fault and the location of the turbine within the WPP.
Vt at POI
Vt at 10836
Vt at 10800
Vt at 10701
Vt at POI
Vt at 10836
Vt at 10800
Vt at 10701
Figure 19. Terminal voltage of different WTGs and the voltage at the POI

‐ 32 ‐
7.0 Summary This report presents the methods to validate positive‐sequence wind dynamic models. This
technique was applied to the WECC generic model as an example.
The validation method described in this report is applicable for all the four types of wind
turbine generators.
The results of the simulations demonstrated that a generic model of DFIGs provides an
adequate representation of the actual wind turbines under fault conditions.
In the report, the simulation is also performed with all 136 turbine connected on line. For both
the full system representation and the two turbine representation, it shows that the output of
real and reactive power at the point of interconnection matches the measured field data. Thus,
modeling the WPP with an equivalent representation preserves the basic response of the WPP.
‐ 33 ‐
References
[1] E. Muljadi, C.P. Butterfield, A. Ellis, J. Mechenbier, J. Hocheimer, R. Young, N. Miller, R.
Delmerico, R. Zavadil, J.C. Smith, ”Equivalencing the Collector System of a Large Wind
Power Plant”, presented at the IEEE Power Engineering Society, Annual Conference,
Montreal, Quebec, June 12‐16, 2006.
[2] E. Muljadi, B. Parsons, ʺComparing Single and Multiple Turbine Representations in a
Wind Farm Simulation,ʺ presented at the European Wind Energy Conference (EWEC‐
2006), Athens, Greece, February 27 – March 2, 2006.
[3] N. W. Miller, J. J. Sanchez‐Gasca, W. W. Price, and R. W. Delmerico, “Dynamic modeling
of GE 1.5 and 3.6 MW wind turbine‐generators for stability simulations,” in Proc. 2003
IEEE Power Engineering Society General Meeting, pp. 1977–1983, June 2003
[4] J. O. G. Tande, E. Muljadi, O. Carlson, J. Pierik, A. Estanqueiro, P. Sørensen, M.
O’Malley, A. Mullane, O. Anaya‐Lara, and B. Lemstrom. Dynamic models of wind farms
for power system studies–status by IEA Wind R&D Annex 21,” European Wind Energy
Conference & Exhibition (EWEC), London, U.K., Nov. 22−25, 2004.
[5] T. Petru and T. Thiringer, ”Modeling of wind turbines for power system studies,” IEEE
Transactions on Power Systems, Volume 17, Issue 4, Nov. 2002, pp. 1132 – 1139.
[6] “Generic Type‐3 Wind Turbine‐Generator Model for Grid Studies”, Version 1.1,
prepared by WECC Wind Generator Modeling Group, September 14, 2006
[7] “WECC Wind Power Plant Power Flow Modeling Guide”, prepared by WECC Wind
Generator Modeling Group, November 2007
[8] P.C. Krause, Analysis of Electric Machinery, McGraw Hill Co. NY, 19862

‐ 34 ‐
Glossary
The following acronyms are used in this report:
CEC California Energy Commission
CRPWM Current Regulated Pulse Width Modulation
DFAG Doubly Fed Asynchronous Generator
DFIG Doubly Fed Induction Generator
DOE Department of Energy
ERCOT Electric Reliability Council of Texas
FERC Federal Electric Regulatory Commission
FOC Flux Oriented Controller
FPL Florida Power and Light
FSR Full System Representation
IEC International Electrotechnical Commission
IEEE Institute of Electrical and Electronic Engineers
LVRT Low Voltage Ride Through
NMEC New Mexico Energy Center
NDA Non Disclosure Agreement
NEC National Electrical Code
NERC North American Electric Reliability Council
NREL National Renewable Energy Laboratory
PFC Power Factor Correction
PIER Public Interest Energy Research
PNM Public Service of New Mexico
POI Point of Interconnection
PSLF Positive Sequence Load Flow
PSSE Power System Simulator for Engineers
RAS Remedial Action Scheme

‐ 35 ‐
SVC Static VAr Compensator
TSR Tip Speed Radio
VAr Volt‐Ampere Reactive
WECC Western Electricity Coordinating Council
WGMG Wind Generator Modeling Group
WTG Wind Turbine Generator
WF Wind Farm
WPP Wind Power Plant