business valuation of midwest endoscopy center, …...partnership is as follows: scott berger, 41%,...
TRANSCRIPT

BUSINESS VALUATION OF
MIDWEST ENDOSCOPY CENTER, LLC
AS OF SEPTEMBER 30, 2013
PREPARED BY
THE ABRIX GROUP, L.P.

TABLE OF CONTENTS
PAGE
I. VALUATION OPINION LETTER 3
II. INTRODUCTION 4PurposeApproachLimiting Conditions
III. BUSINESS BACKGROUND 6OverviewOwnershipOffice FacilityHistoryPhysician OwnersStaff
IV. ECONOMIC REVIEW AND OUTLOOK 8National EconomyState EconomyLocal Economy
V. FINANCIAL REVIEW 20Historical Financial Statements
VI. CONCLUSION OF VALUE 21Business Valuation Methodology
OverviewDiscussion of Various Approaches
Calculation of ValueOverview
Valuation Methodology SelectedConclusion of Value
HEALTHCARE MANAGEMENT CONSULTANTS
DRAFT – For Discussion Purposes Only3
November 13, 2013
Mr. William KottmannEdward Hospital801 S. Washington StreetP.O. Box 3060Naperville, Illinois 60566
Dear Mr. Kottmann,
We have prepared and enclosed, herewith, our valuation of Midwest Endoscopy Center, LLC as ofSeptember 30, 2013. The purpose of the valuation is to render an opinion as to the fair market value ofMidwest Endoscopy Center, LLC.
The term “fair market value” is defined as the price at which the property would change hands betweena willing buyer and a willing seller when the former is not under any compulsion to buy and the latteris not under any compulsion to sell, and both parties have reasonable knowledge of the relevant facts.
Our report is based on historical and prospective financial information provided to us by managementand other third parties. Had we audited or reviewed the underlying data, matters may have come to ourattention that could have resulted in our using amounts that differ from those provided. Accordingly,we take no responsibility for the underlying data presented in this report. Users of this valuation reportshould be aware that business valuations are based on future earnings potential that may or may notmaterialize. Therefore, actual results during the projection period will vary from the projections usedin this valuation, and the variations may be material.
Based on our study and analytical procedures it is our opinion that the fair market value of 100% ofMidwest Endoscopy Center, LLC is $23,412,000, excluding $102,000 cash on hand, assuming alllong-term liabilities are paid by the seller prior to the sale, and assuming that a restrictive covenant willbe put in place. The valuation is prepared on the assumption that the sale will be a majority interest inthe Center and the 100% value be adjusted accordingly to the interest purchased. We have no presentor contemplated financial interest in Midwest Endoscopy Center, LLC. Our fees for this valuation arebased upon our normal hourly billing rates, and are in no way contingent upon the results of ourfindings. We have no responsibility to update these schedules for events and circumstances occurringsubsequent to the date of this report.
These schedules have been prepared for the specific purpose of valuing Midwest Endoscopy Center,LLC as of September 30, 2013. These pages are not to be copied or made available to any personswithout the express written consent of The Abrix Group, LP.
The Abrix Group, LP

HEALTHCARE MANAGEMENT CONSULTANTS
INTRODUCTION
Purpose
We have performed a valuation engagement of Midwest Endoscopy Center, LLC as thatterm is defined in the Statements on Standards for Valuation Services of the AmericanInstitute of Certified Public Accountants. The purpose of this valuation is to establish thefair market value of Midwest Endoscopy Center, LLC as of September 30, 2013 for apotential sale of at least a majority interest of the business.
In the International Glossary of Business Valuation Terms, fair market value is defined asthe price, expressed in terms of cash equivalents, at which property would change handsbetween a hypothetical willing and able buyer and a hypothetical willing and able seller,acting at arms’ length in an open and unrestricted market, when neither is undercompulsion to buy or sell and when both have reasonable knowledge of the relevantfacts.
Approach
Our approach has been to determine our opinion of value, providing a fair and reasonablereturn on investment to an investor or owner, in view of the facts available to us at thetime. Our opinion is based on, among other things, our estimate of the risks facing thebusiness and the return on investment that would be required on alternative investmentswith similar levels of risk. We have applied various valuation methods in estimating thevalue of Midwest Endoscopy Center, LLC as of September 30, 2013.
The valuation methodology used herein is consistent with the guidelines pronounced by theInternal Revenue Service in Revenue Ruling 59-60. In determining what constitutes fairmarket value as it is meant in Revenue Ruling 59-60, the Service explains that the businessenterprise value or going concern value is defined as the value of a company's capitalstructure or, alternatively, as the total value of the assembled assets that comprise the entityas a going concern.
Our valuation methodology is also in accordance with the Medicare and Medicaid anti-kickback statutes enforced by the Office of the Inspector General, as the resultant valuereflects the value to a similarly situated purchasing entity, and thus take into account thefuture revenue stream from only the business itself.
Both internal and external factors that influence the value of the business were reviewed,analyzed and interpreted. Internal factors include the business’ financial position, resultsof operations, and the size and marketability of the interest being valued. External factorsinclude, among other things, the status of the industry and the impact of regulatorychanges and reimbursement pressures and the position of the business relative to theindustry.
DRAFT – For Discussion Purposes Only4

HEALTHCARE MANAGEMENT CONSULTANTS
DRAFT – For Discussion Purposes Only5
The valuation professional will use one of three general approaches – market, income, orasset – each with several underlying methods. We analyzed each approach and methodto determine which generates the most reasonable opinion of value of the business as ofSeptember 30, 2013. After careful consideration of each method, underlying assumptionsand variables, we concluded that the most appropriate method was the market approachusing a multiple of EBITDA (Earnings Before Interest, Taxes, Depreciation,Amortization) to determine the fair market value of Midwest Endoscopy Center, LLC.
Limiting Conditions
We have no present or contemplated financial interest in Midwest Endoscopy Center,LLC. Our fees for this valuation are based upon our normal hourly billing rates, and in noway are contingent upon the results of our findings. We have no responsibility orobligation to update this report for events or circumstances occurring subsequent to thedate of this report.
Our report is based on historical and/or prospective financial information provided to usby management and other third parties. Had we audited or reviewed the underlying data,matters may have come to our attention which would have resulted in our using amountswhich differ from those provided, accordingly, we take no responsibility for theunderlying data presented or relied upon in this report.
We have relied upon the representations of the owner, and other third parties concerningthe value and useful condition of all equipment, real estate, investments used in thebusiness, and any other assets or liabilities except as specifically stated to the contrary inthis report. We have not attempted to confirm whether or not all assets of the businessare free and clear of liens and encumbrances, or that Midwest Endoscopy Center, LLChas good title to all assets.
The opinion of value included in this report assumes that Midwest Endoscopy Center,LLC will maintain its character and integrity through any reorganization orreduction/increase of any owner/manager participation in the existing activities ofMidwest Endoscopy Center, LLC.
The Abrix Group, LP does not purport to be a guarantor of value. Valuation of closelyheld companies is an imprecise science, with value being a question of fact, andreasonable people can differ in their opinion of value. The Abrix Group, LP has usedconceptually sound and commonly accepted methods and procedures of valuation indetermining the opinion of value included in this report.
HEALTHCARE MANAGEMENT CONSULTANTS
DRAFT – For Discussion Purposes Only6
We have compiled certain of the information contained herein. That information,namely, but not limited to, financial statements, business history, and market overview,has been supplied by Midwest Endoscopy Center, LLC or its representatives. Thisinformation has not been audited by us, nor has it been subjected to any type of auditprocedures by us, nor have we audited the books and records of the subject company.Accordingly, this report should not be construed, or referred to, as an audit examinationby The Abrix Group, LP.
Any recast financial statements, forecasts or pro forma statements are the result of dataprovided by the subject business, its representatives, or are based on assumptions, thereasonableness of which have been agreed to by the client in the engagement. Suchrecasted, forecasted or pro forma statements may not anticipate the economic,socioeconomic, political, market or legal factors that may impact the operations of thesubject company. Accordingly, The Abrix Group, LP makes no representations,expressed or implied, as to the validity of such recast financial statements, forecasts orpro forma statements.
The valuation analyst, by reason of performing this valuation and preparing this report, isnot to be required to give expert testimony nor to be in attendance in court or at anygovernment hearing with reference to the matters contained herein unless priorarrangements have been made with The Abrix Group, LP regarding such additionalengagement.
This report is neither an offer to sell, nor a solicitation to buy securities, and/or equity in,or the assets of Midwest Endoscopy Center, LLC.
BUSINESS BACKGROUND
Overview
Midwest Endoscopy Center, LLC, located at 1243 Rickert Drive, Naperville, Illinois60540, is the only state-licensed freestanding endoscopy center in DuPage County,Illinois. It is accredited by the Accreditation Association for Ambulatory Health Care andis approved by Medicare. The Center is one of the few facilities in Illinois to berecognized by the American Society for Gastrointestinal Endoscopy for promotion ofquality in endoscopy. The award was recently received again for the years 2012 through2015. This recognition award reflects the high level of patient care in the Center and thatits physicians and their practices are all quality driven with the patients’ well being inmind. Per Dr. Berger, Midwest Endoscopy Center “adheres to the strictest standards.”Procedures provided include colonoscopy screenings, upper and lower endoscopy, bravo

HEALTHCARE MANAGEMENT CONSULTANTS
DRAFT – For Discussion Purposes Only7
ph monitoring, and H. pylori testing. The Center’s hours are Monday through Fridayfrom 7:00AM to 4:00PM. Per management, their patients mostly reside in thesurrounding communities of Naperville, Joliet, Plainfield, Bolingbrook, and Aurora.
For tax purposes, the business is organized as a limited liability corporation and annuallyfiles a Form 1065 U.S. Return of Partnership Income. The current ownership of thepartnership is as follows: Scott Berger, 41%, Dinesh Jain, 41%, Sushama Gundlapalli,6%, Darren Kastin, 6%, and Ravi Nadimpalli, 6%.
Per practice management, there are currently no malpractice suits or other litigationpending against the business.
Office Facility
The Center’s office is approximately 5,943 square feet of rentable area on the first floorof the professional medical building located at 1243 Rickert Drive, Naperville, Illinois,leased from DJSB, LLC. DJSB, LLC is owned by Dr. Berger and Dr. Jain. The annualbase rent of $267,435 ($45/sq.ft.) was based on the cost of the building at the time ofcompletion. The lease imposes additional rent payable for taxes and operating costs in anamount “estimated from time to time by the Landlord.” The current lease agreementbegan on January 1, 2008 and ends on December 31, 2018. It should be noted that forpurposes of this valuation we assume that the practice would maintain its lease contractand remain at the current location if it is sold.
Photos of the exterior and interior of the practice office are shown in Exhibit A.
History
Drs. Berger and Jain, founding partners of Suburban Gastroenterology, Ltd., were theoriginal owners of the Center, each owning 50%. Dr. Gundlapalli joined and became a6% owner of Midwest Endoscopy Center in January 2010. Dr. Kastin joined and becamea 6% owner of Midwest Endoscopy Center in July of 2010 with Dr. Nadimpallibecoming a 6% owner in September 2011. The purchase price for each of the buy-inswas internally calculated and paid to the original owners by the new owners. In additionto the five physician partners, the Center has two employed physicians, Jennifer Frankeland Gonzalo Pandolfi.
Physician Owners
Dr. Berger earned his medical degree in 1984 from the Mount Sinai School of Medicinein New York. He completed his residency in internal medicine at the University ofMaryland Hospitals, in Baltimore, Maryland and completed a fellowship ingastroenterology at the Loyola School of Medicine in Maywood, Illinois.

HEALTHCARE MANAGEMENT CONSULTANTS
DRAFT – For Discussion Purposes Only8
Dr. Jain earned his medical degree in 1976 from the All India Institute of MedicalSciences in New Delhi, India. He completed his residency in internal medicine at CabriniMedical Center in New York and completed a fellowship in gastroenterology at theChicago Medical School.
Dr. Gundlapalli earned his medical degree in 1999 from the Chicago Medical School. Hecompleted his residency in internal medicine at Rush Presbyterian/St. Luke’s MedicalCenter, in Chicago and completed a fellowship in gastroenterology/hematology, also atRush Presbyterian/St. Luke’s Medical Center.
Dr. Kastin earned his medical degree from the Tulane University School of Medicine, inNew Orleans, Louisiana. He completed his residency in internal medicine at Yale-NewHaven Hospital in New Haven, Connecticut and completed a fellowship ingastroenterology at Northwestern Memorial Hospital in Chicago, Illinois.
Dr. Nadimpalli earned his medical degree in 2001 from the Michigan State UniversityCollege of Human Medicine in East Lansing, Michigan. He completed his residency ininternal medicine at Rush University Medical Center in Chicago, Illinois and completedat fellowship in gastroenterology at the Henry Ford Health System, in Detroit, Michigan.
Staff
The non-physician staff census is presented In Exhibit IV.
ECONOMIC REVIEW AND OUTLOOK
National Economy
According to the KeyValueData September 30, 2013 economic report, the U.S.Commerce Department reported, U.S. economic growth rose by 2.5% in the secondquarter, as businesses spent more than previously thought and government cut less. Thisnew second-quarter figure was revised upward from the originally reported growth rate of1.7%, which the Commerce Department had announced on July 31. Also on July 31, theDepartment downwardly revised the first-quarter growth rate, which originally had beenestimated at 2.4% and already had been notched down to 1.8%, to a sluggish 1.1% pace.Previously, GDP growth in the fourth quarter of 2012, initially estimated at a 0.1%decline, came in at a final figure of a 0.4% gain, a sharp falloff from the Q3 2012 growthrate of 3.1%. Despite the tepid growth rates of the fourth and first quarters, mosteconomists do not believe that a renewed recession is in prospect, pointing out that the

HEALTHCARE MANAGEMENT CONSULTANTS
DRAFT – For Discussion Purposes Only9
economy is still expected to grow by at least 2.0% for all of 2013. Indeed, economists arehopeful that the growth rate for the third and fourth quarters will come in at around 2.5%,which the encouraging second-quarter figure suggests is certainly possible.
After giving indications early in September that it might taper off its $85 billion permonth bond-buying program for stimulating the economy that has been in force now for ayear, the U.S. Federal Reserve said on September 18 that it had decided against reducingthe stimulus effort because it thinks the economy still needs the support. In a statement,the Fed noted that it held off tapering the program because it wants to see moreconclusive evidence that the recovery will be sustained.
The U.S. Federal Reserve, on September 18, once again downgraded its forecast for thegrowth of the U.S. economy. The Fed’s revised projection for GDP growth in 2013 offrom 2.0% to 2.3% was down significantly from its June forecast of from 2.3% to 2.6%and from its March forecast of from 2.3% to 2.8%. The body’s forecast for economicgrowth in 2014 likewise was a barely-healthy 3.0%, below its previous forecast of from3.0% to 3.5% for 2014.
Economists have cut their expectations for 2013 U.S. economic growth, according to asurvey of forecasts released by the Federal Reserve Bank of Philadelphia on August 16.Specifically, the consensus view on expected GDP growth for all of 2013 is 1.5%, downsignificantly from the 2.0% expected when the survey was conducted last May. Thegroup also believes that the economy will growth just 2.2% in the third quarter of 2013and just 2.3% in the fourth quarter, down from forecasts of 2.3% and 2.7%, respectively,in the earlier report.
In a released delayed until October 22 by the partial government shutdown earlier in themonth, the U.S. Department of Labor reported that the number of people who held jobs inSeptember rose for the 13th straight month, with 148,000 new positions having beenadded. The jobs gain was significantly below economists’ expectations of 180,000 newjobs, however. Private payroll creation stood at just 122,000 for the month, with state andlocal governments adding 28,000 positions and the Federal government cutting 6,000. Onthe positive side, the Labor Department upwardly revised the originally reported 169,000gain in jobs for August, raising the number of new jobs for that month to 193,000,although July’s gains were revised down from 104,000 to 89,000. Economists generallyregarded the new report as weak.
After having dropped from 7.9% in January to 7.3% in August, the U.S. unemploymentrate fell further to 7.2% in September, the U.S. Labor Department said in a report delayedby the partial government shutdown until October 22. Overall, the jobless rate has
HEALTHCARE MANAGEMENT CONSULTANTS
DRAFT – For Discussion Purposes Only10
dropped just 0.6 percentage points during the previous 4-plus years, falling from 7.8% inJanuary 2009 to 7.2% in August 2013.
While the majority of jobs lost during the recent economic downturn were in the middlerange of wages, a majority of those added during the subsequent recovery have been low-paying, according to a report from the National Employment Law Project. Specifically,jobs in the middle third of wages, from $13.84 to $21.13 per hour, accounted for 60% ofjob losses from the beginning of 2008 to early 2010, but have accounted for only 22% ofjob gains in the more than three years since then. By contrast, low-paying jobsrepresented only 21% of job losses but have accounted for 58% of all post-recession jobgrowth.
Even though the overall number of U.S. jobs increased in June, the quality of those jobsdid not. In fact, while the number of part-time jobs soared by 360,000 in June to 28.0million, the number of full-time jobs declined by 240,000. For all of 2013, a net of just130,000 full-time jobs have been added, as compared to 557,000 part-time jobs.
In its most recent formal assessment, released on September 18, the U.S. Federal Reserveprojected that the U.S. unemployment rate would fall to no lower than 7.1% by year-end2013 (down from the 7.1% forecast in June but up from a forecast of 6.7% in its Marchprojections). The Fed also predicted that unemployment would fall to 6.4% by year-end2014 (down from its June forecast of 6.5% but up from its March projection of 6.0%).
On October 1, the U.S. Treasury Department reported that the deficit for fiscal 2012,which ended on September 30, had reached $1.276 trillion, the fourth trillion-dollardeficit in a row. Before 2008, the Federal government had never increased its debt by asmuch as $1 trillion in a single fiscal year. The U.S. Congressional Budget Officeprojected on February 5 that the Federal budget deficit for Fiscal Year 2013 actuallywould drop to $845 billion.
The U.S. Department of the Treasury reported on September 4 that total outstandingpublic debt in the United States had climbed to $16.02 trillion, the first time in U.S.history that the public debt had breached the $16 trillion level, and stood at $16.99 trillionthroughout the first half of August. The debt has risen by more than 56%, or more than$6.4 trillion, since January 1, 2009. As of March 31, the U.S. debt/GDP ratio stood at104.8%, up from 103.0% as of December 31, 2012.
The U.S. Congress passed and President Obama signed a budget and debt deal onOctober 17 than ended a 16-day partial government shutdown and averted a potentialfirst-ever U.S. default on the Federal debt. The House voted 285-144 to reopen thegovernment through January 15, suspend the debt ceiling through February 7, and lay the
HEALTHCARE MANAGEMENT CONSULTANTS
DRAFT – For Discussion Purposes Only11
groundwork for talks over broader budget issues. The Senate previously had approved themeasure by a vote of 81-18. Because of the short time frames specified in the bill, thereprieve from the budget and debt crisis is only temporary.
Federal spending now claims 24.0% of the nation’s gross domestic product (GDP), thehighest level since the 24.8% recorded in 1946. Moreover, Federal spending will increaseby 55% over the next decade under the provisions in the most recent Administrationbudget, according to an analysis by staff of the U.S. Senate Budget Committee.According to the August Monthly Treasury Statement of the U.S. Department of theTreasury, Federal spending hit an all-time record for the first 11 months of FY 2013,which ended on September 30. Spending for the period came in at $3.23 trillion, theDepartment noted.
After reaching record highs in July, the Dow Jones Industrial Average slipped from15,658.13 on August 1 to 14,022.50 on September 6. However, by September 13, theIndex had climbed back to 15,376.06. For the next month, through October 18, it edgedback up to 15,399.65. Likewise, the S&P Index fell from 1,706.87 on August 1 to1,655.17 on September 6 before rebounding to 1,744.50 on October 18, while theNASDAQ Composite dropped from 3,675.74 on August 1 to 3,660.01 on September 6before climbing back to 3,914.28 on October 18.
Economic activity in the U.S. manufacturing sector expanded in September for the fourthconsecutive month, according to an October 1 report from the Tempe-based Institute forSupply Management (ISM), a private trade group. The group’s index of manufacturingactivity edged up to 56.2% in September from a reading of 55.7% in August. Anymeasure above 50 indicates expansion, while any reading below 50 signifies contraction.
On April 30, the Institute for Supply Management (ISM) released its SemiannualEconomic Forecast, projecting that the U.S. manufacturing sector would continue to growthroughout 2013. The ISM’s panel of purchasing and supply executives forecast a 4.8%net increase in overall revenues for 2013 as compared to a 4.0% increase in revenues in2012. Fully 66% of panel members expected 2013 revenues to be greater than those of2012.
After falling by 2.4% in July following three straight months of gains, new orders forU.S. factory goods rose by 0.1% in August, the U.S. Commerce Department reported onSeptember 25. After plunging by 7.3% in July following three months of solid gains,U.S. durable goods orders inched up by 0.1% in August, the U.S. Commerce Departmentannounced on September 25. The Department noted that the figures suggest that U.S.businesses are making only tentative investments in new production capacity. By

HEALTHCARE MANAGEMENT CONSULTANTS
DRAFT – For Discussion Purposes Only12
contrast, businesses and consumers typically make big-ticket purchases on long-lastinggoods when they are confident about the economy.
U.S. workers and businesses improved their productivity during the second quarter of2013 after declines in the measure in both Q4 2012 and Q1 2013, the U.S. LaborDepartment reported on August 16. Overall, nonfarm productivity rose by 0.9% on anannualized basis during the second quarter of 2013. The originally reported 0.5% gain inproductivity for the first quarter was revised sharply downward at the same time to anegative 1.7%. Previously, productivity contracted at an annual rate of 2.0% duringfourth quarter of 2012, the biggest drop in that indicator since the first quarter of 2011.Before that, productivity climbed by 2.2% in the second quarter of 2012 and by 3.2% inthe third quarter of 2012.
The opening of the statewide health exchanges under the aegis of the Affordable CareAct has been plagued by a wide range of problems, including server overloads,inaccessible application pages, and misrouting of applicant data to insurers. As a result,according to an exclusive report on October 10 by London’s Daily Mail, only 6,000people had completed applications under the new system on its first day of operation andjust 51,000 during the first week—about 10% of the original goal of 500,000 people. ACongressional Budget Office report released earlier this year had determined that theexchanges needed at least 7 million customers in order to remain financially afloat.Separately, the Huffington Post reported on October 18 that failures of the government’ssignup web site, HealthCare.gov, could “threaten health coverage for millions ofAmericans” due to unsuccessful applications.
According to a May 13 report on internal cost estimates from 17 of the nation’s largestinsurance companies, health premiums could rise by an average of 100% underObamacare, and that some would soar by more than 400%. And official U.S. Departmentof Health & Human Service (HHS) figures—analyzed by The Manhattan Institute andreported in the September 25 edition of Forbes—show that the underlying insurance ratesfor younger men will go up by approximately 99% while those for younger women willclimb by up to 63%. In North Carolina, the rates for young women will triple, and theywill quadruple for young men. Other official HHS data, reported in the September 25Wall Street Journal, reveal sharp increases in the lowest-cost plans, with rates doubling ornearly tripling in such diverse states as Pennsylvania, Tennessee, and Wyoming.
According to the Kaiser Family Foundation’s annual health survey, released on August23 and reported on Investors.com, average employer-provided family health insurancepremiums have climbed by $2,976 since 2009. They’re also up by $3,671 compared withthe year before President Obama took office. All this is despite repeated White Housepromises that the Affordable Care Act would indeed make health care more affordable,

HEALTHCARE MANAGEMENT CONSULTANTS
DRAFT – For Discussion Purposes Only13
with the specific pledge that it would cut health premiums by about $2,500 during thefirst four years after the law’s enactment.
The Conference Board Consumer Confidence Index, which had increased slightly inAugust, decreased in September. The Index now stands at 79.7 (1985=100), down from81.8 in August. The Present Situation Index grew to 73.2 from 70.9. The ExpectationsIndex fell to 84.1 from 89.0 last month. Said Lynn Franco, Director of EconomicIndicators: “Consumer confidence decreased in September as concerns about the short-term outlook for both jobs and earnings resurfaced… Consumers’ assessment of currentbusiness and labor market conditions, however, was more positive. While overalleconomic conditions appear to have moderately improved, consumers are uncertain thatthe momentum can be sustained...”
After declining in August and September, the Thomson Reuters/University of MichiganIndex of Consumer Sentiment fell again in October, slipping from 77.5 in September to75.2 in October and reaching its lowest level in nine months, the survey takers reportedon October 11. U.S. consumer confidence sank to its lowest level in eight months,according to the Bloomberg Consumer Comfort Index. The index declined from minus34.1 to minus 36.1 in the period ended October 20, its lowest point since February. TheBloomberg report also showed that more households were pessimistic about the economythan at any time in the past year.
After edging up by only 0.1% in July, U.S. personal incomes rose by 0.4% in August, thebiggest gain since February, the U.S. Commerce Department reported on September 27.The median net worth of American households has dropped to a 43-year low as the lowerand middle classes appear poorer and less stable than they have been since 1969,according to a recent study by New York University economics professor Edward N.Wolff. According to a July 30 report in Investor’s Business Daily, income inequality inthe United States has grown faster during the past four years than at any time during theprevious two decades. Overall, from June 2009 through December 2011, the averageincome of the top 1% of American income-earners grew by 11.2%, while the averageincome of the bottom 99% fell by 0.4%. As a result, according to a September 10 APreport, the gulf between the richest 1% of Americans and the rest of the country is thewidest it has been since the 1920s.
U.S. Census Bureau data indicate that a record 46.5 million Americans are now living inpoverty, new data released on September 17 show. At least 20% of the nation’s childrenare now classified as poor.
The amount of money that the Federal government distributes in direct payments toindividuals has risen by 32% over the last three years—an increase of nearly $600 billion.
HEALTHCARE MANAGEMENT CONSULTANTS
DRAFT – For Discussion Purposes Only14
The most recent Federal budget calls for another $500 billion increase by 2016. Over theprevious two years, the percentage of American families relying on some form ofgovernment payment has risen by 23%. During FY 2012, the U.S. government spent arecord $80.4 billion on food stamps, a $2.7 billion increase over FY 2011 levels,according to the U.S. Treasury Department. The U.S. Department of Agriculture furtherreported that, as of December 2012, 47.8 million people (some 15% of Americans, or 1 in7) were receiving food stamps—another record. Likewise, the number of households onfood stamps is 23.1 million—or 1 of 5 American households—also a record. The WallStreet Journal says that food stamp enrollment has soared by 70% since 2008
A record 8.80 million workers took Federal disability payments in October, up from 8.79million in September, according to the U.S. Social Security Administration. The increasewas the 201st straight monthly record. There is now one disability recipient for every 13U.S. workers.
After increasing by an upwardly revised 0.6% in June and edging up by 0.1% in July,consumer spending by U.S. households rose by 0.3% in August, the U.S. CommerceDepartment reported on September 27. According to new Federal Reserve data disclosedin an October 12 report on CNBC, U.S. consumer credit has now breached the $3 trillionmark and, at a total of $3.04 trillion, is up by 22% over the previous three years.Aggregate student loan debt over the same period is up by 61%. Total household debtnow stands at $13 trillion, nearly back to its pre-crisis level of 2007.
On a seasonally adjusted basis, the U.S. Consumer Price Index (CPI) for all goodsincreased by 0.1% in August after rising by 0.2% in July and by 0.5% in June. The indexfor all items less food and energy climbed by 0.1% in August after increasing by 0.2% ineach of June and July.
The Producer Price Index (PPI) for finished goods, often, a harbinger of future consumerprice movements, rose by 0.3% in August after being unchanged in July and rising by0.8% in June. With food and energy prices excluded, producer prices were unchanged inAugust after rising by 0.1% in July
Following months of unrest in Egypt that threatened to disrupt oil supplies from theMiddle East, U.S. crude oil prices soared from $98 a barrel at the beginning of July tomore than $107 per barrel by early September. However, crude prices cooled offthereafter, dropping back below $100 a barrel (to $99.28 per barrel) on October 21.
In concert with recent crude oil price declines, the retail price of a regular gallon ofconventional, unleaded gasoline in the United States rose from $3.41 per gallon during

HEALTHCARE MANAGEMENT CONSULTANTS
DRAFT – For Discussion Purposes Only15
the first week of July to $3.61 per gallon in early September. Thereafter, prices dove to$3.36 per gallon by October 21.
State Economy
Illinois, covering an area of 57,918 square miles, is the most populous anddemographically diverse Midwestern state and the fifth most populous state in the nation.The biggest city in Illinois by population and industrial production is Chicago. The mostpopulous cities are Chicago (with a population of 2.7 million within the city limits),Aurora, Rockford, and Joliet. Located at the center of the nation with excellenttransportation infrastructure, Illinois is a national crossroads for air, auto, rail, and trucktraffic. Airports in the Chicago area are O’Hare International Airport and MidwayInternational Airport. Illinois has an extensive passenger and freight rail transportationnetwork. Interstate highways crossing Illinois include I-24, I-39, I-55, I-57, I-64, I-70, I-72, I-74, I-80, I-88, I-90, and I-94.
Many well-known companies have headquarters in Illinois, including AbbottLaboratories, Allstate, Baxter International, Brunswick Corporation, Boeing Co, CDW,Hewitt Associates, Illinois Tool Works, McDonald’s Corporation, Motorola, UnitedAirlines, Walgreen’s, etc.
However, Illinois has been impacted by the global economic downturn just as much asthe rest of the US and in some cases more. According to the Illinois Department ofEmployment Security, the unemployment rate during September 2012 for Illinois was8.80%, exceeding the national average.
According to the U.S. Bureau of Economic Analysis, Illinois’s gross state product in2011 was $670.73 billion and ranked fifth in the United States. In 2011 Illinois had a percapita personal income (PCPI) of $43,721. This is 105% of the national average of$41,560. The 2011 Illinois PCPI reflected an increase of 4.0% from 2010. The 2010-2011 national change was 4.4%.
Agriculture
More than 28 million acres are farmed in Illinois. Illinois’s agricultural outputs are corn,soybeans, hogs, cattle, dairy products, and wheat. For many years Illinois was the leadingstate for the production of soybeans, with a harvest of 466 million bushels in 2010.Illinois farmers received the highest average price nationwide at $12.40 per bushel. TotalIllinois soybean value was $5.779 billion last year, edged out for the top only by Iowa.Illinois is ranked second in total corn production. Livestock is a small but steady sidelinefor farmers, although the state remains a large producer of hogs.

HEALTHCARE MANAGEMENT CONSULTANTS
DRAFT – For Discussion Purposes Only16
Manufacturing
The largest contributor to real GDP growth in Illinois is durable goods manufacturing.This industry accounted for .67 percentage point of the total growth in real GDP. Thesecond largest contributor was wholesale trade. This industry accounted for 0.21percentage point of the total growth in real GDP.
The Illinois manufacturing industry includes about 15,700 companies with combinedannual revenue of $258 billion. Manufacturing employs about 663,600 with an annualpayroll of $32 billion. Major manufacturing sub-sectors include petroleum and coalproducts (valued at $34 billion); chemicals ($34 billion); food products ($34 billion);machinery ($31billion); and transportation equipment ($24 billion). The industrycontributes $84.3 billion to gross state product, representing 12.9% of Illinois's total grossstate product. Annual capital expenditures total $9.9 billion. Issues impactingmanufacturers include raw material, labor, and energy costs; foreign competition; labor,pollution, and foreign trade regulations; supplier and customer consolidation; capitalequipment and facility expenses; quality control; and labor relations. Illinoismanufacturing industry annual exports total about $46.3 billion. Annual labor turnover is4.1%.
Illinois transportation and warehousing industries include about 9,900 companies withcombined annual revenue of $19 billion. Transportation and warehousing industriesemploy approximately 181,900 with an annual payroll of $5.9 billion. Large sub-sectorsinclude air transport (valued at $12 billion); trucking ($11.3 billion); support activities fortransportation ($5.6 billion); and couriers and messenger ($3.3 billion). The industrycontributes $21.9 billion to gross state product, representing 3.4% of Illinois's total grossstate product. Issues impacting the transportation and warehousing industry include fuel,equipment, and building costs; port traffic and shipment flows; security and freight theft;vehicle pollution regulations and maintenance; driver shortages and licensing; technologyfor logistics and shipment tracking. Annual labor turnover is 6.1%.
Services
In 2010, the largest industry in Illinois was real estate and rental and leasing. Thisindustry accounted for 12.8% of Illinois GDP and had 0.2% real growth. The secondlargest industry was finance and insurance, which accounted for 10.6% of Illinois GDPand had 1.5% real growth.

HEALTHCARE MANAGEMENT CONSULTANTS
DRAFT – For Discussion Purposes Only17
Healthcare
The IL healthcare industry includes about 31,000 companies with combined annualrevenue of $70 billion. The healthcare industry employs approximately 706,700 with anannual payroll of $28 billion. The largest healthcare subsectors include ambulatoryservices (valued at $27 billion) and hospitals ($31 billion). The industry contributes $47.8billion to the gross state product, representing 7.3% of Illinois's total gross state product.Issues impacting the healthcare industry include government regulation ofMedicare/Medicaid, doctor/nurse shortages, medical malpractice suits, and care foruninsured patients. About 13% of IL residents lack health insurance. Annual laborturnover is 6.4%.
Culture
Illinois' cultural scene is dominated by Chicago, which is one of the leading culturalcenters in the country. Boasting dozens of art, science, history, and natural historymuseums, as well as outstanding private libraries and theater, dance, and operacompanies, Chicago rivals New York City in its cultural pursuits. Over the years, the cityhas become renowned for several distinct styles in various avenues of the arts. Followingthe Chicago Fire of 1871, a new school of architecture emerged, known as the ChicagoStyle, which was groundbreakingly modern and produced some of the 20th century'sgreatest architectural talents, including Frank Lloyd Wright. During the 1920s, Chicagobecame the meeting place for some of the best jazz and blues musicians in the world. Anannual blues festival continues to secure Chicago's place as the world's blues capital.With a large, multiethnic population, Chicago also hosts numerous ethnic festivalsthroughout the year, celebrating a wide range of cultures through dance, music, costume,and food. The rest of Illinois also supports fine art museums, symphony orchestras, andperforming arts groups. Illinoisans are proud of the state's history, focusing particularlyon the state's role in settling the West and its wild Prohibition days when Chicago servedas home to colorful bootleggers and their speakeasy nightclubs. Illinois also boasts of twoof the state's most famous native sons, presidents Abraham Lincoln and Ulysses S. Grant.Historical markers and museums are located throughout the state commemorating its richhistory.
Financial
Illinois ended FY2012 with a deficit of $8.3 billion. Although the state reducedspending, any benefits were negated by higher pension costs and increased borrowingcosts. Illinois’ widening deficit, huge unfunded pension liability, inability to pay its billson time, and lowered bond ratings have made the state a major financial worry. Money
HEALTHCARE MANAGEMENT CONSULTANTS
DRAFT – For Discussion Purposes Only18
raised through the increased income tax rate is being absorbed by Medicaid and thestate’s pension plans. It is not able to help pay the state’s debts.
The state economy should be analyzed in performing a valuation to help to determinespecific risks associated with the particular region in which the Company operates. In thisinstance, the state economy is performing poorly in many areas and could have a negativeimpact on all businesses in Illinois.
Local Economy
Naperville
The city of Naperville, located approximately 30 miles west of Chicago, is located inDuPage and Will Counties of Illinois. It is the fifth largest city in the state. According tothe United States Census Bureau, the city has a total area of 35.5 square miles. 35.4square miles of it is land and 0.1 square miles of it is water. The city has become a majorpart of the “research and development” corridor along Interstate 88 with headquarters forTellabs, Nicor Gas, First American Title, Dukane Precast, and OfficeMax. According toNaperville’s Comprehensive Annual Financial Report, the top employers in the cityinclude Edward Hospital, Nicor, Alcatel-Lucent, BP America and Tellabs.
One of the most popular attractions in Naperville is the Riverwalk in the downtown area.It features almost two miles of brick paths, fountains, bridges, meeting and event places,outdoor sculpture and artwork, and restaurants. Naperville has been ranked by MoneyMagazine in the top 5 best places to live in America three out of the past six years.
Edward Hospital is a full-service inpatient and outpatient medical center offering healthservices, behavioral health services, a medically based fitness center, and a sportmedicine program to the residents of Naperville and the surrounding areas.
The population within the 10 mile radius of the practice office increased from 821,632 to836,298, resulting in an increase of 1.78% between 2010 and 2013. Over the next fiveyears, the population in this area is projected to increase to 856,866 from 2013 to 2018.Over the next five years the U.S. population is projected to grow by 3.3%. Therefore, thepopulation around the office is growing at a slower rate than the national average.
According to the Claritas Site reports, the population in the 10 mile radius of the office is70.81% White, 8.05% African American, 0.33% American Indian and Alaska Native,8.99% Asian, 9.07% some other race, and 2.76% are two or more races. This area’scurrent estimated Hispanic or Latino population is 22.0%, while the United State’scurrent estimated Hispanic or Latino population is 17.3%. According to the 2013 data

HEALTHCARE MANAGEMENT CONSULTANTS
DRAFT – For Discussion Purposes Only19
describing the population within a 10 mile radius of the practice office, the age group of55 and over was 21.52% of the population. The age group of 35-54 constituted 29.31%,25-34 constituted 12.40%, 18-24 made up 9.16% and those younger than age 18 made up27.63% of the population. The 2013 median age is 35.6 and the average age is 35.8. The2013 median age for the United States is 37.5, while the average age is 38.3.
The average household income within the 10 mile radius of the office is estimated to be$96,868 for 2013, while the average household income for the United States is estimatedto be $69,637 for the same period. The average household income in this area isprojected to increase to $101,280 over the next five years. Over the same time period,the average household income in the United States is projected to grow to $71,917. It isestimated that approximately 33% of households in the area will have income less than$50,000 in the year 2013.
The following table describes the households by household income within the 10 mileradius of the office.
2013 Est. Households by Household Income # Households %
Income < $15,000 17,054 5.94
Income $15,000 - $24,999 19,754 6.88
Income $25,000 - $34,999 24,194 8.43
Income $35,000 - $49,999 33,314 11.61
Income $50,000 - $74,999 50,218 17.50
Income $75,000 - $99,999 42,432 14.79
Income $100,000 - $124,999 32,563 11.35
Income $125,000 - $149,999 22,024 7.67
Income $150,000 - $199,999 24,844 8.66
Income $200,000 - $249,999 7,688 2.68
Income $250,000 - $499,999 10,182 3.55
Income $500,000+ 2,714 0.95
The local economy and population growth rates are important aspects to consider whenperforming a business valuation. The local economy represents the immediateenvironment in which the company operates. The household income of the area practiceoffice is higher than the national average and the population is expected to increase overthe next five years. These two factors, plus the relative stability of the Napervilleeconomy, indicate that there is little risk associated with the local economy andpopulation that would affect the Company.

HEALTHCARE MANAGEMENT CONSULTANTS
DRAFT – For Discussion Purposes Only20
FINANCIAL REVIEW
Historical Financial Statements
We were provided the financial statements and tax returns for the years ended December31, 2009, December 31, 2010, December 31, 2011, December 31, 2012 and financialstatements for year to date September 30, 2013. The business started in 2008. A reviewof these financial statements and tax returns allows us to determine the operationalhistory of the company to draw inferences as to future performance. The financialstatements and tax returns were prepared by Professional Business Management Inc.located in Barrington, Illinois. They were prepared on a cash basis.
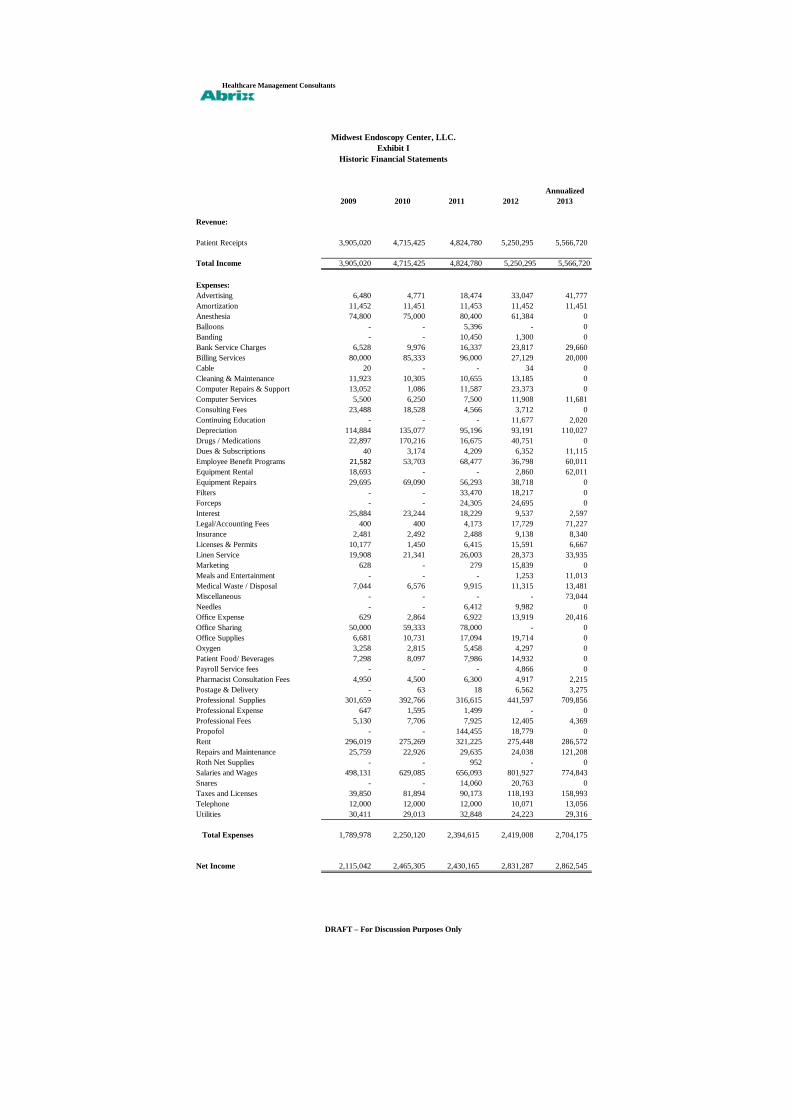
Exhibit I presents the historical income statement of the business. The patient receiptsfor the years ended December 31, 2009, December 31, 2010, December 31, 2011,December 31, 2012, and annualized September 30, 2013 on a cash basis were$3,905,020, $4,715,425, and $4,824,780, $5,250,295, and $5,566,720 respectively. Thecash basis patient receipts increased 20.75% from 2009 to 2010, increased 2.32% from2010 to 2011, increased 8.82% from 2011 to 2012, and increased 6.03% from 2012 toannualized 2013. The compounded annual growth rate is 9.27% from 2009 to 2013 and5.69% from 2010 to 2013.
Exhibit II reflects the operating expenses per the tax return for the years endedDecember 31, 2009, December 31, 2010, December 31, 2011, December 31, 2012, andannualized September 30, 2013. They were as follows: $1,789,978, $2,250,120,$2,394,615, $2,419,008, and $2,704,175 respectively. From these amounts we subtracteddepreciation and amortization that were included as expenses for purposes of the taxreturns. Depreciation and amortization are non-cash expenses and should not be includedin total operating expenses. We also subtracted interest expense to reflect that interest isnot an operating expense. The legal and accounting expense for 2013 is reduced toreflect the additional legal fees incurred in 2013 related to the sales transaction. The2013 advertising expense is reduced by $39,277 to reflect estimated annual advertisingexpenditures of $2,500. The 2013 meals and entertainment expense is reduced by $8,013to reflect estimated annual meals and entertainment expenditures of $3,000. The 2013dues and subscriptions expense is reduced by $7,115 to reflect estimated annual dues andsubscription expenditures of $4,000. The 2013 property tax expense is reduced by$7,999 to normalize property taxes to the current annual rate of $24,200. Because thebuilding is owned by Dr. Berger and Dr. Jain, the rent expense was reviewed todetermine whether it was fair market value. Using information from a commercial
HEALTHCARE MANAGEMENT CONSULTANTS
DRAFT – For Discussion Purposes Only21
broker, it was determined that a fair market rent for the area is between $40 and $45 persquare foot. For purposes of this valuation, we utilized the rate of $45 per square foot asa fair market rent value. Multiplying $45 by the total square footage of the office, 5,943,results in an annual fair market rent of $267,435. The normalized rent adjustmentsshown in Exhibit II reflect the difference between $267,435 and the amount of rent thatwas actually paid each year. The adjusted operating expenses for the years endedDecember 31, 2009, December 31, 2010, December 31, 2011, December 31, 2012, andannualized September 30, 2013 are $1,609,174, $2,072,514, $2,215,947, $2,296,815, and$2,445,061 respectively. The operating expenses increased 28.79% from 2009 to 2010,increased 6.92% from 2010 to 2011, increased 3.65% from 2011 to 2012, and increased6.45% from 2012 to 2013. The compounded annual growth rate is 11.03% from 2009 to2013 and 5.66% from 2010 to 2013.
CONCLUSION OF VALUE
I. BUSINESS VALUATION METHODOLOGY
Overview
Business valuation methodology is based on two principles: “the principle ofsubstitution” and “the principle of future benefits”. The principle of substitution statesthat the value of property tends to be determined by the cost of acquiring an equallydesirable substitute. In other words, a person will not purchase a particular asset if such asubstitute can be purchased at a lower price.
The principle of future benefits states that the economic value of an investment reflectsanticipated future benefits, not past performance. Although the past may serve as a proxyfor the future, a business that has had poor earnings in the past but bright future prospectswill be worth more than a business that has been successful in the past but is not expectedto be as profitable in the future.
The fair market value of securities trading on an active public market is determined byactual market quotations on a particular date, unless the market for a security is affectedby some abnormal influence or condition. Determination of fair market value ofsecurities of closely held corporations, however, cannot be as precisely determined, thuscreating the need for alternative valuation methodologies. Section 3.01 of RevenueRuling 59-60 acknowledges the disparate results that may occur:
A determination of fair market value, being a question of fact, will depend upon the circumstancesin each case. No formula can be devised that will be generally applicable to the multitude ofdifferent valuation issues arising in estate and gift tax cases. Often, an appraiser will find wide

HEALTHCARE MANAGEMENT CONSULTANTS
DRAFT – For Discussion Purposes Only22
differences of opinion as to the fair market value of a particular stock. In resolving suchdifferences, he should maintain a reasonable attitude in recognition of the fact that valuation isnot an exact science. A sound valuation will be based upon all the relevant facts, but the elementsof common sense, informed judgment and reasonableness must enter into the process of weighingthose facts and determining their aggregate significance.
The commonly used methods of valuation are discussed below:
Income Approach
The application of the income approach establishes value by methods that capitalizefuture anticipated benefits, such as cash flow, by a discount or capitalization rate thatreflects market rate of return expectations or conditions as well as the relative risk of theinvestment. Generally, this can be accomplished by the capitalization of earnings or cashflow method and the discounted cash flow (DCF) method.
When applying the income approach we use cash flow as the type of earnings to use as ameasurement of economic income. The use of net cash flows is preferred because cashflows represent the type of earnings that most investors are seeking and expect to receivefrom their investments. In addition, net cash flows take into consideration the futureexpected working capital needs, capital expenditures, and changes in long-term debtnecessary to support the projected earnings of the company.
Although the use of the income approach was considered, we did not rely upon thismethod because it was not a reasonable indication of value.
Market Approach
Value can be determined using the market approach by comparing the business to similarbusinesses, business interest, or securities that are for sale or have been sold. Generally,this can be accomplished by a comparison to publicly traded guideline companies or byan analysis of actual transactions of similar businesses sold. The criteria forcomparability in the selection of publicly traded guideline companies or guidelinetransactions include business and operational characteristics, size measures, growth ratepatterns, earnings trends, markets served, and risk characteristics.
We did not use either the guideline public company method or the guideline transactionmethod to calculate a value of Midwest Endoscopy Center, LLC as we were not satisfiedthat there were companies similar enough to this company to make useful comparisonsthat would translate into calculating a value of it. However, we performed additional
HEALTHCARE MANAGEMENT CONSULTANTS
DRAFT – For Discussion Purposes Only23
research into applicable market multiples, specifically using EBITDA (Earnings BeforeInterest, Taxes, Depreciation, Amortization) to determine fair market value.
Our consideration of the relevant factors led us to conclude that the value of MidwestEndoscopy Center, LLC is most appropriately determined using a market multiple ofEBITDA.
Asset Based Approach
The asset approach establishes value by measuring the fair market value of assets by thecost of reproducing or replacing them, less an allowance for deterioration andobsolescence. This total adjusted asset value is then reduced by the fair market value ofall liabilities.
As part of the valuation process, a site visit was completed and a listing of all assetsowned compiled. Using purchase price information provided by the practice, as well asthird party market data, we valued a sampling of the assets, concentrating on the largerpriced assets.
This approach is usually of greater importance when valuing investment or holdingcompanies as well as in the valuation of asset-intensive operating companies with modestprofitability, but may be used for valuing individual components of a business enterprise.We considered the use of this method; however the net asset value of MidwestEndoscopy Center, LLC is relatively insignificant, as is generally the case with servicebusinesses, we did not rely upon this method because it was not a reasonable indicationof value.
II. CALCULATION OF VALUE
Overview
Determining the value of closely held businesses presents a challenge because of the lackof a ready market. Securities which have an active public market with actual marketquotations are more easily valued by reference to the marketplace for the particularsecurity at a point in time. Contrary to this, the value of closely held securities must bedetermined by a process of careful and impartial analysis.
The principles which have governed this valuation provide a basis for the determinationof value where an active market for a company’s securities is lacking. Our valuation
HEALTHCARE MANAGEMENT CONSULTANTS
DRAFT – For Discussion Purposes Only24
process analyzed the earning power of Midwest Endoscopy Center, LLC and the abilityof the company to convert this earning power into value.
It is important to note that in the valuation of a closely held business, no single method isan absolute. To produce a sound conclusion, the professional valuator uses as many or asfew of the different methods that are appropriate under the given circumstances of thesituation and for which the necessary information is available.
Revenue Ruling 59-60, Section 3, Approach to Valuation, Paragraph 3 states:
… valuation of securities is, in essence, a prophesy as to the future and must be based on factsavailable at the required date of the appraisal. As a generalization, the prices of stocks which aretraded in volume in a free and active market by informed persons best reflect the consensus of theinvesting public as to what the future holds for the corporation and industries represented. Whena stock is closely held, is traded infrequently, or is traded in an erratic market, some othermeasure of value must be used.
Section 4, Factors to Consider, also states:
… in the valuation of the stock of closely held corporations or the stock of corporations wheremarket quotations are either lacking or too scarce to be recognized, all available financial data,as well as all relevant factors affecting the market value, should be considered.
Valuation Method Selected
Our consideration of the relevant factors in the case at hand led us to conclude that thevalue of Midwest Endoscopy Center, LLC for the intended purpose of this report, is mostappropriately determined by use of the EBITDA market multiple. In the sections below,we discuss this approach. These approaches are consistent with Revenue Ruling 59-60,Section 5, Weight Accorded to Various Factors:
The valuation of closely held corporate stock entails the consideration of all relevantfactors as stated in Section 4. Depending upon the circumstances in each case, certainfactors may carry more weight than others because of the nature of the company’sbusiness. To illustrate:
(a) Earnings may be the most important criterion of value in some cases whereas assetvalue will receive primary consideration in others. In general, the appraiser willaccord primary consideration to earnings when valuing stocks of companies whichsell products or services to the public…
HEALTHCARE MANAGEMENT CONSULTANTS
DRAFT – For Discussion Purposes Only25
Market Approach Using Market Multiple
We performed additional research into applicable market multiples, specifically usingEBITDA (Earnings Before Interest, Taxes, Depreciation, Amortization) to determine fairmarket value. Per Merritt Healthcare Solutions, “there is currently a robust, activemarket for the acquisition of ambulatory surgical centers and endoscopy centers.” Forcenters with consistent earnings history, diversified revenue base, and strong growthprospects, the multiple is in the 7 times earnings range. Per the 2013 VMG HealthValueDriver Ambulatory Surgical Care Survey, a majority of control-level (greater than50%) transactions occurred between 5 times and 7 times EBITDA. Also per the survey, amajority of respondents were willing to pay a premium for an ASC of .25 to .75 for anASC with a Certificate of Need. In compiling the survey, VMG spoke with leaders of thenation’s twenty largest and most well respected Ambulatory Surgical Center managementand operating companies. Per a 2012 article by Becker Healthcare, multiples for serious,very strong ambulatory surgical centers are in the 6.5 to 7.5 EBITDA range.
We have determined the appropriate multiple to use in valuing Midwest EndoscopyCenter, LLC to be 7.5 times EBITDA. Midwest Endoscopy is a strong endoscopy centerwith a consistent growth of receipts. It is one of the few facilities in Illinois to berecognized by the American Society for Gastrointestinal Endoscopy for promotion ofquality in endoscopy. We added a .50 premium to reflect that the Center has a Certificateof Need from the State of Illinois.
Per Exhibit III, multiplying the EBITDA of $3,121,659 by 7.5, results in a fair marketvalue of $23,412,443.
III. CONCLUSION OF VALUE
This valuation has been prepared by The Abrix Group, L.P. to establish the fair marketvalue of Midwest Endoscopy Center, LLC for purposes of a sale of a partial interest ofthe Center. It is our opinion that as of September 30, 2013, the total fair market value ofMidwest Endoscopy Center, LLC, excluding $102,000 cash on hand, assuming that alllong-term liabilities will be paid by the seller prior to sale, and assuming that a restrictivecovenant will be put in place, is $23,412,443, rounded to $23,412,000. The valuation isprepared on the assumption that the sale will be a majority interest in the Center and the100% value be adjusted accordingly to the interest purchased.
Healthcare Management Consultants
Annualized
2009 2010 2011 2012 2013
Revenue:
Patient Receipts 3,905,020 4,715,425 4,824,780 5,250,295 5,566,720
Total Income 3,905,020 4,715,425 4,824,780 5,250,295 5,566,720
Expenses:
Advertising 6,480 4,771 18,474 33,047 41,777
Amortization 11,452 11,451 11,453 11,452 11,451
Anesthesia 74,800 75,000 80,400 61,384 0
Balloons - - 5,396 - 0
Banding - - 10,450 1,300 0
Bank Service Charges 6,528 9,976 16,337 23,817 29,660
Billing Services 80,000 85,333 96,000 27,129 20,000
Cable 20 - - 34 0
Cleaning & Maintenance 11,923 10,305 10,655 13,185 0
Computer Repairs & Support 13,052 1,086 11,587 23,373 0
Computer Services 5,500 6,250 7,500 11,908 11,681
Consulting Fees 23,488 18,528 4,566 3,712 0
Continuing Education - - - 11,677 2,020
Depreciation 114,884 135,077 95,196 93,191 110,027
Drugs / Medications 22,897 170,216 16,675 40,751 0
Dues & Subscriptions 40 3,174 4,209 6,352 11,115
Employee Benefit Programs 21,582 53,703 68,477 36,798 60,011
Equipment Rental 18,693 - - 2,860 62,011
Equipment Repairs 29,695 69,090 56,293 38,718 0
Filters - - 33,470 18,217 0
Forceps - - 24,305 24,695 0
Interest 25,884 23,244 18,229 9,537 2,597
Legal/Accounting Fees 400 400 4,173 17,729 71,227
Insurance 2,481 2,492 2,488 9,138 8,340
Licenses & Permits 10,177 1,450 6,415 15,591 6,667
Linen Service 19,908 21,341 26,003 28,373 33,935
Marketing 628 - 279 15,839 0
Meals and Entertainment - - - 1,253 11,013
Medical Waste / Disposal 7,044 6,576 9,915 11,315 13,481
Miscellaneous - - - - 73,044
Needles - - 6,412 9,982 0
Office Expense 629 2,864 6,922 13,919 20,416
Office Sharing 50,000 59,333 78,000 - 0
Office Supplies 6,681 10,731 17,094 19,714 0
Oxygen 3,258 2,815 5,458 4,297 0
Patient Food/ Beverages 7,298 8,097 7,986 14,932 0
Payroll Service fees - - - 4,866 0
Pharmacist Consultation Fees 4,950 4,500 6,300 4,917 2,215
Postage & Delivery - 63 18 6,562 3,275
Professional Supplies 301,659 392,766 316,615 441,597 709,856
Professional Expense 647 1,595 1,499 - 0
Professional Fees 5,130 7,706 7,925 12,405 4,369
Propofol - - 144,455 18,779 0
Rent 296,019 275,269 321,225 275,448 286,572
Repairs and Maintenance 25,759 22,926 29,635 24,038 121,208
Roth Net Supplies - - 952 - 0
Salaries and Wages 498,131 629,085 656,093 801,927 774,843
Snares - - 14,060 20,763 0
Taxes and Licenses 39,850 81,894 90,173 118,193 158,993
Telephone 12,000 12,000 12,000 10,071 13,056
Utilities 30,411 29,013 32,848 24,223 29,316
Total Expenses 1,789,978 2,250,120 2,394,615 2,419,008 2,704,175
Net Income 2,115,042 2,465,305 2,430,165 2,831,287 2,862,545
Midwest Endoscopy Center, LLC.
Exhibit I
Historic Financial Statements
DRAFT – For Discussion Purposes Only

Healthcare Management Consultants
Annualized12/31/2009 12/31/2010 12/31/2011 12/31/2012 9/30/2013
Unadjusted Total Expenses 1,789,978 2,250,120 2,394,615 2,419,008 2,704,175
Less: Depreciation (114,884) (135,077) (95,196) (93,191) (110,027)
Amortization (11,452) (11,451) (11,453) (11,452) (11,451)
Interest (25,884) (23,244) (18,229) (9,537) (2,597)
Legal and Accounting - - - - (53,498)
Advertising - - - - (39,277)
Meals and Entertainment - - - - (8,013)
Dues and Subscriptions - - - - (7,115)
Property Tax - - - - (7,999)
Rent Normalization Adjustment (28,584) (7,834) (53,790) (8,013) (19,137)
Total Adjusted Operating Expenses 1,609,174 2,072,514 2,215,947 2,296,815 2,445,061
DRAFT – For Discussion Purposes Only
Midwest Endoscopy Center, LLCExhibit II
Adjusted Expenses

Healthcare Management Consultants
Annualized9/30/2013
Net Income per Financial Statements 2,862,545
Legal and Accounting Normalization Adjustment 53,498
Advertising Normalization Adjustment 39,277
Meals and Entertainment Normalizing Adjustment 8,013
Dues and Subscriptions Normalizing Adjustment 7,115
Property Tax Normalizing Adjustment 7,999
Rent Expense Normalization Adjustment 19,137
Adjusted Net Income 2,997,584
Plus:
Interest 2,597
Depreciation 110,027
Amortization 11,451
EBITDA 3,121,659
EBITDA times 7.5 23,412,443
Fair Market Value Rounded 23,412,000
Midwest Endoscopy Center, LLC
Exhibit III
Value Using EBITDA Multiple
DRAFT - For Discussion Purposes Only

Healthcare Management Consultants
Staff Date of Hire Hourly Pay Status Estimated FTE
Clinical
Director 4/26/2011 $48.08 Direct /Salary 1.00
RN 6/19/1995 $34.00 Shared / Hourly 0.30
RN 1/12/2005 $31.00 Direct / Hourly 1.00
RN 6/2/2008 $30.00 Direct / Hourly 1.00
RN 6/15/2011 $30.00 Shared / Hourly 0.70
RN 2/14/2013 $30.00 Shared / Hourly 0.63
RN 9/10/2007 $31.88 Direct / Hourly 1.00
RN 9/14/2007 $30.00 Shared / Hourly 0.60
RN 9/4/2002 $32.00 Shared / Hourly 0.60
RN 6/28/2006 $31.00 Direct / Hourly 1.00
RN 2/12/2010 $30.00 Shared / Hourly 0.50
RN 3/15/2010 $27.00 Direct / Hourly 1.00
RN / Infection Control 7/12/2011 $30.00 Shared / Hourly 0.25
LPN 12/27/2010 $19.00 Shared / Hourly 0.75
Tech 5/7/2012 $13.00 Direct / Hourly 0.38
Tech 12/27/2007 $16.00 Direct / Hourly 1.00
Tech 10/9/2009 $17.00 Direct / Hourly 0.23
Tech 10/8/2012 $12.00 Direct / Hourly 0.90
Tech 2/21/2012 $13.25 Direct / Hourly 0.95
Tech 6/27/2011 $14.00 Shared / Hourly 0.20
Tech 4/5/2010 $15.00 Direct / Hourly 0.20
Tech / Cleaner 5/28/2009 $15.00 Direct / Hourly 1.00
Tech / Cleaner 8/12/2008 $16.00 Direct / Hourly 1.00
Tech / Cleaner 11/7/2011 $14.00 Direct / Hourly 0.25
Business Office
Bookkeeper 2/7/2013 $20.00 Shared / Hourly 0.30
Biller / Patient Accts 12/4/2012 $19.00 Direct / Hourly 0.38
Coder / Biller 1/30/2008 $22.50 Direct / Hourly 0.38
Insurance 10/3/2011 $17.00 Direct / Hourly 0.38
Maintenance 3/3/2011 $45.00 Shared / Hourly 0.09
Patient Liasion 5/3/2006 $23.41 Direct / Hourly 1.00
Patient Liasion / Check In 12/27/2010 $15.00 Direct / Hourly 1.00
Midwest Endoscopy Center, LLCExhibit IV
Employee Census

Healthcare Management Consultants
Front Entrance
Front Desk
Midwest EndoscopyExhibit A

Healthcare Management Consultants
Entrance Way
Waiting Area

Healthcare Management Consultants
Reception
Nurses' Station

Healthcare Management Consultants
Nurses' Station
Exam Room # 1

Healthcare Management Consultants
Exam Room # 2
Exam Room #3
Healthcare Management Consultants
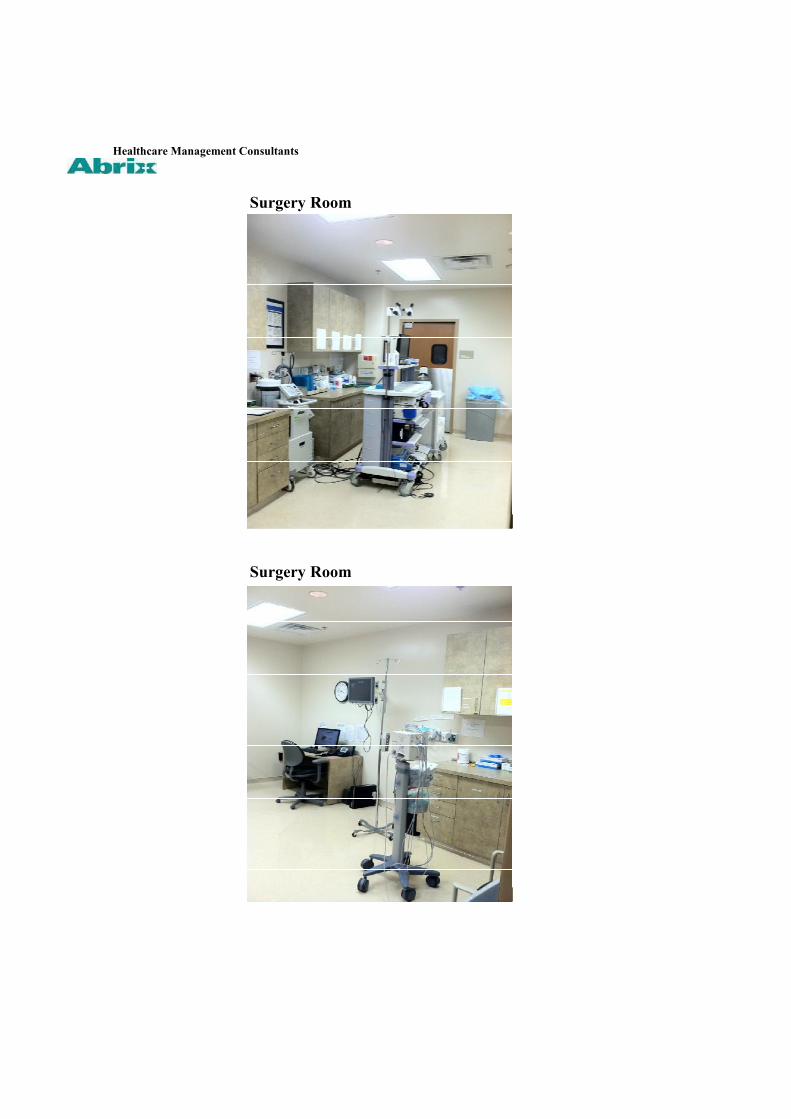
Surgery Room
Surgery Room

Healthcare Management Consultants
Ultrasonic Scope Cleaners
Scopes
Healthcare Management Consultants
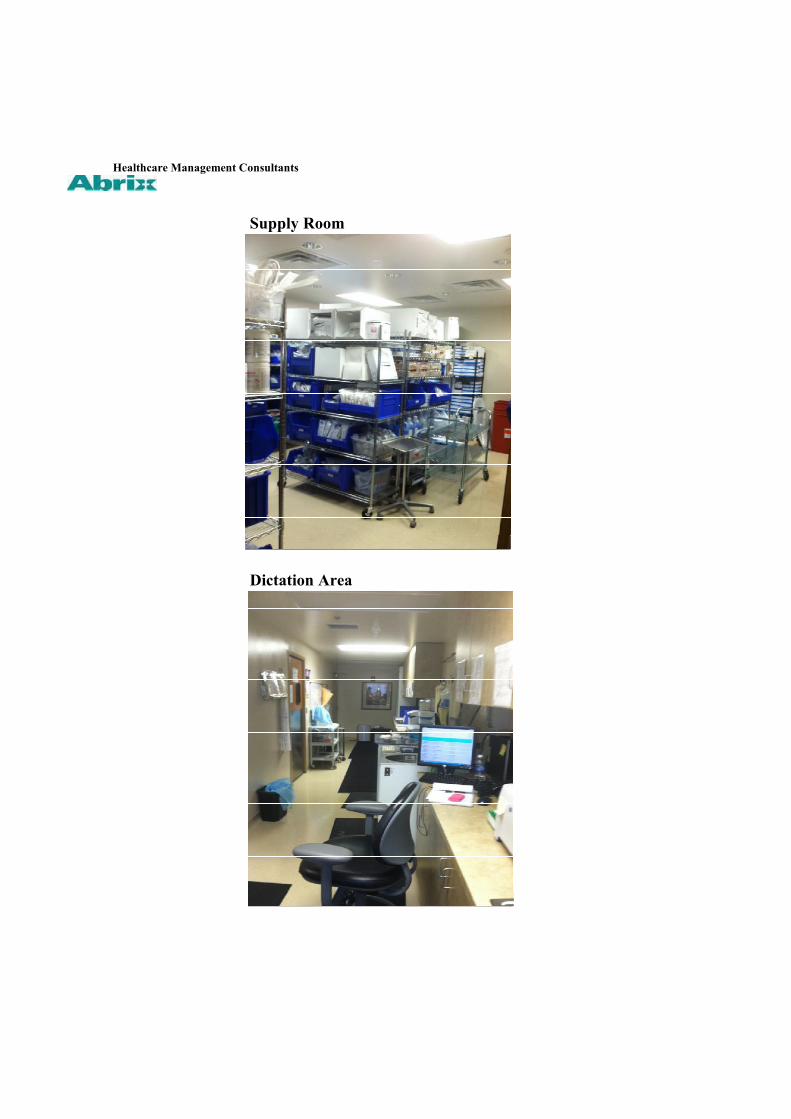
Supply Room
Dictation Area

Healthcare Management Consultants
Office
Office

Healthcare Management Consultants
Kitchen
Kitchen

Healthcare Management Consultants
Hallway
Hallway Desk

Healthcare Management Consultants
Hallway Wash Tub
Locker Room
Healthcare Management Consultants

Bathroom
Bathroom