business travel report 2016 - vdr-service.de · vdr business travel report 2016 ... vdr tracks the...
TRANSCRIPT

VDR Business Travel Report 2016volume 14
The German Business Travel Association


VDR Business Travel Report 2016, Copyright © Verband Deutsches Reisemanagement e.V. (VDR) 2016 3
Contents
Business travel as a trend barometerfor social and economic developments.................4
1. Important results at a glance .........................4
2. Business travel: Facts and figures ..................6Quantity ......................................................6Costs ...........................................................6Number of business travellers........................7Duration ......................................................7Domestic vs. foreign .....................................7
3. Structure of business travel costs...................9Average costs per business trip ......................9Cost areas....................................................9
4. Air travel....................................................10Booking classes..........................................10Airlines......................................................10
5. Overnight stays...........................................11Overall trends .............................................11Accommodation categories ..........................11Loyalty programmes ....................................12Booking channels of the future ....................13
6. Meetings & Events......................................14
7. Travel management strategies ......................15Responsibility for travel management ...........15Travel policy ...............................................15Trends in travel management .......................16Travel expense accounting ...........................17
8. Security and data protection ........................18Responsibility.............................................18Measures ...................................................19
9. Trends .......................................................20Business travel apps...................................20Mobile booking...........................................21Sharing economy........................................22
10. Outlook for 2017........................................24Trends in business travel volume..................24
Methodology and credits...................................25Methodology ..............................................25The research team......................................26Credits ......................................................26

This past year, the most important issue for anyone who travels was also front and centre in the collective aware-ness – safety on the go. The 14th VDR Business Travel Report examines in time-tested fashion this and otherdevelopments in the business travel environment. These also include innovations and changes in the travelmarket as a whole, many of which are driven by the needs of business travellers.
The mobility of German companies provides a good measure of the current economic climate and expectationsfor the future. Representative figures supplied by those in charge of travel at businesses and in the publicsector therefore assist in making sensible and forward-looking policy decisions for the future. Less would oftenbe more, particularly when it comes to bureaucratic hurdles. And to ensure that decision-makers in industryand politics can continue to count on the accustomed strength of the business travel sector, the general reliabilityof services that makes Germany so attractive as a business location is an essential prerequisite. Recurring trans-port strikes only pose a further burden to travellers who are already dealing these days with stepped-up securitymeasures and unscheduled passenger and border controls.
VDR is Germany’s largest network for modern mobility management and represents the interests of its memberson both the national and – in cooperation with the Global Business Travel Association (GBTA) – internationallevels. In daily dialogue with its members and with the help of market research as well as the VDR-TrendsPort“think tank”, VDR tracks the issues relevant to travel management. Which trends will continue to be of interestin future, and which are no longer pertinent?
Managers of people and mobility know better than anyone about the multifaceted and diverse effects of businesstravel. Enjoy reading the VDR Business Travel Report 2016 and discovering the latest facts, figures and insightsin the field of mobility management.
1. Important results at a glance
Business travel as a trend barometer for social and economic developments
Key data 2015: 2014:
In 2015 there were 11 million business travellers1 + 8.8% 10.1 million business travellers
182.7 million business trips led to expenditure in the amount of + 4.0% 175.8 million business trips
50.9 billion euros – equivalent to + 3.4% 49.2 billion euros
153.0 euros per business traveller per day. + 4.3% 146.0 euros
More business travel in a solid economic climate While gross domestic product (GDP) increased by1.7% last year, business travel was up 4%. Organi-sations with 10 – 500 employees booked a recordnumber of overnight stays in Germany – nearly 38million. Larger companies by contrast saw a substan-
tial increase in foreign overnight stays – up from 6.6to 8 million. Their travel costs therefore also rose dis-proportionately to travel volume.(Figures 1, 2, 8 and 9, Page 6 ff.)
1 Employees of a company or public-sector organisation who take at least onebusiness or official trip per year.
4
Chapter 1
VDR Business Travel Report 2016, Copyright © Verband Deutsches Reisemanagement e.V. (VDR) 2016

VDR Business Travel Report 2016, Copyright © Verband Deutsches Reisemanagement e.V. (VDR) 2016
Chapter 1
5
2 When this report refers to “medium-sized businesses”, this means compa-nies with 10 – 500 employees.
3 See VDR Business Travel Report 2010,Chapter 7 “Development of BusinessTravel Volume”, Figure 17, Page 17.
Business travel intensity at a lasting high?In 2015 there were 11 million “road warriors” work-ing for German companies – a new record. In the crisis years, only an average of one in four employeestravelled for work purposes. In the meantime, 40% of employees at the biggest firms with over1,500 employees take business trips. Business man-agement trends such as flat hierarchies and project-based work are reflected here.(Figure 3, Page 7)
Domestic hotels:Momentum thanks to mid-sized businesses2
Overnight stays on business trips witnessed a newhigh this year, with a total of 67.6 million room nights.Domestic accommodations benefitted disproportion-ately from this growth: the number of overnight staysin Germany by travellers for German organisationsrose in 2015 by 7.3% to 49.5 million. Contributingto this upsurge were in particular medium-sized com-panies with up to 500 employees. In terms of bookingcategories, the cards are slowly being reshuffled.(Figures 8 to 10, Pages 11 and 12)
Security as “meta-requirement”Especially since 9/11, the issue of security has gonefrom being a basic Maslowian life need to becominga “meta-requirement” for travel. Those who have totravel frequently on business often face potentialthreats posed by natural disasters, accidents, epi-demics, kidnappings or terrorist attacks. Germancompanies have done a great deal to enhance securityon business trips over the past two years. Today, 81%of companies with more than 500 employees areactively addressing this topic (2014: 74%), andresponsibility for this area is being bundled moreeffectively overall.(Figures 19 to 21, Pages 18 and 19)
Cost-cutting measures for air travel: here to stayThe passenger shift toward the rear section of theplane was intensified during the economic crisis,when whole packages of austerity measures had tobe introduced. In 2010, 60% of the companiesaffected by the economic and financial crisis believedthat these restrictive measures would persist.3 Andthey were right, because most business travellers stillsit in economy on both domestic and Europeanflights. For intercontinental flights, large companiesdo book business class more often than smaller ones,
but here as well there is a trend toward more “cattleclass” – with an increase of ten percentage pointssince 2004. One current reason: as long as (oil) pricesavings are not passed on to customers, companieswill try to book alternatives.(Figure 7, Page 10)
Indirect costs: questionable value for moneyIn addition to the clearly verifiable costs of businesstravel, all companies also incur indirect costs. Basedon the business travel costs for the year 2015, theseindirect costs are estimated at 8% to 10%. They arisefrom processes ranging from travel planning to invoic-ing and subsequent administrative duties, for exam-ple filing receipts. 53% of the companies surveyedwere unable to provide an estimate of these indirectcosts. (Page 9)
Apps and mobile devices – rising demandA business traveller without a mobile phone or smartphone? Inconceivable today. Larger companiesseem to feel the need for special business travel appsmore keenly than smaller ones. Of the firms with over500 employees, 53% already use or plan to launcha “corporate app”. And another 36% do not rule outthis possibility in the future. The actual day-to-daybenefits are the focus here, with mobile check-in,travel itinerary display, searching and booking themain functions cited.(Figures 22 and 23, Page 20)
2017: it all depends on the state of the worldThe confidence and positive basic mood of the previous year are not necessarily reflected in travelmanagers’ forecasts for 2017. On the whole, a waveof consolidation is expected in the coming year.Depending on economic, political and social devel-opments, plans allow for a possible stagnation ordecline in travel activities. A more nuanced view mustbe taken of these forecasts, however, because com-panies of a certain size and also some suppliers arepredicting a rise in bookings instead.(Figure 29, Page 24)
VDR Business Travel Report 2016, Copyright © Verband Deutsches Reisemanagement e.V. (VDR) 2016
Chapter 2
6
2. Business travel: Facts and figures
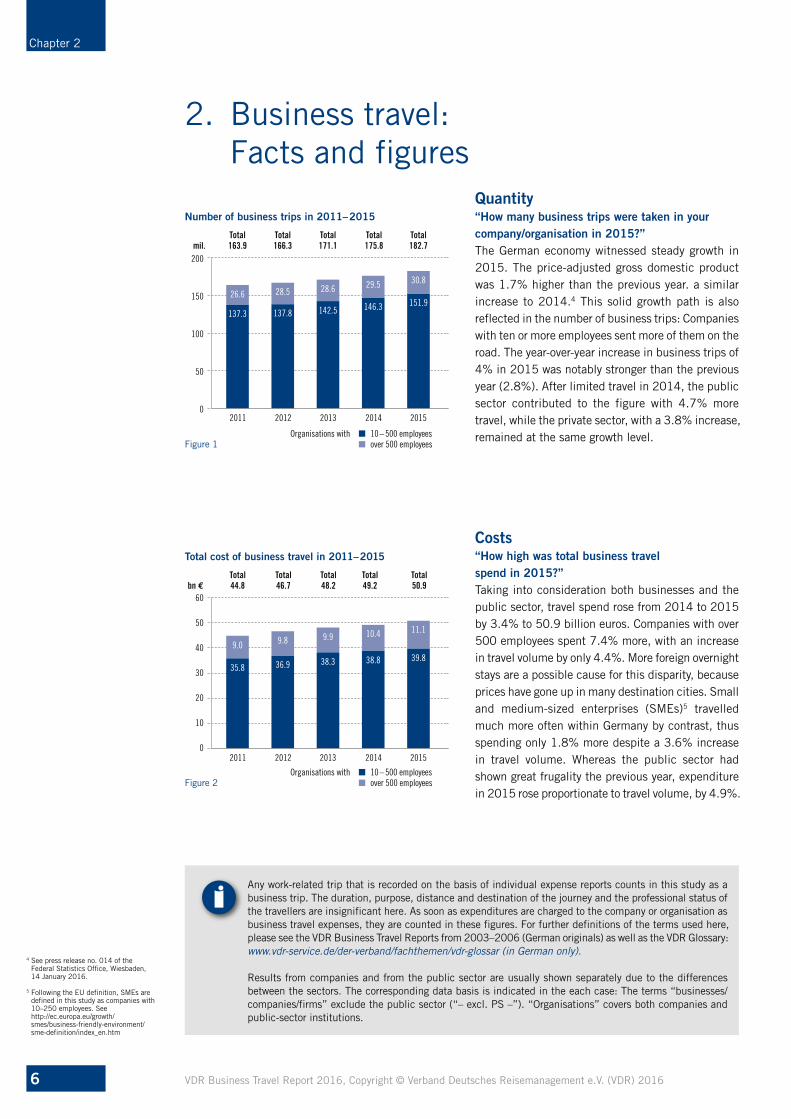
Quantity“How many business trips were taken in your company/organisation in 2015?”The German economy witnessed steady growth in2015. The price-adjusted gross domestic productwas 1.7% higher than the previous year. a similarincrease to 2014.4 This solid growth path is alsoreflected in the number of business trips: Companieswith ten or more employees sent more of them on theroad. The year-over-year increase in business trips of4% in 2015 was notably stronger than the previousyear (2.8%). After limited travel in 2014, the publicsector contributed to the figure with 4.7% moretravel, while the private sector, with a 3.8% increase,remained at the same growth level.
Costs“How high was total business travel spend in 2015?”Taking into consideration both businesses and thepublic sector, travel spend rose from 2014 to 2015by 3.4% to 50.9 billion euros. Companies with over500 employees spent 7.4% more, with an increasein travel volume by only 4.4%. More foreign overnightstays are a possible cause for this disparity, becauseprices have gone up in many destination cities. Smalland medium-sized enterprises (SMEs)5 travelledmuch more often within Germany by contrast, thusspending only 1.8% more despite a 3.6% increasein travel volume. Whereas the public sector hadshown great frugality the previous year, expenditurein 2015 rose proportionate to travel volume, by 4.9%.
4 See press release no. 014 of the Federal Statistics Office, Wiesbaden, 14 January 2016.
5 Following the EU definition, SMEs aredefined in this study as companies with10–250 employees. See http://ec.europa.eu/growth/ smes/business-friendly-environment/sme-definition/index_en.htm
i
Number of business trips in 2011– 2015
Organisations with � 10 –500 employees� over 500 employees
200
150
100
50
02011 2012 2013 2014 2015
Total Total Total Total Total163.9 166.3 171.1 175.8 182.7mil.
28.6 29.526.6 28.5
142.5 146.3
30.8
151.9137.3 137.8
Figure 1
Total cost of business travel in 2011–2015
60
50
40
30
20
10
02011 2012 2013 2014 2015
Total Total Total Total Total44.8 46.7 48.2 49.2 50.9bn €
9.99.0 9.8
38.3
10.4
38.8
11.1
39.835.8 36.9
Organisations with � 10 –500 employees� over 500 employees Figure 2
Any work-related trip that is recorded on the basis of individual expense reports counts in this study as abusiness trip. The duration, purpose, distance and destination of the journey and the professional status ofthe travellers are insignificant here. As soon as expenditures are charged to the company or organisation asbusiness travel expenses, they are counted in these figures. For further definitions of the terms used here,please see the VDR Business Travel Reports from 2003–2006 (German originals) as well as the VDR Glossary: www.vdr-service.de/der-verband/fachthemen/vdr-glossar (in German only).
Results from companies and from the public sector are usually shown separately due to the differencesbetween the sectors. The corresponding data basis is indicated in the each case: The terms “businesses/companies/firms” exclude the public sector (“– excl. PS –”). “Organisations” covers both companies andpublic-sector institutions.

VDR Business Travel Report 2016, Copyright © Verband Deutsches Reisemanagement e.V. (VDR) 2016
Chapter 2
7
6 Business travel intensity: percentage of employees in the company who take at least one business trip a year. For this and further definitions of terms, see: www.vdr-service.de/der-verband/fachthemen/vdr-glossar (in German only).
7 See www.zukunftsinstitut.de
8 VDR Business Travel Report 2014, Chapter 8 “Outlook for 2015”, Page 22.
Business travellers“How many business travellers were there in 2015?”The business travel intensity that could already be felt in 2014 waseven more evident in 2015: companies sent more employees on busi-ness trips than in previous years. While for several years about onein every three or four employees took at least one trip for the company,at the biggest companies an average of 40% of the staff now travelon business. This trend is most likely attributable to corporate man-agement trends such as flat hierarchies, flexible workplaces, work-life blending and gender shift as well as network and project work.7
The number of business travellers increased by 8.8% in 2015 to 11million.
Duration“How long do business trips last?”The average length of two days on the road remains nearlyunchanged. Overall, however, companies are reverting to the 2- to3-day business trip. Day trips without an overnight stay are also onthe rise in particular among SMEs, where business trips last an aver-age of 1.8 days. This sets them apart from larger companies, whereone in five business trips lasts four days or longer. Such companiesquestion the value of day trips because increasing digitalisationmeans that many meetings can be held as a web or telephone con-ference instead. In contrast, meetings that must take place in personare aggregated into longer trips – which take 2.3 days on average inthe biggest firms.
Domestic vs. foreign travel“Where do business travellers go?”Differences in the length of trips are directly related to the destina-tions involved. At 88%, the clear majority of SMEs travel within Germany. This could be one reason why their costs went up by only1.8%, although SMEs travelled 3.6% more overall in 2015. At largercompanies, by contrast, every third business trip in 2015 took theemployee abroad.
The main destinations outside Germany were already in planning in2014. France, the Netherlands, China, the USA and the UK wereGermany’s five major trading partners and, along with three neigh-bouring countries (Poland, Switzerland, Austria), made up the eighttop travel destinations in 2015.8
Breakdown of business travellers by company size in 2011/2015
36%
30%
37%
25%
39%
26%
40%
24%
Companies with10 – 250 employees
251 – 500 employees
501 – 1,500 employees
over 1,500 employees
0% 10% 20% 30% 40%
� 2015 � 2011 – excl. PS –Figure 3
Duration of business trips by company size in 2015
� up to 1 day � 2–3 days � 4–5 days � 6 or more days
100%
80%
60%
40%
20%
0%10 – 250 251 – 500 501 – 1,500 over 1,500
EmployeesØ 1.8 Ø 1.9 Ø 2.2 Ø 2.3
Ø Average duration of business trips in days
14%8% 10% 12%
6%6%3%2%
31%
24.5% 27%28%
49%
65.5%60%
54%
Figure 4 – excl. PS –
Domestic and foreign business trips in 2015
88%
75%
67%
67%
12%
25%
33%
33%
Companies with10 – 250
employees
251 – 500 employees
501 – 1,500 employees
over 1,500 employees
0% 20% 40% 60% 80% 100%
� Percentage of domestic trips� Percentage of trips abroadFigure 5 – excl. PS –


VDR Business Travel Report 2016, Copyright © Verband Deutsches Reisemanagement e.V. (VDR) 2016
Chapter 3
9
3. Structure of business travel costs
Average cost per business tripThe average cost of a business trip has been about the same for yearsbut went down marginally in 2015, to 305 euros. There are manyreasons for this slight drop, for example the continuing trend in favourof midscale hotels and a tendency toward more day trips.
Cost areas“What were the totals for the different cost areas in your company/organisation?”The distribution of costs between the main areas has remained quitestable over the years. In 2015 there were no disproportionateincreases in any one area.
Two euros in five are spent on overnight stays and meals. Air travelswallows up a quarter of business travel spend. Savings would seem possible here, as oil prices have been in a tailspin since thesummer of 2014. The VDR is therefore pressing for these operating
Companies that have put someone in charge of travel managementare usually able to keep spending under control despite a growth intravel volume.
The rise in short trips by SMEs combined with more foreign overnightstays on the part of large companies have led to higher average dailyexpenditure of 153 euros. Business travellers thus still spend abouttwice as much per person per day as those on holiday. Business-related expenditure is also spread more widely between regions anddoes not fluctuate with the seasons. Year-round jobs in the hospitalityindustry, catering, passenger transport and in many other sectors thatbenefit indirectly, such as telecommunications and retail, are safe-guarded in Germany through business travel. Moreover, lower pricescan be offered for the leisure and holiday market thanks to the reliableutilisation of capacities by business travellers.
cost savings to be reflected in lower ticket prices for the benefit ofthe airlines’ largest and most reliable customer group.10
“Other costs” are another major factor, still comprising 10% of totaltravel spend. Small amounts spent for example on parking, taxis, pub-lic transport and communication add up to a grand total of 5.2 billioneuros. They are often just as unavoidable as the main services oftransport and overnight stays. However, keeping track of them leadsto a disproportionate amount of indirect costs.
“What percentage of costs were incurred as indirect costs?”In addition to the readily verifiable costs of business travel, all organ-isations also incur indirect costs. These are the result of processessuch as planning, booking (with changes and cancellations), internaland external accounting, and administration.
The respondents were asked to estimate what percentage of coststhey incurred as indirect costs based on their business travel spendfor 2015. 53% of the companies surveyed were unable to providean estimate of these indirect costs. It made no difference whetherthe respondent was a public-sector enterprise or a small or large busi-ness. Those with a better grasp of this subject estimated indirectcosts as making up 8% to 10% of travel spend.
Total business travel spend broken down by cost areas in 2015
� Flights
� Rail
� Car hire
� Hotels
� Meals
� Other costs
€ 9.3 bn(18.5%)
€ 12.4 bn(24.5%)
€ 4.1 bn
(8%)
€ 13.3 bn(26%)
€ 6.6 bn(13%)
€ 5.2 bn (10%)
2015Total: € 50.9 billion
Figure 6
10 www.vdr-service.de/service/pressemitteilungen/news/vdr-kunden-muessen-vom-niedrigen-oelpreis-profitieren
Average cost per business trip in 2011 –2015 Daily expenditures for business vs. holiday travel in 2011 –20159
Average cost Expenditure per person per day
per business trip Business travel Holiday travel
2015 305 € 153 € 76 €
2014 307 € 146 € 77 €
2013 310 € 148 € 73 €
2012 308 € 140 € 73 €
2011 296 € 148 € 70 €
Table 19 Our own calculations, in conjunction with F.U.R. Kiel: Initial results of the 2012–2016 travel reports.
Business travel expenditure per person and per day: companies only, not the public sector. Holiday trips of 5 days or longer.

10VDR Business Travel Report 2016, Copyright © Verband Deutsches Reisemanagement e.V. (VDR) 2016
Chapter 4
10
4. Air travel
Booking classes“What percentage of flights were booked in economy, premium economy, business and first class for domestic, European and intercontinental travel in 2015?”In view of what has happened over the past decade, it seems to beonly a matter of time before business class disappears altogether ondomestic and European flights. For intercontinental flights, on theother hand, business travellers for large companies often sit in busi-ness class, but even here a trend can be seen toward more “cattleclass” travel, with an increase of ten percentage points since
Airlines“Which airlines were booked most frequently for business trips in 2015?”This year, travel managers were once again asked to name their mainair travel partners – a question we last posed in 2007.
Up to three airlines could be named with which the companies hadthe most volume or bookings. The resulting “airline ranking” reflectsthe importance of these airlines for business travel. However, theresults do not allow any conclusions to be drawn regarding marketshare or sales volumes.
In ten years’ time, Lufthansa has lost its first-place ranking for domes-tic flights taken by medium-sized businesses to Air Berlin. Lufthansastill remains number one for foreign travel, but, alongside old rivals,a new carrier from the Arab region has made it into the top 5 of themost frequently booked airlines: Emirates.
i
– excl. PS –– no Premium Economy in 2004 –
Booking classes for domestic, European and intercontinental flights in 2004 / 2015
� Economy � Premium Economy � Business Class � First Class
0% 25% 50% 75% 100%
201510 – 500 employees
2004
2015over 500 employees
2004
Companies withDOMESTIC
Figure 7
12%88%
98%
96%
13%87%
0% 25% 50% 75% 100%
EUROPE
16%84%
93%
91%
17%83%
0% 25% 50% 75% 100%
INTERCONTINENTAL
53%
24%
44%
59%
35%54%
37%62%
5% 10%
2% 3%
3%
4% 4%
16%
1%
1%
1%
4%
11 See VDR Business Travel Report 2010,Chapter 7 “Development of BusinessTravel Volume”, Figure 17, Page 17.
Airlines used for domestic and foreign business travel in 2007/2015
– excl. PS –– Scoring – 1st place: 3 points – 2nd place: 2 points – 3rd place: 1 point –
Companies with 10 – 500 employees Companies with over 500 employeesDomestic 2015 Domestic 2007 Domestic 2015 Domestic 2007
1st place airberlin Lufthansa Lufthansa Lufthansa
2nd place Lufthansa airberlin airberlin airberlin3rd place Germanwings / Germanwings Germanwings / Germanwings
Eurowings Eurowings
Companies with 10 – 500 employees Companies with over 500 employeesForeign 2015 Foreign 2007 Foreign 2015 Foreign 2007
1st place Lufthansa Lufthansa Lufthansa Lufthansa
2nd place airberlin airberlin Emirates Air France
3rd place Air France Air France airberlin KLM
4th place KLM Germanwings British Airways airberlin
5th place Emirates SWISS KLM British Airways
Table 2
2004.Smaller firms take advantage of the newly created alternative,premium economy, somewhat more often than larger ones – 16%vs.10%.
The passenger shift toward the rear section of the plane was intensi-fied during the economic crisis, when whole packages of austeritymeasures were introduced. 60% of the companies affected believedin 2010 that these restrictive measures would be long-lasting.11
Despite economic recovery, this expectation has been borne out.
The data are based on the companies that named at leastone airline. A weighting was carried out as follows: Threepoints were awarded to the airline named in first place, twopoints to the one in second place, and one point to the airlinein third place.

VDR Business Travel Report 2016, Copyright © Verband Deutsches Reisemanagement e.V. (VDR) 2016
Chapter 5
11
5. Overnight stays
Overall trends“How many overnight stays did the business trips taken by employees in your company / organisation include?”12
A record number of 67.6 million overnight stayswere made by business travellers for German com-panies in 2015. There were more travellers than theprevious year in companies of all sizes, and they alsotook more trips lasting two to three days. One inthree companies with over 1,500 employees hadplanned for increases in 2015.
“What was the distribution of overnight staysbetween domestic and foreign accommodations?”Domestic accommodations benefitted disproportion-ately from the upsurge: The number of overnightstays in Germany by travellers for German organi -sations rose in 2015 by 7.3% to 49.5 million.Medium-sized companies with up to 500 employeeswere mainly responsible for this increase. Overnightstays abroad were up 3.2%. But rather thanmedium-sized businesses, this rise came exclusivelyfrom companies with over 500 employees.
Number of overnight stays in 2011–2015
Organisations with � 10 –500 employees � over 500 employees
70
60
50
40
30
20
10
02011 2012 2013 2014 2015
Total Total Total Total Total57.3 61.0 61.4 63.7 67.6mil.
16.714.2
16.0
44.7
18.0
45.7
19.6
48.043.1 45.0
Figure 8
Number of overnight stays in Germany vs. abroad in 2014 / 2015
Organisations with � 10 –500 employees � over 500 employees
in Germany abroad in Germany abroad
2014 2015Total: 63.7 mil. Total: 67.6 mil.
50
40
30
20
10
0
Total Total Total Total46.2 17.5 49.5 18.1mil.
8.0
10.1
11.6
37.9
6.6
10.9
11.4
34.8
Figure 9
Accommodation categories“Which accommodation categories does yourorganisation book?”Most business travellers stay in 3- or 4-star hotelswhen travelling in Germany. The “new kid on theblock” is the 1- and 2-star category, which has seensteady growth in particular among mid-sized busi-nesses (13% of overnight stays in 2015). Today,these hotels offer inexpensive, “no frills” accommo-dations that give business travellers just what theyneed – a good night’s sleep, a good cup of coffee,internet access, easy check-in/check-out – and ofteneven a fresh design concept to top it all off.
Target-group-specific services can be communicatedquickly in particular in social media and on bookingand rating portals.
12 Number of overnight stays = roomnights.

Loyalty programmes“How would you rate the importance of hotel loyalty programmes for business travel?”Participation in bonus/ loyalty programmes was ratedby 25% of companies last year as a possible incentiveencouraging compliance with travel policy.14 In 2014,93%, and thus the majority of companies that allowtheir employees to benefit from such bonuses, wereprepared to do so in future as well.15
VDR Business Travel Report 2016, Copyright © Verband Deutsches Reisemanagement e.V. (VDR) 2016
Chapter 5
12
13 More information: www.certified.de
14 VDR Business Travel Report 2015,Chapter 5 “Travel management strategies”, Figure 15, Page 15.
15 VDR Business Travel Report 2014,Chapter 4 “Travel management strategies”, Figure 18, Page 15.
For professional hotel selection, VDR certification isa good indicator of quality, for example CertifiedBusiness Hotel®, Certified Conference Hotel®, Certi-fied Green Hotel® and others.13
Figure 10 – excl. PS –
Companies with10 – 500 employees
over 500 employees
10 – 500 employees
over 500 employees
Accommodation categories for business travel in Germany and abroad in 2015
� 1 and 2 stars (economy) � 4 and 4+ stars (upper midscale/upscale) � other accommodation categories� 3 stars (midscale) � 5 stars or above (upper upscale)
24%13% 57%
0% 20% 40% 60% 80% 100%
4%2%
34%7% 52% 5%2%
50%41% 6%1%
46%41% 9%2%2%
2%
Domestic
Abroad
Importance of hotel loyalty programmes
35%
28%
21%
21%
20%
29%
11%
18%
10%
Information provided to travellers, no active encouragement
Some encouragement, if bonus pointsbenefit the company
Fundamental rejectionbut use is permitted
General support in order to encourage travellers
to comply with travel policy
Use of loyalty programmesis not permitted
Selected programmes are allowed,others rejected
0% 10% 20% 30% 40%
Companies with � 10 – 500 employees � over 500 employees
1%
3%
3%
Figure 11 – excl. PS –
For travel abroad, higher hotel categories tend to be chosen, but 2015 also showed a shift in favour of3-star hotels: an increase from 32% to 41%, regard-less of the size of the company.
In the hotel area, the treatment of loyalty programmesis primarily “passively supportive”. About every thirdcompany informs its travellers of such programmes butdoes not actively encourage their use. 39% of largercompanies are not disinclined to take advantage ofsuch offers as long as the programmes are used to theirbenefit, in other words, when they help to steer trav-ellers toward hotels sanctioned by the travel policy.

16 For example, Amadeus e-Travel Management, BookIt, concur, Cytric, Onesto, SAP TM.
VDR Business Travel Report 2016, Copyright © Verband Deutsches Reisemanagement e.V. (VDR) 2016 13
Booking channels of the future“In general, which booking channel will you favour in future when it comes to getting the best room rate, maximumavailability and the widest range of offers (e.g. seasonal promotions)?” This “gazing into the crystal ball” is designed to clarify which bookingchannel travel managers will on the whole favour in future. It thereforepresumes an ideal combination of the criteria of price, availabilityand range of offerings. Online platforms (such as online travel agen-cies and hotel portals) are in the lead in the responses, albeit not byan overwhelming majority. Online booking engines are a close secondat larger companies.16 Regardless of the size of the company, thethird choice is to combine different sources, including if necessarythe use of price comparison systems. “Open booking” – leaving it upto the traveller to decide what to book with which provider and how –is the alternative least favoured by travel managers.
Preferred hotel booking channels of the future
26%
22%
19%
15%
13%
5%
32%
25%
20%
13%
8%
Online platforms
Directly from the service provider
Combinations of different sources
Stationary travel agency (TMC)
Online booking engine
Open booking
Online platforms
Online booking engine
Combinations of different sources
Directly from the service provider
Stationary travel agency (TMC)
Open booking
0% 10% 20% 30% 40%
2%
Figure 12 – excl. PS –
Companies with 10 – 500 employees
Companies with over 500 employees

VDR Business Travel Report 2016, Copyright © Verband Deutsches Reisemanagement e.V. (VDR) 2016
Chapter 6
14
17 VDR Business Travel Report 2014,Chapter 4 “Travel management strategies”, Figure 13, Page 11.
18 VDR Business Travel Report 2013,Chapter 6 “Event management”, Figure 17, Page 15.
6. Meetings & Events
Events have gained in importance as one of the tasks involved in mobility management. While 35% of thoseresponsible for business travel in companies were also in charge of event management in 2007, this percentagehad grown to 61% by 2014.17 The question of where to host events becomes relevant when there are severalalternatives to choose from. In the public sector, 44% of organisations hold meetings and events in externalfacilities – mainly meetings, sessions, workshops and conferences. The kinds of events differ from those in theprivate sector, where informal reviews, meetings, sessions and workshops are most common, followed by eventsand company celebrations. As a third event area, companies also invest in trade fairs.18
“Does your company hold meetingsand events in rented (external) premises?”The bigger the firm, the more events there are, andthe more it is therefore desirable or necessary tohold them outside the company’s own four walls. Asignificant majority of 83% of the largest companiesanswered this question in the affirmative, and onein three SMEs likewise rents outside facilities.
“Is your company planning measures to optimiseprocesses and potential savings in the meetings &events area? If so, which ones?”Of the medium-sized companies that conduct meet-ings and events in external premises, 8% are plan-ning various measures for process and cost optimi-sation. Such measures are also planned by no fewerthan 43% of firms with more than 1,500 employees.The measures that are receiving the most attentionare outsourcing to online agents (42%) and negoti-ation of fixed corporate rates with suppliers (39%).
Conducting meetings & events in rented premises
33%
45%
61%
83%
10 – 250 employees
251 – 500 employees
501 – 1,500 employees
over 1,500 employees
0% 20% 40% 60% 80% 100%
Figure 13 – excl. PS –
Companies with

VDR Business Travel Report 2016, Copyright © Verband Deutsches Reisemanagement e.V. (VDR) 2016
Chapter 7
15
7. Travel management strategies
Responsibility for travel managementDepending on the size of the company and its busi-ness travel volume, travel management is oftendefined today as a separate area of responsibility cov-ering an increasingly complex range of tasks involv-ing mobility, people and machines. The largest com-panies realised at the latest during the economiccrisis how much potential this area harbours for shap-ing and steering their business. 75% of these com-panies have therefore set up a separate travel man-agement unit. Among companies with 501 to 1,500employees, 35% – 50% have indicated over the yearsthat they have made travel management a separatearea of responsibility. In companies with 251 to 500employees, the ratio is stagnating at around 20%.SMEs have tended to do away with dedicated travelmanagement, thanks in part to the variety of cus-tomised offerings and services available both onlineand offline. In many of these firms, certain travelmanagement tasks are taken on by members of man-agement and their assistants, or by the HumanResources department.
Travel policy“Does your company have a travel policy?"“How high would you estimate the percentage ofyour company’s business trips that do not complywith travel policy?”A travel policy – as the most important tool for controlling direct and indirect costs – has been instituted by now in most German companies with251 employees or more. In 57% of companies thathave a travel policy, up to 5% of the trips bookeddo not comply with this policy. This estimate is sim-ilar across all company sizes.
Percentage of companies with a travel policyin 2013 / 2016
42%
45%
75%
71%
97%
86%
100%
97%
10 – 250 employees
251 – 500 employees
501 – 1,500 employees
over 1,500 employees
0% 20% 40% 60% 80% 100%
– excl. PS –� 2016 � 2013Figure 15
Ratio of companies with travel management as a separate areaof responsibility in 2011– 2016
63%59%
62% 63%
73% 74%
35% 34%38% 37%
50%
42%
22% 24% 23% 20% 21%18%
Figure 14 – excl. PS –
2011 2012 2013 2014 2015 2016
Companies with � 10 – 250 employees � 251 – 500 employees� 501 – 1,500 employees � over 1,500 employees
17.5%12% 15%
12% 10%7%
Companies with
VDR Business Travel Report 2016, Copyright © Verband Deutsches Reisemanagement e.V. (VDR) 201616
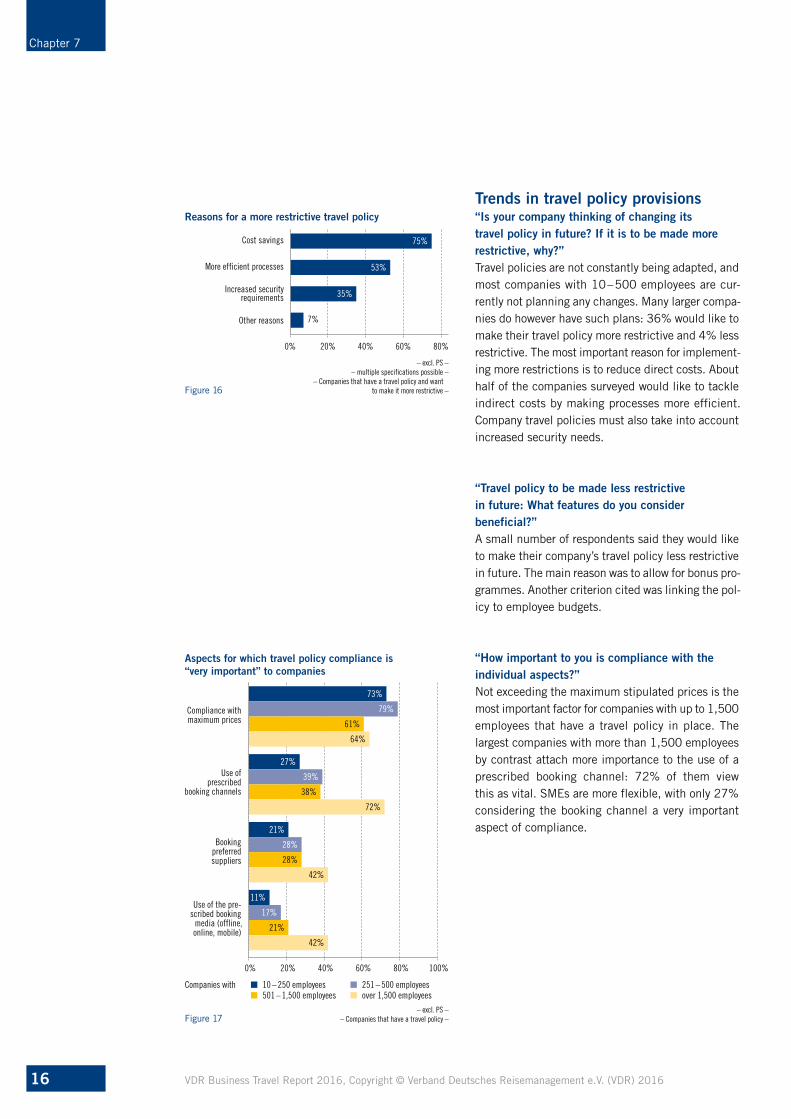
Trends in travel policy provisions“Is your company thinking of changing its travel policy in future? If it is to be made morerestrictive, why?”Travel policies are not constantly being adapted, andmost companies with 10 – 500 employees are cur-rently not planning any changes. Many larger compa-nies do however have such plans: 36% would like tomake their travel policy more restrictive and 4% lessrestrictive. The most important reason for implement-ing more restrictions is to reduce direct costs. Abouthalf of the companies surveyed would like to tackleindirect costs by making processes more efficient.Company travel policies must also take into accountincreased security needs.
“Travel policy to be made less restrictive in future: What features do you consider beneficial?”A small number of respondents said they would liketo make their company’s travel policy less restrictivein future. The main reason was to allow for bonus pro-grammes. Another criterion cited was linking the pol-icy to employee budgets.
Chapter 7
7%
Reasons for a more restrictive travel policy
75%
53%
35%
Cost savings
More efficient processes
Increased security requirements
Other reasons
0% 20% 40% 60% 80%
– excl. PS –– multiple specifications possible –
– Companies that have a travel policy and wantto make it more restrictive –Figure 16
“How important to you is compliance with theindividual aspects?”Not exceeding the maximum stipulated prices is themost important factor for companies with up to 1,500employees that have a travel policy in place. Thelargest companies with more than 1,500 employeesby contrast attach more importance to the use of aprescribed booking channel: 72% of them view this as vital. SMEs are more flexible, with only 27%considering the booking channel a very importantaspect of compliance.
Companies with � 10 – 250 employees � 251 – 500 employees� 501 – 1,500 employees � over 1,500 employees
Aspects for which travel policy compliance is “very important” to companies
73%
79%
61%
64%
27%
39%
38%
72%
21%
28%
28%
42%
11%
17%
21%
42%
Compliance with maximum prices
Use of prescribed
booking channels
Booking preferred suppliers
Use of the pre-scribed booking
media (offline, online, mobile)
0% 20% 40% 60% 80% 100%
– excl. PS –– Companies that have a travel policy –Figure 17
VDR Business Travel Report 2016, Copyright © Verband Deutsches Reisemanagement e.V. (VDR) 2016
Chapter 7
17
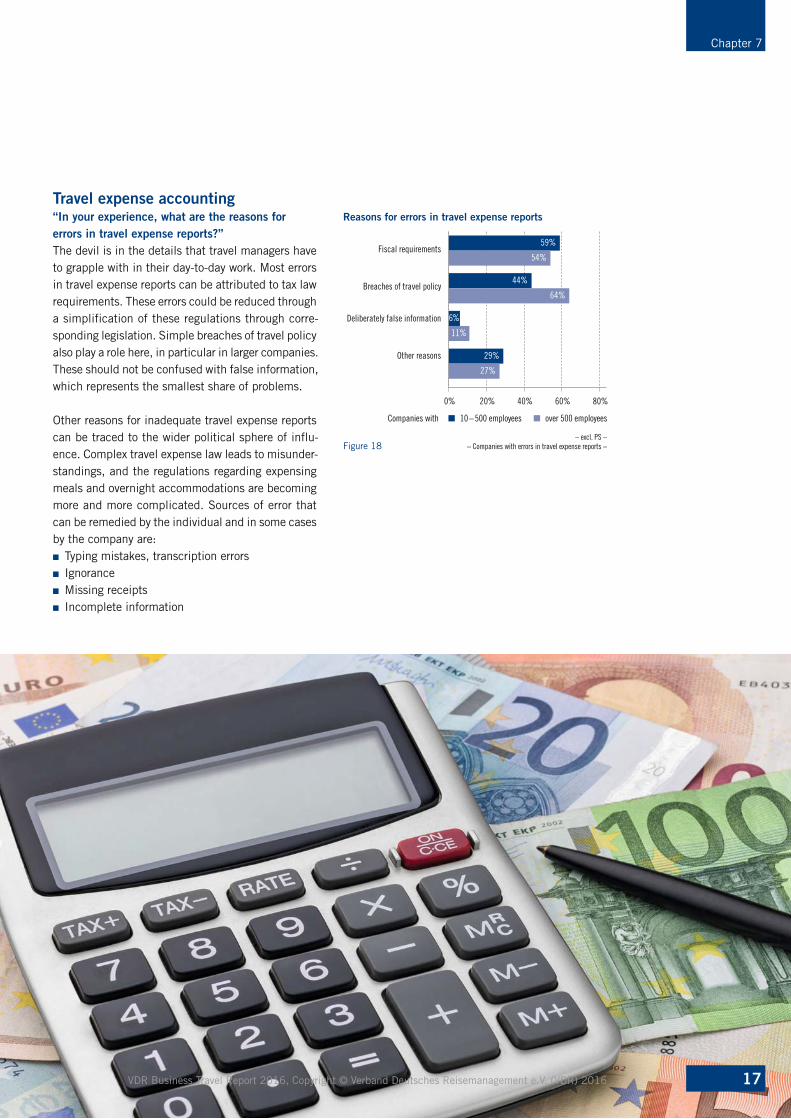
Travel expense accounting“In your experience, what are the reasons forerrors in travel expense reports?”The devil is in the details that travel managers haveto grapple with in their day-to-day work. Most errorsin travel expense reports can be attributed to tax lawrequirements. These errors could be reduced througha simplification of these regulations through corre-sponding legislation. Simple breaches of travel policyalso play a role here, in particular in larger companies.These should not be confused with false information,which represents the smallest share of problems.
Other reasons for inadequate travel expense reportscan be traced to the wider political sphere of influ-ence. Complex travel expense law leads to misunder-standings, and the regulations regarding expensingmeals and overnight accommodations are becomingmore and more complicated. Sources of error thatcan be remedied by the individual and in some casesby the company are:■ Typing mistakes, transcription errors ■ Ignorance■ Missing receipts ■ Incomplete information
Reasons for errors in travel expense reports
59%
54%
44%
64%
6%
11%
29%
27%
Fiscal requirements
Breaches of travel policy
Deliberately false information
Other reasons
0% 20% 40% 60% 80%
– excl. PS –– Companies with errors in travel expense reports –Figure 18
Companies with � 10 –500 employees � over 500 employees

“Is your company taking measures to increase security on business trips?”While in 2014, 46% of companies with up to 500 employees were devoting more attention to security onbusiness trips, by 2016 the ratio had risen to 53%. This increase of seven percentage points is also reflectedin the larger companies with more than 500 employ-ees, of which 81% are closely engaging with thistopic (2014: 74%).
Similar concerns are reported by the public sector,although they are less pronounced – which can beexplained by the much higher proportion of domestictrips. In larger organisations, the issue of security ison the agenda for 65% of the respondents (2014:46%) and in smaller ones for 44% (2014: 33%).
VDR Business Travel Report 2016, Copyright © Verband Deutsches Reisemanagement e.V. (VDR) 2016
Chapter 8
18
8. Security and data protection
Especially since the attacks of 11 September 2001, the issue of security has been foremost in many people’sminds. The current political situation and the risk of terrorist attacks like those in Paris or Brussels have onlymade matters worse. Our society finds itself today facing a variety of threats – a situation that is also reflectedin the attitudes of German companies. People who often need to travel on business are accordingly more fre-quently in danger – both subjectively and also objectively. Companies in Germany have therefore undertakenefforts to increase security on business trips. Issues ranging from professional prevention to the correct responsewill surely preoccupy them for many years to come.
Responsibility
Percentage of companies concerned with the securityof business travellers in 2014 / 2016
53%
46%
81%
74%
Companies with10 – 500
employees
over 500 employees
0% 20% 40% 60% 80% 100%
– excl. PS –� 2016 � 2014Figure 19
Human Resources
Outsourced
Management
Travel manageror travel office
Separate “Security” unit in the company
Executive Secretary / Assistant or Office Manager
Finance / Budget
Auditing / Controlling
Purchasing
Other area
0% 10% 20% 30% 40% 50%
– excl. PS –– multiple specifications possible –
– Companies concerned about security on business trips –
25%45%
12%4%
14%19%
47%42%
42%43%
4%
12%
5%5%
4%
0% 10% 20% 30% 40% 50%
Companies with over 500 employees
Figure 20
� 2016 � 2014
Responsibility for ensuring the security of travellers in 2014 / 2016
31%23%
25%4%
22%33%
22%17%
16%29%
10%26%
4%
8%
4%
1%2 %
2%2 %
2%2 %
2%
3%
2%3 %
Companies with 10 –500 employees
VDR Business Travel Report 2016, Copyright © Verband Deutsches Reisemanagement e.V. (VDR) 2016
Chapter 8
19
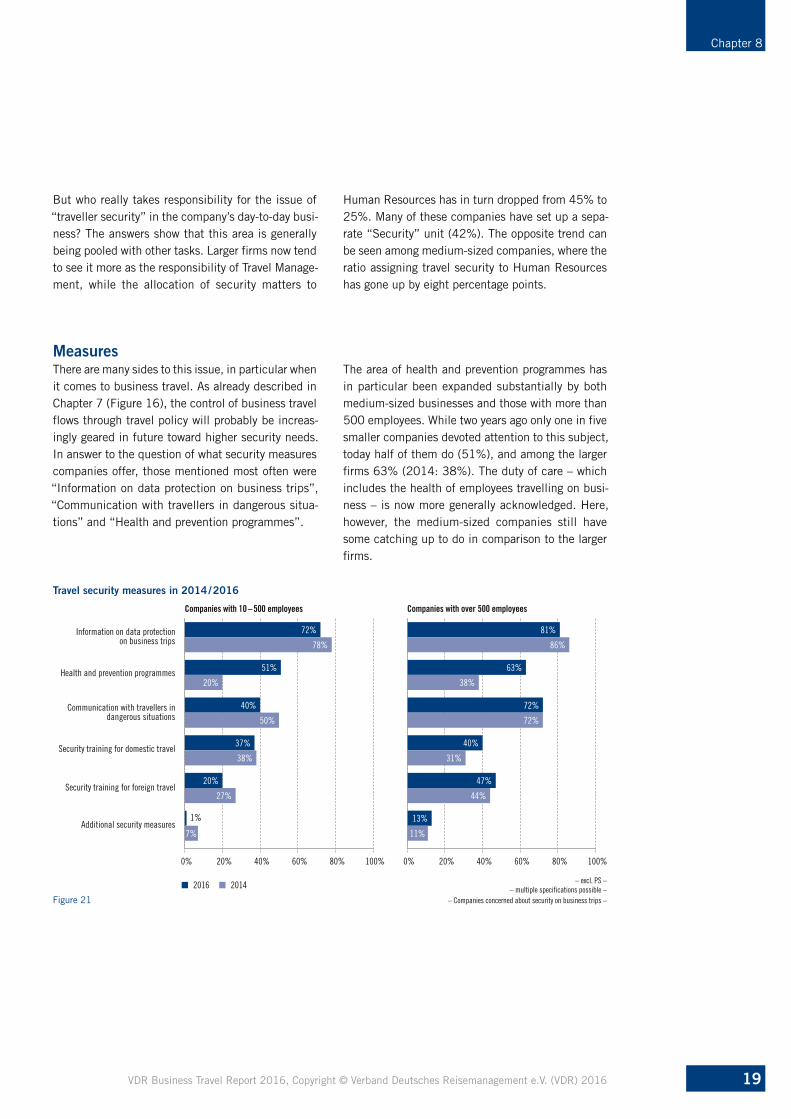
MeasuresThere are many sides to this issue, in particular whenit comes to business travel. As already described inChapter 7 (Figure 16), the control of business travelflows through travel policy will probably be increas-ingly geared in future toward higher security needs.In answer to the question of what security measurescompanies offer, those mentioned most often were“Information on data protection on business trips”,“Communication with travellers in dangerous situa-tions” and “Health and prevention programmes”.
� 2016 � 2014
Travel security measures in 2014 / 2016
72%
78%
51%
20%
40%
50%
37%
38%
20%
27%
7%
Information on data protectionon business trips
Health and prevention programmes
Communication with travellers indangerous situations
Security training for domestic travel
Security training for foreign travel
Additional security measures
0% 20% 40% 60% 80% 100%
1%
– excl. PS –– multiple specifications possible –
– Companies concerned about security on business trips –
81%
86%
63%
38%
72%
72%
40%
31%
47%
13%
44%
11%
0% 20% 40% 60% 80% 100%
Companies with 10 –500 employees Companies with over 500 employees
Figure 21
But who really takes responsibility for the issue of“traveller security” in the company’s day-to-day busi-ness? The answers show that this area is generallybeing pooled with other tasks. Larger firms now tendto see it more as the responsibility of Travel Manage-ment, while the allocation of security matters to
Human Resources has in turn dropped from 45% to25%. Many of these companies have set up a sepa-rate “Security” unit (42%). The opposite trend canbe seen among medium-sized companies, where theratio assigning travel security to Human Resourceshas gone up by eight percentage points.
The area of health and prevention programmes hasin particular been expanded substantially by bothmedium-sized businesses and those with more than500 employees. While two years ago only one in fivesmaller companies devoted attention to this subject,today half of them do (51%), and among the largerfirms 63% (2014: 38%). The duty of care – whichincludes the health of employees travelling on busi-ness – is now more generally acknowledged. Here,however, the medium-sized companies still havesome catching up to do in comparison to the largerfirms.

9. Trends
Business travel appsA business traveller without a mobile phone or smartphone? Unthinkable these days. What was stilla privilege seventeen years ago (for example, owninga BlackBerry in 1999), has now evolved from cult
Use of a business travel app
� Yes, we use an app� No, but we plan to use one� No, but we would consider it� No, and we would definitely rule it out in future
33%14%
34%
12%Companies with10 – 500 employees
over 500 employees
0% 20% 40% 60% 80% 100%
41%
36%19% 11%
– excl. PS –Figure 22
– excl. PS –– multiple specifications possible –
– Companies that use a business travel app or would consider using an app in future –
Features that are musts for a business travel app
Companies with � 10 – 500 employees � over 500 employees
68%Online check-in
Display itinerary
Search for rail, flight or hotel offers
Book rail, flights or hotels
Traveller can change or cancel bookings
during a trip
Traveller can change or cancel bookings
before a trip
Traveller can book ancillary services
Travel expense reports
0% 20% 40% 60% 80%
75%
53%
71%
46%
51%
41%
46%
43%
39%
39%
36%
32%
24%
19%
20%
Figure 23
Chapter 9
20
object (iPhone of the Steve Jobs years) to everydaytool for the masses. A differentiated selection ofmobile applications – “apps” – has thus been devel-oped for every lifestyle.
Larger companies seem to feel the need for specialbusiness travel apps more keenly than smaller ones,41% of which are still reluctant to use them. The difference in attitude is surely also due to the higherfrequency of business travel in large companies withover 500 employees. Today, 53% of them already usea “corporate app” or plan to launch one. Another36% would at least consider such an app in thefuture.
“Which features should a business travel app include?”Of the companies that already use a business travelapp, are planning to introduce one, or would at leastnot rule out such an app in the future, most are look-ing to facilitate travel planning, booking and actualtravel for their travellers. Helpful features are forexample mobile check-in, travel itinerary display, andsearching for and booking services with the app. Thepossibility of integrated travel expense reports,although in last place, is nevertheless desired by onein five respondents. Typing in a few receipts andamounts on the way back from a trip would certainlybe one way to take advantage of travel time for doingroutine tasks.
VDR Business Travel Report 2016, Copyright © Verband Deutsches Reisemanagement e.V. (VDR) 2016

VDR Business Travel Report 2016, Copyright © Verband Deutsches Reisemanagement e.V. (VDR) 2016
Chapter 9
21
19 For additional current background information and to learn what needs to be considered in general when planning and launching a “corporate app”, see: Graue, O.: “Smartphones und Geschäftsreisen”, in BizTravel 29 April 2016, http://biztravel.fvw.de/ umgang-mit-apps-co-smartphones-und-geschaeftsreisen/1/156441/14697
20 VDR Business Travel Report 2015, Chapter 6, “Booking and accounting”, Figure 21, Page 18.
“What do you require of a business travel app interms of meeting travellers’ needs?”Notification of delays from railway operators or air-lines – this was once considered innovative, becauseif something went wrong it was surely worth inform-ing the traveller. Today, the focus is on meeting theneeds of business travellers while fulfilling theduties and requirements of the company: fromdirect contact with service providers, to useful infor-mation before and during a trip, all the way to “door-to-door” as sistance extending from departure toreturn – the list keeps growing longer and the inter-faces more numerous. In view of heightened securityneeds and adjustments in travel policy, this list mustalso include integrated mobile travel risk manage-ment.19 Entertainment value is among the top threerequirements for only 5% to 6% of travel managers.
– excl. PS –– multiple specifications possible (maximum 3 requirements) –
– Companies that use a business travel app or do not rule out using an app in future –
Requirements for a business travel app
Companies with � 10 – 500 employees � over 500 employees
64%Direct contact with travel services providers
Information on hotels
User ratings / experience reports
Traveller assistance from booking to return
(door-to-door)
Individualised offers for business travellers
Booking of local offerings such as restaurants or events
Entertainment value / gamification
Other requirements
0% 20% 40% 60% 80%
64%
57%
60%
41%
37%
41%
54%
34%
24%
17%
16%
5%
6%
Figure 24
1%
2 %
Mobile booking“Which of the following business travel offeringsare booked in your company using mobile devices and for which would you like to usemobile booking in future?”The trend of the last several years towards “moreonline” continued last year. But even though infor-mation is increasingly being searched for usingmobile devices, mobile bookings are still not the pre-ferred channel among those interviewed. Their shareof the total bookings was only 4% to 5%.20 The will-ingness to accept “more mobile” must therefore beviewed in a more nuanced way, depending on the serv-ice provider and type of offering. Among the alterna-tives queried for this report, car hire, taxi services andpublic transport were in the lead. For personal trans-port services like these, mobile booking can almostbe said to be part of today’s standard repertoire.
– excl. PS –– multiple specifications possible –
– Companies that make mobile bookings or do not rule out using such bookings in future –
Mobile booking – current or desired
Companies with � 10 – 500 employees � over 500 employees
70%Car hire
Taxi
Public transport
Parking at departure airport
People-tracking tool for emergencies
Events and excursions at destination
Car sharing
Alternative accommodations such as Airbnb
Long-distance buses
Other
0% 20% 40% 60% 80%
76%
46%
57%
45%
47%
37%
50%
26%
32%
26%
25%
17%
29%
13%
11%
Figure 25
6%
7%
3%
2 %
VDR Business Travel Report 2016, Copyright © Verband Deutsches Reisemanagement e.V. (VDR) 2016
Chapter 9
22
21 www.telegraph.co.uk/technology/blackberry/11347347/The-history-of-BlackBerry-in-pictures.html?image=1
22 http://de.statista.com/statistik/daten/studie/251737/umfrage/marktanteil-des-apple-iphone-am-smartphone-absatz-in-deutschland/
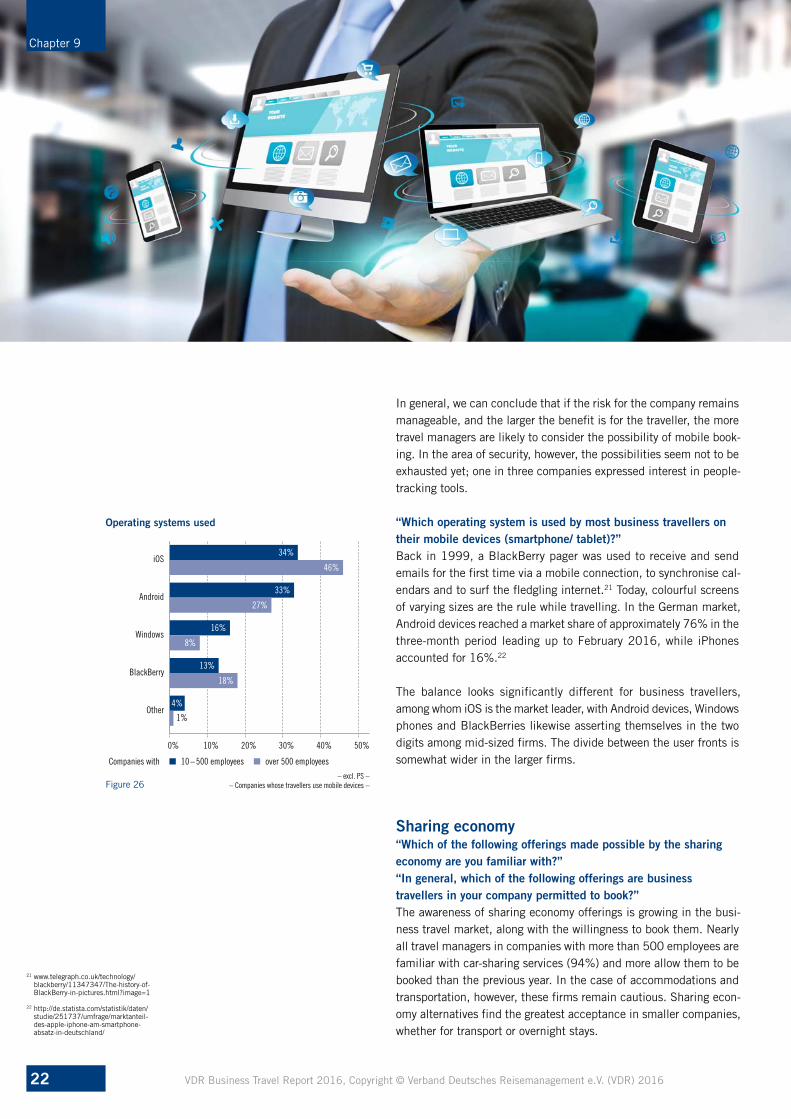
“Which operating system is used by most business travellers ontheir mobile devices (smartphone/ tablet)?”Back in 1999, a BlackBerry pager was used to receive and sendemails for the first time via a mobile connection, to synchronise cal-endars and to surf the fledgling internet.21 Today, colourful screensof varying sizes are the rule while travelling. In the German market,Android devices reached a market share of approximately 76% in thethree-month period leading up to February 2016, while iPhonesaccounted for 16%.22
The balance looks significantly different for business travellers,among whom iOS is the market leader, with Android devices, Windowsphones and BlackBerries likewise asserting themselves in the twodigits among mid-sized firms. The divide between the user fronts issomewhat wider in the larger firms.
Operating systems used
34%
46%
33%
27%
16%
8%
13%
18%
4%
iOS
Android
Windows
BlackBerry
Other
0% 10% 20% 30% 40% 50%
– excl. PS –– Companies whose travellers use mobile devices –
Companies with � 10 – 500 employees � over 500 employees
Figure 26
1%
Sharing economy“Which of the following offerings made possible by the sharingeconomy are you familiar with?”“In general, which of the following offerings are business travellers in your company permitted to book?”The awareness of sharing economy offerings is growing in the busi-ness travel market, along with the willingness to book them. Nearlyall travel managers in companies with more than 500 employees arefamiliar with car-sharing services (94%) and more allow them to bebooked than the previous year. In the case of accommodations andtransportation, however, these firms remain cautious. Sharing econ-omy alternatives find the greatest acceptance in smaller companies,whether for transport or overnight stays.
In general, we can conclude that if the risk for the company remainsmanageable, and the larger the benefit is for the traveller, the moretravel managers are likely to consider the possibility of mobile book-ing. In the area of security, however, the possibilities seem not to beexhausted yet; one in three companies expressed interest in people-tracking tools.

Chapter 9
Sharing economy offerings in 2015 / 2016
86%
82%
54%
69%
43%
43%
41%
45%
23%
Companies with 10 – 500 employees
Companies with over 500 employees
0% 20% 40% 60% 80% 100%
56%
50%
34%
0% 20% 40% 60% 80% 100%
� 2016 � 2015� 2016 � 2015
Car sharing
Mediation platforms foraccommodations
Transport services
Awareness of ... Permission to book when the offerings are known
Figure 27 – excl. PS –
93%
94%
69%
81%
66%
70%
49%
36%
27%
0% 20% 40% 60% 80% 100%
57%
33%
27%
0% 20% 40% 60% 80% 100%
Car sharing
Mediation platforms foraccommodations
Transport services
“If your travellers are not allowed to use sharing economy offerings, what are the reasonsfor this?”Once sharing economy platforms have managed todevelop good solutions for security and insuranceissues, German companies will probably be less reluc-tant to use them. These are the points that more thanhalf of respondents cited as the main reasons forrejecting an offer for their business travellers. Forlarge companies, control and cost reasons are the second most important reason. And for every thirdcompany interviewed, the providers are not reliableenough. 17% argue based on their own bad experi-ences.
– excl. PS –– multiple specifications possible –
– Companies that are aware of the offerings and do not allow at leastone kind of sharing economy offering to be booked –
Reasons why booking sharing economy offerings is not allowed
Companies with � 10 – 500 employees � over 500 employees
54%Security and insurance issues
Reliability of the providers
Our corporate principles
Control reasons, including cost reasons
Processes too complicated
Bad experiences
Other reasons
0% 20% 40% 60% 80%
64%
29%
31%
28%
29%
27%
45%
25%
23%
17%
17%
Figure 28
0%
2 %
23VDR Business Travel Report 2016, Copyright © Verband Deutsches Reisemanagement e.V. (VDR) 2016

VDR Business Travel Report 2016, Copyright © Verband Deutsches Reisemanagement e.V. (VDR) 2016
Chapter 10
24
10. Outlook for 2017
Trends in business travel volume“How will the number of trips made by your company change in 2017 compared to 2016?”The confidence and positive basic mood of the previous year are not necessarily reflected in travel managers’forecasts for 2017. Depending on economic, political and social developments, an overall consolidation is predicted in the coming year, with plans allowing for a possible stagnation or decline in travel activities. As inprevious years, these travel forecasts are a sensitive barometer of the global “climate”, which has a directimpact on Germany as an export nation.
According to the OECD, growth is slowing down in many emerging nations, and economic recovery in the indus-trialised countries is proving to be modest.23 The German government foresees weaker economic growth in the coming months: The spring forecast predicts a 1.7% increase in the gross domestic product in 2016 and1.5% growth in 2017. The low exchange rate continues to affect the German economy’s export prospects.24
Further reasons for sluggish growth are the subdued global economy and escalating risks.
Those interviewed expressed a feeling of uncertainty much more often than in previous years by preferring notto make a forecast at all for 2017. Both in the hotel and air travel fields, there seems to be a shift away fromthe previous stable numbers, but in both directions: With growth on one side and declines on the other, theservice providers might just be able to get away with only a slap on the wrist.
This forecast should be considered in a more differentiated manner, however: While last year 10% of the largestcompanies expected less air travel in the year to come, now the ratio is 26%. In contrast, the share of rail travelcould then rise sharply according to 46% of the respondents. Such a shift in the direction of rail would certainlymake itself felt in the car hire industry.
23 OECD: Interim Economic Outlook, 18 February 2016.
24 Federal Ministry for Economic Affairs and Energy: press release of 20 April 2016. – excl. PS –
Estimated trends in overnight stays and modes of transport in 2017
Overnight stays and the use of personal transport will � decrease � stay the same � increase � can’t say
15% 63%
0% 20% 40% 60% 80% 100%
15% 10 – 250 employees
251 – 500 employees
501 – 1,500 employees
over 1,500 employees
10 – 250 employees
251 – 500 employees
501 – 1,500 employees
over 1,500 employees
10 – 250 employees
251 – 500 employees
501 – 1,500 employees
over 1,500 employees
10 – 250 employees
251 – 500 employees
501 – 1,500 employees
over 1,500 employees
7%
8% 58% 23% 11%
16% 52% 23% 9%
9% 66% 20% 5%
20% 48% 24% 8%
62% 28% 7%
14% 59.5% 16% 10.5%
15% 41% 37% 7%
26% 33% 32% 9%
24% 37% 27% 12%
Companies with
Hotel
Flights
Rail
Car hire
Figure 29
9% 67% 16% 8%
56% 27% 14%
18% 63% 4% 15%
47% 41% 10%
22% 56% 9% 13%
6% 38% 46% 10%
3%
2%
3%

VDR Business Travel Report 2016, Copyright © Verband Deutsches Reisemanagement e.V. (VDR) 2016 25
Methodology and credits
MethodologyAs in previous years, the statistical universe for the study is consti-tuted by all businesses that have their headquarters in Germany –including those that have operations abroad – and organisations inthe public sector with ten or more employees. On the basis of thesefeatures, the four different sectors – manufacturing/construction,services, trade and the public sector (PS) – are equally well repre-sented. The same weight is given to the four different size categories.Due to the differences between the private sector (“businesses/
A random sample was taken from this statistical universe. BetweenJanuary and April 2016, 800 computer-assisted telephone interviewswere conducted with persons who are responsible for managing busi-ness travel and who are authorised by their organisations to providethe relevant data.
The responses to qualitative questions reflect the situation at thetime of the survey, while all others are based on the 2015 figures.All extrapolations without reference to secondary sources are basedon a special evaluation of the statistics from the German FederalEmployment Agency (see Table 3).
Exact figures are used when calculating percentage changes (forexample total annual expenditure on business trips). This explainswhy calculations using the rounded figures shown in the texts andcharts sometimes lead to different results after the decimal point.
The following organisation size categories have been defined for thisanalysis:
■ organisations with 10−250 employees■ organisations with 251−500 employees■ organisations with 501−1,500 employees■ organisations with über 1,500 employees
Number of organisations in Germany and their employees according to size categories (NACE 2003)
– Status: 2015 –– excluding organisations with 1 – 9 employees –
Source: own calculations, in conjunction with statistics from the Federal Employment Agency, Data Centre, Nuremberg, Calculated using NACE 2008 (2014 and 2015) and NACE 2003 (2008)
Organisation size categories (organisations with … employees)
10 – 250 251 – 500 501 – 1,500 over 1,500 Total
Organisations Employees Organisations Employees Organisations Employees Organisations Employees Organisations Employees
Total 429,982 15,207,886 8,864 3,052,830 4,163 3,282,391 1,209 3,506,669 444,218 25,049,776
Table 3
2016 Respondent areas of responsibility
56%
28%
26%
16%
11%
7%
6%
Travel Management
Finance / Budget
Human Resources
Executive Secretary /Assistant or Office Manager
Purchasing
Management
Auditing / Controlling
Other activity
0% 10% 20% 30% 40% 50% 60%
2%
Figure 30 – multiple specifications possible –
2016 Respondent sectors of industry
� Trade / installation and repair of vehiclesand consumer goods
� Manufacturing
� Other public and personal services
� Public administration / defence / social security
� Credit and insurance trade
� Education and training
� Health care / veterinary medicine / social work
� Transport / news services (2%)
� Construction (2%)
� Real estate / housing / rental services (1%)
� Hospitality industry (0.5%)
100%
80%
60%
40%
20%
0%
25%
23%
19%
14%
5.5%4%4%
Figure 31
companies”) and the public sector, most results are presented sep-arately. The corresponding data basis is made clear in the respectivepassages:
■ When reference is made to businesses or companies/ firms, thepublic sector is excluded (“– excl. PS –”).
■ When reference is made to organisations, this includes both com-panies/ businesses and institutions in the public sector.
26
CreditsThis report in German and English (2007–2016 editions) and the German and English ManagementSummaries from 2003–2006 are available free of charge from www.geschaeftsreiseanalyse.de.
The contents of this document are protected by copyright. Changes, abridged versions, additionsand supplements as well as any publication or translation, or commercial or educational use by thirdparties must first be approved in writing by VDR. Duplication is only permitted for personal use andonly on condition that this copyright notice is reproduced on the duplicated document. Quotationsfrom the VDR Business Travel Report 2016 are permitted, provided they contain a reference to thesource as well as to the secondary sources indicated in the report. A file copy would be greatly appre-ciated.
Where the male pronoun form is used in the text, this has been done for the sake of simplicity. Thisis meant to signify both men and women.
Published by:Verband Deutsches Reisemanagement e.V. (VDR)(VDR – The German Business Travel Association)Darmstädter Landstr. 12560598 Frankfurt am MainTel. +49 69 695229 0Fax +49 69 695229 29info@geschaeftsreiseanalyse.dewww.geschaeftsreiseanalyse.deinfo@vdr-service.dewww.vdr-service.de
LayoutKugelstadt MedienDesignWeyprechtstr. 364283 DarmstadtTel. +49 170 [email protected]
TranslationJennifer Taylor
Printed in german byWerbedruck Petzold GmbHRobert-Bunsen-Str. 41–4364579 GernsheimTel. +49 6258 [email protected]
Printed using a carbon-neutral process on certified recycled paper.
Copyright © Verband Deutsches Reisemanagement e.V. (VDR)2016 All rights reserved. Original edition 2016
VDR, the publisher of this report, has since 2003defined the basic structure of this analysis in con-sultation with its members and each year selects topical questions to be examined, some of them sug-gested by readers. United Research AG is responsi-ble for the field work and scientific evaluation of theprimary data, which is gathered by the Research Fac-tory company. Antje Adam, Claudia Giese, ViolaEggert (VDR) and Claudia Schwager-Wehming(United Research) work together with project man-ager Kirsi Hyvaerinen (PRÁTTO Consulting) on theexpert analysis, reporting and organisational super-vision of this study project. Volunteers also con-tribute their expert knowledge to each year’s report,
including Daniela Schade and Ralph Rettig from thePresidential Committee of VDR, and also the leadersof expert committees as appropriate for each specifictopic.
VDR – The German Business Travel AssociationVDR – The German Business Travel Association rep-resents the interests of German business with respectto all aspects of business travel management. Theaim is to ensure that worldwide business travel is effi-cient, economical, safe and unimpeded. With over550 member companies, the German Business TravelAssociation represents a total business travel turnoverof more than ten billion euros per year.
The research team
GFA-COC-001147


Darmstädter Landstr. 12560598 Frankfurt am MainTel. +49 69695229 0Fax +49 69695229 29info@geschaeftsreiseanalyse.dewww.geschaeftsreiseanalyse.deinfo@vdr-service.dewww.vdr-service.de
With the kindsupport of