business process analysis - international trade · pdf fileprocess of this business process...
TRANSCRIPT
BUSINESS PROCESS ANALYSIS
EXPORT OF COFFEE AND TEXTILES/APPAREL IN KENYA

BUSINESS PROCESS ANALYSIS: EXPORT OF COFFEE AND TEXTILES/APPAREL IN KENYA
ii

BUSINESS PROCESS ANALYSIS: EXPORT OF COFFEE AND TEXTILES/APPAREL IN KENYA
iii
Acknowledgements
Cambodochine Dao, economic and trade development consultant, is the author of this guide. He was assisted by Peter Morabu, trade consultant, based in Nairobi, Kenya.
The consultants’ team acknowledges with gratitude the contributions of a number of people towards the process of this business process analysis (BPA), without whose participation the project would not have succeeded. We would like to express our gratitude and appreciation to Andrew Huelin, Associate Programme Adviser, Trade Facilitation and Policy for Business, International Trade Centre (ITC), for his motivation and overall oversight, providing an enabling environment for the project to take place.
We express our gratitude and thanks to Rajeev Arora, Textile Value Chain Advisor Ministry of Industrialization and Enterprise Development, Government of Kenya, for giving constructive comments and timely advice, giving us early insights for the project. We also appreciate the contributions of Korir Julius, Industrialization Secretary, Ministry of Industrialization and Enterprise Development, and James Munyi, personal assistant to the CEO at the Export Promotion Council. He and his team played the rather critical role of ensuring timely linkages or networks with key stakeholders.
We recognize the active participatory roles played and valuable inputs to the process by the African Cotton and Textile Industries Federation (ACTIF), Joseph Nyagari, and Export Processing Zones Authority (EPZA), Margaret Waithaka, and her staff, including Christopher Kenana, Moses Kipkebut, Benjamin Chesang and Fabian Olaba, who went out of their way to ensure we had meaningful appointments. Similarly, we appreciate the valuable inputs by Daniel Mbithi, the Nairobi Coffee Exchange (NCE), Chief Executive Officer, and the Coffee Directorate staff (including Benson Apuoyo, Felix Mutuiri and James Mwanza).
Vanessa Finaughty edited the report and Isabelle Jouve, Associate Programme Adviser, TFPB, ITC, prepared the copy for printing.

BUSINESS PROCESS ANALYSIS: EXPORT OF COFFEE AND TEXTILES/APPAREL IN KENYA
iv

BUSINESS PROCESS ANALYSIS: EXPORT OF COFFEE AND TEXTILES/APPAREL IN KENYA
v
Contents
Acknowledgements iii Acronyms and Abbreviations xi
Introduction 1
Chapter 1 Methodology of the study 3
Chapter 2 Kenya: an overview 6
1. Economic developments 6 2. Trade performance 7 3. Agriculture sector 9 4. Manufacturing sector 11 5. Transport and storage sector 12
Chapter 3 Trade Facilitation 14
1. Trade agreements 14 2. Registration and pre-shipment inspection 14 3. Customs procedures 14 4. Export taxes 15 5. Export prohibitions, restrictions and licensing 15 6. Export subsidies and incentives 15 7. Export finance, insurance and guarantees 16 8. Export promotion and marketing assistance 16
Chapter 4 Coffee sector 17
1. Production 17 2. Exports 18
Chapter 5 Textile and apparel sector 21
1. Exports 21
Chapter 6 Procedures and documents required for export 22
1. Sales contract and trade terms 22 2. Certificate, licensing and inspection 22
2.1. Certificate of AGOA 23

BUSINESS PROCESS ANALYSIS: EXPORT OF COFFEE AND TEXTILES/APPAREL IN KENYA
vi
2.2. Licensing of clearing and forwarding agent 23 2.3. Coffee dealer’s license 23 2.4. Registering with the International Coffee Organization 24 2.5. Rules of origin 24 2.6. Fumigation 24 2.7. Phytosanitary certificate 24 2.8. Coffee movement permit 25 2.9. Customs declaration 25 2.10. Customs inspection 25
3. Container handling at the port 25 4. In-house export paperwork 25
4.1. Commercial invoice 25 4.2. Packing list 25 4.3. Bill of lading 26 4.4. Logistics 26 4.5. Cargo insurance 26
5. Documents involved in exports 26 6. Costs involved in exports 27
Chapter 7 Core business processes of coffee exports 29
Chapter 8 Core business processes area for coffee: 1 Buy 32
1. Process area: 1.1 Conclude sales contract and trade terms 32
Chapter 9 Core business processes area for coffee: 2 Ship 34
1. Process area: 2.1 Coffee movement permit (1) 35 2. Process area: 2.2 Certificate of origin (KNCC) 36 3. Process area: 2.3 Certificate of origin (ICO) 37 4. Process area: 2.4 Fumigation 38 5. Process area: 2.5 Phytosanitary certificate 39 6. Process area: 2.6 Clearing and forwarding agent 41 7. Process area: 2.7 Customs declaration 42 8. Process area: 2.8 Customs inspection and clearance 43 9. Process area: 2.9 Coffee movement permit (2) 44 10. Process area: 2.10 Inland transport 45 11. Process area: 2.11 Container handling at port 46
Chapter 10 Core business processes area for coffee: 3 Pay 48
BUSINESS PROCESS ANALYSIS: EXPORT OF COFFEE AND TEXTILES/APPAREL IN KENYA
vii
1. Process area: 3.1 Claim payment for goods sold 48
Chapter 11 Time chart - coffee 51
Chapter 12 Core business processes area for textile and apparel exports 52
Chapter 13 Core business process area for textiles and apparel: 1. Buy 54
1. Process area: 1.1 Conclude sales contract and trade terms 54
Chapter 14 Core business process area for textiles and apparel: 2. Ship 56
1. Process area: 2.1 Certificate of origin 56 2. Process area: 2.2 Clearing and forwarding agent 58 3. Process area: 2.3 Customs declaration 59 4. Process area: 2.4 Customs inspection and clearance 60 5. Process area: 2.5 Inland transport 61 6. Process area: 2.6 Container handling at port 62
Chapter 15 Core business process area for textiles and apparel: 3. Buy 64
1. Process area: 3.1 Claim payment for goods sold 64
Chapter 16 Time chart – textiles and apparel 66
Conclusion 67
Recommendation 69
Annex 1 – Regulations 89
Annex 2 – Logistics Performance Index 91
References 95
List of tables
Table 1. Ethiopia’s balance of trade (2010–2014) (values in KSh million) 8 Table 2. Exports by destination (2010–2014) (values in KSh million) 8 Table 3. Imports by destination (2010–2014) (values in KSh million) 9 Table 4. Export processing zones (2010–2014) 12 Table 5. Traffic at the Port of Mombasa (2010–2014) 13
BUSINESS PROCESS ANALYSIS: EXPORT OF COFFEE AND TEXTILES/APPAREL IN KENYA
viii
Table 6. Kenya’s coffee production by type of growers (2009/10–2013/14) 17 Table 7. Total coffee production by all exporting countries in Africa (2011–2014) 18 Table 8. Main destinations for Kenya coffee exports (1,000 kg bags) and share percentage (2010–
2013) 18 Table 9. Kenya’s exports of unroasted coffee (2014–2015) 20 Table 10. Garment and apparel EPZs under AGOA (2010–2014) 21 Table 11. Processing sales with an existing customer 22 Table 12. Kenyan documentary requirements to export 26 Table 13. Kenya’s official costs to export one TEU 27 Table 14. Summary of predefined stages and documents for trading across borders in Kenya 28 Table 15. Core business processes and stakeholders involved in exports 30 Table 16. Number of days to export coffee “as-is” 51 Table 17. Core business processes and stakeholders involved in exports 53 Table 18. Number of days to export textiles and apparel “as-is” 66 Table 19. Analysis of coffee export business process and recommendations for improvement 69 Table 20. Number of days to export coffee “to-be” 77 Table 21. Analysis of textile and apparel export business process and recommendations for
improvement 79 Table 22. Number of days to export textile and apparel “to-be” 82 Table 23. Kenya’s domestic LPI performance (2014) 92 Table 24. Kenya’s domestic LPI environment and institutions (2014) 93
List of figures
Figure 1. UN/CEFACT international supply chain model 3 Figure 2. Kenya’s annual GDP growth (2012–2014) (%) 6 Figure 3. Kenya’s quarterly GDP growth (2012–2015) (%) 7 Figure 4. Kenya’s agriculture gross value added (2011–2014) (%) 10 Figure 5. Coffee sales at NCE (in ‘000 MT) 19 Figure 6. Kenyan textile exports vs total exports to the US (2000–2009) 21 Figure 7. Use case diagram of business processes of coffee exports 29 Figure 8. Buy: 1 Core business process use case diagram 32 Figure 9. 1.1 Conclude sales contract and trade terms 32 Figure 10. 2. Ship: 11 Core business processes use case diagram 34 Figure 11. 2.1 Coffee movement permit (1) 35 Figure 12. 2.2 Certificate of origin (KNCC) 36 Figure 13. 2.3 Certificate of origin (ICO) 37 Figure 14. 2.4 Fumigation 38 Figure 15. 2.5 Phytosanitary certificate 39 Figure 16. 2.6 Clearing and forwarding agent 41 Figure 17. 2.7 Customs declaration 42 Figure 18. 2.8 Customs inspection and clearance 43 Figure 19. 2.9 Coffee movement permit (2) 44 Figure 20. 2.10 Logistics 45 Figure 21. 2.11 Container handling at port 46
BUSINESS PROCESS ANALYSIS: EXPORT OF COFFEE AND TEXTILES/APPAREL IN KENYA
ix
Figure 23. 3 Claim payment for goods sold 48 Figure 23: 3.1 Claim payment for goods sold 49 Figure 24. Number of days to export coffee “as-is” 51 Figure 25. Use case diagram of business processes of textile and apparel exports 52 Figure 26. 1. Buy: One core business process use case diagram 54 Figure 27. 1.1 Conclude sales contract and trade terms 54 Figure 28. 2. Ship: Six cores business processes use case diagram 56 Figure 29. 2.1 Certificate of origin 57 Figure 30. 2.2 Clearing and forwarding agent 58 Figure 31. 2.3 Customs declaration 59 Figure 32. 2.4 Customs inspection and clearance 60 Figure 33. 2.5 Inland transport 61 Figure 34. 2.6 Container handling at port 62 Figure 35. 3. Pay: One core business process use case diagram 64 Figure 36. 3.1 Claim payment for goods sold 65 Figure 37. Number of days to export textiles and apparel “as-is” 66 Figure 38. Number of days to export coffee “to-be” 78 Figure 39. Number of days to export textile and apparel “to-be” 83 Figure 40: Customs agent license 84 Figure 41. Coffee dealer license 86 Figure 42. Coffee export license 87 Figure 43. Kenya’s LPI scorecard (2014) 91

BUSINESS PROCESS ANALYSIS: EXPORT OF COFFEE AND TEXTILES/APPAREL IN KENYA
x
BUSINESS PROCESS ANALYSIS: EXPORT OF COFFEE AND TEXTILES/APPAREL IN KENYA
xi
Acronyms and Abbreviations
Unless otherwise specified, all references to dollars ($) are to United States dollars, and all references to tons are to metric tons.
The following abbreviations are used:
ACTIF African Cotton & Textile Industries Federation
AEO Authorized economic operator
AGOA African Growth and Opportunity Act
BPA Business process analysis
CD Coffee Directorate
CET Common external tariff
CFS Container freight station
CMP Coffee movement permit
CO Certificate of origin
CoDF Coffee Development Fund
COMESA Common Market for Eastern and Southern Africa
CSD Customs services department
EAC East African Community
EPC Export Promotion Council
EPZ Export processing zone
EPZA Export Processing Zones Authority
EU European Union
TFTA Tripartite Free Trade Agreement
GDP Gross domestic product
GSP Generalized System of Preferences
ICO International Coffee Organization
ITC International Trade Centre
KACE Kenya Agricultural Commodity Exchange
KAMEA Kenya Apparel Manufacturers and Exporters Association
KAM Kenya Association of Manufacturers
KEBS Kenya Bureau of Standards
KEPHIS Kenya Plant Health Inspectorate Service
KRA Kenya Revenue Authority
MCTA Mild Coffee Trade Association of East Africa
NCE Nairobi Coffee Exchange
PhC phytosanitary certificate
PIN personal identification number
PVoC Pre-Export Verification of Conformity
BUSINESS PROCESS ANALYSIS: EXPORT OF COFFEE AND TEXTILES/APPAREL IN KENYA
xii
SEZ Special economic zone
SPS Sanitary and phytosanitary
SSA Sub-Saharan Africa
TEU Twenty-foot equivalent unit
VAT Value-added tax
WB World Bank
WTO World Trade Organization
FOB Free on board
CIF Cost, insurance and freight

BUSINESS PROCESS ANALYSIS: EXPORT OF COFFEE AND TEXTILES/APPAREL IN KENYA
1
Introduction
Trading goods across borders requires a vast number of transactions to meet the rules and regulations of exporting and importing countries. Failure to comply with any of these requirements and/or submit a wrong or incomplete set of documents often results in unnecessary delays in time and additional costs. High trade facilitation and internal transportation costs act like a headwind, having a significant impact on traders’ ability to earn profits on a thin margin. Not all costs, however, are attributable to the public sector purview, e.g. certification and licensing, customs clearance and cargo inspections, etc. Business-to-business transactions can also be the domain of enormous non-value-added costs, e.g. inefficient use of transportation mode, truck fuel inefficiency and lack of commodity warehouse at strategic export hub, etc.
The Republic of Kenya’s Vision 2030 is the new development blueprint covering the period 2008 to 2030. It aims to make Kenya a newly industrializing, middle-income country providing a high quality of life to all its citizens by 2030. Vision 2030 was developed through an all-inclusive stakeholder consultative process, including the National Committee on WTO (NCWTO).1 The economic pillar of Vision 2030 aims to maintain a sustained economic growth of 10% during the 10 years from 2008. This programme followed the successful implementation of the Economic Recovery Strategy for Wealth and Employment Creation (ERS), under which the country’s economy moved back into growth from 2002, when gross domestic product (GDP) grew at 0.6%.
Kenya’s economy is estimated to have expanded by 5.4% in 2014, compared to a growth of 5.7% in 2013. A number of factors influenced the country’s economic performance during 2014. From the demand side, government and private sector final consumption increased by 2.7% and 5.5% respectively. The demand side was mainly driven by a resilient private sector final consumption and a robust growth in fixed assets. The World Bank (WB) projected GDP would grow 6% in 2015 and 6.6% in 2016, mainly thanks to increased aggregate demand as a result of the ongoing infrastructural projects and the fall in oil prices. The boost in real income will allow a robust increase in private consumption, the engine of Kenya’s economy. Higher public investment spending on infrastructure, especially on the standard gauge railway, will also stimulate the economy and enhance Kenya’s competitiveness, particularly beginning in 2016.
Agriculture (including livestock, forestry and fisheries) is the backbone of Kenya’s economy. Kenya’s agriculture sector directly influences its overall economic performance through its contribution to GDP. Periods of increased agricultural growth have been associated with high economic growth rates. It provides livelihood for more than 80% of the rural population and accounts for more than 50% of export earnings, led by coffee, tea, tobacco, cotton, sisal, pyrethrum, horticulture and cashew nuts, and exports of fruits, flowers and vegetables are also increasingly important. The sector is dominated by small-scale farming, which contributes about 75% of the total value of agricultural output and about 85% of total agricultural employment. There are an estimated three million smallholder farms in the country.
1 This committee meets periodically to review issues pertaining to the multilateral trading system.

BUSINESS PROCESS ANALYSIS: EXPORT OF COFFEE AND TEXTILES/APPAREL IN KENYA
2
BUSINESS PROCESS ANALYSIS: EXPORT OF COFFEE AND TEXTILES/APPAREL IN KENYA
3
Chapter 1 Methodology of the study
The BPA is a valuable organizational and diagnostic tool, which has become a source of greater transparency, improved efficiency and greater capacity to innovate. When properly applied, it can be the key to the success of any organization, whether it’s a government agencies or private sector enterprise
In this context, the Economic and Social Commission for Asia and the Pacific (UNESCAP), the United Nations Economic Commission for Europe (UNECE) and the UN Network of Experts for Paperless Trade (UNNExT) have detailed the methodology to analyse the complete business process in their “Business Process Analysis Guide to Simplify Trade Procedures”.2 The guide aims to provide a simple methodology to elicit and document the “as is” business processes used in the international trade, which requires interaction between traders (seller and buyer), government agencies and trade service providers.
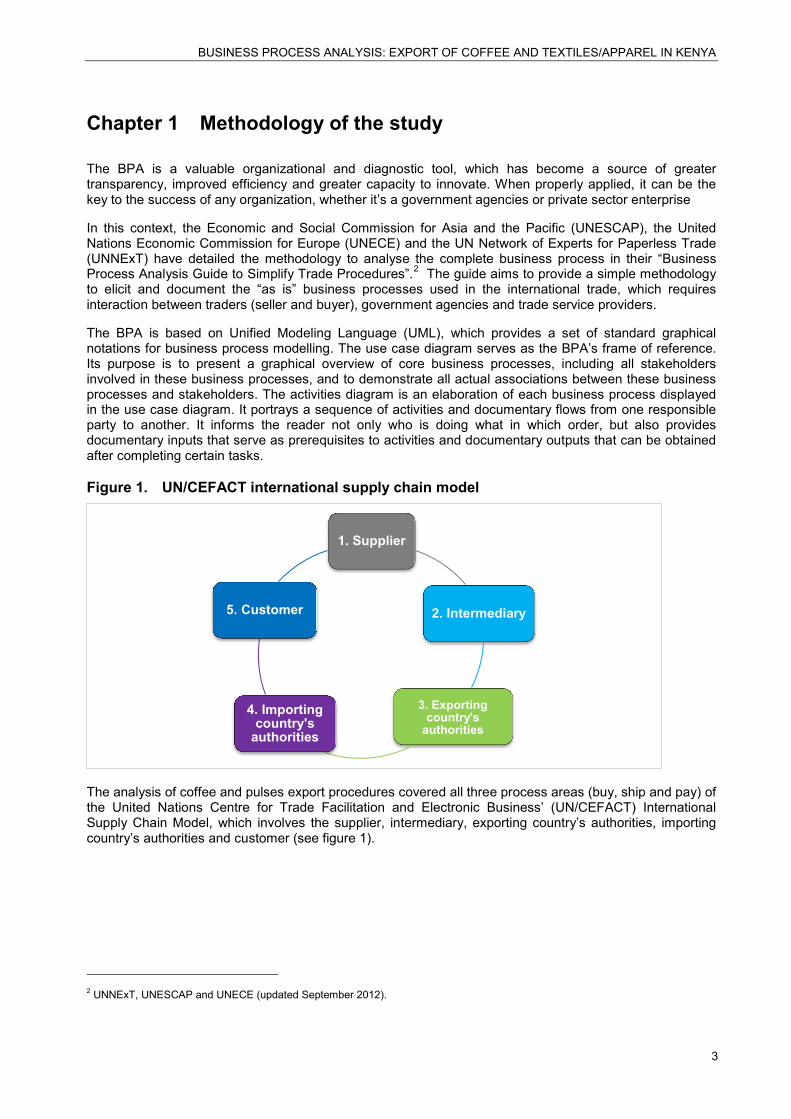
The BPA is based on Unified Modeling Language (UML), which provides a set of standard graphical notations for business process modelling. The use case diagram serves as the BPA’s frame of reference. Its purpose is to present a graphical overview of core business processes, including all stakeholders involved in these business processes, and to demonstrate all actual associations between these business processes and stakeholders. The activities diagram is an elaboration of each business process displayed in the use case diagram. It portrays a sequence of activities and documentary flows from one responsible party to another. It informs the reader not only who is doing what in which order, but also provides documentary inputs that serve as prerequisites to activities and documentary outputs that can be obtained after completing certain tasks.
Figure 1. UN/CEFACT international supply chain model
The analysis of coffee and pulses export procedures covered all three process areas (buy, ship and pay) of the United Nations Centre for Trade Facilitation and Electronic Business’ (UN/CEFACT) International Supply Chain Model, which involves the supplier, intermediary, exporting country’s authorities, importing country’s authorities and customer (see figure 1).
2 UNNExT, UNESCAP and UNECE (updated September 2012).
1. Supplier
2. Intermediary
3. Exporting
country's authorities
4. Importing country's
authorities
5. Customer

BUSINESS PROCESS ANALYSIS: EXPORT OF COFFEE AND TEXTILES/APPAREL IN KENYA
4
1. Buy: The conclusion of trade terms and the establishment of a sales contract.
Commercial procedures
• Sales contract
• Order goods and advice on delivery
• Mode of payment
2. Ship: The arrangements for cargo movement and the completion of necessary actions to meet regulatory requirements of both export and import countries.
Transport procedures
• Transport contract
• Collect, transport and deliver goods
• Waybill, goods receipt and status reports
Regulatory procedures
• Import and export licenses, etc.
• Customs clearance
• Cargo declaration
• Trade security
• Clear goods for import or export
3. Pay: The claim for the payment of the purchased cargo, once it’s delivered and meets all conditions and requirements
Financial procedures
• Credit rating
• Cargo insurance
• Execute payment
• Issue statements
The compelling reason for conducting the BPA study is that the results of the analysis may well serve as a baseline for implementing trade facilitation measures, not only for the selected products, but for the export and import sectors, such as:
1. Simplification of trade procedures (including commercial, transport, regulatory and financial procedures);
2. Simplification of documentary requirements and their alignment with international standards;
3. Ultimately, automation of international trade transaction and its associated electronic documents for paperless trade systems.
BUSINESS PROCESS ANALYSIS: EXPORT OF COFFEE AND TEXTILES/APPAREL IN KENYA
5
The documented business processes provide stakeholders at the management level (in particular, senior government officials at line ministries and managers of private enterprises) with insights into existing situations at the operational level. They serve as an organizational blueprint that facilitates the identification of bottlenecks, the prioritization of areas for improvement, and the design trade facilitation strategies by top policymakers to eliminate redundancies.
The BPA: Export of Coffee and Textile/Apparel in Kenya was conducted in 2015 with the aim to provide the basis for advocacy, public-private dialogue (PPD) and trade policy reforms to improve sector competitiveness. The private sector will also benefit, through enhanced trade performance, from a better understanding of their supply chains. The Government of Kenya and its East African Community (EAC) regional partners will also gain important insights to enable well-informed decision-making on trade and trade-related regulatory reforms.
Two exporters from the coffee sector were interviewed to collect the data regarding coffee exports, coupled with the public sector in charge of coffee trade in Kenya, i.e.; Export Promotion Council, Kenya Plant Health Inspectorate Service, Coffee Directorate, and Nairobi Coffee Exchange. For the textile and apparel sector, six manufacturers and exporters were interviewed, while the public sector directly and indirectly involved in textile and apparel trade that the study team consulted with are African Cotton and Textile Industries Federation, Ministry of Industrialization and Enterprise Development, Export Promotion Council, Fiber Crops Directorate, Athi River Export Processing Zones Authority, and Nairobi Export Processing Zones Authority.
The draft report was submitted to International Trade Centre (ITC) and was presented at the National Stakeholders Consultation Forum in Nairobi on 14 October 2015 for comments and validation of the findings. A second phase of field interview was conducted, including a field visit to the Port of Mombasa to collect additional data after the forum. The report has been revised, taking into account the comments received from ITC, the Trade and Investment Division (TID) of ESCAP, and stakeholders’ consultation forum.
Despite all possible efforts by the study team, the mission and BPA report suffers from a number of challenges and limitations as described below:
1. The targeted respondents either did not respond or confirm, in sufficient numbers, the meeting requested prior to the mission kick-off. Therefore, the study team improvised by scheduling the meetings on the fly, which resulted in the duration of appointments with the respondent companies being inadequate. This prohibited the study team from collecting all necessary data.
2. Certain required documents could not be gathered, as respondents felt that some of them were sensitive and confidential for internal uses only.
3. Interviews with government officials and exporters were marred by suspicion of the motives of this study. On the exporters’ side, while they were quite truthful about the simplicity or complexity of the various procedures, they were quite muted when it came to disclosing the actual informal costs, if any, which meant the export costs in this study are actual official costs.
The BPA study concentrated on one or two particular geographical areas for the interview; thus, it is presumed that the findings of the report might not represent the average scenario across all regions of Kenya.

BUSINESS PROCESS ANALYSIS: EXPORT OF COFFEE AND TEXTILES/APPAREL IN KENYA
6
Chapter 2 Kenya: an overview
1. Economic developments Kenya’s economy is estimated to have expanded by 5.4% in 2014, compared to a growth of 5.7% in 2013 (see figure 2). A number of factors influenced the country’s economic performance during 2014. From the demand side, government and private sector final consumption increased by 2.7% and 5.5% respectively. The demand side was mainly driven by a resilient private sector final consumption and a robust growth in fixed assets. Investment in fixed assets expanded rapidly on account of vibrant growth in the real estate sector, the ongoing mega-infrastructure projects and increased investments in air transport equipment. There was an increase of 7% in exports of goods and services. However, imports of goods and services expanded more rapidly, resulting in a widening of the current account deficit.
From the supply side, the major drivers of the economy were agriculture, forestry and fishing, construction, wholesale and retail trade, education, and finance and insurance, with respective contributions of 14.5%, 11.1%, 9.8%, 9.7% and 9.1% to the growth. The accommodation and food services (hotels and restaurants) sector contracted for the second year in a row, while all the other sectors recorded positive growths of varying magnitudes during the past year.
Figure 2. Kenya’s annual GDP growth (2012–2014) (%)
Source: Kenya Bureau of Statistics and World Bank Group
During 2014, the main macroeconomic indicators remained relatively stable. The KSh generally held firm against the major trading currencies despite its depreciation against the US dollar (US$), UK pound (£) and euro (€). The shilling’s stability was mainly due to proceeds from the successful international sovereign bond floated by the government in June 2014 and increased diaspora remittances. A significant decline in the international tourism earnings and a widening trade deficit worked against the shilling during this period.
Kenya’s economic performance improved to 4.9% during the first quarter of 2015 compared to a growth of 4.5% realized in the same quarter of 2014 (see figure 3). Growth was mainly supported by strong expansions of activities in construction, finance and insurance, information and communication, electricity and water supply, wholesale and retail trade, and transport and storage.
All the sectors of the economy recorded positive growth of varying magnitudes, except the hotels and restaurant, whose growth contracted. This was the fifth consecutive decline in growth, which is mainly attributed to low hotel occupancy rates arising from insecurity concerns mainly by international visitors.
0
1
2
3
4
5
6
2012 2013 2014
4.5
5.7 5.4

BUSINESS PROCESS ANALYSIS: EXPORT OF COFFEE AND TEXTILES/APPAREL IN KENYA
7
Figure 3. Kenya’s quarterly GDP growth (2012–2015) (%)
Source: Kenya Bureau of Statistics and World Bank Group
The WB projects GDP will grow 6% in 2015 and 6.6% in 2016, mainly thanks to increased aggregate demand as a result of the ongoing infrastructural projects and the fall in oil prices. The boost in real income will allow a robust increase in private consumption, the engine of Kenya’s economy. Higher public investment spending on infrastructure, especially on the standard gauge railway, will also stimulate the economy and enhance Kenya’s competitiveness, particularly beginning in 2016.
Private investment in the manufacturing sector will rise, supporting a rapid increase in industrial production. A gradual pick up in tourism and continued recovery in agriculture will further support growth. In contrast, the contribution of net exports is expected to be marginal. Although the fall in oil prices will reduce the current account deficit, it will remain relatively large due to slow export growth.
2. Trade performance As per key indicators of international trade shown in 2014, Kenya’s merchandise trade deficit continued to widen due to a high import bill. This was mainly driven by imports of aircrafts and associated equipment, motor vehicles, industrial machinery and petroleum products. The balance of trade deteriorated from a deficit of KSh 911 billion in 2013 to KSh 1,081 billion in 2014 – an increase of 18.7%.
During the past year, the import bill increased by 14.5% while earnings from exports registered an increase of only 7%. This led to the export-import ratio deteriorating from 35.5% in 2013 to 33.2% in 2014. Tea, horticulture, coffee, and articles of apparel and clothing accessories were the leading export earners in 2014, collectively accounting for 52.1% of total export earnings.
The volume of external trade has grown consistently between 2010 and 2014, as shown in table 1. The value of total trade increased by 12.5% to KSh 2,155.6 billion in 2014. Similarly, the value of imports rose by 14.5% in 2014 to KSh 1,618.3 billion, while that of total exports grew by 6.9% to KSh 537.2 billion during the same period. Domestic exports grew marginally from KSh 455.7 billion in 2013 to KSh 460.6 billion in 2014, while re-exports recorded a significant increase during 2014. This growth is mainly due to the increase in re-exports of petroleum products. The balance of trade continued to deteriorate from a deficit of KSh 911 billion in 2013 to KSh 1,081.1 billion in 2014 on account of an increase in imports. Consequently, exports financed only 33.2% of the import bill in 2014.
0
1
2
3
4
5
6
7
8
2012 2013 2014 2015
4.5
6.3
4.5 4.9
4.3
7.3
5.7
4.5
6.2
5.5
4.6
3.2
5.9
Q1
Q2
Q3
Q4

BUSINESS PROCESS ANALYSIS: EXPORT OF COFFEE AND TEXTILES/APPAREL IN KENYA
8
Table 1. Ethiopia’s balance of trade (2010–2014) (values in KSh million)
2010 2011 2012 2013 2014*
Exports (free on board (FOB))
Domestic exports 385 441 484 507 479 706 455 689 460 572 Re-exports 24 353 28 097 38 141 46 598 76 664 Total 409 794 512 604 517 847 502 287 537 236 Imports (cost, insurance and freight (CIF))
Commercial 934 729 1 283 111 1 360 408 1 403 225 1 599 619 Government 12 476 17 639 14 179 10 091 18 702 Total 947 205 1 300 750 1 374 587 1 413 316 1 618 321 Balance of trade (537 411) (788 146) (856 740) (911 029) (1 081 085) Total trade 1 356 999 1 813 354 1 892 434 1 915 603 2 155 557 Cover ratio** 43.3 39.4 37.7 35.5 33.2 Source: Kenya National Bureau of Statistics and Kenya Revenue Authority * Provisional ** Cover ratio % = (total imports/total exports)*100
Petroleum products, which account for the largest share of the total import bill, increased by 15.8% from KSh 252,673 million in 2013 to KSh 292,643 million in 2014. The expenditure on aircraft and associated equipment grew sixfold to KSh 129,589 million in 2014 from KSh 21,308 million in 2013. Likewise, the value of motor vehicle and industrial machinery imports rose by 22.2% and 10.9% respectively in 2014.
The value of maize imports more than tripled, while that of unmilled wheat increased by 12.1% in 2014. There was a decline in the value of iron and steel imports from KSh 80,749 million in 2013 to KSh 75,526 million in 2014. Expenditure on chemical fertilizers recorded a marked decline of 30.9% from KSh 27,957 million in 2013 to KSh 19,331 million in 2014.
In 2014, Africa was the leading export destination, accounting for 44.9% of total export earnings (see table 2). The value of total exports to Africa increased by 4.3% from KSh 231,474 million in 2013 to KSh 241,363 million in 2014. Europe was the second leading destination of total exports at KSh 138,965 million in 2014, with the European Union (EU) accounting for the bulk of exports to the region.
Table 2. Exports by destination (2010–2014) (values in KSh million) 2010 2011 2012 2013 2014*
Africa (EAC) 101 312 137 155 134 946 124 957 125 798 Africa (rest of) 87 602 110 446 115 643 106 517 115 565 Total Africa 188 914 247 600 250 589 231 474 241 363 Europe (EU) 101 689 126 402 114 411 111 594 128 038 Europe (Eastern) 7 734 9 844 10 784 11 705 10 927 Total Europe 109 422 136 246 125 195 123 299 138 965 United States of America 24 380 27 592 28 740 33 765 45 664 Middle East 30 525 32 940 42 065 39 502 35 806 Asia (Far East) 51 075 62 673 63 395 68 056 64 212 Australia/Oceanic 767 1 049 1 894 2 858 3 465 All other countries 1 661 1 022 1 191 1 456 1 166 Aircraft/ship stores 3 051 3 483 4 776 1 876 6 595 Total exports 409 795 512 605 517 847 502 286 537 236 Source: Kenya National Bureau of Statistics and Kenya Revenue Authority * Provisional

BUSINESS PROCESS ANALYSIS: EXPORT OF COFFEE AND TEXTILES/APPAREL IN KENYA
9
Imports from Africa declined marginally from KSh 147,839 million in 2013 to KSh 146,141 million in 2014. South Africa remained the dominant source of imports from this region despite a 9.7% decline in the value of imports to KSh 63,893 million in 2014.
Total exports to America have been rising steadily, growing by 35.2% to KSh 45,664 million in 2014. The value of exports to the United States of America (USA) increased by 27.9% to KSh 38,290 million in 2014, comprising mainly articles of apparel and clothing accessories (KSh 26,157 million), coffee (KSh 3,521 million), and titanium ores and concentrates (KSh 2,121 million).
Imports from the United States grew significantly from KSh 84,477 million in 2013 to KSh 187,476 million in 2014 (see table 3). Growth in imports from this region was largely driven by imports from the United States, which grew from KSh 57,412 million in 2013 to KSh 168,720 million in 2014, mainly on account of commercial aircraft imports. The purchase of aircraft and associated equipment was the single largest expenditure, accounting for 70.6% of total imports from the United States during 2014.
Table 3. Imports by destination (2010–2014) (values in KSh million) 2010 2011 2012 2013 2014*
Africa 114 804 151 254 140 755 147 839 146 141 Europe (EU) 185 431 227 599 225 543 231 597 245 651 Europe (Eastern) 18 484 27 350 24 226 39 039 40 294 Total Europe 203 914 254 950 249 769 270 635 285 945 America 55 647 79 168 119 293 84 477 187 476 Middle East 168 726 299 611 284 117 219 880 227 969 Asia (Far East) 399 195 509 556 572 408 676 820 762 204 Australia/Oceanic 3 932 2 997 8 112 13 040 7 500 All other countries 987 3 214 134 624 1 086 Aircraft/ship stores Total imports 947 205 1 300 750 1 374 588 1 413 315 1 618 321 Source: Kenya National Bureau of Statistics and Kenya Revenue Authority * Provisional
Total export earnings from Asia declined by 7% to KSh 100,018 million and accounted for 18.6% of total exports in 2014. In 2014, imports from Asia accounted for 61.2% of total imports. The Republic of India continued to be the major source of Kenya’s imports between 2011 and 2014, recording a marginal increase of 2.4% in 2014. Imports from the People’s Republic of China grew significantly from KSh 182,356 million in 2013 to KSh 248,648 million in 2014 out of the total of KSh 762,204 million, with the main category of imports being civil engineering equipment valued at KSh 23,059 million. Similarly, imports from the Republic of Indonesia and Japan expanded by 7.9% and 3.4% respectively in 2014. Expenditure on motor vehicles from Japan was the highest and stood at KSh 53,709 million during 2014.
3. Agriculture sector Agriculture (including livestock, forestry and fisheries) is the backbone of Kenya’s economy. Kenya’s agriculture sector directly influences its overall economic performance through its contribution to GDP. Periods of increased agricultural growth have been associated with high economic growth rates. It provides livelihood for more than 80% of the rural population and accounts for more than 50% of export earnings, led by coffee, tea, tobacco, cotton, sisal, pyrethrum, horticulture and cashew nuts, and exports of fruits, flowers and vegetables are also increasingly important.
The sector is dominated by small-scale farming, which contributes about 75% of the total value of agricultural output and about 85% of total agricultural employment. There are an estimated three million smallholder farms in the country.
Beans, cassava, potatoes, maize, sorghum and fruit are harvested mainly as subsistence crops. As a consequence of volatile production, agriculture’s contribution to overall GDP has been unstable in recent
BUSINESS PROCESS ANALYSIS: EXPORT OF COFFEE AND TEXTILES/APPAREL IN KENYA
10
years. About 84% of Kenya’s land is arid or semi-arid and not suitable for rain-fed farming, due to low and erratic rainfall. However, this land serves for livestock farming, including meat and milk production.
The agriculture sector faces several challenges. Its reliance on rain-fed agriculture, compounded by poor irrigation systems (with less than 7% of irrigated crop land), has led to increasing episodes of food insecurity in the country. In addition, the use of inappropriate technology, due to weak linkages between agricultural research bodies and farmers, lack of information on suitable quality of inputs and their high cost, and poor infrastructure, negatively affects productivity and competitiveness.
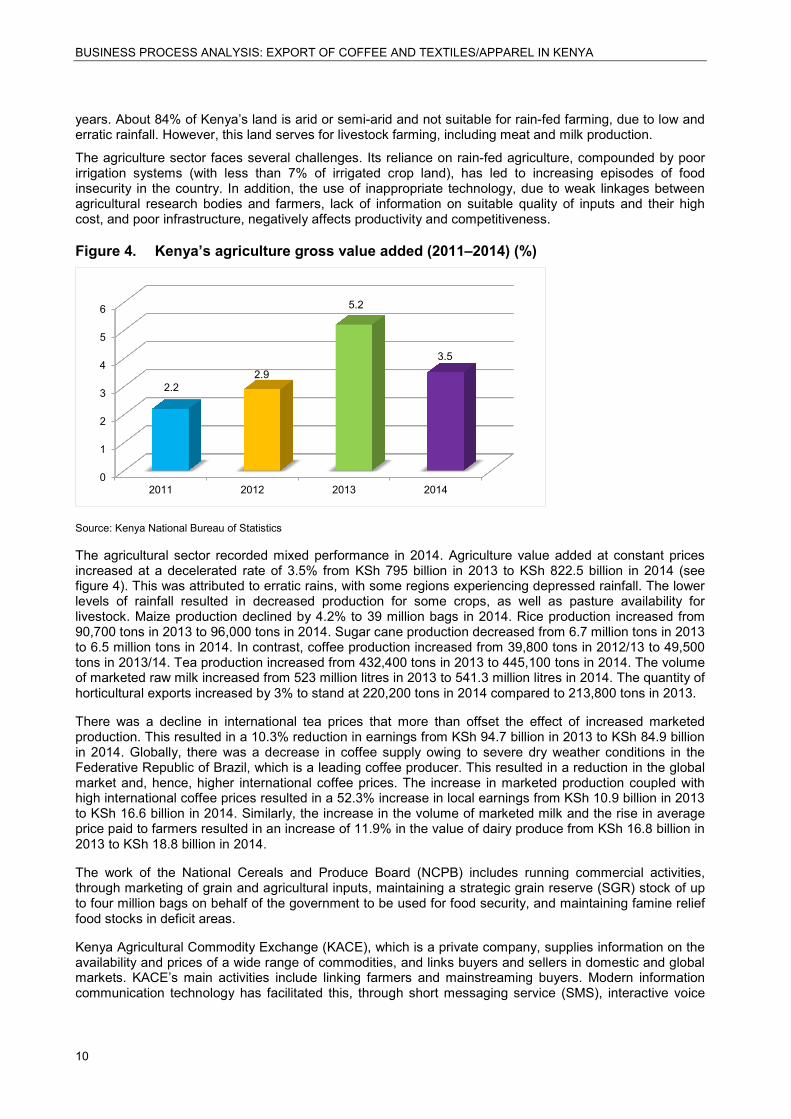
Figure 4. Kenya’s agriculture gross value added (2011–2014) (%)
Source: Kenya National Bureau of Statistics
The agricultural sector recorded mixed performance in 2014. Agriculture value added at constant prices increased at a decelerated rate of 3.5% from KSh 795 billion in 2013 to KSh 822.5 billion in 2014 (see figure 4). This was attributed to erratic rains, with some regions experiencing depressed rainfall. The lower levels of rainfall resulted in decreased production for some crops, as well as pasture availability for livestock. Maize production declined by 4.2% to 39 million bags in 2014. Rice production increased from 90,700 tons in 2013 to 96,000 tons in 2014. Sugar cane production decreased from 6.7 million tons in 2013 to 6.5 million tons in 2014. In contrast, coffee production increased from 39,800 tons in 2012/13 to 49,500 tons in 2013/14. Tea production increased from 432,400 tons in 2013 to 445,100 tons in 2014. The volume of marketed raw milk increased from 523 million litres in 2013 to 541.3 million litres in 2014. The quantity of horticultural exports increased by 3% to stand at 220,200 tons in 2014 compared to 213,800 tons in 2013.
There was a decline in international tea prices that more than offset the effect of increased marketed production. This resulted in a 10.3% reduction in earnings from KSh 94.7 billion in 2013 to KSh 84.9 billion in 2014. Globally, there was a decrease in coffee supply owing to severe dry weather conditions in the Federative Republic of Brazil, which is a leading coffee producer. This resulted in a reduction in the global market and, hence, higher international coffee prices. The increase in marketed production coupled with high international coffee prices resulted in a 52.3% increase in local earnings from KSh 10.9 billion in 2013 to KSh 16.6 billion in 2014. Similarly, the increase in the volume of marketed milk and the rise in average price paid to farmers resulted in an increase of 11.9% in the value of dairy produce from KSh 16.8 billion in 2013 to KSh 18.8 billion in 2014.
The work of the National Cereals and Produce Board (NCPB) includes running commercial activities, through marketing of grain and agricultural inputs, maintaining a strategic grain reserve (SGR) stock of up to four million bags on behalf of the government to be used for food security, and maintaining famine relief food stocks in deficit areas.
Kenya Agricultural Commodity Exchange (KACE), which is a private company, supplies information on the availability and prices of a wide range of commodities, and links buyers and sellers in domestic and global markets. KACE’s main activities include linking farmers and mainstreaming buyers. Modern information communication technology has facilitated this, through short messaging service (SMS), interactive voice
0
1
2
3
4
5
6
2011 2012 2013 2014
2.2 2.9
5.2
3.5

BUSINESS PROCESS ANALYSIS: EXPORT OF COFFEE AND TEXTILES/APPAREL IN KENYA
11
response (IVR) service, daily radio bulletins, a live radio auction service and online computer services. Trading activities are through competitive bids and offers, with KACE acting as a clearing house and arranging the financial and logistical aspects of the sale.
Access to credit is expected to improve sector performance in some respects, following aggressive reforms in Kenya’s financial sector, notably the adoption of legislation on microfinance and a credit information-sharing mechanism. However, the limited use of land as collateral and the high risk associated with agricultural activities in Kenya remain challenges to accessing credit in agriculture. The Agricultural Finance Corporation (AFC), a government-owned financial institution, provides short- and long-term financing to a variety of agricultural operations, mainly dairy, maize and wheat farming, and mechanization development. Estimates indicate that only 15% of the funding has been used on small-scale farms. In addition, Kenya Livestock Finance Trust is supporting livestock enterprises with credit.
Imports of maize, wheat, sorghum and millet are subject to East African Community (EAC) common external tariff (CET) rates of 25% and rice imports of 75%. The import tariff on coffee and coffee products is 25%, the CET maximum rate.
4. Manufacturing sector The manufacturing sector’s contribution to GDP has remained at an average of 10% for more than 10 years. However, Vision 2030 stipulates that the sector should account for 20% of GDP. Achieving this goal requires addressing some underlying constraints that hinder faster growth. These include high input cost, decline in investment portfolio for some activities, transport infrastructure, high cost of credit and stiff competition from cheap imports. In an effort to spur growth in the sector, the government continues to invest in both infrastructure development projects and cheap energy supply, mainly in geothermal and wind energy. Essentially, this will improve competitiveness of manufactured products in the domestic and global markets. Equally, the government initiative to attract investors through the Special Economic Zones (SEZs) programme, which allows lower levels of taxation and fewer regulatory hurdles, is expected to boost the country’s industrial output.
In 2014, the manufacturing sector’s real output expanded by 3.4% compared to a growth of 5.6% in 2013, with the sector’s volume of output increased by 4.5% in 2014. The modest inflation during 2014 contributed to capital accumulation in the sector, thus boosting production. The decrease in oil prices in the second half of the year also contributed to a reduction in input costs.
The export processing zone (EPZ) programme recorded improved performance in most of the indicators. These included exports, imports, employment, number of approved zones, and local expenditure on goods and services. However, the number of operating enterprises, domestic sales and cumulative investments were reduced. The total value of manufacturing projects approved by financial institutions rose by 30.3% to KSh 237.9 billion in 2014.
Formal employment in the manufacturing sector rose by 2.9% to 287,456 persons in 2014. Some of the activities that had high increases in employment numbers were in manufacture of pharmaceutical products, paints and varnishes, animal feeds and dairy products. Similarly, total wage earnings increased by 12.4% from KSh 98.3 million in 2013 to KSh 110.5 million in 2014.
The textile subsector only recorded a 2.8% growth in 2014. The growth was as a result of increased production of knitting wool, woven fabric and blankets, which went up by 25.5%, 16.4% and 4.3% respectively. However, production of twine, cordage and rope dropped by more than 25% in 2014. The apparel subsector recorded a growth of 4.8% during 2014, with cardigans registering the highest growth of 13.4%, followed by T-shirts and shirts, with 5.2% and 1.4% respectively.
Financial institutions play a key role in promoting industrial growth through provision of loans and credit. Enterprises with adequate financial access have greater potential to grow through an increase in productive capacities. The total value of approved projects rose to KSh 237.9 billion in 2014 from KSh 182.6 billion in 2013. The value of projects approved by the selected industrial financial institutions in 2014 was KSh 569.1 million, which was almost half the value endorsed in 2013. This was attributed to a reduction in the value of approved expenditures by the selected financial institutions, with the exception of
BUSINESS PROCESS ANALYSIS: EXPORT OF COFFEE AND TEXTILES/APPAREL IN KENYA
12
Kenya Industrial Estates (KIE). However, the total number of projects endorsed by financial institutions increased from 268 in 2013 to 549 in 2014.
Kenya Investment Authority (KenInvest) recorded a significant decrease in proposed investments in the manufacturing sector. The value of investments stood at KSh 7.4 billion in 2014; down significantly from KSh 42.1 billion in 2013. The projects concentrated more on the manufacture of food products, fabricated metal products, chemical and chemical products, and pharmaceutical products. Local investment accounted for 67.4% of the total investments in 2014.
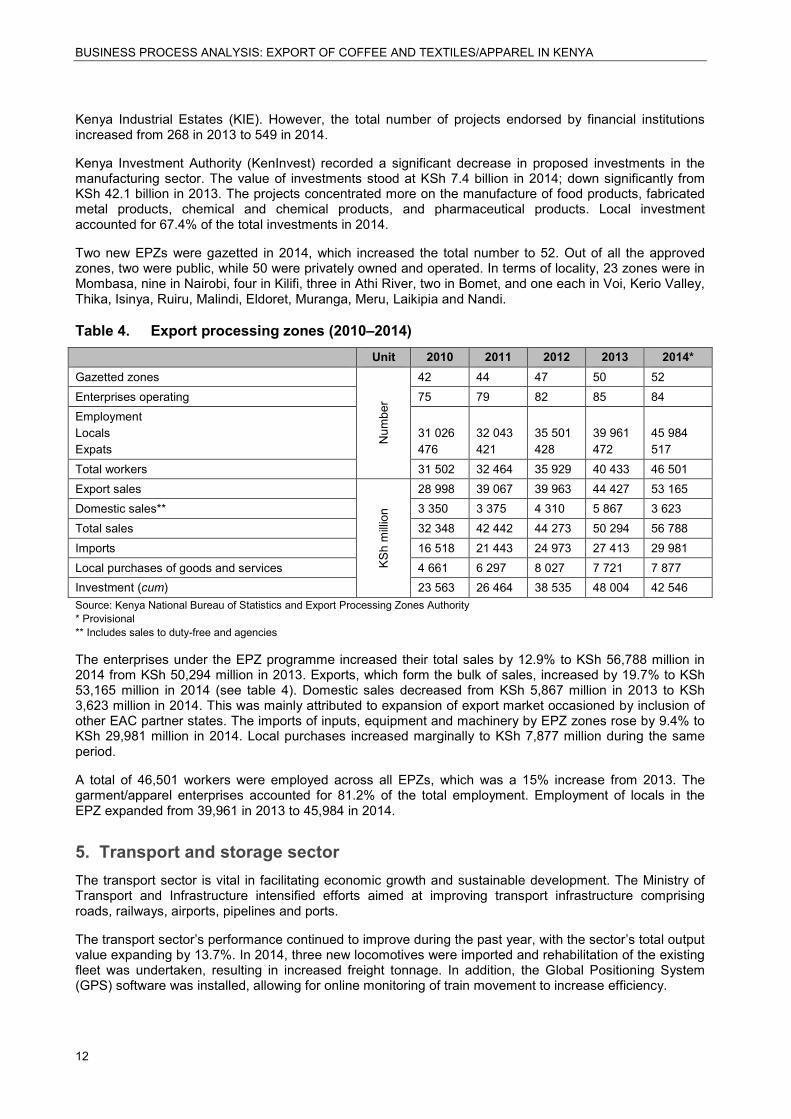
Two new EPZs were gazetted in 2014, which increased the total number to 52. Out of all the approved zones, two were public, while 50 were privately owned and operated. In terms of locality, 23 zones were in Mombasa, nine in Nairobi, four in Kilifi, three in Athi River, two in Bomet, and one each in Voi, Kerio Valley, Thika, Isinya, Ruiru, Malindi, Eldoret, Muranga, Meru, Laikipia and Nandi.
Table 4. Export processing zones (2010–2014) Unit 2010 2011 2012 2013 2014*
Gazetted zones N
umbe
r 42 44 47 50 52
Enterprises operating 75 79 82 85 84 Employment Locals Expats
31 026 476
32 043 421
35 501 428
39 961 472
45 984 517
Total workers 31 502 32 464 35 929 40 433 46 501 Export sales
KSh
milli
on
28 998 39 067 39 963 44 427 53 165 Domestic sales** 3 350 3 375 4 310 5 867 3 623 Total sales 32 348 42 442 44 273 50 294 56 788 Imports 16 518 21 443 24 973 27 413 29 981 Local purchases of goods and services 4 661 6 297 8 027 7 721 7 877 Investment (cum) 23 563 26 464 38 535 48 004 42 546 Source: Kenya National Bureau of Statistics and Export Processing Zones Authority * Provisional ** Includes sales to duty-free and agencies
The enterprises under the EPZ programme increased their total sales by 12.9% to KSh 56,788 million in 2014 from KSh 50,294 million in 2013. Exports, which form the bulk of sales, increased by 19.7% to KSh 53,165 million in 2014 (see table 4). Domestic sales decreased from KSh 5,867 million in 2013 to KSh 3,623 million in 2014. This was mainly attributed to expansion of export market occasioned by inclusion of other EAC partner states. The imports of inputs, equipment and machinery by EPZ zones rose by 9.4% to KSh 29,981 million in 2014. Local purchases increased marginally to KSh 7,877 million during the same period.
A total of 46,501 workers were employed across all EPZs, which was a 15% increase from 2013. The garment/apparel enterprises accounted for 81.2% of the total employment. Employment of locals in the EPZ expanded from 39,961 in 2013 to 45,984 in 2014.
5. Transport and storage sector The transport sector is vital in facilitating economic growth and sustainable development. The Ministry of Transport and Infrastructure intensified efforts aimed at improving transport infrastructure comprising roads, railways, airports, pipelines and ports.
The transport sector’s performance continued to improve during the past year, with the sector’s total output value expanding by 13.7%. In 2014, three new locomotives were imported and rehabilitation of the existing fleet was undertaken, resulting in increased freight tonnage. In addition, the Global Positioning System (GPS) software was installed, allowing for online monitoring of train movement to increase efficiency.
BUSINESS PROCESS ANALYSIS: EXPORT OF COFFEE AND TEXTILES/APPAREL IN KENYA
13
Freight traffic of the railway transport subsector recorded improved performance, which is mainly attributed to the three new locomotive engines acquired, coupled with rehabilitation of the existing fleet. Total freight traffic via rail expanded by 24.3% from 1,214,000 tons in 2013 to 1,509,000 tons in 2014.
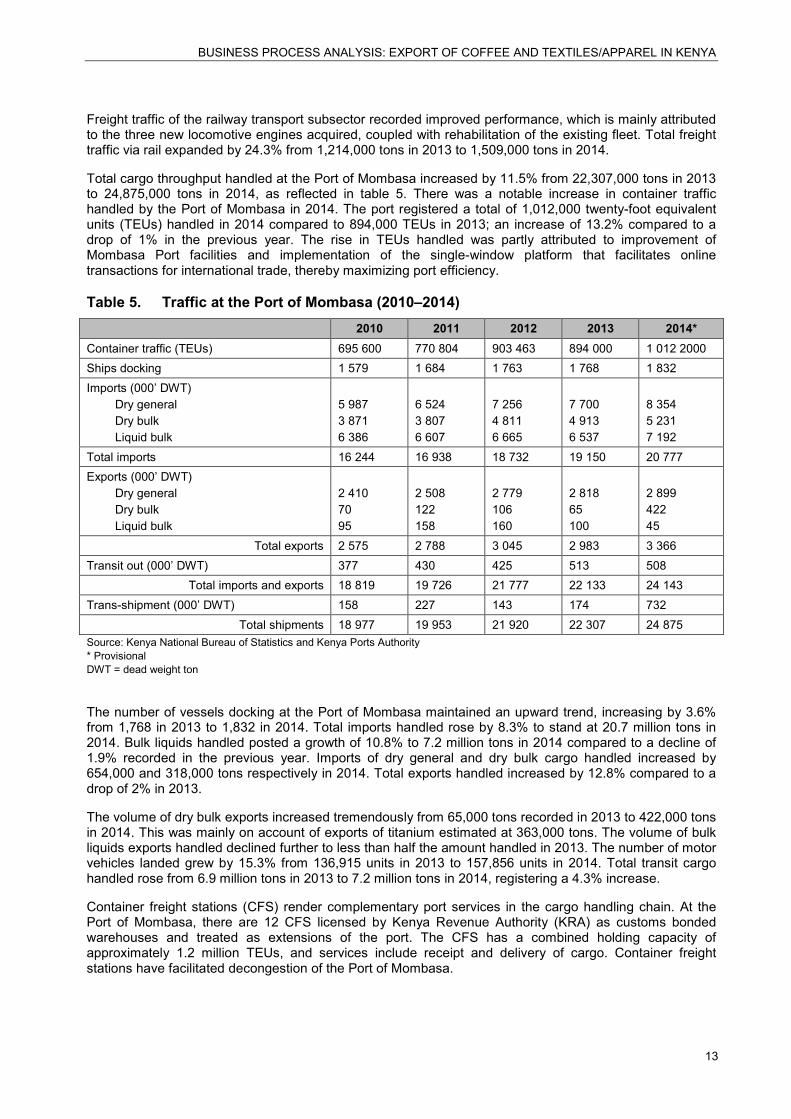
Total cargo throughput handled at the Port of Mombasa increased by 11.5% from 22,307,000 tons in 2013 to 24,875,000 tons in 2014, as reflected in table 5. There was a notable increase in container traffic handled by the Port of Mombasa in 2014. The port registered a total of 1,012,000 twenty-foot equivalent units (TEUs) handled in 2014 compared to 894,000 TEUs in 2013; an increase of 13.2% compared to a drop of 1% in the previous year. The rise in TEUs handled was partly attributed to improvement of Mombasa Port facilities and implementation of the single-window platform that facilitates online transactions for international trade, thereby maximizing port efficiency.
Table 5. Traffic at the Port of Mombasa (2010–2014) 2010 2011 2012 2013 2014*
Container traffic (TEUs) 695 600 770 804 903 463 894 000 1 012 2000 Ships docking 1 579 1 684 1 763 1 768 1 832 Imports (000’ DWT)
Dry general Dry bulk Liquid bulk
5 987 3 871 6 386
6 524 3 807 6 607
7 256 4 811 6 665
7 700 4 913 6 537
8 354 5 231 7 192
Total imports 16 244 16 938 18 732 19 150 20 777 Exports (000’ DWT)
Dry general Dry bulk Liquid bulk
2 410 70 95
2 508 122 158
2 779 106 160
2 818 65 100
2 899 422 45
Total exports 2 575 2 788 3 045 2 983 3 366 Transit out (000’ DWT) 377 430 425 513 508
Total imports and exports 18 819 19 726 21 777 22 133 24 143 Trans-shipment (000’ DWT) 158 227 143 174 732
Total shipments 18 977 19 953 21 920 22 307 24 875 Source: Kenya National Bureau of Statistics and Kenya Ports Authority * Provisional DWT = dead weight ton
The number of vessels docking at the Port of Mombasa maintained an upward trend, increasing by 3.6% from 1,768 in 2013 to 1,832 in 2014. Total imports handled rose by 8.3% to stand at 20.7 million tons in 2014. Bulk liquids handled posted a growth of 10.8% to 7.2 million tons in 2014 compared to a decline of 1.9% recorded in the previous year. Imports of dry general and dry bulk cargo handled increased by 654,000 and 318,000 tons respectively in 2014. Total exports handled increased by 12.8% compared to a drop of 2% in 2013.
The volume of dry bulk exports increased tremendously from 65,000 tons recorded in 2013 to 422,000 tons in 2014. This was mainly on account of exports of titanium estimated at 363,000 tons. The volume of bulk liquids exports handled declined further to less than half the amount handled in 2013. The number of motor vehicles landed grew by 15.3% from 136,915 units in 2013 to 157,856 units in 2014. Total transit cargo handled rose from 6.9 million tons in 2013 to 7.2 million tons in 2014, registering a 4.3% increase.
Container freight stations (CFS) render complementary port services in the cargo handling chain. At the Port of Mombasa, there are 12 CFS licensed by Kenya Revenue Authority (KRA) as customs bonded warehouses and treated as extensions of the port. The CFS has a combined holding capacity of approximately 1.2 million TEUs, and services include receipt and delivery of cargo. Container freight stations have facilitated decongestion of the Port of Mombasa.

BUSINESS PROCESS ANALYSIS: EXPORT OF COFFEE AND TEXTILES/APPAREL IN KENYA
14
Chapter 3 Trade Facilitation
1. Trade agreements Kenya is a founding member of the EAC, the Intergovernmental Authority on Development (IGAD), the Indian Ocean Rim Association for Regional Cooperation (IOR-ARC), and the Common Market for Eastern and Southern Africa (COMESA). Kenya has also initiated an economic partnership agreement (EPA) with the European Union (EU) and continues to engage in these negotiations. As part of the EAC, it is negotiating the EAC-COMESA-SADC Tripartite Free Trade Agreement (TFTA). Kenya benefits from the US African Growth and Opportunity Act (AGOA) and the Generalized System of Preferences (GSP) schemes of some developed partners, notably Canada, the EU, Japan, the Kingdom of Norway, the Swiss Confederation and the USA. It also participates in the US-EAC Trade and Investment Framework Agreement (TIFA).
2. Registration and pre-shipment inspection Trade activities, including imports, are open to both Kenyans and foreigners. The repeal of the Imports, Exports and Essential Supplies Act and the Trade Licensing Act has simplified registration procedures.3 The documents required for importation of goods include a personal identification number (PIN) from the Domestic Taxes Department of KRA, and an import declaration form (IDF), which costs 2.25% of CIF value or KSh 5000, whichever is higher.
In 2005, the Kenya Bureau of Standards (KEBS) established a system of Pre-Export Verification of Conformity (PVoC) to Kenyan technical regulations or approved equivalents. The conformity assessment programme is carried out by verification bodies appointed through tendering. As of 18 January 2012, Bureau Veritas, Intertek International, and Société Générale de Surveillance (SGS) were appointed to carry out PVoC procedures on a list of 2,463 tariff lines, including textile, chemical, food and electrical product imports. KEBS may undertake a surveillance audit to check the effectiveness of the appointed bodies.
The registration formalities for imports of goods for commercial purposes also apply to exports. Export consignments of animals and animal products require an international veterinary certificate issued by the Director of Veterinary Services, at a fee averaging KSh 500. For health-related products, certification is required on the premises where the product is processed, manufactured or stored prior to exportation. This certification is issued by the health authorities, for a fee of KSh 1,000. Kenya Plant Health Inspectorate Service (KEPHIS) issues export permits, depending on the trading partner’s requirements.
3. Customs procedures The Kenya Revenue Authority (KRA) is responsible for customs procedures, as well as collection, accounting and administration of all government taxes, including customs and excise duties and value-added tax (VAT) on imports. Kenya participates in the Revenue Authorities Digital Data Exchange (RADDEx) project, a system for electronic exchange of documents and information among EAC customs authorities.
Kenya has embarked on a wide range of trade facilitation reforms, geared towards improving its global competitiveness. In this respect, in 2005, KRA brought into operation the Simba electronic system to process customs declarations. In general, the documents required for customs declaration are: the supplier’s invoice, the packing list, the bill of lading, the PVoC certificate of conformity, the IDF, the single entry document (C17B), the insurance debit note and the declaration of customs value form (C36). The customs authority may request the importer to provide additional supporting documents. According to the World Bank (WB), Kenya ranks 153rd out of 189 economies in terms of ease of trade across border.
3 The Licensing Laws (Repeals and Amendments) Act 2006.
BUSINESS PROCESS ANALYSIS: EXPORT OF COFFEE AND TEXTILES/APPAREL IN KENYA
15
According to data collected by Doing Business 2015, exporting a standard container of goods requires eight documents, takes 26 days and costs US$ 2,255. Importing the same container of goods requires nine documents, takes 26 days and costs US$ 2,350.
Import procedures are regulated through the EAC Customs Management Act and the Customs and Excise Act Cap. 472 (2011 amendment). Importers clear their own goods through an appointed agent. An application fee of US$ 10 is required for a customs broker license. Once licensed, the agent is required, inter alia, to execute a security bond of US$ 5,000, pay an annual license fee of US$ 400 and have a computer system capable of connecting to the Simba system.
A risk management system is built into the Simba system: goods may be routed through a red channel (high risk), requiring a physical inspection of the documents and goods before clearance; a yellow channel (medium risk), requiring inspection of the documents; or a green channel (low risk) for clearance without the need for inspection. In 2013, an average of 37% of goods was cleared through the green channel, 42% through the yellow and 21% through the red. The blue channel is used for clearance of authorized economic operators (AEO), which was adopted in 2008. It grants special status to importers and their clearing agents who have proven to be reliable and compliant KRA partners. To be considered as an AEO, international trade operators are required to have, inter alia, a satisfactory system for management of commercial records, proven financial and safety capacities, and good knowledge of customs procedures in Kenya. An application form is available on the KRA website for importers and clearing agents.
4. Export taxes In 2006, with a view to increasing value addition in the leather subsector, the Government of Kenya increased export taxes on hides and skins from 20% to 40%. According to the authorities, this policy has been successful in boosting Kenya’s leather exports, and almost all skins produced are semi-processed to wet blue or finished leather. The number of cottage industries and tanneries has also risen, resulting in noticeable job creation. Kenya also applies an export tax of 20% to scrap metal to support local demand for metals.
5. Export prohibitions, restrictions and licensing The Third Schedule of the EAC Customs Management Act is the main legal basis for export prohibitions and restrictions. The minister in charge of trade may amend the lists by order in the gazette. In October 2008, the government placed a ban on the export of maize to prevent a further shortfall in its supply to the local market.
In 2010, through a gazette notice, the EAC Council of Ministers restricted the export of used automobile batteries, lead scrap, crude and refined lead, and all other forms of scrap metals, in order to support the region’s demand for metals.
6. Export subsidies and incentives The Government of Kenya does not grant any export subsidy and there has not been substantial change to export incentives during the past few years. However, three incentive schemes are available to Kenyan companies to encourage export-oriented activities: the EPZs Scheme, the Manufacturing Under Bond Scheme (MUBS), and the Duty Remission Scheme (DRS).
The Export Processing Zones Authority (EPZA) administers the implementation of the EPZ Act Cap. 517 of the Laws of Kenya. EPZA appraises applicants for EPZ developer and operator licenses. It also reviews applications for business service permits on the basis of the eligibility of the activity, the applicant’s professional qualification and adequate experience to undertake the proposed business activity, and its financial and ethical standings. The main eligible activities are: export-oriented manufacturing or processing; export-oriented commercial activities, including bulk breaking, trading, relabelling, grading and repacking; and export services, including brokerage, repair, consultancy and information.
BUSINESS PROCESS ANALYSIS: EXPORT OF COFFEE AND TEXTILES/APPAREL IN KENYA
16
The criteria against which the EPZ enterprises are evaluated include job creation, technology transfer and skills training, development of new export products and new export markets, and backward linkages with the Kenyan economy. EPZ enterprises benefit from exemptions from all taxes and duties payable under the Customs and Excise Act and the Value Added Tax Act on all imports for use in eligible business activities, subject to the limitations on goods specified in the second schedule of the EPZ Act, and the conditions specified in the Customs and Excise Act and the Value Added Tax Act. According to the authorities, EPZs in Kenya are being transformed into special economic zones (SEZs). The SEZ programme will widen the scope of incentives to various eligible activities.
7. Export finance, insurance and guarantees Kenya does not maintain a public export finance, insurance or guarantee scheme. Export finance and insurance are provided by private companies whose prices are market-determined. The African Trade Insurance Agency provides export credit guarantees to cover political risks.
8. Export promotion and marketing assistance The EPC is the main institution in charge of the development and promotion of Kenya’s exports. It has the mandate of coordinating and harmonizing export development programmes in Kenya. In collaboration with the Ministry of Trade, the EPC develops annual export market development programmes to guide the participation of Kenya’s exporters in trade fairs and exhibitions in prioritized markets.
Among the other agencies involved are EPZA, the Kenya National Chamber of Commerce and Industry (KNCCI), and sectoral producer and exporter associations, such as the Kenya Association of Manufacturers (KAM). Government’s regulatory agencies, such as the Horticultural Crops Development Authority (HCDA), are also involved in export promotion activities. The National Export Strategy (NES) was issued in 2003, for the period 2003–2007, which assisted in deepening markets for manufacturers in traditional markets, and expansion into new markets.

BUSINESS PROCESS ANALYSIS: EXPORT OF COFFEE AND TEXTILES/APPAREL IN KENYA
17
Chapter 4 Coffee sector
1. Production Coffee production declined in 2009 and 2010 as a consequence of cold weather conditions. Small-scale farmers, organized into cooperatives, continue to account for the majority of coffee production (approximately 70%). Table 6 shows the area, production and average yield of coffee by type of grower for crop years 2009/10 to 2013/14.
There was a minimal increase in the area planted for coffee from 109,800 hectares in 2013 to 110,000 hectares in 2014. The area for coffee in cooperatives and estates increased by 100 hectares each during the past year. However, production in estates declined for the second year in a row. Despite depressed production in the estates, the coffee subsector recorded an overall increase in production of 24.4% from 39,800 tons in 2013 to 49,500 tons in 2014. This was largely due to the cooperative subsector, which recorded a 49.3% increase from 21,900 tons in 2013 to 32,700 tons in 2014.
The increase was attributed to factors such as biannual coffee production cycle, whereby one season of good harvest is followed by a drop in the following season. Recently, planted coffee coming into production and improved investment in coffee production also contributed to the increase. The average yield for the cooperative sector increased by 48.4% while that of the estates decreased by 5%.
Table 6. Kenya’s coffee production by type of growers (2009/10–2013/14) 2009/10 2010/11 2011/12 2012/13 2013/14*
Hectares** (000’) Cooperatives Estates
84.2 24.5
82.4 24.5
85.2 24.6
85.2 24.6
85.3 24.7
Total 108.7 106.9 109.8 109.8 110 Production (MT 000’) Cooperatives Estates
22.3 19.7
19.6 16.7
28 22
21.9 17.9
32.7 16.8
Total 42 36.3 50 39.8 49.5 Average yield (kg/ha) Cooperatives Estates
264.8 804.1
237.9 681.6
328.6 894.3
257 727.6
383 680
Source: Agriculture, Fisheries and Food Authority, and Coffee Directorate * Provisional ** Series revised MT = Metric tons
The 2001 Coffee Act provides the legal framework for the subsector. The Coffee Directorate (CD) is the regulatory body and issues licenses to marketing agents, who are legally allowed to participate in the coffee auctions. The Kenya Planters Cooperative Union (KPCU) is the main coffee miller in Kenya. However, its dominance has decreased recently, after the CD licensed nine additional millers (Central Kenya, Nyambene, Thika Coffee, Kofinaf, CMS, NKG, Sasini, Gusii, and Kenya Co-operative Coffee Millers Ltd). Other organizations involved in the industry are the Coffee Research Foundation (CRF), financed by CD through a levy on coffee proceeds, and the Mild Coffee Trade Association of East Africa (MCTA), a regional association of coffee dealers.
The government has recently established the Coffee Development Fund (CoDF) as a source of credit to assist coffee growers to improve their production activities. According to the authorities, CoDF funds are loaned to farmers at an interest rate of 10% per annum. Funding is mainly provided for farm operations geared toward increasing coffee production and quality, coffee rehabilitation, and for coffee processing.

BUSINESS PROCESS ANALYSIS: EXPORT OF COFFEE AND TEXTILES/APPAREL IN KENYA
18
2. Exports Though a relatively small producer (see table 7), Kenya is still an important producing country due to its consistently high-quality mild arabica coffees. Export shipments occur between December and July for the main crop and between August and December for the fly crop. The government does not impose any tax on coffee exports from Kenya. The import tariff on coffee and coffee products is 25%, the maximum rate of the CET.
Table 7. Total coffee production by all exporting countries in Africa (2011–2014) Crop year commencing
(in thousands; 60 kg bags) 2011 2012 2013 2014 % Change
2013–2014
Africa 16 058 16 632 16 240 16 589 2% The Republic of Burundi 204 406 163 248 51.71% The Republic of Cameroon 574 366 413 475 15% The Democratic Republic of the Congo
357 334 347 335 -3.5%
The Republic of Cote d’Ivoire 1 966 2 072 2 107 2 175 3.2% The Federal Democratic Republic of Ethiopia
6 798 6 233 6 527 6 625 1.5%
The Republic of Guinea 385 233 158 150 -5% Kenya 757 875 838 850 1.4% The Republic of Madagascar 585 500 588 518 -11.9% The Republic of Rwanda 251 259 254 258 1.5% The United Republic of Tanzania 544 1 109 809 728 -10.1% The Togolese Republic 162 78 135 100 -26% The Republic of Uganda 3 075 3 878 3 602 3 800 5.5% Others 399 289 298 307 3.3% Source: International Coffee Organization. Data as of Oct. 2015 – next update: Jan. 2016
Almost 99% of Kenyan coffee is exported, mainly to the Federal Republic of Germany, the Kingdom of Belgium, the Kingdom of Sweden and the US (see table 8). Kenya is also the main logistics hub for Eastern Africa and all the main international coffee traders are represented in the country.4
Table 8. Main destinations for Kenya coffee exports (1,000 kg bags) and share percentage (2010–2013)
Country 2010/2011 % Share 2011/2012 % Share 2012/2013 % Share Germany 90 14% 157 20% 182 22% Belgium 68 10% 117 15% 136 17% United States 62 9% 106 13% 113 14% Sweden 69 11% 109 14% 69 8% India 18 3% 7 1% 48 6% The Republic of Finland 30 5% 34 4% 38 5% Norway 10 1% 20 3% 19 2% Canada 19 3% 19 2% 16 2% The State of Israel 0 0% 5 1% 15 2% The French Republic 7 1% 6 1% 14 2%
4 Kenya Coffee Report 2014 by USDA Foreign Agricultural Service (FAS), 5 July 2014.

BUSINESS PROCESS ANALYSIS: EXPORT OF COFFEE AND TEXTILES/APPAREL IN KENYA
19
Country 2010/2011 % Share 2011/2012 % Share 2012/2013 % Share The Russian Federation 0 0% 7 1% 14 2%
Republic of Korea 4 1% 9 1% 14 2% Australia 4 1% 9 1% 13 2% Switzerland 132 20% 43 5% 13 2% The United Kingdom of Great Britain and Northern Ireland
73 11% 34 4% 12 1%
FAS/Nairobi forecasts an increase in Kenya’s coffee production to 900,000 bags in the marketing year (MY) 2014/2015, partly due to the government’s ongoing expansion programme. Increased adoption of improved varieties by farmers and higher global coffee prices are also expected to boost production and exports. Legal and institutional reforms are also being implemented in the sector.
Coffee is marketed through computerized auctions at the Nairobi Coffee Exchange (NCE) and through direct sales. The quantity of coffee auctioned at the NCE declined from 3,714 MT in April 2015 to 2,969 MT in May 2015, while the average auction price dropped from KSh 310.44 per kilogram to KSh 289.09 per kilogram during the same period (see figure 5). There was no coffee auction during the month of June 2015 since the NCE was in recess.
Figure 5. Coffee sales at NCE (in ‘000 MT)
Source: Coffee Directorate
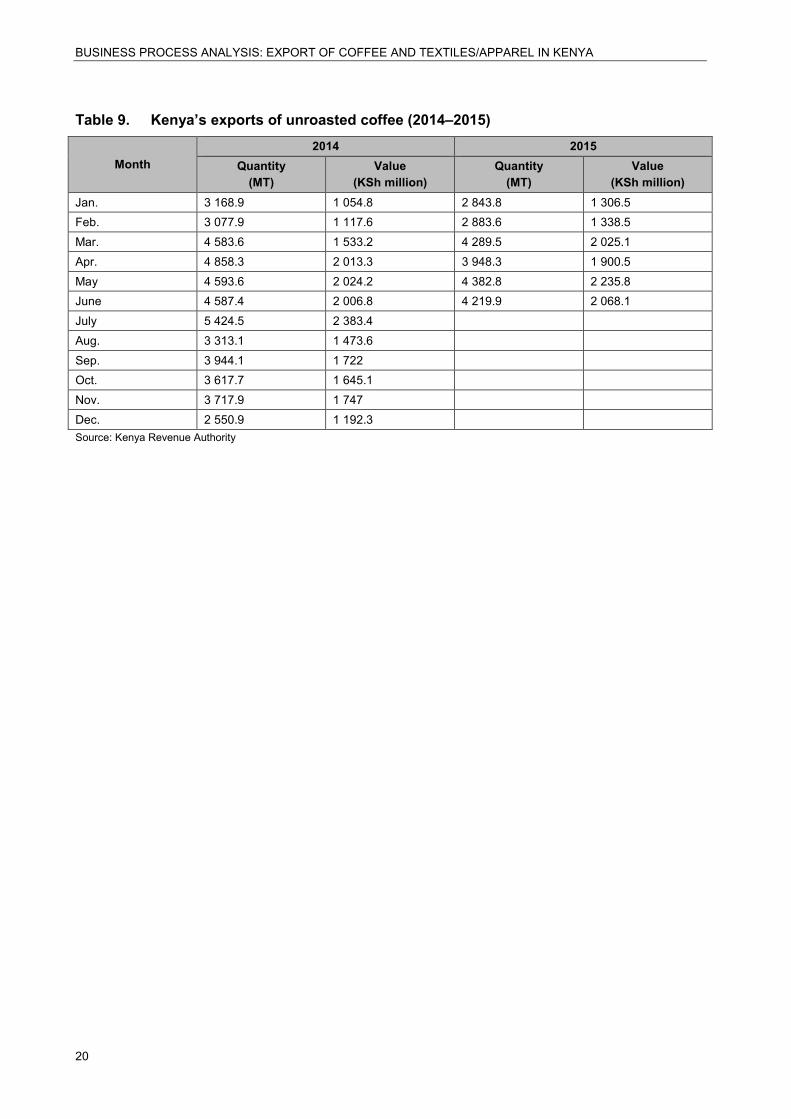
The most recent data from KRA in 2014 and 2015 shows quantity of coffee exported contracted from 4,382.8 MT in May 2015 to 4,219.9 MT in June 2015, while its value decreased from KSh 2,235.8 million to KSh 2,068.1 million during the same period (see table 9).
0
1,000
2,000
3,000
4,000
5,000
6,000
7,000
Jan. Feb. Mar. Apr. May June July Aug. Sep. Oct. Nov. Dec.
2014
2015
BUSINESS PROCESS ANALYSIS: EXPORT OF COFFEE AND TEXTILES/APPAREL IN KENYA
20
Table 9. Kenya’s exports of unroasted coffee (2014–2015)
Month 2014 2015
Quantity (MT)
Value (KSh million)
Quantity (MT)
Value (KSh million)
Jan. 3 168.9 1 054.8 2 843.8 1 306.5 Feb. 3 077.9 1 117.6 2 883.6 1 338.5 Mar. 4 583.6 1 533.2 4 289.5 2 025.1 Apr. 4 858.3 2 013.3 3 948.3 1 900.5 May 4 593.6 2 024.2 4 382.8 2 235.8 June 4 587.4 2 006.8 4 219.9 2 068.1 July 5 424.5 2 383.4 Aug. 3 313.1 1 473.6 Sep. 3 944.1 1 722 Oct. 3 617.7 1 645.1 Nov. 3 717.9 1 747 Dec. 2 550.9 1 192.3 Source: Kenya Revenue Authority
BUSINESS PROCESS ANALYSIS: EXPORT OF COFFEE AND TEXTILES/APPAREL IN KENYA
21
Chapter 5 Textile and apparel sector
Local textile manufacturers supply only 45% of the Kenyan textile market requirements, while imported new and used clothes account for about 37% of the market. Demand for textile products in Kenya is estimated to be growing at 3.8% annually. Lint and second-hand clothing trade dominates cotton and textile trade between Kenya and the different regions.5
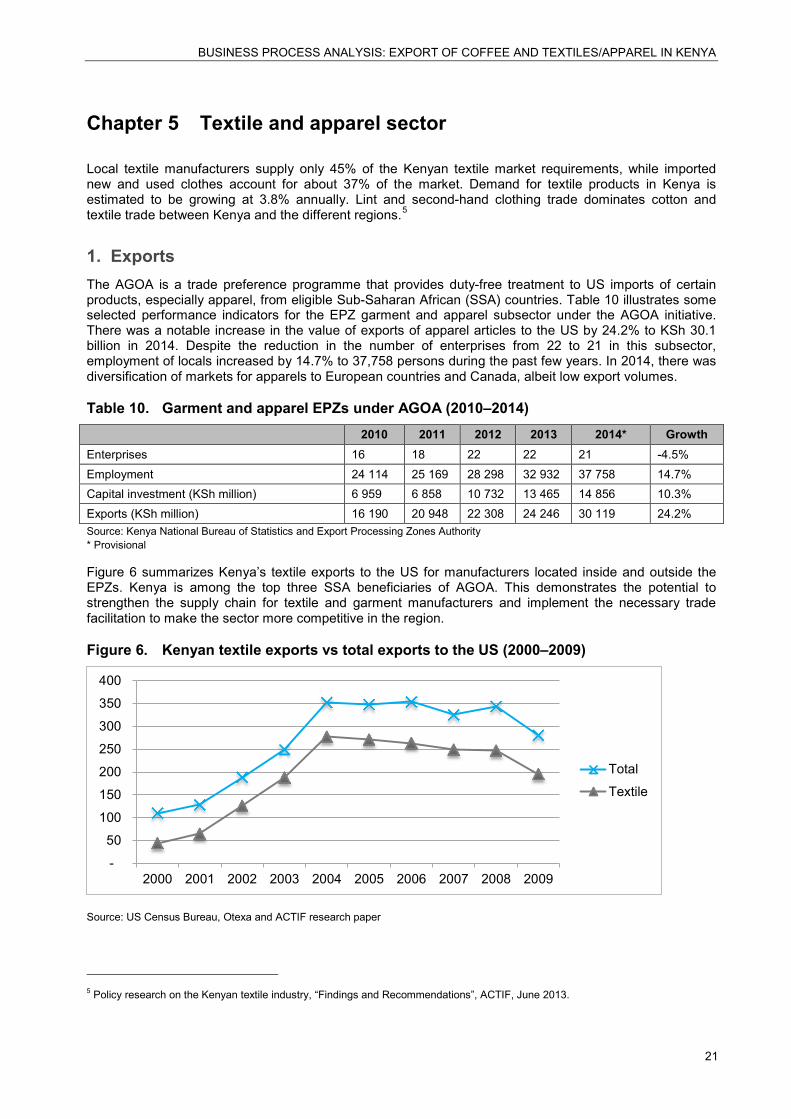
1. Exports The AGOA is a trade preference programme that provides duty-free treatment to US imports of certain products, especially apparel, from eligible Sub-Saharan African (SSA) countries. Table 10 illustrates some selected performance indicators for the EPZ garment and apparel subsector under the AGOA initiative. There was a notable increase in the value of exports of apparel articles to the US by 24.2% to KSh 30.1 billion in 2014. Despite the reduction in the number of enterprises from 22 to 21 in this subsector, employment of locals increased by 14.7% to 37,758 persons during the past few years. In 2014, there was diversification of markets for apparels to European countries and Canada, albeit low export volumes.
Table 10. Garment and apparel EPZs under AGOA (2010–2014) 2010 2011 2012 2013 2014* Growth
Enterprises 16 18 22 22 21 -4.5% Employment 24 114 25 169 28 298 32 932 37 758 14.7% Capital investment (KSh million) 6 959 6 858 10 732 13 465 14 856 10.3% Exports (KSh million) 16 190 20 948 22 308 24 246 30 119 24.2% Source: Kenya National Bureau of Statistics and Export Processing Zones Authority * Provisional
Figure 6 summarizes Kenya’s textile exports to the US for manufacturers located inside and outside the EPZs. Kenya is among the top three SSA beneficiaries of AGOA. This demonstrates the potential to strengthen the supply chain for textile and garment manufacturers and implement the necessary trade facilitation to make the sector more competitive in the region.
Figure 6. Kenyan textile exports vs total exports to the US (2000–2009)
Source: US Census Bureau, Otexa and ACTIF research paper
5 Policy research on the Kenyan textile industry, “Findings and Recommendations”, ACTIF, June 2013.
-
50
100
150
200
250
300
350
400
2000 2001 2002 2003 2004 2005 2006 2007 2008 2009
Total
Textile
BUSINESS PROCESS ANALYSIS: EXPORT OF COFFEE AND TEXTILES/APPAREL IN KENYA
22
Chapter 6 Procedures and documents required for export
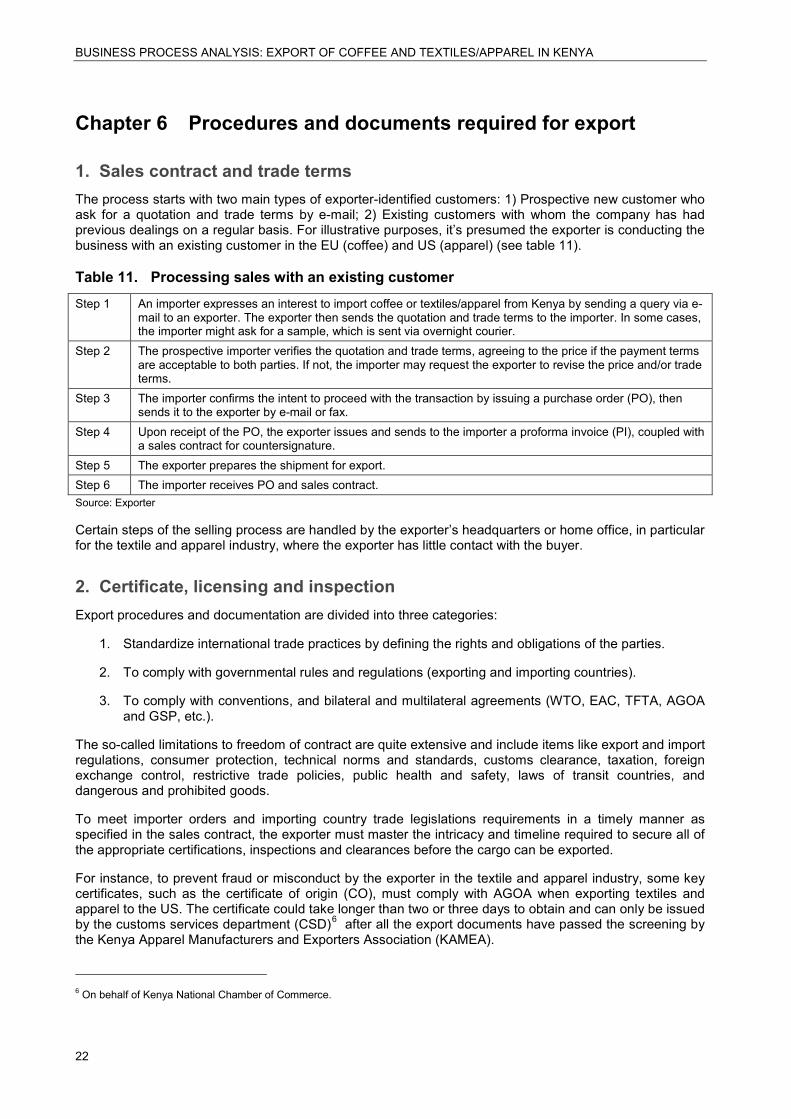
1. Sales contract and trade terms The process starts with two main types of exporter-identified customers: 1) Prospective new customer who ask for a quotation and trade terms by e-mail; 2) Existing customers with whom the company has had previous dealings on a regular basis. For illustrative purposes, it’s presumed the exporter is conducting the business with an existing customer in the EU (coffee) and US (apparel) (see table 11).
Table 11. Processing sales with an existing customer Step 1 An importer expresses an interest to import coffee or textiles/apparel from Kenya by sending a query via e-
mail to an exporter. The exporter then sends the quotation and trade terms to the importer. In some cases, the importer might ask for a sample, which is sent via overnight courier.
Step 2 The prospective importer verifies the quotation and trade terms, agreeing to the price if the payment terms are acceptable to both parties. If not, the importer may request the exporter to revise the price and/or trade terms.
Step 3 The importer confirms the intent to proceed with the transaction by issuing a purchase order (PO), then sends it to the exporter by e-mail or fax.
Step 4 Upon receipt of the PO, the exporter issues and sends to the importer a proforma invoice (PI), coupled with a sales contract for countersignature.
Step 5 The exporter prepares the shipment for export. Step 6 The importer receives PO and sales contract. Source: Exporter
Certain steps of the selling process are handled by the exporter’s headquarters or home office, in particular for the textile and apparel industry, where the exporter has little contact with the buyer.
2. Certificate, licensing and inspection Export procedures and documentation are divided into three categories:
1. Standardize international trade practices by defining the rights and obligations of the parties.
2. To comply with governmental rules and regulations (exporting and importing countries).
3. To comply with conventions, and bilateral and multilateral agreements (WTO, EAC, TFTA, AGOA and GSP, etc.).
The so-called limitations to freedom of contract are quite extensive and include items like export and import regulations, consumer protection, technical norms and standards, customs clearance, taxation, foreign exchange control, restrictive trade policies, public health and safety, laws of transit countries, and dangerous and prohibited goods.
To meet importer orders and importing country trade legislations requirements in a timely manner as specified in the sales contract, the exporter must master the intricacy and timeline required to secure all of the appropriate certifications, inspections and clearances before the cargo can be exported.
For instance, to prevent fraud or misconduct by the exporter in the textile and apparel industry, some key certificates, such as the certificate of origin (CO), must comply with AGOA when exporting textiles and apparel to the US. The certificate could take longer than two or three days to obtain and can only be issued by the customs services department (CSD)6 after all the export documents have passed the screening by the Kenya Apparel Manufacturers and Exporters Association (KAMEA).
6 On behalf of Kenya National Chamber of Commerce.

BUSINESS PROCESS ANALYSIS: EXPORT OF COFFEE AND TEXTILES/APPAREL IN KENYA
23
2.1. Certificate of AGOA AGOA provides for entry of Kenyan (among other Sub-Saharan countries) exports to the US at preferential rates. Textile and apparel originating from Kenya and consigned directly to the US are eligible for this treatment.7
Having AGOA eligibility does not imply automatic eligibility for a “wearing apparel” provision. To export apparel and certain textiles to the US under AGOA duty-free, an eligible country must have implemented a “visa system” that satisfies American authorities and proves compliance with the AGOA rules of origin.
The Kenyan Government has an effective “visa system” in place to prevent illegal trans-shipments and use of counterfeit documentation, as well as effective enforcement and verification procedures.
Manufacturers who want to take advantage of the benefits of AGOA have to obtain a certificate of registration for manufacture, which is issued annually to register manufacturers in Kenya wishing to export merchandise to the US by the Department of Industries in the Ministry of Trade, Industrialization and Entrepreneurship.
The manufacturer is required to apply for an amendment to the certificate of registration every time changes take place on the business premises, such as change of equipment or machinery, or production capacity, etc., if the manufacturer still expects to export goods under the AGOA scheme. The manufacturer shall undertake to preserve all records relating to the production of the goods to be exported, such as records of the number of workers, actual quantities produced, work that is subcontracted (outside the manufacturer’s premises) and the machinery used. The records should be kept for a period of at least seven years.
Thereafter, the applicant will make and attach a photocopy of the AGOA certificate to every application for the CO. KAMEA scrutinizes the documents and forwards them to the CSD to examine, and, if satisfied that the goods fulfil the requirements of origin in Kenya according to AGOA, customs issues the CO and visa stamp.
2.2. Licensing of clearing and forwarding agent A clearing and forwarding agent (CFA) license allows access to customs areas at the port (normally secured areas). Most companies in Kenya prefer to outsource customs clearance services; however, some choose to acquire the CFA’s license in order to do this process in-house. The procedure covers the process of vetting, issuance, renewal and cancellation of CFA license by the CSD. The application is vetted to ensure all the required supporting documents have been submitted.8
Application for renewal of the license is made on the prescribed license renewal form and submitted to customs. The licensing officer will check for compliance with the conditions for renewal and confirm that the company has no outstanding transactions or pending queries.
No license will be renewed if the applicant has any pending queries or outstanding transactions. If the applicant has no pending queries or outstanding transactions, a recommendation is made by the commissioner’s office for renewal of the license.
2.3. Coffee dealer’s license The coffee dealer’s license issued by the Coffee Directorate (CD) (formerly known as the Coffee Board of Kenya) authorizes the holder to buy or trade in clean coffee, add value addition, and export coffee as a finished product or as green coffee. It enables the dealer to participate in the coffee auction at Nairobi Coffee Exchange (NCE). According to the CD’s databank, about 60 dealers are licensed to buy and sell
7 Customs Services Department. 8 Kenya Revenue Authority (www.kra.go.ke).

BUSINESS PROCESS ANALYSIS: EXPORT OF COFFEE AND TEXTILES/APPAREL IN KENYA
24
coffee in 2015. Annual renewal of the license is mandatory and the procedures follow the same steps as for a new applicant.9
2.4. Registering with the International Coffee Organization The coffee dealer also needs to register with the International Coffee Organization (ICO), which is represented locally by CD, to obtain a certificate of origin under ICO rules of statistics when exporting coffee from Kenya. This particular CO does not determine eligibility for preferential treatment; it is only for statistical purposes to keep track of coffee trade in the international market by the CD and ICO (ICC 102-9 Rules on Statistics Certificate of Origin).
2.5. Rules of origin This is the most important piece of document for the buyer, seller and customs authorities in the importing country, as it affects tariffs and quotas applied between countries for specific product(s). Product classification, origin and original status determine eligibility for preferential treatment and the specific duty rate assessed by the importing country.
The EAC protocol on the establishment of the customs union provides origin criteria for products from the EAC region. Under COMESA rules of origin, a product qualifies for preferential treatment if it is wholly produced by a member state or has undergone substantial transformation in that member state (i.e. import content of no more than 60% of the total cost of all materials, or value added of 35% or change of tariff heading, or 25% value added for goods of economic importance). Cumulating of origin is allowed between COMESA countries. Goods that have been accepted as meeting all the rules of origin requirements should be issued with a COMESA certificate of origin by the relevant authority. Through its CSD, KRA is in charge of issuing certificates of origin for exports to enjoy preferential treatment into relevant export markets.
2.6. Fumigation Kenya Plant Health Inspectorate Service (KEPHIS) makes a risk assessment based on the risk for pests, the commodities’ source of origin, and the testing and inspection requirements of the importing country, and then determines the export requirements and guidelines in Kenya.
Only KEPHIS-certified private companies are allowed to provide fumigation services at the exporter’s premises. The control process may takes up to 72 hours to complete. A fumigation certificate (FC) is then issued, which states the product, date and dosage used for the treatment.
2.7. Phytosanitary certificate The main agencies involved in Kenya’s sanitary and phytosanitary institutional (SPS) framework are: KEPHIS, under the ministry in charge of agriculture; the Department of Fisheries, under the ministry in charge of fisheries development; the Department of Veterinary Services (DVS), under the ministry in charge of livestock development; and the Department of Food Safety and Quality, under the ministry in charge of public health.
Plant health issues are regulated through the Plant Protection Act Cap. 324, the Suppression of Noxious Weeds Act Cap. 325, the Agricultural Produce (Export) Act Cap. 319, and the Seeds and Plant Varieties Act Cap. 326. KEPHIS is responsible for coordinating all matters relating to plant health, and quality control of agricultural inputs and products in Kenya, and for issuing permits and a phytosanitary certificate (PhC) in compliance with the International Plant Protection Convention (IPPC). Its export and import control activities are supported by a relatively well-equipped laboratory facility in Nairobi.
The PhC is often required when exporting agricultural commodities to most countries. It is the exporter’s responsibility to ensure that the product is free from quarantine pests and significantly free from injurious pests that could damage plants and crops in the importing country.
9 Coffee Directorate (http://www.coffeeboardkenya.co.ke)
BUSINESS PROCESS ANALYSIS: EXPORT OF COFFEE AND TEXTILES/APPAREL IN KENYA
25
2.8. Coffee movement permit To transport coffee from point A to point B in Kenya, the exporter must apply for a coffee movement permit (CMP) from the CD. The permit is not valid to be used between 6 p.m. and 6 a.m. and is non-transferable from vehicle to vehicle. In the event the vehicle registered in the CMP is mechanically disabled or involved in an accident and cannot continue to the final destination, a new CMP must be applied for the replacement vehicle. Due to widespread illegal and unsanctioned activities involving coffee trade, CMP is to guarantee the coffee being transported is actually bought and paid for legally by the exporter from NCE.
2.9. Customs declaration All exported and imported goods, whether or not exempt from duties and other taxes, must be subjected to a “customs declaration” using the Simba 2005 Electronic System, in operation since 2005. The declaration manual of instructions is available for download from the Customs Services Department.10
2.10. Customs inspection Customs must inspect all export cargo – goods are released only when documents are approved, the container is sealed (standard or electronic seal) and the export tax (if any) is paid, and the customs inspection report is issued. In the past, inspection was conducted at the exporter’s warehouse during loading of the goods; however, today the inspection may also take place during the container’s loading in the approved warehouse at the port, and in the presence of the customs official or under the surveillance of CCTV cameras.
3. Container handling at the port For a container packed with goods, which has been declared and inspected prior to arrival at the port, the customs officer only checks the related export documents and verifies the authenticity of the seal on the container. The container may undergo scanning, depending on the type of goods and the risk management assessment by customs.
For break bulk cargo, the CFA or exporter processes the declaration, inspection and stuffing of the goods at the approved warehouse at the port in the presence of the customs official.
4. In-house export paperwork To process internal paperwork to facilitate the physical movement of goods, including establishing title or ownership during transportation and documentation required by consignee for customs clearance and payment, etc., can be time-consuming if not carefully choreographed.
4.1. Commercial invoice The commercial invoice varies according to destination. Special invoice forms, a certificate of origin or consular documents, and a certificate of value may be specified and care must be taken in fulfilling these destination requirements.
4.2. Packing list The packing list is an essential document, as it is needed in particular for customs purposes when goods are exported or imported. Most Incoterms stipulate that the exporter must provide, at his own expense, the customary packing of the goods, unless it is the custom of the trade to dispatch the goods unpacked.
Many countries have specific label requirements, such as the requirement that imported goods (or containers) be marked with the country of origin. If the cargo is not properly marked when exported, a 10 www.kra.go.ke/pdf/publications/declarationmanual.pdf.
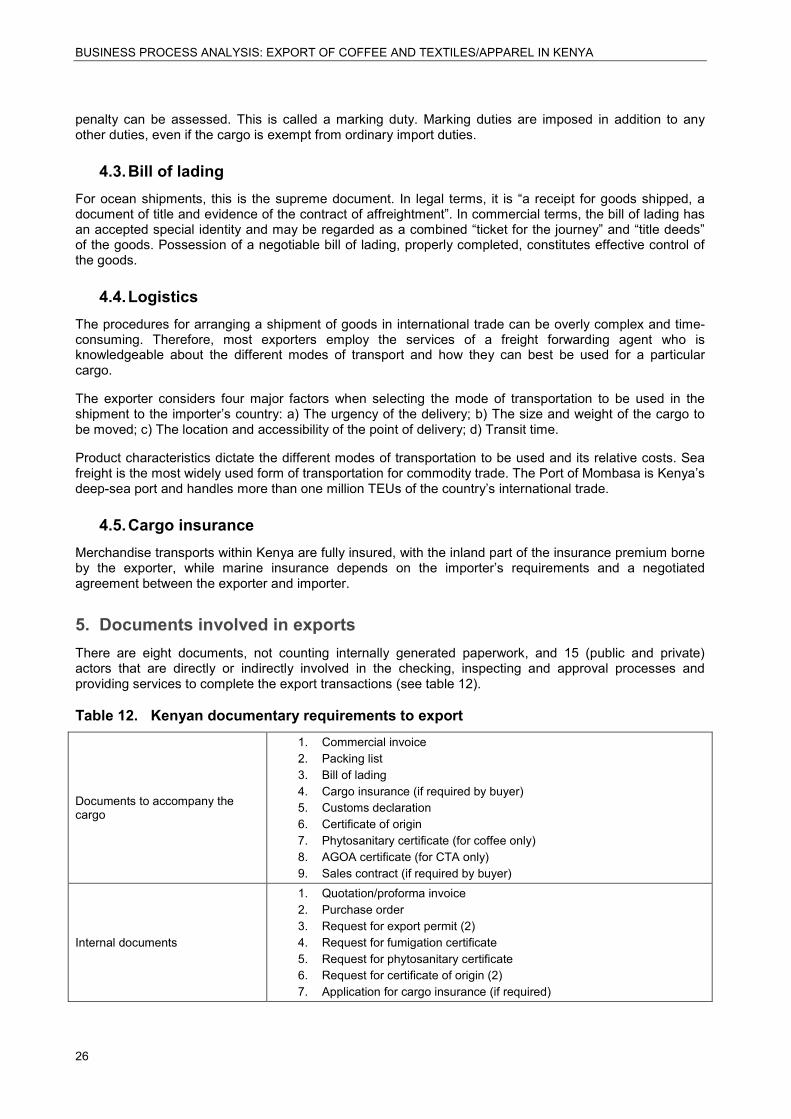
BUSINESS PROCESS ANALYSIS: EXPORT OF COFFEE AND TEXTILES/APPAREL IN KENYA
26
penalty can be assessed. This is called a marking duty. Marking duties are imposed in addition to any other duties, even if the cargo is exempt from ordinary import duties.
4.3. Bill of lading For ocean shipments, this is the supreme document. In legal terms, it is “a receipt for goods shipped, a document of title and evidence of the contract of affreightment”. In commercial terms, the bill of lading has an accepted special identity and may be regarded as a combined “ticket for the journey” and “title deeds” of the goods. Possession of a negotiable bill of lading, properly completed, constitutes effective control of the goods.
4.4. Logistics The procedures for arranging a shipment of goods in international trade can be overly complex and time-consuming. Therefore, most exporters employ the services of a freight forwarding agent who is knowledgeable about the different modes of transport and how they can best be used for a particular cargo.
The exporter considers four major factors when selecting the mode of transportation to be used in the shipment to the importer’s country: a) The urgency of the delivery; b) The size and weight of the cargo to be moved; c) The location and accessibility of the point of delivery; d) Transit time.
Product characteristics dictate the different modes of transportation to be used and its relative costs. Sea freight is the most widely used form of transportation for commodity trade. The Port of Mombasa is Kenya’s deep-sea port and handles more than one million TEUs of the country’s international trade.
4.5. Cargo insurance Merchandise transports within Kenya are fully insured, with the inland part of the insurance premium borne by the exporter, while marine insurance depends on the importer’s requirements and a negotiated agreement between the exporter and importer.
5. Documents involved in exports There are eight documents, not counting internally generated paperwork, and 15 (public and private) actors that are directly or indirectly involved in the checking, inspecting and approval processes and providing services to complete the export transactions (see table 12).
Table 12. Kenyan documentary requirements to export
Documents to accompany the cargo
1. Commercial invoice 2. Packing list 3. Bill of lading 4. Cargo insurance (if required by buyer) 5. Customs declaration 6. Certificate of origin 7. Phytosanitary certificate (for coffee only) 8. AGOA certificate (for CTA only) 9. Sales contract (if required by buyer)
Internal documents
1. Quotation/proforma invoice 2. Purchase order 3. Request for export permit (2) 4. Request for fumigation certificate 5. Request for phytosanitary certificate 6. Request for certificate of origin (2) 7. Application for cargo insurance (if required)
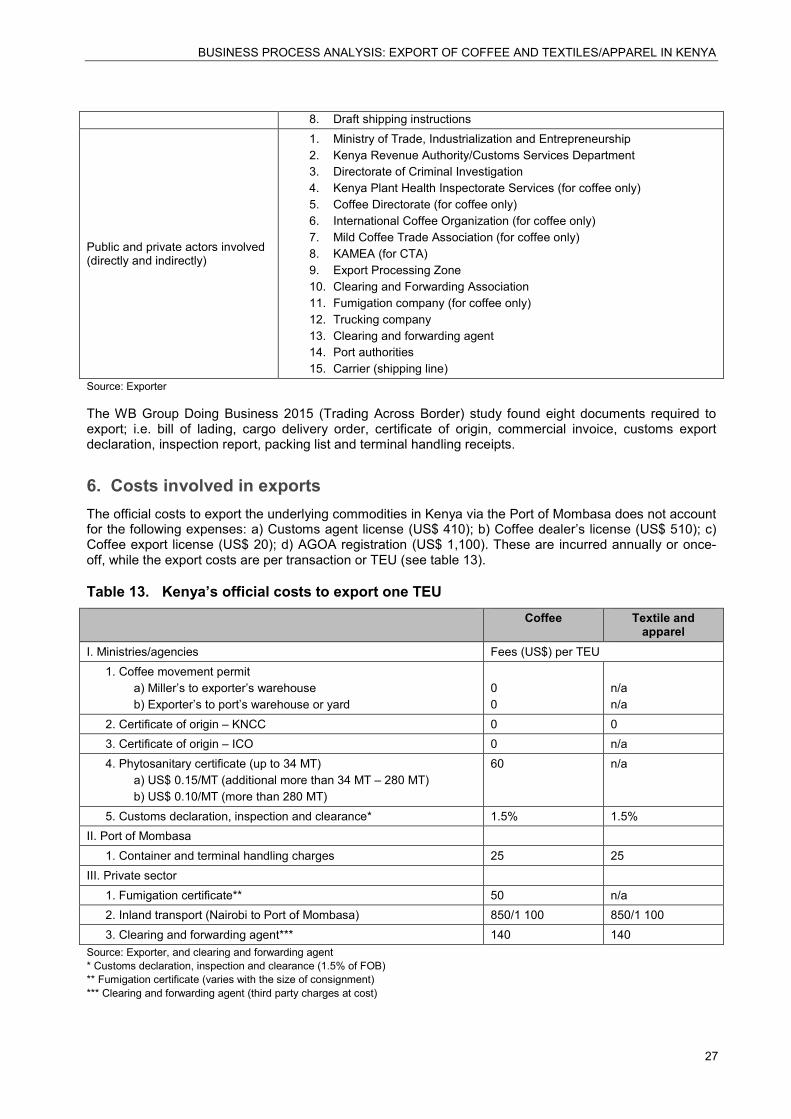
BUSINESS PROCESS ANALYSIS: EXPORT OF COFFEE AND TEXTILES/APPAREL IN KENYA
27
8. Draft shipping instructions
Public and private actors involved (directly and indirectly)
1. Ministry of Trade, Industrialization and Entrepreneurship 2. Kenya Revenue Authority/Customs Services Department 3. Directorate of Criminal Investigation 4. Kenya Plant Health Inspectorate Services (for coffee only) 5. Coffee Directorate (for coffee only) 6. International Coffee Organization (for coffee only) 7. Mild Coffee Trade Association (for coffee only) 8. KAMEA (for CTA) 9. Export Processing Zone 10. Clearing and Forwarding Association 11. Fumigation company (for coffee only) 12. Trucking company 13. Clearing and forwarding agent 14. Port authorities 15. Carrier (shipping line)
Source: Exporter
The WB Group Doing Business 2015 (Trading Across Border) study found eight documents required to export; i.e. bill of lading, cargo delivery order, certificate of origin, commercial invoice, customs export declaration, inspection report, packing list and terminal handling receipts.
6. Costs involved in exports The official costs to export the underlying commodities in Kenya via the Port of Mombasa does not account for the following expenses: a) Customs agent license (US$ 410); b) Coffee dealer’s license (US$ 510); c) Coffee export license (US$ 20); d) AGOA registration (US$ 1,100). These are incurred annually or once-off, while the export costs are per transaction or TEU (see table 13).
Table 13. Kenya’s official costs to export one TEU Coffee Textile and
apparel I. Ministries/agencies Fees (US$) per TEU
1. Coffee movement permit a) Miller’s to exporter’s warehouse b) Exporter’s to port’s warehouse or yard
0 0
n/a n/a
2. Certificate of origin – KNCC 0 0 3. Certificate of origin – ICO 0 n/a 4. Phytosanitary certificate (up to 34 MT)
a) US$ 0.15/MT (additional more than 34 MT – 280 MT) b) US$ 0.10/MT (more than 280 MT)
60 n/a
5. Customs declaration, inspection and clearance* 1.5% 1.5% II. Port of Mombasa
1. Container and terminal handling charges 25 25 III. Private sector
1. Fumigation certificate** 50 n/a 2. Inland transport (Nairobi to Port of Mombasa) 850/1 100 850/1 100 3. Clearing and forwarding agent*** 140 140
Source: Exporter, and clearing and forwarding agent * Customs declaration, inspection and clearance (1.5% of FOB) ** Fumigation certificate (varies with the size of consignment) *** Clearing and forwarding agent (third party charges at cost)
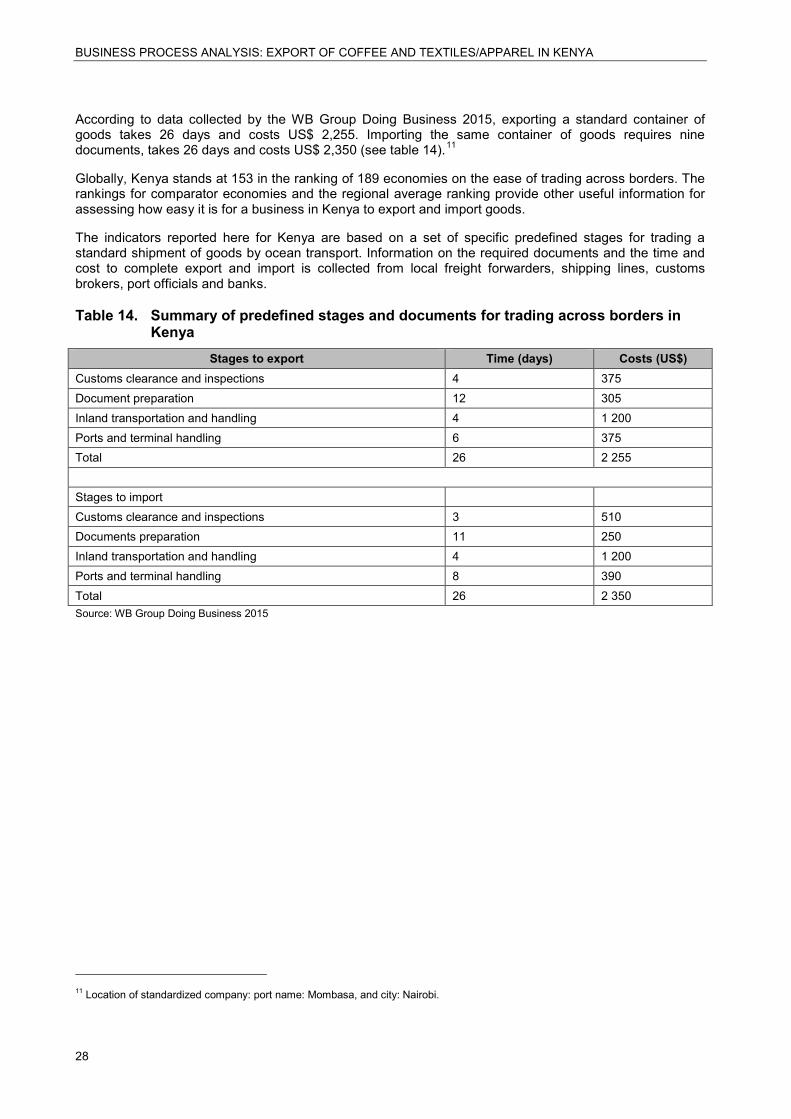
BUSINESS PROCESS ANALYSIS: EXPORT OF COFFEE AND TEXTILES/APPAREL IN KENYA
28
According to data collected by the WB Group Doing Business 2015, exporting a standard container of goods takes 26 days and costs US$ 2,255. Importing the same container of goods requires nine documents, takes 26 days and costs US$ 2,350 (see table 14).11
Globally, Kenya stands at 153 in the ranking of 189 economies on the ease of trading across borders. The rankings for comparator economies and the regional average ranking provide other useful information for assessing how easy it is for a business in Kenya to export and import goods.
The indicators reported here for Kenya are based on a set of specific predefined stages for trading a standard shipment of goods by ocean transport. Information on the required documents and the time and cost to complete export and import is collected from local freight forwarders, shipping lines, customs brokers, port officials and banks.
Table 14. Summary of predefined stages and documents for trading across borders in Kenya
Stages to export Time (days) Costs (US$) Customs clearance and inspections 4 375 Document preparation 12 305 Inland transportation and handling 4 1 200 Ports and terminal handling 6 375 Total 26 2 255 Stages to import Customs clearance and inspections 3 510 Documents preparation 11 250 Inland transportation and handling 4 1 200 Ports and terminal handling 8 390 Total 26 2 350 Source: WB Group Doing Business 2015
11 Location of standardized company: port name: Mombasa, and city: Nairobi.

BUSINESS PROCESS ANALYSIS: EXPORT OF COFFEE AND TEXTILES/APPAREL IN KENYA
29
Chapter 7 Core business processes of coffee exports
The use case diagram shown in figure 7 presents a string of core business processes that are typically carried out (some simultaneously) when exporting coffee from Kenya, which includes a list of stakeholders that an exporter directly or indirectly interacts with to complete the processes.
Figure 7. Use case diagram of business processes of coffee exports
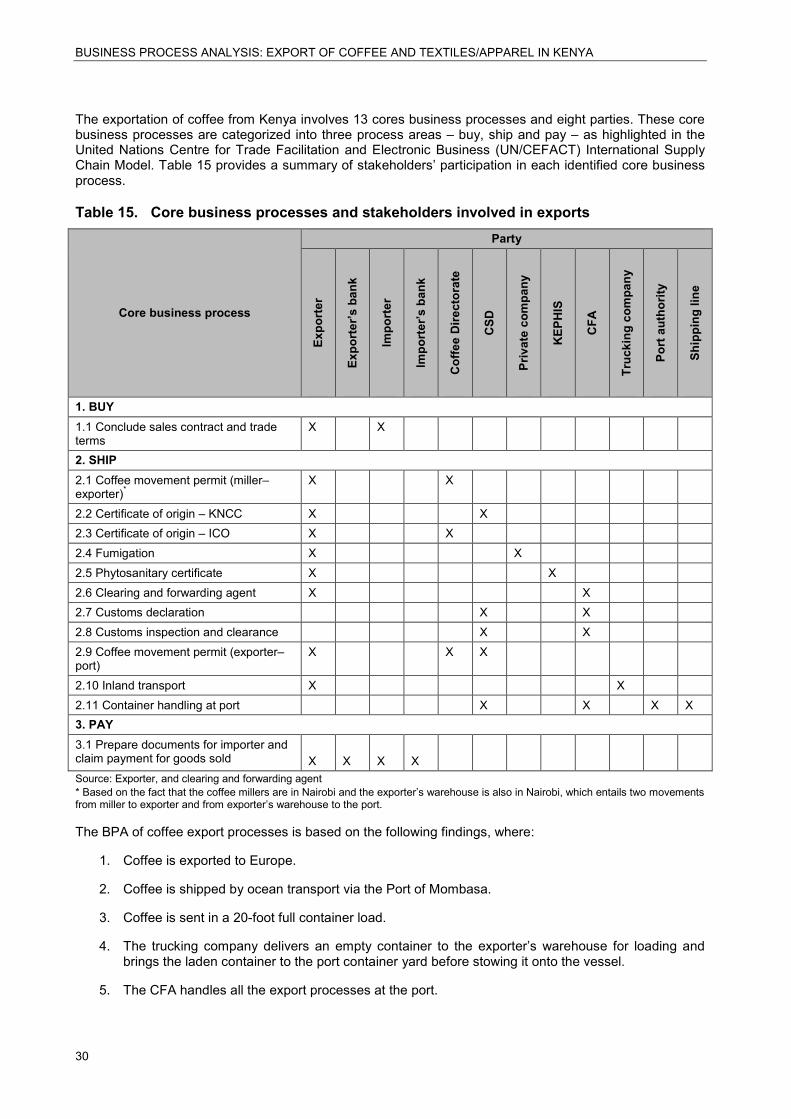
BUSINESS PROCESS ANALYSIS: EXPORT OF COFFEE AND TEXTILES/APPAREL IN KENYA
30
The exportation of coffee from Kenya involves 13 cores business processes and eight parties. These core business processes are categorized into three process areas – buy, ship and pay – as highlighted in the United Nations Centre for Trade Facilitation and Electronic Business (UN/CEFACT) International Supply Chain Model. Table 15 provides a summary of stakeholders’ participation in each identified core business process.
Table 15. Core business processes and stakeholders involved in exports
Core business process
Party
Expo
rter
Expo
rter
’s b
ank
Impo
rter
Impo
rter
’s b
ank
Cof
fee
Dire
ctor
ate
CSD
Priv
ate
com
pany
KEP
HIS
CFA
Truc
king
com
pany
Port
aut
horit
y
Ship
ping
line
1. BUY 1.1 Conclude sales contract and trade terms
X X
2. SHIP 2.1 Coffee movement permit (miller–exporter)*
X X
2.2 Certificate of origin – KNCC X X 2.3 Certificate of origin – ICO X X 2.4 Fumigation X X 2.5 Phytosanitary certificate X X 2.6 Clearing and forwarding agent X X 2.7 Customs declaration X X 2.8 Customs inspection and clearance X X 2.9 Coffee movement permit (exporter–port)
X X X
2.10 Inland transport X X 2.11 Container handling at port X X X X 3. PAY 3.1 Prepare documents for importer and claim payment for goods sold
X
X
X
X
Source: Exporter, and clearing and forwarding agent * Based on the fact that the coffee millers are in Nairobi and the exporter’s warehouse is also in Nairobi, which entails two movements from miller to exporter and from exporter’s warehouse to the port.
The BPA of coffee export processes is based on the following findings, where:
1. Coffee is exported to Europe.
2. Coffee is shipped by ocean transport via the Port of Mombasa.
3. Coffee is sent in a 20-foot full container load.
4. The trucking company delivers an empty container to the exporter’s warehouse for loading and brings the laden container to the port container yard before stowing it onto the vessel.
5. The CFA handles all the export processes at the port.

BUSINESS PROCESS ANALYSIS: EXPORT OF COFFEE AND TEXTILES/APPAREL IN KENYA
31
6. The cargo is delivered under FOB terms.
7. The container is loaded with 320 bags of 50 kg.
8. The payment for the purchase is made by some percentage of advance payment and final payment against import documents.

BUSINESS PROCESS ANALYSIS: EXPORT OF COFFEE AND TEXTILES/APPAREL IN KENYA
32
Chapter 8 Core business processes area for coffee: 1 Buy
To export coffee from Kenya, the coffee dealer must purchase green coffee from the marketing agent at the auction run by the NCE. The exchange, which is done via an electronic trading platform, brings together the seller and buyer, and open for business every Tuesday.
There is only one core business process under “Buy” (see figure 8), which involves the exporter and importer to conclude the sales contract and trade terms.
Figure 8. Buy: 1 Core business process use case diagram
1. Process area: 1.1 Conclude sales contract and trade terms The activity diagram (see figure 9) shows that the process to “conclude sales contract and trade terms” requires the participation of the exporter and importer.
Figure 9. 1.1 Conclude sales contract and trade terms
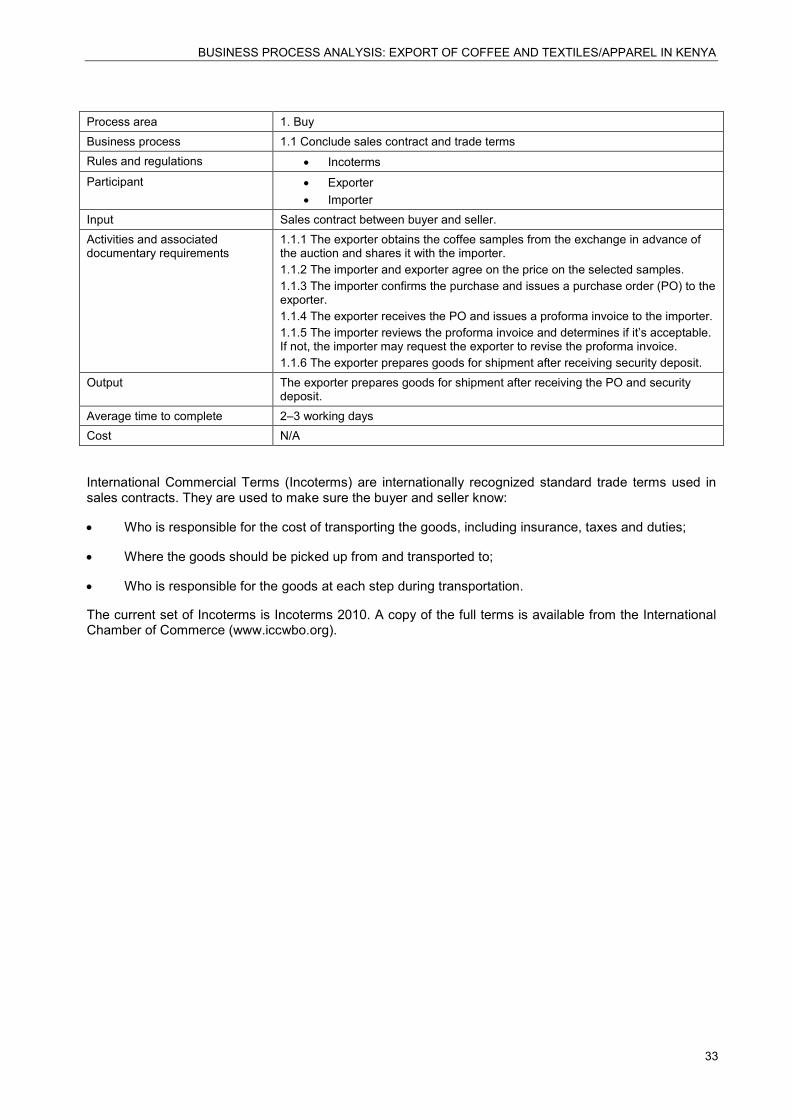
BUSINESS PROCESS ANALYSIS: EXPORT OF COFFEE AND TEXTILES/APPAREL IN KENYA
33
Process area 1. Buy Business process 1.1 Conclude sales contract and trade terms Rules and regulations • Incoterms Participant • Exporter
• Importer Input Sales contract between buyer and seller. Activities and associated documentary requirements
1.1.1 The exporter obtains the coffee samples from the exchange in advance of the auction and shares it with the importer. 1.1.2 The importer and exporter agree on the price on the selected samples. 1.1.3 The importer confirms the purchase and issues a purchase order (PO) to the exporter. 1.1.4 The exporter receives the PO and issues a proforma invoice to the importer. 1.1.5 The importer reviews the proforma invoice and determines if it’s acceptable. If not, the importer may request the exporter to revise the proforma invoice. 1.1.6 The exporter prepares goods for shipment after receiving security deposit.
Output The exporter prepares goods for shipment after receiving the PO and security deposit.
Average time to complete 2–3 working days Cost N/A
International Commercial Terms (Incoterms) are internationally recognized standard trade terms used in sales contracts. They are used to make sure the buyer and seller know:
• Who is responsible for the cost of transporting the goods, including insurance, taxes and duties;
• Where the goods should be picked up from and transported to;
• Who is responsible for the goods at each step during transportation.
The current set of Incoterms is Incoterms 2010. A copy of the full terms is available from the International Chamber of Commerce (www.iccwbo.org).
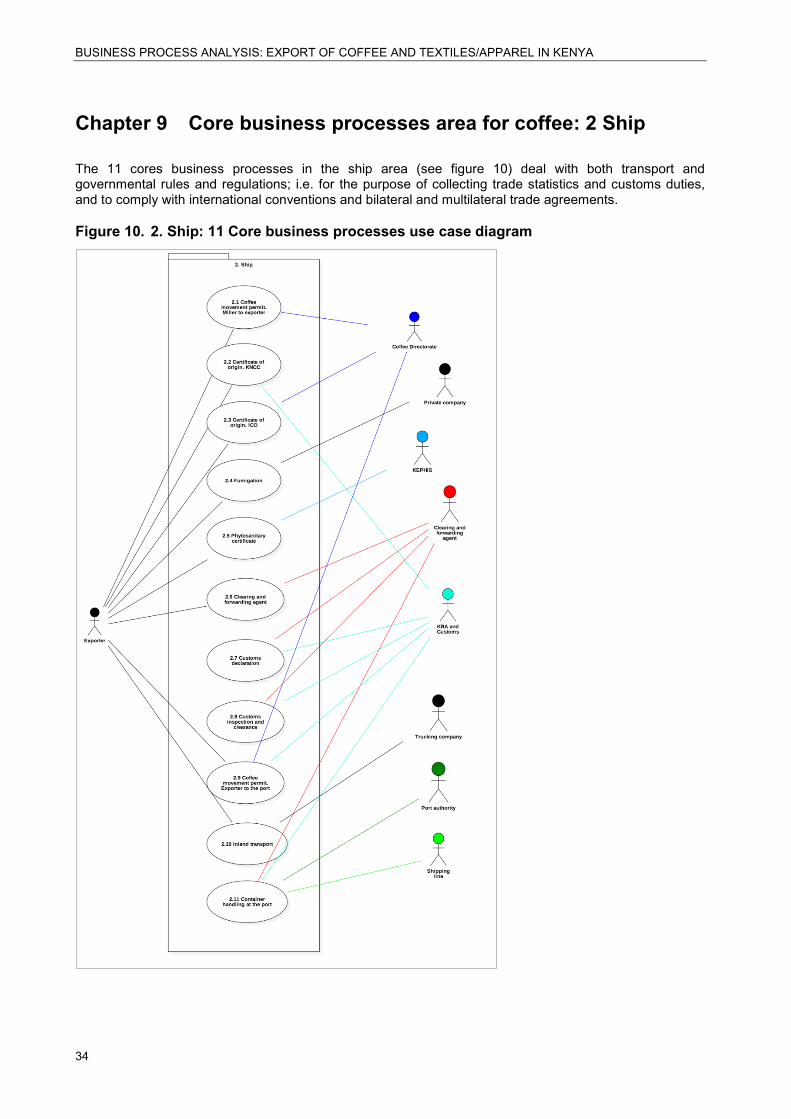
BUSINESS PROCESS ANALYSIS: EXPORT OF COFFEE AND TEXTILES/APPAREL IN KENYA
34
Chapter 9 Core business processes area for coffee: 2 Ship
The 11 cores business processes in the ship area (see figure 10) deal with both transport and governmental rules and regulations; i.e. for the purpose of collecting trade statistics and customs duties, and to comply with international conventions and bilateral and multilateral trade agreements.
Figure 10. 2. Ship: 11 Core business processes use case diagram
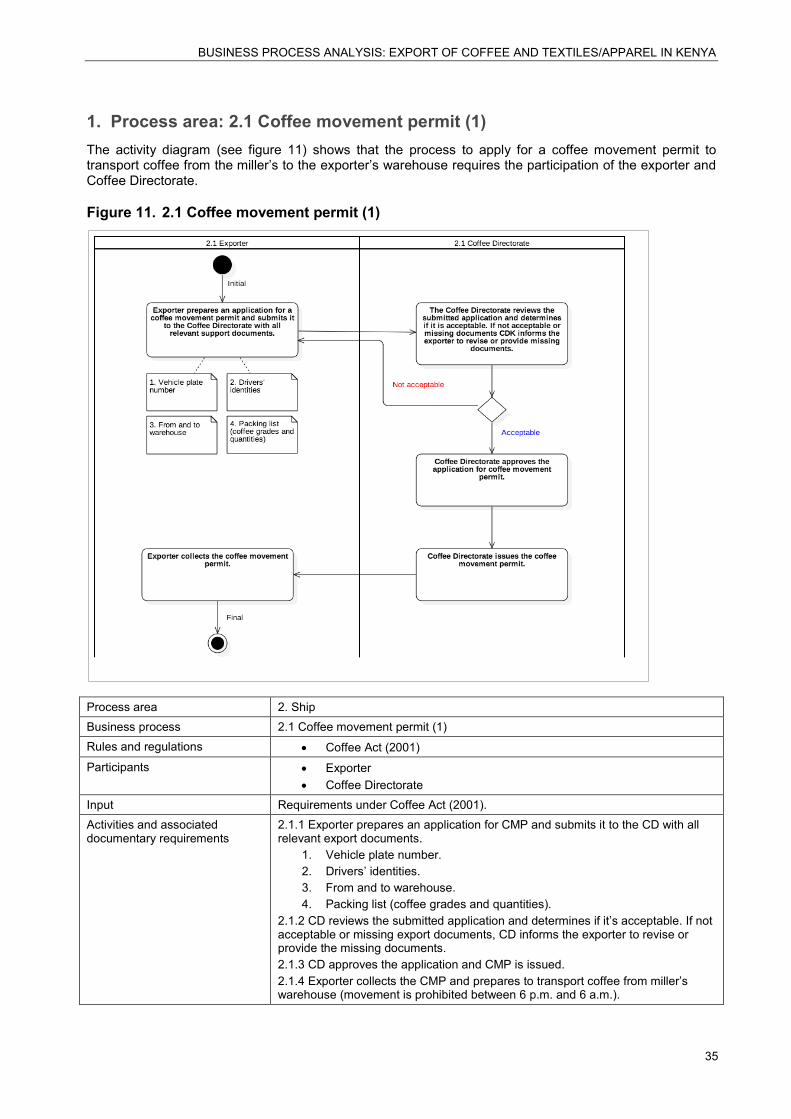
BUSINESS PROCESS ANALYSIS: EXPORT OF COFFEE AND TEXTILES/APPAREL IN KENYA
35
1. Process area: 2.1 Coffee movement permit (1) The activity diagram (see figure 11) shows that the process to apply for a coffee movement permit to transport coffee from the miller’s to the exporter’s warehouse requires the participation of the exporter and Coffee Directorate.
Figure 11. 2.1 Coffee movement permit (1)
Process area 2. Ship Business process 2.1 Coffee movement permit (1) Rules and regulations • Coffee Act (2001) Participants • Exporter
• Coffee Directorate Input Requirements under Coffee Act (2001). Activities and associated documentary requirements
2.1.1 Exporter prepares an application for CMP and submits it to the CD with all relevant export documents.
1. Vehicle plate number. 2. Drivers’ identities. 3. From and to warehouse. 4. Packing list (coffee grades and quantities).
2.1.2 CD reviews the submitted application and determines if it’s acceptable. If not acceptable or missing export documents, CD informs the exporter to revise or provide the missing documents. 2.1.3 CD approves the application and CMP is issued. 2.1.4 Exporter collects the CMP and prepares to transport coffee from miller’s warehouse (movement is prohibited between 6 p.m. and 6 a.m.).
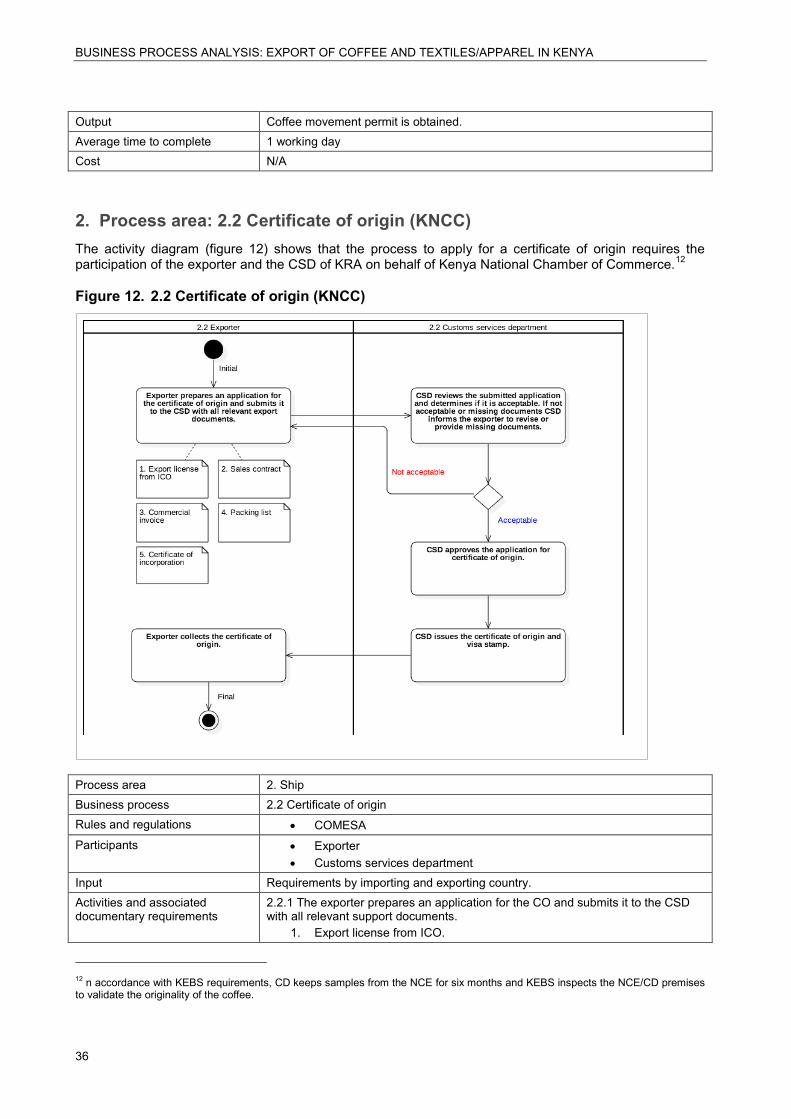
BUSINESS PROCESS ANALYSIS: EXPORT OF COFFEE AND TEXTILES/APPAREL IN KENYA
36
Output Coffee movement permit is obtained. Average time to complete 1 working day Cost N/A
2. Process area: 2.2 Certificate of origin (KNCC) The activity diagram (figure 12) shows that the process to apply for a certificate of origin requires the participation of the exporter and the CSD of KRA on behalf of Kenya National Chamber of Commerce.12
Figure 12. 2.2 Certificate of origin (KNCC)
Process area 2. Ship Business process 2.2 Certificate of origin Rules and regulations • COMESA Participants • Exporter
• Customs services department Input Requirements by importing and exporting country. Activities and associated documentary requirements
2.2.1 The exporter prepares an application for the CO and submits it to the CSD with all relevant support documents.
1. Export license from ICO.
12 n accordance with KEBS requirements, CD keeps samples from the NCE for six months and KEBS inspects the NCE/CD premises to validate the originality of the coffee.
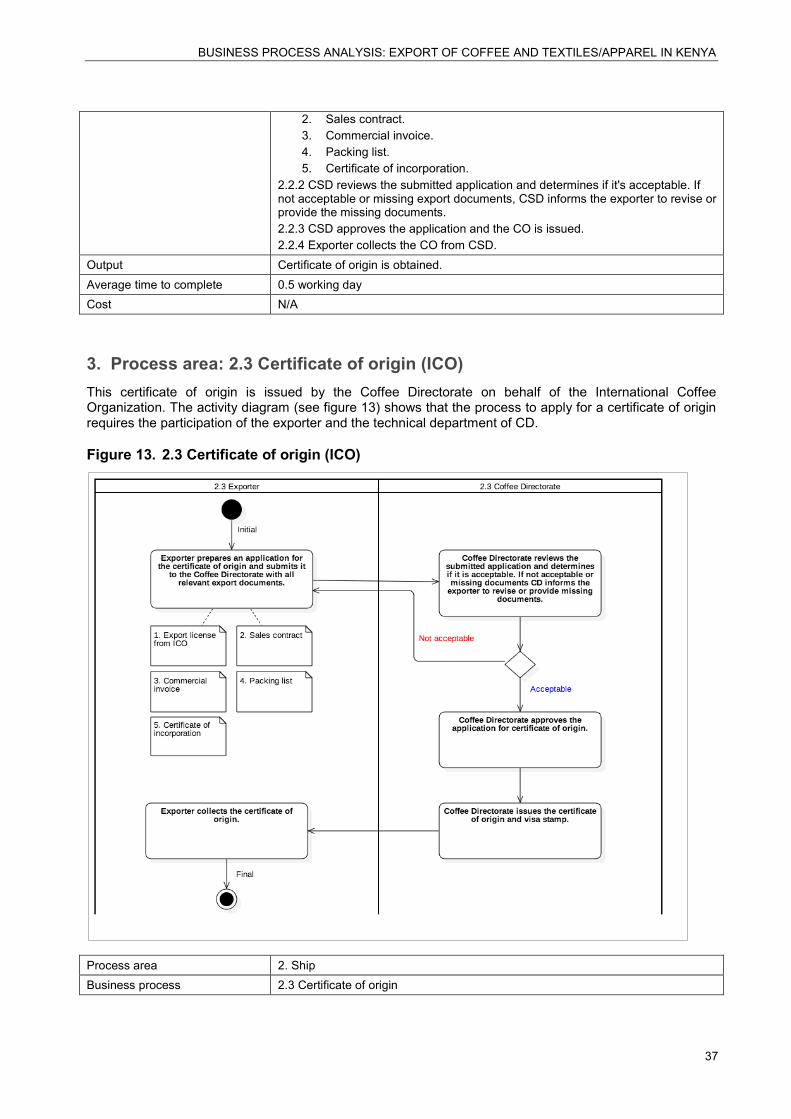
BUSINESS PROCESS ANALYSIS: EXPORT OF COFFEE AND TEXTILES/APPAREL IN KENYA
37
2. Sales contract. 3. Commercial invoice. 4. Packing list. 5. Certificate of incorporation.
2.2.2 CSD reviews the submitted application and determines if it's acceptable. If not acceptable or missing export documents, CSD informs the exporter to revise or provide the missing documents. 2.2.3 CSD approves the application and the CO is issued. 2.2.4 Exporter collects the CO from CSD.
Output Certificate of origin is obtained. Average time to complete 0.5 working day Cost N/A
3. Process area: 2.3 Certificate of origin (ICO) This certificate of origin is issued by the Coffee Directorate on behalf of the International Coffee Organization. The activity diagram (see figure 13) shows that the process to apply for a certificate of origin requires the participation of the exporter and the technical department of CD.
Figure 13. 2.3 Certificate of origin (ICO)
Process area 2. Ship Business process 2.3 Certificate of origin
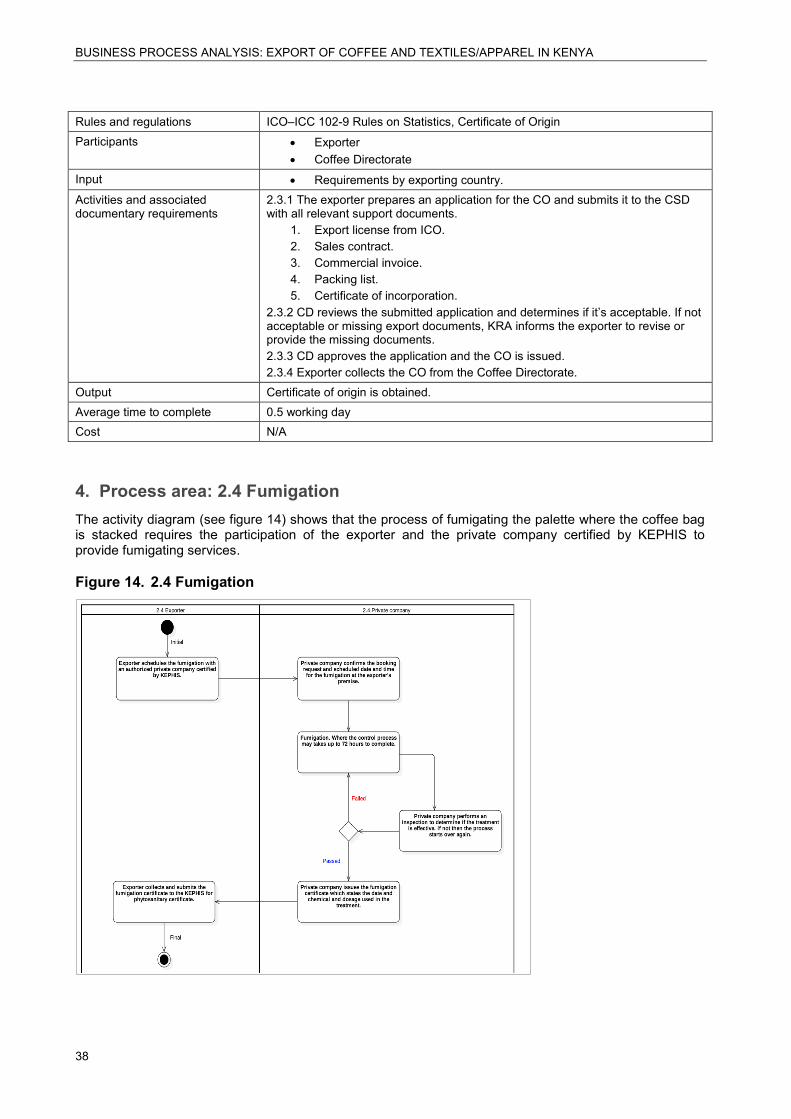
BUSINESS PROCESS ANALYSIS: EXPORT OF COFFEE AND TEXTILES/APPAREL IN KENYA
38
Rules and regulations ICO–ICC 102-9 Rules on Statistics, Certificate of Origin Participants • Exporter
• Coffee Directorate Input • Requirements by exporting country. Activities and associated documentary requirements
2.3.1 The exporter prepares an application for the CO and submits it to the CSD with all relevant support documents.
1. Export license from ICO. 2. Sales contract. 3. Commercial invoice. 4. Packing list. 5. Certificate of incorporation.
2.3.2 CD reviews the submitted application and determines if it’s acceptable. If not acceptable or missing export documents, KRA informs the exporter to revise or provide the missing documents. 2.3.3 CD approves the application and the CO is issued. 2.3.4 Exporter collects the CO from the Coffee Directorate.
Output Certificate of origin is obtained. Average time to complete 0.5 working day Cost N/A
4. Process area: 2.4 Fumigation The activity diagram (see figure 14) shows that the process of fumigating the palette where the coffee bag is stacked requires the participation of the exporter and the private company certified by KEPHIS to provide fumigating services.
Figure 14. 2.4 Fumigation

BUSINESS PROCESS ANALYSIS: EXPORT OF COFFEE AND TEXTILES/APPAREL IN KENYA
39
Process area 2. Ship Business process 2.4 Fumigation Rules and regulations • Plant Protection Act (Cap. 324)
• Agriculture Produce (Export) Act (Cap. 319) Participants • Exporter
• Private company Input Requirements by importing and exporting country. Activities and associated documentary requirements
2.4.1 The exporter schedules the fumigation of the pallet with an authorized private company certified by KEPHIS. 2.4.2 The private company confirms the booking request, and schedules a date and time for the fumigation at the exporter’s premises. 2.4.3 Fumigation at the exporter’s warehouse, where the control process may takes up to 72 hours to complete. 2.4.4 The private company performs a follow-up inspection to determine if the treatment is effective; if not, the process starts over again. 2.4.5 The private company issues the fumigation certificate, which states the date, chemical and dosage used in the treatment. 2.4.6 The exporter collects and submits the fumigation certificate to KEPHIS for a phytosanitary certificate.
Output Fumigation requirement is completed. Average time to complete 3–5 working days Cost US$ 50 (varies with the size of the consignment)
5. Process area: 2.5 Phytosanitary certificate The activity diagram (see figure 15) shows that the process to apply for a phytosanitary certificate requires the participation of the exporter and KEPHIS, which issues the certificate once the palette is fumigated.
Figure 15. 2.5 Phytosanitary certificate
BUSINESS PROCESS ANALYSIS: EXPORT OF COFFEE AND TEXTILES/APPAREL IN KENYA
40
Process area 2. Ship Business process 2.5 Phytosanitary certificate Rules and regulations • Plant Protection Act (Cap. 324)
• Agriculture Produce (Export) Act (Cap. 319) Participants • Exporter
• Kenya Plant Health Inspectorate Services Input Requirements by importing and exporting country. Activities and associated documentary requirements
2.5.1 The exporter prepares an online application for a PhC and submits it to KEPHIS with the attachment of all relevant export documents.
1. Commercial invoice. 2. Packing list. 3. Coffee samples. 4. Fumigation certificate. 5. Trade license. 6. Company PIN. 7. Certificate of incorporation. 8. National ID of one director.
2.5.2 KEPHIS reviews the submitted application and determines if it’s acceptable. If not acceptable or missing export documents, KEPHIS informs the exporter to revise or provide the missing documents. 2.5.3 KEPHIS makes a risk assessment based on the product’s risk for pest and source of origin. 2.5.4 KEPHIS determines product’s export requirements and guidelines. 2.5.5 KEPHIS checks testing and inspection requirements of the importing country. 2.5.6 KEPHIS arranges for warehouse inspection every three to four months. 2.5.7 KEPHIS issues a phytosanitary certificate after all conditions are met (palette has been fumigated). 2.5.8 The exporter collects the phytosanitary certificate from KEPHIS.
Output Phytosanitary certificate is obtained. Average time to complete 1–2 working days Cost US$ 60 (weight up to 34 MT)
US$ 0.15/MT (additional more than 34 MT to 280 MT) US$ 0.10/MT (more than 280 MT)
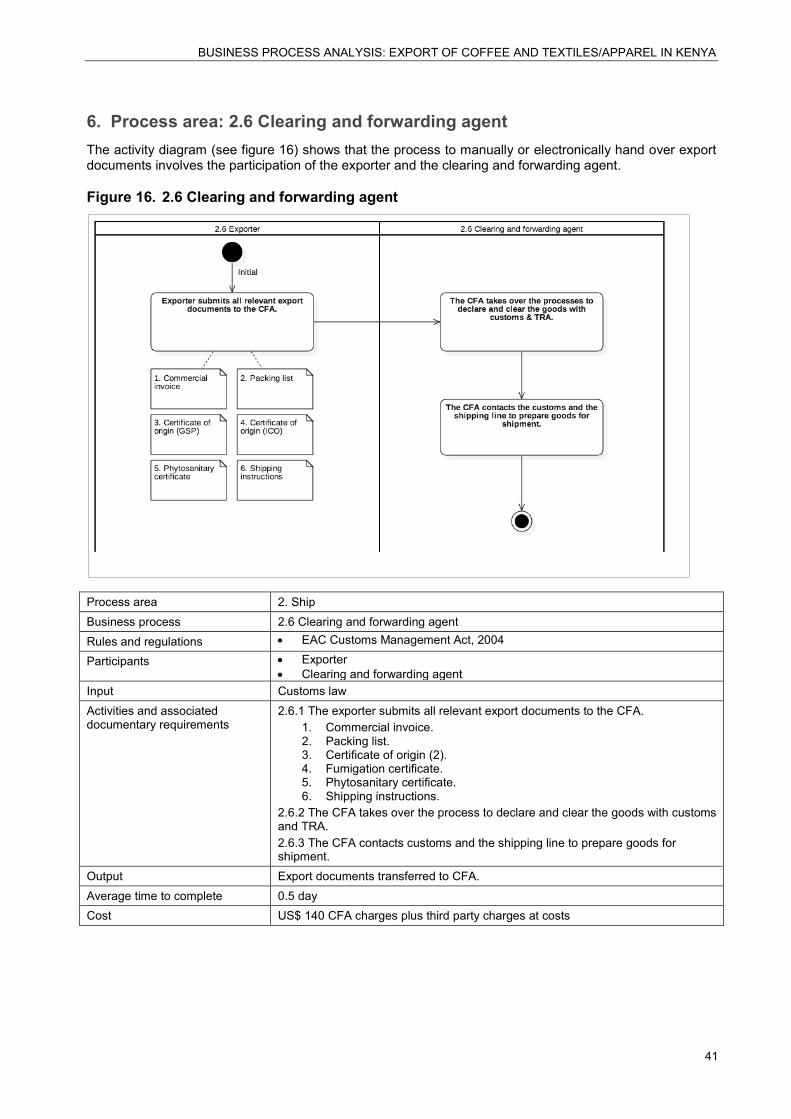
BUSINESS PROCESS ANALYSIS: EXPORT OF COFFEE AND TEXTILES/APPAREL IN KENYA
41
6. Process area: 2.6 Clearing and forwarding agent The activity diagram (see figure 16) shows that the process to manually or electronically hand over export documents involves the participation of the exporter and the clearing and forwarding agent.
Figure 16. 2.6 Clearing and forwarding agent
Process area 2. Ship Business process 2.6 Clearing and forwarding agent Rules and regulations • EAC Customs Management Act, 2004
Participants • Exporter • Clearing and forwarding agent
Input Customs law Activities and associated documentary requirements
2.6.1 The exporter submits all relevant export documents to the CFA. 1. Commercial invoice. 2. Packing list. 3. Certificate of origin (2). 4. Fumigation certificate. 5. Phytosanitary certificate. 6. Shipping instructions.
2.6.2 The CFA takes over the process to declare and clear the goods with customs and TRA. 2.6.3 The CFA contacts customs and the shipping line to prepare goods for shipment.
Output Export documents transferred to CFA. Average time to complete 0.5 day Cost US$ 140 CFA charges plus third party charges at costs
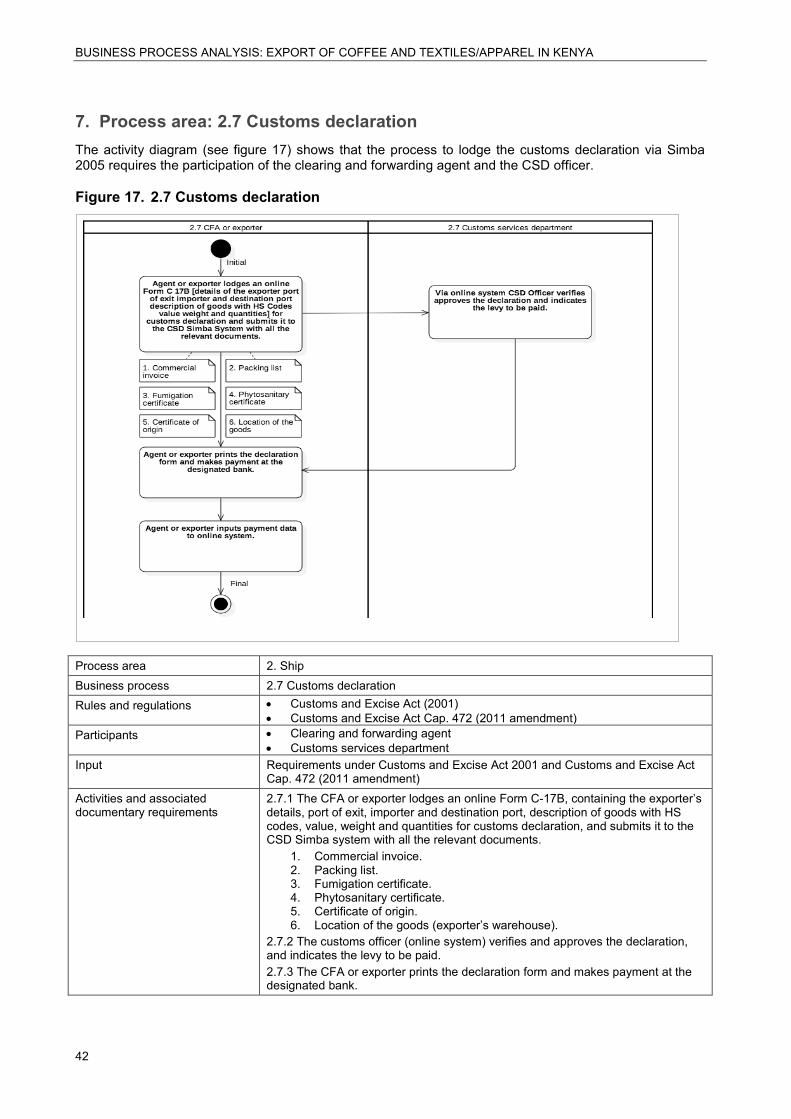
BUSINESS PROCESS ANALYSIS: EXPORT OF COFFEE AND TEXTILES/APPAREL IN KENYA
42
7. Process area: 2.7 Customs declaration The activity diagram (see figure 17) shows that the process to lodge the customs declaration via Simba 2005 requires the participation of the clearing and forwarding agent and the CSD officer.
Figure 17. 2.7 Customs declaration
Process area 2. Ship Business process 2.7 Customs declaration Rules and regulations • Customs and Excise Act (2001)
• Customs and Excise Act Cap. 472 (2011 amendment) Participants • Clearing and forwarding agent
• Customs services department Input Requirements under Customs and Excise Act 2001 and Customs and Excise Act
Cap. 472 (2011 amendment) Activities and associated documentary requirements
2.7.1 The CFA or exporter lodges an online Form C-17B, containing the exporter’s details, port of exit, importer and destination port, description of goods with HS codes, value, weight and quantities for customs declaration, and submits it to the CSD Simba system with all the relevant documents.
1. Commercial invoice. 2. Packing list. 3. Fumigation certificate. 4. Phytosanitary certificate. 5. Certificate of origin. 6. Location of the goods (exporter’s warehouse).
2.7.2 The customs officer (online system) verifies and approves the declaration, and indicates the levy to be paid. 2.7.3 The CFA or exporter prints the declaration form and makes payment at the designated bank.
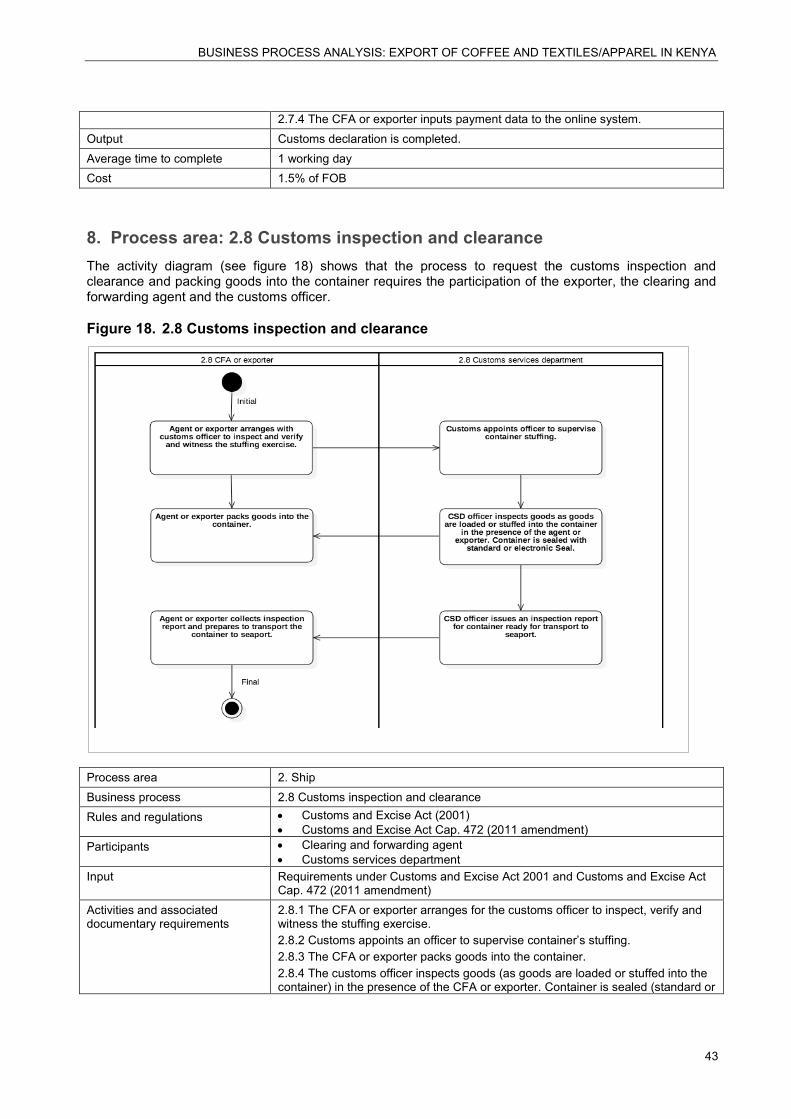
BUSINESS PROCESS ANALYSIS: EXPORT OF COFFEE AND TEXTILES/APPAREL IN KENYA
43
2.7.4 The CFA or exporter inputs payment data to the online system. Output Customs declaration is completed. Average time to complete 1 working day Cost 1.5% of FOB
8. Process area: 2.8 Customs inspection and clearance The activity diagram (see figure 18) shows that the process to request the customs inspection and clearance and packing goods into the container requires the participation of the exporter, the clearing and forwarding agent and the customs officer.
Figure 18. 2.8 Customs inspection and clearance
Process area 2. Ship Business process 2.8 Customs inspection and clearance Rules and regulations • Customs and Excise Act (2001)
• Customs and Excise Act Cap. 472 (2011 amendment) Participants • Clearing and forwarding agent
• Customs services department Input Requirements under Customs and Excise Act 2001 and Customs and Excise Act
Cap. 472 (2011 amendment) Activities and associated documentary requirements
2.8.1 The CFA or exporter arranges for the customs officer to inspect, verify and witness the stuffing exercise. 2.8.2 Customs appoints an officer to supervise container’s stuffing. 2.8.3 The CFA or exporter packs goods into the container. 2.8.4 The customs officer inspects goods (as goods are loaded or stuffed into the container) in the presence of the CFA or exporter. Container is sealed (standard or

BUSINESS PROCESS ANALYSIS: EXPORT OF COFFEE AND TEXTILES/APPAREL IN KENYA
44
electronic seal). 2.8.5 The customs officer issues an inspection report for container ready for transport to seaport. 2.8.6 The CFA or exporter collects inspection report and prepares to transport the container to seaport.
Output Customs inspection and clearance is completed. Average time to complete 1 working day plus 2–3 working days for the availability of the customs officer Cost 1.5% of FOB
9. Process area: 2.9 Coffee movement permit (2) The activity diagram (see figure 19) shows that the process to apply for a coffee movement permit to transport coffee from exporter’s warehouse to the seaport yard requires the participation of the exporter, Coffee Directorate and customs officer.
Figure 19. 2.9 Coffee movement permit (2)
Process area 2. Ship Business process 2.9 Coffee movement permit (2) Rules and regulations • Coffee Act (2001)
Participants • Exporter • Coffee Directorate • Customs services department
Input Requirements under Coffee Act (2001) Activities and associated documentary requirements
2.9.1 The exporter prepares an application for a CMP and submits it to the CD and CSD with all relevant export documents.
1. Vehicle plate number. 2. Drivers’ identities. 3. From warehouse and to seaport.
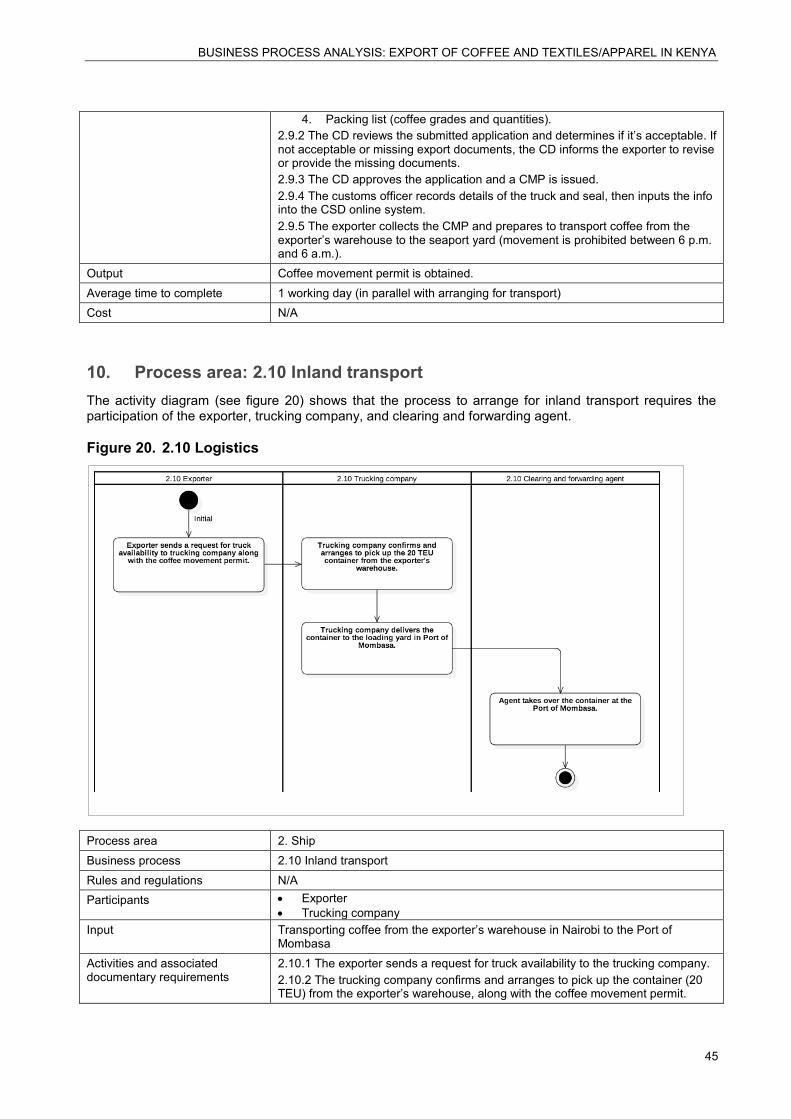
BUSINESS PROCESS ANALYSIS: EXPORT OF COFFEE AND TEXTILES/APPAREL IN KENYA
45
4. Packing list (coffee grades and quantities). 2.9.2 The CD reviews the submitted application and determines if it’s acceptable. If not acceptable or missing export documents, the CD informs the exporter to revise or provide the missing documents. 2.9.3 The CD approves the application and a CMP is issued. 2.9.4 The customs officer records details of the truck and seal, then inputs the info into the CSD online system. 2.9.5 The exporter collects the CMP and prepares to transport coffee from the exporter’s warehouse to the seaport yard (movement is prohibited between 6 p.m. and 6 a.m.).
Output Coffee movement permit is obtained. Average time to complete 1 working day (in parallel with arranging for transport) Cost N/A
10. Process area: 2.10 Inland transport The activity diagram (see figure 20) shows that the process to arrange for inland transport requires the participation of the exporter, trucking company, and clearing and forwarding agent.
Figure 20. 2.10 Logistics
Process area 2. Ship Business process 2.10 Inland transport Rules and regulations N/A Participants • Exporter
• Trucking company Input Transporting coffee from the exporter’s warehouse in Nairobi to the Port of
Mombasa Activities and associated documentary requirements
2.10.1 The exporter sends a request for truck availability to the trucking company. 2.10.2 The trucking company confirms and arranges to pick up the container (20 TEU) from the exporter’s warehouse, along with the coffee movement permit.
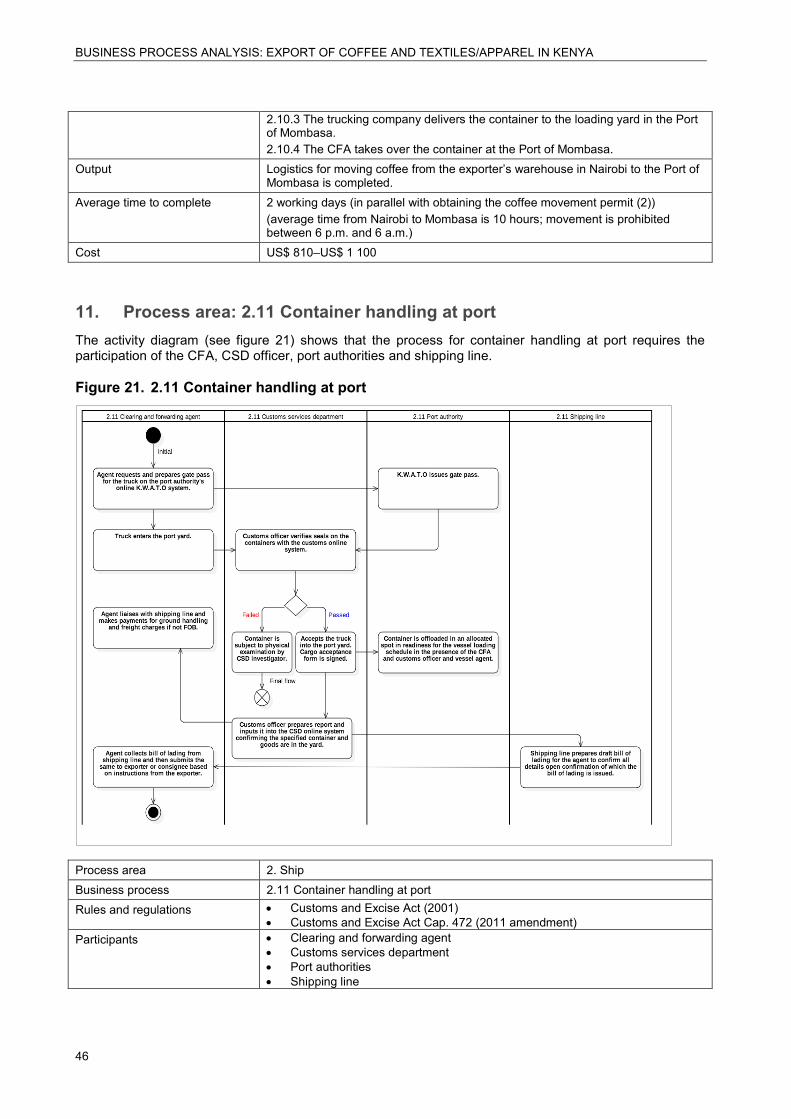
BUSINESS PROCESS ANALYSIS: EXPORT OF COFFEE AND TEXTILES/APPAREL IN KENYA
46
2.10.3 The trucking company delivers the container to the loading yard in the Port of Mombasa. 2.10.4 The CFA takes over the container at the Port of Mombasa.
Output Logistics for moving coffee from the exporter’s warehouse in Nairobi to the Port of Mombasa is completed.
Average time to complete 2 working days (in parallel with obtaining the coffee movement permit (2)) (average time from Nairobi to Mombasa is 10 hours; movement is prohibited between 6 p.m. and 6 a.m.)
Cost US$ 810–US$ 1 100
11. Process area: 2.11 Container handling at port The activity diagram (see figure 21) shows that the process for container handling at port requires the participation of the CFA, CSD officer, port authorities and shipping line.
Figure 21. 2.11 Container handling at port
Process area 2. Ship Business process 2.11 Container handling at port Rules and regulations • Customs and Excise Act (2001)
• Customs and Excise Act Cap. 472 (2011 amendment) Participants • Clearing and forwarding agent
• Customs services department • Port authorities • Shipping line
BUSINESS PROCESS ANALYSIS: EXPORT OF COFFEE AND TEXTILES/APPAREL IN KENYA
47
Input Requirements under Customs and Excise Act 2001 and Customs and Excise Act Cap. 472 (2011 amendment)
Activities and associated documentary requirements
2.11.1 The CFA requests and prepares the gate pass for the truck on the port authorities’ online systems (enters details of truck, driver, goods per invoice and packing list into K.W.A.T.O.S).13 2.11.2 The customs officer verifies seals on the containers with the customs online system and accepts the truck into the yard (cargo acceptance form is signed). 2.11.3 The container is offloaded in an allocated spot in readiness for the vessel’s loading schedule – in the presence of the CFA, customs officer and vessel agent. 2.11.4 The customs officer prepares the report and inputs it into the CSD online system, confirming the specified container and goods are in the yard. Ad hoc (at the discretion of the authorities), the container may go through electronic scanning. 2.11.5 The agent liaises with the shipping line and makes payments for ground handling and freight charges (if not FOB). 2.11.6 The shipping line prepares the draft bill of lading for the agent to confirm all details, upon confirmation of which the bill of lading is issued.
2.11.7 The CFA collects the bill of lading from the shipping line, then submits it to the exporter or consignee based on instructions from the exporter.
Output Cargo is ready to sail and shipping activities are completed. Average time to complete If the vessel is in the port, all procedures usually take 4–5 working days. Cost US$ 25 terminal handling charges
13 K.W.A.T.O.S = Kilindini Waterfront Automated Terminal Operating System (Kilindini is the Mombasa seaport)
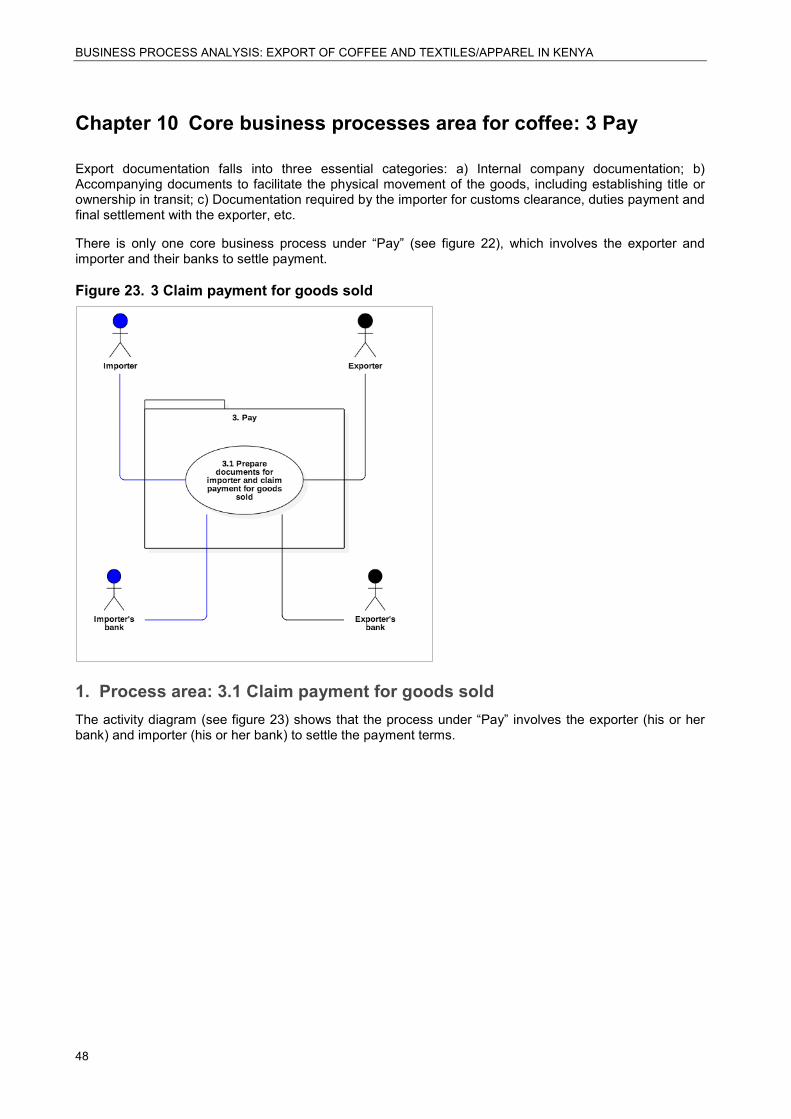
BUSINESS PROCESS ANALYSIS: EXPORT OF COFFEE AND TEXTILES/APPAREL IN KENYA
48
Chapter 10 Core business processes area for coffee: 3 Pay
Export documentation falls into three essential categories: a) Internal company documentation; b) Accompanying documents to facilitate the physical movement of the goods, including establishing title or ownership in transit; c) Documentation required by the importer for customs clearance, duties payment and final settlement with the exporter, etc.
There is only one core business process under “Pay” (see figure 22), which involves the exporter and importer and their banks to settle payment.
Figure 23. 3 Claim payment for goods sold
1. Process area: 3.1 Claim payment for goods sold The activity diagram (see figure 23) shows that the process under “Pay” involves the exporter (his or her bank) and importer (his or her bank) to settle the payment terms.
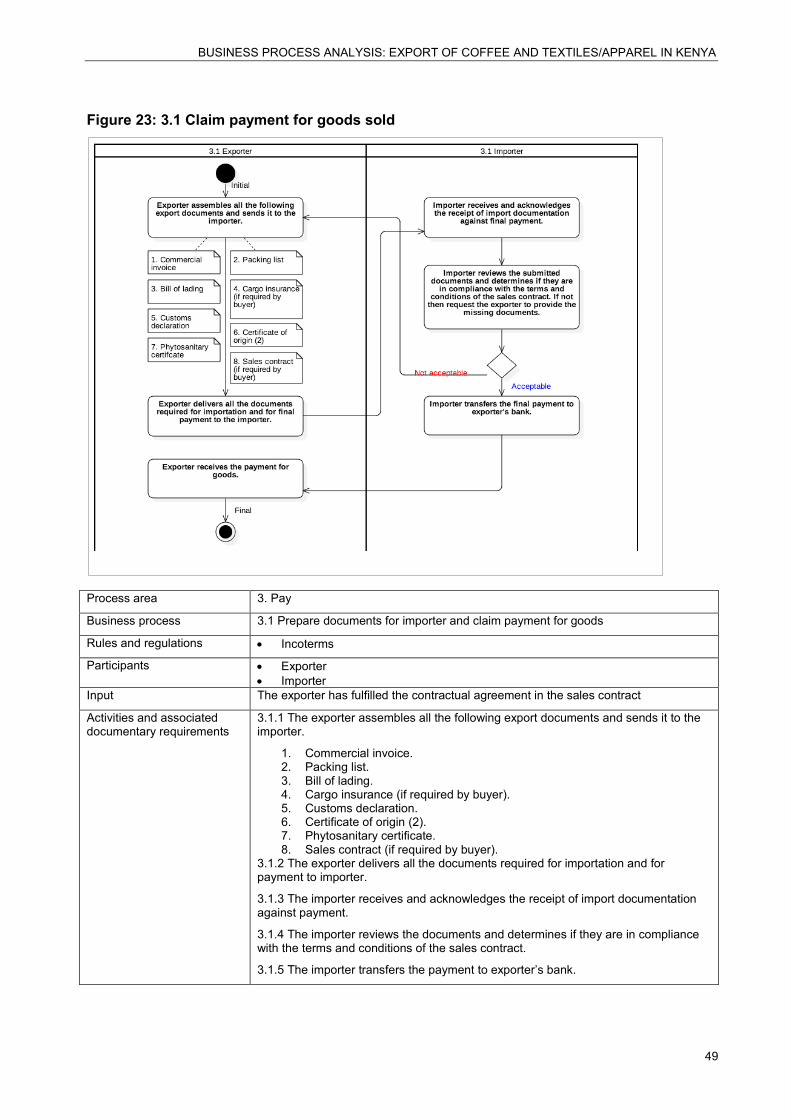
BUSINESS PROCESS ANALYSIS: EXPORT OF COFFEE AND TEXTILES/APPAREL IN KENYA
49
Figure 23: 3.1 Claim payment for goods sold
Process area 3. Pay
Business process 3.1 Prepare documents for importer and claim payment for goods
Rules and regulations • Incoterms
Participants • Exporter • Importer
Input The exporter has fulfilled the contractual agreement in the sales contract
Activities and associated documentary requirements
3.1.1 The exporter assembles all the following export documents and sends it to the importer.
1. Commercial invoice. 2. Packing list. 3. Bill of lading. 4. Cargo insurance (if required by buyer). 5. Customs declaration. 6. Certificate of origin (2). 7. Phytosanitary certificate. 8. Sales contract (if required by buyer).
3.1.2 The exporter delivers all the documents required for importation and for payment to importer.
3.1.3 The importer receives and acknowledges the receipt of import documentation against payment.
3.1.4 The importer reviews the documents and determines if they are in compliance with the terms and conditions of the sales contract.
3.1.5 The importer transfers the payment to exporter’s bank.
BUSINESS PROCESS ANALYSIS: EXPORT OF COFFEE AND TEXTILES/APPAREL IN KENYA
50
3.1.6 The exporter receives the payment for the goods.
Output The importer receives documents to complete import formalities.
The exporter receives the payment for the goods.
Average time to complete 2–3 working days, after the delivery of goods
Cost N/A
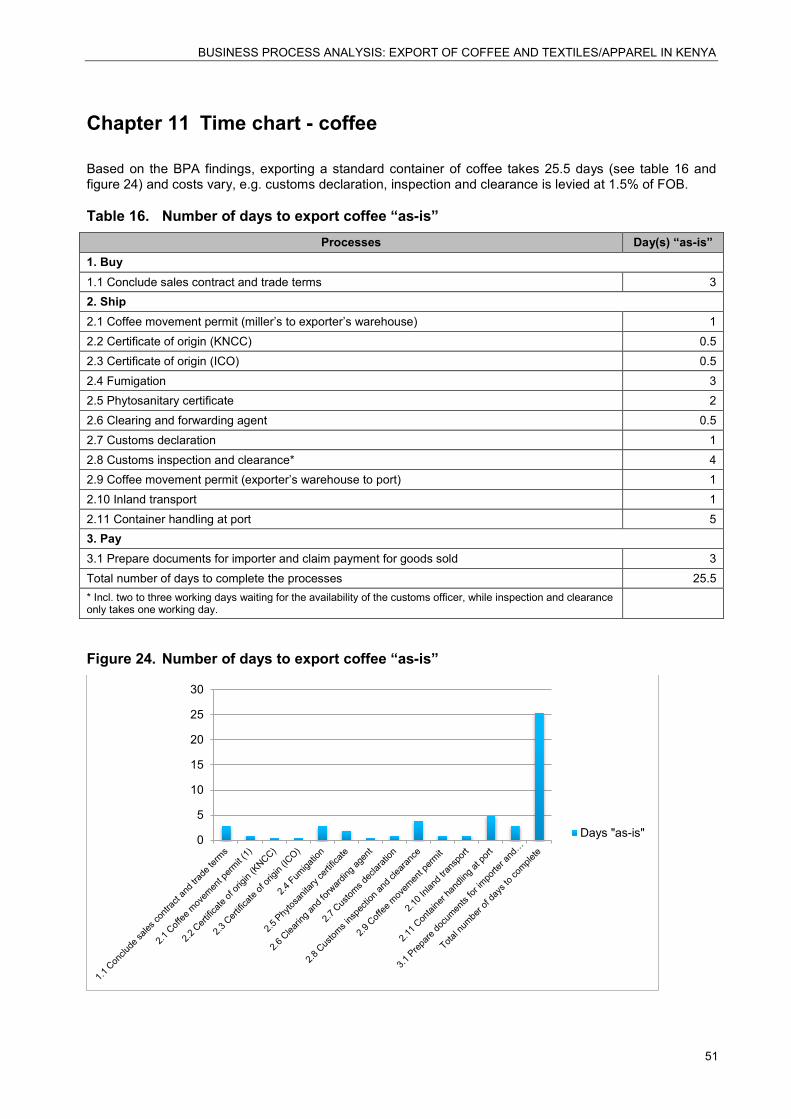
BUSINESS PROCESS ANALYSIS: EXPORT OF COFFEE AND TEXTILES/APPAREL IN KENYA
51
Chapter 11 Time chart - coffee
Based on the BPA findings, exporting a standard container of coffee takes 25.5 days (see table 16 and figure 24) and costs vary, e.g. customs declaration, inspection and clearance is levied at 1.5% of FOB.
Table 16. Number of days to export coffee “as-is” Processes Day(s) “as-is”
1. Buy 1.1 Conclude sales contract and trade terms 3 2. Ship 2.1 Coffee movement permit (miller’s to exporter’s warehouse) 1 2.2 Certificate of origin (KNCC) 0.5 2.3 Certificate of origin (ICO) 0.5 2.4 Fumigation 3 2.5 Phytosanitary certificate 2 2.6 Clearing and forwarding agent 0.5 2.7 Customs declaration 1 2.8 Customs inspection and clearance* 4 2.9 Coffee movement permit (exporter’s warehouse to port) 1 2.10 Inland transport 1 2.11 Container handling at port 5 3. Pay 3.1 Prepare documents for importer and claim payment for goods sold 3 Total number of days to complete the processes 25.5 * Incl. two to three working days waiting for the availability of the customs officer, while inspection and clearance only takes one working day.
Figure 24. Number of days to export coffee “as-is”
0
5
10
15
20
25
30
Days "as-is"
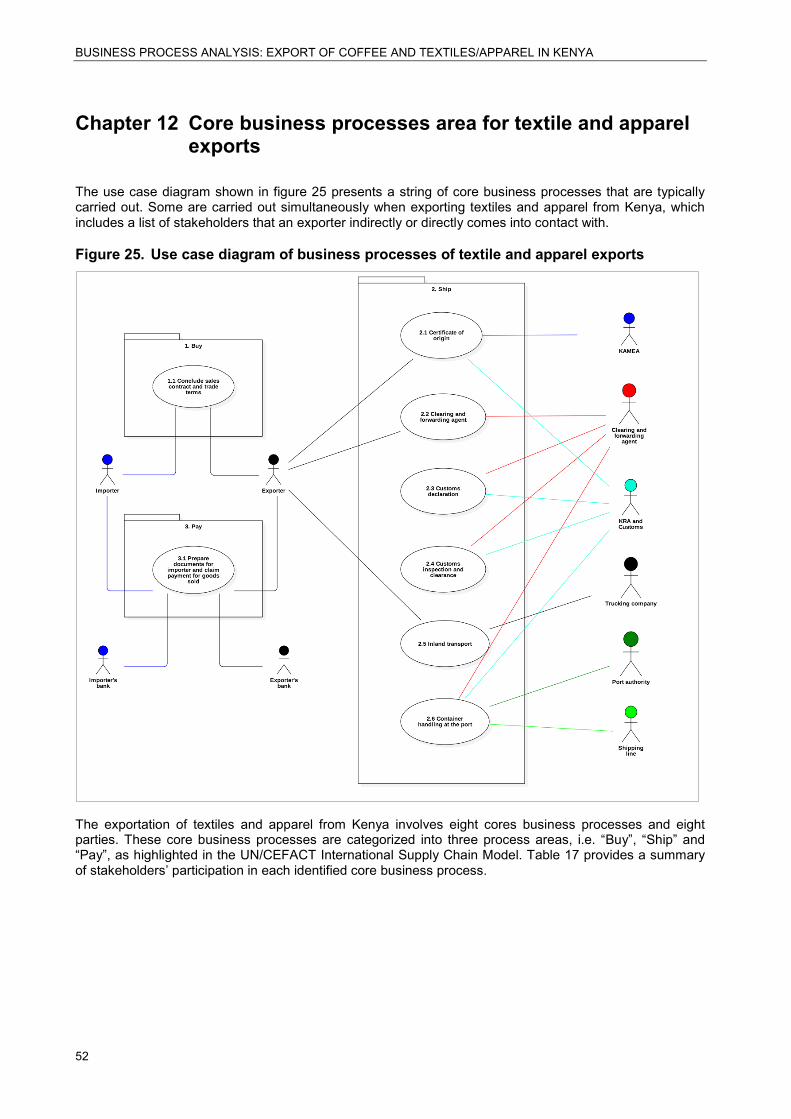
BUSINESS PROCESS ANALYSIS: EXPORT OF COFFEE AND TEXTILES/APPAREL IN KENYA
52
Chapter 12 Core business processes area for textile and apparel exports
The use case diagram shown in figure 25 presents a string of core business processes that are typically carried out. Some are carried out simultaneously when exporting textiles and apparel from Kenya, which includes a list of stakeholders that an exporter indirectly or directly comes into contact with.
Figure 25. Use case diagram of business processes of textile and apparel exports
The exportation of textiles and apparel from Kenya involves eight cores business processes and eight parties. These core business processes are categorized into three process areas, i.e. “Buy”, “Ship” and “Pay”, as highlighted in the UN/CEFACT International Supply Chain Model. Table 17 provides a summary of stakeholders’ participation in each identified core business process.
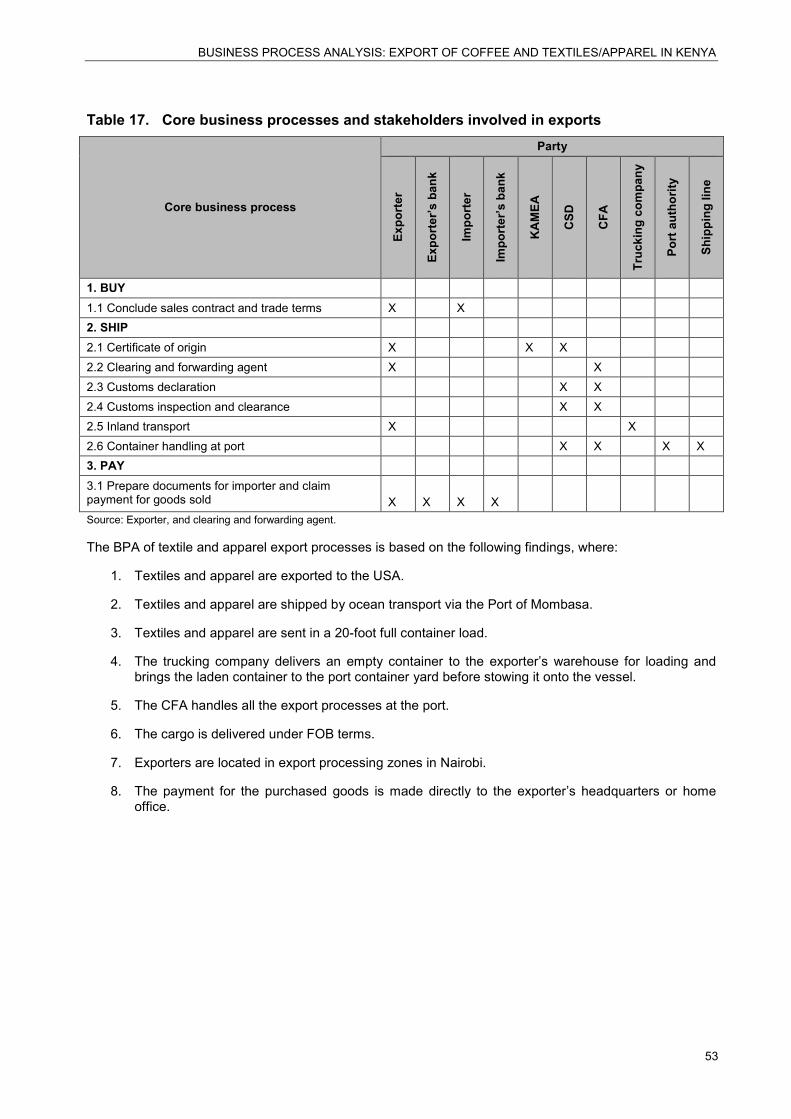
BUSINESS PROCESS ANALYSIS: EXPORT OF COFFEE AND TEXTILES/APPAREL IN KENYA
53
Table 17. Core business processes and stakeholders involved in exports
Core business process
Party
Expo
rter
Expo
rter
’s b
ank
Impo
rter
Impo
rter
’s b
ank
KA
MEA
CSD
CFA
Truc
king
com
pany
Port
aut
horit
y
Ship
ping
line
1. BUY 1.1 Conclude sales contract and trade terms X X 2. SHIP 2.1 Certificate of origin X X X 2.2 Clearing and forwarding agent X X 2.3 Customs declaration X X 2.4 Customs inspection and clearance X X 2.5 Inland transport X X 2.6 Container handling at port X X X X 3. PAY 3.1 Prepare documents for importer and claim payment for goods sold
X
X
X
X
Source: Exporter, and clearing and forwarding agent.
The BPA of textile and apparel export processes is based on the following findings, where:
1. Textiles and apparel are exported to the USA.
2. Textiles and apparel are shipped by ocean transport via the Port of Mombasa.
3. Textiles and apparel are sent in a 20-foot full container load.
4. The trucking company delivers an empty container to the exporter’s warehouse for loading and brings the laden container to the port container yard before stowing it onto the vessel.
5. The CFA handles all the export processes at the port.
6. The cargo is delivered under FOB terms.
7. Exporters are located in export processing zones in Nairobi.
8. The payment for the purchased goods is made directly to the exporter’s headquarters or home office.
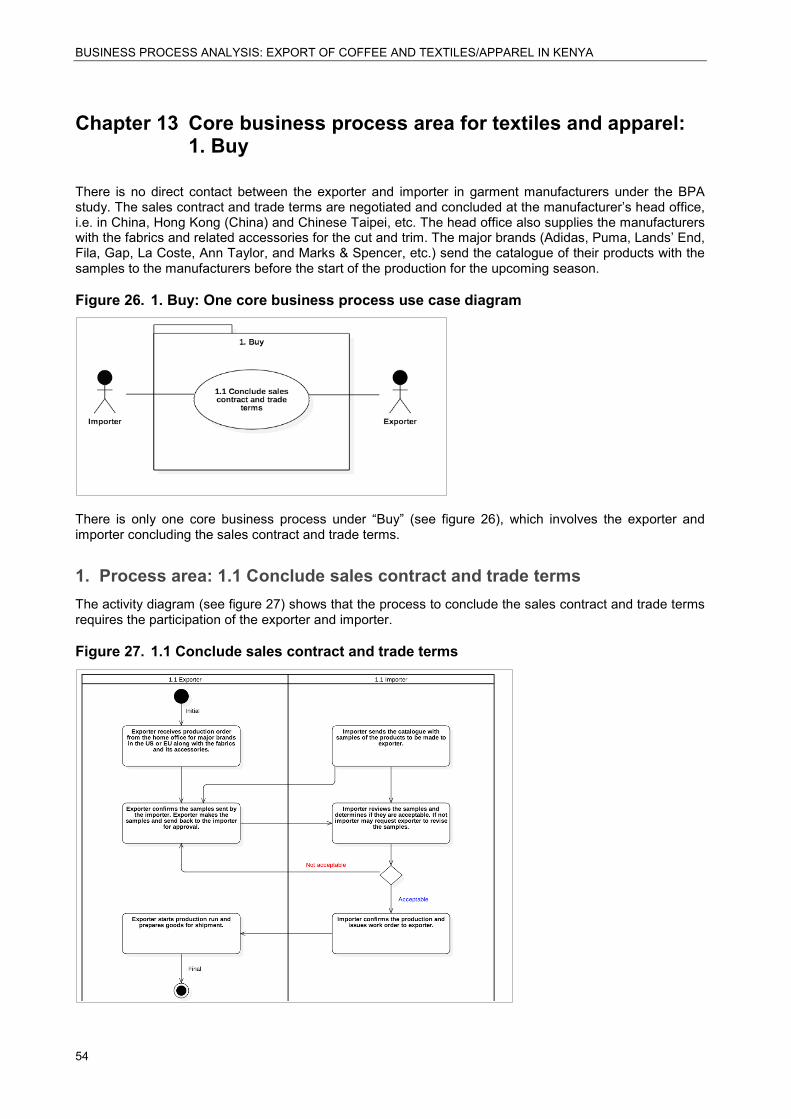
BUSINESS PROCESS ANALYSIS: EXPORT OF COFFEE AND TEXTILES/APPAREL IN KENYA
54
Chapter 13 Core business process area for textiles and apparel: 1. Buy
There is no direct contact between the exporter and importer in garment manufacturers under the BPA study. The sales contract and trade terms are negotiated and concluded at the manufacturer’s head office, i.e. in China, Hong Kong (China) and Chinese Taipei, etc. The head office also supplies the manufacturers with the fabrics and related accessories for the cut and trim. The major brands (Adidas, Puma, Lands’ End, Fila, Gap, La Coste, Ann Taylor, and Marks & Spencer, etc.) send the catalogue of their products with the samples to the manufacturers before the start of the production for the upcoming season.
Figure 26. 1. Buy: One core business process use case diagram
There is only one core business process under “Buy” (see figure 26), which involves the exporter and importer concluding the sales contract and trade terms.
1. Process area: 1.1 Conclude sales contract and trade terms The activity diagram (see figure 27) shows that the process to conclude the sales contract and trade terms requires the participation of the exporter and importer.
Figure 27. 1.1 Conclude sales contract and trade terms

BUSINESS PROCESS ANALYSIS: EXPORT OF COFFEE AND TEXTILES/APPAREL IN KENYA
55
Process area 1. Buy Business process 1.1 Conclude sales contract and trade terms Rules and regulations • Intracompany policies and Incoterms
Participants • Manufacturer’s head office • Exporter • Importer
Input Sales contract between buyer and seller Activities and associated documentary requirements
1.1.1 The exporter receives a production order from the head office for major brands in the US or EU, along with the fabrics and accessories. 1.1.2 The importer sends the catalogue with samples of the products to be made to the exporter. 1.1.3 The exporter confirms the samples sent by the importer, then makes the samples and sends them back to the importer for approval. 1.1.4 The importer reviews the samples and determines if they are acceptable. If not, the importer may request the exporter to revise the samples. 1.1.5 The importer confirms the production and issues a work order to the exporter. 1.1.6 The exporter starts the production run and prepares goods for shipment.
Output The importer and exporter’s head office concludes sales contract and trade terms. The exporter prepares goods for shipment.
Average time to complete 5 working days (production can run for months based on the volume and the catalogue of order)
Cost N/A
International Commercial Terms (Incoterms) are internationally recognized standard trade terms used in sales contracts. They are used to make sure the buyer and seller know:
• Who is responsible for the cost of transporting the goods, including insurance, taxes and duties;
• Where the goods should be picked up from and transported to;
• Who is responsible for the goods at each step during transportation.
The current set of Incoterms is Incoterms 2010. A copy of the full terms is available from the International Chamber of Commerce (www.iccwbo.org).

BUSINESS PROCESS ANALYSIS: EXPORT OF COFFEE AND TEXTILES/APPAREL IN KENYA
56
Chapter 14 Core business process area for textiles and apparel: 2. Ship
The six cores business processes in the ship area (see figure 28) deal with both transport and governmental rules and regulations; i.e. for the purpose of collecting trade statistics and customs duties, and to comply with international conventions and bilateral and multilateral trade agreements.
Figure 28. 2. Ship: Six cores business processes use case diagram
1. Process area: 2.1 Certificate of origin The activity diagram (see figure 29) shows that the process to apply for a certificate of origin requires the participation of the exporter, the technical department of KAMEA and CSD.
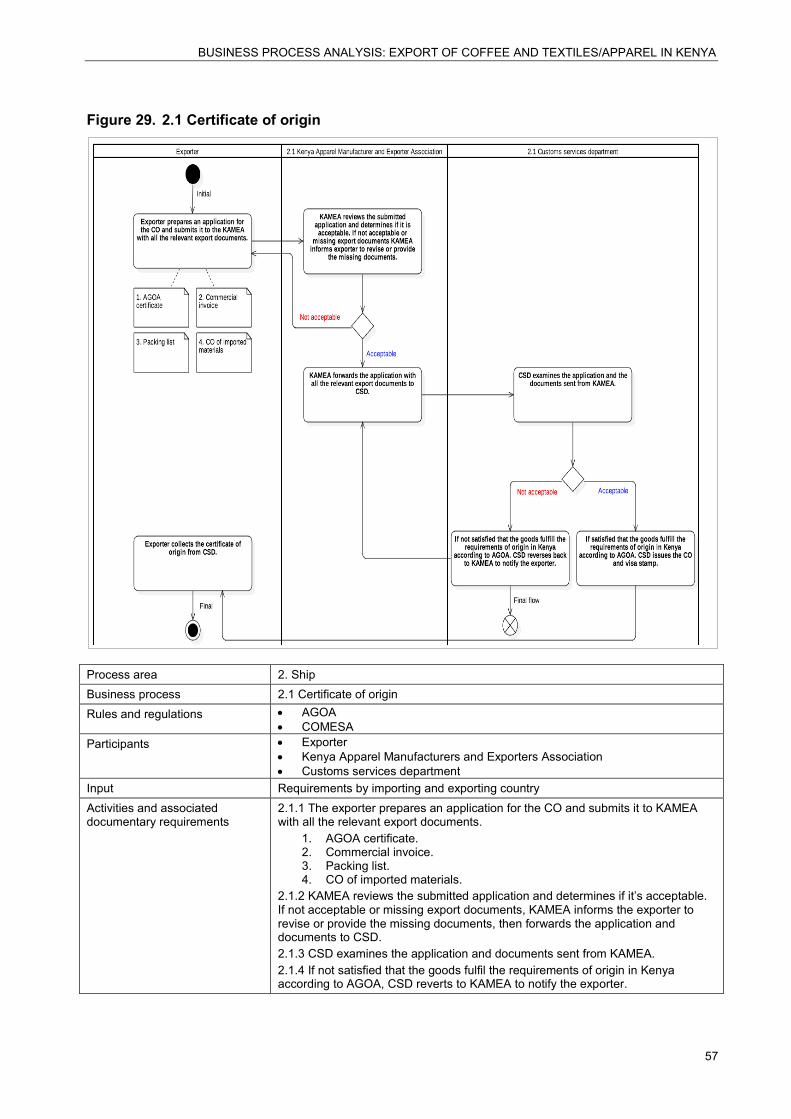
BUSINESS PROCESS ANALYSIS: EXPORT OF COFFEE AND TEXTILES/APPAREL IN KENYA
57
Figure 29. 2.1 Certificate of origin
Process area 2. Ship Business process 2.1 Certificate of origin Rules and regulations • AGOA
• COMESA Participants • Exporter
• Kenya Apparel Manufacturers and Exporters Association • Customs services department
Input Requirements by importing and exporting country Activities and associated documentary requirements
2.1.1 The exporter prepares an application for the CO and submits it to KAMEA with all the relevant export documents.
1. AGOA certificate. 2. Commercial invoice. 3. Packing list. 4. CO of imported materials.
2.1.2 KAMEA reviews the submitted application and determines if it’s acceptable. If not acceptable or missing export documents, KAMEA informs the exporter to revise or provide the missing documents, then forwards the application and documents to CSD. 2.1.3 CSD examines the application and documents sent from KAMEA. 2.1.4 If not satisfied that the goods fulfil the requirements of origin in Kenya according to AGOA, CSD reverts to KAMEA to notify the exporter.
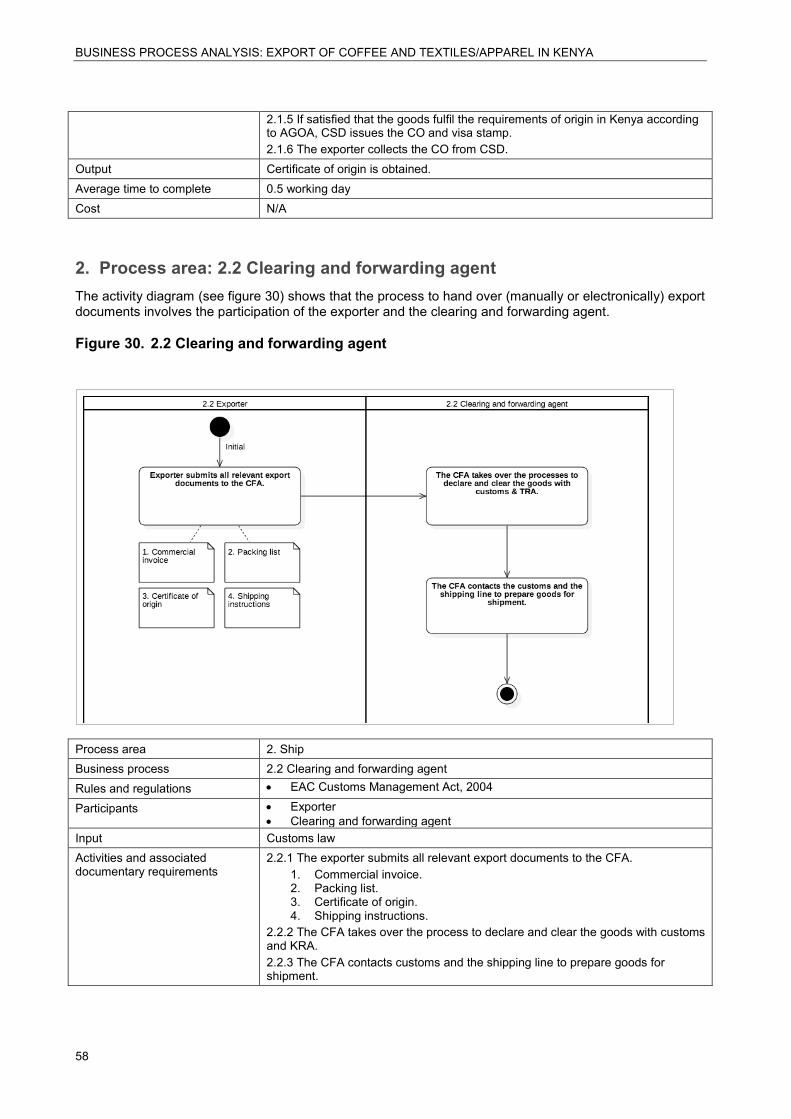
BUSINESS PROCESS ANALYSIS: EXPORT OF COFFEE AND TEXTILES/APPAREL IN KENYA
58
2.1.5 If satisfied that the goods fulfil the requirements of origin in Kenya according to AGOA, CSD issues the CO and visa stamp. 2.1.6 The exporter collects the CO from CSD.
Output Certificate of origin is obtained. Average time to complete 0.5 working day Cost N/A
2. Process area: 2.2 Clearing and forwarding agent The activity diagram (see figure 30) shows that the process to hand over (manually or electronically) export documents involves the participation of the exporter and the clearing and forwarding agent.
Figure 30. 2.2 Clearing and forwarding agent
Process area 2. Ship Business process 2.2 Clearing and forwarding agent Rules and regulations • EAC Customs Management Act, 2004
Participants • Exporter • Clearing and forwarding agent
Input Customs law Activities and associated documentary requirements
2.2.1 The exporter submits all relevant export documents to the CFA. 1. Commercial invoice. 2. Packing list. 3. Certificate of origin. 4. Shipping instructions.
2.2.2 The CFA takes over the process to declare and clear the goods with customs and KRA. 2.2.3 The CFA contacts customs and the shipping line to prepare goods for shipment.
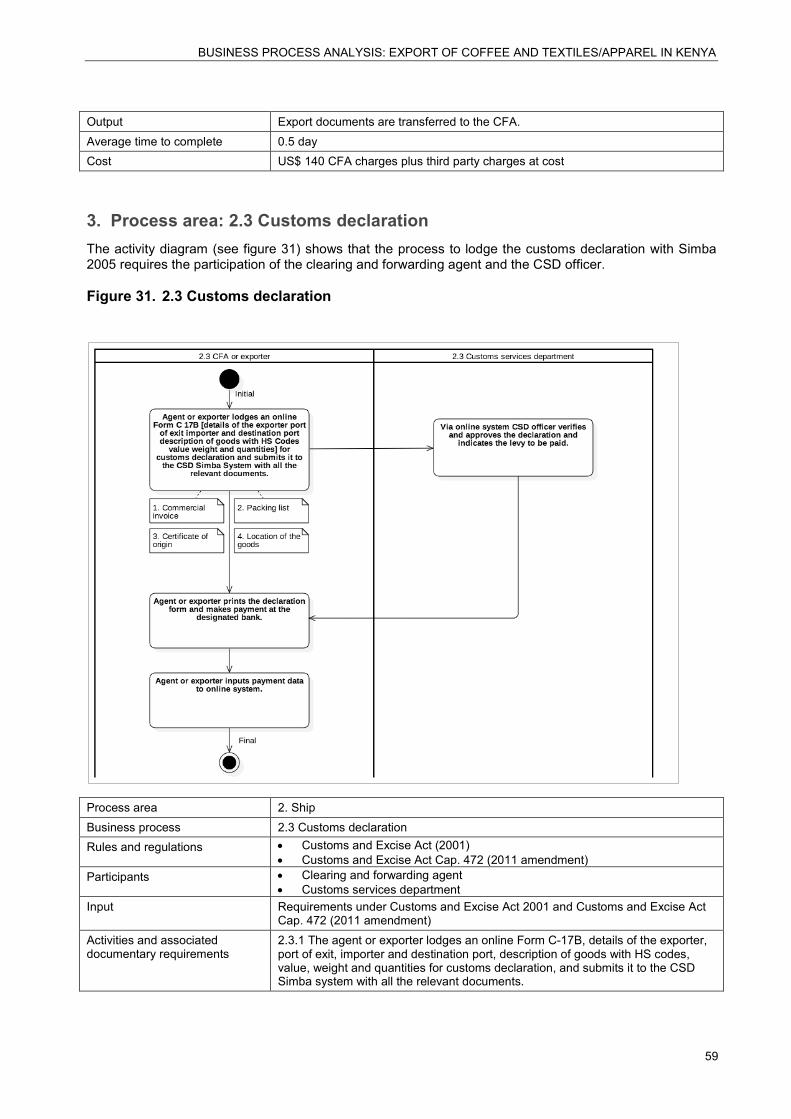
BUSINESS PROCESS ANALYSIS: EXPORT OF COFFEE AND TEXTILES/APPAREL IN KENYA
59
Output Export documents are transferred to the CFA. Average time to complete 0.5 day Cost US$ 140 CFA charges plus third party charges at cost
3. Process area: 2.3 Customs declaration The activity diagram (see figure 31) shows that the process to lodge the customs declaration with Simba 2005 requires the participation of the clearing and forwarding agent and the CSD officer.
Figure 31. 2.3 Customs declaration
Process area 2. Ship Business process 2.3 Customs declaration Rules and regulations • Customs and Excise Act (2001)
• Customs and Excise Act Cap. 472 (2011 amendment) Participants • Clearing and forwarding agent
• Customs services department Input Requirements under Customs and Excise Act 2001 and Customs and Excise Act
Cap. 472 (2011 amendment) Activities and associated documentary requirements
2.3.1 The agent or exporter lodges an online Form C-17B, details of the exporter, port of exit, importer and destination port, description of goods with HS codes, value, weight and quantities for customs declaration, and submits it to the CSD Simba system with all the relevant documents.
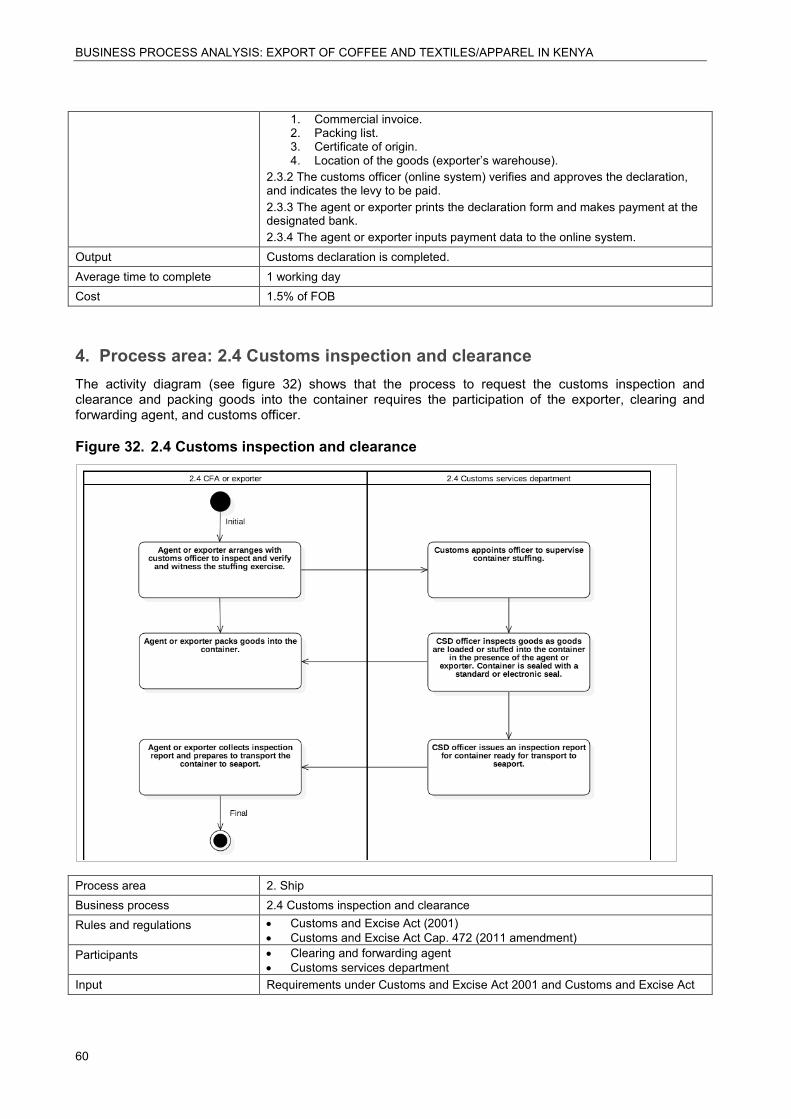
BUSINESS PROCESS ANALYSIS: EXPORT OF COFFEE AND TEXTILES/APPAREL IN KENYA
60
1. Commercial invoice. 2. Packing list. 3. Certificate of origin. 4. Location of the goods (exporter’s warehouse).
2.3.2 The customs officer (online system) verifies and approves the declaration, and indicates the levy to be paid. 2.3.3 The agent or exporter prints the declaration form and makes payment at the designated bank. 2.3.4 The agent or exporter inputs payment data to the online system.
Output Customs declaration is completed. Average time to complete 1 working day Cost 1.5% of FOB
4. Process area: 2.4 Customs inspection and clearance The activity diagram (see figure 32) shows that the process to request the customs inspection and clearance and packing goods into the container requires the participation of the exporter, clearing and forwarding agent, and customs officer.
Figure 32. 2.4 Customs inspection and clearance
Process area 2. Ship Business process 2.4 Customs inspection and clearance Rules and regulations • Customs and Excise Act (2001)
• Customs and Excise Act Cap. 472 (2011 amendment) Participants • Clearing and forwarding agent
• Customs services department Input Requirements under Customs and Excise Act 2001 and Customs and Excise Act
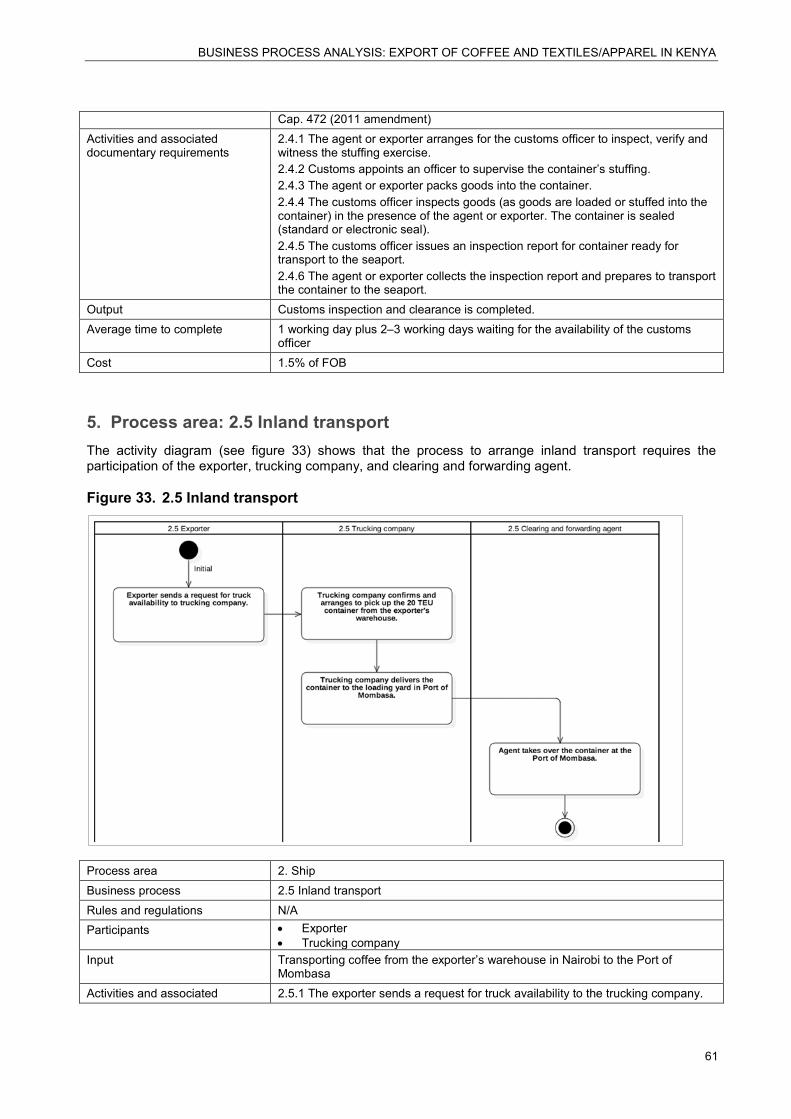
BUSINESS PROCESS ANALYSIS: EXPORT OF COFFEE AND TEXTILES/APPAREL IN KENYA
61
Cap. 472 (2011 amendment) Activities and associated documentary requirements
2.4.1 The agent or exporter arranges for the customs officer to inspect, verify and witness the stuffing exercise. 2.4.2 Customs appoints an officer to supervise the container’s stuffing. 2.4.3 The agent or exporter packs goods into the container. 2.4.4 The customs officer inspects goods (as goods are loaded or stuffed into the container) in the presence of the agent or exporter. The container is sealed (standard or electronic seal). 2.4.5 The customs officer issues an inspection report for container ready for transport to the seaport. 2.4.6 The agent or exporter collects the inspection report and prepares to transport the container to the seaport.
Output Customs inspection and clearance is completed. Average time to complete 1 working day plus 2–3 working days waiting for the availability of the customs
officer Cost 1.5% of FOB
5. Process area: 2.5 Inland transport The activity diagram (see figure 33) shows that the process to arrange inland transport requires the participation of the exporter, trucking company, and clearing and forwarding agent.
Figure 33. 2.5 Inland transport
Process area 2. Ship Business process 2.5 Inland transport Rules and regulations N/A Participants • Exporter
• Trucking company Input Transporting coffee from the exporter’s warehouse in Nairobi to the Port of
Mombasa Activities and associated 2.5.1 The exporter sends a request for truck availability to the trucking company.
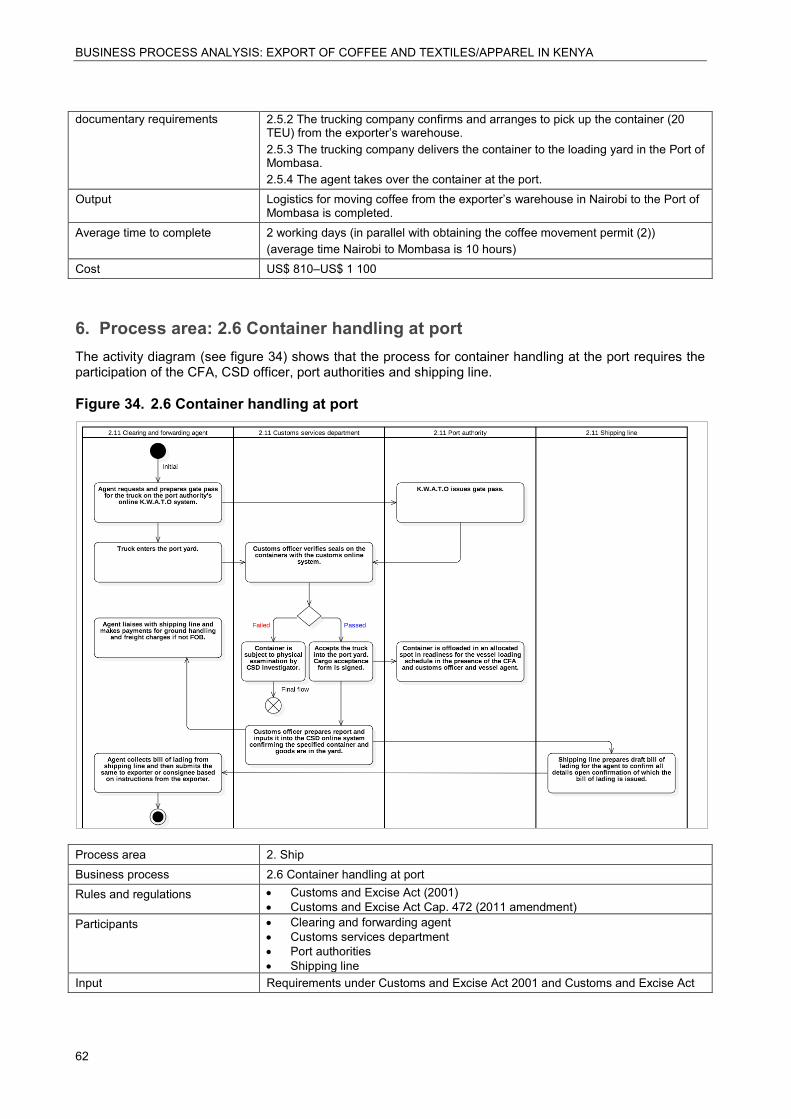
BUSINESS PROCESS ANALYSIS: EXPORT OF COFFEE AND TEXTILES/APPAREL IN KENYA
62
documentary requirements 2.5.2 The trucking company confirms and arranges to pick up the container (20 TEU) from the exporter’s warehouse. 2.5.3 The trucking company delivers the container to the loading yard in the Port of Mombasa. 2.5.4 The agent takes over the container at the port.
Output Logistics for moving coffee from the exporter’s warehouse in Nairobi to the Port of Mombasa is completed.
Average time to complete 2 working days (in parallel with obtaining the coffee movement permit (2)) (average time Nairobi to Mombasa is 10 hours)
Cost US$ 810–US$ 1 100
6. Process area: 2.6 Container handling at port The activity diagram (see figure 34) shows that the process for container handling at the port requires the participation of the CFA, CSD officer, port authorities and shipping line.
Figure 34. 2.6 Container handling at port
Process area 2. Ship Business process 2.6 Container handling at port Rules and regulations • Customs and Excise Act (2001)
• Customs and Excise Act Cap. 472 (2011 amendment) Participants • Clearing and forwarding agent
• Customs services department • Port authorities • Shipping line
Input Requirements under Customs and Excise Act 2001 and Customs and Excise Act
BUSINESS PROCESS ANALYSIS: EXPORT OF COFFEE AND TEXTILES/APPAREL IN KENYA
63
Cap. 472 (2011 amendment) Activities and associated documentary requirements
2.6.1 The agent requests or prepares a gate pass for the truck on the port authority’s online system (enters details of truck, driver, goods per invoice and packing list into K.W.A.T.O.S).14 2.6.2 The customs officer verifies seals on the containers with the customs online system and accepts the truck into the yard (cargo acceptance form is signed). 2.6.3 The container is offloaded in an allocated spot in readiness for the vessel’s loading schedule – in the presence of the CFA, customs officer and vessel agent. 2.6.4 The customs officer prepares the report and inputs it into the CSD online system, confirming the specified container and goods are in the yard. Ad hoc (at the discretion of the authorities), the container may go through electronic scanning. 2.6.5 The agent liaises with the shipping line and makes payments for ground handling and freight charges (if not FOB). 2.6.6 The shipping line prepares the draft bill of lading for the agent to confirm all details, upon confirmation of which the bill of lading is issued.
2.6.7 The agent collects the bill of lading from shipping line, then submits it to the exporter or consignee based on instructions from the exporter.
Output Cargo is ready to sail and shipping activities are completed. Average time to complete If the vessel is in the port, all procedures usually take 4–5 working days Cost US$ 25 terminal handling charges
14 K.W.A.T.O.S = Kilindini Waterfront Automated Terminal Operating System (Kilindini is the Mombasa seaport).
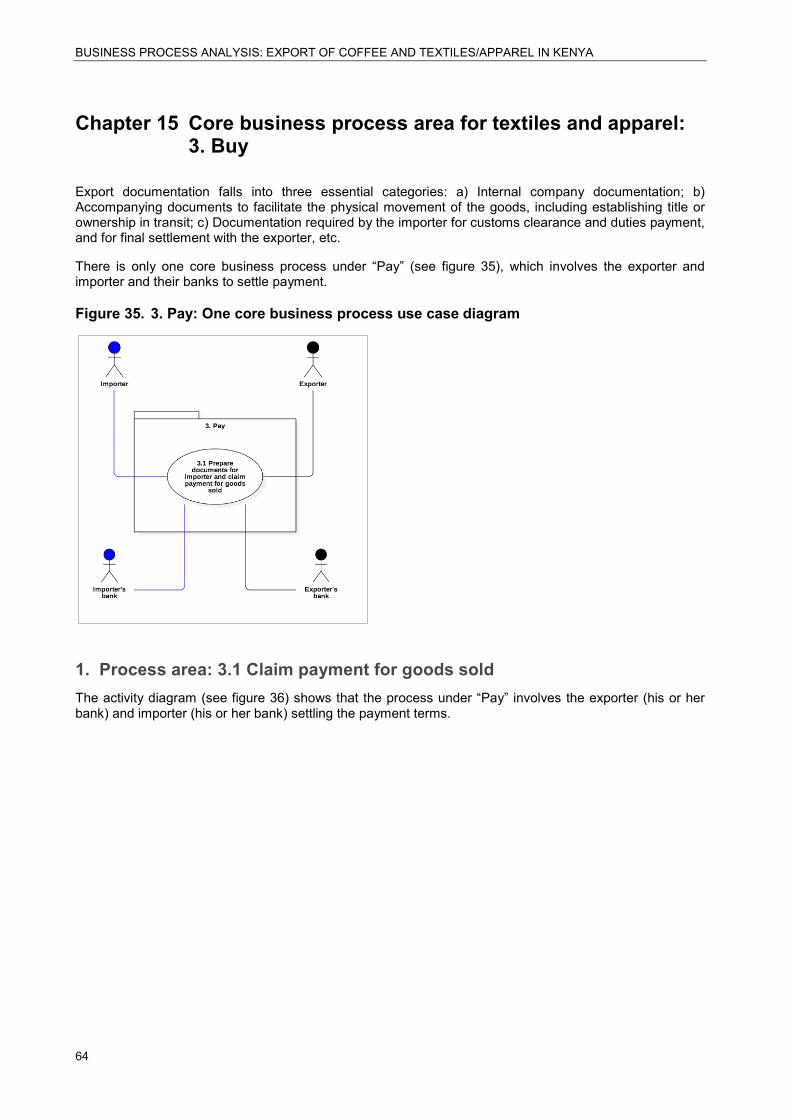
BUSINESS PROCESS ANALYSIS: EXPORT OF COFFEE AND TEXTILES/APPAREL IN KENYA
64
Chapter 15 Core business process area for textiles and apparel: 3. Buy
Export documentation falls into three essential categories: a) Internal company documentation; b) Accompanying documents to facilitate the physical movement of the goods, including establishing title or ownership in transit; c) Documentation required by the importer for customs clearance and duties payment, and for final settlement with the exporter, etc.
There is only one core business process under “Pay” (see figure 35), which involves the exporter and importer and their banks to settle payment.
Figure 35. 3. Pay: One core business process use case diagram
1. Process area: 3.1 Claim payment for goods sold The activity diagram (see figure 36) shows that the process under “Pay” involves the exporter (his or her bank) and importer (his or her bank) settling the payment terms.

BUSINESS PROCESS ANALYSIS: EXPORT OF COFFEE AND TEXTILES/APPAREL IN KENYA
65
Figure 36. 3.1 Claim payment for goods sold
Process area 3. Pay Business process 3.1 Prepare documents for the importer and claim payment for goods sold Rules and regulations • Incoterms
Participant • Exporter’s head office • Exporter • Importer
Input The exporter has fulfilled contractual agreement in the sales contract. Requirements for payment against documents.
Activities and associated documentary requirements
3.1.1 The exporter assembles all the following export documents for the importer. 1. Commercial invoice. 2. Packing list. 3. Bill of lading. 4. Cargo insurance (if required by buyer). 5. Customs declaration. 6. Certificate of origin.
3.1.2 The exporter delivers all the documents required for importation and for final payment to the importer. 3.1.3 The importer receives and acknowledges the receipt of import documentation against final payment. 3.1.4 The importer reviews the submitted documents and determines if they are in compliance with the terms and conditions of the sales contract. If not, the importer requests the exporter to amend or provide the missing documents. 3.1.5 The importer transfers the final payment to the exporter’s head office bank. 3.1.6 The exporter’s head office receives payment for the goods.
Output The importer receives documents to complete import formalities. The exporter’s head office receives payment for the goods.
Average time to complete 2–3 working days Cost N/A
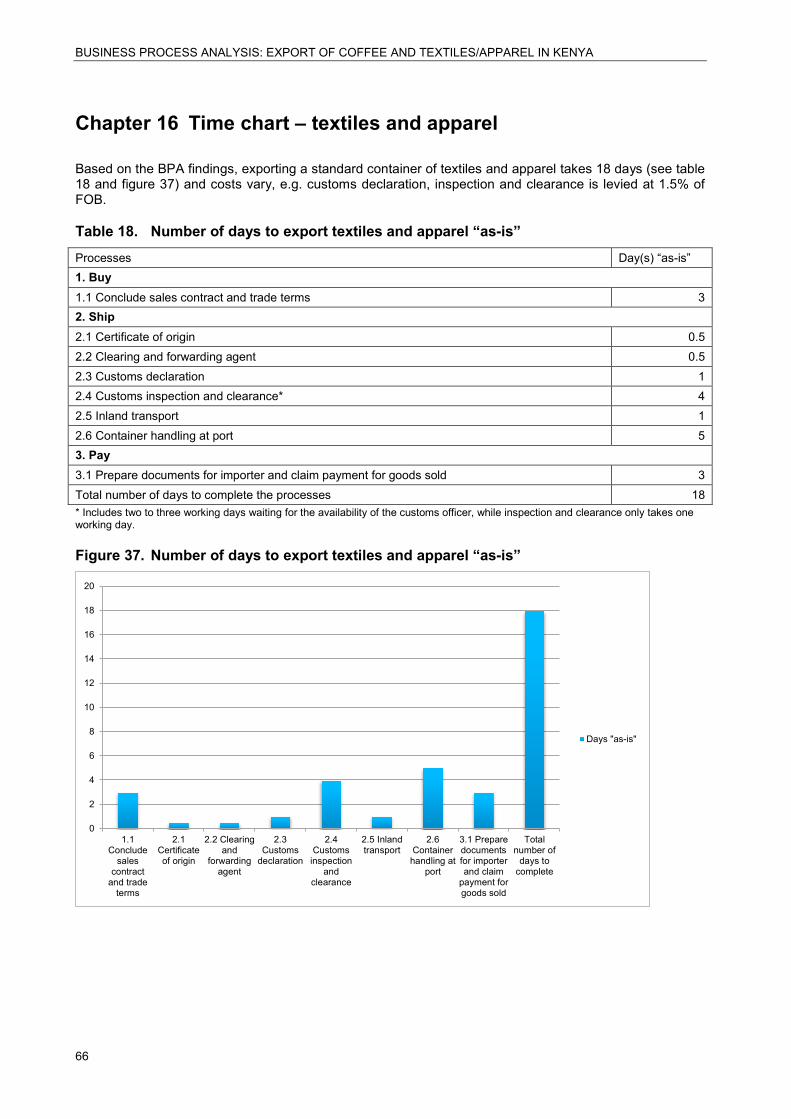
BUSINESS PROCESS ANALYSIS: EXPORT OF COFFEE AND TEXTILES/APPAREL IN KENYA
66
Chapter 16 Time chart – textiles and apparel
Based on the BPA findings, exporting a standard container of textiles and apparel takes 18 days (see table 18 and figure 37) and costs vary, e.g. customs declaration, inspection and clearance is levied at 1.5% of FOB.
Table 18. Number of days to export textiles and apparel “as-is” Processes Day(s) “as-is” 1. Buy 1.1 Conclude sales contract and trade terms 3 2. Ship 2.1 Certificate of origin 0.5 2.2 Clearing and forwarding agent 0.5 2.3 Customs declaration 1 2.4 Customs inspection and clearance* 4 2.5 Inland transport 1 2.6 Container handling at port 5 3. Pay 3.1 Prepare documents for importer and claim payment for goods sold 3 Total number of days to complete the processes 18 * Includes two to three working days waiting for the availability of the customs officer, while inspection and clearance only takes one working day.
Figure 37. Number of days to export textiles and apparel “as-is”
0
2
4
6
8
10
12
14
16
18
20
1.1Conclude
salescontract
and tradeterms
2.1Certificateof origin
2.2 Clearingand
forwardingagent
2.3Customs
declaration
2.4Customsinspection
andclearance
2.5 Inlandtransport
2.6Containerhandling at
port
3.1 Preparedocumentsfor importerand claim
payment forgoods sold
Totalnumber of
days tocomplete
Days "as-is"
BUSINESS PROCESS ANALYSIS: EXPORT OF COFFEE AND TEXTILES/APPAREL IN KENYA
67
Conclusion
The benefits for the exporter that can result from various reforms of trade facilitation-related measures – be it is streamlining or consolidating the number of ministries and agencies’ documents required per transaction, reducing the number of days required to complete the export process, to publish the formal fess, and to reduce informal payments – is relatively dependent on the sector’s scale of political visibility.
Take AGOA as an example. The manufacturer is required to apply for an amendment to the certificate of registration every time changes take place on the business premises, such as change of equipment or machinery, or in production capacity, etc. if the manufacturer still expects to export goods under the AGOA scheme. The manufacturer shall undertake to preserve all records relating to the production of the goods to be exported, such as records of the number of workers, actual quantities produced, work that is subcontracted (outside the manufacturer’s premises) and the machinery used. The records should be kept for a period of at least seven years. Whether this requirement is imposed by the rules written into AGOA or by the Government of Kenya, it appears excessive and the BPA study team did not do a detailed analysis of the Act.
Key export certificates, such as the certificate of origin (CO) to comply with AGOA when exporting textiles and apparel to the US, could take longer than two or three days to obtain and can only be issued by the CSD after all the export documents have passed the screening by KAMEA.
For coffee exporters, two COs are required to export coffee from Kenya (from CSD and CD). The CO issued by the CD on behalf of the ICO must be signed by a customs officer at the port of exit and does not offer preferential treatment to the exporter. However, as a member of the ICO, Kenya is bound by Article 33 of the International Coffee Agreement 2007, which stipulates the requirements for the certificates of origin as per box 1.
Moreover, to transport coffee within Kenya, traders must apply for two CMPs (the first to transport coffee from the miller’s to exporter’s warehouse and the second for transport from the exporter’s warehouse to the port), which cannot be used between 6 p.m. and 6 a.m. The permit is non-transferable from vehicle to vehicle; therefore, in the event that the vehicle is disabled due to an accident or mechanical breakdown, the exporter needs to apply for a new permit in order to continue the journey to the final destination.
Coffee exporters take 90 working days to obtain the coffee dealer license, which must be renewed yearly and costs US$ 500 plus US$ 10 application fees. This is a major constraint even for seasoned exporters, let alone the new entry for which it takes time to prospect for buyers to generate business.
The inefficiency of the multimodal transportation network (i.e. port, railways and road transport services) deprives the exporter of the option to use more cost-effective transport (i.e. railways) when exporting non-
Box 1. Article 33 of the International Coffee Agreement 2007 • In order to facilitate the collection of statistics on the international coffee trade and to ascertain the
quantities of coffee, which have been exported by each exporting Member, the Organization shall establish a system of Certificates of Origin, governed by rules approved by the Council.
• Every export of coffee by an exporting Member shall be covered by a valid Certificate of Origin. Certificates of Origin shall be issued, in accordance with the rules established by the Council, by a qualified agency chosen by the Member and approved by the Organization.
• Each exporting Member shall notify the Organization of the government or non-governmental agency, which is to perform the functions specified in paragraph (2) of this Article. The Organization shall specifically approve a non-governmental agency in accordance with the rules approved by the Council.
• An exporting Member, on an exceptional basis and with proper justification, may submit, for approval by the Council, a request to allow data conveyed in Certificates of Origin concerning its exports of coffee to be transmitted to the Organization using an alternative method.
BUSINESS PROCESS ANALYSIS: EXPORT OF COFFEE AND TEXTILES/APPAREL IN KENYA
68
time-sensitive commodities. This hampers the ability of local manufacturers to access and be competitive in regional and global markets. Kenyan road transport rate of KSh 4/kg/km is way above the global competitive road transport rate of KSh 1/kg/km. Similarly for rail transport, where the Kenyan applicable tariff is US$ 5.8c/km when compared with the competitive tariff of US$ 2.6c/km.15
The BPA study team omitted the cotton sector from the analysis for the reason that, at the time of the study, Kenya is a net importer of cotton fibre from neighbouring countries, in particular Tanzania, to feed it the textile and apparel industry.16
The BPA study team omitted the cotton sector from the analysis for the reason that, at the time of the analysis, Kenya is a net importer of cotton fibre from neighbouring countries, in particular Tanzania, to supply its textile and apparel industry.17
15 Policy research on the Kenyan Textile Industry “Findings and Recommendations”, ACTIF, June 2013. 16 Ibid. 17 Ibid.
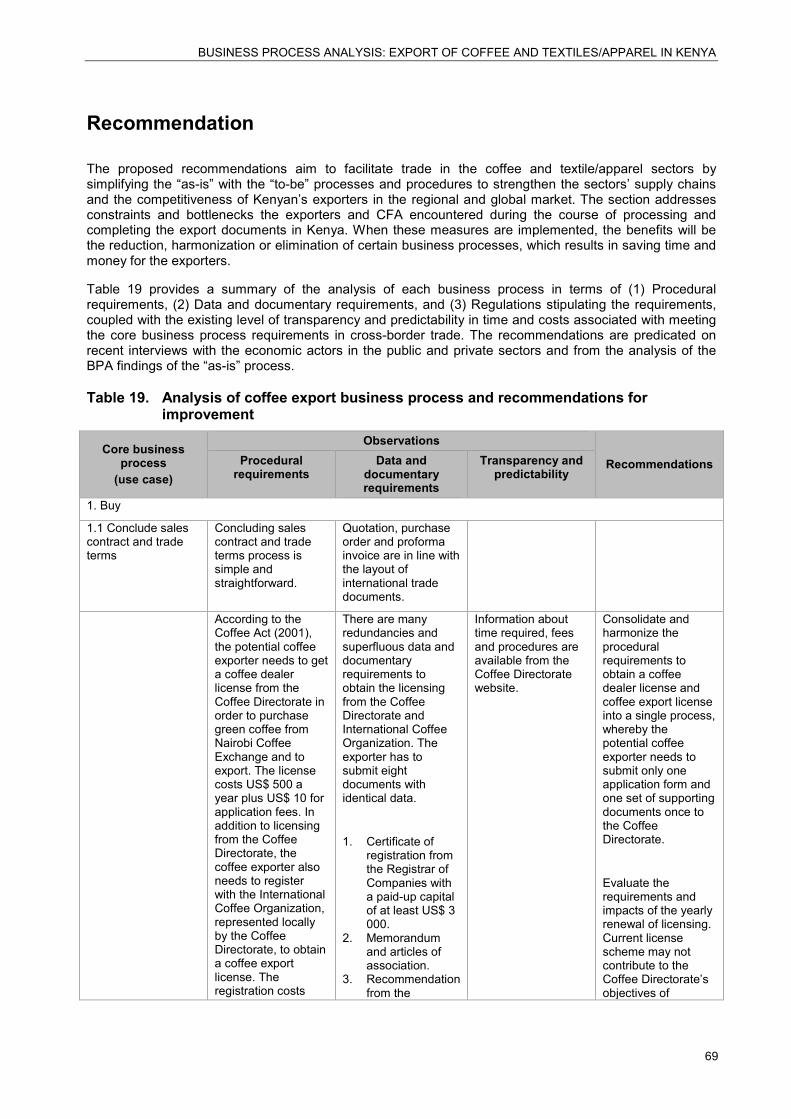
BUSINESS PROCESS ANALYSIS: EXPORT OF COFFEE AND TEXTILES/APPAREL IN KENYA
69
Recommendation
The proposed recommendations aim to facilitate trade in the coffee and textile/apparel sectors by simplifying the “as-is” with the “to-be” processes and procedures to strengthen the sectors’ supply chains and the competitiveness of Kenyan’s exporters in the regional and global market. The section addresses constraints and bottlenecks the exporters and CFA encountered during the course of processing and completing the export documents in Kenya. When these measures are implemented, the benefits will be the reduction, harmonization or elimination of certain business processes, which results in saving time and money for the exporters.
Table 19 provides a summary of the analysis of each business process in terms of (1) Procedural requirements, (2) Data and documentary requirements, and (3) Regulations stipulating the requirements, coupled with the existing level of transparency and predictability in time and costs associated with meeting the core business process requirements in cross-border trade. The recommendations are predicated on recent interviews with the economic actors in the public and private sectors and from the analysis of the BPA findings of the “as-is” process.
Table 19. Analysis of coffee export business process and recommendations for improvement
Core business process
(use case)
Observations
Recommendations Procedural requirements
Data and documentary requirements
Transparency and predictability
1. Buy
1.1 Conclude sales contract and trade terms
Concluding sales contract and trade terms process is simple and straightforward.
Quotation, purchase order and proforma invoice are in line with the layout of international trade documents.
According to the Coffee Act (2001), the potential coffee exporter needs to get a coffee dealer license from the Coffee Directorate in order to purchase green coffee from Nairobi Coffee Exchange and to export. The license costs US$ 500 a year plus US$ 10 for application fees. In addition to licensing from the Coffee Directorate, the coffee exporter also needs to register with the International Coffee Organization, represented locally by the Coffee Directorate, to obtain a coffee export license. The registration costs
There are many redundancies and superfluous data and documentary requirements to obtain the licensing from the Coffee Directorate and International Coffee Organization. The exporter has to submit eight documents with identical data.
1. Certificate of registration from the Registrar of Companies with a paid-up capital of at least US$ 3 000.
2. Memorandum and articles of association.
3. Recommendation from the
Information about time required, fees and procedures are available from the Coffee Directorate website.
Consolidate and harmonize the procedural requirements to obtain a coffee dealer license and coffee export license into a single process, whereby the potential coffee exporter needs to submit only one application form and one set of supporting documents once to the Coffee Directorate.
Evaluate the requirements and impacts of the yearly renewal of licensing. Current license scheme may not contribute to the Coffee Directorate’s objectives of

BUSINESS PROCESS ANALYSIS: EXPORT OF COFFEE AND TEXTILES/APPAREL IN KENYA
70
Core business process
(use case)
Observations
Recommendations Procedural requirements
Data and documentary requirements
Transparency and predictability
US$ 20.
The license and registration must be renewed every year at the same costs.
Regulations governing the coffee sector act as trade barriers for potential new coffee traders.
company’s bank on the suitability of the company trading in coffee export. A suitable letter should show the financial status of the company as within or above its paid-up capital.
4. Membership of the MCTA with relevant fees paid up and other requirements fulfilled.
5. Retain the services of a coffee expert who will give written consent in the undertaking.
6. Insurance performance bond of US$ 5 000 in favour of CD.
7. Tax compliance certificate from KRA.
8. Certificate of good conduct for all directors from the Directorate of Criminal Investigation.
facilitating trade, ensuring fair competition and creating a market-friendly mechanism for the sector, but instead may harm the coffee exporter; therefore, consider.
1. Renew coffee dealer license every two years at the same cost.
2. Renew coffee dealer license yearly, but at a marginal cost (US$ 50–US$ 100).
3. Reduce the time required to issue license to 30 days from 90 days.
Consider eliminating data and documentary requirements when applying for licensing and registration; i.e. item numbers 3, 5 and 8.
Consider incorporating e-payment in the online application system.
2. Ship
2.1 Coffee movement permit (miller to exporter)
Procedural requirements to obtain a coffee movement permit are simple; however, physically transporting the coffee is complicated and restricted. The permit is free.
The permit is not
Data the exporter needs to provide to the Coffee Directorate includes: 1. Vehicle plate
number. 2. Drivers’
identities. 3. From and to
warehouse. 4. Packing list
(coffee grades
Regulations regarding coffee movement permits are not available either online or in printed form.
The rigidity of the times and means allowed for coffee’s movement rob the exporter of the flexibility and efficiency to choose when and how to conduct his/her trade; therefore consider:
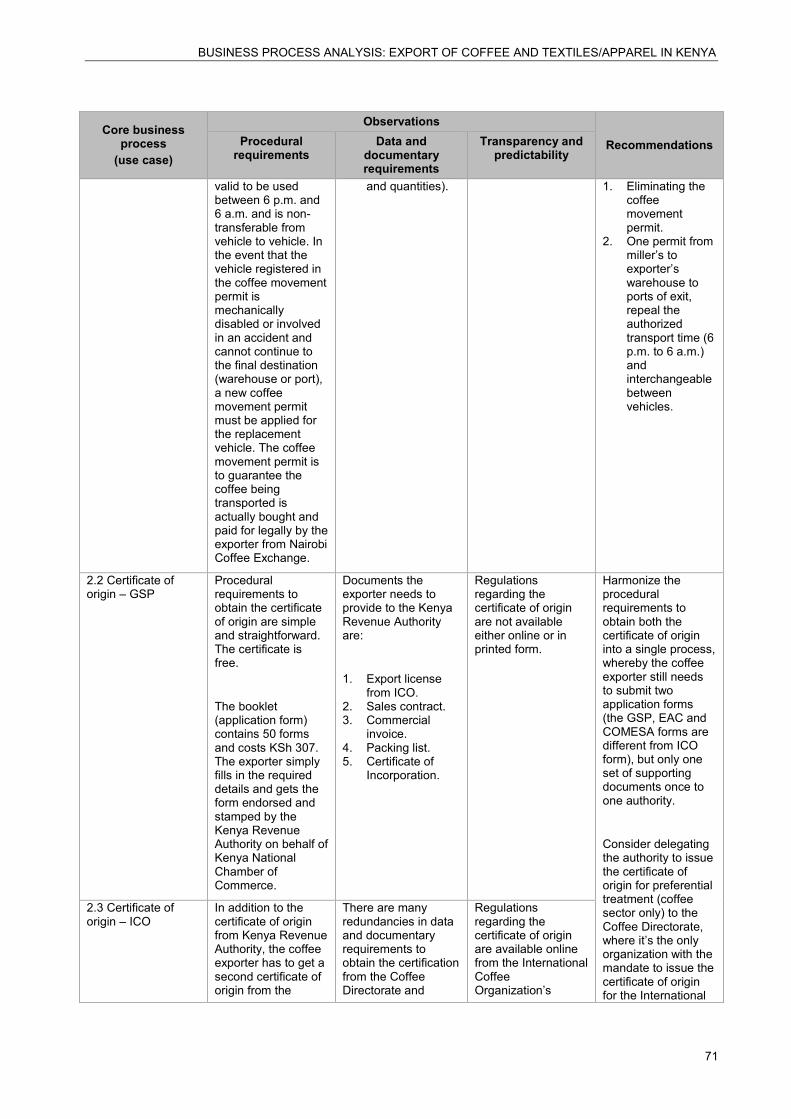
BUSINESS PROCESS ANALYSIS: EXPORT OF COFFEE AND TEXTILES/APPAREL IN KENYA
71
Core business process
(use case)
Observations
Recommendations Procedural requirements
Data and documentary requirements
Transparency and predictability
valid to be used between 6 p.m. and 6 a.m. and is non-transferable from vehicle to vehicle. In the event that the vehicle registered in the coffee movement permit is mechanically disabled or involved in an accident and cannot continue to the final destination (warehouse or port), a new coffee movement permit must be applied for the replacement vehicle. The coffee movement permit is to guarantee the coffee being transported is actually bought and paid for legally by the exporter from Nairobi Coffee Exchange.
and quantities).
1. Eliminating the coffee movement permit.
2. One permit from miller’s to exporter’s warehouse to ports of exit, repeal the authorized transport time (6 p.m. to 6 a.m.) and interchangeable between vehicles.
2.2 Certificate of origin – GSP
Procedural requirements to obtain the certificate of origin are simple and straightforward. The certificate is free.
The booklet (application form) contains 50 forms and costs KSh 307. The exporter simply fills in the required details and gets the form endorsed and stamped by the Kenya Revenue Authority on behalf of Kenya National Chamber of Commerce.
Documents the exporter needs to provide to the Kenya Revenue Authority are:
1. Export license from ICO.
2. Sales contract. 3. Commercial
invoice. 4. Packing list. 5. Certificate of
Incorporation.
Regulations regarding the certificate of origin are not available either online or in printed form.
Harmonize the procedural requirements to obtain both the certificate of origin into a single process, whereby the coffee exporter still needs to submit two application forms (the GSP, EAC and COMESA forms are different from ICO form), but only one set of supporting documents once to one authority.
Consider delegating the authority to issue the certificate of origin for preferential treatment (coffee sector only) to the Coffee Directorate, where it’s the only organization with the mandate to issue the certificate of origin for the International
2.3 Certificate of origin – ICO
In addition to the certificate of origin from Kenya Revenue Authority, the coffee exporter has to get a second certificate of origin from the
There are many redundancies in data and documentary requirements to obtain the certification from the Coffee Directorate and
Regulations regarding the certificate of origin are available online from the International Coffee Organization’s
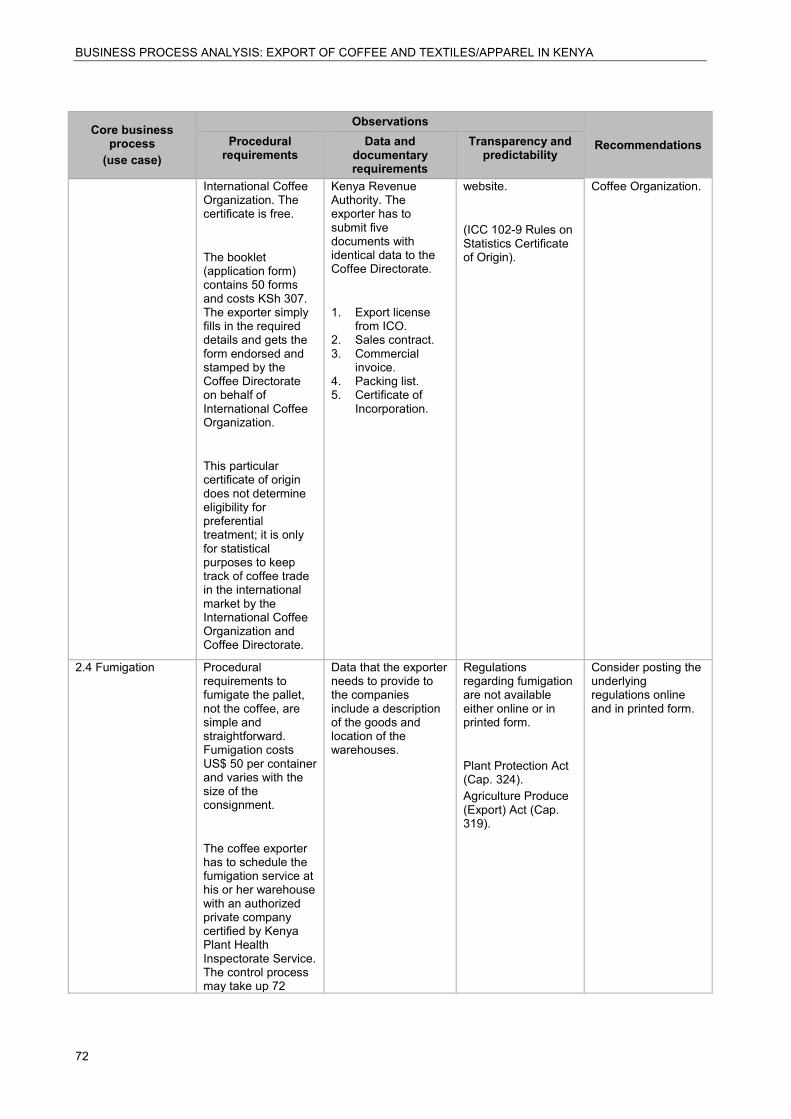
BUSINESS PROCESS ANALYSIS: EXPORT OF COFFEE AND TEXTILES/APPAREL IN KENYA
72
Core business process
(use case)
Observations
Recommendations Procedural requirements
Data and documentary requirements
Transparency and predictability
International Coffee Organization. The certificate is free.
The booklet (application form) contains 50 forms and costs KSh 307. The exporter simply fills in the required details and gets the form endorsed and stamped by the Coffee Directorate on behalf of International Coffee Organization.
This particular certificate of origin does not determine eligibility for preferential treatment; it is only for statistical purposes to keep track of coffee trade in the international market by the International Coffee Organization and Coffee Directorate.
Kenya Revenue Authority. The exporter has to submit five documents with identical data to the Coffee Directorate.
1. Export license from ICO.
2. Sales contract. 3. Commercial
invoice. 4. Packing list. 5. Certificate of
Incorporation.
website.
(ICC 102-9 Rules on Statistics Certificate of Origin).
Coffee Organization.
2.4 Fumigation Procedural requirements to fumigate the pallet, not the coffee, are simple and straightforward. Fumigation costs US$ 50 per container and varies with the size of the consignment.
The coffee exporter has to schedule the fumigation service at his or her warehouse with an authorized private company certified by Kenya Plant Health Inspectorate Service. The control process may take up 72
Data that the exporter needs to provide to the companies include a description of the goods and location of the warehouses.
Regulations regarding fumigation are not available either online or in printed form.
Plant Protection Act (Cap. 324). Agriculture Produce (Export) Act (Cap. 319).
Consider posting the underlying regulations online and in printed form.
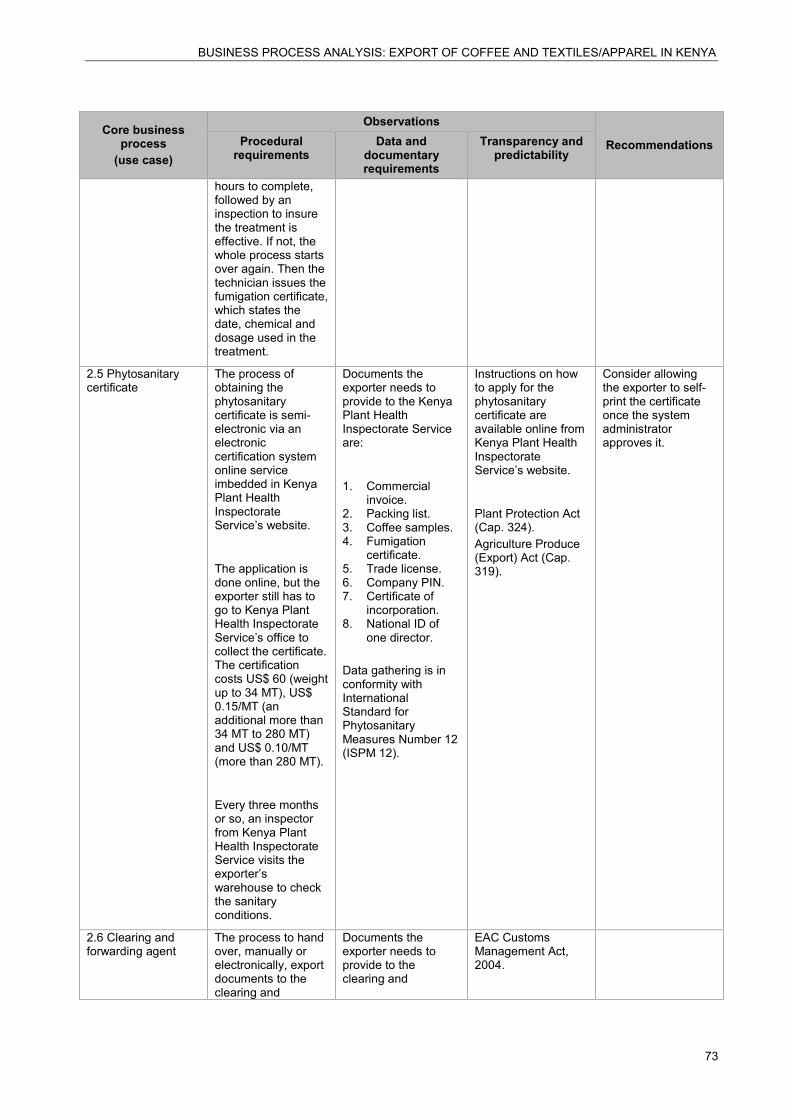
BUSINESS PROCESS ANALYSIS: EXPORT OF COFFEE AND TEXTILES/APPAREL IN KENYA
73
Core business process
(use case)
Observations
Recommendations Procedural requirements
Data and documentary requirements
Transparency and predictability
hours to complete, followed by an inspection to insure the treatment is effective. If not, the whole process starts over again. Then the technician issues the fumigation certificate, which states the date, chemical and dosage used in the treatment.
2.5 Phytosanitary certificate
The process of obtaining the phytosanitary certificate is semi-electronic via an electronic certification system online service imbedded in Kenya Plant Health Inspectorate Service’s website.
The application is done online, but the exporter still has to go to Kenya Plant Health Inspectorate Service’s office to collect the certificate. The certification costs US$ 60 (weight up to 34 MT), US$ 0.15/MT (an additional more than 34 MT to 280 MT) and US$ 0.10/MT (more than 280 MT).
Every three months or so, an inspector from Kenya Plant Health Inspectorate Service visits the exporter’s warehouse to check the sanitary conditions.
Documents the exporter needs to provide to the Kenya Plant Health Inspectorate Service are:
1. Commercial invoice.
2. Packing list. 3. Coffee samples. 4. Fumigation
certificate. 5. Trade license. 6. Company PIN. 7. Certificate of
incorporation. 8. National ID of
one director. Data gathering is in conformity with International Standard for Phytosanitary Measures Number 12 (ISPM 12).
Instructions on how to apply for the phytosanitary certificate are available online from Kenya Plant Health Inspectorate Service’s website.
Plant Protection Act (Cap. 324). Agriculture Produce (Export) Act (Cap. 319).
Consider allowing the exporter to self-print the certificate once the system administrator approves it.
2.6 Clearing and forwarding agent
The process to hand over, manually or electronically, export documents to the clearing and
Documents the exporter needs to provide to the clearing and
EAC Customs Management Act, 2004.
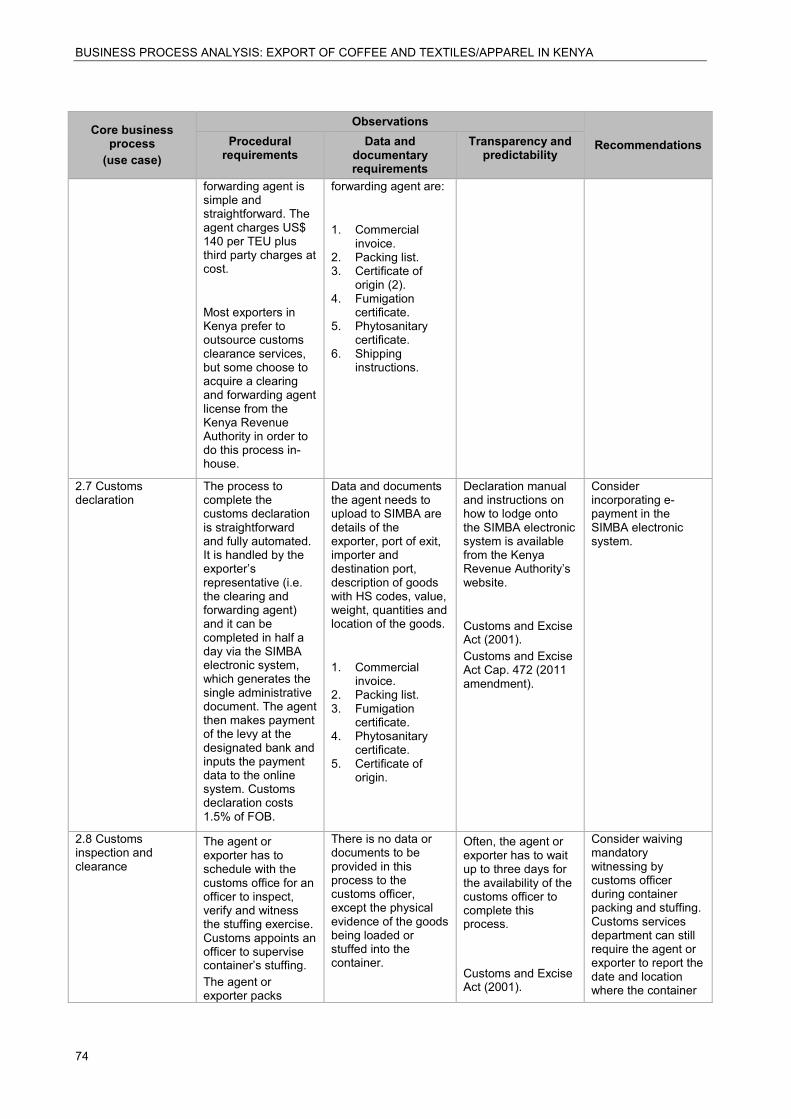
BUSINESS PROCESS ANALYSIS: EXPORT OF COFFEE AND TEXTILES/APPAREL IN KENYA
74
Core business process
(use case)
Observations
Recommendations Procedural requirements
Data and documentary requirements
Transparency and predictability
forwarding agent is simple and straightforward. The agent charges US$ 140 per TEU plus third party charges at cost.
Most exporters in Kenya prefer to outsource customs clearance services, but some choose to acquire a clearing and forwarding agent license from the Kenya Revenue Authority in order to do this process in-house.
forwarding agent are:
1. Commercial invoice.
2. Packing list. 3. Certificate of
origin (2). 4. Fumigation
certificate. 5. Phytosanitary
certificate. 6. Shipping
instructions.
2.7 Customs declaration
The process to complete the customs declaration is straightforward and fully automated. It is handled by the exporter’s representative (i.e. the clearing and forwarding agent) and it can be completed in half a day via the SIMBA electronic system, which generates the single administrative document. The agent then makes payment of the levy at the designated bank and inputs the payment data to the online system. Customs declaration costs 1.5% of FOB.
Data and documents the agent needs to upload to SIMBA are details of the exporter, port of exit, importer and destination port, description of goods with HS codes, value, weight, quantities and location of the goods.
1. Commercial invoice.
2. Packing list. 3. Fumigation
certificate. 4. Phytosanitary
certificate. 5. Certificate of
origin.
Declaration manual and instructions on how to lodge onto the SIMBA electronic system is available from the Kenya Revenue Authority’s website.
Customs and Excise Act (2001). Customs and Excise Act Cap. 472 (2011 amendment).
Consider incorporating e-payment in the SIMBA electronic system.
2.8 Customs inspection and clearance
The agent or exporter has to schedule with the customs office for an officer to inspect, verify and witness the stuffing exercise. Customs appoints an officer to supervise container’s stuffing. The agent or exporter packs
There is no data or documents to be provided in this process to the customs officer, except the physical evidence of the goods being loaded or stuffed into the container.
Often, the agent or exporter has to wait up to three days for the availability of the customs officer to complete this process. Customs and Excise Act (2001).
Consider waiving mandatory witnessing by customs officer during container packing and stuffing. Customs services department can still require the agent or exporter to report the date and location where the container
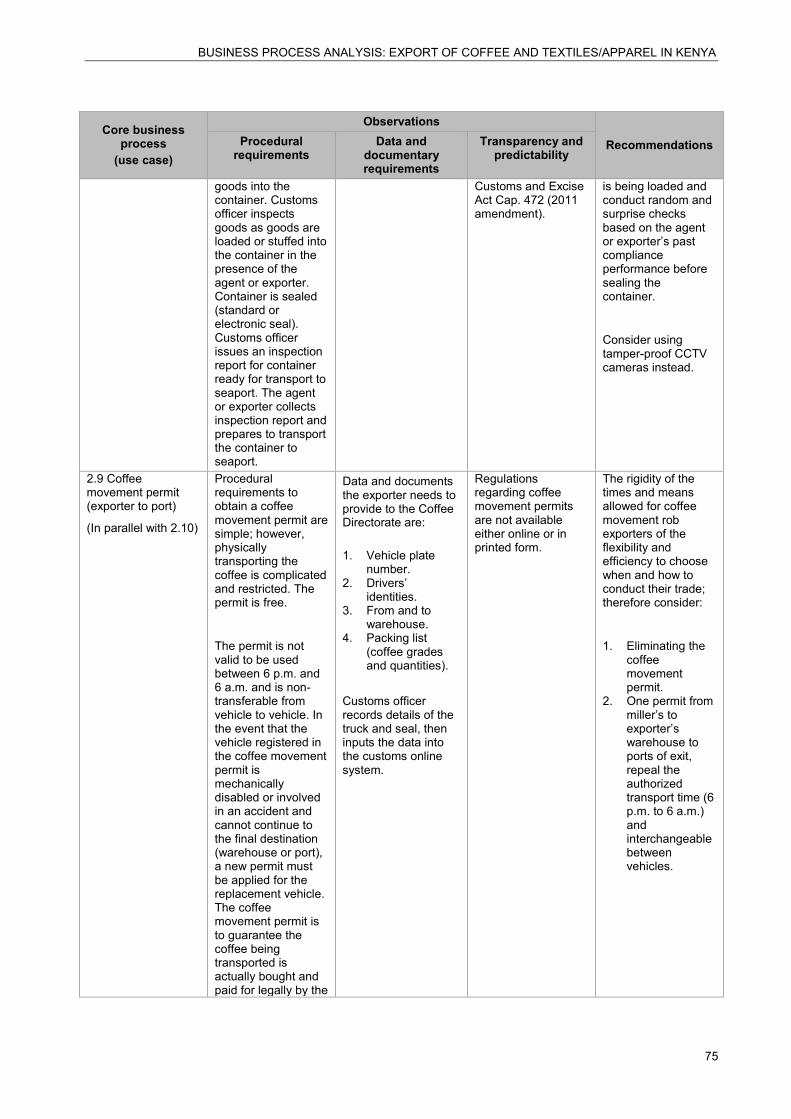
BUSINESS PROCESS ANALYSIS: EXPORT OF COFFEE AND TEXTILES/APPAREL IN KENYA
75
Core business process
(use case)
Observations
Recommendations Procedural requirements
Data and documentary requirements
Transparency and predictability
goods into the container. Customs officer inspects goods as goods are loaded or stuffed into the container in the presence of the agent or exporter. Container is sealed (standard or electronic seal). Customs officer issues an inspection report for container ready for transport to seaport. The agent or exporter collects inspection report and prepares to transport the container to seaport.
Customs and Excise Act Cap. 472 (2011 amendment).
is being loaded and conduct random and surprise checks based on the agent or exporter’s past compliance performance before sealing the container.
Consider using tamper-proof CCTV cameras instead.
2.9 Coffee movement permit (exporter to port)
(In parallel with 2.10)
Procedural requirements to obtain a coffee movement permit are simple; however, physically transporting the coffee is complicated and restricted. The permit is free.
The permit is not valid to be used between 6 p.m. and 6 a.m. and is non-transferable from vehicle to vehicle. In the event that the vehicle registered in the coffee movement permit is mechanically disabled or involved in an accident and cannot continue to the final destination (warehouse or port), a new permit must be applied for the replacement vehicle. The coffee movement permit is to guarantee the coffee being transported is actually bought and paid for legally by the
Data and documents the exporter needs to provide to the Coffee Directorate are: 1. Vehicle plate
number. 2. Drivers’
identities. 3. From and to
warehouse. 4. Packing list
(coffee grades and quantities).
Customs officer records details of the truck and seal, then inputs the data into the customs online system.
Regulations regarding coffee movement permits are not available either online or in printed form.
The rigidity of the times and means allowed for coffee movement rob exporters of the flexibility and efficiency to choose when and how to conduct their trade; therefore consider:
1. Eliminating the coffee movement permit.
2. One permit from miller’s to exporter’s warehouse to ports of exit, repeal the authorized transport time (6 p.m. to 6 a.m.) and interchangeable between vehicles.
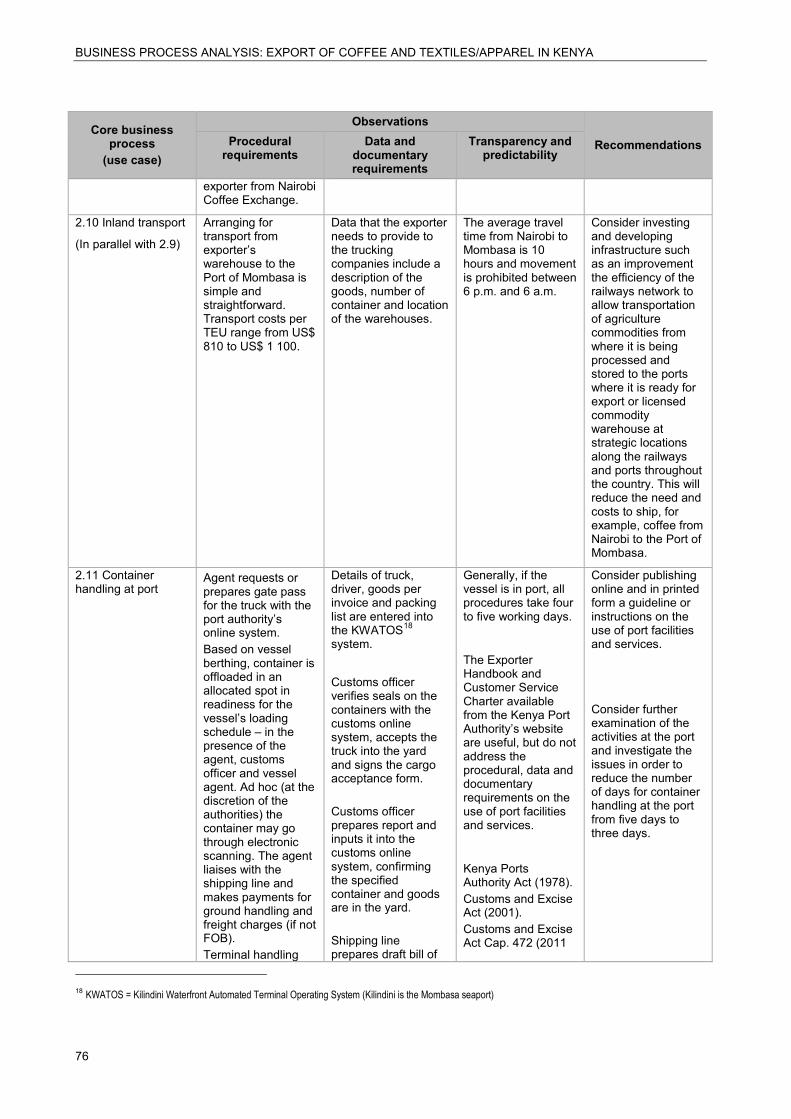
BUSINESS PROCESS ANALYSIS: EXPORT OF COFFEE AND TEXTILES/APPAREL IN KENYA
76
Core business process
(use case)
Observations
Recommendations Procedural requirements
Data and documentary requirements
Transparency and predictability
exporter from Nairobi Coffee Exchange.
2.10 Inland transport
(In parallel with 2.9)
Arranging for transport from exporter’s warehouse to the Port of Mombasa is simple and straightforward. Transport costs per TEU range from US$ 810 to US$ 1 100.
Data that the exporter needs to provide to the trucking companies include a description of the goods, number of container and location of the warehouses.
The average travel time from Nairobi to Mombasa is 10 hours and movement is prohibited between 6 p.m. and 6 a.m.
Consider investing and developing infrastructure such as an improvement the efficiency of the railways network to allow transportation of agriculture commodities from where it is being processed and stored to the ports where it is ready for export or licensed commodity warehouse at strategic locations along the railways and ports throughout the country. This will reduce the need and costs to ship, for example, coffee from Nairobi to the Port of Mombasa.
2.11 Container handling at port
Agent requests or prepares gate pass for the truck with the port authority’s online system. Based on vessel berthing, container is offloaded in an allocated spot in readiness for the vessel’s loading schedule – in the presence of the agent, customs officer and vessel agent. Ad hoc (at the discretion of the authorities) the container may go through electronic scanning. The agent liaises with the shipping line and makes payments for ground handling and freight charges (if not FOB). Terminal handling
Details of truck, driver, goods per invoice and packing list are entered into the KWATOS18 system.
Customs officer verifies seals on the containers with the customs online system, accepts the truck into the yard and signs the cargo acceptance form. Customs officer prepares report and inputs it into the customs online system, confirming the specified container and goods are in the yard. Shipping line prepares draft bill of
Generally, if the vessel is in port, all procedures take four to five working days.
The Exporter Handbook and Customer Service Charter available from the Kenya Port Authority’s website are useful, but do not address the procedural, data and documentary requirements on the use of port facilities and services.
Kenya Ports Authority Act (1978). Customs and Excise Act (2001). Customs and Excise Act Cap. 472 (2011
Consider publishing online and in printed form a guideline or instructions on the use of port facilities and services.
Consider further examination of the activities at the port and investigate the issues in order to reduce the number of days for container handling at the port from five days to three days.
18 KWATOS = Kilindini Waterfront Automated Terminal Operating System (Kilindini is the Mombasa seaport)
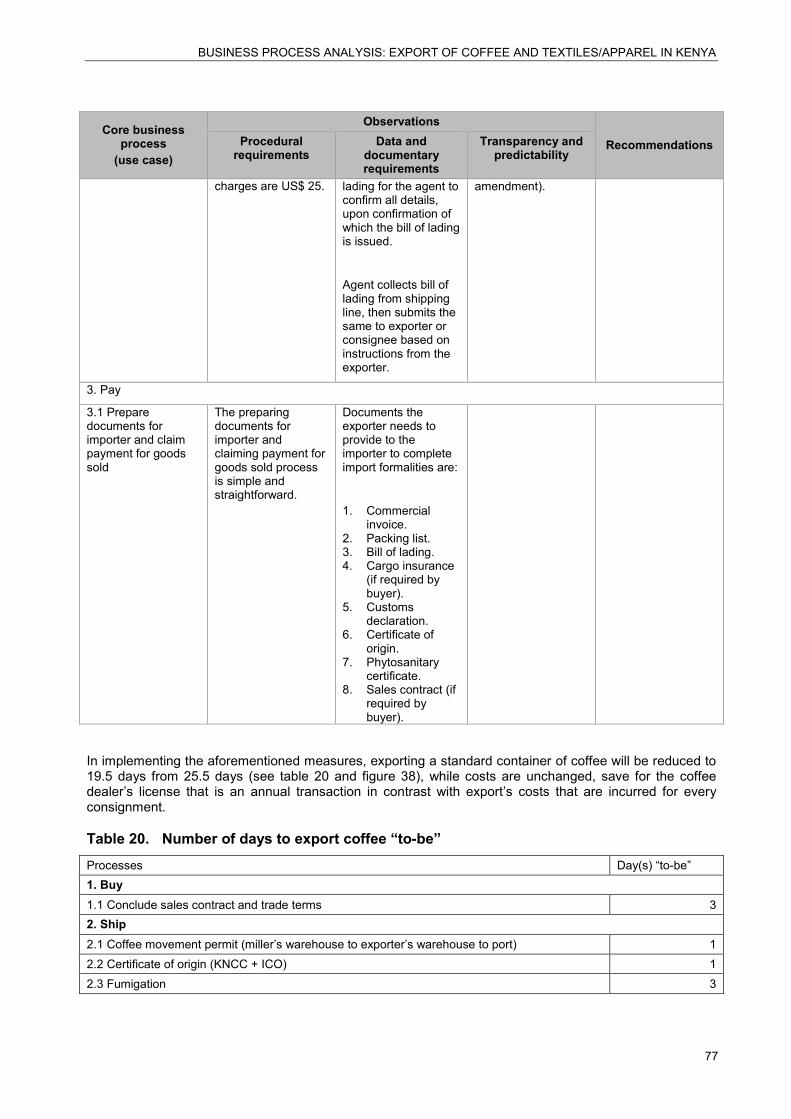
BUSINESS PROCESS ANALYSIS: EXPORT OF COFFEE AND TEXTILES/APPAREL IN KENYA
77
Core business process
(use case)
Observations
Recommendations Procedural requirements
Data and documentary requirements
Transparency and predictability
charges are US$ 25. lading for the agent to confirm all details, upon confirmation of which the bill of lading is issued.
Agent collects bill of lading from shipping line, then submits the same to exporter or consignee based on instructions from the exporter.
amendment).
3. Pay
3.1 Prepare documents for importer and claim payment for goods sold
The preparing documents for importer and claiming payment for goods sold process is simple and straightforward.
Documents the exporter needs to provide to the importer to complete import formalities are:
1. Commercial invoice.
2. Packing list. 3. Bill of lading. 4. Cargo insurance
(if required by buyer).
5. Customs declaration.
6. Certificate of origin.
7. Phytosanitary certificate.
8. Sales contract (if required by buyer).
In implementing the aforementioned measures, exporting a standard container of coffee will be reduced to 19.5 days from 25.5 days (see table 20 and figure 38), while costs are unchanged, save for the coffee dealer’s license that is an annual transaction in contrast with export’s costs that are incurred for every consignment.
Table 20. Number of days to export coffee “to-be” Processes Day(s) “to-be” 1. Buy 1.1 Conclude sales contract and trade terms 3 2. Ship 2.1 Coffee movement permit (miller’s warehouse to exporter’s warehouse to port) 1 2.2 Certificate of origin (KNCC + ICO) 1 2.3 Fumigation 3
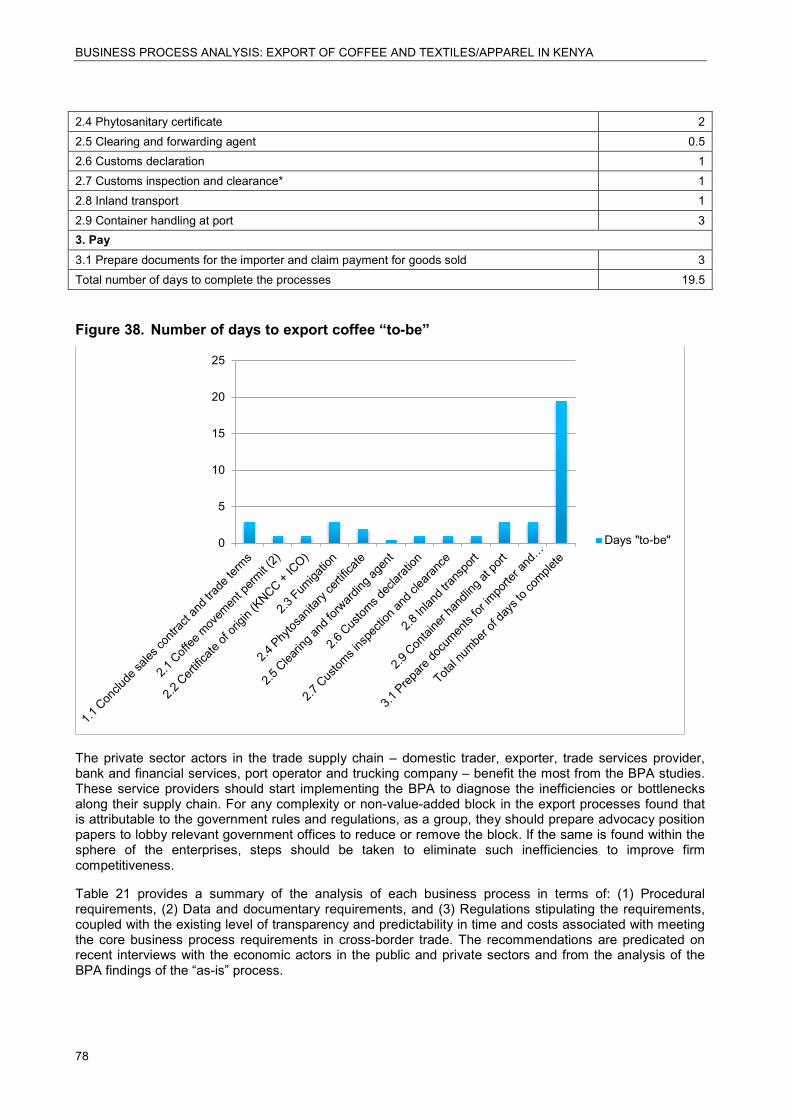
BUSINESS PROCESS ANALYSIS: EXPORT OF COFFEE AND TEXTILES/APPAREL IN KENYA
78
2.4 Phytosanitary certificate 2 2.5 Clearing and forwarding agent 0.5 2.6 Customs declaration 1 2.7 Customs inspection and clearance* 1 2.8 Inland transport 1 2.9 Container handling at port 3 3. Pay 3.1 Prepare documents for the importer and claim payment for goods sold 3 Total number of days to complete the processes 19.5
Figure 38. Number of days to export coffee “to-be”
The private sector actors in the trade supply chain – domestic trader, exporter, trade services provider, bank and financial services, port operator and trucking company – benefit the most from the BPA studies. These service providers should start implementing the BPA to diagnose the inefficiencies or bottlenecks along their supply chain. For any complexity or non-value-added block in the export processes found that is attributable to the government rules and regulations, as a group, they should prepare advocacy position papers to lobby relevant government offices to reduce or remove the block. If the same is found within the sphere of the enterprises, steps should be taken to eliminate such inefficiencies to improve firm competitiveness.
Table 21 provides a summary of the analysis of each business process in terms of: (1) Procedural requirements, (2) Data and documentary requirements, and (3) Regulations stipulating the requirements, coupled with the existing level of transparency and predictability in time and costs associated with meeting the core business process requirements in cross-border trade. The recommendations are predicated on recent interviews with the economic actors in the public and private sectors and from the analysis of the BPA findings of the “as-is” process.
0
5
10
15
20
25
Days "to-be"
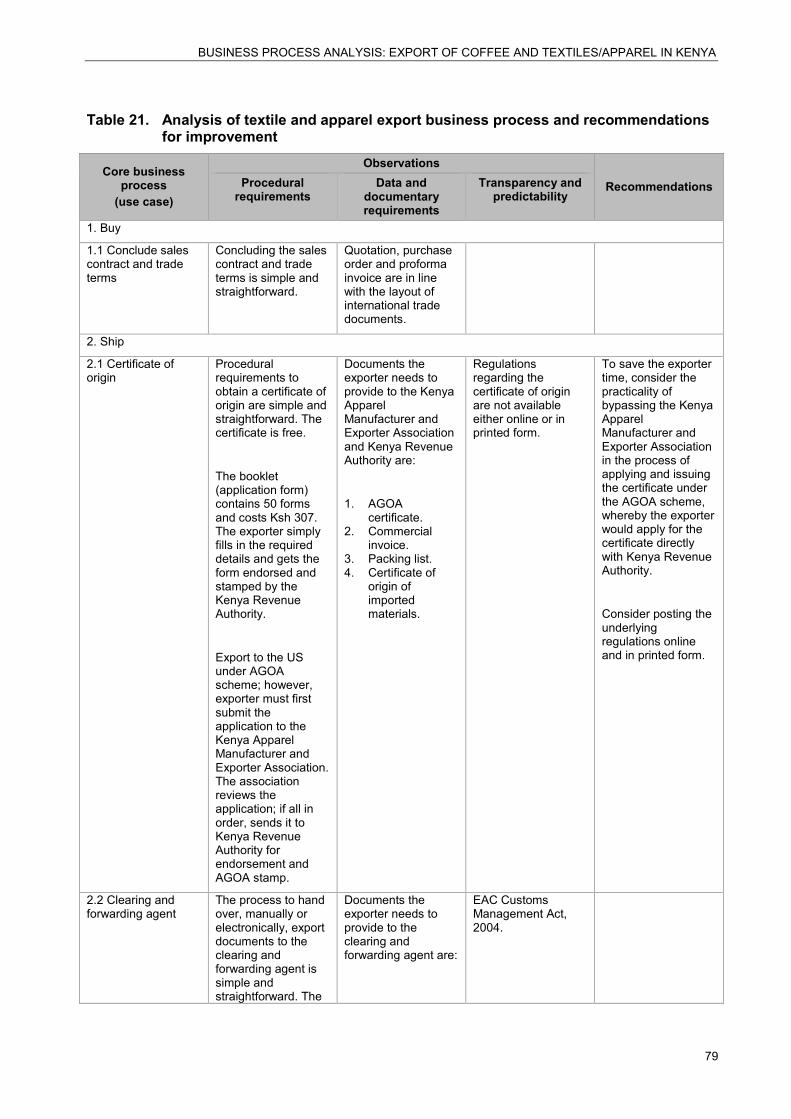
BUSINESS PROCESS ANALYSIS: EXPORT OF COFFEE AND TEXTILES/APPAREL IN KENYA
79
Table 21. Analysis of textile and apparel export business process and recommendations for improvement
Core business process
(use case)
Observations
Recommendations Procedural requirements
Data and documentary requirements
Transparency and predictability
1. Buy
1.1 Conclude sales contract and trade terms
Concluding the sales contract and trade terms is simple and straightforward.
Quotation, purchase order and proforma invoice are in line with the layout of international trade documents.
2. Ship
2.1 Certificate of origin
Procedural requirements to obtain a certificate of origin are simple and straightforward. The certificate is free.
The booklet (application form) contains 50 forms and costs Ksh 307. The exporter simply fills in the required details and gets the form endorsed and stamped by the Kenya Revenue Authority.
Export to the US under AGOA scheme; however, exporter must first submit the application to the Kenya Apparel Manufacturer and Exporter Association. The association reviews the application; if all in order, sends it to Kenya Revenue Authority for endorsement and AGOA stamp.
Documents the exporter needs to provide to the Kenya Apparel Manufacturer and Exporter Association and Kenya Revenue Authority are:
1. AGOA certificate.
2. Commercial invoice.
3. Packing list. 4. Certificate of
origin of imported materials.
Regulations regarding the certificate of origin are not available either online or in printed form.
To save the exporter time, consider the practicality of bypassing the Kenya Apparel Manufacturer and Exporter Association in the process of applying and issuing the certificate under the AGOA scheme, whereby the exporter would apply for the certificate directly with Kenya Revenue Authority.
Consider posting the underlying regulations online and in printed form.
2.2 Clearing and forwarding agent
The process to hand over, manually or electronically, export documents to the clearing and forwarding agent is simple and straightforward. The
Documents the exporter needs to provide to the clearing and forwarding agent are:
EAC Customs Management Act, 2004.
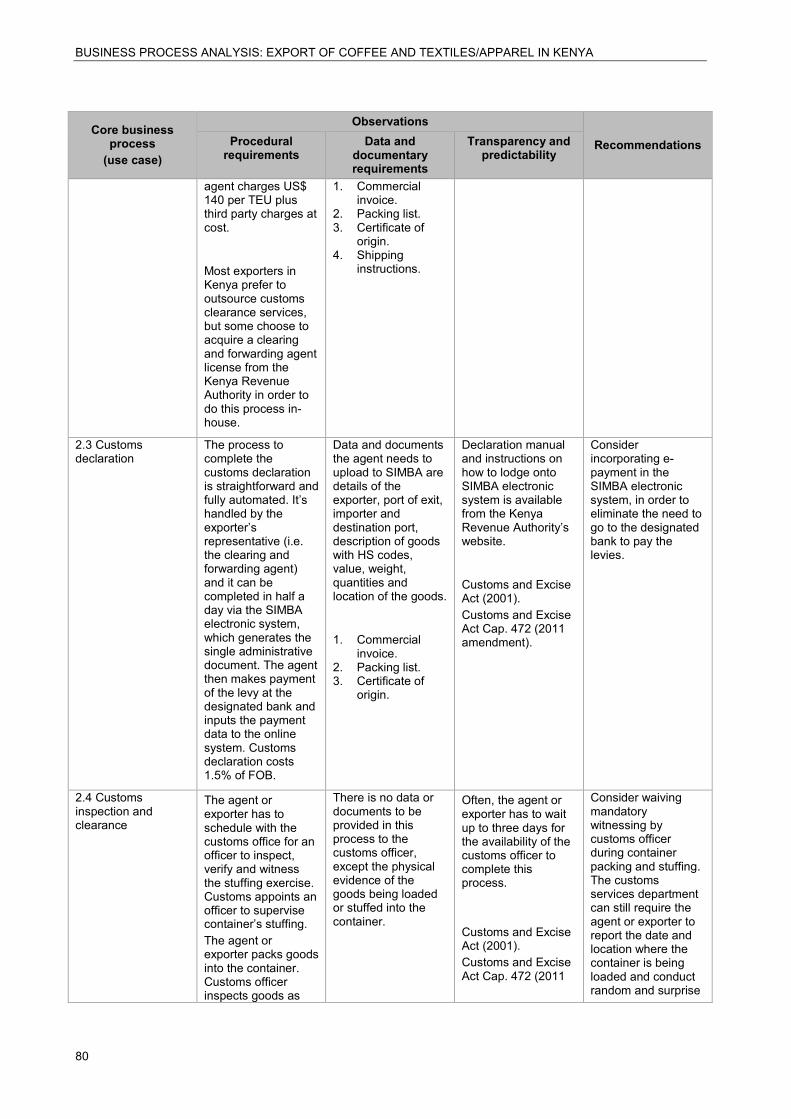
BUSINESS PROCESS ANALYSIS: EXPORT OF COFFEE AND TEXTILES/APPAREL IN KENYA
80
Core business process
(use case)
Observations
Recommendations Procedural requirements
Data and documentary requirements
Transparency and predictability
agent charges US$ 140 per TEU plus third party charges at cost.
Most exporters in Kenya prefer to outsource customs clearance services, but some choose to acquire a clearing and forwarding agent license from the Kenya Revenue Authority in order to do this process in-house.
1. Commercial invoice.
2. Packing list. 3. Certificate of
origin. 4. Shipping
instructions.
2.3 Customs declaration
The process to complete the customs declaration is straightforward and fully automated. It’s handled by the exporter’s representative (i.e. the clearing and forwarding agent) and it can be completed in half a day via the SIMBA electronic system, which generates the single administrative document. The agent then makes payment of the levy at the designated bank and inputs the payment data to the online system. Customs declaration costs 1.5% of FOB.
Data and documents the agent needs to upload to SIMBA are details of the exporter, port of exit, importer and destination port, description of goods with HS codes, value, weight, quantities and location of the goods.
1. Commercial invoice.
2. Packing list. 3. Certificate of
origin.
Declaration manual and instructions on how to lodge onto SIMBA electronic system is available from the Kenya Revenue Authority’s website.
Customs and Excise Act (2001). Customs and Excise Act Cap. 472 (2011 amendment).
Consider incorporating e-payment in the SIMBA electronic system, in order to eliminate the need to go to the designated bank to pay the levies.
2.4 Customs inspection and clearance
The agent or exporter has to schedule with the customs office for an officer to inspect, verify and witness the stuffing exercise. Customs appoints an officer to supervise container’s stuffing. The agent or exporter packs goods into the container. Customs officer inspects goods as
There is no data or documents to be provided in this process to the customs officer, except the physical evidence of the goods being loaded or stuffed into the container.
Often, the agent or exporter has to wait up to three days for the availability of the customs officer to complete this process. Customs and Excise Act (2001). Customs and Excise Act Cap. 472 (2011
Consider waiving mandatory witnessing by customs officer during container packing and stuffing. The customs services department can still require the agent or exporter to report the date and location where the container is being loaded and conduct random and surprise
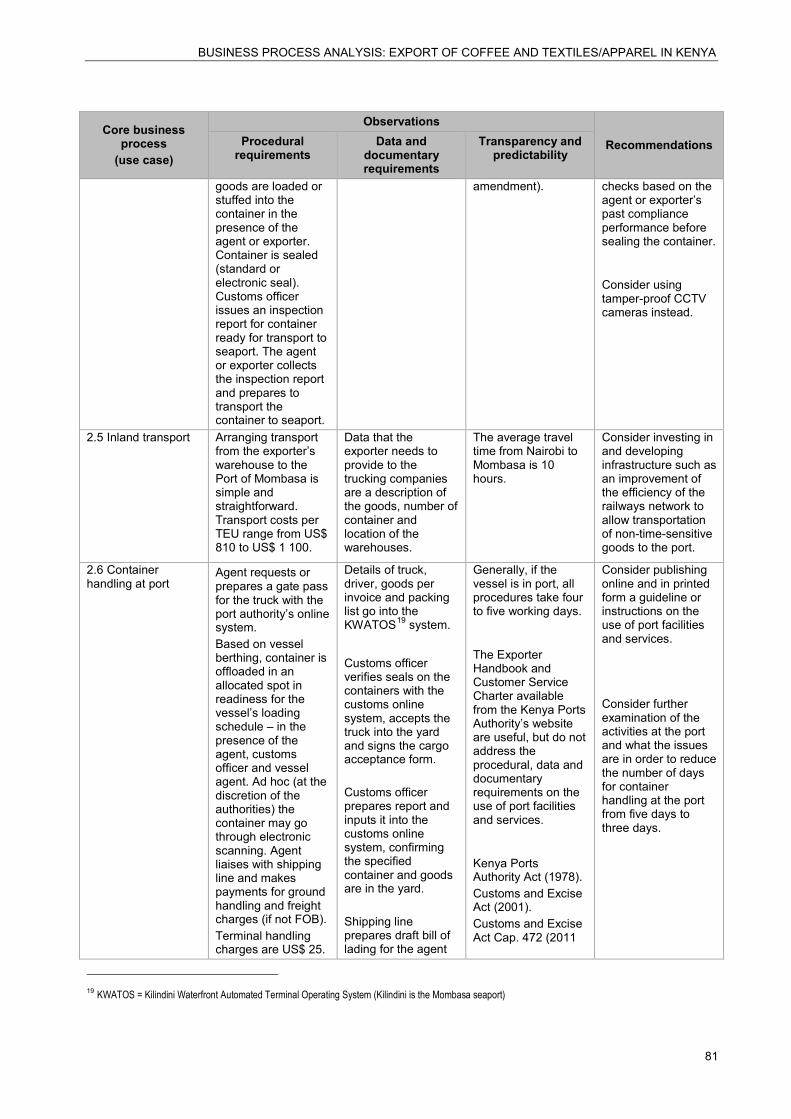
BUSINESS PROCESS ANALYSIS: EXPORT OF COFFEE AND TEXTILES/APPAREL IN KENYA
81
Core business process
(use case)
Observations
Recommendations Procedural requirements
Data and documentary requirements
Transparency and predictability
goods are loaded or stuffed into the container in the presence of the agent or exporter. Container is sealed (standard or electronic seal). Customs officer issues an inspection report for container ready for transport to seaport. The agent or exporter collects the inspection report and prepares to transport the container to seaport.
amendment). checks based on the agent or exporter’s past compliance performance before sealing the container.
Consider using tamper-proof CCTV cameras instead.
2.5 Inland transport Arranging transport from the exporter’s warehouse to the Port of Mombasa is simple and straightforward. Transport costs per TEU range from US$ 810 to US$ 1 100.
Data that the exporter needs to provide to the trucking companies are a description of the goods, number of container and location of the warehouses.
The average travel time from Nairobi to Mombasa is 10 hours.
Consider investing in and developing infrastructure such as an improvement of the efficiency of the railways network to allow transportation of non-time-sensitive goods to the port.
2.6 Container handling at port
Agent requests or prepares a gate pass for the truck with the port authority’s online system. Based on vessel berthing, container is offloaded in an allocated spot in readiness for the vessel’s loading schedule – in the presence of the agent, customs officer and vessel agent. Ad hoc (at the discretion of the authorities) the container may go through electronic scanning. Agent liaises with shipping line and makes payments for ground handling and freight charges (if not FOB). Terminal handling charges are US$ 25.
Details of truck, driver, goods per invoice and packing list go into the KWATOS19 system.
Customs officer verifies seals on the containers with the customs online system, accepts the truck into the yard and signs the cargo acceptance form. Customs officer prepares report and inputs it into the customs online system, confirming the specified container and goods are in the yard. Shipping line prepares draft bill of lading for the agent
Generally, if the vessel is in port, all procedures take four to five working days.
The Exporter Handbook and Customer Service Charter available from the Kenya Ports Authority’s website are useful, but do not address the procedural, data and documentary requirements on the use of port facilities and services.
Kenya Ports Authority Act (1978). Customs and Excise Act (2001). Customs and Excise Act Cap. 472 (2011
Consider publishing online and in printed form a guideline or instructions on the use of port facilities and services.
Consider further examination of the activities at the port and what the issues are in order to reduce the number of days for container handling at the port from five days to three days.
19 KWATOS = Kilindini Waterfront Automated Terminal Operating System (Kilindini is the Mombasa seaport)
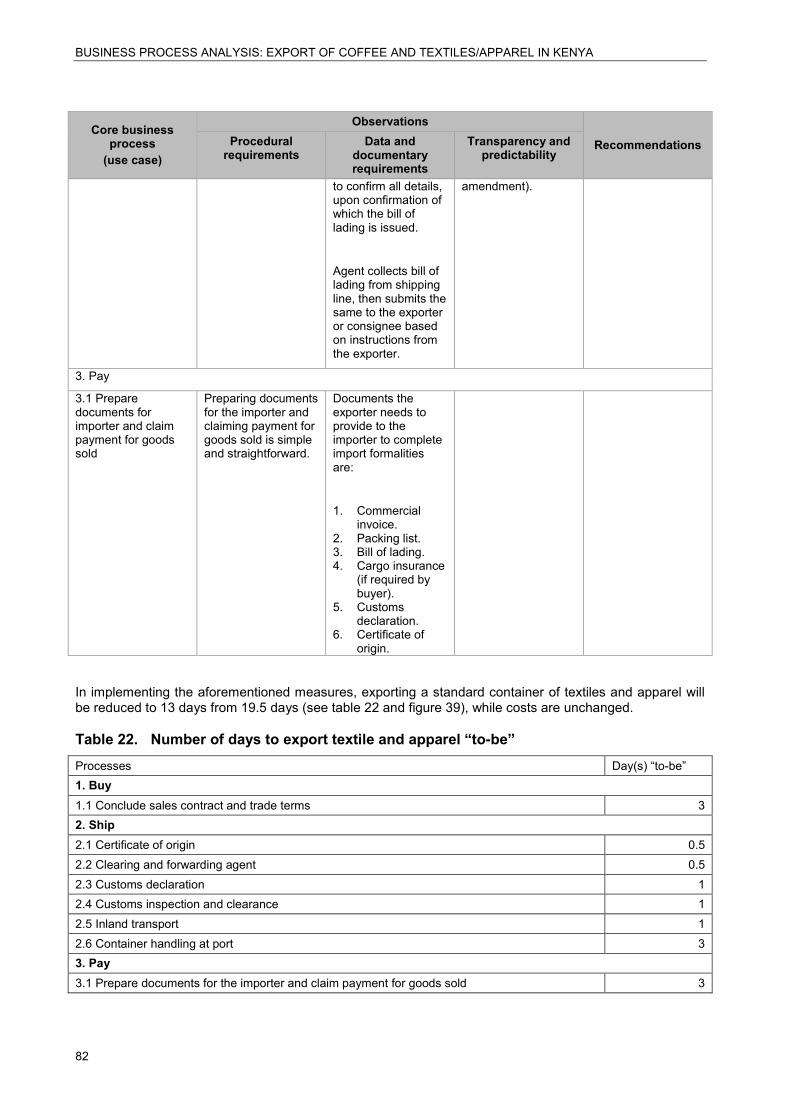
BUSINESS PROCESS ANALYSIS: EXPORT OF COFFEE AND TEXTILES/APPAREL IN KENYA
82
Core business process
(use case)
Observations
Recommendations Procedural requirements
Data and documentary requirements
Transparency and predictability
to confirm all details, upon confirmation of which the bill of lading is issued.
Agent collects bill of lading from shipping line, then submits the same to the exporter or consignee based on instructions from the exporter.
amendment).
3. Pay
3.1 Prepare documents for importer and claim payment for goods sold
Preparing documents for the importer and claiming payment for goods sold is simple and straightforward.
Documents the exporter needs to provide to the importer to complete import formalities are:
1. Commercial invoice.
2. Packing list. 3. Bill of lading. 4. Cargo insurance
(if required by buyer).
5. Customs declaration.
6. Certificate of origin.
In implementing the aforementioned measures, exporting a standard container of textiles and apparel will be reduced to 13 days from 19.5 days (see table 22 and figure 39), while costs are unchanged.
Table 22. Number of days to export textile and apparel “to-be” Processes Day(s) “to-be” 1. Buy 1.1 Conclude sales contract and trade terms 3 2. Ship 2.1 Certificate of origin 0.5 2.2 Clearing and forwarding agent 0.5 2.3 Customs declaration 1 2.4 Customs inspection and clearance 1 2.5 Inland transport 1 2.6 Container handling at port 3 3. Pay 3.1 Prepare documents for the importer and claim payment for goods sold 3

BUSINESS PROCESS ANALYSIS: EXPORT OF COFFEE AND TEXTILES/APPAREL IN KENYA
83
Total number of days to complete the processes 13
Figure 39. Number of days to export textile and apparel “to-be”
Private sector actors in the trade supply chain (domestic trader, exporter, trade services provider, bank and financial services, port operator and trucking company) are the most direct beneficiaries of the BPA studies. These service providers should start implementing the BPA to diagnose the inefficiencies and bottlenecks along their supply chain. For any complexity or non-value-added block in the export processes found that are attributable to government rules and regulations, as a group, they should prepare advocacy position papers to lobby relevant government offices to reduce or remove the block. If the same is found within the sphere of the enterprises, steps should be taken to eliminate such inefficiencies to improve firm competitiveness.
0
2
4
6
8
10
12
14
1.1Conclude
salescontract
and tradeterms
2.1Certificateof origin
2.2Clearing
andforwarding
agent
2.3Customs
declaration
2.4Customs
inspectionand
clearance
2.5 Inlandtransport
2.6Container
handling atport
3.1Prepare
documentsfor importerand claimpaymentfor goods
sold
Totalnumber of
days tocomplete
Days "to-be"

BUSINESS PROCESS ANALYSIS: EXPORT OF COFFEE AND TEXTILES/APPAREL IN KENYA
84
Licensing of clearing and forwarding agent
The activity diagram (see figure 40) shows that the process to apply for a customs agent license requires the participation of the exporter and CSD.
Figure 40: Customs agent license
Process area 2. Customs agent license Business process 2.1 Licensing procedure (new application) Rules and regulations • Customs and Excise Act (2001)
• Customs and Excise Act Cap. 472 (2011 amendment) Participants • Exporter
• Customs services department Input The exporter is registered with the Registrar of Companies, and the Ministry of
Trade, Industrialization and Entrepreneurship Activities and associated documentary requirements
2.1.1 The exporter prepares an application for a customs agent license, Form C50, and submits it to the licensing officer at CSD with all the supporting

BUSINESS PROCESS ANALYSIS: EXPORT OF COFFEE AND TEXTILES/APPAREL IN KENYA
85
(documents are to be provided in certified copy if not in original form)
documents. 1. Certificate of registration from the Registrar of Companies. 2. Memorandum and articles of association. 3. National IDs and passports of the directors. 4. Recent passport photographs of all the directors duly certified by a notary
or commissioner of oaths. 5. Evidence of membership with a recognized clearing and forwarding
association. 6. Letter from bankers showing the company maintains an account at the
banks. 7. PIN certificates for the company and all its directors. 8. VAT certificate. 9. Tax compliance certificate from KRA confirming that the company and all
its directors have lodged current domestic income taxes and VAT returns.
10. Certificate of good conduct for all directors from the Directorate of Criminal Investigation (DCI).
11. Lease or title deed of the customs agent’s office. 12. Receipt for payment of the application fee.
2.1.2 CSD reviews the submitted application, records it and assigns a reference number. 2.1.3 The licensing committee invites the applicant for an interview, after which the application is accepted or rejected. If the application is accepted, the committee recommends it for licensing. 2.1.4 Unsuccessful applicants can file an appeal. 2.1.5 A hearing is conducted, after which licensing is either recommended or declined. 2.1.6 The applicant pays the required license fee. 2.1.7 The commissioner approves the application and a customs agent's license is issued.
Output Customs agent license is obtained. Average time to complete 3 months and valid for 1 year Cost US$ 10 for application form
US$ 400 for customs agent license US$ 5 000 for security bond, once licensed
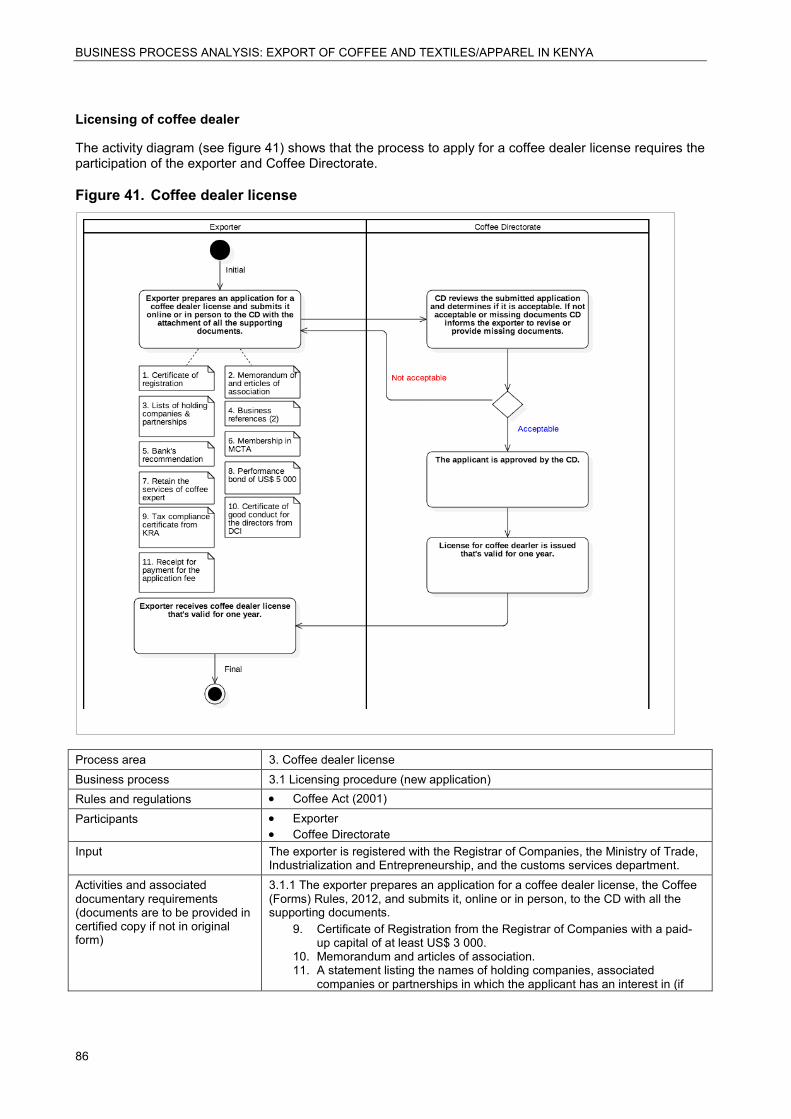
BUSINESS PROCESS ANALYSIS: EXPORT OF COFFEE AND TEXTILES/APPAREL IN KENYA
86
Licensing of coffee dealer
The activity diagram (see figure 41) shows that the process to apply for a coffee dealer license requires the participation of the exporter and Coffee Directorate.
Figure 41. Coffee dealer license
Process area 3. Coffee dealer license Business process 3.1 Licensing procedure (new application) Rules and regulations • Coffee Act (2001) Participants • Exporter
• Coffee Directorate Input The exporter is registered with the Registrar of Companies, the Ministry of Trade,
Industrialization and Entrepreneurship, and the customs services department. Activities and associated documentary requirements (documents are to be provided in certified copy if not in original form)
3.1.1 The exporter prepares an application for a coffee dealer license, the Coffee (Forms) Rules, 2012, and submits it, online or in person, to the CD with all the supporting documents.
9. Certificate of Registration from the Registrar of Companies with a paid-up capital of at least US$ 3 000.
10. Memorandum and articles of association. 11. A statement listing the names of holding companies, associated
companies or partnerships in which the applicant has an interest in (if

BUSINESS PROCESS ANALYSIS: EXPORT OF COFFEE AND TEXTILES/APPAREL IN KENYA
87
any). 12. Names and addresses of two business references. 13. Recommendation from the company’s bank on the suitability of the
company trading in coffee exports. A suitable letter should show the company’s financial status as within or more than its paid-up capital.
14. Membership of the MCTA with relevant fees paid up and other requirements fulfilled.
15. Retain the services of a coffee expert who will give written consent in the undertaking.
16. Insurance performance bond of US$ 5 000 in favour of CD. 17. Tax compliance certificate from KRA. 18. Certificate of good conduct for all directors from the Directorate of
Criminal Investigation (DCI). 19. Receipt for payment of the application fee.
3.1.2 CD reviews the submitted application and determines if it’s acceptable. If not acceptable or missing documents, CD informs the exporter to revise or provide missing documents. 3.1.3 CD approves the application and a coffee dealer license is issued.
Output Coffee dealer license is obtained. Average time to complete 90 working days (maximum) and valid for one year Cost US$ 10 for application form
US$ 500 for coffee dealer license
Coffee export license
The activity diagram (see figure 42) shows that the process to apply for a coffee export license requires the participation of the exporter and International Coffee Organization locally represented by the Coffee Directorate.
Figure 42. Coffee export license
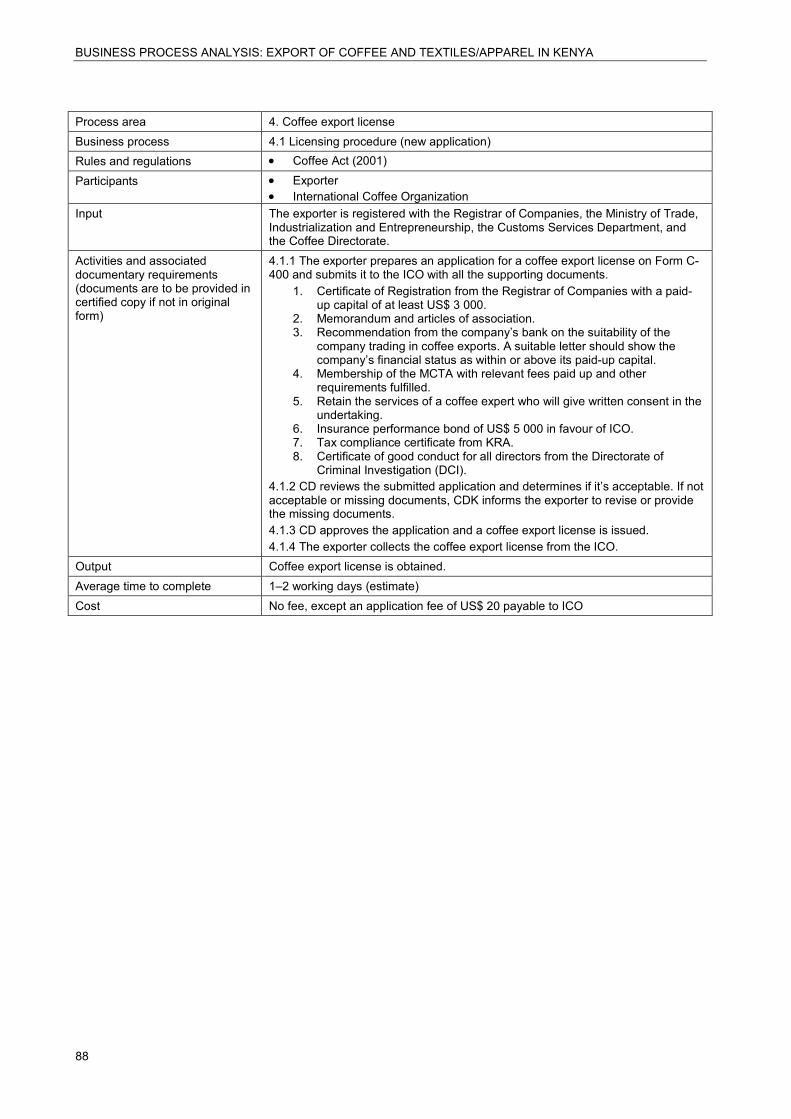
BUSINESS PROCESS ANALYSIS: EXPORT OF COFFEE AND TEXTILES/APPAREL IN KENYA
88
Process area 4. Coffee export license Business process 4.1 Licensing procedure (new application) Rules and regulations • Coffee Act (2001) Participants • Exporter
• International Coffee Organization Input The exporter is registered with the Registrar of Companies, the Ministry of Trade,
Industrialization and Entrepreneurship, the Customs Services Department, and the Coffee Directorate.
Activities and associated documentary requirements (documents are to be provided in certified copy if not in original form)
4.1.1 The exporter prepares an application for a coffee export license on Form C-400 and submits it to the ICO with all the supporting documents.
1. Certificate of Registration from the Registrar of Companies with a paid-up capital of at least US$ 3 000.
2. Memorandum and articles of association. 3. Recommendation from the company’s bank on the suitability of the
company trading in coffee exports. A suitable letter should show the company’s financial status as within or above its paid-up capital.
4. Membership of the MCTA with relevant fees paid up and other requirements fulfilled.
5. Retain the services of a coffee expert who will give written consent in the undertaking.
6. Insurance performance bond of US$ 5 000 in favour of ICO. 7. Tax compliance certificate from KRA. 8. Certificate of good conduct for all directors from the Directorate of
Criminal Investigation (DCI). 4.1.2 CD reviews the submitted application and determines if it’s acceptable. If not acceptable or missing documents, CDK informs the exporter to revise or provide the missing documents. 4.1.3 CD approves the application and a coffee export license is issued. 4.1.4 The exporter collects the coffee export license from the ICO.
Output Coffee export license is obtained. Average time to complete 1–2 working days (estimate) Cost No fee, except an application fee of US$ 20 payable to ICO

BUSINESS PROCESS ANALYSIS: EXPORT OF COFFEE AND TEXTILES/APPAREL IN KENYA
89
Annex 1 – Regulations
Selected trade-related laws, June 2012 Area Law Customs EAC Customs Union Protocol, 2005 EAC Customs Management Act, 2004, revised 2009 Customs and Excise Act (Cap. 472), revised edition 2010 Import/export control The Stamp Duty Act (Cap. 480) as amended by the Statute Law
(miscellaneous amendments) Act of 2009 Sale of Goods Act (Cap. 31), 2003 Trade Disputes Act (Cap. 234), 1991 Price Control (essential goods) 2011 Trading in prohibited goods (Cap. 519), 1967 Weights and Measures Act (Cap. 513), 1993 Trade Descriptions Act (Cap. 505), 1980 Licensing of businesses Registration of Business Names (Cap. 499) Licensing Laws (repeals and amendments) Act, 2006 Transfer of Businesses (Cap. 500) Business Premises Rent Tribunal Act (Cap. 301) Aliens Restriction Act, repealed by 12 of 2011 Companies Act (Cap. 486), 2009 Factories Act and other places of work (Cap. 514), repealed by A 15 of 2007
Act Bankruptcy Act (Cap. 53), 1982 Taxation Income Tax Act (Cap. 470), 1993, 2010 Value-Added Tax Act (Cap. 476), 2004 Stamp Duty Act, 1982 Sanitary and phytosanitary measures Pest Control Products Act, 1985
Meat Control Act (Cap. 356) Fertilizers and Animal Foodstuffs Act (Cap. 345) Animal Disease Act (Cap. 364) Plant Protection Act (Cap. 324) Public Health Act (Cap. 242) Food, Drugs and Chemical Substances Act (Cap. 254), 1992
Pharmacy and Poisons Act (Cap. 244) Veterinary Surgeons and Veterinary Paraprofessionals Act, number 29 of 2011 Biosafety Act, number 9 of 2009 Fisheries Act (Cap. 378)
Standards Standards Act (Cap. 496), 1981 Foreign investment Investment Promotion Act (Cap. 485B), 2005 Foreign Investments Protection (Cap. 518), 2010 Housing Act, 1990; revised 2010 Land Acquisition Act, 1983; revised 2010 Investment Disputes Convention, 1967
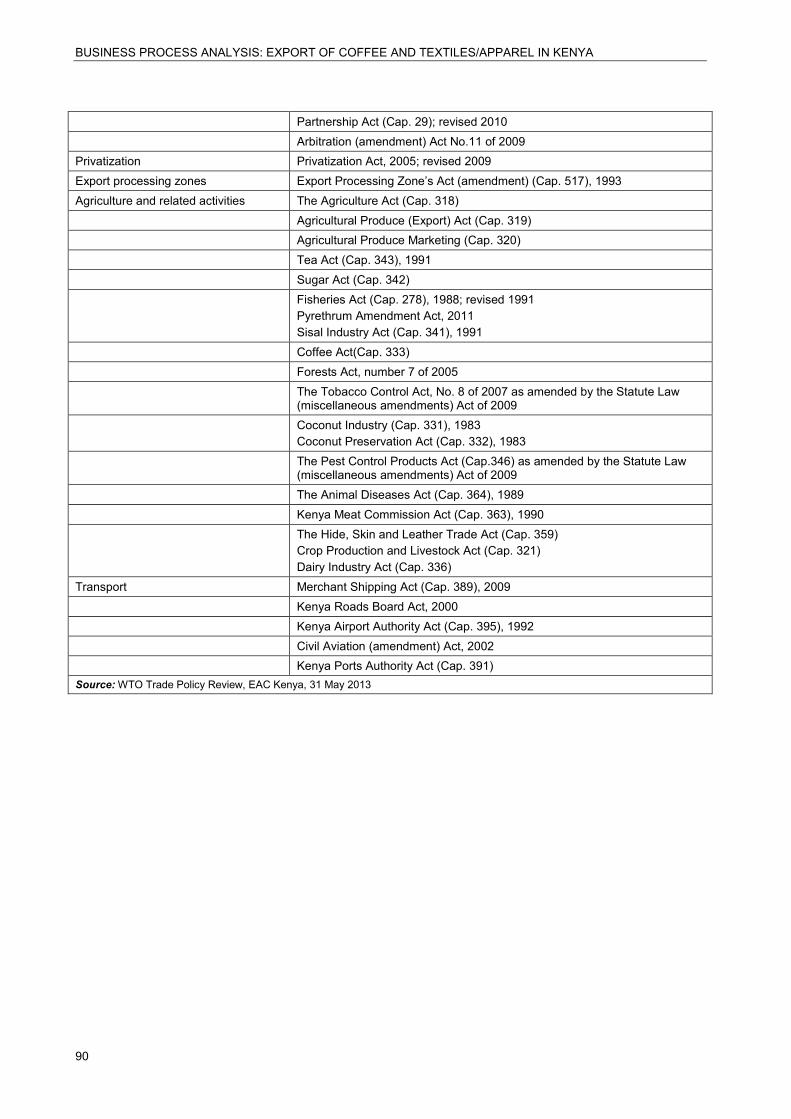
BUSINESS PROCESS ANALYSIS: EXPORT OF COFFEE AND TEXTILES/APPAREL IN KENYA
90
Partnership Act (Cap. 29); revised 2010 Arbitration (amendment) Act No.11 of 2009 Privatization Privatization Act, 2005; revised 2009 Export processing zones Export Processing Zone’s Act (amendment) (Cap. 517), 1993 Agriculture and related activities The Agriculture Act (Cap. 318) Agricultural Produce (Export) Act (Cap. 319) Agricultural Produce Marketing (Cap. 320) Tea Act (Cap. 343), 1991 Sugar Act (Cap. 342) Fisheries Act (Cap. 278), 1988; revised 1991
Pyrethrum Amendment Act, 2011 Sisal Industry Act (Cap. 341), 1991
Coffee Act(Cap. 333) Forests Act, number 7 of 2005 The Tobacco Control Act, No. 8 of 2007 as amended by the Statute Law
(miscellaneous amendments) Act of 2009 Coconut Industry (Cap. 331), 1983
Coconut Preservation Act (Cap. 332), 1983 The Pest Control Products Act (Cap.346) as amended by the Statute Law
(miscellaneous amendments) Act of 2009 The Animal Diseases Act (Cap. 364), 1989 Kenya Meat Commission Act (Cap. 363), 1990 The Hide, Skin and Leather Trade Act (Cap. 359)
Crop Production and Livestock Act (Cap. 321) Dairy Industry Act (Cap. 336)
Transport Merchant Shipping Act (Cap. 389), 2009 Kenya Roads Board Act, 2000 Kenya Airport Authority Act (Cap. 395), 1992 Civil Aviation (amendment) Act, 2002 Kenya Ports Authority Act (Cap. 391) Source: WTO Trade Policy Review, EAC Kenya, 31 May 2013
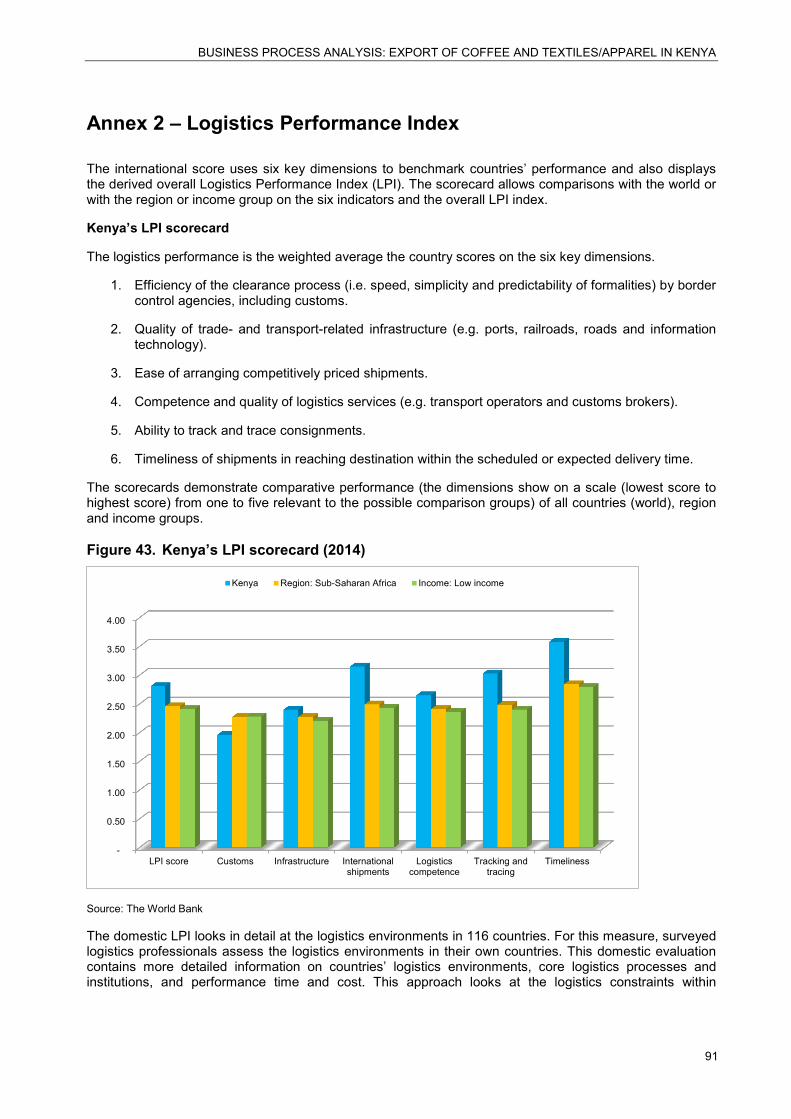
BUSINESS PROCESS ANALYSIS: EXPORT OF COFFEE AND TEXTILES/APPAREL IN KENYA
91
Annex 2 – Logistics Performance Index
The international score uses six key dimensions to benchmark countries’ performance and also displays the derived overall Logistics Performance Index (LPI). The scorecard allows comparisons with the world or with the region or income group on the six indicators and the overall LPI index.
Kenya’s LPI scorecard
The logistics performance is the weighted average the country scores on the six key dimensions.
1. Efficiency of the clearance process (i.e. speed, simplicity and predictability of formalities) by border control agencies, including customs.
2. Quality of trade- and transport-related infrastructure (e.g. ports, railroads, roads and information technology).
3. Ease of arranging competitively priced shipments.
4. Competence and quality of logistics services (e.g. transport operators and customs brokers).
5. Ability to track and trace consignments.
6. Timeliness of shipments in reaching destination within the scheduled or expected delivery time.
The scorecards demonstrate comparative performance (the dimensions show on a scale (lowest score to highest score) from one to five relevant to the possible comparison groups) of all countries (world), region and income groups.
Figure 43. Kenya’s LPI scorecard (2014)
Source: The World Bank
The domestic LPI looks in detail at the logistics environments in 116 countries. For this measure, surveyed logistics professionals assess the logistics environments in their own countries. This domestic evaluation contains more detailed information on countries’ logistics environments, core logistics processes and institutions, and performance time and cost. This approach looks at the logistics constraints within
-
0.50
1.00
1.50
2.00
2.50
3.00
3.50
4.00
LPI score Customs Infrastructure Internationalshipments
Logisticscompetence
Tracking andtracing
Timeliness
Kenya Region: Sub-Saharan Africa Income: Low income
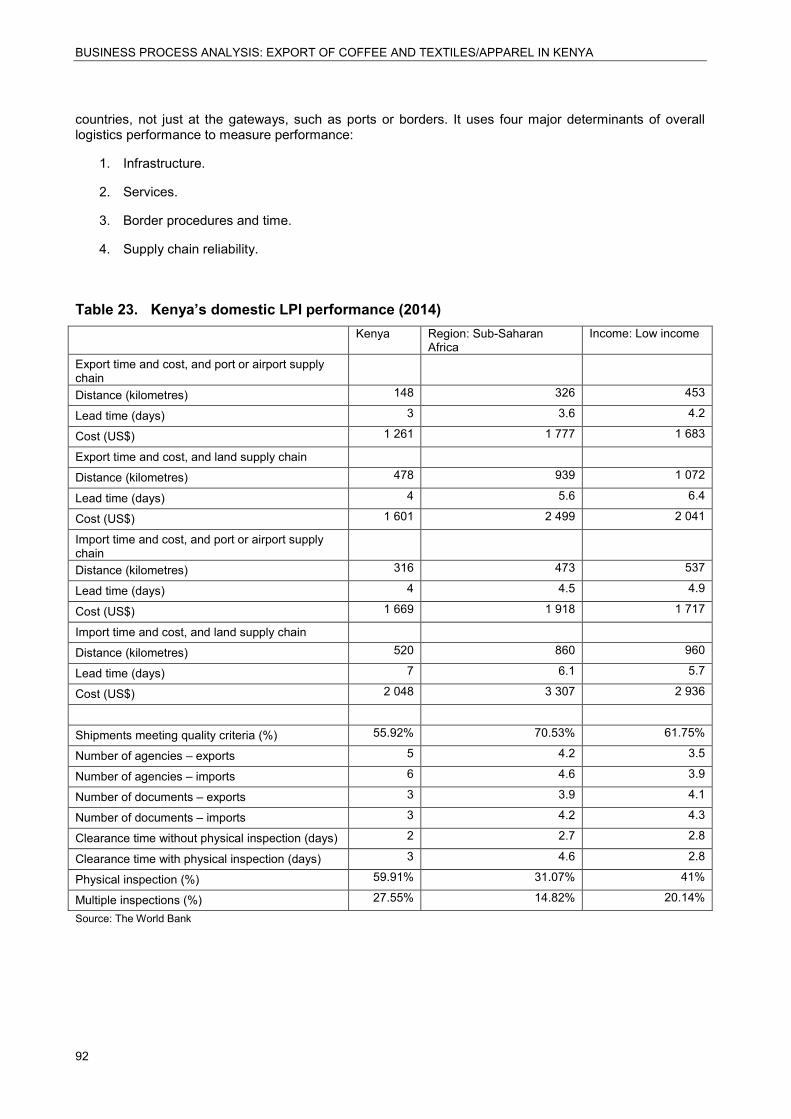
BUSINESS PROCESS ANALYSIS: EXPORT OF COFFEE AND TEXTILES/APPAREL IN KENYA
92
countries, not just at the gateways, such as ports or borders. It uses four major determinants of overall logistics performance to measure performance:
1. Infrastructure.
2. Services.
3. Border procedures and time.
4. Supply chain reliability.
Table 23. Kenya’s domestic LPI performance (2014) Kenya Region: Sub-Saharan
Africa Income: Low income
Export time and cost, and port or airport supply chain
Distance (kilometres) 148 326 453
Lead time (days) 3 3.6 4.2
Cost (US$) 1 261 1 777 1 683
Export time and cost, and land supply chain
Distance (kilometres) 478 939 1 072
Lead time (days) 4 5.6 6.4
Cost (US$) 1 601 2 499 2 041
Import time and cost, and port or airport supply chain
Distance (kilometres) 316 473 537
Lead time (days) 4 4.5 4.9
Cost (US$) 1 669 1 918 1 717
Import time and cost, and land supply chain
Distance (kilometres) 520 860 960
Lead time (days) 7 6.1 5.7
Cost (US$) 2 048 3 307 2 936
Shipments meeting quality criteria (%) 55.92% 70.53% 61.75%
Number of agencies – exports 5 4.2 3.5
Number of agencies – imports 6 4.6 3.9
Number of documents – exports 3 3.9 4.1
Number of documents – imports 3 4.2 4.3
Clearance time without physical inspection (days) 2 2.7 2.8
Clearance time with physical inspection (days) 3 4.6 2.8
Physical inspection (%) 59.91% 31.07% 41%
Multiple inspections (%) 27.55% 14.82% 20.14%
Source: The World Bank
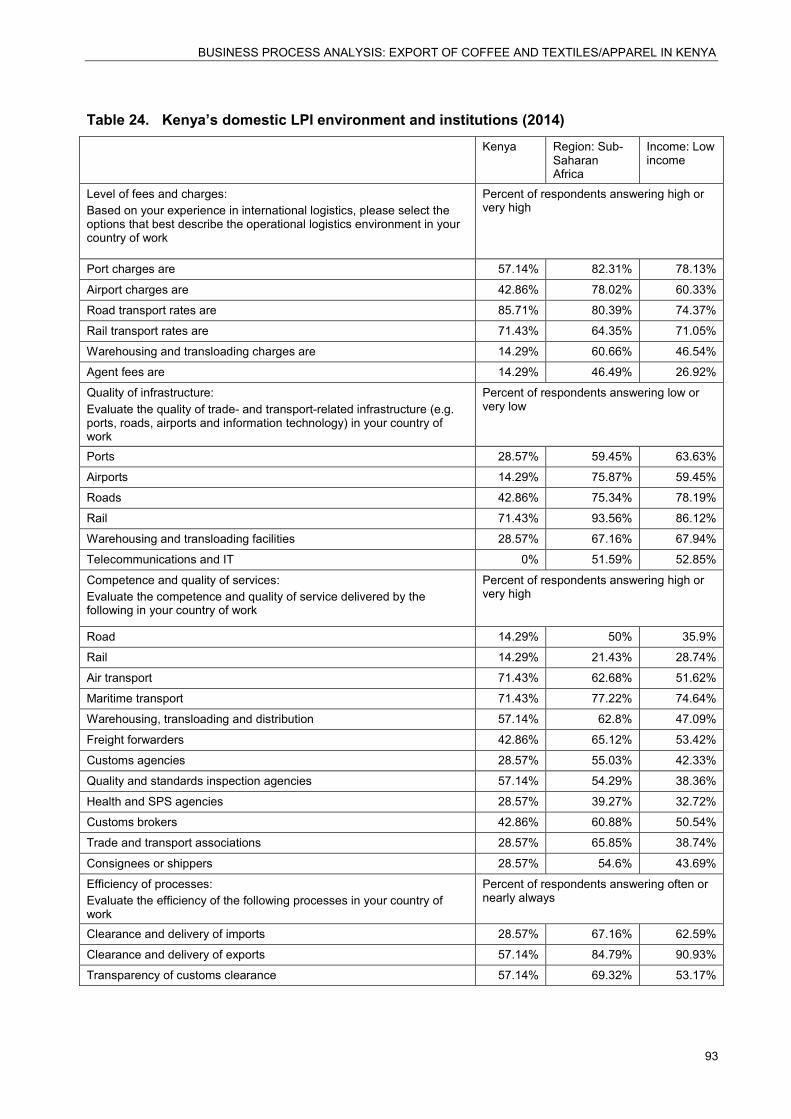
BUSINESS PROCESS ANALYSIS: EXPORT OF COFFEE AND TEXTILES/APPAREL IN KENYA
93
Table 24. Kenya’s domestic LPI environment and institutions (2014) Kenya Region: Sub-
Saharan Africa
Income: Low income
Level of fees and charges: Based on your experience in international logistics, please select the options that best describe the operational logistics environment in your country of work
Percent of respondents answering high or very high
Port charges are 57.14% 82.31% 78.13%
Airport charges are 42.86% 78.02% 60.33%
Road transport rates are 85.71% 80.39% 74.37%
Rail transport rates are 71.43% 64.35% 71.05%
Warehousing and transloading charges are 14.29% 60.66% 46.54%
Agent fees are 14.29% 46.49% 26.92%
Quality of infrastructure: Evaluate the quality of trade- and transport-related infrastructure (e.g. ports, roads, airports and information technology) in your country of work
Percent of respondents answering low or very low
Ports 28.57% 59.45% 63.63%
Airports 14.29% 75.87% 59.45%
Roads 42.86% 75.34% 78.19%
Rail 71.43% 93.56% 86.12%
Warehousing and transloading facilities 28.57% 67.16% 67.94%
Telecommunications and IT 0% 51.59% 52.85%
Competence and quality of services: Evaluate the competence and quality of service delivered by the following in your country of work
Percent of respondents answering high or very high
Road 14.29% 50% 35.9%
Rail 14.29% 21.43% 28.74%
Air transport 71.43% 62.68% 51.62%
Maritime transport 71.43% 77.22% 74.64%
Warehousing, transloading and distribution 57.14% 62.8% 47.09%
Freight forwarders 42.86% 65.12% 53.42%
Customs agencies 28.57% 55.03% 42.33%
Quality and standards inspection agencies 57.14% 54.29% 38.36%
Health and SPS agencies 28.57% 39.27% 32.72%
Customs brokers 42.86% 60.88% 50.54%
Trade and transport associations 28.57% 65.85% 38.74%
Consignees or shippers 28.57% 54.6% 43.69%
Efficiency of processes: Evaluate the efficiency of the following processes in your country of work
Percent of respondents answering often or nearly always
Clearance and delivery of imports 28.57% 67.16% 62.59%
Clearance and delivery of exports 57.14% 84.79% 90.93%
Transparency of customs clearance 57.14% 69.32% 53.17%
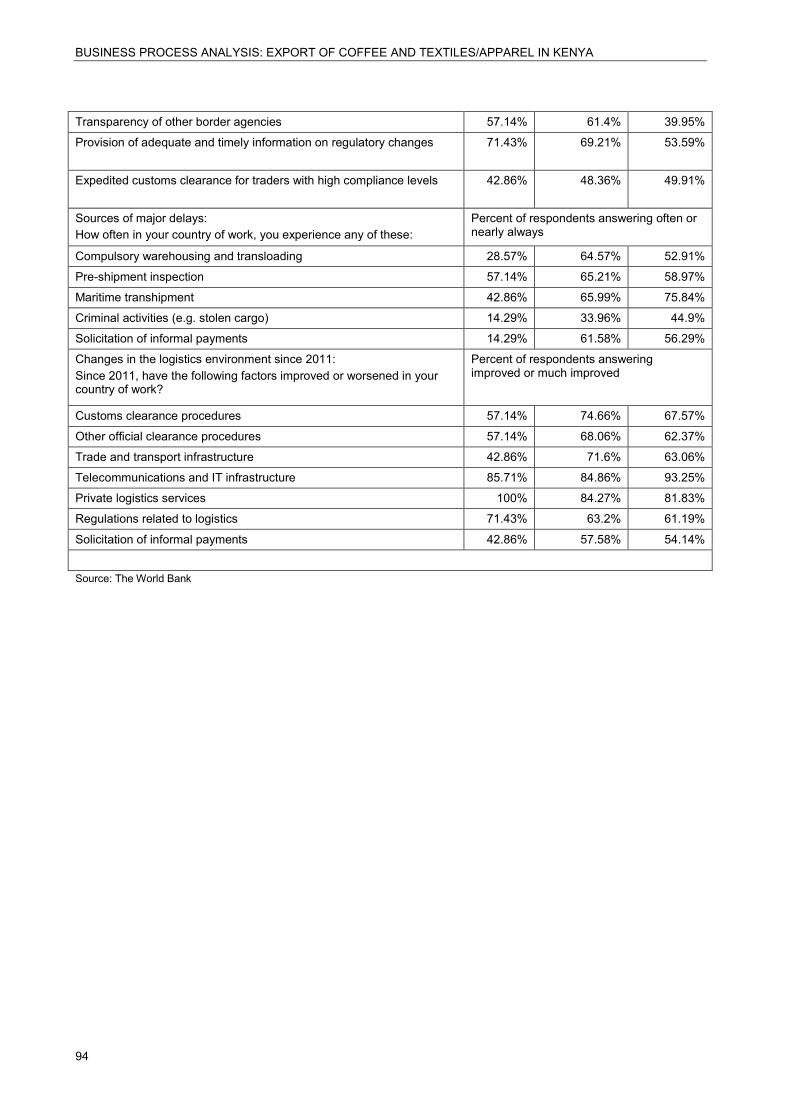
BUSINESS PROCESS ANALYSIS: EXPORT OF COFFEE AND TEXTILES/APPAREL IN KENYA
94
Transparency of other border agencies 57.14% 61.4% 39.95%
Provision of adequate and timely information on regulatory changes 71.43% 69.21% 53.59%
Expedited customs clearance for traders with high compliance levels 42.86% 48.36% 49.91%
Sources of major delays: How often in your country of work, you experience any of these:
Percent of respondents answering often or nearly always
Compulsory warehousing and transloading 28.57% 64.57% 52.91%
Pre-shipment inspection 57.14% 65.21% 58.97%
Maritime transhipment 42.86% 65.99% 75.84%
Criminal activities (e.g. stolen cargo) 14.29% 33.96% 44.9%
Solicitation of informal payments 14.29% 61.58% 56.29%
Changes in the logistics environment since 2011: Since 2011, have the following factors improved or worsened in your country of work?
Percent of respondents answering improved or much improved
Customs clearance procedures 57.14% 74.66% 67.57%
Other official clearance procedures 57.14% 68.06% 62.37%
Trade and transport infrastructure 42.86% 71.6% 63.06%
Telecommunications and IT infrastructure 85.71% 84.86% 93.25%
Private logistics services 100% 84.27% 81.83%
Regulations related to logistics 71.43% 63.2% 61.19%
Solicitation of informal payments 42.86% 57.58% 54.14%
Source: The World Bank
BUSINESS PROCESS ANALYSIS: EXPORT OF COFFEE AND TEXTILES/APPAREL IN KENYA
95
References
Kenya National Bureau of Statistics (2015). Economic survey. Nairobi. Available from www.knbs.or.ke.
Kenya National Bureau of Statistics (June 2015). Leading economic indicators. Nairobi. Available from www.knbs.or.ke.
Kenya National Bureau of Statistics (first quarter of 2015). Quarterly gross domestic product and balance payments. Nairobi. Available from www.knbs.or.ke.
Kenya National Bureau of Statistics (2015). Kenya facts and figures. Nairobi. Available from www.knbs.or.ke.
ITC (2014). Kenya Company Perspectives – An ITC Series on Non-Tariff Measures, Geneva, 2014.
World Bank Group (2014). Kenya Economic Update (December 2014, edition no. 11). Anchoring High Growth, Can Manufacturing Contribute More? December 2014, edition no. 11.
World Bank Group (2015). Doing Business 2015, Going Beyond Efficiency, economy profile, Kenya, 12th edition.
World Trade Organization (2013). WTO Trade Policy Review, EAC, Kenya, 31 May 2013, Annex 2.
World Economic Forum (2014–2015). The Global Competitiveness Report 2014–2015, Geneva.
UNNexT, ESCAP and UNECE (2012). Business Process Analysis: Guide to Simplify Trade Procedures (updated September 2012).
SATNET Asia/ESCAP (2014). Business Process Analysis: Export of Cassava and Maize in Cambodia (January 2014), final report.
SATNET Asia/ESCAP (2013). Business Process Analysis: Export of Jute Hessian Bags and Import of Wheat in Bangladesh (December 2013), final report.
SATNET Asia/ESCAP (2014). Business Process Analysis: Export of Maize and Import of Animal Feed in Lao PDR (April 2014), final report.
SATNET Asia/ESCAP (2013). Business Process Analysis: Export of Rice and Mango and Import of Palm Oil in Myanmar (December 2013), final report.
ACTIF (2013). Policy Research on the Kenyan Textile Industry, Findings and Recommendations, June 2013
.

BUSINESS PROCESS ANALYSIS: EXPORT OF COFFEE AND TEXTILES/APPAREL IN KENYA
96
.
