seasonal patterns in criminal victimization trends
TRANSCRIPT

June 2014 ncJ 245959
U.S. Department of Justice Office of Justice Programs Bureau of Justice Statistics
BJS
Special Report
Janet L. Lauritsen, Ph.D., BJS Visiting Fellow, and Nicole White, Ph.D., University of Missouri – St. Louis
Seasonal Patterns in Criminal Victimization Trends
IntroductionSeasonal patterns exist when similar fluctuations in the victimization rates tend to recur each year during the same season. Seasonal patterns are a long-standing topic in both popular and scholarly literatures on crime and show how environmental factors, such as temperature changes and daylight hours, might be associated with crime throughout the year. Seasonal patterns also are examined to learn whether routine activity patterns, such as those associated with the beginning and end of the school year, are associated with variations in crime throughout the year.
This report examines seasonal patterns in violent and household property victimization in the United States from 1993 to 2010. It describes seasonal patterns for household property victimization (burglary, motor vehicle theft, and household larceny) and types of violence (rape and sexual assault, robbery, aggravated assault, and simple assault). Trends in other forms of violence, including intimate partner violence, victimizations involving weapons, and those resulting in injury, also are examined to determine the extent to which seasonal fluctuations exist.
For household property crimes, the victimization data indicate that there are seasonal patterns in household burglary and larceny, with higher rates in the summer and lower rates during other seasons of the year. Motor vehicle thefts do not exhibit the same seasonal patterns.
For violent victimizations, seasonal patterns also vary depending on the type of crime. Rape and sexual assault rates and aggravated assault rates are higher in the summer than in most other seasons. In comparison, simple assault rates are higher in the fall than in other seasons, and robbery victimization rates show no seasonal patterns. Intimate partner violence exhibits regular seasonal fluctuations with rates highest during the summer and lowest during the winter. Rates of violence involving weapons and violence resulting in serious injury are higher in the summer than in the winter and spring seasons; however, the fall rates are not significantly different from the summer rates.
HigHligHts � When seasonal variations in household property victimization were found, the differences between the highest and lowest seasonal rates were less than 11%.
� Seasonal patterns existed in household larceny and burglary victimization rates. Rates of these household crimes tended to be higher in the summer than during other seasons of the year.
� Though rates of motor vehicle theft tended to be lower in the spring than in the summer, there were few regular differences between summer, fall, and winter rates.
� When seasonal variations were found for violent victimization, the differences between the rates of the highest and lowest season were less than 12%.
� Aggravated assault rates were higher during the summer than during the winter, spring, and fall. In comparison, simple assault rates were higher during the fall than during other seasons of the year.
� Robbery rates did not exhibit seasonal variations.
� Rape and sexual assault victimization rates tended to be higher during the summer than during the fall and winter.
� Rates of intimate partner violence were higher during the summer than during the winter, spring, and fall.

2SeaSonal patternS in Criminal ViCtimization trendS | June 2014
Prior BJS Research on SeasonalityBJS has previously examined seasonal patterns in selected types of victimization using monthly data from 1973 to 1977 from the National Crime Survey (NCS), the predecessor of the National Crime Victimization Survey (NCVS).1 Earlier research examined some of the same types of victimizations assessed in this report.
The previous report found notable seasonal fluctuations in household larceny and burglary, and rates were highest during the summer months. Seasonal differences were also found for motor vehicle theft and for assault victimization. For these crimes, the differences between the summer and winter month rates were relatively smaller than those found for household burglary and larceny. The earlier findings for these types of victimization are similar to the patterns shown in this report; however, the magnitude of the seasonal differences were somewhat larger from 1973 to 1977 than from 1993 to 2010. During the earlier period, burglaries were about 26% less frequent in the winter than in the summer, while in the more recent period, the winter versus summer difference in burglary was about 11%. No significant seasonal fluctuations were found for robbery in either study. 1Crime and Seasonality: National Crime Survey Report, NCJ 64818, BJS web, May 1980.
The data in this report were developed from the Bureau of Justice Statistics’ (BJS) National Crime Victimization Survey (NCVS), which annually collects information on nonfatal victimizations against persons age 12 or older from a nationally representative sample of U.S. households. The data included crimes reported and not reported to the police from 1993 to 2010. Asking the victim in which month the incident occurred makes it possible to assess how the risk for victimization varies throughout the year. For each of the crime types, differences in the rates are compared across the four seasons of the year. Winter rates are based on victimizations that occur in December, January, and February; spring rates occur in March, April, and May; summer rates occur in June, July, and August; and fall rates occur in September, October, and November. Seasonal patterns in the 1993 to 2010 trends exist when statistical analyses reveal periodic fluctuations in the rates, which tend to recur each year during the same season See Methodology for a description of the statistical analysis used in this report.
BJS Visiting Fellows The BJS Visiting Fellows program is intended to facilitate collaboration between academic scholars and government researchers in survey methodology, statistics, economics, and social sciences. Visiting Fellows have the unique opportunity to address substantive, methodological, and analytic issues relevant to BJS programs, and to further knowledge and understanding of criminal justice systems operation. Fellows conduct research at BJS or at their home site, use BJS data and facilities, and interact with BJS staff. Pending available funding, the program is normally conducted each year through a competitive solicitation.
Applicants are limited to senior-level social science researchers or statisticians in the fields of statistics, survey methodology, mathematics, criminology, demography, economics, behavioral science, and other related fields. They must have an established research record in their field, have considerable expertise in their area of proposed research, and be willing to commit a substantial portion of their time (typically 6 to 18 months) to undertake analyses of existing BJS data. In addition, they must produce a report that both summarizes their analyses and meets BJS publication and data quality standards. For further information, see http://www.bjs.gov/content/fellows.cfm.
3SeaSonal patternS in Criminal ViCtimization trendS | June 2014
Table 1 Average percent difference in seasonal rate of household victimization, by type of crime, 1993–2010
Total property crime
Household burglary
Motor vehicle theft
Household larceny
Winter -6.9%* -10.5%* -2.2% -6.4%*Spring -8.0* -8.8* -5.6* -8.0*Summer ~ ~ ~ ~Fall -3.1* -5.9* 0 -2.7*Note: See appendix table 1 for regression coefficients and standard errors.*Difference is statistically significant (p < .05, two-tail test). ~Highest rate season used for percentage comparisons.Source: Bureau of Justice Statistics, National Crime Victimization Survey, 1993–2010.
0
20
40
60
80
100
Sum
mer
'10
Wint
er '1
0Su
mm
er '0
9W
inter
'09
Sum
mer
'08
Wint
er '0
8Su
mm
er '0
7W
inter
'07
Sum
mer
'06
Wint
er '0
6Su
mm
er '0
5W
inter
'05
Sum
mer
'04
Wint
er '0
4Su
mm
er '0
3W
inter
'03
Sum
mer
'02
Wint
er '0
2Su
mm
er '0
1W
inter
'01
Sum
mer
'00
Wint
er '0
0Su
mm
er '9
9W
inter
'99
Sum
mer
'98
Wint
er '9
8Su
mm
er '9
7W
inter
'97
Sum
mer
'96
Wint
er '9
6Su
mm
er '9
5W
inter
'95
Sum
mer
'94
Wint
er '9
4
Sum
mer
'93
Wint
er '9
3
Per 1,000 households
Source: Bureau of Justice Statistics, National Crime Victimization Survey, 1993–2010.
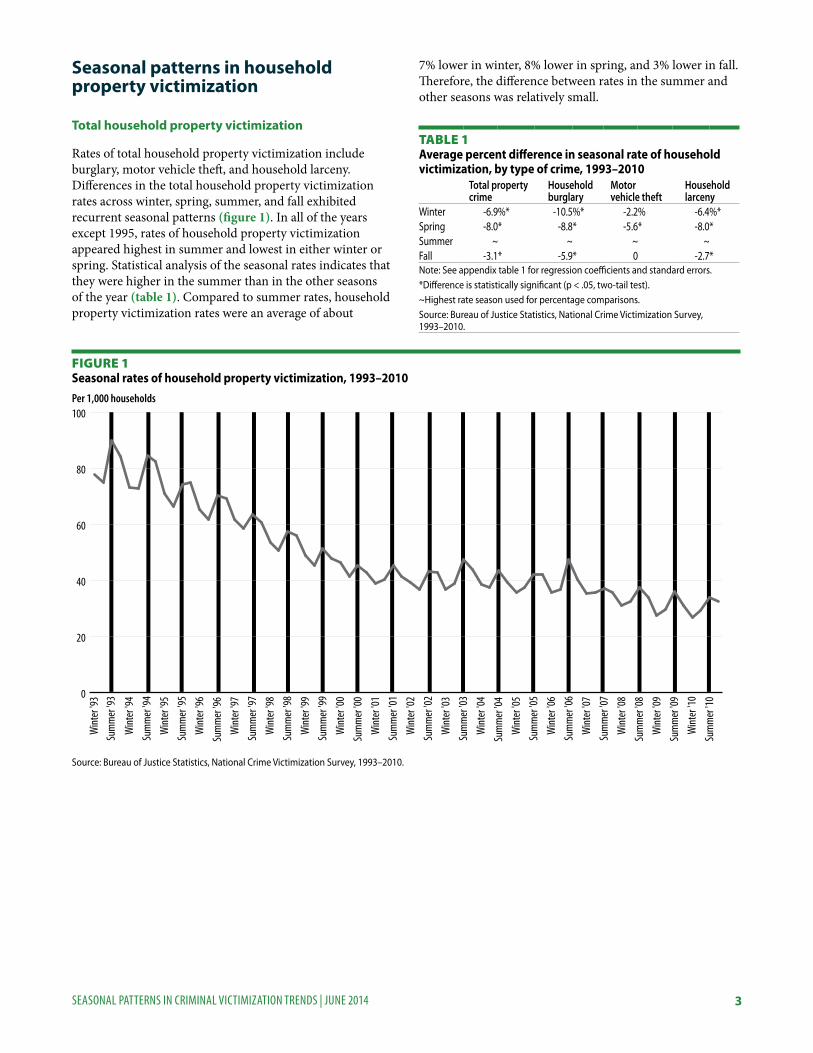
Figure 1Seasonal rates of household property victimization, 1993–2010
Seasonal patterns in household property victimization
Total household property victimization
Rates of total household property victimization include burglary, motor vehicle theft, and household larceny. Differences in the total household property victimization rates across winter, spring, summer, and fall exhibited recurrent seasonal patterns (figure 1). In all of the years except 1995, rates of household property victimization appeared highest in summer and lowest in either winter or spring. Statistical analysis of the seasonal rates indicates that they were higher in the summer than in the other seasons of the year (table 1). Compared to summer rates, household property victimization rates were an average of about
7% lower in winter, 8% lower in spring, and 3% lower in fall. Therefore, the difference between rates in the summer and other seasons was relatively small.
4SeaSonal patternS in Criminal ViCtimization trendS | June 2014
0
5
10
15
20
Sum
mer
'10
Wint
er '1
0Su
mm
er '0
9W
inter
'09
Sum
mer
'08
Wint
er '0
8Su
mm
er '0
7W
inter
'07
Sum
mer
'06
Wint
er '0
6Su
mm
er '0
5W
inter
'05
Sum
mer
'04
Wint
er '0
4Su
mm
er '0
3W
inter
'03
Sum
mer
'02
Wint
er '0
2Su
mm
er '0
1W
inter
'01
Sum
mer
'00
Wint
er '0
0Su
mm
er '9
9W
inter
'99
Sum
mer
'98
Wint
er '9
8Su
mm
er '9
7W
inter
'97
Sum
mer
'96
Wint
er '9
6Su
mm
er '9
5W
inter
'95
Sum
mer
'94
Wint
er '9
4Su
mm
er '9
3W
inter
'93
Per 1,000 households
Source: Bureau of Justice Statistics, National Crime Victimization Survey, 1993–2010.
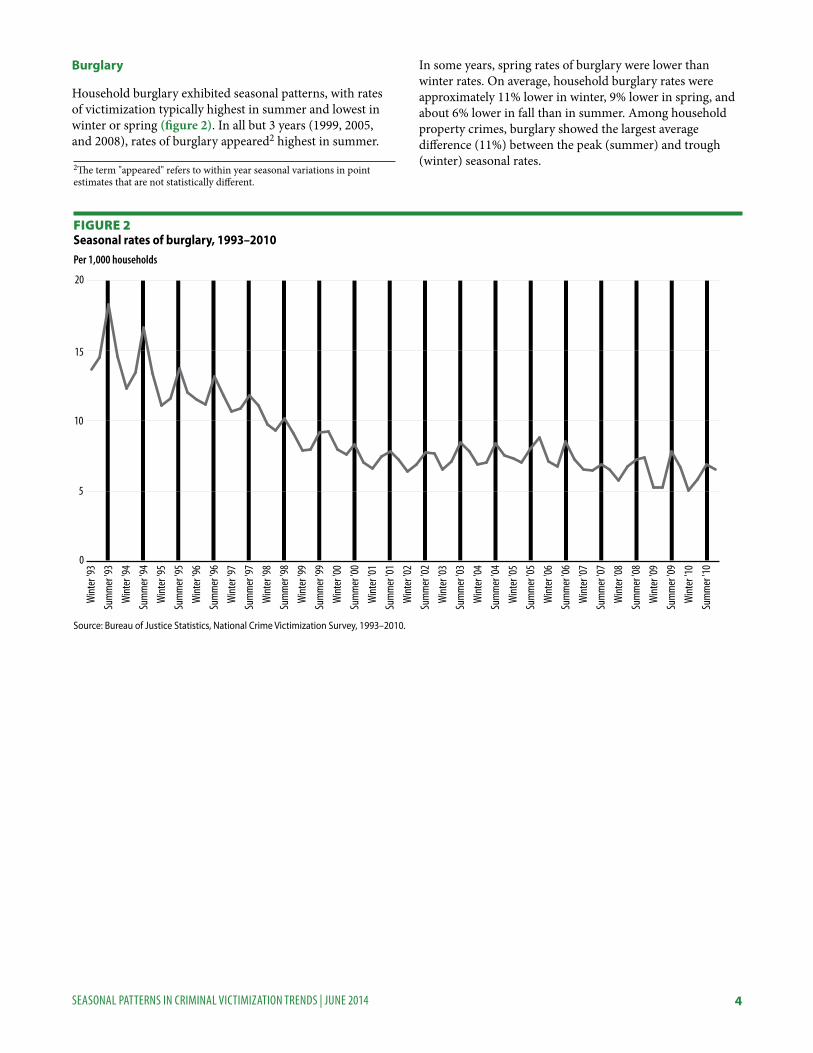
Figure 2Seasonal rates of burglary, 1993–2010
Burglary
Household burglary exhibited seasonal patterns, with rates of victimization typically highest in summer and lowest in winter or spring (figure 2). In all but 3 years (1999, 2005, and 2008), rates of burglary appeared2 highest in summer.
In some years, spring rates of burglary were lower than winter rates. On average, household burglary rates were approximately 11% lower in winter, 9% lower in spring, and about 6% lower in fall than in summer. Among household property crimes, burglary showed the largest average difference (11%) between the peak (summer) and trough (winter) seasonal rates.2The term "appeared" refers to within year seasonal variations in point
estimates that are not statistically different.
5SeaSonal patternS in Criminal ViCtimization trendS | June 2014
0
2
4
6
8
10
Sum
mer
'10
Wint
er '1
0Su
mm
er '0
9W
inter
'09
Sum
mer
'08
Wint
er '0
8Su
mm
er '0
7W
inter
'07
Sum
mer
'06
Wint
er '0
6Su
mm
er '0
5W
inter
'05
Sum
mer
'04
Wint
er '0
4Su
mm
er '0
3W
inter
'03
Sum
mer
'02
Wint
er '0
2Su
mm
er '0
1W
inter
'01
Sum
mer
'00
Wint
er '0
0Su
mm
er '9
9W
inter
'99
Sum
mer
'98
Wint
er '9
8Su
mm
er '9
7W
inter
'97
Sum
mer
'96
Wint
er '9
6Su
mm
er '9
5W
inter
'95
Sum
mer
'94
Wint
er '9
4Su
mm
er '9
3W
inter
'93
Per 1,000 households
Source: Bureau of Justice Statistics, National Crime Victimization Survey, 1993–2010.
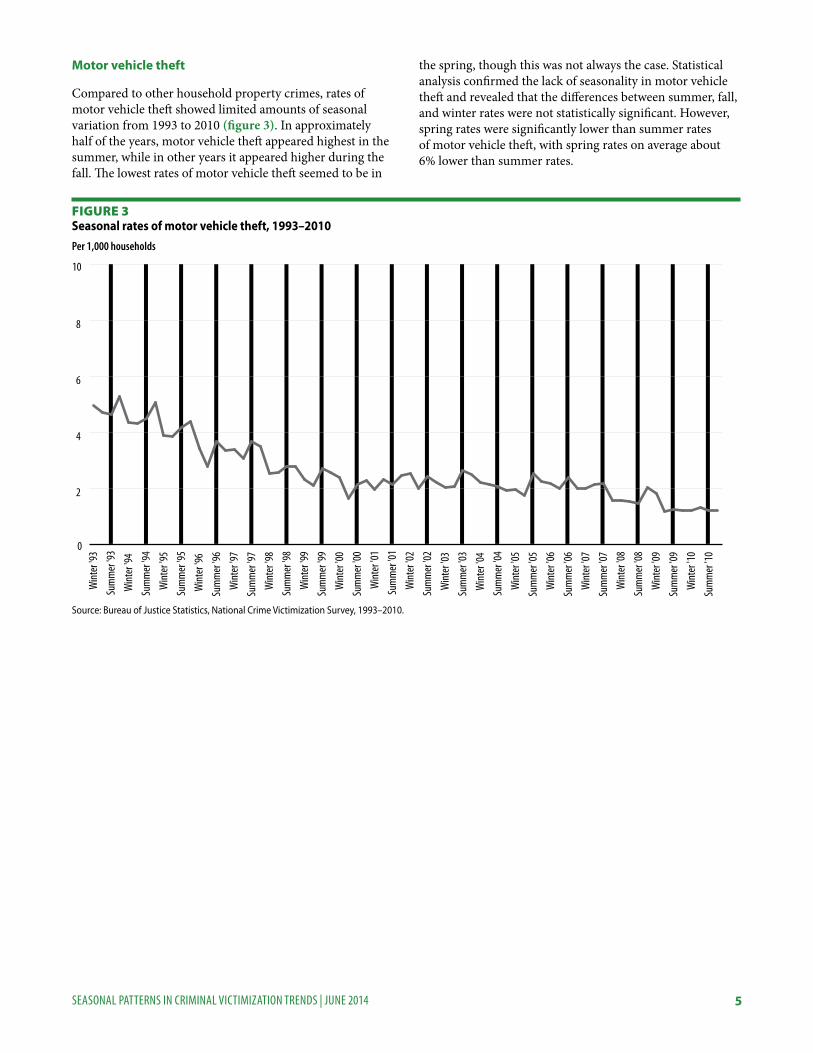
Figure 3Seasonal rates of motor vehicle theft, 1993–2010
Motor vehicle theft
Compared to other household property crimes, rates of motor vehicle theft showed limited amounts of seasonal variation from 1993 to 2010 (figure 3). In approximately half of the years, motor vehicle theft appeared highest in the summer, while in other years it appeared higher during the fall. The lowest rates of motor vehicle theft seemed to be in
the spring, though this was not always the case. Statistical analysis confirmed the lack of seasonality in motor vehicle theft and revealed that the differences between summer, fall, and winter rates were not statistically significant. However, spring rates were significantly lower than summer rates of motor vehicle theft, with spring rates on average about 6% lower than summer rates.
6SeaSonal patternS in Criminal ViCtimization trendS | June 2014
0
20
40
60
80
Sum
mer
'10
Wint
er '1
0Su
mm
er '0
9W
inter
'09
Sum
mer
'08
Wint
er '0
8Su
mm
er '0
7W
inter
'07
Sum
mer
'06
Wint
er '0
6Su
mm
er '0
5W
inter
'05
Sum
mer
'04
Wint
er '0
4Su
mm
er '0
3W
inter
'03
Sum
mer
'02
Wint
er '0
2Su
mm
er '0
1W
inter
'01
Sum
mer
'00
Wint
er '0
0Su
mm
er '9
9W
inter
'99
Sum
mer
'98
Wint
er '9
8Su
mm
er '9
7W
inter
'97
Sum
mer
'96
Wint
er '9
6Su
mm
er '9
5W
inter
'95
Sum
mer
'94
Wint
er '9
4Su
mm
er '9
3W
inter
'93
Per 1,000 households
Source: Bureau of Justice Statistics, National Crime Victimization Survey, 1993–2010.
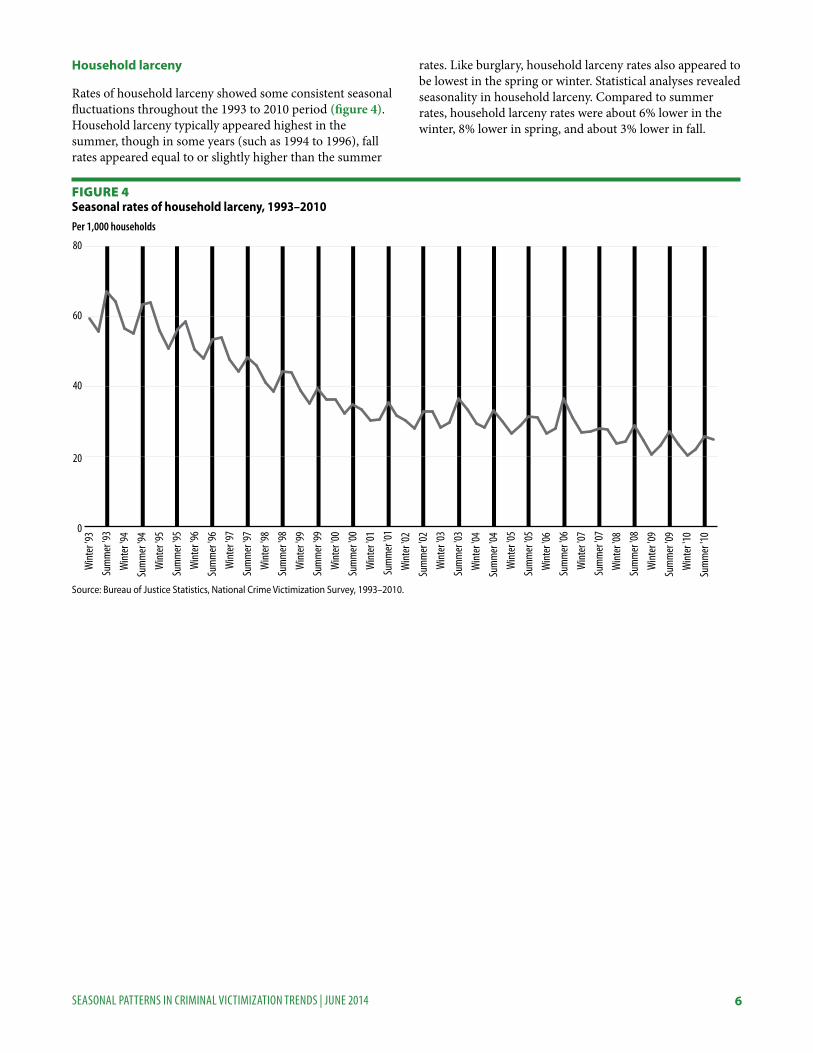
Figure 4Seasonal rates of household larceny, 1993–2010
Household larceny
Rates of household larceny showed some consistent seasonal fluctuations throughout the 1993 to 2010 period (figure 4). Household larceny typically appeared highest in the summer, though in some years (such as 1994 to 1996), fall rates appeared equal to or slightly higher than the summer
rates. Like burglary, household larceny rates also appeared to be lowest in the spring or winter. Statistical analyses revealed seasonality in household larceny. Compared to summer rates, household larceny rates were about 6% lower in the winter, 8% lower in spring, and about 3% lower in fall.

7SeaSonal patternS in Criminal ViCtimization trendS | June 2014
0
5
10
15
20
Sum
mer
'10
Wint
er '1
0Su
mm
er '0
9W
inter
'09
Sum
mer
'08
Wint
er '0
8Su
mm
er '0
7W
inter
'07
Sum
mer
'06
Wint
er '0
6Su
mm
er '0
5W
inter
'05
Sum
mer
'04
Wint
er '0
4Su
mm
er '0
3W
inter
'03
Sum
mer
'02
Wint
er '0
2Su
mm
er '0
1W
inter
'01
Sum
mer
'00
Wint
er '0
0Su
mm
er '9
9W
inter
'99
Sum
mer
'98
Wint
er '9
8Su
mm
er '9
7W
inter
'97
Sum
mer
'96
Wint
er '9
6Su
mm
er '9
5W
inter
'95
Sum
mer
'94
Wint
er '9
4Su
mm
er '9
3W
inter
'93
Per 1,000 persons age 12 or older
Source: Bureau of Justice Statistics, National Crime Victimization Survey, 1993–2010.
Figure 5Seasonal rates of total violent victimization, 1993–2010
Table 2 Average percent difference in seasonal rate of violent victimization, by type of crime, 1993–2010
Total violence
Serious violence
Rape/sexual assault Robbery
Aggravated assault
Simple assault
Winter -4.4%* -5.6%* -9.0%* -2.5% -6.9%* -5.6%*Spring -3.4* -4.7* -6.0 -1.9 -6.0* -4.7*Summer -1.8 ~ ~ -0.6 ~ -5.0*Fall ~ -3.2* -10.4* ~ -3.6* ~Note: See appendix table 2 for regression coefficients and standard errors. *Difference is statistically significant (p < .05, two-tail test). ~Highest rate season used for percentage comparisons.Source: Bureau of Justice Statistics, National Crime Victimization Survey, 1993–2010.
Seasonal patterns in violent victimization
Total violent victimization
Summary indicators and specific types of violence were examined to assess the seasonal patterns for violent victimization. Total violent victimization includes rape and sexual assault, robbery, aggravated assault, and simple assault. Differences in the total violent victimization rates across the winter, spring, summer, and fall exhibited some recurrent seasonal patterns from 1993 to 2010 (figure 5). However, these patterns were different from those observed for household property victimization.
In most years, rates of violence appeared highest in the fall and lowest in the winter, though this was not always the case. On average, statistical analysis indicated that the rates were higher in the fall than in the winter and spring
and that summer rates were statistically similar to rates of violence during the fall (table 2). Though the differences between the fall rates of violence and the winter and spring rates were statistically significant, the seasonal variations were small. On average, rates of violence during the fall were about 4% higher than winter rates and about 3% higher than spring rates.
8SeaSonal patternS in Criminal ViCtimization trendS | June 2014
0
2
4
6
8
10
Sum
mer
'10
Wint
er '1
0Su
mm
er '0
9W
inter
'09
Sum
mer
'08
Wint
er '0
8Su
mm
er '0
7W
inter
'07
Sum
mer
'06
Wint
er '0
6Su
mm
er '0
5W
inter
'05
Sum
mer
'04
Wint
er '0
4Su
mm
er '0
3W
inter
'03
Sum
mer
'02
Wint
er '0
2Su
mm
er '0
1W
inter
'01
Sum
mer
'00
Wint
er '0
0Su
mm
er '9
9W
inter
'99
Sum
mer
'98
Wint
er '9
8Su
mm
er '9
7W
inter
'97
Sum
mer
'96
Wint
er '9
6Su
mm
er '9
5W
inter
'95
Sum
mer
'94
Wint
er '9
4Su
mm
er '9
3W
inter
'93
Per 1,000 persons age 12 or older
Source: Bureau of Justice Statistics, National Crime Victimization Survey, 1993–2010.
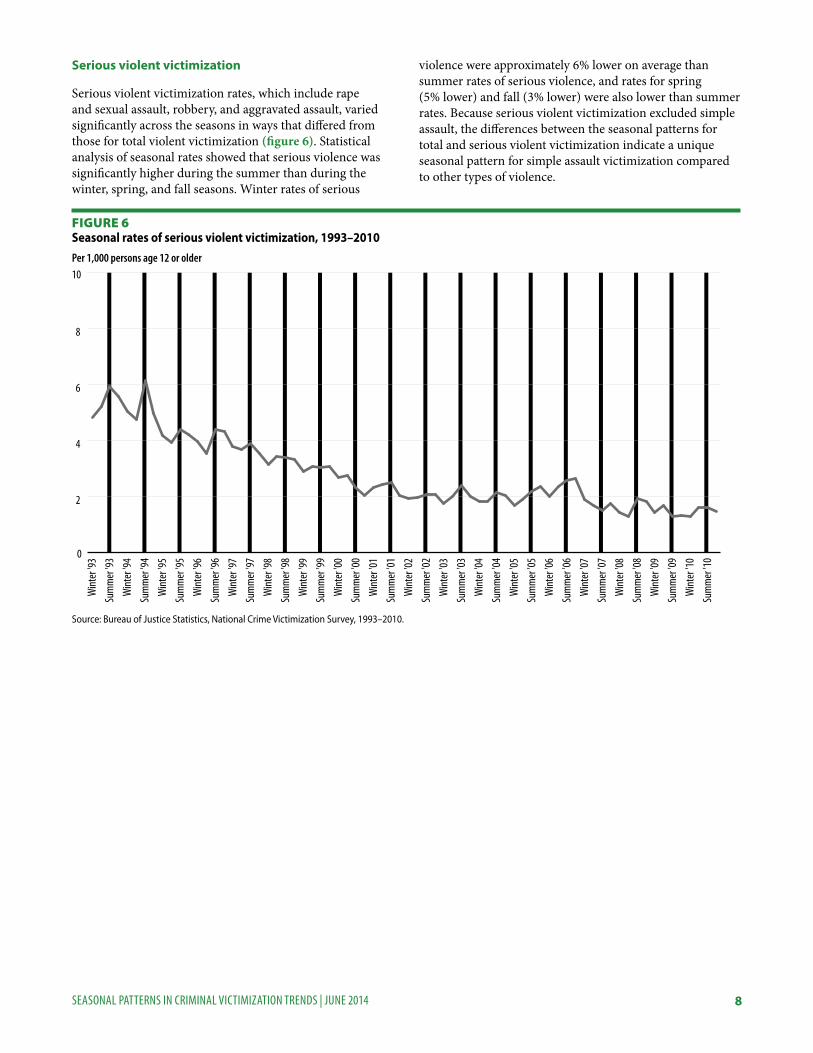
Figure 6Seasonal rates of serious violent victimization, 1993–2010
Serious violent victimization
Serious violent victimization rates, which include rape and sexual assault, robbery, and aggravated assault, varied significantly across the seasons in ways that differed from those for total violent victimization (figure 6). Statistical analysis of seasonal rates showed that serious violence was significantly higher during the summer than during the winter, spring, and fall seasons. Winter rates of serious
violence were approximately 6% lower on average than summer rates of serious violence, and rates for spring (5% lower) and fall (3% lower) were also lower than summer rates. Because serious violent victimization excluded simple assault, the differences between the seasonal patterns for total and serious violent victimization indicate a unique seasonal pattern for simple assault victimization compared to other types of violence.

9SeaSonal patternS in Criminal ViCtimization trendS | June 2014
0.0
0.2
0.4
0.6
0.8
1.0
Sum
mer
'10
Wint
er '1
0Su
mm
er '0
9W
inter
'09
Sum
mer
'08
Wint
er '0
8Su
mm
er '0
7W
inter
'07
Sum
mer
'06
Wint
er '0
6Su
mm
er '0
5W
inter
'05
Sum
mer
'04
Wint
er '0
4Su
mm
er '0
3W
inter
'03
Sum
mer
'02
Wint
er '0
2Su
mm
er '0
1W
inter
'01
Sum
mer
'00
Wint
er '0
0Su
mm
er '9
9W
inter
'99
Sum
mer
'98
Wint
er '9
8Su
mm
er '9
7W
inter
'97
Sum
mer
'96
Wint
er '9
6Su
mm
er '9
5W
inter
'95
Sum
mer
'94
Wint
er '9
4Su
mm
er '9
3W
inter
'93
Per 1,000 persons age 12 or older
Source: Bureau of Justice Statistics, National Crime Victimization Survey, 1993–2010.
Figure 7Seasonal rates of rape and sexual assault, 1993–2010
Rape and sexual assault
When trends in specific types of violent crime were examined separately, differences in seasonal patterns emerged. Rape and sexual assault rates exhibited some regular fluctuation across some of the seasons; however, the patterns did not indicate a single peak season, as the
differences between the summer and spring rates were not statistically significant (figure 7). Winter and fall rates of rape and sexual assault tended to be lower than summer rates, but they were not significantly lower than spring rates. From 1993 to 2010, winter rates of rape and sexual assault were approximately 9% lower on average than summer rates, and fall rates were about 10% lower than summer rates.
10SeaSonal patternS in Criminal ViCtimization trendS | June 2014
0.0
0.4
0.8
1.2
1.6
2.0
Sum
mer
'10
Wint
er '1
0Su
mm
er '0
9W
inter
'09
Sum
mer
'08
Wint
er '0
8Su
mm
er '0
7W
inter
'07
Sum
mer
'06
Wint
er '0
6Su
mm
er '0
5W
inter
'05
Sum
mer
'04
Wint
er '0
4Su
mm
er '0
3W
inter
'03
Sum
mer
'02
Wint
er '0
2Su
mm
er '0
1W
inter
'01
Sum
mer
'00
Wint
er '0
0Su
mm
er '9
9W
inter
'99
Sum
mer
'98
Wint
er '9
8Su
mm
er '9
7W
inter
'97
Sum
mer
'96
Wint
er '9
6Su
mm
er '9
5W
inter
'95
Sum
mer
'94
Wint
er '9
4Su
mm
er '9
3W
inter
'93
Per 1,000 persons age 12 or older
Source: Bureau of Justice Statistics, National Crime Victimization Survey, 1993–2010.
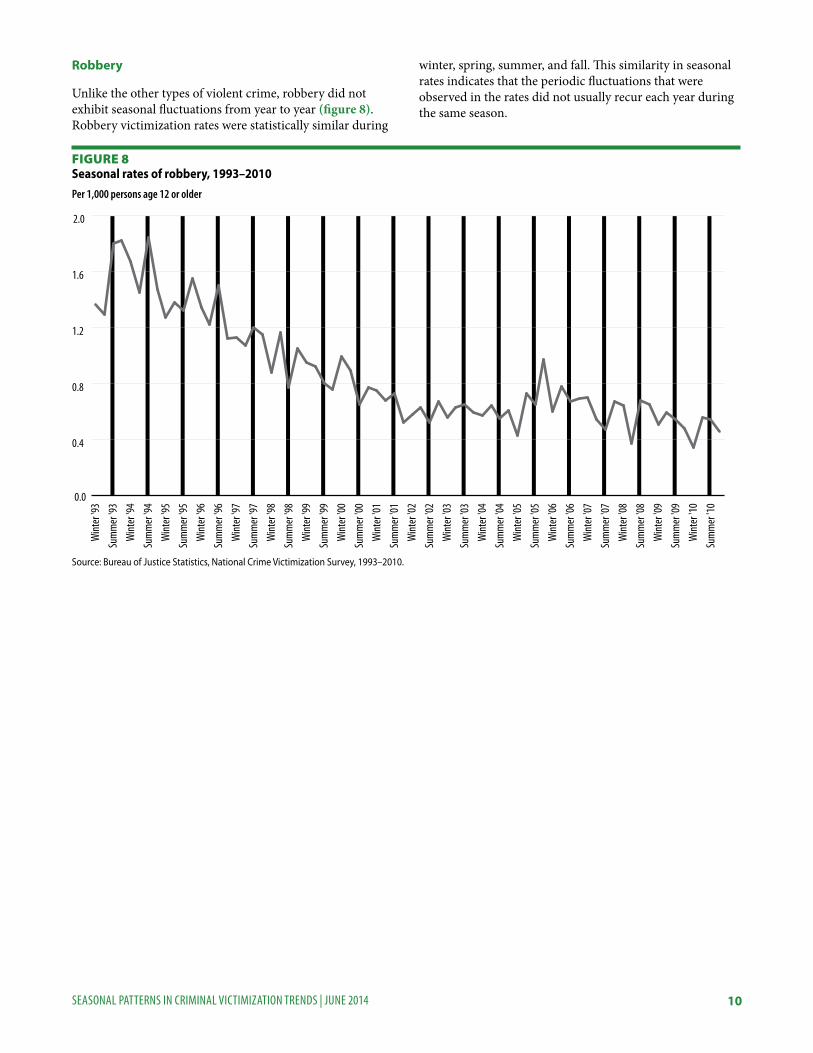
Figure 8Seasonal rates of robbery, 1993–2010
Robbery
Unlike the other types of violent crime, robbery did not exhibit seasonal fluctuations from year to year (figure 8). Robbery victimization rates were statistically similar during
winter, spring, summer, and fall. This similarity in seasonal rates indicates that the periodic fluctuations that were observed in the rates did not usually recur each year during the same season.
11SeaSonal patternS in Criminal ViCtimization trendS | June 2014
0
1
2
3
4
5
Sum
mer
'10
Wint
er '1
0Su
mm
er '0
9W
inter
'09
Sum
mer
'08
Wint
er '0
8Su
mm
er '0
7W
inter
'07
Sum
mer
'06
Wint
er '0
6Su
mm
er '0
5W
inter
'05
Sum
mer
'04
Wint
er '0
4Su
mm
er '0
3W
inter
'03
Sum
mer
'02
Wint
er '0
2Su
mm
er '0
1W
inter
'01
Sum
mer
'00
Wint
er '0
0Su
mm
er '9
9W
inter
'99
Sum
mer
'98
Wint
er '9
8Su
mm
er '9
7W
inter
'97
Sum
mer
'96
Wint
er '9
6Su
mm
er '9
5W
inter
'95
Sum
mer
'94
Wint
er '9
4Su
mm
er '9
3W
inter
'93
Per 1,000 persons age 12 or older
Source: Bureau of Justice Statistics, National Crime Victimization Survey, 1993–2010.
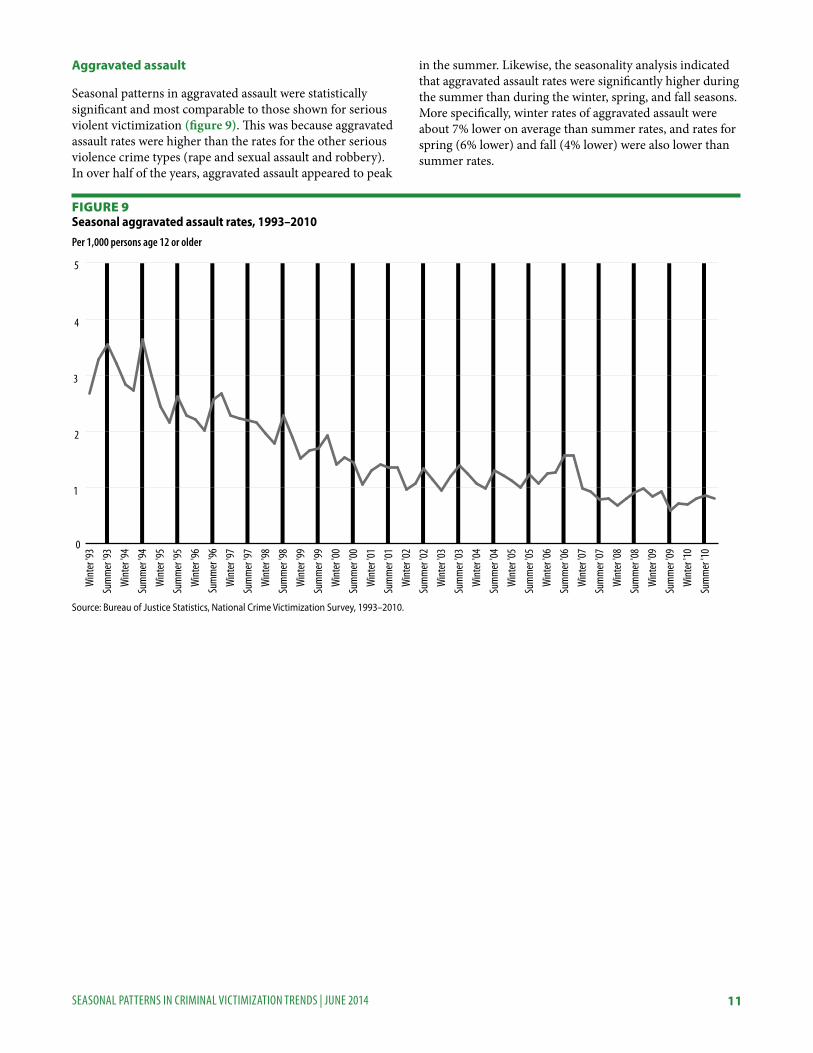
Figure 9Seasonal aggravated assault rates, 1993–2010
Aggravated assault
Seasonal patterns in aggravated assault were statistically significant and most comparable to those shown for serious violent victimization (figure 9). This was because aggravated assault rates were higher than the rates for the other serious violence crime types (rape and sexual assault and robbery). In over half of the years, aggravated assault appeared to peak
in the summer. Likewise, the seasonality analysis indicated that aggravated assault rates were significantly higher during the summer than during the winter, spring, and fall seasons. More specifically, winter rates of aggravated assault were about 7% lower on average than summer rates, and rates for spring (6% lower) and fall (4% lower) were also lower than summer rates.

12SeaSonal patternS in Criminal ViCtimization trendS | June 2014
0
2
4
6
8
10
Sum
mer
'10
Wint
er '1
0Su
mm
er '0
9W
inter
'09
Sum
mer
'08
Wint
er '0
8Su
mm
er '0
7W
inter
'07
Sum
mer
'06
Wint
er '0
6Su
mm
er '0
5W
inter
'05
Sum
mer
'04
Wint
er '0
4Su
mm
er '0
3W
inter
'03
Sum
mer
'02
Wint
er '0
2Su
mm
er '0
1W
inter
'01
Sum
mer
'00
Wint
er '0
0Su
mm
er '9
9W
inter
'99
Sum
mer
'98
Wint
er '9
8Su
mm
er '9
7W
inter
'97
Sum
mer
'96
Wint
er '9
6Su
mm
er '9
5W
inter
'95
Sum
mer
'94
Wint
er '9
4Su
mm
er '9
3W
inter
'93
Per 1,000 persons age 12 or older
Source: Bureau of Justice Statistics, National Crime Victimization Survey, 1993–2010.
Figure 10Seasonal rates of simple assault, 1993–2010
Simple assault
As suggested by the differences in the seasonal patterns for total violence and serious violent victimization, simple assault rates exhibited a unique pattern of seasonality (figure 10). Unlike any other type of violent victimization, simple assault rates were highest in the fall. On average,
winter rates of simple assault were nearly 6% lower than fall rates, while spring and summer rates were about 5% lower than fall rates. This unique seasonal pattern for simple assault was due to the experiences of youth ages 12 to 17 whose victimization experiences exhibited distinct seasonal patterns compared to adults (see textbox on page 13).

13SeaSonal patternS in Criminal ViCtimization trendS | June 2014
0
5
10
15
20
25
30
35
Sum
mer
'10
Wint
er '1
0Su
mm
er '0
9W
inter
'09
Sum
mer
'08
Wint
er '0
8Su
mm
er '0
7W
inter
'07
Sum
mer
'06
Wint
er '0
6Su
mm
er '0
5W
inter
'05
Sum
mer
'04
Wint
er '0
4Su
mm
er '0
3W
inter
'03
Sum
mer
'02
Wint
er '0
2Su
mm
er '0
1W
inter
'01
Sum
mer
'00
Wint
er '0
0Su
mm
er '9
9W
inter
'99
Sum
mer
'98
Wint
er '9
8Su
mm
er '9
7W
inter
'97
Sum
mer
'96
Wint
er '9
6Su
mm
er '9
5W
inter
'95
Sum
mer
'94
Wint
er '9
4Su
mm
er '9
3W
inter
'93
Per 1,000 persons age 12 or older
Age 12–17
Age 18 and older
Source: Bureau of Justice Statistics, National Crime Victimization Survey, 1993–2010.
Figure 11Seasonal rates of simple assault for youth and adults, 1993–2010
Seasonal patterns in simple assault differed for youth and adultsSimple assault victimization rates were higher among youth ages 12 to 17 than among adults age 18 and older and exhibited different peak and trough seasons (figure 11). Simple assault rates among youth were lowest during the summer when the school year ended, and highest in the fall when the school year began. Adult rates of simple assault exhibited relatively less seasonal fluctuation and were highest in the summer.
14SeaSonal patternS in Criminal ViCtimization trendS | June 2014
0.0
0.4
0.8
1.2
1.6
2.0
Sum
mer
'10
Wint
er '1
0Su
mm
er '0
9W
inter
'09
Sum
mer
'08
Wint
er '0
8Su
mm
er '0
7W
inter
'07
Sum
mer
'06
Wint
er '0
6Su
mm
er '0
5W
inter
'05
Sum
mer
'04
Wint
er '0
4Su
mm
er '0
3W
inter
'03
Sum
mer
'02
Wint
er '0
2Su
mm
er '0
1W
inter
'01
Sum
mer
'00
Wint
er '0
0Su
mm
er '9
9W
inter
'99
Sum
mer
'98
Wint
er '9
8Su
mm
er '9
7W
inter
'97
Sum
mer
'96
Wint
er '9
6Su
mm
er '9
5W
inter
'95
Sum
mer
'94
Wint
er '9
4Su
mm
er '9
3W
inter
'93
Per 1,000 persons age 12 or older
Source: Bureau of Justice Statistics, National Crime Victimization Survey, 1993–2010.
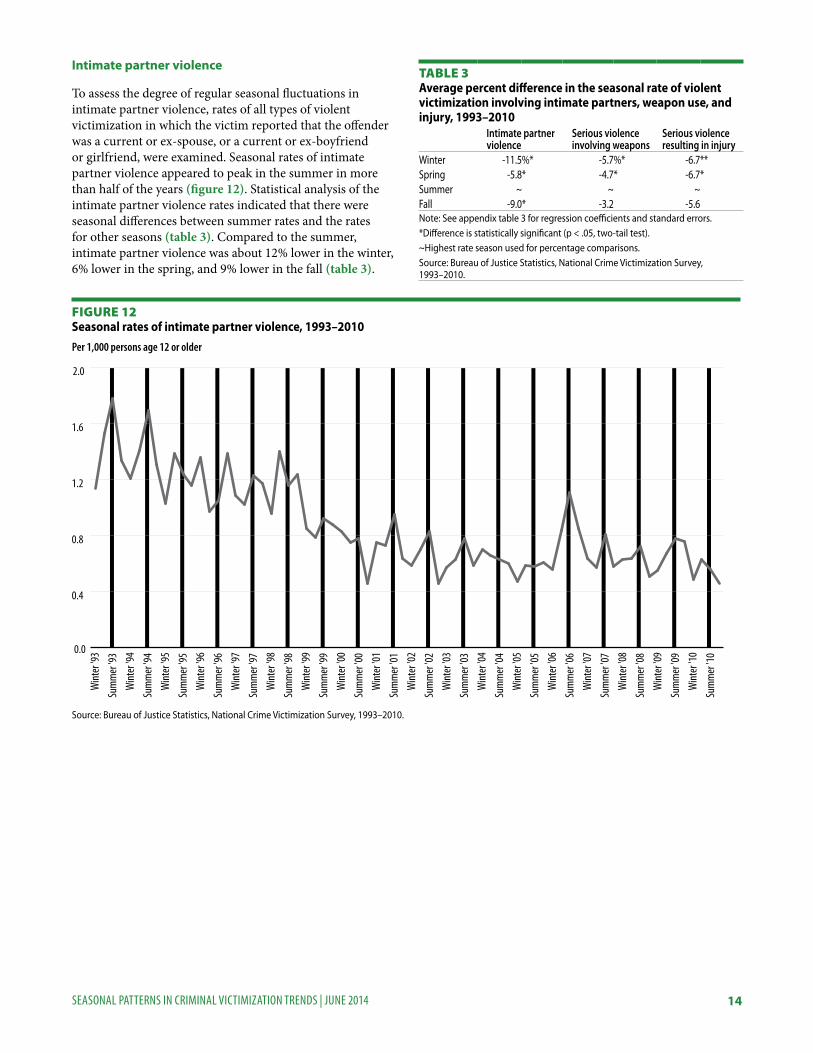
Figure 12Seasonal rates of intimate partner violence, 1993–2010
Table 3 Average percent difference in the seasonal rate of violent victimization involving intimate partners, weapon use, and injury, 1993–2010
Intimate partner violence
Serious violence involving weapons
Serious violence resulting in injury
Winter -11.5%* -5.7%* -6.7**Spring -5.8* -4.7* -6.7*Summer ~ ~ ~Fall -9.0* -3.2 -5.6Note: See appendix table 3 for regression coefficients and standard errors.*Difference is statistically significant (p < .05, two-tail test). ~Highest rate season used for percentage comparisons.Source: Bureau of Justice Statistics, National Crime Victimization Survey, 1993–2010.
Intimate partner violence
To assess the degree of regular seasonal fluctuations in intimate partner violence, rates of all types of violent victimization in which the victim reported that the offender was a current or ex-spouse, or a current or ex-boyfriend or girlfriend, were examined. Seasonal rates of intimate partner violence appeared to peak in the summer in more than half of the years (figure 12). Statistical analysis of the intimate partner violence rates indicated that there were seasonal differences between summer rates and the rates for other seasons (table 3). Compared to the summer, intimate partner violence was about 12% lower in the winter, 6% lower in the spring, and 9% lower in the fall (table 3).
15SeaSonal patternS in Criminal ViCtimization trendS | June 2014
0
2
4
6
8
10
Sum
mer
'10
Wint
er '1
0Su
mm
er '0
9W
inter
'09
Sum
mer
'08
Wint
er '0
8Su
mm
er '0
7W
inter
'07
Sum
mer
'06
Wint
er '0
6Su
mm
er '0
5W
inter
'05
Sum
mer
'04
Wint
er '0
4Su
mm
er '0
3W
inter
'03
Sum
mer
'02
Wint
er '0
2Su
mm
er '0
1W
inter
'01
Sum
mer
'00
Wint
er '0
0Su
mm
er '9
9W
inter
'99
Sum
mer
'98
Wint
er '9
8Su
mm
er '9
7W
inter
'97
Sum
mer
'96
Wint
er '9
6Su
mm
er '9
5W
inter
'95
Sum
mer
'94
Wint
er '9
4Su
mm
er '9
3W
inter
'93
Per 1,000 persons age 12 or older
Source: Bureau of Justice Statistics, National Crime Victimization Survey, 1993–2010.
Figure 13Seasonal rates of serious violent crime involving weapons, 1993–2010
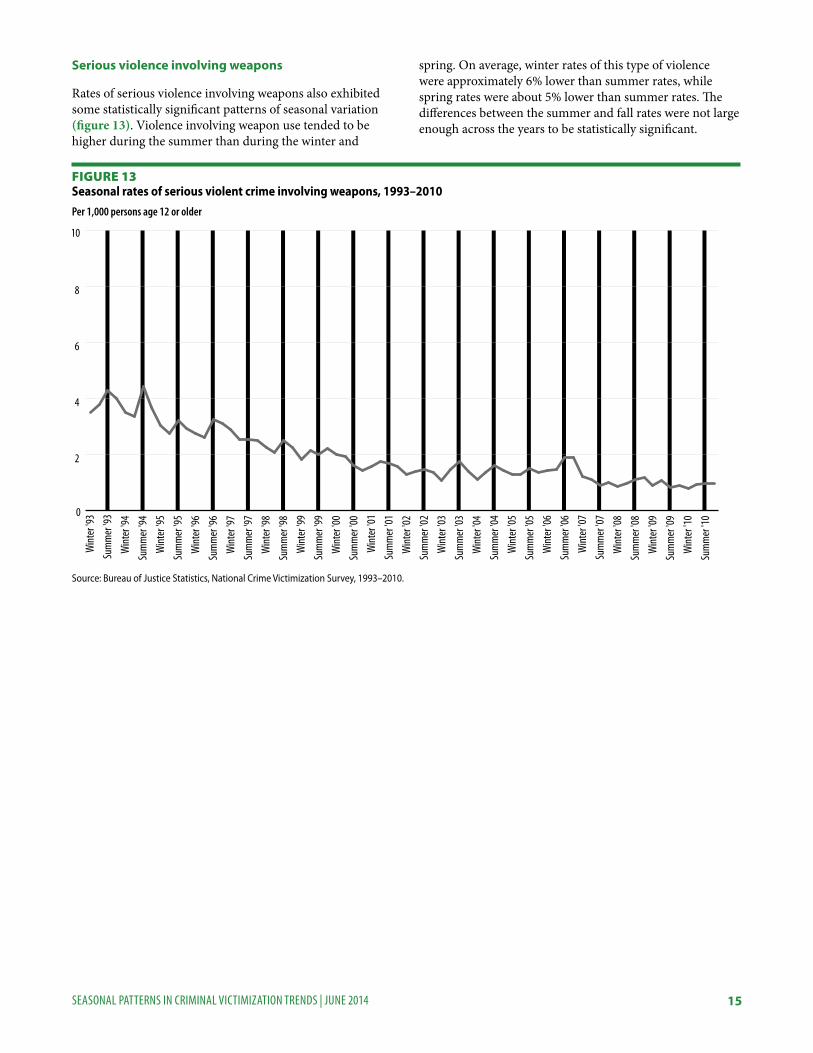
Serious violence involving weapons
Rates of serious violence involving weapons also exhibited some statistically significant patterns of seasonal variation (figure 13). Violence involving weapon use tended to be higher during the summer than during the winter and
spring. On average, winter rates of this type of violence were approximately 6% lower than summer rates, while spring rates were about 5% lower than summer rates. The differences between the summer and fall rates were not large enough across the years to be statistically significant.
16SeaSonal patternS in Criminal ViCtimization trendS | June 2014
0.0
0.5
1.0
1.5
2.0
Sum
mer
'10
Wint
er '1
0Su
mm
er '0
9W
inter
'09
Sum
mer
'08
Wint
er '0
8Su
mm
er '0
7W
inter
'07
Sum
mer
'06
Wint
er '0
6Su
mm
er '0
5W
inter
'05
Sum
mer
'04
Wint
er '0
4Su
mm
er '0
3W
inter
'03
Sum
mer
'02
Wint
er '0
2Su
mm
er '0
1W
inter
'01
Sum
mer
'00
Wint
er '0
0Su
mm
er '9
9W
inter
'99
Sum
mer
'98
Wint
er '9
8Su
mm
er '9
7W
inter
'97
Sum
mer
'96
Wint
er '9
6Su
mm
er '9
5W
inter
'95
Sum
mer
'94
Wint
er '9
4Su
mm
er '9
3W
inter
'93
Per 1,000 persons age 12 or older
Source: Bureau of Justice Statistics, National Crime Victimization Survey, 1993–2010.
Figure 14Seasonal rates of serious violent crime resulting in injury, 1993–2010
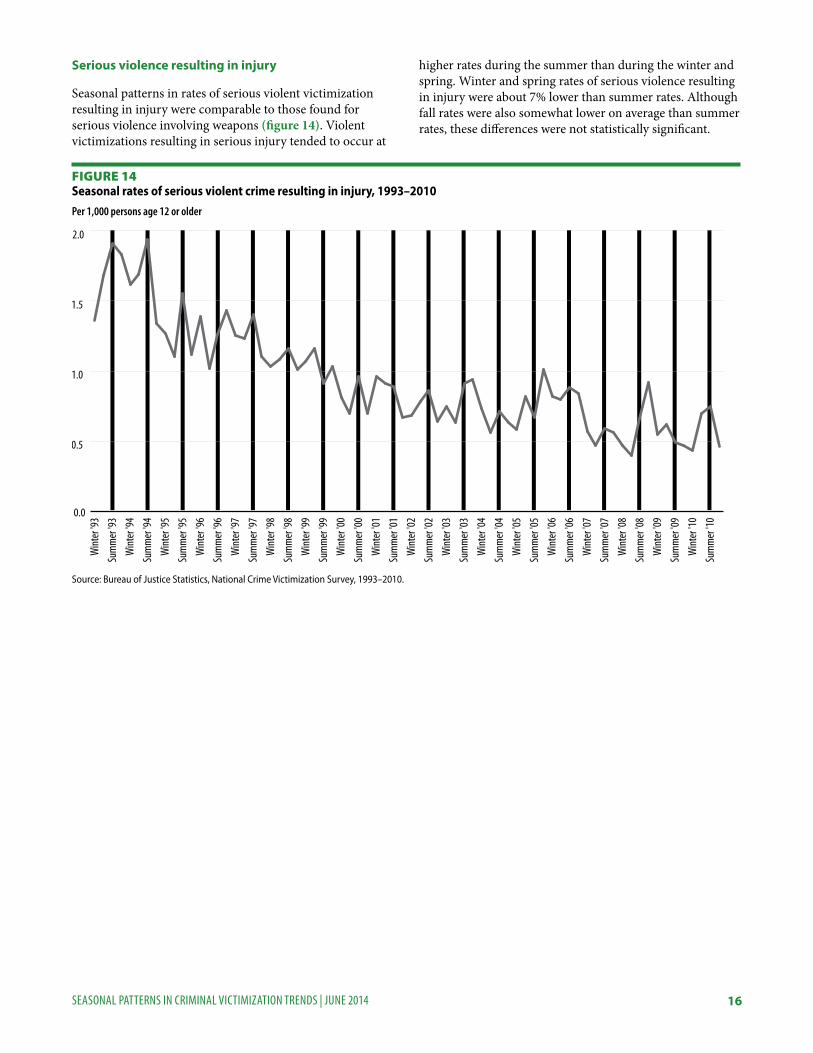
Serious violence resulting in injury
Seasonal patterns in rates of serious violent victimization resulting in injury were comparable to those found for serious violence involving weapons (figure 14). Violent victimizations resulting in serious injury tended to occur at
higher rates during the summer than during the winter and spring. Winter and spring rates of serious violence resulting in injury were about 7% lower than summer rates. Although fall rates were also somewhat lower on average than summer rates, these differences were not statistically significant.
17SeaSonal patternS in Criminal ViCtimization trendS | June 2014
SummaryWith the exception of robbery, each of the violent and household property crimes exhibited a pattern of recurrent seasonal fluctuations in their trends from 1993 to 2010. The most common pattern for household property crimes was that victimization occurred at higher rates during the summer than during other seasons. Motor vehicle theft rates exhibited less regular seasonal fluctuation than household burglary and larceny. While summer rates of motor vehicle theft were higher than spring rates, they were not significantly different from winter and fall rates. Across each type of household property victimization, the fluctuations between the seasonal peak and trough rates are less than 11%. In comparison, the variations in the annual victimization rates from 1993 to 2010 were much larger. For example, the household property victimization rate declined 62% from 318.9 per 1,000 households in 1993 to 120.2 per 1,000 households in 2010.3 Therefore, the variation in household victimization rates across the years was larger than the seasonal fluctuations within the calendar year.
For violent crimes, the most common pattern showed that victimization rates were higher during the summer than during other seasons of the year. However, this pattern had two important exceptions. First, unlike any other type
of violence, robbery rates exhibited no regular seasonal variation over time. Second, simple assault rates were higher in the fall than in the winter, spring, and summer. These findings indicating little seasonality in robbery and peak rates of simple assault in the fall were similar to those found in prior BJS research based on victimization data from the mid-1970s.4
Intimate partner violence rates were higher during the summer than during other seasons of the year. This pattern was more similar to the seasonal variations found for serious violence than for simple assault victimization. Trends in assault resulting in serious injury and assault involving weapons also indicated that summer rates were higher than the rates in other seasons; however, the differences between fall and summer rates in these types of violence were not statistically significant. When seasonal differences in various types of violence were found, the magnitude of the difference between the peak and trough rates was 12% or less. Like household property crime, variations in the annual violent victimization rates from 1993 to 2010 were larger. The violent victimization rate declined 70% from 49.9 per 1,000 persons age 12 or older in 1993 to 14.9 per 1,000 in 2010, varying more from 1993 to 2010 than across the seasons of the year.5
3Criminal Victimization, 2010, NCJ 235508, BJS web, September 2011. 4Crime and Seasonality: National Crime Survey Report, NCJ 64818, BJS web, May 1980.5Criminal Victimization, 2010, NCJ 235508, BJS web, September 2011.
18SeaSonal patternS in Criminal ViCtimization trendS | June 2014
Methodology
Survey coverage
The National Crime Victimization Survey (NCVS) is an annual data collection conducted by the U.S. Census Bureau for the Bureau of Justice Statistics (BJS). The NCVS is a self-report survey in which interviewed persons are asked about the number and characteristics of victimizations they they experienced during the prior 6 months. The NCVS collects information on nonfatal personal crimes (rape or sexual assault, robbery, aggravated and simple assault, and personal larceny) and household property crimes (burglary, motor vehicle theft, and other theft) both reported and not reported to police. In addition to providing annual-level and change estimates on criminal victimization, the NCVS is the primary source of information on the nature of criminal victimization incidents. Survey respondents provide information about themselves (such as age, sex, race and ethnicity, marital status, education level, and income) and whether they experienced a victimization. The survey also collects information about the offender in each victimization incident (such as age, race and ethnicity, sex, and victim–offender relationship), characteristics of the crime (including time and place, use of weapons, nature of injury, and economic consequences), whether the crime was reported to police, reasons why the crime was or was not reported, and experiences with the criminal justice system.
The NCVS is administered to persons age 12 or older from a nationally representative sample of households in the United States. The NCVS defines a household as a group of members who all reside at a sampled address. Persons are considered household members when the sampled address is their usual place of residence at the time of the interview and when they have no usual place of residence elsewhere. Once selected, households remain in the sample for 3 years, and eligible persons in these households are interviewed every 6 months for a total of seven interviews. New households rotate into the sample on an ongoing basis to replace outgoing households that have been in the sample for the 3-year period. The sample includes persons living in group quarters, such as dormitories, rooming houses, and religious group dwellings, and excludes persons living in military barracks and institutional settings, such as correctional or hospital facilities, and homeless shelters. (For more detail, see Survey Methodology in Criminal Victimization in the United States, 2008, NCJ 231173, BJS web, May 2011.)
Nonresponse and weighting adjustments
In 2010, about 41,000 households and 73,300 individuals age 12 or older were interviewed for the NCVS. Each household was interviewed twice during the year. The response rate was 92.3% of households and 87.5% of eligible individuals. Victimizations that occurred outside of the U.S. were excluded from this report.
Estimates in this report use data from the 1993 to 2010 NCVS data files. These files can be weighted to produce annual estimates of victimization for persons age 12 or older living in U.S. households. Because the NCVS relies on a sample rather than a census of the entire U.S. population, weights are designed to inflate sample point estimates to known population totals and to compensate for survey nonresponse and other aspects of the sample design.
The NCVS data files include both person and household weights. Person weights provide an estimate of the population represented by each person in the sample. Household weights provide an estimate of the U.S. household population represented by each household in the sample. After proper adjustment, both household and person weights are also typically used to form the denominator in calculations of crime rates.
Victimization weights used in this analysis account for the number of persons present during an incident. High-frequency repeat victimizations (or series victimizations) are handled differently in this report than in recent BJS victimization reports because they present a special problem for seasonality analysis. Series victimizations are similar in type but occur with such frequency that a victim is unable to recall each individual event or describe each event in detail. Survey procedures allow NCVS interviewers to identify and classify these similar victimizations as series victimizations and to collect detailed information on only the most recent incident in the series. Because the month in which a victimization occurred is recorded only for the most recent incident, series victimizations are treated as a single victimization. The percentage of victimizations reported as series victimizations declined from 1993 to 2010. In 2010, series incidents accounted for about 1% of household property victimizations and about 3% of violent victimizations.

19SeaSonal patternS in Criminal ViCtimization trendS | June 2014
Methodological changes to the NCVS in 2006
Methodological changes implemented in 2006 may have affected the crime estimates for that year to such an extent that they are not comparable to estimates from other years. Evaluation of 2007 and later data from the NCVS conducted by BJS and the Census Bureau found a high degree of confidence that estimates for 2007, 2008, 2009, and 2010 are consistent with and comparable to estimates for 2005 and previous years. The reports, Criminal Victimization, 2006, NCJ 219413, December 2007; Criminal Victimization, 2007, NCJ 224390, December 2008; Criminal Victimization, 2008, NCJ 227777, September 2009; Criminal Victimization, 2009, NCJ 231327, October 2010; and Criminal Victimization, 2010, NCJ 235508, September 2011, are available on the BJS website.
Estimating and analyzing seasonal victimization rates
Victims’ reports of the month in which the incident occurred are used to estimate seasonal rates of victimization. Seasons of the year are defined according to the month in which the season begins. Therefore, winter rates include in December, January, and February incidents; spring rates include March, April, and May incidents; summer rates include June, July, and August incidents; and fall rates include September, October, and November incidents. The 1993 to 2010 seasonal victimization rates include incidents occurring from December 1992 through November 2010. Seasonal household property victimization rates are estimated by dividing the weighted number of incidents by the weighted number of households and multiplying by 1,000. Violent victimization rates are estimated by dividing the weighted number of incidents by the weighted number of persons age 12 and older and multiplying by 1,000. Sampling weights are used in all population estimates.
The NCVS has three important design features that reduce potential errors in measuring the month in which victimization occurred. First, the relatively short 6-month reference period reduces the chances that victims will forget the incident, underreport victimizations, and attribute incidents to the wrong month. Second, the bounding procedure provides a reference point for respondents about previously reported incidents, and thereby reduces telescoping and minimizes error in assigning dates to incidents. Third, the rotating panel structure of the survey is designed so that data are collected from respondents in each month of the year. This minimizes recency bias errors in reporting the dates of incidents, which may occur if the survey was administered only once during a fixed period each year.
The extent and statistical significance of seasonal patterns in household property victimization and violent victimization are estimated by developing regression models that decompose each of the victimization trends into three
components: the long-term trend, seasonal variation around that trend, and error. To ensure that the results are robust, two regression-based approaches were used along with various sensitivity tests. For each analysis, variables representing the seasons of the year were regressed on each victimization trend to estimate the difference between the peak seasonal rate and the rates in the other seasons.
The first approach estimated ordinary least squares regression models for each victimization series and included year fixed effects to account for the long-term trend. The degree of autocorrelation in the error structure was estimated using Breusch-Godfrey tests for up to four lagged periods. For victimization series in which autocorrelated error was present, a lagged indicator was found to remove the autocorrelation. In a few instances, autocorrelated errors persisted despite a variety of lag specifications; therefore, Newey-West standard errors were estimated to take into account the potential influences of autocorrelation and heteroskedasticity in the error structure.
The second approach re-estimated the regression models for each victimization series using first differences in rates to examine whether the seasonality results were replicated when the models accounted for possible stochastic nonstationarity in the trends. Autocorrelated errors were similarly assessed and handled in the first-difference models and the conclusions about the statistical significance of each of the seasonal coefficients were replicated in these results. Stationarity in the victimization trends in levels and first differences was examined using Dickey-Fuller and Philips-Perron tests.
Additional diagnostic tests were performed to ensure that the models, and therefore estimates of the seasonal differences, fit the observed seasonal rates. These included visual inspections of observed and predicted trends and model-fit improvement F-tests that compared the results based on long-term trends to those based on long-term trends plus seasonal variations. Further details about this statistical process using the burglary trend as an illustration are shown in appendix table 4.
The results from the series of regression models shown in this report are presented in levels and converted to relative percentage differences because this information provides a more intuitive interpretation of the magnitude of seasonal variation relative to the average rate across the time period. These percentages are obtained by comparing the coefficient for each season against the estimated comparison rate (typically the summer) represented by the constant. The regression results that resulted in the percentages are shown in appendix tables 1–4.
20SeaSonal patternS in Criminal ViCtimization trendS | June 2014
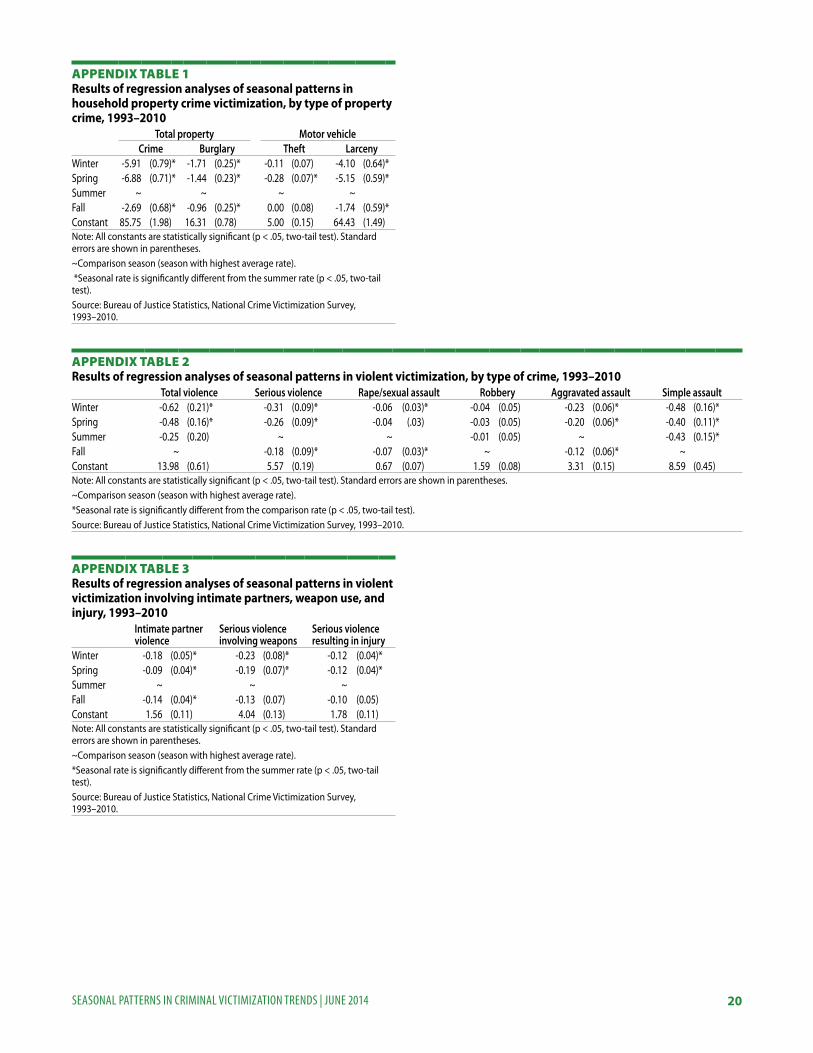
appendix Table 1 Results of regression analyses of seasonal patterns in household property crime victimization, by type of property crime, 1993–2010
Total property Motor vehicleCrime Burglary Theft Larceny
Winter -5.91 (0.79)* -1.71 (0.25)* -0.11 (0.07) -4.10 (0.64)*Spring -6.88 (0.71)* -1.44 (0.23)* -0.28 (0.07)* -5.15 (0.59)*Summer ~ ~ ~ ~Fall -2.69 (0.68)* -0.96 (0.25)* 0.00 (0.08) -1.74 (0.59)*Constant 85.75 (1.98) 16.31 (0.78) 5.00 (0.15) 64.43 (1.49)Note: All constants are statistically significant (p < .05, two-tail test). Standard errors are shown in parentheses. ~Comparison season (season with highest average rate). *Seasonal rate is significantly different from the summer rate (p < .05, two-tail test).Source: Bureau of Justice Statistics, National Crime Victimization Survey, 1993–2010.
appendix Table 2Results of regression analyses of seasonal patterns in violent victimization, by type of crime, 1993–2010
Total violence Serious violence Rape/sexual assault Robbery Aggravated assault Simple assaultWinter -0.62 (0.21)* -0.31 (0.09)* -0.06 (0.03)* -0.04 (0.05) -0.23 (0.06)* -0.48 (0.16)*Spring -0.48 (0.16)* -0.26 (0.09)* -0.04 (.03) -0.03 (0.05) -0.20 (0.06)* -0.40 (0.11)*Summer -0.25 (0.20) ~ ~ -0.01 (0.05) ~ -0.43 (0.15)*Fall ~ -0.18 (0.09)* -0.07 (0.03)* ~ -0.12 (0.06)* ~Constant 13.98 (0.61) 5.57 (0.19) 0.67 (0.07) 1.59 (0.08) 3.31 (0.15) 8.59 (0.45)Note: All constants are statistically significant (p < .05, two-tail test). Standard errors are shown in parentheses.~Comparison season (season with highest average rate).*Seasonal rate is significantly different from the comparison rate (p < .05, two-tail test).Source: Bureau of Justice Statistics, National Crime Victimization Survey, 1993–2010.
appendix Table 3Results of regression analyses of seasonal patterns in violent victimization involving intimate partners, weapon use, and injury, 1993–2010
Intimate partner violence
Serious violence involving weapons
Serious violence resulting in injury
Winter -0.18 (0.05)* -0.23 (0.08)* -0.12 (0.04)*Spring -0.09 (0.04)* -0.19 (0.07)* -0.12 (0.04)*Summer ~ ~ ~Fall -0.14 (0.04)* -0.13 (0.07) -0.10 (0.05)Constant 1.56 (0.11) 4.04 (0.13) 1.78 (0.11)Note: All constants are statistically significant (p < .05, two-tail test). Standard errors are shown in parentheses. ~Comparison season (season with highest average rate).*Seasonal rate is significantly different from the summer rate (p < .05, two-tail test).Source: Bureau of Justice Statistics, National Crime Victimization Survey, 1993–2010.

21SeaSonal patternS in Criminal ViCtimization trendS | June 2014
appendix Table 4 Expanded detail of regression model results for seasonal burglary rates, 1994–2010
OLS Model 1 OLS Model 2First differences model
Variable b s.e.b b s.e.b b s.e.bWinter - - -1.71 0.25* -1.94 0.20*Spring - - -1.44 0.23* -1.56 0.17*Fall - - -0.96 0.25* -0.84 0.17*1994 -1.33 1.39 -1.33 0.92 - -1995 -3.16 1.18* -3.16 0.72* - -1996 -3.33 1.12* -3.33 0.71* - -1997 -4.16 1.06* -4.16 0.71* - -1998 -5.69 1.05* -5.69 0.77* - -1999 -6.72 1.09* -6.72 0.73* - -2000 -7.53 1.06* -7.53 0.79* - -2001 -8.00 1.06* -8.00 0.73* - -2002 -8.11 1.08* -8.11 0.72* - -2003 -7.78 1.11* -7.78 0.70* - -2004 -7.81 1.08* -7.81 0.69* - -2005 -7.48 1.10* -7.48 0.79* - -2006 -7.88 1.10* -7.88 0.71* - -2007 -8.66 1.03* -8.66 0.76* - -2008 -8.50 1.09* -8.50 0.75* - -2009 -9.02 1.20* -9.02 0.74* - -2010 -9.18 1.11* -9.18 0.72* - -Constanta 15.28 1.03* 16.31 0.78* -0.12 0.10R2 0.91 0.96 0.61Note: Breusch-Godfrey test for autocorrelation, not significant (lag 1). Dickey-Fuller and Phillips-Perron tests show burglary trends are not stationary. Dickey-Fuller and Phillips-Perron tests show burglary trends are stationary in first differences.*p < .05 (two-tail test).aOmitted year is 1993.Source: Bureau of Justice Statistics, National Crime Victimization Survey, 1993–2010.

Office of Justice ProgramsInnovation • Partnerships • Safer Neighborhoods
www.ojp.usdoj.gov
The Bureau of Justice Statistics, located in the Office of Justice Programs, U.S. Department of Justice, collects, analyzes, and disseminates statistical information on crime, criminal offenders, victims of crime, and the operation of justice systems at all levels of government. William J. Sabol is acting director.
This report was written and verified by Janet L. Lauritsen and Nicole White, University of Missouri - St. Louis. Lynn Langton assisted with verification.
Jill Thomas edited the report. Barbara Quinn produced the report.
June 2014, NCJ 245959