burst overlapping of alos-2 palsar-2 scansar-scansar...
TRANSCRIPT
Burst overlapping of ALOS-2 PALSAR-2 ScanSAR-ScanSAR interferometry
Japan Aerospace Exploration Agency
Earth Observation Research Center
Ryo Natsuaki, Takeshi Motohka, Shinichi Suzuki and Masanobu Shimada
Outline
1. Introduction
2. ALOS-2 ScanSAR burst misalignment befor Feb. 8, 2015
3. Burst misalignment after Feb. 8, 2015
4. Conclusion
Outline
1. Introduction
2. ALOS-2 ScanSAR burst misalignment befor Feb. 8, 2015
3. Burst misalignment after Feb. 8, 2015
4. Conclusion
Spotlight Ultra FineHigh
sensitiveFine
ScanSAR
nominal
ScanSAR
wide
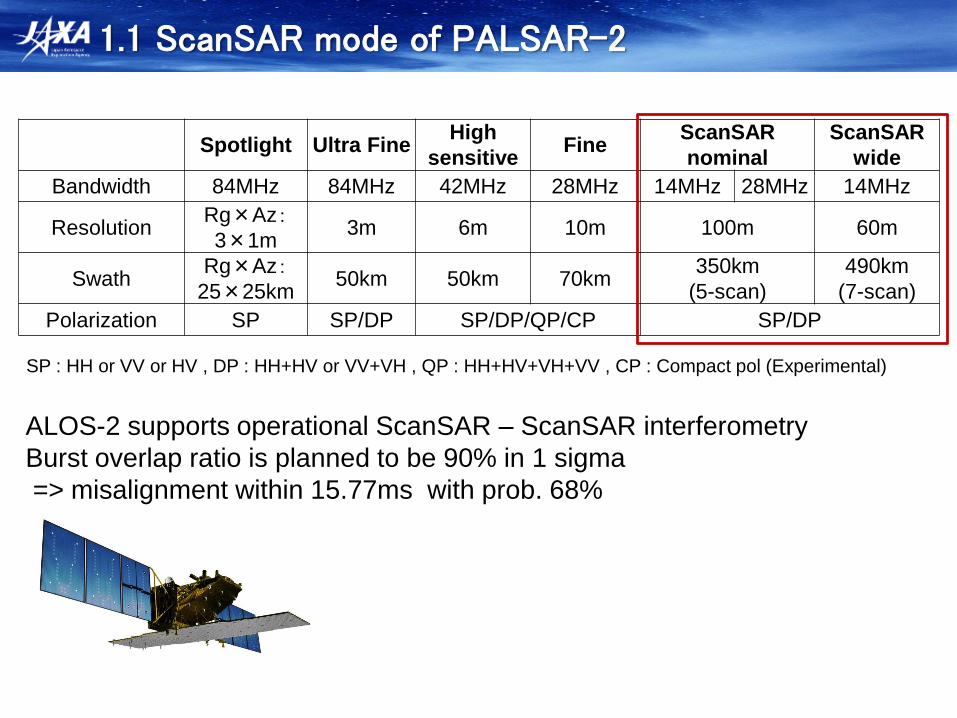
Bandwidth 84MHz 84MHz 42MHz 28MHz 14MHz 28MHz 14MHz
ResolutionRg×Az:3×1m
3m 6m 10m 100m 60m
SwathRg×Az:
25×25km50km 50km 70km
350km
(5-scan)
490km
(7-scan)
Polarization SP SP/DP SP/DP/QP/CP SP/DP
ALOS-2 supports operational ScanSAR – ScanSAR interferometry
Burst overlap ratio is planned to be 90% in 1 sigma
=> misalignment within 15.77ms with prob. 68%
SP : HH or VV or HV , DP : HH+HV or VV+VH , QP : HH+HV+VH+VV , CP : Compact pol (Experimental)
1.1 ScanSAR mode of PALSAR-2
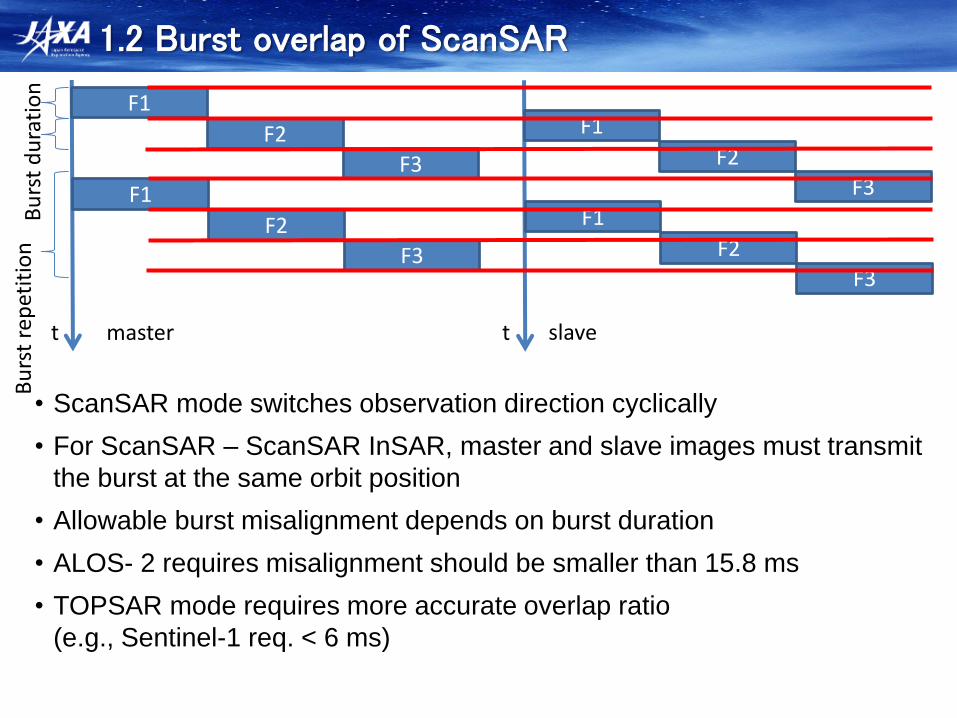
1.2 Burst overlap of ScanSAR
• ScanSAR mode switches observation direction cyclically
• For ScanSAR – ScanSAR InSAR, master and slave images must transmit
the burst at the same orbit position
• Allowable burst misalignment depends on burst duration
• ALOS- 2 requires misalignment should be smaller than 15.8 ms
• TOPSAR mode requires more accurate overlap ratio
(e.g., Sentinel-1 req. < 6 ms)
F1
F2
F3
F1
F2
F3
F1
F2
F3
F1
F2
F3
master
F1
F2
F3
F1
F2
F3
F1
F2
F3
F1
F2
F3
slavett
Bu
rst
du
rati
on
Bu
rst
rep
etit
ion
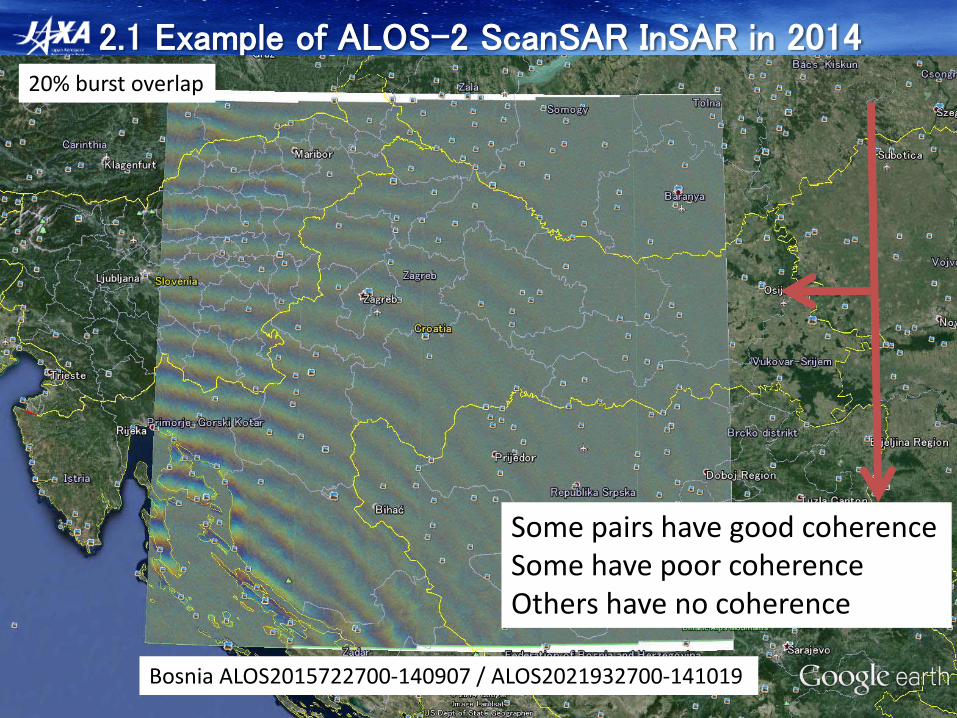
2.1 Example of ALOS-2 ScanSAR InSAR in 2014
Bosnia ALOS2015722700-140907 / ALOS2021932700-141019
Some pairs have good coherenceSome have poor coherenceOthers have no coherence
20% burst overlap
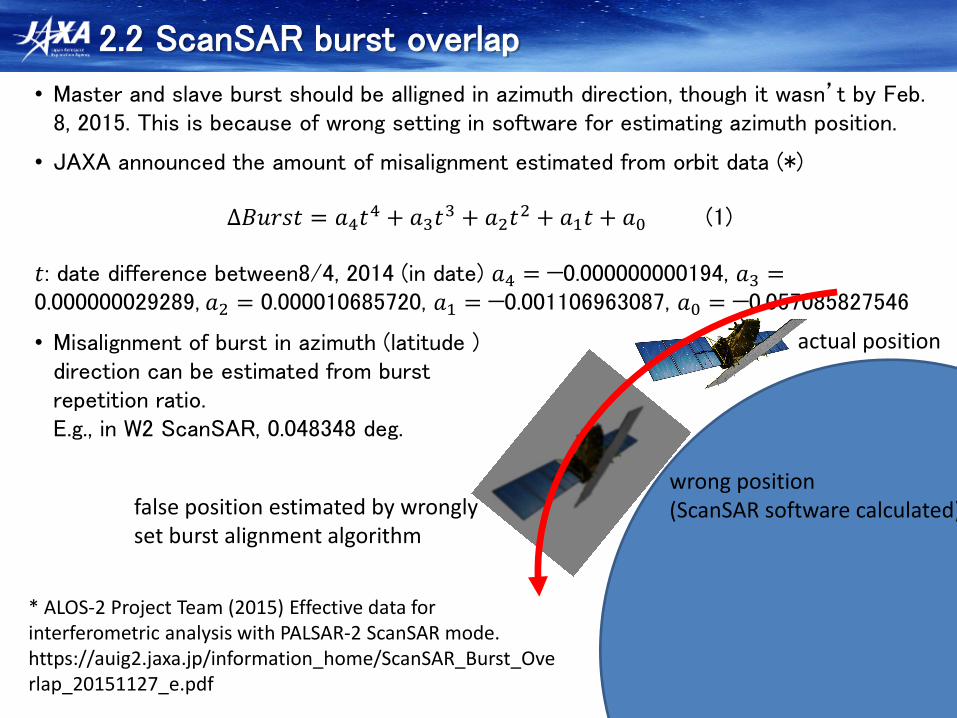
• Master and slave burst should be alligned in azimuth direction, though it wasn’t by Feb. 8, 2015. This is because of wrong setting in software for estimating azimuth position.
• JAXA announced the amount of misalignment estimated from orbit data (*)
∆𝐵𝑢𝑟𝑠𝑡 = 𝑎4𝑡4 + 𝑎3𝑡
3 + 𝑎2𝑡2 + 𝑎1𝑡 + 𝑎0 (1)
𝑡: date difference between8/4, 2014 (in date) 𝑎4 = −0.000000000194, 𝑎3 =0.000000029289, 𝑎2 = 0.000010685720, 𝑎1 = −0.001106963087, 𝑎0 = −0.057085827546
• Misalignment of burst in azimuth (latitude ) direction can be estimated from burst repetition ratio.E.g., in W2 ScanSAR, 0.048348 deg.
2.2 ScanSAR burst overlap
* ALOS-2 Project Team (2015) Effective data for interferometric analysis with PALSAR-2 ScanSAR mode. https://auig2.jaxa.jp/information_home/ScanSAR_Burst_Overlap_20151127_e.pdf
actual position
false position estimated by wrongly set burst alignment algorithm
wrong position(ScanSAR software calculated)
** Lindsey, E.O., Natsuaki, R. et al., “Line of sight displacement from ALOS-2 interferometry: M7.8 Gorkha earthquake and mw 7.3 aftershock,” Geophysical Research Letters , doi:10.1002/2015GL065385.
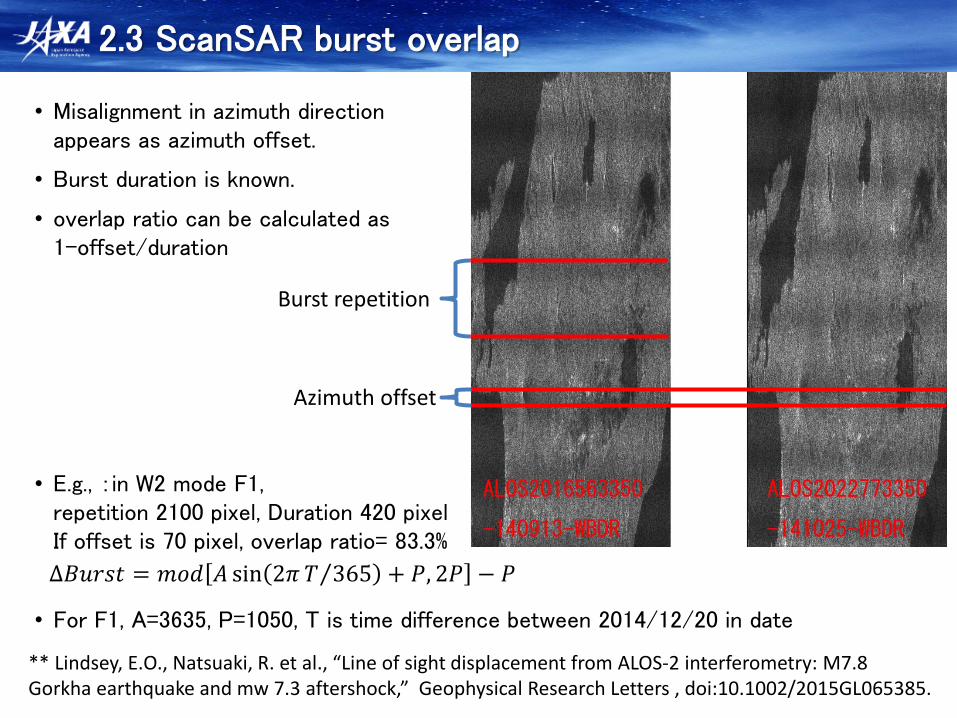
2.3 ScanSAR burst overlap
• Misalignment in azimuth direction appears as azimuth offset.
• Burst duration is known.
• overlap ratio can be calculated as1-offset/duration
• E.g., :in W2 mode F1,repetition 2100 pixel, Duration 420 pixelIf offset is 70 pixel, overlap ratio= 83.3%
• For F1, A=3635, P=1050, T is time difference between 2014/12/20 in date
Azimuth offset
Burst repetition
∆𝐵𝑢𝑟𝑠𝑡 = 𝑚𝑜𝑑 𝐴 sin 2𝜋 𝑇 365 + 𝑃, 2𝑃 − 𝑃
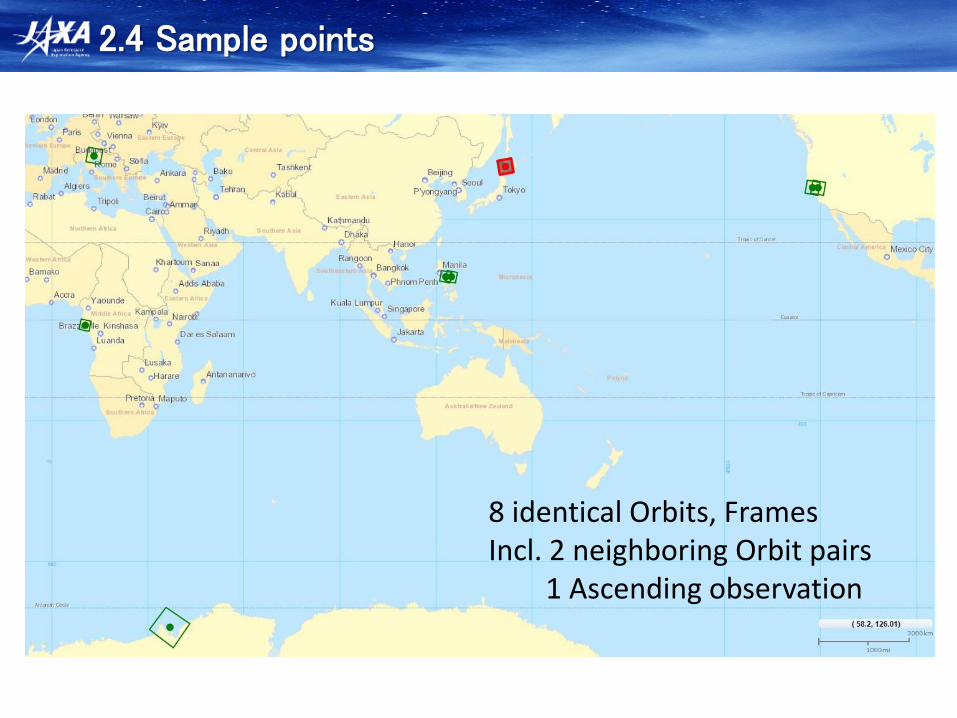
2.4 Sample points
8 identical Orbits, FramesIncl. 2 neighboring Orbit pairs
1 Ascending observation
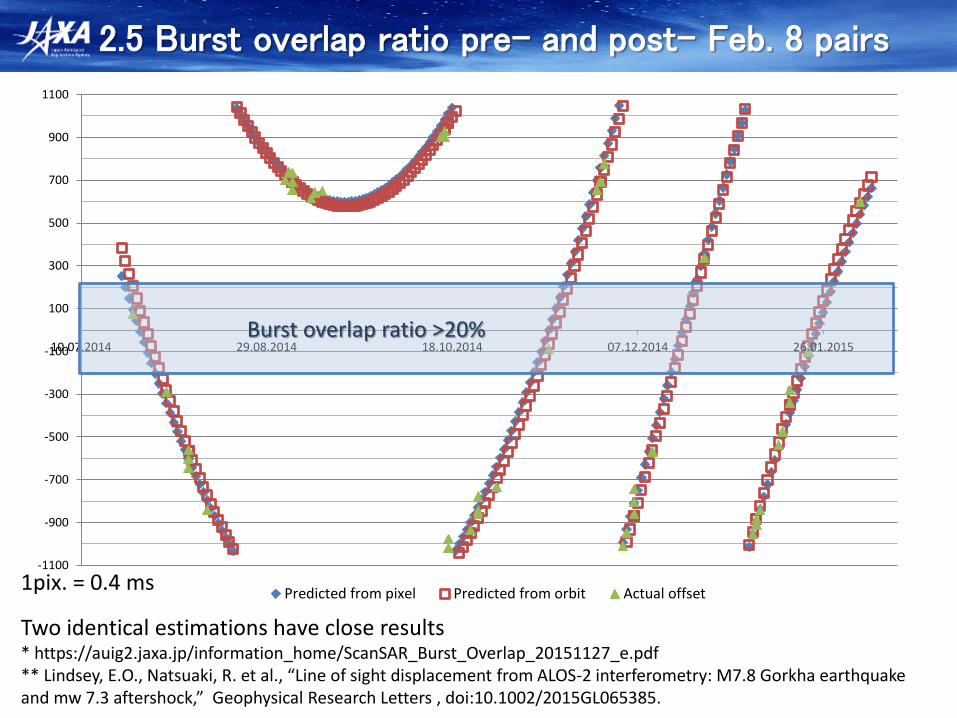
2.5 Burst overlap ratio pre- and post- Feb. 8 pairs
-1100
-900
-700
-500
-300
-100
100
300
500
700
900
1100
10.07.2014 29.08.2014 18.10.2014 07.12.2014 26.01.2015
Predicted from pixel Predicted from orbit Actual offset
Burst overlap ratio >20%
Two identical estimations have close results* https://auig2.jaxa.jp/information_home/ScanSAR_Burst_Overlap_20151127_e.pdf** Lindsey, E.O., Natsuaki, R. et al., “Line of sight displacement from ALOS-2 interferometry: M7.8 Gorkha earthquake and mw 7.3 aftershock,” Geophysical Research Letters , doi:10.1002/2015GL065385.
1pix. = 0.4 ms
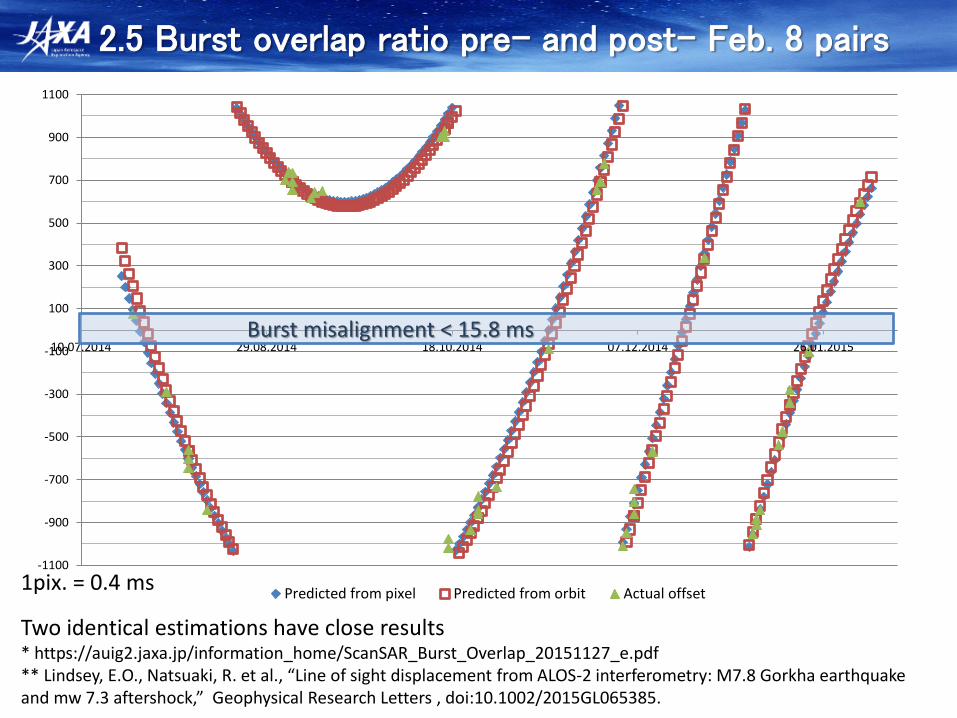
2.5 Burst overlap ratio pre- and post- Feb. 8 pairs
-1100
-900
-700
-500
-300
-100
100
300
500
700
900
1100
10.07.2014 29.08.2014 18.10.2014 07.12.2014 26.01.2015
Predicted from pixel Predicted from orbit Actual offset
Burst misalignment < 15.8 ms
Two identical estimations have close results* https://auig2.jaxa.jp/information_home/ScanSAR_Burst_Overlap_20151127_e.pdf** Lindsey, E.O., Natsuaki, R. et al., “Line of sight displacement from ALOS-2 interferometry: M7.8 Gorkha earthquake and mw 7.3 aftershock,” Geophysical Research Letters , doi:10.1002/2015GL065385.
1pix. = 0.4 ms
Outline
1. Introduction
2. ALOS-2 ScanSAR burst misalignment befor Feb. 8, 2015
3. Burst misalignment after Feb. 8, 2015
4. Conclusion
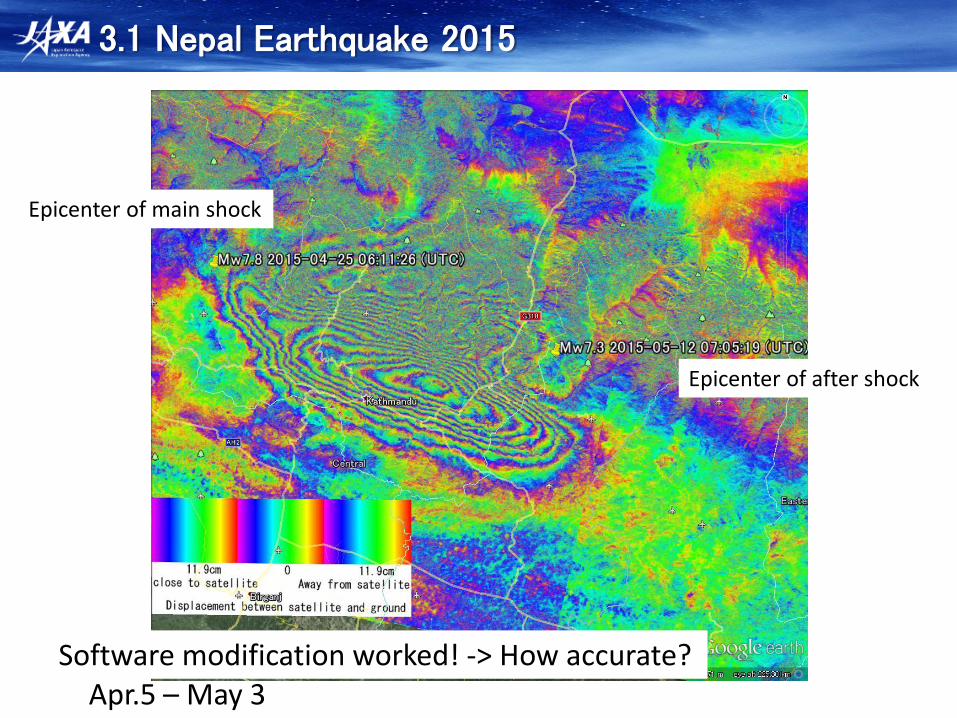
3.1 Nepal Earthquake 2015
Epicenter of main shock
Epicenter of after shock
Apr.5 – May 3Software modification worked! -> How accurate?
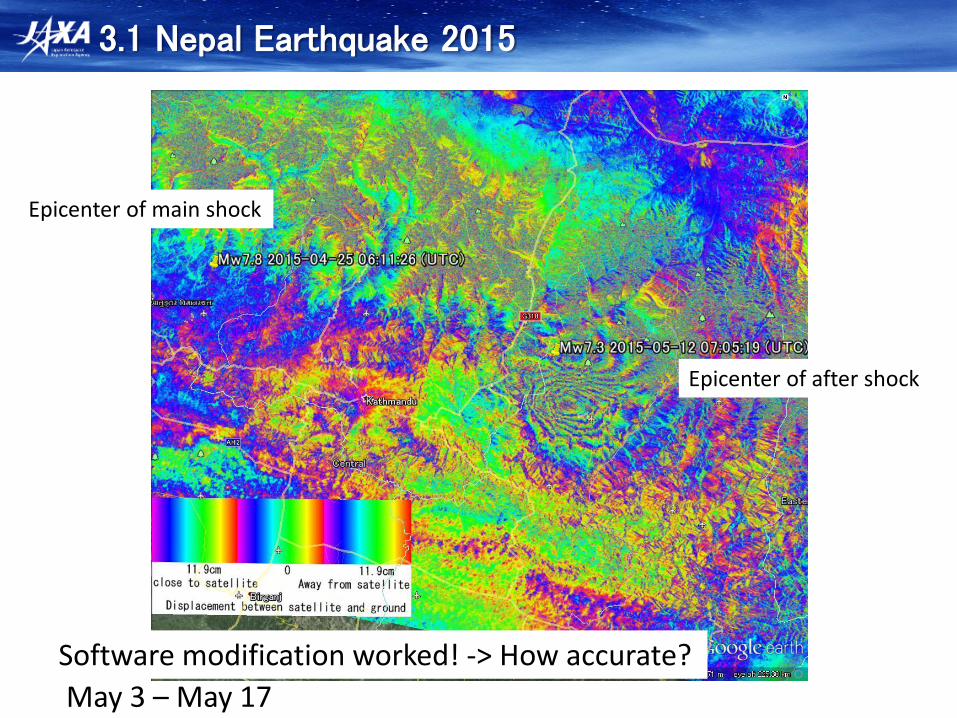
3.1 Nepal Earthquake 2015
Epicenter of main shock
Epicenter of after shock
May 3 – May 17
Software modification worked! -> How accurate?
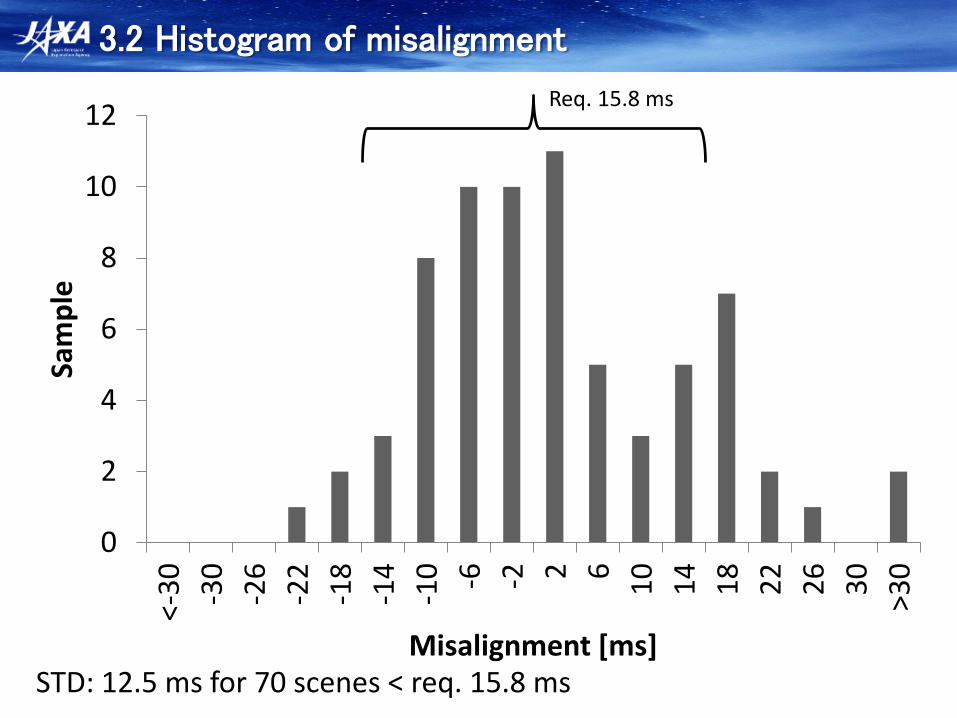
3.2 Histogram of misalignment
0
2
4
6
8
10
12
<-3
0
-30
-26
-22
-18
-14
-10 -6 -2 2 6
10
14
18
22
26
30
>30
Sam
ple
Misalignment [ms]STD: 12.5 ms for 70 scenes < req. 15.8 ms
Req. 15.8 ms
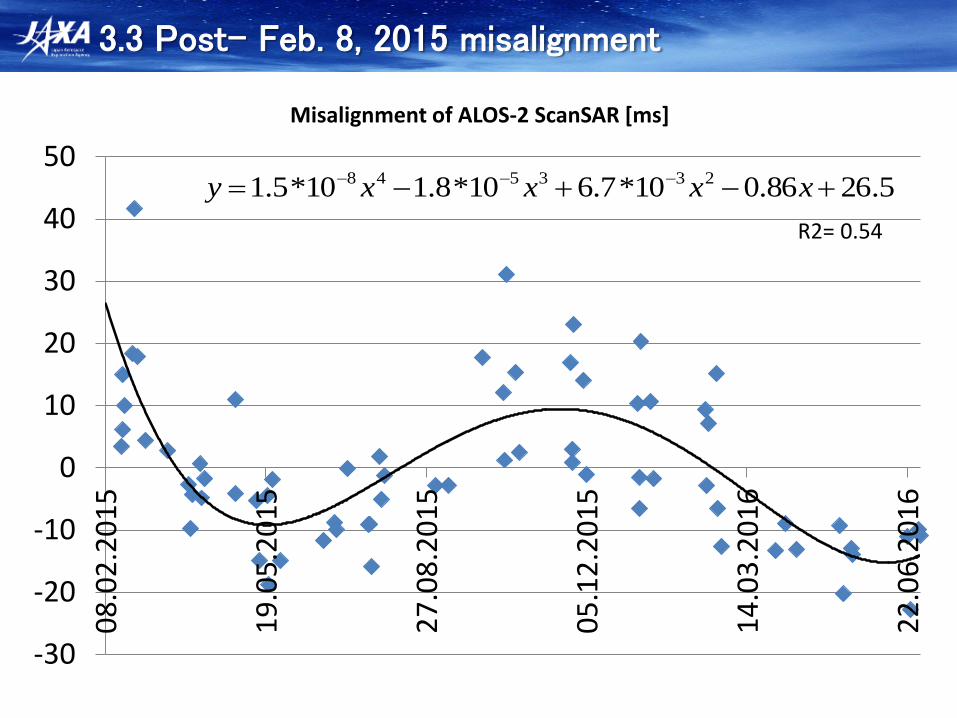
3.3 Post- Feb. 8, 2015 misalignment
-30
-20
-10
0
10
20
30
40
50
08
.02
.20
15
19
.05
.20
15
27
.08
.20
15
05
.12
.20
15
14
.03
.20
16
22
.06
.20
16
Misalignment of ALOS-2 ScanSAR [ms]
5.2686.010*7.610*8.110*5.1 233548 xxxxy
R2= 0.54
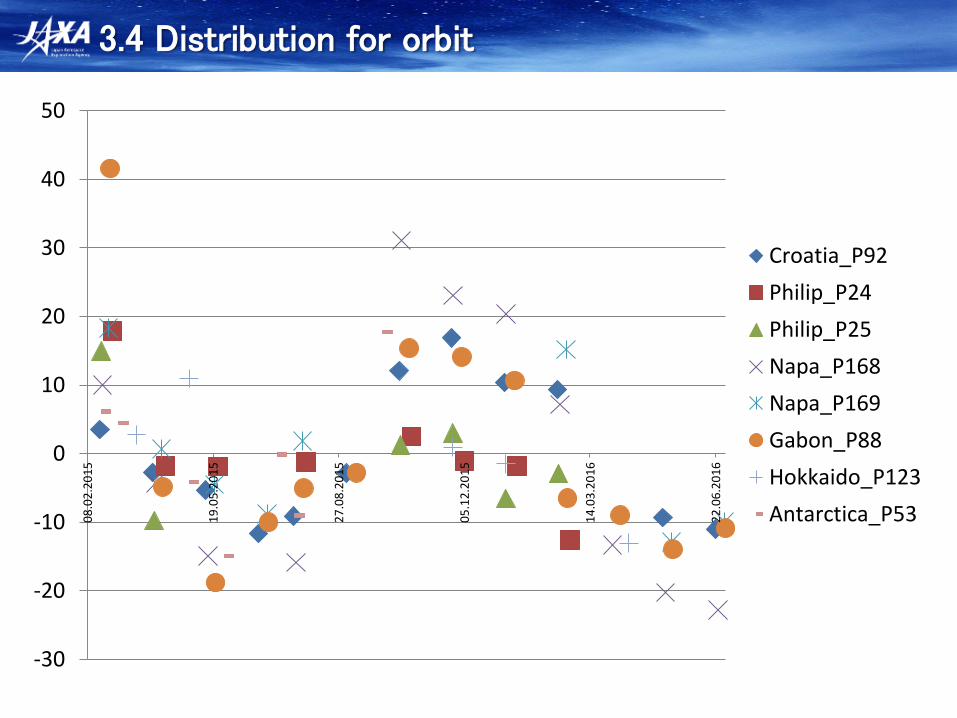
3.4 Distribution for orbit
-30
-20
-10
0
10
20
30
40
500
8.0
2.2
01
5
19
.05
.20
15
27
.08
.20
15
05
.12
.20
15
14
.03
.20
16
22
.06
.20
16
Croatia_P92
Philip_P24
Philip_P25
Napa_P168
Napa_P169
Gabon_P88
Hokkaido_P123
Antarctica_P53
4. Conclusion
• Validated PALSAR-2 ScanSAR burst misalignment
• Limited number of Pre- Feb. 8, 2015 archive have burst
overlap with Post- Feb. 8, 2015 data.
-> Users must check overlap ratio before ordering.
• Post- Feb. data have good overlap ratio each other.
• Misalignment is better than its planned score.
• However, remaining misalignment seems not random
Time dependency / orbit dependency
-> can it be better?

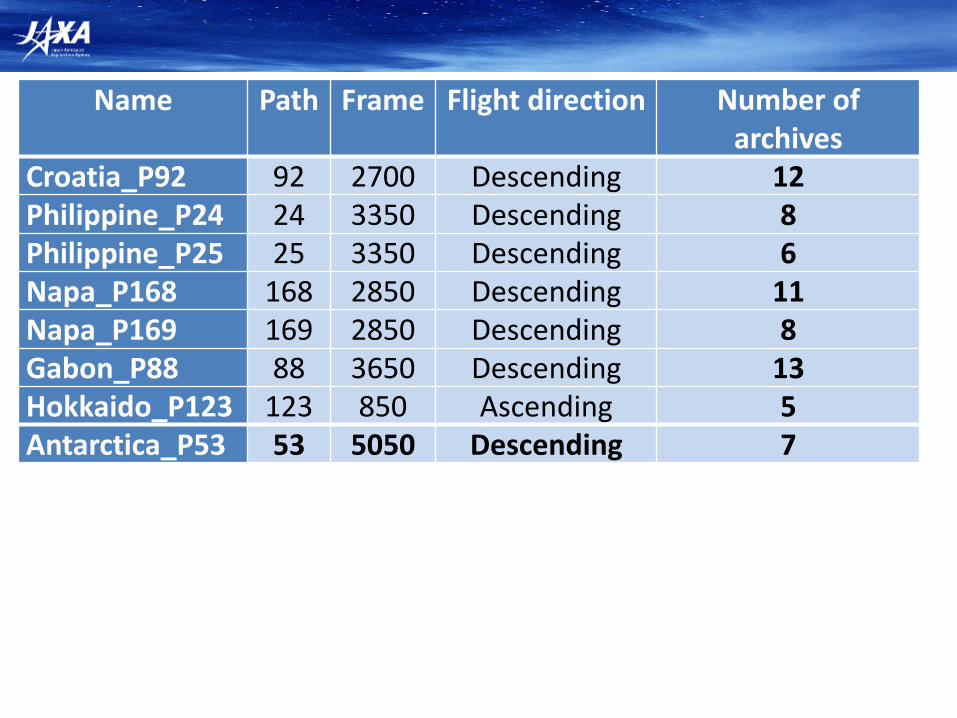
Name Path Frame Flight direction Number of archives
Croatia_P92 92 2700 Descending 12Philippine_P24 24 3350 Descending 8Philippine_P25 25 3350 Descending 6Napa_P168 168 2850 Descending 11Napa_P169 169 2850 Descending 8Gabon_P88 88 3650 Descending 13Hokkaido_P123 123 850 Ascending 5Antarctica_P53 53 5050 Descending 7
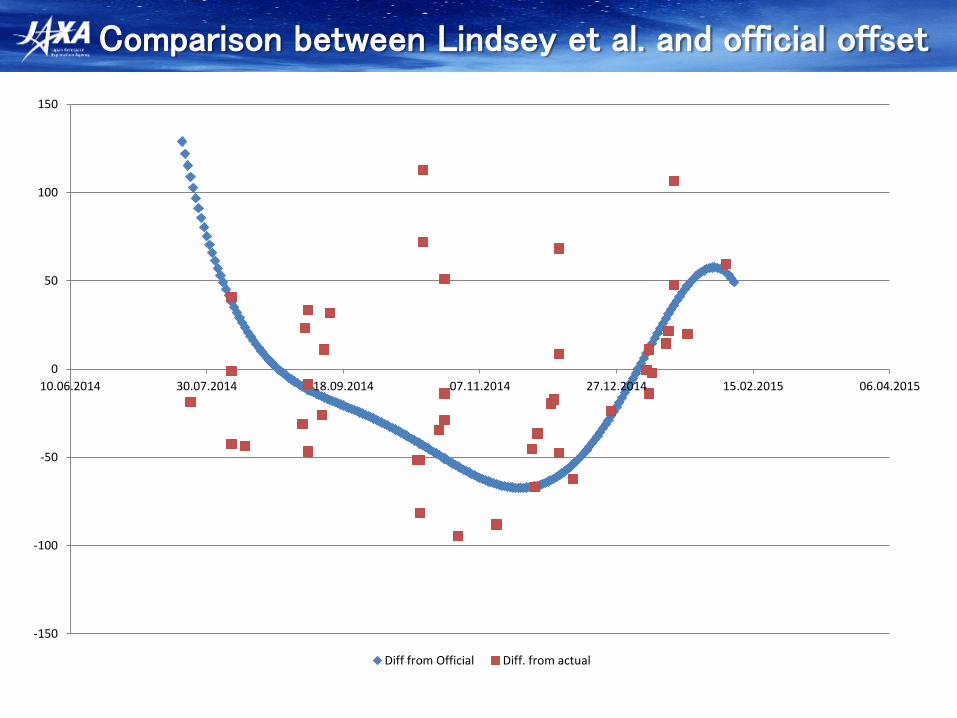
Comparison between Lindsey et al. and official offset
-150
-100
-50
0
50
100
150
10.06.2014 30.07.2014 18.09.2014 07.11.2014 27.12.2014 15.02.2015 06.04.2015
Diff from Official Diff. from actual
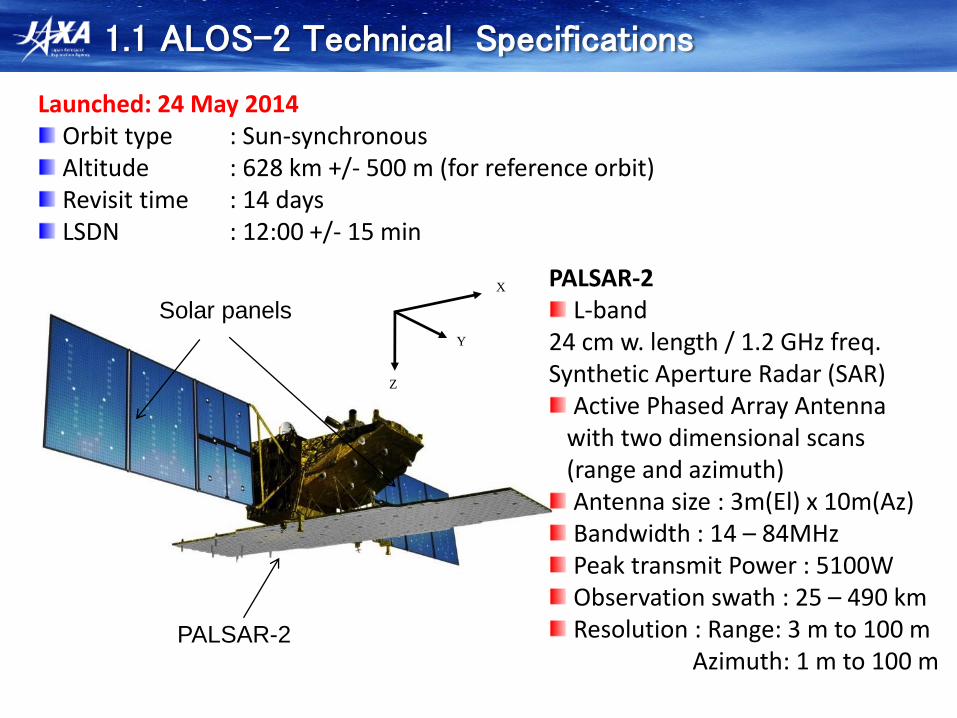
1.1 ALOS-2 Technical Specifications
Launched: 24 May 2014Orbit type : Sun-synchronousAltitude : 628 km +/- 500 m (for reference orbit)Revisit time : 14 daysLSDN : 12:00 +/- 15 min
PALSAR-2
X
Y
Z
Solar panels
PALSAR-2 L-band
24 cm w. length / 1.2 GHz freq. Synthetic Aperture Radar (SAR)
Active Phased Array Antennawith two dimensional scans (range and azimuth)Antenna size : 3m(El) x 10m(Az)Bandwidth : 14 – 84MHzPeak transmit Power : 5100WObservation swath : 25 – 490 kmResolution : Range: 3 m to 100 m
Azimuth: 1 m to 100 m
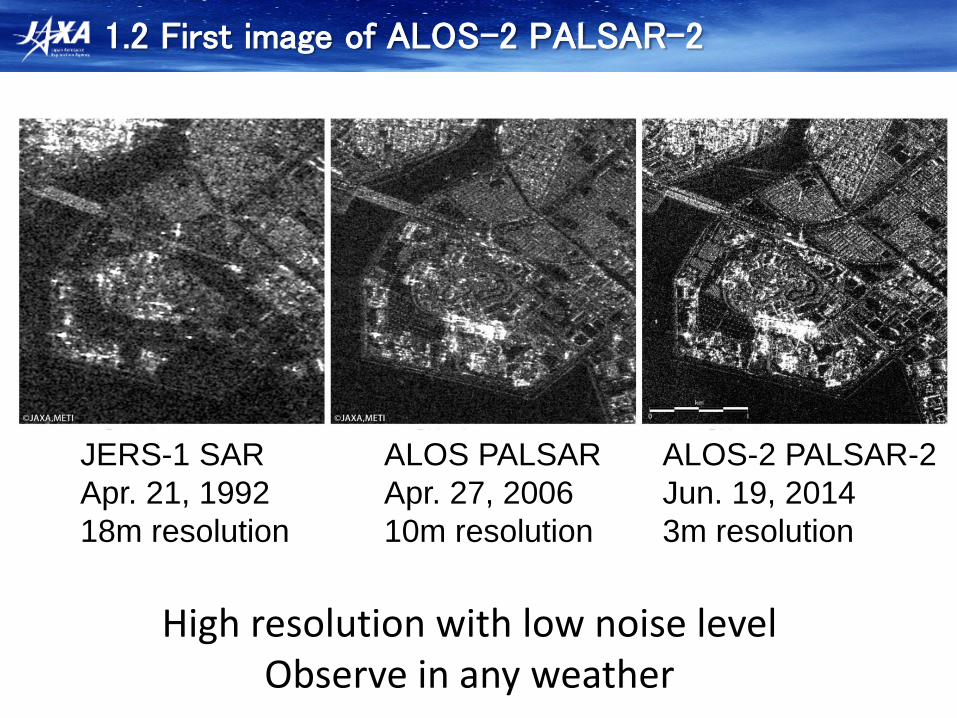
1.2 First image of ALOS-2 PALSAR-2
JERS-1 SAR
Apr. 21, 1992
18m resolution
ALOS PALSAR
Apr. 27, 2006
10m resolution
ALOS-2 PALSAR-2
Jun. 19, 2014
3m resolution
High resolution with low noise levelObserve in any weather
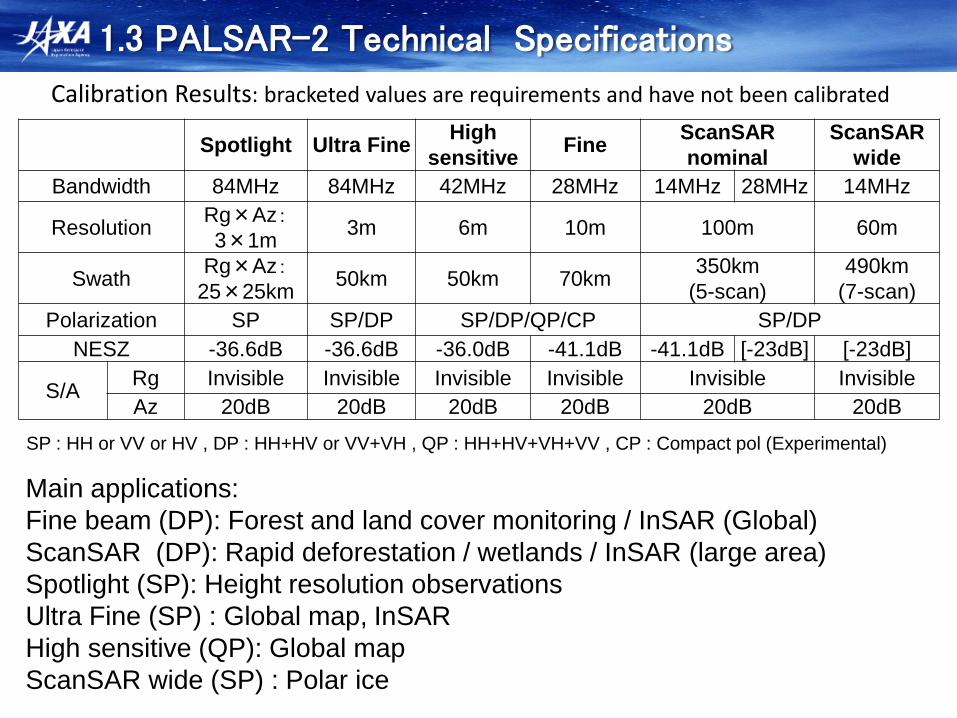
Spotlight Ultra FineHigh
sensitiveFine
ScanSAR
nominal
ScanSAR
wide
Bandwidth 84MHz 84MHz 42MHz 28MHz 14MHz 28MHz 14MHz
ResolutionRg×Az:3×1m
3m 6m 10m 100m 60m
SwathRg×Az:
25×25km50km 50km 70km
350km
(5-scan)
490km
(7-scan)
Polarization SP SP/DP SP/DP/QP/CP SP/DP
NESZ -36.6dB -36.6dB -36.0dB -41.1dB -41.1dB [-23dB] [-23dB]
S/ARg Invisible Invisible Invisible Invisible Invisible Invisible
Az 20dB 20dB 20dB 20dB 20dB 20dB
Main applications:
Fine beam (DP): Forest and land cover monitoring / InSAR (Global)
ScanSAR (DP): Rapid deforestation / wetlands / InSAR (large area)
Spotlight (SP): Height resolution observations
Ultra Fine (SP) : Global map, InSAR
High sensitive (QP): Global map
ScanSAR wide (SP) : Polar ice
SP : HH or VV or HV , DP : HH+HV or VV+VH , QP : HH+HV+VH+VV , CP : Compact pol (Experimental)
1.3 PALSAR-2 Technical Specifications
Calibration Results: bracketed values are requirements and have not been calibrated
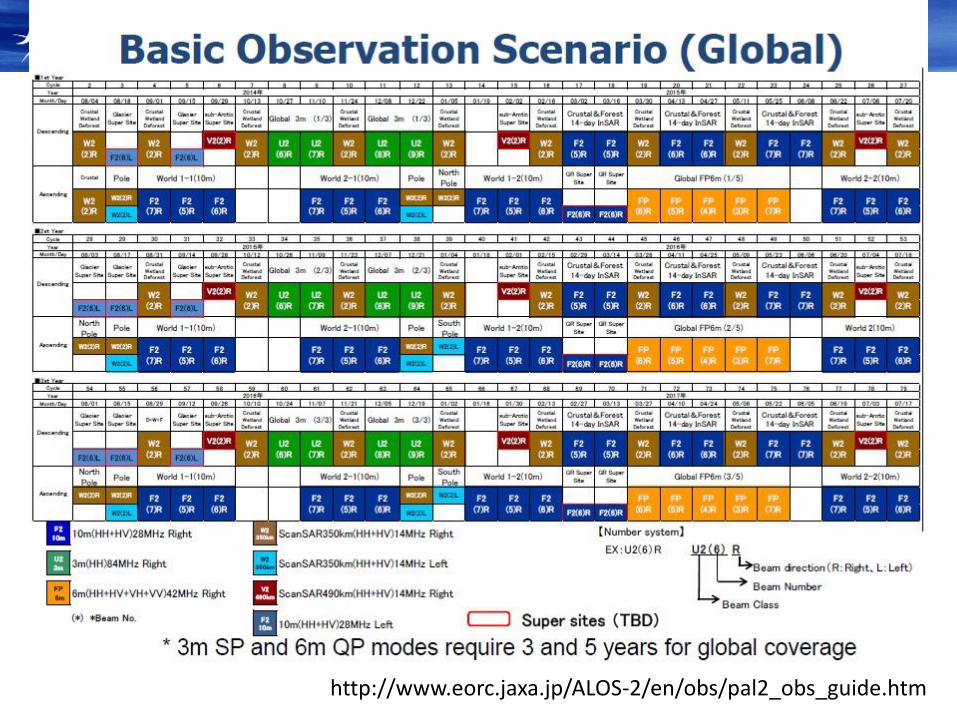
http://www.eorc.jaxa.jp/ALOS-2/en/obs/pal2_obs_guide.htm