burnley borough council pendle borough council
TRANSCRIPT

Burnley Borough Council Pendle Borough Council
Update Report 2010
Adopted 8th February 2011

Table o f Contents
Page i
Table of Contents
1. Introduction to study .........................................................................................................................1
2. Site appraisals ....................................................................................................................................3
3. Appraisal results ..............................................................................................................................11
4. Threshold modelling: results ..........................................................................................................17
5. Study findings...................................................................................................................................23
6. Dynamic Viability: Burnley ..............................................................................................................27
7. Dynamic Viability: Pendle................................................................................................................35
Appendix 1. Newbuild schemes .........................................................................................................43
Appendix 2. Proposed Burnley benchmark appraisal......................................................................45
Appendix 3. Proposed Pendle benchmark appraisal .......................................................................53
Appendix 4. Financial appraisal summaries .....................................................................................61

Burn ley & Pendle Af fordable Housing Si te V iab i l i ty Update
Page i i
1. In t roduct ion to s tudy
Page 1
1. Introduction to study
Introduction
1.1 This report provides the results of an update of affordable housing viability in Burnley and Pendle. The
study was commissioned by the two Borough Councils to provide guidance on the scope for seeking
affordable housing in the market conditions of June 2010, from sites both above and below the
national guidance threshold of 15 dwellings (PPS3, DCLG).
Basis for study
1.2 The work builds upon and draws from, an earlier study by Fordham Research for Burnley and Pendle
Borough Councils, an Affordable Housing Site Viability Study (AHSVS) for the Burnley & Pendle
Housing Market Area. Whilst the final study report was published in October 2009, the work was
primarily carried out in November and December 2008, and reflects the market conditions which
prevailed at that time.
1.3 That study was designed to produce guidance on affordable housing targets and site viability for each
Council area. To achieve this, financial appraisals were prepared for a total of 16 sites across the two
areas. The final AHSVS Report set out the results of those appraisals, and made recommendations in
respect of targets for each Council area.
1.4 At the time of the original study, house prices had been declining since the onset of housing finance
difficulties (commonly termed the ‘credit crunch’) in late 2007, which by the time of the study had
developed into a major economic downturn. Despite the continuing difficult economic conditions,
house prices began to recover from mid 2009 but have again faltered during 2010. The present report:
• Updates the financial appraisals of the original 16 sites to reflect the market conditions of June
2010, and provides recommendations on what affordable targets would now be deliverable in
the two Councils’ areas on sites above the national guidance threshold
• carries out further analysis of viability on sites below the national guidance threshold and
produces appropriate policy guidance for small sites
• sets out a methodology (‘Dynamic Viability’) which will allow the affordable targets to be
revised periodically as market conditions change, by applying nationally published index
figures to a pre-programmed matrix of percentage targets

Burn ley & Pendle Af fordable Housing Si te V iab i l i ty Update
Page 2

2. S i te appra isa ls
Page 3
2. Site appraisals
Relationship to AHSVS
2.1 The 16 sites in the AHSVS were actual sites; eight in each Borough area. Of the total, only one site
was below the national guidance threshold of 15 dwellings – Pendle Site P7, land at Warehouse Lane,
Foulridge (12 dwellings, 0.34 ha). Consequently, the AHSVS could provide only very limited guidance
on viability below the size threshold specific to Burnley and Pendle.
2.2 This report provides details of the assumptions used to produce updated appraisals for the 16 sites.
The bulk of the appraisal assumptions remained as they were in the AHSVS, and are not repeated
here. Where specific assumptions are identified and discussed below, to aid understanding we have
followed as far as possible the sequence of topic headings used in the earlier report.
AHSVS update sites
2.3 For convenience the AHSVS site details are summarised below.
Table 2.1 Site details
Area ha SiteRef Site
gross net Dw
Densitynet
(dw/ha) Planning status
B1 Dorma, Burnley 1.97 1.97 110 55.8 Approved
B2 Summit Works, Burnley 0.45 0.45 25 55.6 Under construction
B3 Park Mill, Burnley 1.35 1.35 77 57.0 Under construction
B4 Spa Mill, Padiham 1.40 1.40 55 39.3 Under construction
B5 Former Coal Yard, Burnley 1.90 1.90 57 30.0 Proposed site
B6 Langham St, Burnley 3.20 3.20 96 30.0 Proposed site
B7 Gorple Mill, Worsthorne 0.90 0.90 27 30.0 Proposed site
B8 Albion Mill, Padiham 1.20 1.20 36 30.0 Proposed site
P1 Lob Lane Mill, Brierfield 1.00 1.00 99 99.5 Approved
P2 Richard St, Brierfield 0.98 0.98 70 71.1 Refused (Oversupply)
P3 Lamberts Woodyard, Nelson 0.90 0.90 52 58.1 Approved
P4 J Nelson Sports Club, Nelson 1.81 1.81 65 35.9 Proposed
P5 Spen Brook Mill, Spen Brook 0.90 0.90 52 58.0 Proposed site
P6 Glen Mill, Colne 1.24 1.24 37 29.9 Proposed site
P7 Warehouse Lane, Foulridge 0.34 0.34 12 35.3 Proposed site
P8 Garage Site, Earby 0.63 0.63 35 55.3 Proposed site
Source: Affordable Housing Site Viability Study Table 2.1

Burn ley & Pendle Af fordable Housing Si te V iab i l i ty Update
Page 4
Affordable housing assumptions
2.4 Update appraisals were prepared for 10%, 20%, 30% and 40% options, as originally, and with a
tenure split of 90/10 social rented/intermediate for Burnley, but 80/20 for Pendle. The financial terms –
the prices at which RSLs would purchase affordable housing provided by a developer – were updated
to current values from spring 2008. As before, the assumption of zero grant support applies and that
properties would be built to Sustainable Homes Code Level 3.
2.5 After considering evidence from the Retail Price Index (RPI), social rented values were uplifted by
3.75% (RPI November 2008 216.0, June 2010 224.1). After consideration, the intermediate prices
were increased by a similar amount.
2.6 The resulting figures are compared to the previous (AHSVS) figures, below.
Table 2.2 Affordable housing purchase prices
November 2008 June 2010 Category Type
£ per sq ft £ per sq m £ per sq ft £ per sq m
Social rented Flat 70 753 72.5 781
House 80 861 83 893
Intermediate Flat 104 1,120 108 1,162
House 104 1,120 108 1,162 Source: Affordable Housing Viability Update Fordham Research 2010
Other developer contributions
2.7 In the main study, developer contributions assumptions were based upon a modelled approach
drawing on contributions sought or achieved on a number of sites in the two Council areas. The
approach assumed an average contribution figure of £3,000 per dwelling, which was applied
generally, but increased to £3,500 per dwelling for the substantial greenfield site P4 (James Nelson
Sports Club, to allow for a larger transport contribution.
2.8 Most established contributions policies provide for the average per dwelling contribution to reduce on
the smallest sites, as size thresholds for the individual elements come into play. However with the
smallest site being 12 dwellings no reduction was assumed. Developer contributions policies are
currently under review. With the possibility of a move to a tariff based system, the across the board
approach seems in any case a sensible one.
2.9 It is necessary to allow for cost inflation from the November 2008 base date; the figures were
therefore increased by 3.75%, though then also rounded to reflect the strategic approach being used.
This gave a general figure of £3,100 per dwelling and a higher figure of £3,650 per dwelling at site P4.

2. S i te appra isa ls
Page 5
2.10 As with the figures in the main study, we must emphasise that these figures cannot be assumed to
reflect the contributions that would arise in practice, either in amount or topic coverage.
Price assumptions for financial appraisals
2.11 It was necessary to carry out a current housing market survey in order to form a view about the
appropriate prices to assume as at June 2010 for the 16 AHSVS sites. The Halifax quarterly Regional
House Price Index figures since the peak Q4 2007 are shown in the table below.
Table 2.3 Price index movements
Period North West Region House Price Index
2007 Q4 604.0
2008 Q1 597.3
2008 Q2 575.7
2008 Q3 536.1
2008 Q4 500.4
2009 Q1 485.4
2009 Q2 474.2
2009 Q3 502.9
2009 Q4 501.7
2010 Q1 493.8 North West Region All Buyers Seasonally Adjusted 2010
Source: Halifax Price Index
2.12 It can be seen that the regional index figure fell steadily from the peak to Q2 2009, and after a
relatively strong surge to Q3 of 2009 has made no further progress. The Q2 figure for 2010 will make
it clear in due course where prices stood at June 2010, but this figure will not be available just yet.
However, between the time of the AHSVS and Q1 2010, the regional data suggest prices have moved
very little – 500.4 to 493.8, a drop of 1.3%.
2.13 There is very little new build housing currently available to provide comparables for the appraisal
updates. The details of what is currently available as at June 2010 are set out in Appendix 1. Taking
these and the index data into consideration we came to the view that there was only limited scope for
changing the base price structure in the 2008 study of £150/£145/£135 per sq ft for flats,
detached/semis, and terraced town houses (£1,615/£1,560/£1,453 per sq m). It appeared that prices
for two storey detached and semis of reasonable quality had edged just a little higher to around £150
per sq ft, whilst the flat and town house figures should be left unchanged.
Burn ley & Pendle Af fordable Housing Si te V iab i l i ty Update
Page 6
2.14 In the 2008 study the majority of sites were priced at these base levels. Two green edge sites, B6
Langham St Burnley and P4 Sports Club Nelson, received a modest premium, and the two rural sites
a more substantial mark-up, whilst prices on one urban site (B8 Albion Mill Padiham) were slightly
discounted. For the update the first and last of these groups were adjusted in line with the base, whilst
the middle group was left unchanged.
2.15 As before, the sale prices for the three categories were combined on the basis of the proportions in
each scheme, to produce a single composite average price. The resulting figures are set out in Table
2.4 below.
Table 2.4 Price bands
Price £ per Price £ per Site/location
Sq ft Sq m Site/location
Sq ft Sq m
Dorma 150 1,614 Lob Lane Mill Brierfield 135 1,453
Summit Wks 143 1,533 Richard St Brierfield 135 1,453
Park Mill 139 1,493 Lamberts Woodyard 143 1,533
Spa Mill 143 1,533 J Nelson Sports Club 161 1,727
Former Coal Yard 143 1,533 Spen Brook Mill 225 2,421
Langham St 143 1,533 Glen Mill 146 1,574
Gorple Mill Worsthorne 161 1,727 Warehouse La Foulridge 185 1,991
Albion Mill Padiham 138 1,480 Garage Site Earby 139 1,493 Source: Affordable Housing Update Fordham Research 2010
Current and Alternative Use Values
2.16 All but two of the sites in the AHSVS were assumed to have the industrial benchmark value; P7
Warehouse Lane was given agricultural value and the open space/sports club at P4 an intermediate
value between the two.
2.17 The likely change to alternative use values was considered. The 2008 study used a benchmark value
of £175k per acre (£430k per ha) for industrial/warehousing land throughout the two Council areas.
The agricultural value was assumed to be £10k per acre (£25k per ha).
2.18 We looked at update data on industrial values from the Valuation Office Agency’s (VOA) Property
Market report.
2. S i te appra isa ls
Page 7
Table 2.5 Industrial land values
Value of typical industrial land per ha over half year period ending
Jan 08 Jul 08 Jan 09 Jul 09 Jan 10
North West Region 502 502 460 409 n/a
Liverpool 275 275 250 240 450
Manchester 650 650 600 540 650
Leeds 900 750 600 540 600
Blackburn/Burnley 500 500 475 380 n/a
Rochdale/Oldham 475 475 435 390 n/a
Bolton/Bury 550 550 500 450 n/a
Preston/Central Lancs 625 625 625 500 n/a Source: Valuation Office Agency Property Market Reports
2.19 Unfortunately, from the January 2010 issue the Property Market Report appears with a much more
limited range of locations, and no regional average. Consequently we have very limited guidance on
local movements in values since the middle of 2009. We can see that the value of £190k per acre
(£475k per ha) for Blackburn/Burnley in late 2008 slipped to around £155k per acre (£380k per ha) in
early 2009, with slightly smaller falls (typically around 10%) in other nearby locations. However, we do
not know to what extent if any it has now recovered: we only have subsequent information for the big
urban centres of Liverpool, Manchester and Leeds, where values have picked up, though to varying
degrees.
2.20 There is limited guidance from industrial land currently on the market in the two areas. We have found
examples of land at £127k and £225k per acre, and another recently offered for sale at Accrington
(2.4 acres at £177k per acre/£438k per ha). Although it is possible that land values in Burnley and
Pendle may have fallen back just a little since November 2008 we have not got sufficient evidence to
support a specific reduction in the previous benchmark of £175k per acre/£430k per ha. After
consideration, therefore, we left the benchmark value unchanged.
2.21 The most recent Property Market Report gives a value for agricultural land at January 2010 of £7,000
per acre/£17,290 per ha (Equipped Mixed land with vacant possession Lancashire) - identical to the
January 2009 figure for the North West Region (which is not now published). This suggests that the
2008 benchmark value of £10k per acre could be left unchanged. Similarly the threshold value of £75k
per acre for the sports club land at P4 was retained.
2.22 The resulting values area as set out in the table below.

Burn ley & Pendle Af fordable Housing Si te V iab i l i ty Update
Page 8
Table 2.6 Alternative Use Value bases
Ref Site Basis £k per acre £k per ha
P7 Warehouse Lane, Foulridge agricultural 10 25
P4 J Nelson Sports Club, Nelson open space 75 185
All other sites industrial 175 430
Source: Affordable Housing Update Fordham Research2010
Development costs
(i) Construction costs
2.23 In the AHSVS, build costs for all (market and affordable) housing were built up from the Fordham data
base for houses and flats, re-based to a November 2008 base date using a BCIS cost index, and
adjusted to meet the requirements of CSH Level 3 and 10% renewables. A ‘small site’ premium of 3%
was added for the one site of fewer than 15 dwellings – P7.
2.24 The general cost level was adjusted to the new June 2010 base date using BCIS index figures (295.9
compared to the 289.3 used in AHSVS rebasing).
2.25 The final build cost figures following these adjustments and allowing for the mix of houses and flats on
each site, are as in the table below.
Table 2 7 Construction costs adjusted and
rounded
Build cost £ per sq ft/sq m
Site sq ft sq m Site sq ft sq m
B1 88.0 947 P1 101.8 1,095
B2 85.4 919 P2 99.2 1,068
B3 90.5 974 P3 99.2 1,068
B4 89.0 958 P4 83.4 897
B5 83.9 903 P5 96.7 1,040
B6 84.9 914 P6 83.9 903
B7 83.4 897 P7 85.9 925
B8 87.5 941 P8 85.5 920 Source: Affordable Housing Update Fordham Research 2010

2. S i te appra isa ls
Page 9
(ii) Other development costs et alia
2.26 Alongside the per sq ft/sq ms build costs, a range of allowances provided for other costs of
development including infrastructure costs, estimated site specific abnormals, contingency and fees.
Except for abnormals, the AHSVS dealt with these as percentage allowances on build cost, so that
they increase automatically with a rise in build costs. Although abnormals were identified as site
specific cash sums, they were entered into the appraisal software as a site specific additional
percentage mark-up on build cost, and are therefore subject to the same automatic updating process
in practice.
Financial and other appraisal assumptions:
2.27 All the other appraisal assumptions were left unchanged, including interest rate, developer’s profit and
phasing assumptions.

Burn ley & Pendle Af fordable Housing Si te V iab i l i ty Update
Page 10

3. Appra isa l resu l ts
Page 11
3. Appraisal results
Appraisals
3.1 Update appraisals were prepared for the 16 AHSVS sites. Appendix 4 provides the appraisal
summaries for each site.
Results of viability analysis
3.2 The results of the two sets of appraisals, for prices and costs as at June 2010, are set out below. As in
the main AHSVS report they are expressed as residual values.
Table 3.1 Appraisal results for five affordable options
Zero grant: shared ownership at 25% share
Residual value £k per acre for affordable option: No Site
No aff 10% 20% 30% 40%
B1 Dorma, Burnley -170 -245 -321 -397 -473
B2 Summit Works, Burnley -129 -206 -285 -364 -443
B3 Park Mill, Burnley -304 -364 -424 -485 -547
B4 Spa Mill, Padiham -199 -269 -339 -409 -479
B5 Former Coal Yard, Burnley -50 -100 -149 -199 -250
B6 Langham St, Burnley -107 -156 -206 -256 -306
B7 Gorple Mill, Worsthorne 95 35 -27 -87 -150
B8 Albion Mill, Padiham -266 -314 -362 -412 -461
P1 Lob Lane Mill, Brierfield -1,175 -1,282 -1,387 -1,493 -1,601
P2 Richard St, Brierfield -633 -701 -772 -841 -911
P3 Lamberts Woodyard, Nelson -512 -580 -648 -717 -786
P4 J Nelson Sports Club, Nelson 103 48 -10 -70 -129
P5 Spen Brook Mill, Spen Brook 371 227 79 -75 -230
P6 Glen Mill, Colne -73 -124 -174 -226 -276
P7 Warehouse Lane, Foulridge 345 271 189 107 25
P8 Garage Site, Earby -220 -276 -333 -391 -449 Source: Affordable Housing Update Fordham Research 2010

Burn ley & Pendle Af fordable Housing Si te V iab i l i ty Update
Page 12
3.3 Table 3.1 shows that, as with the AHSVS, with no requirement for affordable housing all but four of the
sites deliver a negative residual land value. As before, the residual value for the two rural Pendle sites
is quite substantial, around £350k per acre, with lesser figures around £100k per acre for the two
green edge sites. For the rest of the sites, the figures suggest that in present conditions most are
unlikely to come forward.
3.4 Land values fall away as increasingly high affordable housing requirements are sought; as before they
do so more rapidly on the two higher value sites P5 and P7, and also the higher density site P1.
Alternative use benchmarks
3.5 The results from the above table have to be compared with the alternative use value in order to show
whether the site is viable. To be viable the site has to deliver more value than the alternative use, and
by a margin that provides some incentive to the landowner. That margin was called the ”cushion’’ in
the AHSVS. In the AHSVS a fixed value of £40k per acre was used for the cushion for all sites except
for the greenfield site P7 which had only agricultural value, where it was increased to £90k per acre.
3.6 On several sites there were assumed to be some abnormal costs involved in achieving the alternative
use value. For simplicity we did not index the cost element and so the viability thresholds and cushion
values set out in AHSVS Table 6.2 were carried over unchanged to the current study. By comparing
the results from Table 3.1 with the alternative use values, we obtain a view of the likely viability of the
affordable options for each site. This is set out below in Table 3.2. As in the AHSVS, a site is only
viable if it produces a Residual Value fully equalling the required alternative use value plus cushion. If
the site’s Residual Value exceeds the Table 6.2 alternative use value but not by the full amount of the
cushion, it is considered marginal; the landowner may not receive sufficient incentive to bring the site
forward.
Table 3.2 Appraisal outcomes: base appraisals
Value £k per acre No Site Alt use
value No
affordable 10% 20% 30% 40%
B1 Dorma, Burnley 135-175 -170 -245 -321 -397 -473
NOT VIAB NOT VIAB NOT VIAB NOT VIAB NOT VIAB
B2 Summit Works, Burnley 160-200 -129 -206 -285 -364 -443
NOT VIAB NOT VIAB NOT VIAB NOT VIAB NOT VIAB
B3 Park Mill, Burnley 160-200 -304 -364 -424 -485 -547
NOT VIAB NOT VIAB NOT VIAB NOT VIAB NOT VIAB
B4 Spa Mill, Padiham 160-200 -199 -269 -339 -409 -479
NOT VIAB NOT VIAB NOT VIAB NOT VIAB NOT VIAB

3. Appra isa l resu l ts
Page 13
Table 3.2 Appraisal outcomes: base appraisals
Value £k per acre No Site Alt use
value No
affordable 10% 20% 30% 40%
B5 Former Coal Yard, Burnley 160-200 -50 -100 -149 -199 -250
NOT VIAB NOT VIAB NOT VIAB NOT VIAB NOT VIAB
B6 Langham St, Burnley 160-200 -107 -156 -206 -256 -306
NOT VIAB NOT VIAB NOT VIAB NOT VIAB NOT VIAB
B7 Gorple Mill, Worsthorne 160-200 95 35 -27 -87 -150
NOT VIAB NOT VIAB NOT VIAB NOT VIAB NOT VIAB
B8 Albion Mill, Padiham 160-200 -266 -314 -362 -412 -461
NOT VIAB NOT VIAB NOT VIAB NOT VIAB NOT VIAB
P1 Lob Lane Mill, Brierfield 135-175 -1,175 -1,282 -1,387 -1,493 -1,601
NOT VIAB NOT VIAB NOT VIAB NOT VIAB NOT VIAB
P2 Richard St, Brierfield 160-200 -633 -701 -772 -841 -911
NOT VIAB NOT VIAB NOT VIAB NOT VIAB NOT VIAB
P3 Lamberts Woodyard, Nelson 160-200 -512 -580 -648 -717 -786
NOT VIAB NOT VIAB NOT VIAB NOT VIAB NOT VIAB
P4 J Nelson Sports Club, Nelson 80-120 103 48 -10 -70 -129
MARGINAL NOT VIAB NOT VIAB NOT VIAB NOT VIAB
P5 Spen Brook Mill, Spen Brook 160-200 371 227 79 -75 -230
VIABLE VIABLE NOT VIAB NOT VIAB NOT VIAB
P6 Glen Mill, Colne 135-175 -73 -124 -174 -226 -276
NOT VIAB NOT VIAB NOT VIAB NOT VIAB NOT VIAB
P7 Warehouse Lane, Foulridge 10-100 345 271 189 107 25
VIABLE VIABLE VIABLE VIABLE MARGINAL
P8 Garage Site, Earby 175-215 -220 -276 -333 -391 -449
NOT VIAB NOT VIAB NOT VIAB NOT VIAB NOT VIAB Source: Affordable Housing Update Fordham Research 2010
Comparison results
3.7 With zero affordable housing, two sites are viable, as at 2008 in the AHSVS. However the 2010
update shows that there is now one other marginal site, P4.
3.8 At 10% the marginal site becomes unviable, leaving two viable sites as with the AHSVS. Spen Brook
P5 becomes unviable at 20%, whilst P7 warehouse Lane remains viable through to 30%. This is again
in line with the AHSVS. In fact Warehouse Lane becomes marginal at 40%.
3.9 It should be noted that Warehouse Lane is the smallest site, with 12 dwellings.
3.10 The results are summarised below.

Burn ley & Pendle Af fordable Housing Si te V iab i l i ty Update
Page 14
Table 3.3 Viability by site size
Sites viable with Status
No afff 10% aff 20% aff 30% aff 40% aff
Burnley 0 viable
8 unviable
0 viable
8 unviable
0 viable
8 unviable
0 viable
8 unviable
0 viable
8 unviable
Pendle
2 viable
1 marginal
5 unviable
2 viable
6 unviable
1 viable
7 unviable
1 viable
7 unviable
0 viable
1 marginal
7 unviable Source: Affordable Housing Update Fordham Research 2010
3.11 The implications for what the affordable targets should be as at June 2010 market conditions, are
taken forward in the next chapter. Before that we consider the sensitivity of the results to changes in
the basic assumptions, in particular cost and price levels.
Sensitivity: price and cost levels
3.12 We carried out sensitivity testing to show how possible changes in market conditions impacted upon
the base appraisal outcomes.
3.13 Whilst clearly over the lifetime of the two Boroughs’ LDF policies prices are likely to recover – and
indeed move ahead of costs – the short term may well see prices falling back. We therefore looked at
the impact of a 10% reduction in market prices, and a return to the market peak level of autumn 2007.
The results for these under the 10% affordable option are compared to those from the base appraisals
(i.e. current market prices and costs) in the table below. The peak level was assumed to be prices 19-
20% above current levels, and costs 8-9% lower.
Table 3.4 Appraisal outcomes: sensitivity on price
Value £k per acre for 10% affordable with
No Site Alt use value
BASE Current prices
PRICES DOWN
10%
PRICES MARKET
PEAK B1 Dorma, Burnley 135-175 -245 -417 229
NOT VIAB NOT VIAB VIABLE
B2 Summit Works, Burnley 160-200 -206 -403 346
NOT VIAB NOT VIAB VIABLE
B3 Park Mill, Burnley 160-200 -364 -518 76
NOT VIAB NOT VIAB NOT VIAB
B4 Spa Mill, Padiham 160-200 -269 -436 202
NOT VIAB NOT VIAB VIABLE

3. Appra isa l resu l ts
Page 15
Table 3.4 Appraisal outcomes: sensitivity on price
Value £k per acre for 10% affordable with
No Site Alt use value
BASE Current prices
PRICES DOWN
10%
PRICES MARKET
PEAK B5 Former Coal Yard, Burnley 160-200 -100 -226 252
NOT VIAB NOT VIAB VIABLE
B6 Langham St, Burnley 160-200 -156 -281 197
NOT VIAB NOT VIAB MARGINAL
B7 Gorple Mill, Worsthorne 160-200 35 -97 392
NOT VIAB NOT VIAB VIABLE
B8 Albion Mill, Padiham 160-200 -314 -434 57
NOT VIAB NOT VIAB NOT VIAB
P1 Lob Lane Mill, Brierfield 135-175 -1,282 -1,547 -514
NOT VIAB NOT VIAB NOT VIAB
P2 Richard St, Brierfield 160-200 -701 -863 -226
NOT VIAB NOT VIAB NOT VIAB
P3 Lamberts Woodyard, Nelson 160-200 -580 -747 -88
NOT VIAB NOT VIAB NOT VIAB
P4 J Nelson Sports Club, Nelson 80-120 48 -82 401
NOT VIAB NOT VIAB VIABLE
P5 Spen Brook Mill, Spen Brook 160-200 227 -1 871
VIABLE NOT VIAB VIABLE
P6 Glen Mill, Colne 135-175 -124 -261 243
NOT VIAB NOT VIAB VIABLE
P7 Warehouse Lane, Foulridge 10-100 271 115 687
VIABLE VIABLE VIABLE
P8 Garage Site, Earby 175-215 -276 -437 177
NOT VIAB NOT VIAB MARGINAL
Source: Affordable Housing Update Fordham Research 2010
3.14 Were there to be a further fall of 10% in prices relative to costs, only one site would still be viable at
10%. The improvement in prices in the second half of 2009 made the prospect of a further significant
fall in prices less likely. However the improvement is not universally accepted to be the beginning of a
steady recovery; there has been no clear pattern to price movements in 2010. At present many
commentators believe a downwards adjustment is a strong possibility in the immediate short term.
3.15 On the other hand over the longer term it is reasonable to expect that market conditions will improve
significantly. Over the length of the LDF plan period, land values are likely to recover to at least their
position at the 2007 market peak.

Burn ley & Pendle Af fordable Housing Si te V iab i l i ty Update
Page 16
3.16 The results for a return to the ‘market peak’ price/cost relationship show that 10% affordable housing
could reasonably be sought in both Burnley and Pendle. Altogether nine sites are viable, and two
marginal.
3.17 This underlines the importance of a flexible approach to target setting, which will allow a significant
improvement in prices to be reflected in the affordable target as and when such an improvement is
manifested.

4. Threshold model l ing: resu l ts
Page 17
4. Threshold modelling: results
Introduction
4.1 This chapter sets out how viability assessments of model sites were prepared to provide guidance on
the threshold issue, and presents the appraisal results of the model sites.
Modelling variations in scheme size
4.2 Of the AHSVS sites, P7 Warehouse Lane (12 dwellings) is the only site of fewer than 15 dwellings,
and can therefore provide only limited guidance on viability for sites below the national guidance
threshold.
4.3 In order to provide more robust support on the scope for reducing thresholds in either Borough area, it
was necessary to look at model sites. In order to provide a full picture of how viability varied between
five and 15 dwellings, we created a suite of model sites with the same characteristics as the greenfield
site P7. It was felt that, with only a few exceptions considered below, assumptions from the actual site
could reasonably be carried over to the model sites; otherwise, that meant that the model sites were
greenfield, on agricultural land, with a built form of 100% two storey houses.
4.4 Firstly, we recognised that as site size declines it may be increasingly difficult to achieve the same site
utilisation efficiency. Therefore as site size varied we allowed the development density (sq ft
floorspace per acre/sq m per ha) to vary, increasing above 12 dwellings though at a declining rate,
and decreasing below 12 dwellings, at an increasing rate. Since the average floor area of the
dwellings remained constant this was achieved by varying the site area (i.e. so that it did not vary fully
pro rata with dwelling numbers).
4.5 Secondly, we built in loadings for the build cost which varied with scheme size but were consistent
with the 3% loading for 12 dwellings in the AHSVS and referred to 2.23.
4.6 Thirdly, we considered whether the developer contribution assumption should vary to reflect some
minimum contributions threshold. Whilst In Pendle the contribution would reduce below 10 dwellings,
in Burnley it would not. Taking a ‘worse case’ approach it was decided to leave the developer
contribution figure, used for the 12 dwellings at site P7, unchanged throughout.
4.7 Finally we considered whether as site size declined below 12 dwellings, values might at some point
improve to reflect a ‘non-estate’ type of location. However it was difficult to decide in the abstract
model situation where this might arise, and so no adjustments were made to values.
4.8 The variant floorspace densities and build costs are set out in the table below.

Burn ley & Pendle Af fordable Housing Si te V iab i l i ty Update
Page 18
Table 4.1 Variant assumptions for model
threshold sites
build cost No of dwgs
floorspace density
sq ft per acre + % loading £ per sq ft
15 13,800 0.00% 83.4
14 13,790 1.00% 84.3
13 13,775 2.00% 85.1
12 13,755 3.00% 85.9
11 13,730 4.00% 86.8
10 13,705 5.00% 87.6
9 13,675 6.00% 88.4
8 13,640 7.25% 89.5
7 13,600 8.50% 90.5
6 13,555 10.00% 91.8
5 13,500 12.00% 93.4
4 13,440 14.00% 95.1
3 13,350 16.00% 96.8
Source: Fordham Research derived from analysis of BCIS cost data
Viability results
4.9 Using the above assumptions, and deriving from the ‘actual site’ appraisals for Site P7, appraisals
were prepared for two suites of model sites.
4.10 The first used house prices at £185 per sq ft, i.e. consistent with site P7, representing a greenfield site
in a location equivalent to Warehouse Lane. The second used lower prices at £150 per sq ft, in line
with the urban sites with base market levels in Burnley and in Pendle. These two therefore provided
guidance on small sites respectively on rural and urban sites.
4.11 The results for the rural threshold model sites are set out below. They cover the full range of sites from
15 down to three dwellings.
4. Threshold model l ing: resu l ts
Page 19
Table 4.2 Appraisal outcomes: rural threshold sites
Value £k per acre Site Alt use
value No
affordable 10% 20% 30% 40%
model site 15 dwgs 10-100 382 303 228 146 64
VIABLE VIABLE VIABLE VIABLE MARGINAL
model site 14 dwgs 10-100 366 287 212 131 49
VIABLE VIABLE VIABLE VIABLE MARGINAL
model site 13 dwgs 10-100 351 275 198 117 36
VIABLE VIABLE VIABLE VIABLE MARGINAL
model site 12 dwgs 10-100 345 271 189 107 25
VIABLE VIABLE VIABLE VIABLE MARGINAL
model site 11 dwgs 10-100 329 255 174 92 10
VIABLE VIABLE VIABLE MARGINAL NOT VIAB
model site 10 dwgs 10-100 320 240 160 79 -4
VIABLE VIABLE VIABLE MARGINAL NOT VIAB
model site 9 dwgs 10-100 314 233 152 71 -13
VIABLE VIABLE VIABLE MARGINAL NOT VIAB
model site 8 dwgs 10-100 293 213 133 52 -31
VIABLE VIABLE VIABLE MARGINAL NOT VIAB
model site 7 dwgs 10-100 275 195 117 35 -47
VIABLE VIABLE VIABLE MARGINAL NOT VIAB
model site 6 dwgs 10-100 257 177 98 16 -67
VIABLE VIABLE MARGINAL MARGINAL NOT VIAB
model site 5 dwgs 10-100 231 153 72 -10 -92
VIABLE VIABLE MARGINAL NOT VIAB NOT VIAB
model site 4 dwgs 10-100 208 127 46 -37 -119
VIABLE VIABLE MARGINAL NOT VIAB NOT VIAB
model site 3 dwgs 10-100 178 99 19 -62 -144
VIABLE MARGINAL MARGINAL NOT VIAB NOT VIAB
Source: Burnley & Pendle Affordable Housing Site Viability Study, Fordham Research 2010
4.12 The table shows quite clearly how viability declines as the site size reduces. At 30% the site is viable
down to 12 dwellings, the actual size of Site P7. From 11 dwellings downwards the scheme is only
marginally viable, and it is unviable from five dwellings.
4.13 At 20% the scheme is viable down to seven dwellings. It is marginal from six dwellings down. A 10%
affordable requirement is viable all the way down to four dwellings, and only becomes marginal, just,
at three dwellings.
4.14 Comparable results for the urban threshold model are shown in the table below.

Burn ley & Pendle Af fordable Housing Si te V iab i l i ty Update
Page 20
Table 4.3 Appraisal outcomes: urban threshold sites
Value £k per acre Site Alt use
value No
affordable 10% 20% 30% 40%
model site 15 dwgs 10-100 65 16 -34 -84 -135
MARGINAL MARGINAL NOT VIAB NOT VIAB NOT VIAB
model site 14 dwgs 10-100 51 2 -48 -98 -149
MARGINAL NOT VIAB NOT VIAB NOT VIAB NOT VIAB
model site 13 dwgs 10-100 38 -12 -61 -101 -162
MARGINAL NOT VIAB NOT VIAB NOT VIAB NOT VIAB
model site 12 dwgs 10-100 26 -24 -74 -125 -176
MARGINAL NOT VIAB NOT VIAB NOT VIAB NOT VIAB
model site 11 dwgs 10-100 11 -38 -89 -139 -190
MARGINAL NOT VIAB NOT VIAB NOT VIAB NOT VIAB
model site 10 dwgs 10-100 -2 -52 -101 -151 -202
NOT VIAB NOT VIAB NOT VIAB NOT VIAB NOT VIAB
model site 9 dwgs 10-100 -11 -61 -111 -162 -213
NOT VIAB NOT VIAB NOT VIAB NOT VIAB NOT VIAB
model site 8 dwgs 10-100 -29 -78 -128 -178 -229
NOT VIAB NOT VIAB NOT VIAB NOT VIAB NOT VIAB
model site 7 dwgs 10-100 -45 -93 -144 -193 -243
NOT VIAB NOT VIAB NOT VIAB NOT VIAB NOT VIAB
model site 6 dwgs 10-100 -66 -115 -165 -215 -265
NOT VIAB NOT VIAB NOT VIAB NOT VIAB NOT VIAB
model site 5 dwgs 10-100 -91 -141 -190 -240 -290
NOT VIAB NOT VIAB NOT VIAB NOT VIAB NOT VIAB
model site 4 dwgs 10-100 -118 -168 -217 -267 -318
NOT VIAB NOT VIAB NOT VIAB NOT VIAB NOT VIAB
model site 3 dwgs 10-100 -143 -191 -240 -289 -339
NOT VIAB NOT VIAB NOT VIAB NOT VIAB NOT VIAB
Source: Burnley & Pendle Affordable Housing Site Viability Study, Fordham Research 2010
4.15 As could be anticipated, the viability results for urban threshold sites are not very good. As the site is
consistent with Site P7, it is a clean greenfield site, with wholly two storey dwellings – no flats or three
storey town houses. However values are at the levels prevailing over most of the two Boroughs’ urban
areas. Consequently, only the largest site, 15 dwellings, exceeds the threshold use value of £10k per
acre with 10% affordable housing, though only narrowly – it is not viable. With no affordable housing
at all, sites down to 11 dwellings are similarly marginal.
4. Threshold model l ing: resu l ts
Page 21
4.16 These results help to understand how viability might decline as the size threshold was reduced. The
‘tipping point’ will depend in each case on the target proportion of affordable housing in the policy.
However it is clear that on rural sites at least, there is some scope for reducing the threshold from the
national guidance level of 15 dwellings.
4.17 This issue is considered further along with the general target, in the next chapter.

Burn ley & Pendle Af fordable Housing Si te V iab i l i ty Update
Page 22

5. Study f ind ings
Page 23
5. Study findings
Introduction
5.1 The AHSVS study carried out in 2008 considered a range of sites across the two Boroughs
comprising the Burnley and Pendle Housing Market Area. Only one of the 16 sites, in Pendle,
was below the national guidance threshold of 15 dwellings.
5.2 The 2008 study was carried out during a prolonged downturn in both housing market and
general economic conditions, when house prices had fallen quite significantly. Its findings
reflected market conditions as at November 2008.
5.3 The two Councils commissioned additional work to provide an updated assessment of current
residential development viability, with additional analysis of viability on sites below the national
guidance threshold. It would also incorporate arrangements (‘Dynamic Viability’),
subsequently developed by Fordham Research, which would enable the affordable target to
be updated automatically from time to time, as viability changed/improved.
5.4 The findings and conclusions from the work are outlined below.
Results from update
5.5 The information from our market survey suggested that, though they might well have moved in
the intervening period, at June 2010 prices of market dwellings were very similar to the values
they had in November 2008. There had been a small improvement in the base prices for two
storey houses, whilst prices for town houses and flats were just about the same. There was
no reason to think that the threshold alternative use values had changed to any measurable
extent. Build costs had risen slightly, and we assumed that affordable prices had risen in line
with the Retail Price Index (RPI).
5.6 The overall impact was that the viability results reported in the 2008 AHSVS report had not
changed very significantly; residual values had improved just a little on some sites, and
dropped back slightly on others. Overall it remained the case that a large majority of the sites
would be unviable even with zero affordable housing; they would not proceed in current
market circumstances, with the sustainability requirements and developer contributions we
assumed.
5.7 This indicates that it would not be possible to set an affordable housing target, however low,
even 0%, to apply generally across the two Borough areas.

Burn ley & Pendle Af fordable Housing Si te V iab i l i ty Update
Page 24
5.8 On the other hand, in the rural parts of Pendle prices are significantly higher than in the main
towns and, as in 2008, it appears that an affordable target could reasonably be set for those
areas.
General target
5.9 This study has drawn upon the work of the 2008 AHSVS study to provide an updated
assessment of viability for residential development in Burnley and Pendle, and also to look at
the scope for reducing the affordable housing threshold from the national guidance figure of
15 dwellings. To do this the 2008 appraisals were updated, and appraisals have also been
prepared for two sets of model sites of fewer than 15 dwellings.
5.10 The results suggest that in current market conditions, no affordable target could be set to
apply generally across either Burnley or Pendle. Market conditions would need to improve
somewhat in order that a positive target could be set.
5.11 However an affordable target could be applied in the rural parts of Pendle where prices are
higher. We suggest a figure of 20% in current market conditions. The rural area in Burnley is
much smaller, with only one substantial settlement, and with the postcode level data available
from the AHSVS (Table A2.1) the evidence of a significant rural price premium for that
settlement is more limited. However if that could be established, then we feel a corresponding
policy initiative could be supported if the Council wished to consider it.
Thresholds
5.12 We have analysed viability on sites below the national guidance threshold. Viability has been
considered for both rural sites, and for urban sites. Both were assumed to be greenfield.
5.13 For rural sites in Pendle below 15 dwellings it appears that, as with larger sites, viability would
permit their bearing an affordable target. On the model site used for our analysis a target
consistent with the suggested 20% target for larger sites, could be borne on sites down to
seven dwellings. A site of five dwellings – the smallest that at 20% would generate a complete
dwelling – could not bear the full requirement, though by interpolation we suggest it could
carry 15%.
5.14 There are several possible policy responses. A simple approach would be to operate a lower
target, of 15%, on sites from five to nine dwellings, and the full target of 20% from ten
dwellings upwards. A more sophisticated approach would involve a graduated scale, taking
one third of a dwelling as affordable on every additional dwelling after four dwellings. By ten
dwellings the full 20% target would be reached.

5. Study f ind ings
Page 25
5.15 Both these approaches would involve fractions of a dwelling, which we envisage would be
taken as commuted sums. If this arrangement is felt to be unacceptable, the graduated scale
could be rounded to whole numbers. The three approaches are shown together for
comparison in the table below. .
Table 5.1 Graduated scale for20% rural target
Option A 15% to 10 Option B graduated scale Option C rounded scale
Affordable requirement Affordable requirement Affordable requirement No of dwgs in scheme
Dwgs % Dwgs % Dwgs %
4 0 0% 0 0% 0 0%
5 0.75 15% 0.33 7% 0.0 0%
6 0.9 15% 0.67 11% 1 17%
7 1.05 15% 1.00 14% 1 14%
8 1.2 15% 1.33 17% 1 13%
9 1.35 15% 1.67 18% 2 22%
10 2 20% 2.00 20% 2 20%
11 2.2 20% 2.2 20% 2 18%
12 2.4 20% 2.4 20% 2 17%
13 2.6 20% 2.6 20% 3 23%
14 2.8 20% 2.8 20% 3 21% Source: Fordham Research Strategic Housing Viability Study
5.16 We consider that if a rural 20% target were to be developed for Burnley a parallel set of
proposals could be justified.
5.17 Model appraisals were also produced for urban threshold sites. These suggested that even
with zero affordable housing, development was only marginally viable down to 11 dwellings.
No affordable housing could be produced.
5.18 This situation is to be expected since it is reflected in the larger (15 dwellings plus) urban
sites, which also could not provide any level of affordable housing and remain viable. Were
market conditions to improve to the point where a target of say 20% could be applied
generally in Burnley or Pendle, then it is possible that a reduction in the urban threshold might
be considered. However that situation is some way off, and the relevant analysis only applies
to clean greenfield sites of comparable density to Warehouse Lane. We would suggest that
any such initiative is not pursued at this time.

Burn ley & Pendle Af fordable Housing Si te V iab i l i ty Update
Page 26
Changes in market conditions
5.19 The recommendations on targets and thresholds set out above reflect current (June 2010)
market conditions. They also reflect other assumptions such as those on tenure split; grant
support (zero); developer contributions; and the Code for Sustainable Homes specification,
which in general have been carried over from the 2008 study.
5.20 These assumptions may change, and in doing so impact upon the appraisal results. The level
of general target that could be achieved viably could then increase, or conceivably decrease.
5.21 More generally, in the report’s final two chapters (one for Burnley, one for Pendle) we develop
an approach to target setting which allows for the impact of changes in market conditions
upon the deliverable target. The approach involves constructing a matrix which shows all the
possible percentage targets that result from different combinations of movements in prices,
costs, and alternative use values. The matrix is calculated using a single ‘benchmark site’
which is felt to be reasonably representative of development generally in each Council’s area.
Sufficiently favourable movements in prices relative to costs and alternative use values would
then enable a general affordable target greater than zero to be set in each Council area. The
target of 20% proposed for rural parts of Pendle would then increase in line with the general
target.
5.22 Generally speaking, most changes (in either market conditions or other key assumptions) that
can be envisaged, will be neutral as between sites above and below 15 dwellings; if so the
results will move up or down in step. Consequently our conclusion that a lower (rural)
threshold can be introduced would remain valid, though the level of target should then vary in
step with the 15 dwellings plus target.

6. Dynamic V iab i l i ty : Burn ley
Page 27
6. Dynamic Viability: Burnley
6.1 These final two chapters for Burnley and for Pendle take the results of the viability analysis, and
provide a basis for setting policy targets. This is achieved by allowing the affordable housing target to
vary through the plan period according to what is deliverable. Hence although a general Borough-wide
target cannot be set in either area under market conditions as they stood at June 2010, a favourable
change in those conditions would allow a target to be set subsequently.
What Dynamic Viability does
6.2 The Dynamic Viability model is designed to provide robust targets at all phases of the housing market
during the plan period. This is taken to mean that the full range of possibilities must be set out for the
Core Strategy Examination, so that its Inspector can consider and decide on the level of target setting
for the whole plan period.
6.3 The model begins with the viability assessment, based on the residual valuations carried out as part of
the main Viability Study (covering a total of eight sites characteristic of the Burnley area). Whilst
normally the initial target figure provides the starting point for the model, in this case there can be no
initial target figure. The target would in fact be less than zero in Burnley, since at zero affordable
housing a majority of sites are still unviable.
Benchmark Site
6.4 The Dynamic Viability approach requires that a single benchmark site is identified that reasonably
reflects the affordable target level that is deliverable in that area. This site should be representative of
future development in the council area concerned.
6.5 After careful consideration Site B5, Former Coal Yard Burnley, was selected. The site has the base
level of floorspace density, and with market peak prices (Table 3.4) it has a middling land value
performance.
6.6 Its alternative use value is given as industrial/warehouse (net of some necessary abnormals) valued at
£160k per acre/£395k per hectare. This value is then keyed to the national published index.
Burn ley & Pendle Af fordable Housing Si te V iab i l i ty Update
Page 28
The indices
6.7 Future change in target levels is purely dependent on published indexes. This means that the process
of target setting through the plan period is entirely transparent. The model is set up prior to the Core
Strategy Examination, is assessed and approved in whatever form during that Examination, and
afterwards is entirely dependent on three published indexes:
• Price change: We use the Halifax Price Index (HPI) but others are available
• Building costs change: The RICS building cost index based on tenders (BCIS) provides a
general index of building costs
• Alternative use value: The appropriate measure would depend on the specific alternative
use applying to the benchmark site but usually it is the Valuation Office Agency’s (VOA)
Industrial Land index
6.8 The set of indices is based on the assessment that, of all the many financial assumptions in the
appraisal that could change over time, there are three key variables which in practice dominate the
outcome. Price and build cost are the key figures which determine the residual value result, but
significant movements in alternative use value will also move the site into or out of viability.
6.9 The following table shows the figures and sources of indices for each of these three ‘dimensions’:

6. Dynamic V iab i l i ty : Burn ley
Page 29
Table 6.1 Indices for automatic updating of Dynamic Viability
Variable Proposed index Starting value
House Price Halifax House Price Index Quarterly North West Seasonally Adjusted Q1 2010 = 493.8
Halifax House Price Index (free, monthly)
http://www.lloydsbankinggroup.com/media1/research/halifax_hpi.asp
Build cost BCIS General Building Cost Index Q2 2009 = 295.9
BCIS Review Online (subscription only, monthly) Produced by the Royal Institute of Chartered Surveyors http://www.bcis.co.uk/online
Alternative use value
Value of industrial land for Manchester
Both the coverage and frequency of VOA’s Property Market Report have recently (July 2010) been reduced. They are now annual rather than six monthly, and as discussed at para 2.19, only cover the very largest regional centres – the nearest being Manchester Liverpool & Leeds. The Manchester figure is proposed for use as an index in updating the alternative use value; it is movements in the Manchester figure rather than its absolute value, which are important.
January 2010: Value of £650,000 -per ha
Valuation Office Agency: Property Market Reports (free, annual) http://www.voa.gov.uk/publications/property_market_report/pmr-jan-
2010/index.htm
Sources: As shown in the boxes of the table
Details of the outputs
6.10 A simplified appraisal is used to assess what affordable target is achievable for any given combination
of new values for price, cost and alternative use value that may emerge from future movements in the
indices. Clearly in theory there are an infinite number of combinations of these three. To make the
task manageable, we have to work in ranges, i.e. with rounded percentage increases, and also to
consider only the plausible range of future variations.
6.11 Even then, the required three-dimensional table has to be reduced to a series of two dimensional
tables in order to set it down on paper. The following illustrated table shows the achievable affordable
target varies with future changes in price and cost for one particular alternative use value, the starting
(‘base’) value. It is one of a set of eight such tables. The complete set is presented in Appendix 3.

Burn ley & Pendle Af fordable Housing Si te V iab i l i ty Update
Page 30
Table 6.2 Coarse Matrix for Burnley: base alternative use value
Price Change HPI
% -20% -10% 0% 10% 20% 30% 40% 50% 60%
395.0 444.4 493.8 543.2 592.6 641.9 691.3 740.7 790.1
-20% 236.7 0% 0% 15% 30% 40% 50% 55% 55% 55%
-10% 266.3 0% 0% 0% 10% 25% 35% 45% 50% 55%
0% 295.9 0% 0% 0% 0% 10% 20% 30% 40% 45%
10% 325.5 0% 0% 0% 0% 0% 5% 20% 25% 35%
20% 355.1 0% 0% 0% 0% 0% 0% 5% 15% 25%
30% 384.7 0% 0% 0% 0% 0% 0% 0% 5% 15%
40% 414.3 0% 0% 0% 0% 0% 0% 0% 0% 5%
Cos
t Cha
nge
BC
IS In
dex
50% 443.9 0% 0% 0% 0% 0% 0% 0% 0% 0% Note that the figure shows proposed % target for each cost/price combination, with 0% change in alternative use value. The
table also provides, inside the percentages, the actual values of the indexes, so that they can be read off in future Source: Table C1 of Appendix 2 below
6.12 The base value is the 0% price and 0% cost point: as can be seen this cell contains 0%, in line with
the maximum Borough-wide affordable housing target. (This cell shows the initial value for the two
indexes: 493.8 for price and 295.9 for build cost). For each combination of price and cost change, the
table shows what affordable target is achievable. If price moves sufficiently ahead of cost, so long as
alternative use value remains broadly at its present level, it will become possible to apply a general
affordable target across Pendle. For instance, with a 40% increase in price and only 10% cost
increase, a 20% affordable target will be achievable.
6.13 The set of eight tables, of which Table 7.2 is the first, together make up a Coarse Matrix. Appendix 3
also contains eight tables comprising a parallel Fine Matrix. The reason for there being two Matrices is
as follows:
• Coarse Matrix: This is calculated in 10% intervals of the indexes (all three). The result
provides broad coverage, but the change from one cell to another can produce large changes
in targets: e.g. from 20% to 35%. But this stage provides wide coverage.
• Fine Matrix: This takes the area around the chosen target and uses 4% intervals in the
indexes (the intervals can be varied). This produces results for the area around the chosen
target that yield much smaller target changes: mostly 5% intervals and sometimes 10%.

6. Dynamic V iab i l i ty : Burn ley
Page 31
Table 6.3 Fine Matrix for Burnley: base alternative use value
Price Change HPI
% -8% -4% 0% 4% 8% 12% 16% 20% 24%
454.3 474.0 493.8 513.6 533.3 553.1 572.8 592.6 612.3
-8% 272.2 0% 0% 0% 0% 0% 10% 15% 20% 25%
-4% 284.1 0% 0% 0% 0% 0% 0% 10% 15% 20%
0% 295.9 0% 0% 0% 0% 0% 0% 0% 10% 15%
4% 307.7 0% 0% 0% 0% 0% 0% 0% 0% 5%
8% 319.6 0% 0% 0% 0% 0% 0% 0% 0% 0%
12% 331.4 0% 0% 0% 0% 0% 0% 0% 0% 0%
16% 343.2 0% 0% 0% 0% 0% 0% 0% 0% 0%
Cos
t Cha
nge
BC
IS In
dex
20% 355.1 0% 0% 0% 0% 0% 0% 0% 0% 0% Source: Fordham Research: Source Table F1 of Appendix 3 below
6.14 The Fine Matrix is the operational level. It produces target changes of the order of 5%, which seems a
manageable level of change for a potentially annual shift. The Coarse Matrix in some cases shows
changes of 10% or more, which seems too large for an annual shift.
6.15 After a period of years it may well be that the indexes move beyond the range of the initial Fine Matrix.
This is not a problem, as the Fine Matrix can move within the Coarse Matrix. It is simply a ‘close up’ of
part of the Coarse Matrix. The following diagram shows the process as it may unfold.
Figure 6.1 Coarse and Fine Matrices related
Source: Fordham Research 2009: Affordable Housing Viability Study 2009

Burn ley & Pendle Af fordable Housing Si te V iab i l i ty Update
Page 32
6.16 To provide further assistance in visualising how this system works, Figure 6.2 provides an operational
guide as to how the updating process goes.
Implementing Dynamic Viability
6.17 The Viability study which is the input into Dynamic Viability is likely to be done as part of the
preparation of the Core Strategy Affordable Housing Policy. There will then be a delay of months or
years until the actual Examination. During that period there may well be changes in the market. Thus it
is likely to be necessary to redo the base viability analysis at the time of the Core Strategy
Examination to ensure that the Dynamic Viability process starts from the period of the Examination.
6.18 Since the automatic target varying procedure cannot begin until approved by the Inspector’s Report, it
is desirable to have it as up to date as possible. Figure 6.2 indicates this process schematically.
Updating Dynamic Viability targets
6.19 The figure below sets out the updating sequence. It requires input from the report which we will have
provided. This includes, as an appendix, the following sets of tables containing indexes. In the same
appendix is a table listing the sources of the three indexes. The current values of the indexes, and the
sets of tables listed below, are all that is required for the updating process.
i) Coarse matrix of targets. This shows Halifax Price Index x BCIS (the RICS building cost
index). The indexes are shown by 10% gaps to provide affordable target numbers across a
very wide price/cost range. There are eight tables because the ‘third dimension’ of the
price/cost calculation is alternative use value. This is the value of the Benchmark Site in the
best alternative land uses to housing. The alternative use value may sometimes be higher
than housing for the Benchmark site (and so remove the affordable target, and sometimes it
may reduce the feasible target). This has to be checked as part of the procedure of updating.
ii) Fine matrix of targets. This parallels the Coarse Matrix (with eight tables) with narrower gap in
the indexes of 4%. It covers only part of the Coarse Matrix range, but as demonstrated in
Figure 7.1, can move around within that range. The affordable targets in adjoining cells of the
Fine Matrix are roughly at 5% intervals. This is about as big a target change as seems
feasible at the annual review point. The Coarse Matrix provides the background, and the Fine
matrix provides the operational targets. These alter as the prices and costs in the housing
market alter.

6. Dynamic V iab i l i ty : Burn ley
Page 33
Figure 6.2: Sequence of steps in updating the target
Step 1
The starting point is the Alternative Use Value Fine Matrix Table F1. Does the current value of the
Alternative use index mean that another page rather than the base page should be used? If so this is the
reference for the further steps.
Step 2
Using the appropriate Fine matrix table, decided by Step 1, check the changes in the HPI and the BCIS.
If either or both of these has changed by more than half the interval to the next step, then the target cell
will change. This may or may not involve a target change, since some of the targets will the same in
several cells.
Step 3
Publish the change in some suitable format such as the Annual Monitoring report.
Source: Fordham Research 2009: Affordable Housing Viability Study 2009
Figure 6.3 Implementing Dynamic Viability
Source: Fordham Research 2009: Affordable Housing Viability Study 2009
6.20 The diagram illustrates the possible change in viability between study and Core Strategy Examination,
after that, of course, the Dynamic Viability matrix will take account of future variations in viability. As
the diagram suggests, these could be downward as well as upward. The future course of the market is
uncertain.

Burn ley & Pendle Af fordable Housing Si te V iab i l i ty Update
Page 34
Conclusion: proposed target
6.21 The update study has confirmed that a general target, one covering the urban area of Burnley, could
not be set at the present time. However at some future point within the LDF plan period, if and when
prices move sufficiently ahead of costs, it will become possible to seek a target generally across
Burnley, as determined, from the Matrix tables, by movements of the published indices.
6.22 The analysis of viability, drawn from the AHSVS, does not provide sufficiently fine detail to confirm that
in current market conditions a target could be applied to the, more fragmentary, rural parts of the
Borough. Should such a target be established for some or all of the rural area, then when market
conditions improve to the point that a general target can be set through Dynamic Viability, viability will
also have improved in the rural areas sufficiently for a higher target to be deliverable. We therefore
recommend that any rural target moves up in step with the general target.
6.23 The analysis has suggested that in the rural areas, a reduced site threshold is justified. Clearly the
proposed target scale for small sites (set out at paragraph 5.16) ought also to move in step with any
rural target.

7. Dynamic V iab i l i ty : Pendle
Page 35
7. Dynamic Viability: Pendle
7.1 These final two chapters for Burnley and for Pendle take the results of the viability analysis, and
provide a basis for setting policy targets. This is achieved by allowing the affordable housing target to
vary through the plan period according to what is deliverable. Hence although a general Borough-wide
target cannot be set in either area under market conditions as they stood at June 2010, a favourable
change in those conditions would allow a target to be set subsequently.
What Dynamic Viability does
7.2 The Dynamic Viability model is designed to provide robust targets at all phases of the housing market
during the plan period. This is taken to mean that the full range of possibilities must be set out for the
Core Strategy Examination, so that its Inspector can consider and decide on the level of target setting
for the whole plan period.
7.3 The model begins with the viability assessment, based on the residual valuations carried out as part of
the main Viability Study (covering a total of eight sites characteristic of the Pendle area). Whilst
normally the initial target figure provides the starting point for the model, in this case there can be no
initial target figure. The target would in fact be less than zero in Pendle, since at zero affordable
housing a majority of sites are still unviable.
Benchmark Site
7.4 The Dynamic Viability approach requires that a single benchmark site is identified that reasonably
reflects the affordable target level that is deliverable in that area. This site should be representative of
future development in the council area concerned.
7.5 After careful consideration Site P6, Glen Mill Colne, was selected. The site has the base level of
floorspace density, and with market peak prices (Table 3.4) it has a middling land value performance.
7.6 Its alternative use value is given as industrial/warehouse (net of some necessary abnormals) valued at
£135k per acre/£335k per hectare. This value is then keyed to the national published index.

Burn ley & Pendle Af fordable Housing Si te V iab i l i ty Update
Page 36
The indices
7.7 Future change in target levels is purely dependent on published indexes. This means that the process
of target setting through the plan period is entirely transparent. The model is set up prior to the Core
Strategy Examination, is assessed and approved in whatever form during that Examination, and
afterwards is entirely dependent on three published indexes:
• Price change: We use the Halifax Price Index (HPI)
• Building costs change: The RICS building cost index (BCIS) provides a general index of
building costs
• Alternative use value: The appropriate measure would depend on the specific alternative
use applying to the benchmark site but usually it is the Valuation Office Agency’s (VOA)
Industrial Land index
7.8 The set of indices is based on the assessment that, of all the many financial assumptions in the
appraisal that could change over time, there are three key variables which in practice dominate the
outcome. Price and build cost are the key figures which determine the residual value result, but
significant movements in alternative use value will also move the site into or out of viability.
7.9 The following table shows the figures and sources of indices for each of these three ‘dimensions’:

7. Dynamic V iab i l i ty : Pendle
Page 37
Table 7.1 Indices for automatic updating of Dynamic Viability
Variable Proposed index Starting value
House Price Halifax House Price Index Quarterly North West Seasonally Adjusted Q1 2010 = 493.8
Halifax House Price Index (free, monthly)
http://www.lloydsbankinggroup.com/media1/research/halifax_hpi.asp
Build cost BCIS General Building Cost Index Q2 2009 = 295.9
BCIS Review Online (subscription only, monthly) Produced by the Royal Institute of Chartered Surveyors http://www.bcis.co.uk/online
Alternative use value
Value of industrial land for Manchester
Both the coverage and frequency of VOA’s Property Market Report have recently (July 2010) been reduced. They are now annual rather than six monthly, and as discussed at para 2.19, only cover the very largest regional centres – the nearest being Manchester Liverpool & Leeds. The Manchester figure is proposed for use as an index in updating the alternative use value; it is movements in the Manchester figure rather than its absolute value, which are important.
January 2010: Value of £650,000 -per ha
Valuation Office Agency: Property Market Reports (free, annual) http://www.voa.gov.uk/publications/property_market_report/pmr-jan-
2010/index.htm
Sources: As shown in the boxes of the table
Details of the outputs
7.10 A simplified appraisal is used to assess what affordable target is achievable for any given combination
of new values for price, cost and alternative use value that may emerge from future movements in the
indices. Clearly in theory there are an infinite number of combinations of these three. To make the
task manageable, we have to work in ranges, i.e. with rounded percentage increases, and also to
consider only the plausible range of future variations.
7.11 Even then, the required three-dimensional table has to be reduced to a series of two dimensional
tables in order to set it down on paper. The following illustrated table shows the achievable affordable
target varies with future changes in price and cost for one particular alternative use value, the starting
(‘base’) value. It is one of a set of eight such tables. The complete set is presented in Appendix 3.

Burn ley & Pendle Af fordable Housing Si te V iab i l i ty Update
Page 38
Table 7.2 Coarse Matrix for Pendle: base alternative use value
Price Change HPI
% -20% -10% 0% 10% 20% 30% 40% 50% 60%
395.0 444.4 493.8 543.2 592.6 641.9 691.3 740.7 790.1
-20% 236.7 0% 0% 15% 30% 45% 50% 55% 55% 55%
-10% 266.3 0% 0% 0% 10% 25% 35% 45% 50% 55%
0% 295.9 0% 0% 0% 0% 10% 20% 30% 40% 45%
10% 325.5 0% 0% 0% 0% 0% 5% 20% 25% 35%
20% 355.1 0% 0% 0% 0% 0% 0% 5% 15% 25%
30% 384.7 0% 0% 0% 0% 0% 0% 0% 5% 15%
40% 414.3 0% 0% 0% 0% 0% 0% 0% 0% 5%
Cos
t Cha
nge
BC
IS In
dex
50% 443.9 0% 0% 0% 0% 0% 0% 0% 0% 0% Note that the figure shows proposed % target for each cost/price combination, with 0% change in alternative use value. The
table also provides, inside the percentages, the actual values of the indexes, so that they can be read off in future Source: Table C1 of Appendix 3 below
7.12 The base value is the 0% price and 0% cost point: as can be seen this cell contains 0%, in line with
the maximum Borough-wide affordable housing target. (This cell shows the initial value for the two
indexes: 493.8 for price and 295.9 for build cost). For each combination of price and cost change, the
table shows what affordable target is achievable. If price moves sufficiently ahead of cost, so long as
alternative use value remains broadly at its present level, it will become possible to apply a general
affordable target across Pendle. For instance, with a 40% increase in price and only 10% cost
increase, a 20% affordable target will be achievable.
7.13 The set of eight tables, of which Table 7.2 is the first, together make up a Coarse Matrix. Appendix 3
also contains eight tables comprising a parallel Fine Matrix. The reason for there being two Matrices is
as follows:
• Coarse Matrix: This is calculated in 10% intervals of the indexes (all three). The result
provides broad coverage, but the change from one cell to another can produce large changes
in targets: e.g. from 20% to 35%. But this stage provides wide coverage.
• Fine Matrix: This takes the area around the chosen target and uses 4% intervals in the
indexes (the intervals can be varied). This produces results for the area around the chosen
target that yield much smaller target changes: mostly 5% intervals and sometimes 10%.

7. Dynamic V iab i l i ty : Pendle
Page 39
Table 7.3 Fine Matrix for Pendle: base alternative use value
Price Change HPI
% -8% -4% 0% 4% 8% 12% 16% 20% 24%
454.3 474.0 493.8 513.6 533.3 553.1 572.8 592.6 612.3
-8% 272.2 0% 0% 0% 0% 5% 10% 15% 20% 25%
-4% 284.1 0% 0% 0% 0% 0% 0% 10% 15% 20%
0% 295.9 0% 0% 0% 0% 0% 0% 0% 10% 15%
4% 307.7 0% 0% 0% 0% 0% 0% 0% 0% 10%
8% 319.6 0% 0% 0% 0% 0% 0% 0% 0% 0%
12% 331.4 0% 0% 0% 0% 0% 0% 0% 0% 0%
16% 343.2 0% 0% 0% 0% 0% 0% 0% 0% 0%
Cos
t Cha
nge
BC
IS In
dex
20% 355.1 0% 0% 0% 0% 0% 0% 0% 0% 0% Source: Fordham Research: Source Table F1 of Appendix 3 below
7.14 The Fine Matrix is the operational level. It produces target changes of the order of 5%, which seems a
manageable level of change for a potentially annual shift. The Coarse Matrix in some cases shows
changes of 10% or more, which seems too large for an annual shift.
7.15 After a period of years it may well be that the indexes move beyond the range of the initial Fine Matrix.
This is not a problem, as the Fine Matrix can move within the Coarse Matrix. It is simply a ‘close up’ of
part of the Coarse Matrix. The following diagram shows the process as it may unfold.
Figure 7.1 Coarse and Fine Matrices related
Source: Fordham Research 2009: Affordable Housing Viability Study 2009

Burn ley & Pendle Af fordable Housing Si te V iab i l i ty Update
Page 40
7.16 To provide further assistance in visualising how this system works, Figure 7.2 provides an operational
guide as to how the updating process goes.
Implementing Dynamic Viability
7.17 The Viability study which is the input into Dynamic Viability is likely to be done as part of the
preparation of the Core Strategy Affordable Housing Policy. There will then be a delay until the actual
Examination. During that period there may well be changes in the market. Thus it is likely to be
necessary to redo the base viability analysis at the time of the Core Strategy Examination to ensure
that the Dynamic Viability process starts from the period of the Examination. Only when the relevant
Development Plan Document has been approved will the automatic target varying procedure begin to
operate. However, it is desirable to have it as up to date as possible; Figure 7.3 indicates this process
schematically.
Updating Dynamic Viability targets
7.18 The figure below sets out the updating sequence. It requires input from the report which we will have
provided. This includes, as an appendix, the following sets of tables containing indexes. In the same
appendix is a table listing the sources of the three indexes. The current values of the indexes, and the
sets of tables listed below, are all that is required for the updating process.
i) Coarse matrix of targets. This shows Halifax Price Index x BCIS (the RICS building cost
index). The indexes are shown by 10% gaps to provide affordable target numbers across a
very wide price/cost range. There are eight tables because the ‘third dimension’ of the
price/cost calculation is alternative use value. This is the value of the Benchmark Site (Glen
Mill, Colne).in the best alternative land uses to housing. The alternative use value may
sometimes be higher than housing for the Benchmark site (and so remove the affordable
target, and sometimes it may reduce the feasible target). This has to be checked as part of the
procedure of updating.
ii) Fine matrix of targets. This parallels the Coarse Matrix (with eight tables) with a narrower gap
in the indexes of 4%. It covers only part of the Coarse Matrix range, but as demonstrated in
Figure 7.1, can move around within that range. The affordable targets in adjoining cells of the
Fine Matrix are roughly at 5% intervals. This is about as big a target change as seems
feasible at the annual review point. The Coarse Matrix provides the background, and the Fine
matrix provides the operational targets. These alter as the prices and costs in the housing
market alter.

7. Dynamic V iab i l i ty : Pendle
Page 41
Figure 7.2: Sequence of steps in updating the target
Step 1
The starting point is the Alternative Use Value Fine Matrix Table F1. Does the current value of the
Alternative use index mean that another page rather than the base page should be used? If so this is the
reference for the further steps.
Step 2
Using the appropriate Fine matrix table, decided by Step 1, check the changes in the HPI and the BCIS.
If either or both of these has changed by more than half the interval to the next step, then the target cell
will change. This may or may not involve a target change, since some of the targets will remain the same
in several cells.
Step 3
Publish the change in some suitable format such as the Annual Monitoring Report (AMR).
Source: Fordham Research 2009: Affordable Housing Viability Study 2009
Figure 7.3 Implementing Dynamic Viability
Source: Fordham Research 2009: Affordable Housing Viability Study 2009

Burn ley & Pendle Af fordable Housing Si te V iab i l i ty Update
Page 42
7.19 The diagram illustrates the possible change in viability between study and Core Strategy Examination,
after that, of course, the Dynamic Viability matrix will take account of future variations in viability. As
the diagram suggests, these could be downward as well as upward. The future course of the market is
uncertain.
Conclusion: proposed targets
7.20 The update study has confirmed that a general target, i.e. covering the urban and rural areas of
Pendle, could not be set at the present time. However at some future point within the LDF plan period,
if and when prices move sufficiently ahead of costs, it will become possible to seek a target generally
across Pendle, as determined, from the Matrix tables, by movements of the published indices.
7.21 The viability analysis indicates that in current market conditions a 20% target could be applied across
the rural areas of the Borough. When market conditions improve to the point that a general target can
be set through Dynamic Viability, viability will also have improved in the rural areas sufficiently for a
higher target to be deliverable. We therefore recommend that the rural target moves in step with the
general target, but 20% higher.
7.22 The analysis has suggested that in the rural areas of Pendle, a reduced site threshold is justified.
Clearly the proposed target scale for small sites (set out at paragraph 5.16) ought also to move in step
with the rural target.

Appendix 1 . Newbui ld schemes
Page 43
Appendix 1. Newbuild schemes
A1.1 The schedule below provides details of a number of current new build developments and conversions
in the two Borough areas.
Table A1.1 Newbuild schemes
Site Builder
The Summit, Manchester Road, Burnley, BB11 Paddle Homes 25 3/4 & 4 bed houses £175k-£275k
Heather Close, Brierfield, BB9 5HB n/a n/a 3 4 & 5 bed houses £199k
Clifton Square, Burnley Pringle 40 2 bed flats 2 & 3/4 bed houses £84k-£133k
Weir Close, Padiham PDS Properties 10 3 & 4 bed houses £179k-£219k
Groveside Park, Rosegrove, Burnley n/a n/a 2 & 3 bed houses & bungalows £145k
Pennine View Keepmoat 56 2 3 & 4 bed houses £99k-£133k
Kirkside View, Hapton n/a 12 2 bed flats £86k
Alderhurst End Farm, Trawden n/a 5 2 3 & 4 bed conversions £289k-£375k
Westfield Park, Barnoldswick Orchard Developments 53 2, 3 & 3/4 bed houses £169k-£245k

Burn ley & Pendle Af fordable Housing Si te V iab i l i ty Update
Page 44

Appendix 2 . Proposed Burn ley benchmark appra isa l
Page 45
Appendix 2. Proposed Burnley benchmark
appraisal A2.1 This appendix sets out the detail of the two sets of matrices discussed in Chapter 6 in relation to
implementing Dynamic Viability.
A2.2 For convenience this appendix summarises two key features: the Benchmark Site and the three index
sources used to generate the matrices.
Benchmark site and the Indices
A2.3 As discussed at the beginning of Chapter 6, the Benchmark Site is No B5, the former Coalyard site at
Oswald St Burnley, a site for 75 dwellings. It is considered reasonably representative of future
development in Burnley. Its alternative use value (net of abnormal costs) is industrial/warehouse.
A2.4 The following table, identical to Table 6.1, shows the values of the indexes at the time of the fieldwork.
Table A3.1 Indices for automatic updating of Dynamic Viability
Variable Proposed index Starting value
House Price Halifax House Price Index Quarterly North West Seasonally Adjusted Q1 2010 = 493.8
Halifax House Price Index (free, monthly)
http://www.lloydsbankinggroup.com/media1/research/halifax_hpi.asp
Build cost BCIS General Building Cost Index Q2 2009 = 295.9
BCIS Review Online (subscription only, monthly) Produced by the Royal Institute of Chartered Surveyors http://www.bcis.co.uk/online
Alternative use value
The Valuation Office Agency has recently (July 2010) altered its reports, producing annual valuations as at January of each year rather than six monthly ones. The industrial value is taken for Manchester (within the North West region)
January 2010: Value of £650,000 -per ha
Valuation Office Agency: Property Market Reports (free, annual) http://www.voa.gov.uk/publications/property_market_report/pmr-jan-
2010/index.htm
Sources: As shown in the boxes of the table

Burn ley & Pendle Af fordable Housing Si te V iab i l i ty Update
Page 46
Detailed tables
A2.5 The results from the sequence of appraisals are set out in the following table(s). There are two sets of
eight tabulations of the Coarse and Fine Matrices described in Chapter 6. They provide for the full
range of possible targets and also the alternative use value check in eight bands of alternative use
value indexes.

Appendix 2 . Proposed Burn ley benchmark appra isa l
Page 47
Burnley Benchmark Site Appraisal
Coarse Matrix
Table C1 Base alternative use value: 0% change in Land Value Index
Price Change HPI
% -20% -10% 0% 10% 20% 30% 40% 50% 60%
395.0 444.4 493.8 543.2 592.6 641.9 691.3 740.7 790.1
-20% 236.7 0% 0% 15% 30% 40% 50% 55% 55% 55%
-10% 266.3 0% 0% 0% 10% 25% 35% 45% 50% 55%
0% 295.9 0% 0% 0% 0% 10% 20% 30% 40% 45%
10% 325.5 0% 0% 0% 0% 0% 5% 20% 25% 35%
20% 355.1 0% 0% 0% 0% 0% 0% 5% 15% 25%
30% 384.7 0% 0% 0% 0% 0% 0% 0% 5% 15%
40% 414.3 0% 0% 0% 0% 0% 0% 0% 0% 5%
Cos
t Cha
nge
BC
IS In
dex
50% 443.9 0% 0% 0% 0% 0% 0% 0% 0% 0%
Table C2 Base alternative use value: -60% change in Land Value Index
Price Change HPI
% -20% -10% 0% 10% 20% 30% 40% 50% 60%
395.0 444.4 493.8 543.2 592.6 641.9 691.3 740.7 790.1
-20% 236.7 0% 5% 30% 45% 50% 55% 55% 55% 55%
-10% 266.3 0% 0% 0% 20% 35% 45% 50% 55% 55%
0% 295.9 0% 0% 0% 0% 20% 30% 40% 45% 50%
10% 325.5 0% 0% 0% 0% 0% 15% 25% 35% 40%
20% 355.1 0% 0% 0% 0% 0% 0% 15% 20% 30%
30% 384.7 0% 0% 0% 0% 0% 0% 0% 10% 20%
40% 414.3 0% 0% 0% 0% 0% 0% 0% 0% 10%
Cos
t Cha
nge
BC
IS In
dex
50% 443.9 0% 0% 0% 0% 0% 0% 0% 0% 0%

Burn ley & Pendle Af fordable Housing Si te V iab i l i ty Update
Page 48
Table C3 Base alternative use value: -40% change in Land Value Index
Price Change HPI
% -20% -10% 0% 10% 20% 30% 40% 50% 60%
395.0 444.4 493.8 543.2 592.6 641.9 691.3 740.7 790.1
-20% 236.7 0% 0% 25% 40% 50% 55% 55% 55% 55%
-10% 266.3 0% 0% 0% 20% 30% 40% 50% 55% 55%
0% 295.9 0% 0% 0% 0% 15% 25% 35% 40% 50%
10% 325.5 0% 0% 0% 0% 0% 10% 25% 30% 40%
20% 355.1 0% 0% 0% 0% 0% 0% 10% 20% 30%
30% 384.7 0% 0% 0% 0% 0% 0% 0% 10% 20%
40% 414.3 0% 0% 0% 0% 0% 0% 0% 0% 10%
Cos
t Cha
nge
BC
IS In
dex
50% 443.9 0% 0% 0% 0% 0% 0% 0% 0% 0%
Table C4 Base alternative use value: -20% change in Land Value Index
Price Change HPI
% -20% -10% 0% 10% 20% 30% 40% 50% 60%
395.0 444.4 493.8 543.2 592.6 641.9 691.3 740.7 790.1
-20% 236.7 0% 0% 20% 35% 45% 55% 55% 55% 55%
-10% 266.3 0% 0% 0% 15% 30% 40% 45% 50% 55%
0% 295.9 0% 0% 0% 0% 10% 25% 35% 40% 45%
10% 325.5 0% 0% 0% 0% 0% 10% 20% 30% 35%
20% 355.1 0% 0% 0% 0% 0% 0% 10% 20% 25%
30% 384.7 0% 0% 0% 0% 0% 0% 0% 5% 15%
40% 414.3 0% 0% 0% 0% 0% 0% 0% 0% 5%
Cos
t Cha
nge
BC
IS In
dex
50% 443.9 0% 0% 0% 0% 0% 0% 0% 0% 0%
Table C5 Base alternative use value: +20% change in Land Value Index
Price Change HPI
% -20% -10% 0% 10% 20% 30% 40% 50% 60%
395.0 444.4 493.8 543.2 592.6 641.9 691.3 740.7 790.1
-20% 236.7 0% 0% 10% 25% 40% 45% 55% 55% 55%
-10% 266.3 0% 0% 0% 5% 20% 35% 40% 45% 50%
0% 295.9 0% 0% 0% 0% 5% 20% 30% 35% 40%
10% 325.5 0% 0% 0% 0% 0% 5% 15% 25% 30%
20% 355.1 0% 0% 0% 0% 0% 0% 5% 15% 20%
30% 384.7 0% 0% 0% 0% 0% 0% 0% 0% 10%
40% 414.3 0% 0% 0% 0% 0% 0% 0% 0% 0%
Cos
t Cha
nge
BC
IS In
dex
50% 443.9 0% 0% 0% 0% 0% 0% 0% 0% 0%

Appendix 2 . Proposed Burn ley benchmark appra isa l
Page 49
Table C6 Base alternative use value: +40% change in Land Value Index
Price Change HPI
% -20% -10% 0% 10% 20% 30% 40% 50% 60%
395.0 444.4 493.8 543.2 592.6 641.9 691.3 740.7 790.1
-20% 236.7 0% 0% 5% 25% 35% 45% 50% 55% 55%
-10% 266.3 0% 0% 0% 0% 20% 30% 40% 45% 50%
0% 295.9 0% 0% 0% 0% 0% 15% 25% 35% 40%
10% 325.5 0% 0% 0% 0% 0% 0% 15% 25% 30%
20% 355.1 0% 0% 0% 0% 0% 0% 0% 10% 20%
30% 384.7 0% 0% 0% 0% 0% 0% 0% 0% 10%
40% 414.3 0% 0% 0% 0% 0% 0% 0% 0% 0%
Cos
t Cha
nge
BC
IS In
dex
50% 443.9 0% 0% 0% 0% 0% 0% 0% 0% 0%
Table C7 Base alternative use value: +60% change in Land Value Index
Price Change HPI
% -20% -10% 0% 10% 20% 30% 40% 50% 60%
395.0 444.4 493.8 543.2 592.6 641.9 691.3 740.7 790.1
-20% 236.7 0% 0% 0% 20% 30% 40% 50% 55% 55%
-10% 266.3 0% 0% 0% 0% 15% 25% 35% 45% 50%
0% 295.9 0% 0% 0% 0% 0% 15% 25% 30% 40%
10% 325.5 0% 0% 0% 0% 0% 0% 10% 20% 30%
20% 355.1 0% 0% 0% 0% 0% 0% 0% 10% 20%
30% 384.7 0% 0% 0% 0% 0% 0% 0% 0% 10%
40% 414.3 0% 0% 0% 0% 0% 0% 0% 0% 0%
Cos
t Cha
nge
BC
IS In
dex
50% 443.9 0% 0% 0% 0% 0% 0% 0% 0% 0%
Table C8 Base alternative use value: +80% change in Land Value Index
Price Change HPI
% -20% -10% 0% 10% 20% 30% 40% 50% 60%
395.0 444.4 493.8 543.2 592.6 641.9 691.3 740.7 790.1
-20% 236.7 0% 0% 0% 15% 30% 40% 45% 50% 55%
-10% 266.3 0% 0% 0% 0% 10% 25% 35% 40% 45%
0% 295.9 0% 0% 0% 0% 0% 10% 20% 30% 35%
10% 325.5 0% 0% 0% 0% 0% 0% 10% 20% 25%
20% 355.1 0% 0% 0% 0% 0% 0% 0% 5% 15%
30% 384.7 0% 0% 0% 0% 0% 0% 0% 0% 5%
40% 414.3 0% 0% 0% 0% 0% 0% 0% 0% 0%
Cos
t Cha
nge
BC
IS In
dex
50% 443.9 0% 0% 0% 0% 0% 0% 0% 0% 0%

Burn ley & Pendle Af fordable Housing Si te V iab i l i ty Update
Page 50
Burnley Benchmark Site Appraisal
Fine Matrix
Table F1 Base alternative use value: 0% change in Land Value Index
Price Change HPI
% -8% -4% 0% 4% 8% 12% 16% 20% 24%
454.3 474.0 493.8 513.6 533.3 553.1 572.8 592.6 612.3
-8% 272.2 0% 0% 0% 0% 0% 10% 15% 20% 25%
-4% 284.1 0% 0% 0% 0% 0% 0% 10% 15% 20%
0% 295.9 0% 0% 0% 0% 0% 0% 0% 10% 15%
4% 307.7 0% 0% 0% 0% 0% 0% 0% 0% 5%
8% 319.6 0% 0% 0% 0% 0% 0% 0% 0% 0%
12% 331.4 0% 0% 0% 0% 0% 0% 0% 0% 0%
16% 343.2 0% 0% 0% 0% 0% 0% 0% 0% 0%
Cos
t Cha
nge
BC
IS In
dex
20% 355.1 0% 0% 0% 0% 0% 0% 0% 0% 0%
Table F2 Base alternative use value: -30% change in Land Value Index
Price Change HPI
% -8% -4% 0% 4% 8% 12% 16% 20% 24%
454.3 474.0 493.8 513.6 533.3 553.1 572.8 592.6 612.3
-8% 272.2 0% 0% 0% 0% 10% 15% 20% 25% 30%
-4% 284.1 0% 0% 0% 0% 0% 5% 15% 20% 25%
0% 295.9 0% 0% 0% 0% 0% 0% 5% 15% 20%
4% 307.7 0% 0% 0% 0% 0% 0% 0% 5% 10%
8% 319.6 0% 0% 0% 0% 0% 0% 0% 0% 5%
12% 331.4 0% 0% 0% 0% 0% 0% 0% 0% 0%
16% 343.2 0% 0% 0% 0% 0% 0% 0% 0% 0%
Cos
t Cha
nge
BC
IS In
dex
20% 355.1 0% 0% 0% 0% 0% 0% 0% 0% 0%
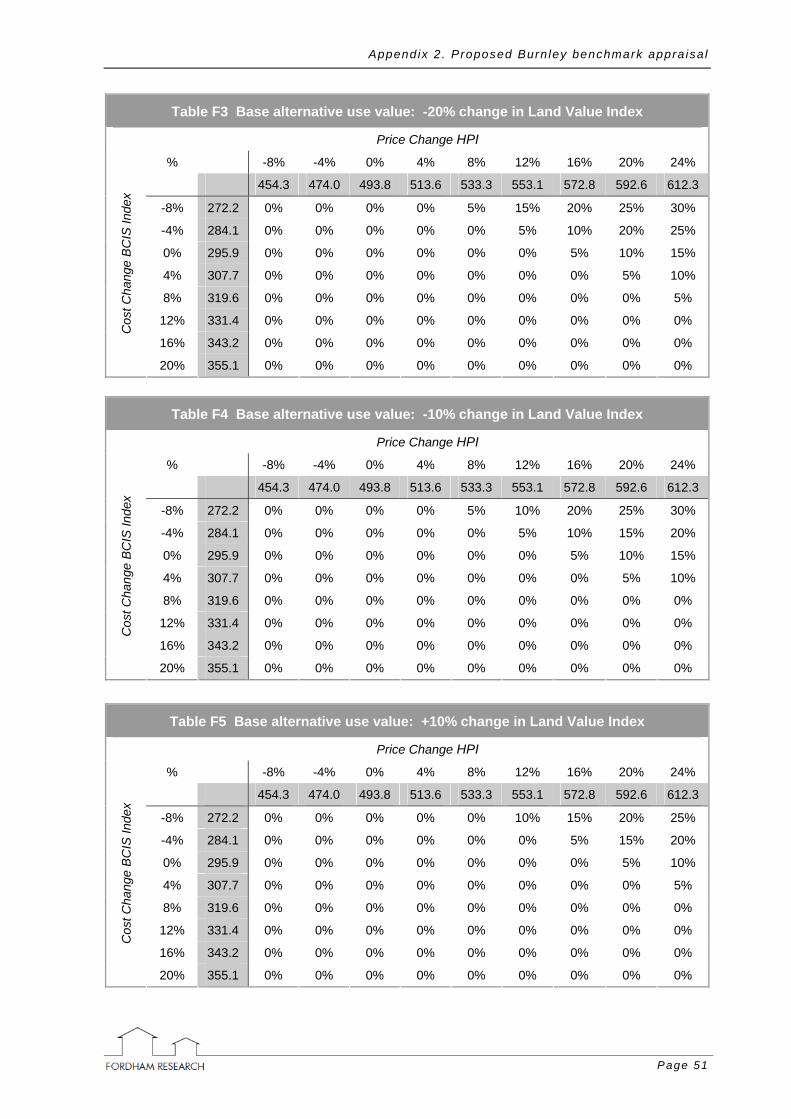
Appendix 2 . Proposed Burn ley benchmark appra isa l
Page 51
Table F3 Base alternative use value: -20% change in Land Value Index
Price Change HPI
% -8% -4% 0% 4% 8% 12% 16% 20% 24%
454.3 474.0 493.8 513.6 533.3 553.1 572.8 592.6 612.3
-8% 272.2 0% 0% 0% 0% 5% 15% 20% 25% 30%
-4% 284.1 0% 0% 0% 0% 0% 5% 10% 20% 25%
0% 295.9 0% 0% 0% 0% 0% 0% 5% 10% 15%
4% 307.7 0% 0% 0% 0% 0% 0% 0% 5% 10%
8% 319.6 0% 0% 0% 0% 0% 0% 0% 0% 5%
12% 331.4 0% 0% 0% 0% 0% 0% 0% 0% 0%
16% 343.2 0% 0% 0% 0% 0% 0% 0% 0% 0%
Cos
t Cha
nge
BC
IS In
dex
20% 355.1 0% 0% 0% 0% 0% 0% 0% 0% 0%
Table F4 Base alternative use value: -10% change in Land Value Index
Price Change HPI
% -8% -4% 0% 4% 8% 12% 16% 20% 24%
454.3 474.0 493.8 513.6 533.3 553.1 572.8 592.6 612.3
-8% 272.2 0% 0% 0% 0% 5% 10% 20% 25% 30%
-4% 284.1 0% 0% 0% 0% 0% 5% 10% 15% 20%
0% 295.9 0% 0% 0% 0% 0% 0% 5% 10% 15%
4% 307.7 0% 0% 0% 0% 0% 0% 0% 5% 10%
8% 319.6 0% 0% 0% 0% 0% 0% 0% 0% 0%
12% 331.4 0% 0% 0% 0% 0% 0% 0% 0% 0%
16% 343.2 0% 0% 0% 0% 0% 0% 0% 0% 0%
Cos
t Cha
nge
BC
IS In
dex
20% 355.1 0% 0% 0% 0% 0% 0% 0% 0% 0%
Table F5 Base alternative use value: +10% change in Land Value Index
Price Change HPI
% -8% -4% 0% 4% 8% 12% 16% 20% 24%
454.3 474.0 493.8 513.6 533.3 553.1 572.8 592.6 612.3
-8% 272.2 0% 0% 0% 0% 0% 10% 15% 20% 25%
-4% 284.1 0% 0% 0% 0% 0% 0% 5% 15% 20%
0% 295.9 0% 0% 0% 0% 0% 0% 0% 5% 10%
4% 307.7 0% 0% 0% 0% 0% 0% 0% 0% 5%
8% 319.6 0% 0% 0% 0% 0% 0% 0% 0% 0%
12% 331.4 0% 0% 0% 0% 0% 0% 0% 0% 0%
16% 343.2 0% 0% 0% 0% 0% 0% 0% 0% 0%
Cos
t Cha
nge
BC
IS In
dex
20% 355.1 0% 0% 0% 0% 0% 0% 0% 0% 0%

Burn ley & Pendle Af fordable Housing Si te V iab i l i ty Update
Page 52
Table F6 Base alternative use value: +20% change in Land Value Index
Price Change HPI
% -8% -4% 0% 4% 8% 12% 16% 20% 24%
454.3 474.0 493.8 513.6 533.3 553.1 572.8 592.6 612.3
-8% 272.2 0% 0% 0% 0% 0% 5% 10% 20% 25%
-4% 284.1 0% 0% 0% 0% 0% 0% 5% 10% 15%
0% 295.9 0% 0% 0% 0% 0% 0% 0% 5% 10%
4% 307.7 0% 0% 0% 0% 0% 0% 0% 0% 5%
8% 319.6 0% 0% 0% 0% 0% 0% 0% 0% 0%
12% 331.4 0% 0% 0% 0% 0% 0% 0% 0% 0%
16% 343.2 0% 0% 0% 0% 0% 0% 0% 0% 0%
Cos
t Cha
nge
BC
IS In
dex
20% 355.1 0% 0% 0% 0% 0% 0% 0% 0% 0%
Table F7 Base alternative use value: +30% change in Land Value Index
Price Change HPI
% -8% -4% 0% 4% 8% 12% 16% 20% 24%
454.3 474.0 493.8 513.6 533.3 553.1 572.8 592.6 612.3
-8% 272.2 0% 0% 0% 0% 0% 5% 10% 15% 20%
-4% 284.1 0% 0% 0% 0% 0% 0% 5% 10% 15%
0% 295.9 0% 0% 0% 0% 0% 0% 0% 5% 10%
4% 307.7 0% 0% 0% 0% 0% 0% 0% 0% 5%
8% 319.6 0% 0% 0% 0% 0% 0% 0% 0% 0%
12% 331.4 0% 0% 0% 0% 0% 0% 0% 0% 0%
16% 343.2 0% 0% 0% 0% 0% 0% 0% 0% 0%
Cos
t Cha
nge
BC
IS In
dex
20% 355.1 0% 0% 0% 0% 0% 0% 0% 0% 0%
Table F8 Base alternative use value: +40% change in Land Value Index
Price Change HPI
% -8% -4% 0% 4% 8% 12% 16% 20% 24%
454.3 474.0 493.8 513.6 533.3 553.1 572.8 592.6 612.3
-8% 272.2 0% 0% 0% 0% 0% 0% 10% 15% 20%
-4% 284.1 0% 0% 0% 0% 0% 0% 0% 10% 15%
0% 295.9 0% 0% 0% 0% 0% 0% 0% 0% 5%
4% 307.7 0% 0% 0% 0% 0% 0% 0% 0% 0%
8% 319.6 0% 0% 0% 0% 0% 0% 0% 0% 0%
12% 331.4 0% 0% 0% 0% 0% 0% 0% 0% 0%
16% 343.2 0% 0% 0% 0% 0% 0% 0% 0% 0%
Cos
t Cha
nge
BC
IS In
dex
20% 355.1 0% 0% 0% 0% 0% 0% 0% 0% 0%

Appendix 3 . Proposed Pendle benchmark appra isa l
Page 53
Appendix 3. Proposed Pendle benchmark
appraisal A3.1 This appendix sets out the detail of the two sets of matrices discussed in Chapter 7 in relation to
implementing Dynamic Viability.
A3.2 For convenience this appendix summarises two key features: the Benchmark Site and the three index
sources used to generate the matrices.
Benchmark site and the Indices
A3.3 As discussed at the beginning of Chapter 7, the Benchmark Site is No. P6, Glen Mill Colne, a site for
37 dwellings. It is considered reasonably representative of future development in Pendle. Its
alternative use value (net of abnormal costs) is industrial/warehouse.
A3.4 The following table, identical to Table 7.1, shows the values of the indexes at the time of the fieldwork.
Table A3.1 Indices for automatic updating of Dynamic Viability
Variable Proposed index Starting value
House Price Halifax House Price Index Quarterly North West Seasonally Adjusted Q1 2010 = 493.8
Halifax House Price Index (free, monthly)
http://www.lloydsbankinggroup.com/media1/research/halifax_hpi.asp
Build cost BCIS General Building Cost Index Q2 2009 = 295.9
BCIS Review Online (subscription only, monthly) Produced by the Royal Institute of Chartered Surveyors http://www.bcis.co.uk/online
Alternative use value
The Valuation Office Agency has recently (July 2010) altered its reports, producing annual valuations as at January of each year rather than six monthly ones. The industrial value is taken for Manchester (within the North West region)
January 2010: Value of £650,000 -per ha
Valuation Office Agency: Property Market Reports (free, annual) http://www.voa.gov.uk/publications/property_market_report/pmr-jan-
2010/index.htm
Sources: As shown in the boxes of the table

Burn ley & Pendle Af fordable Housing Si te V iab i l i ty Update
Page 54
Detailed tables
A3.5 The results from the sequence of appraisals are set out in the following table(s). There are two sets of
eight tabulations of the Coarse and Fine Matrices described in Chapter 7. They provide for the full
range of possible targets and also the alternative use value check in eight bands of alternative use
value indexes.
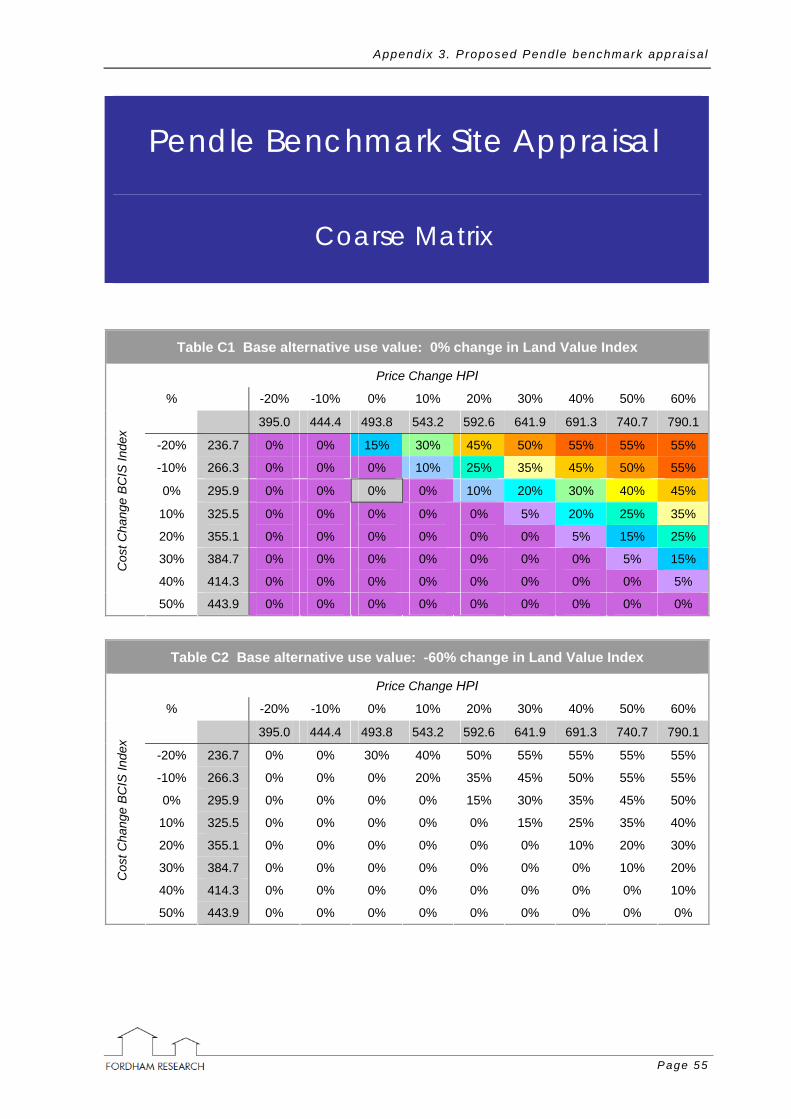
Appendix 3 . Proposed Pendle benchmark appra isa l
Page 55
Pendle Benchmark Site Appraisal
Coarse Matrix
Table C1 Base alternative use value: 0% change in Land Value Index
Price Change HPI
% -20% -10% 0% 10% 20% 30% 40% 50% 60%
395.0 444.4 493.8 543.2 592.6 641.9 691.3 740.7 790.1
-20% 236.7 0% 0% 15% 30% 45% 50% 55% 55% 55%
-10% 266.3 0% 0% 0% 10% 25% 35% 45% 50% 55%
0% 295.9 0% 0% 0% 0% 10% 20% 30% 40% 45%
10% 325.5 0% 0% 0% 0% 0% 5% 20% 25% 35%
20% 355.1 0% 0% 0% 0% 0% 0% 5% 15% 25%
30% 384.7 0% 0% 0% 0% 0% 0% 0% 5% 15%
40% 414.3 0% 0% 0% 0% 0% 0% 0% 0% 5%
Cos
t Cha
nge
BC
IS In
dex
50% 443.9 0% 0% 0% 0% 0% 0% 0% 0% 0%
Table C2 Base alternative use value: -60% change in Land Value Index
Price Change HPI
% -20% -10% 0% 10% 20% 30% 40% 50% 60%
395.0 444.4 493.8 543.2 592.6 641.9 691.3 740.7 790.1
-20% 236.7 0% 0% 30% 40% 50% 55% 55% 55% 55%
-10% 266.3 0% 0% 0% 20% 35% 45% 50% 55% 55%
0% 295.9 0% 0% 0% 0% 15% 30% 35% 45% 50%
10% 325.5 0% 0% 0% 0% 0% 15% 25% 35% 40%
20% 355.1 0% 0% 0% 0% 0% 0% 10% 20% 30%
30% 384.7 0% 0% 0% 0% 0% 0% 0% 10% 20%
40% 414.3 0% 0% 0% 0% 0% 0% 0% 0% 10%
Cos
t Cha
nge
BC
IS In
dex
50% 443.9 0% 0% 0% 0% 0% 0% 0% 0% 0%

Burn ley & Pendle Af fordable Housing Si te V iab i l i ty Update
Page 56
Table C3 Base alternative use value: -40% change in Land Value Index
Price Change HPI
% -20% -10% 0% 10% 20% 30% 40% 50% 60%
395.0 444.4 493.8 543.2 592.6 641.9 691.3 740.7 790.1
-20% 236.7 0% 0% 25% 40% 50% 55% 55% 55% 55%
-10% 266.3 0% 0% 0% 20% 30% 40% 50% 55% 55%
0% 295.9 0% 0% 0% 0% 15% 25% 35% 40% 50%
10% 325.5 0% 0% 0% 0% 0% 10% 25% 30% 40%
20% 355.1 0% 0% 0% 0% 0% 0% 10% 20% 30%
30% 384.7 0% 0% 0% 0% 0% 0% 0% 10% 15%
40% 414.3 0% 0% 0% 0% 0% 0% 0% 0% 5%
Cos
t Cha
nge
BC
IS In
dex
50% 443.9 0% 0% 0% 0% 0% 0% 0% 0% 0%
Table C4 Base alternative use value: -20% change in Land Value Index
Price Change HPI
% -20% -10% 0% 10% 20% 30% 40% 50% 60%
395.0 444.4 493.8 543.2 592.6 641.9 691.3 740.7 790.1
-20% 236.7 0% 0% 20% 35% 45% 55% 55% 55% 55%
-10% 266.3 0% 0% 0% 15% 30% 40% 45% 50% 55%
0% 295.9 0% 0% 0% 0% 10% 25% 35% 40% 45%
10% 325.5 0% 0% 0% 0% 0% 10% 20% 30% 35%
20% 355.1 0% 0% 0% 0% 0% 0% 10% 20% 25%
30% 384.7 0% 0% 0% 0% 0% 0% 0% 5% 15%
40% 414.3 0% 0% 0% 0% 0% 0% 0% 0% 5%
Cos
t Cha
nge
BC
IS In
dex
50% 443.9 0% 0% 0% 0% 0% 0% 0% 0% 0%
Table C5 Base alternative use value: +20% change in Land Value Index
Price Change HPI
% -20% -10% 0% 10% 20% 30% 40% 50% 60%
395.0 444.4 493.8 543.2 592.6 641.9 691.3 740.7 790.1
-20% 236.7 0% 0% 10% 30% 40% 50% 55% 55% 55%
-10% 266.3 0% 0% 0% 10% 25% 35% 40% 50% 55%
0% 295.9 0% 0% 0% 0% 5% 20% 30% 35% 45%
10% 325.5 0% 0% 0% 0% 0% 5% 15% 25% 35%
20% 355.1 0% 0% 0% 0% 0% 0% 5% 15% 25%
30% 384.7 0% 0% 0% 0% 0% 0% 0% 5% 10%
40% 414.3 0% 0% 0% 0% 0% 0% 0% 0% 0%
Cos
t Cha
nge
BC
IS In
dex
50% 443.9 0% 0% 0% 0% 0% 0% 0% 0% 0%

Appendix 3 . Proposed Pendle benchmark appra isa l
Page 57
Table C6 Base alternative use value: +40% change in Land Value Index
Price Change HPI
% -20% -10% 0% 10% 20% 30% 40% 50% 60%
395.0 444.4 493.8 543.2 592.6 641.9 691.3 740.7 790.1
-20% 236.7 0% 0% 5% 25% 40% 45% 55% 55% 55%
-10% 266.3 0% 0% 0% 5% 20% 30% 40% 45% 50%
0% 295.9 0% 0% 0% 0% 5% 15% 25% 35% 40%
10% 325.5 0% 0% 0% 0% 0% 0% 15% 25% 30%
20% 355.1 0% 0% 0% 0% 0% 0% 0% 10% 20%
30% 384.7 0% 0% 0% 0% 0% 0% 0% 0% 10%
40% 414.3 0% 0% 0% 0% 0% 0% 0% 0% 0%
Cos
t Cha
nge
BC
IS In
dex
50% 443.9 0% 0% 0% 0% 0% 0% 0% 0% 0%
Table C7 Base alternative use value: +60% change in Land Value Index
Price Change HPI
% -20% -10% 0% 10% 20% 30% 40% 50% 60%
395.0 444.4 493.8 543.2 592.6 641.9 691.3 740.7 790.1
-20% 236.7 0% 0% 0% 20% 35% 45% 50% 55% 55%
-10% 266.3 0% 0% 0% 0% 20% 30% 40% 45% 50%
0% 295.9 0% 0% 0% 0% 0% 15% 25% 35% 40%
10% 325.5 0% 0% 0% 0% 0% 0% 10% 20% 30%
20% 355.1 0% 0% 0% 0% 0% 0% 0% 10% 20%
30% 384.7 0% 0% 0% 0% 0% 0% 0% 0% 10%
40% 414.3 0% 0% 0% 0% 0% 0% 0% 0% 0%
Cos
t Cha
nge
BC
IS In
dex
50% 443.9 0% 0% 0% 0% 0% 0% 0% 0% 0%
Table C8 Base alternative use value: +80% change in Land Value Index
Price Change HPI
% -20% -10% 0% 10% 20% 30% 40% 50% 60%
395.0 444.4 493.8 543.2 592.6 641.9 691.3 740.7 790.1
-20% 236.7 0% 0% 0% 20% 30% 40% 50% 55% 55%
-10% 266.3 0% 0% 0% 0% 15% 25% 35% 45% 50%
0% 295.9 0% 0% 0% 0% 0% 10% 25% 30% 40%
10% 325.5 0% 0% 0% 0% 0% 0% 10% 20% 30%
20% 355.1 0% 0% 0% 0% 0% 0% 0% 10% 20%
30% 384.7 0% 0% 0% 0% 0% 0% 0% 0% 5%
40% 414.3 0% 0% 0% 0% 0% 0% 0% 0% 0%
Cos
t Cha
nge
BC
IS In
dex
50% 443.9 0% 0% 0% 0% 0% 0% 0% 0% 0%

Burn ley & Pendle Af fordable Housing Si te V iab i l i ty Update
Page 58
Pendle Benchmark Site Appraisal
Fine Matrix
Table F1 Base alternative use value: 0% change in Land Value Index
Price Change HPI
% -8% -4% 0% 4% 8% 12% 16% 20% 24%
454.3 474.0 493.8 513.6 533.3 553.1 572.8 592.6 612.3
-8% 272.2 0% 0% 0% 0% 5% 10% 15% 20% 25%
-4% 284.1 0% 0% 0% 0% 0% 0% 10% 15% 20%
0% 295.9 0% 0% 0% 0% 0% 0% 0% 10% 15%
4% 307.7 0% 0% 0% 0% 0% 0% 0% 0% 10%
8% 319.6 0% 0% 0% 0% 0% 0% 0% 0% 0%
12% 331.4 0% 0% 0% 0% 0% 0% 0% 0% 0%
16% 343.2 0% 0% 0% 0% 0% 0% 0% 0% 0%
Cos
t Cha
nge
BC
IS In
dex
20% 355.1 0% 0% 0% 0% 0% 0% 0% 0% 0%
Table F2 Base alternative use value: -30% change in Land Value Index
Price Change HPI
% -8% -4% 0% 4% 8% 12% 16% 20% 24%
454.3 474.0 493.8 513.6 533.3 553.1 572.8 592.6 612.3
-8% 272.2 0% 0% 0% 0% 10% 15% 20% 25% 30%
-4% 284.1 0% 0% 0% 0% 0% 5% 15% 20% 25%
0% 295.9 0% 0% 0% 0% 0% 0% 5% 15% 20%
4% 307.7 0% 0% 0% 0% 0% 0% 0% 5% 10%
8% 319.6 0% 0% 0% 0% 0% 0% 0% 0% 5%
12% 331.4 0% 0% 0% 0% 0% 0% 0% 0% 0%
16% 343.2 0% 0% 0% 0% 0% 0% 0% 0% 0%
Cos
t Cha
nge
BC
IS In
dex
20% 355.1 0% 0% 0% 0% 0% 0% 0% 0% 0%

Appendix 3 . Proposed Pendle benchmark appra isa l
Page 59
Table F3 Base alternative use value: -20% change in Land Value Index
Price Change HPI
% -8% -4% 0% 4% 8% 12% 16% 20% 24%
454.3 474.0 493.8 513.6 533.3 553.1 572.8 592.6 612.3
-8% 272.2 0% 0% 0% 0% 5% 15% 20% 25% 30%
-4% 284.1 0% 0% 0% 0% 0% 5% 15% 20% 25%
0% 295.9 0% 0% 0% 0% 0% 0% 5% 10% 15%
4% 307.7 0% 0% 0% 0% 0% 0% 0% 5% 10%
8% 319.6 0% 0% 0% 0% 0% 0% 0% 0% 5%
12% 331.4 0% 0% 0% 0% 0% 0% 0% 0% 0%
16% 343.2 0% 0% 0% 0% 0% 0% 0% 0% 0%
Cos
t Cha
nge
BC
IS In
dex
20% 355.1 0% 0% 0% 0% 0% 0% 0% 0% 0%
Table F4 Base alternative use value: -10% change in Land Value Index
Price Change HPI
% -8% -4% 0% 4% 8% 12% 16% 20% 24%
454.3 474.0 493.8 513.6 533.3 553.1 572.8 592.6 612.3
-8% 272.2 0% 0% 0% 0% 5% 10% 20% 25% 30%
-4% 284.1 0% 0% 0% 0% 0% 5% 10% 15% 20%
0% 295.9 0% 0% 0% 0% 0% 0% 5% 10% 15%
4% 307.7 0% 0% 0% 0% 0% 0% 0% 5% 10%
8% 319.6 0% 0% 0% 0% 0% 0% 0% 0% 5%
12% 331.4 0% 0% 0% 0% 0% 0% 0% 0% 0%
16% 343.2 0% 0% 0% 0% 0% 0% 0% 0% 0%
Cos
t Cha
nge
BC
IS In
dex
20% 355.1 0% 0% 0% 0% 0% 0% 0% 0% 0%
Table F5 Base alternative use value: +10% change in Land Value Index
Price Change HPI
% -8% -4% 0% 4% 8% 12% 16% 20% 24%
454.3 474.0 493.8 513.6 533.3 553.1 572.8 592.6 612.3
-8% 272.2 0% 0% 0% 0% 0% 10% 15% 20% 25%
-4% 284.1 0% 0% 0% 0% 0% 0% 10% 15% 20%
0% 295.9 0% 0% 0% 0% 0% 0% 0% 5% 15%
4% 307.7 0% 0% 0% 0% 0% 0% 0% 0% 5%
8% 319.6 0% 0% 0% 0% 0% 0% 0% 0% 0%
12% 331.4 0% 0% 0% 0% 0% 0% 0% 0% 0%
16% 343.2 0% 0% 0% 0% 0% 0% 0% 0% 0%
Cos
t Cha
nge
BC
IS In
dex
20% 355.1 0% 0% 0% 0% 0% 0% 0% 0% 0%

Burn ley & Pendle Af fordable Housing Si te V iab i l i ty Update
Page 60
Table F6 Base alternative use value: +20% change in Land Value Index
Price Change HPI
% -8% -4% 0% 4% 8% 12% 16% 20% 24%
454.3 474.0 493.8 513.6 533.3 553.1 572.8 592.6 612.3
-8% 272.2 0% 0% 0% 0% 0% 5% 15% 20% 25%
-4% 284.1 0% 0% 0% 0% 0% 0% 5% 15% 20%
0% 295.9 0% 0% 0% 0% 0% 0% 0% 5% 10%
4% 307.7 0% 0% 0% 0% 0% 0% 0% 0% 5%
8% 319.6 0% 0% 0% 0% 0% 0% 0% 0% 0%
12% 331.4 0% 0% 0% 0% 0% 0% 0% 0% 0%
16% 343.2 0% 0% 0% 0% 0% 0% 0% 0% 0%
Cos
t Cha
nge
BC
IS In
dex
20% 355.1 0% 0% 0% 0% 0% 0% 0% 0% 0%
Table F7 Base alternative use value: +30% change in Land Value Index
Price Change HPI
% -8% -4% 0% 4% 8% 12% 16% 20% 24%
454.3 474.0 493.8 513.6 533.3 553.1 572.8 592.6 612.3
-8% 272.2 0% 0% 0% 0% 0% 5% 10% 20% 25%
-4% 284.1 0% 0% 0% 0% 0% 0% 5% 10% 15%
0% 295.9 0% 0% 0% 0% 0% 0% 0% 5% 10%
4% 307.7 0% 0% 0% 0% 0% 0% 0% 0% 5%
8% 319.6 0% 0% 0% 0% 0% 0% 0% 0% 0%
12% 331.4 0% 0% 0% 0% 0% 0% 0% 0% 0%
16% 343.2 0% 0% 0% 0% 0% 0% 0% 0% 0%
Cos
t Cha
nge
BC
IS In
dex
20% 355.1 0% 0% 0% 0% 0% 0% 0% 0% 0%
Table F8 Base alternative use value: +40% change in Land Value Index
Price Change HPI
% -8% -4% 0% 4% 8% 12% 16% 20% 24%
454.3 474.0 493.8 513.6 533.3 553.1 572.8 592.6 612.3
-8% 272.2 0% 0% 0% 0% 0% 5% 10% 15% 20%
-4% 284.1 0% 0% 0% 0% 0% 0% 5% 10% 15%
0% 295.9 0% 0% 0% 0% 0% 0% 0% 5% 10%
4% 307.7 0% 0% 0% 0% 0% 0% 0% 0% 5%
8% 319.6 0% 0% 0% 0% 0% 0% 0% 0% 0%
12% 331.4 0% 0% 0% 0% 0% 0% 0% 0% 0%
16% 343.2 0% 0% 0% 0% 0% 0% 0% 0% 0%
Cos
t Cha
nge
BC
IS In
dex
20% 355.1 0% 0% 0% 0% 0% 0% 0% 0% 0%

Appendix 4 . F inanc ia l appra isa l summar ies
Page 61
Appendix 4. Financial appraisal summaries
A4.1 The development viability summaries contained in the following pages set out the assumptions and
outputs of the viability appraisals for a 10% affordable scenario.

Burn ley & Pendle Af fordable Housing Si te V iab i l i ty Update
Page 62

Appendix 4 . F inanc ia l appra isa l summar ies
Page 63
SITE B1: Dorma, Casterton Avenue, Burnley

Burn ley & Pendle Af fordable Housing Si te V iab i l i ty Update
Page 64
Inpu
t ass
umpt
ions
Scen
ario
& o
ptio
nAf
ford
able
10%
= 9
% s
ocia
l ren
ted
1% in
term
edia
te
Bur
nley
& P
endl
e vi
abili
ty s
tudy
Dw
ellin
gs
Site
det
ails
ave
floor
spa
cebu
ildsa
les
Site
B1
Dor
ma
Cas
tert
on A
veD
wel
lings
gros
sne
tco
stva
lue
Loca
tion
Bur
nley
sq ft
sq ft
per s
q ft
per s
q ft
Are
a
ha
1.93
Mar
ket h
ousi
ng99
.090
.00%
893
851
88.0
015
0.00
acre
s4.
770.
0%N
o dw
gs11
0Af
ford
able
soc
rent
9.9
9.00
%89
385
188
.00
80.0
0D
ensi
ty d
w/h
a57
.00.
0%Af
ford
able
sh
oshi
p1.
11.
00%
893
851
88.0
010
8.00
0.0%
Aff o
ther
20.
00.
00%
893
851
88.0
00.
000.
0%Af
f oth
er 2
0.0
0.00
%0
088
.00
0.00
£kC
ontin
genc
yTo
tal
110.
010
0.00
%98
,230
93,6
10£8
,644
,240
£13,
412,
441
allo
wan
ce5.
00%
432
Floo
rspa
ce d
ensi
ty=
19,6
29ne
t sq
ft pe
r acr
e
Dev
elop
men
t cos
tsst
anda
rd %
bui
ld13
.00%
1,18
0O
ther
cos
tsPl
anni
ng43
8.2
£ pe
r dw
ellin
g
Surv
ey50
0£
per d
wel
ling
plus
abn
orm
als
2.6%
237
Mar
ketin
g0
£ pe
r dw
ellin
gTo
tal
16%
Des
ign
fees
on b
uild
cos
ts10
.0%
908
Inte
rest
% p
er a
nnum
7.50
%
on d
ev c
osts
0%N
otes
Plan
ning
gai
n£
per d
wel
ling
3,10
034
1

Appendix 4 . F inanc ia l appra isa l summar ies
Page 65
SITE B1 LAND COST & PHASING
Land
Itera
te to
ach
ieve
20.
0% p
rofit
Affo
rdab
leN
o af
ford
able
Affo
rdab
leN
o af
ford
able
Land
pur
chas
e pr
ice
£
-1,1
68,3
93-8
09,7
98R
V pe
r acr
e£
-244
,996
-169
,803
-£60
5,38
5-£
419,
584
Dev
pro
fit£
2,19
0,89
12,
340,
488
Tota
l cos
ts£
11,2
22,8
2411
,702
,287
prof
it as
% o
f cos
ts19
.52%
20.0
0%
Hec
tare
Prog
ram
me
Year
1Ye
ar 2
Year
3Ye
ar 4
Year
5Q
1Q
2Q
3Q
4Q
1Q
2Q
3Q
4Q
1Q
2Q
3Q
4Q
1Q
2Q
3Q
4Q
1Q
2Q
3Q
4TO
TALS
Uni
tsM
arke
t hou
sing
9.0
9.0
9.0
9.0
9.0
9.0
9.0
9.0
9.0
9.0
9.0
0.0
0.0
0.0
0.0
0.0
0.0
0.0
99.0
star
ted
Affo
rdab
le s
oc re
nt0.
90.
90.
90.
90.
90.
90.
90.
90.
90.
90.
90.
00.
00.
00.
00.
00.
00.
09.
9Af
ford
able
sh
oshi
p0.
10.
10.
10.
10.
10.
10.
10.
10.
10.
10.
10.
00.
00.
00.
00.
00.
00.
01.
1Af
f oth
er 2
0.0
0.0
0.0
0.0
0.0
0.0
0.0
0.0
0.0
0.0
0.0
0.0
0.0
0.0
0.0
0.0
0.0
0.0
0.0
Aff o
ther
20.
00.
00.
00.
00.
00.
00.
00.
00.
00.
00.
00.
00.
00.
00.
00.
00.
00.
00.
0TO
TAL
00
1010
1010
1010
1010
1010
100
00
00
00
110.
0
Uni
tsM
arke
t hou
sing
00
99
99
99
99
99
90
00
00
99'b
uilt' +2
QAf
ford
able
soc
rent
00
11
11
11
11
11
10
00
00
10Af
ford
able
sh
oshi
p0
00
00
00
00
00
00
00
00
01
Aff o
ther
20
00
00
00
00
00
00
00
00
00
Aff o
ther
20
00
00
00
00
00
00
00
00
00
Uni
tsM
arke
t hou
sing
00
99
99
99
99
99
90
00
099
com
plet
ed+3
QAf
ford
able
soc
rent
00
11
11
11
11
11
10
00
010
Affo
rdab
le s
h os
hip
00
00
00
00
00
00
00
00
01
Aff o
ther
20
00
00
00
00
00
00
00
00
0Af
f oth
er 2
00
00
00
00
00
00
00
00
00
Uni
tsM
arke
t hou
sing
00
99
99
99
99
99
90
00
99pu
rcha
sed
+4Q
Affo
rdab
le s
oc re
nt0
01
11
11
11
11
11
00
010
Affo
rdab
le s
h os
hip
00
00
00
00
00
00
00
00
1Af
f oth
er 2
00
00
00
00
00
00
00
00
0Af
f oth
er 2
00
00
00
00
00
00
00
00
0

Burn ley & Pendle Af fordable Housing Si te V iab i l i ty Update
Page 66
SITE B1 CASH FLOW AFFORDABLE
Year
1Ye
ar 2
Year
3Ye
ar 4
Year
5ra
teQ
1Q
2Q
3Q
4Q
1Q
2Q
3Q
4Q
1Q
2Q
3Q
4Q
1Q
2Q
3Q
4Q
1Q
2Q
3Q
4TO
TALS
INC
OM
E
Hou
sing
sal
esM
arke
t hou
sing
00
00
00
1,14
91,
149
1,14
91,
149
1,14
91,
149
1,14
91,
149
1,14
91,
149
1,14
90
00
12,6
37Af
ford
able
soc
rent
00
00
00
6161
6161
6161
6161
6161
610
00
674
Affo
rdab
le s
h os
hip
00
00
00
99
99
99
99
99
90
00
101
Aff o
ther
20
00
00
00
00
00
00
00
00
00
00
Aff o
ther
20
00
00
00
00
00
00
00
00
00
00
Sale
s fe
es0
00
00
0-4
1-4
1-4
1-4
1-4
1-4
1-4
1-4
1-4
1-4
1-4
10
00
-447
Tota
l inc
ome
00
00
00
1,21
91,
219
1,21
91,
219
1,21
91,
219
1,21
91,
219
1,21
91,
219
1,21
90
00
13,4
12C
OST
S
Land
Land
acq
uisi
tion
-1,1
68-1
,168
Stam
p du
ty0
0Pu
rcha
se fe
es-3
2-3
2To
tal
-1,2
01B
uild
cos
tsM
arke
t hou
sing
00
00
707
707
707
707
707
707
707
707
707
707
707
00
00
07,
780
Affo
rdab
le s
oc re
nt0
00
071
7171
7171
7171
7171
7171
00
00
077
8Af
ford
able
sh
oshi
p0
00
08
88
88
88
88
88
00
00
086
Aff o
ther
20
00
00
00
00
00
00
00
00
00
00
Aff o
ther
20
00
00
00
00
00
00
00
00
00
00
Build
con
tinge
ncy
5.0%
00
00
3939
3939
3939
3939
3939
390
00
00
432
Tota
l9,
076
Dev
cos
tsU
pfro
nt6.
5%14
714
714
714
759
0Bu
ild re
late
d6.
5%0
054
5454
5454
5454
5454
5454
00
00
00
059
0Ab
norm
als
3%11
811
823
7To
tal
1,41
7Fe
esFe
es o
n bu
ild c
osts
10.0
%0
00
083
8383
8383
8383
8383
8383
00
00
090
8Fe
es o
n de
v co
sts
0.0%
00
00
00
00
00
00
00
00
00
00
0To
tal
908
PGPl
anni
ng g
ain
3131
3131
3131
3131
3131
310
00
00
00
341
Tota
l34
1O
ther
Plan
ning
£438
1616
1648
Surv
ey£5
0055
55M
arke
ting
£00
00
00
00
00
00
00
00
00
00
Tota
l10
3Sa
les
fees
b/fo
rwar
d fro
m a
bove
00
00
00
4141
4141
4141
4141
4141
410
00
447
Tota
l cos
ts-8
6428
224
823
299
299
21,
033
1,03
31,
033
1,03
31,
033
1,03
31,
033
948
948
4141
00
011
,092
Net
pro
fit/lo
ss fr
om q
uart
er86
4-2
82-2
48-2
32-9
92-9
9218
618
618
618
618
618
618
627
127
11,
179
1,17
90
00
2,32
1
Prof
it/lo
ss b
f fro
m la
st q
uart
er0
880
609
368
138
-870
-1,8
97-1
,743
-1,5
85-1
,425
-1,2
62-1
,096
-926
-754
-492
-225
972
2,19
12,
191
2,19
1
Cum
ulat
ive
prof
it/lo
ss86
459
836
113
6-8
54-1
,862
-1,7
11-1
,556
-1,3
99-1
,239
-1,0
76-9
09-7
40-4
83-2
2195
42,
150
2,19
12,
191
2,19
1
Inte
rest
Cha
rged
at
7.50
%7.
50%
7.50
%7.
50%
7.50
%7.
50%
7.50
%7.
50%
7.50
%7.
50%
7.50
%7.
50%
7.50
%7.
50%
7.50
%7.
50%
7.50
%7.
50%
0.00
%0.
00%
0.00
%To
tal
1611
73
-16
-35
-32
-29
-26
-23
-20
-17
-14
-9-4
1840
00
0-1
31
Cum
ulat
ive
deve
lope
r pro
fit88
060
936
813
8-8
70-1
,897
-1,7
43-1
,585
-1,4
25-1
,262
-1,0
96-9
26-7
54-4
92-2
2597
22,
191
2,19
12,
191
2,19
12,
190
carr
ied
forw
ard
to R
V ca
lc

Appendix 4 . F inanc ia l appra isa l summar ies
Page 67
SITE B2: Summit Works Burnley

Burn ley & Pendle Af fordable Housing Si te V iab i l i ty Update
Page 68
Inpu
t ass
umpt
ions
Scen
ario
& o
ptio
nAf
ford
able
10%
= 9
% s
ocia
l ren
ted
1% in
term
edia
te
Bur
nley
& P
endl
e vi
abili
ty s
tudy
Dw
ellin
gs
Site
det
ails
ave
floor
spa
cebu
ildsa
les
Site
B2
Sum
mit
Wks
Man
ches
tr R
dD
wel
lings
gros
sne
tco
stva
lue
Loca
tion
Bur
nley
sq ft
sq ft
per s
q ft
per s
q ft
Are
a
ha
0.45
Mar
ket h
ousi
ng22
.590
.00%
1,04
51,
045
85.4
014
3.00
acre
s1.
110.
0%N
o dw
gs25
Affo
rdab
le s
oc re
nt2.
39.
00%
1,04
51,
045
85.4
082
.00
Den
sity
dw
/ha
55.6
0.0%
Affo
rdab
le s
h os
hip
0.3
1.00
%1,
045
1,04
585
.40
108.
000.
0%Af
f oth
er 2
0.0
0.00
%1,
045
1,04
585
.40
0.00
0.0%
Aff o
ther
20.
00.
00%
00
85.4
00.
00£k
Con
tinge
ncy
Tota
l25
.010
0.00
%26
,125
26,1
25£2
,231
,075
£3,5
83,3
05al
low
ance
5.00
%11
2Fl
oors
pace
den
sity
=23
,495
net s
q ft
per a
cre
Dev
elop
men
t cos
tsst
anda
rd %
bui
ld12
.50%
293
Oth
er c
osts
Plan
ning
515.
0£
per d
wel
ling
Surv
ey50
0£
per d
wel
ling
plus
abn
orm
als
3.1%
71
Mar
ketin
g0
£ pe
r dw
ellin
gTo
tal
16%
Des
ign
fees
on b
uild
cos
ts10
.0%
234
Inte
rest
% p
er a
nnum
7.50
%
on d
ev c
osts
0%N
otes
Plan
ning
gai
n£
per d
wel
ling
3,10
078
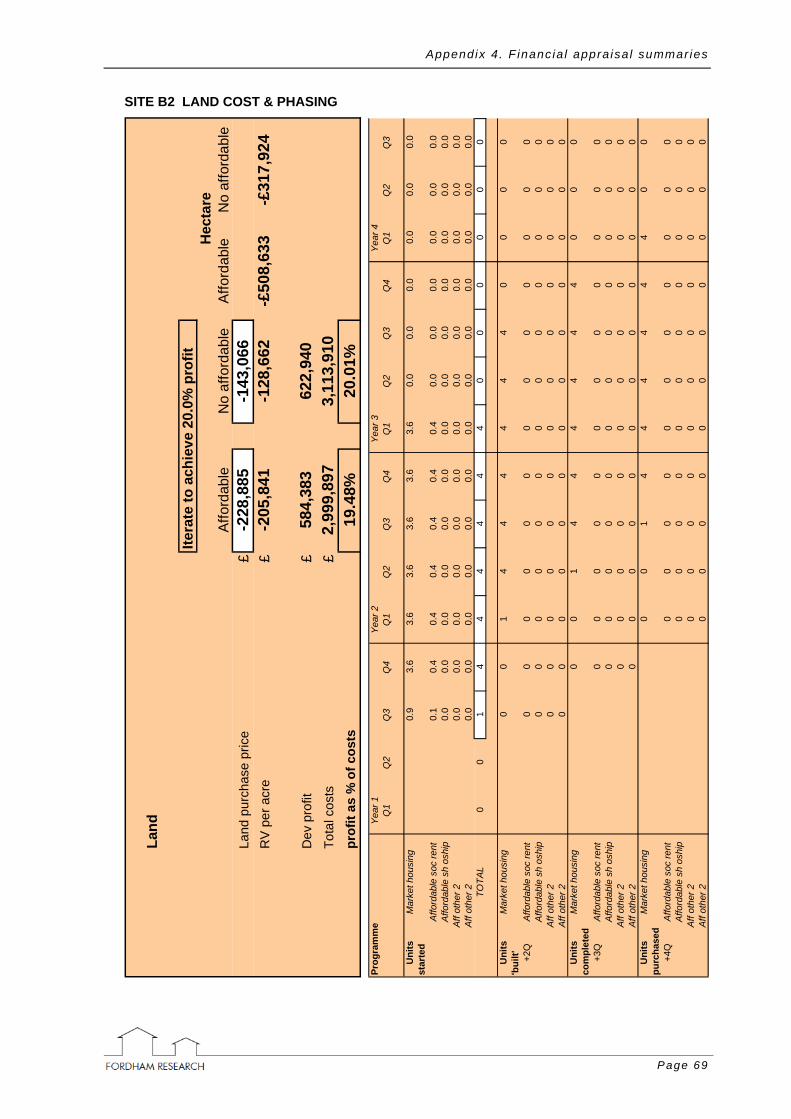
Appendix 4 . F inanc ia l appra isa l summar ies
Page 69
SITE B2 LAND COST & PHASING
Land
Itera
te to
ach
ieve
20.
0% p
rofit
Affo
rdab
leN
o af
ford
able
Affo
rdab
leN
o af
ford
able
Land
pur
chas
e pr
ice
£
-228
,885
-143
,066
RV
per a
cre
£-2
05,8
41-1
28,6
62-£
508,
633
-£31
7,92
4
Dev
pro
fit£
584,
383
622,
940
Tota
l cos
ts£
2,99
9,89
73,
113,
910
prof
it as
% o
f cos
ts19
.48%
20.0
1%
Hec
tare
Prog
ram
me
Yea
r 1Y
ear 2
Yea
r 3Y
ear 4
Q1
Q2
Q3
Q4
Q1
Q2
Q3
Q4
Q1
Q2
Q3
Q4
Q1
Q2
Q3
Uni
tsM
arke
t hou
sing
0.9
3.6
3.6
3.6
3.6
3.6
3.6
0.0
0.0
0.0
0.0
0.0
0.0
star
ted
Affo
rdab
le s
oc re
nt0.
10.
40.
40.
40.
40.
40.
40.
00.
00.
00.
00.
00.
0A
fford
able
sh
oshi
p0.
00.
00.
00.
00.
00.
00.
00.
00.
00.
00.
00.
00.
0Af
f oth
er 2
0.0
0.0
0.0
0.0
0.0
0.0
0.0
0.0
0.0
0.0
0.0
0.0
0.0
Aff o
ther
20.
00.
00.
00.
00.
00.
00.
00.
00.
00.
00.
00.
00.
0TO
TAL
00
14
44
44
40
00
00
0
Uni
tsM
arke
t hou
sing
00
14
44
44
40
00
0'b
uilt' +2
QA
fford
able
soc
rent
00
00
00
00
00
00
0A
fford
able
sh
oshi
p0
00
00
00
00
00
00
Aff o
ther
20
00
00
00
00
00
00
Aff o
ther
20
00
00
00
00
00
00
Uni
tsM
arke
t hou
sing
00
14
44
44
40
00
com
plet
ed+3
QA
fford
able
soc
rent
00
00
00
00
00
00
Affo
rdab
le s
h os
hip
00
00
00
00
00
00
Aff o
ther
20
00
00
00
00
00
0Af
f oth
er 2
00
00
00
00
00
00
Uni
tsM
arke
t hou
sing
00
14
44
44
40
0pu
rcha
sed
+4Q
Affo
rdab
le s
oc re
nt0
00
00
00
00
00
Affo
rdab
le s
h os
hip
00
00
00
00
00
0Af
f oth
er 2
00
00
00
00
00
0Af
f oth
er 2
00
00
00
00
00
0

Burn ley & Pendle Af fordable Housing Si te V iab i l i ty Update
Page 70
SITE B2 CASH FLOW AFFORDABLE
Yea
r 1Ye
ar 2
Yea
r 3Y
ear 4
rate
Q1
Q2
Q3
Q4
Q1
Q2
Q3
Q4
Q1
Q2
Q3
Q4
Q1
Q2
Q3
Q4
Q4
TOTA
LS
INC
OM
E
Hou
sing
sal
esM
arke
t hou
sing
00
00
00
134
538
538
538
538
538
538
00
00
3,36
2Af
ford
able
soc
rent
00
00
00
831
3131
3131
310
00
019
3Af
ford
able
sh
oshi
p0
00
00
01
55
55
55
00
00
28Af
f oth
er 2
00
00
00
00
00
00
00
00
00
Aff o
ther
20
00
00
00
00
00
00
00
00
0Sa
les
fees
00
00
00
-5-1
9-1
9-1
9-1
9-1
9-1
90
00
0-1
19
Tota
l inc
ome
00
00
00
143
573
573
573
573
573
573
00
00
3,58
3C
OST
S
Land
Land
acq
uisi
tion
-229
-229
Stam
p du
ty0
0Pu
rcha
se fe
es-6
-6To
tal
-235
Bui
ld c
osts
Mar
ket h
ousi
ng0
00
080
321
321
321
321
321
321
00
00
00
2,00
8Af
ford
able
soc
rent
00
00
832
3232
3232
320
00
00
020
1Af
ford
able
sh
oshi
p0
00
01
44
44
44
00
00
00
22Af
f oth
er 2
00
00
00
00
00
00
00
00
00
Aff o
ther
20
00
00
00
00
00
00
00
00
0Bu
ild c
ontin
genc
y5.
0%0
00
04
1818
1818
1818
00
00
00
112
Tota
l2,
343
Dev
cos
tsU
pfro
nt6.
3%37
3737
3714
6Bu
ild re
late
d6.
3%0
06
2323
2323
2323
00
00
00
014
6Ab
norm
als
3%36
3671
Tota
l36
4Fe
esFe
es o
n bu
ild c
osts
10.0
%0
00
09
3737
3737
3737
00
00
00
234
Fees
on
dev
cost
s0.
0%0
00
00
00
00
00
00
00
00
0To
tal
234
PGPl
anni
ng g
ain
312
1212
1212
120
00
00
00
078
Tota
l78
Oth
erPl
anni
ng£5
154
44
13Su
rvey
£500
1313
Mar
ketin
g£0
00
00
00
00
00
00
00
00
Tota
l25
Sale
s fe
esb/
forw
ard
from
abo
ve0
00
00
05
1919
1919
1919
00
00
119
Tota
l cos
ts-1
4677
5072
139
448
453
467
467
431
431
1919
00
00
2,92
8
Net
pro
fit/lo
ss fr
om q
uart
er14
6-7
7-5
0-7
2-1
39-4
48-3
1010
610
614
214
255
455
40
00
065
5
Prof
it/lo
ss b
f fro
m la
st q
uart
er0
149
7424
-49
-191
-651
-979
-889
-797
-668
-535
1958
458
458
458
4
Cum
ulat
ive
prof
it/lo
ss14
672
24-4
8-1
88-6
39-9
61-8
73-7
83-6
55-5
2619
574
584
584
584
584
Inte
rest
Cha
rged
at
7.50
%7.
50%
7.50
%7.
50%
7.50
%7.
50%
7.50
%7.
50%
7.50
%7.
50%
7.50
%7.
50%
7.50
%7.
50%
0.00
%0.
00%
0.00
%0.
00%
Tota
l3
10
-1-4
-12
-18
-16
-15
-12
-10
011
00
00
-72
Cum
ulat
ive
deve
lope
r pro
fit14
974
24-4
9-1
91-6
51-9
79-8
89-7
97-6
68-5
3519
584
584
584
584
584
583
carr
ied
forw
ard
to R
V ca
lc

Appendix 4 . F inanc ia l appra isa l summar ies
Page 71
SITE B3: Park Mill Burnley

Burn ley & Pendle Af fordable Housing Si te V iab i l i ty Update
Page 72
Inpu
t ass
umpt
ions
Scen
ario
& o
ptio
nAf
ford
able
10%
= 9
% s
ocia
l ren
ted
1% in
term
edia
te
Bur
nley
& P
endl
e vi
abili
ty s
tudy
Dw
ellin
gs
Site
det
ails
ave
floor
spa
cebu
ildsa
les
Site
B3
Park
Mill
Ley
land
Rd
Dw
ellin
gsgr
oss
net
cost
valu
eLo
catio
nB
urnl
eysq
ftsq
ftpe
r sq
ftpe
r sq
ftA
rea
h
a1.
35M
arke
t hou
sing
69.3
90.0
0%84
281
290
.50
141.
00ac
res
3.34
0.0%
No
dwgs
77Af
ford
able
soc
rent
6.9
9.00
%84
281
290
.50
81.0
0D
ensi
ty d
w/h
a57
.00.
0%Af
ford
able
sh
oshi
p0.
81.
00%
842
812
90.5
010
8.00
0.0%
Aff o
ther
20.
00.
00%
842
812
90.5
00.
000.
0%Af
f oth
er 2
0.0
0.00
%0
090
.50
0.00
£kC
ontin
genc
yTo
tal
77.0
100.
00%
64,8
3462
,524
£5,8
67,4
77£8
,457
,621
allo
wan
ce5.
00%
293
Floo
rspa
ce d
ensi
ty=
18,7
43ne
t sq
ft pe
r acr
e
Dev
elop
men
t cos
tsst
anda
rd %
bui
ld13
.00%
801
Oth
er c
osts
Plan
ning
371.
0£
per d
wel
ling
Surv
ey50
0£
per d
wel
ling
plus
abn
orm
als
2.3%
140
Mar
ketin
g0
£ pe
r dw
ellin
gTo
tal
15%
Des
ign
fees
on b
uild
cos
ts10
.0%
616
Inte
rest
% p
er a
nnum
7.50
%
on d
ev c
osts
0%N
otes
Plan
ning
gai
n£
per d
wel
ling
3,10
023
9

Appendix 4 . F inanc ia l appra isa l summar ies
Page 73
SITE B3 LAND COST & PHASING
Land
Itera
te to
ach
ieve
20.
0% p
rofit
Affo
rdab
leN
o af
ford
able
Affo
rdab
leN
o af
ford
able
Land
pur
chas
e pr
ice
£
-1,2
14,5
87-1
,013
,222
RV
per
acr
e£
-364
,101
-303
,737
-£89
9,69
4-£
750,
535
Dev
pro
fit£
1,38
2,70
91,
469,
766
Tota
l cos
ts£
7,07
6,11
27,
347,
318
prof
it as
% o
f cos
ts19
.54%
20.0
0%
Hec
tare
Prog
ram
me
Yea
r 1Ye
ar 2
Year
3Ye
ar 4
Year
5Q
1Q
2Q
3Q
4Q
1Q
2Q
3Q
4Q
1Q
2Q
3Q
4Q
1Q
2Q
3Q
4Q
1Q
2Q
3Q
4TO
TALS
Uni
tsM
arke
t hou
sing
4.5
7.2
7.2
7.2
7.2
7.2
7.2
7.2
7.2
7.2
0.0
0.0
0.0
0.0
0.0
0.0
0.0
0.0
69.3
star
ted
Affo
rdab
le s
oc re
nt0.
50.
70.
70.
70.
70.
70.
70.
70.
70.
70.
00.
00.
00.
00.
00.
00.
00.
06.
9A
fford
able
sh
oshi
p0.
00.
10.
10.
10.
10.
10.
10.
10.
10.
10.
00.
00.
00.
00.
00.
00.
00.
00.
8Af
f oth
er 2
0.0
0.0
0.0
0.0
0.0
0.0
0.0
0.0
0.0
0.0
0.0
0.0
0.0
0.0
0.0
0.0
0.0
0.0
0.0
Aff o
ther
20.
00.
00.
00.
00.
00.
00.
00.
00.
00.
00.
00.
00.
00.
00.
00.
00.
00.
00.
0TO
TAL
00
58
88
88
88
88
00
00
00
00
77.0
Uni
tsM
arke
t hou
sing
00
57
77
77
77
77
00
00
00
69'b
uilt' +2
QA
fford
able
soc
rent
00
01
11
11
11
11
00
00
00
7A
fford
able
sh
oshi
p0
00
00
00
00
00
00
00
00
01
Aff o
ther
20
00
00
00
00
00
00
00
00
00
Aff o
ther
20
00
00
00
00
00
00
00
00
00
Uni
tsM
arke
t hou
sing
00
57
77
77
77
77
00
00
069
com
plet
ed+3
QA
fford
able
soc
rent
00
01
11
11
11
11
00
00
07
Affo
rdab
le s
h os
hip
00
00
00
00
00
00
00
00
01
Aff o
ther
20
00
00
00
00
00
00
00
00
0Af
f oth
er 2
00
00
00
00
00
00
00
00
00
Uni
tsM
arke
t hou
sing
00
57
77
77
77
77
00
00
69pu
rcha
sed
+4Q
Affo
rdab
le s
oc re
nt0
00
11
11
11
11
10
00
07
Affo
rdab
le s
h os
hip
00
00
00
00
00
00
00
00
1Af
f oth
er 2
00
00
00
00
00
00
00
00
0Af
f oth
er 2
00
00
00
00
00
00
00
00
0

Burn ley & Pendle Af fordable Housing Si te V iab i l i ty Update
Page 74
SITE B3 CASH FLOW AFFORDABLE
Year
1Ye
ar 2
Year
3Ye
ar 4
Year
5ra
teQ
1Q
2Q
3Q
4Q
1Q
2Q
3Q
4Q
1Q
2Q
3Q
4Q
1Q
2Q
3Q
4Q
1Q
2Q
3Q
4TO
TALS
INC
OM
E
Hou
sing
sal
esM
arke
t hou
sing
00
00
00
515
824
824
824
824
824
824
824
824
824
00
00
7,93
4Af
ford
able
soc
rent
00
00
00
3047
4747
4747
4747
4747
00
00
456
Affo
rdab
le s
h os
hip
00
00
00
47
77
77
77
77
00
00
68Af
f oth
er 2
00
00
00
00
00
00
00
00
00
00
0Af
f oth
er 2
00
00
00
00
00
00
00
00
00
00
0Sa
les
fees
00
00
00
-18
-29
-29
-29
-29
-29
-29
-29
-29
-29
00
00
-281
Tota
l inc
ome
00
00
00
549
879
879
879
879
879
879
879
879
879
00
00
8,45
8C
OST
S
Land
Land
acq
uisi
tion
-1,2
15-1
,215
Stam
p du
ty0
0Pu
rcha
se fe
es-3
3-3
3To
tal
-1,2
48B
uild
cos
tsM
arke
t hou
sing
00
00
343
549
549
549
549
549
549
549
549
549
00
00
00
5,28
1Af
ford
able
soc
rent
00
00
3455
5555
5555
5555
5555
00
00
00
528
Affo
rdab
le s
h os
hip
00
00
46
66
66
66
66
00
00
00
59Af
f oth
er 2
00
00
00
00
00
00
00
00
00
00
0Af
f oth
er 2
00
00
00
00
00
00
00
00
00
00
0Bu
ild c
ontin
genc
y5.
0%0
00
019
3030
3030
3030
3030
300
00
00
029
3To
tal
6,16
1D
ev c
osts
Upf
ront
6.5%
100
100
100
100
400
Build
rela
ted
6.5%
00
2642
4242
4242
4242
4242
00
00
00
00
400
Abno
rmal
s2%
7070
140
Tota
l94
1Fe
esFe
es o
n bu
ild c
osts
10.0
%0
00
040
6464
6464
6464
6464
640
00
00
061
6Fe
es o
n de
v co
sts
0.0%
00
00
00
00
00
00
00
00
00
00
0To
tal
616
PGPl
anni
ng g
ain
1625
2525
2525
2525
2525
00
00
00
00
239
Tota
l23
9O
ther
Plan
ning
£371
1010
1029
Surv
ey£5
0039
39M
arke
ting
£00
00
00
00
00
00
00
00
00
00
Tota
l67
Sale
s fe
esb/
forw
ard
from
abo
ve0
00
00
018
2929
2929
2929
2929
290
00
028
1To
tal c
osts
-1,0
3018
015
116
750
677
178
980
080
080
080
080
073
373
329
290
00
07,
057
Net
pro
fit/lo
ss fr
om q
uart
er1,
030
-180
-151
-167
-506
-771
-240
7979
7979
7914
514
585
085
00
00
01,
401
Prof
it/lo
ss b
f fro
m la
st q
uart
er0
1,04
988
674
859
388
-695
-952
-890
-826
-761
-694
-627
-490
-351
508
1,38
31,
383
1,38
31,
383
Cum
ulat
ive
prof
it/lo
ss1,
030
869
734
582
86-6
83-9
35-8
73-8
11-7
47-6
82-6
15-4
81-3
4549
81,
357
1,38
31,
383
1,38
31,
383
Inte
rest
Cha
rged
at
7.50
%7.
50%
7.50
%7.
50%
7.50
%7.
50%
7.50
%7.
50%
7.50
%7.
50%
7.50
%7.
50%
7.50
%7.
50%
7.50
%7.
50%
7.50
%0.
00%
0.00
%0.
00%
0.00
%To
tal
1916
1411
2-1
3-1
8-1
6-1
5-1
4-1
3-1
2-9
-69
250
00
0-1
9
Cum
ulat
ive
deve
lope
r pro
fit1,
049
886
748
593
88-6
95-9
52-8
90-8
26-7
61-6
94-6
27-4
90-3
5150
81,
383
1,38
31,
383
1,38
31,
383
1,38
2ca
rrie
d fo
rwar
d to
RV
calc

Appendix 4 . F inanc ia l appra isa l summar ies
Page 75
SITE B4: Spa Mill Padiham

Burn ley & Pendle Af fordable Housing Si te V iab i l i ty Update
Page 76
Inpu
t ass
umpt
ions
Scen
ario
& o
ptio
nAf
ford
able
10%
= 9
% s
ocia
l ren
ted
1% in
term
edia
te
Bur
nley
& P
endl
e vi
abili
ty s
tudy
Dw
ellin
gs
Site
det
ails
ave
floor
spa
cebu
ildsa
les
Site
B4
Spa
Mill
, Ins
titut
e St
Dw
ellin
gsgr
oss
net
cost
valu
eLo
catio
nB
urnl
eysq
ftsq
ftpe
r sq
ftpe
r sq
ftA
rea
h
a1.
40M
arke
t hou
sing
49.5
90.0
0%1,
322
1,28
889
.00
144.
00ac
res
3.46
0.0%
No
dwgs
55Af
ford
able
soc
rent
5.0
9.00
%1,
322
1,28
889
.00
81.0
0D
ensi
ty d
w/h
a39
.30.
0%Af
ford
able
sh
oshi
p0.
51.
00%
1,32
21,
288
89.0
010
8.00
0.0%
Aff o
ther
20.
00.
00%
1,32
21,
288
89.0
00.
000.
0%Af
f oth
er 2
0.0
0.00
%0
089
.00
0.00
£kC
ontin
genc
yTo
tal
55.0
100.
00%
72,7
1070
,840
£6,4
71,1
90£9
,773
,795
allo
wan
ce5.
00%
324
Floo
rspa
ce d
ensi
ty=
20,4
78ne
t sq
ft pe
r acr
e
Dev
elop
men
t cos
tsst
anda
rd %
bui
ld13
.00%
883
Oth
er c
osts
Plan
ning
281.
4£
per d
wel
ling
Surv
ey50
0£
per d
wel
ling
plus
abn
orm
als
2.1%
145
Mar
ketin
g0
£ pe
r dw
ellin
gTo
tal
15%
Des
ign
fees
on b
uild
cos
ts10
.0%
679
Inte
rest
% p
er a
nnum
7.50
%
on d
ev c
osts
0%N
otes
Plan
ning
gai
n£
per d
wel
ling
3,10
017
1
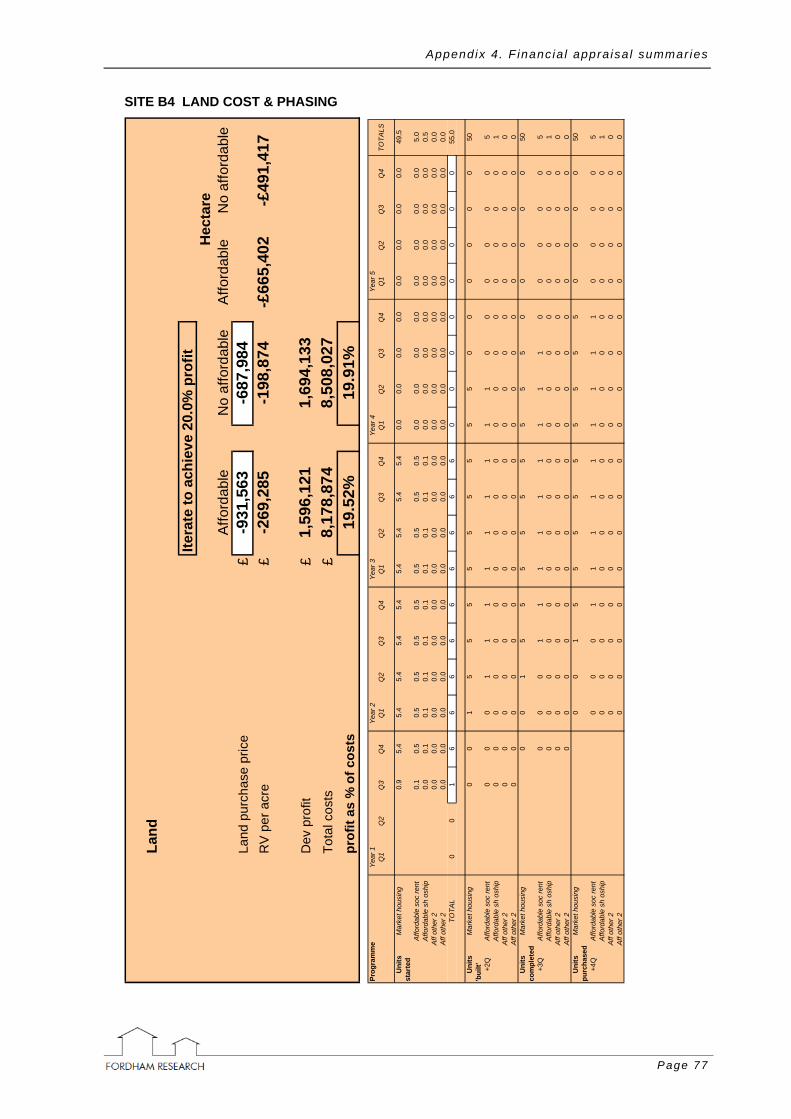
Appendix 4 . F inanc ia l appra isa l summar ies
Page 77
SITE B4 LAND COST & PHASING
Land
Itera
te to
ach
ieve
20.
0% p
rofit
Affo
rdab
leN
o af
ford
able
Affo
rdab
leN
o af
ford
able
Land
pur
chas
e pr
ice
£
-931
,563
-687
,984
RV
per
acr
e£
-269
,285
-198
,874
-£66
5,40
2-£
491,
417
Dev
pro
fit£
1,59
6,12
11,
694,
133
Tota
l cos
ts£
8,17
8,87
48,
508,
027
prof
it as
% o
f cos
ts19
.52%
19.9
1%
Hec
tare
Prog
ram
me
Yea
r 1Ye
ar 2
Year
3Ye
ar 4
Year
5Q
1Q
2Q
3Q
4Q
1Q
2Q
3Q
4Q
1Q
2Q
3Q
4Q
1Q
2Q
3Q
4Q
1Q
2Q
3Q
4TO
TALS
Uni
tsM
arke
t hou
sing
0.9
5.4
5.4
5.4
5.4
5.4
5.4
5.4
5.4
5.4
0.0
0.0
0.0
0.0
0.0
0.0
0.0
0.0
49.5
star
ted
Affo
rdab
le s
oc re
nt0.
10.
50.
50.
50.
50.
50.
50.
50.
50.
50.
00.
00.
00.
00.
00.
00.
00.
05.
0A
fford
able
sh
oshi
p0.
00.
10.
10.
10.
10.
10.
10.
10.
10.
10.
00.
00.
00.
00.
00.
00.
00.
00.
5Af
f oth
er 2
0.0
0.0
0.0
0.0
0.0
0.0
0.0
0.0
0.0
0.0
0.0
0.0
0.0
0.0
0.0
0.0
0.0
0.0
0.0
Aff o
ther
20.
00.
00.
00.
00.
00.
00.
00.
00.
00.
00.
00.
00.
00.
00.
00.
00.
00.
00.
0TO
TAL
00
16
66
66
66
66
00
00
00
00
55.0
Uni
tsM
arke
t hou
sing
00
15
55
55
55
55
00
00
00
50'b
uilt' +2
QA
fford
able
soc
rent
00
01
11
11
11
11
00
00
00
5A
fford
able
sh
oshi
p0
00
00
00
00
00
00
00
00
01
Aff o
ther
20
00
00
00
00
00
00
00
00
00
Aff o
ther
20
00
00
00
00
00
00
00
00
00
Uni
tsM
arke
t hou
sing
00
15
55
55
55
55
00
00
050
com
plet
ed+3
QA
fford
able
soc
rent
00
01
11
11
11
11
00
00
05
Affo
rdab
le s
h os
hip
00
00
00
00
00
00
00
00
01
Aff o
ther
20
00
00
00
00
00
00
00
00
0Af
f oth
er 2
00
00
00
00
00
00
00
00
00
Uni
tsM
arke
t hou
sing
00
15
55
55
55
55
00
00
50pu
rcha
sed
+4Q
Affo
rdab
le s
oc re
nt0
00
11
11
11
11
10
00
05
Affo
rdab
le s
h os
hip
00
00
00
00
00
00
00
00
1Af
f oth
er 2
00
00
00
00
00
00
00
00
0Af
f oth
er 2
00
00
00
00
00
00
00
00
0

Burn ley & Pendle Af fordable Housing Si te V iab i l i ty Update
Page 78
SITE B4 CASH FLOW AFFORDABLE
Year
1Ye
ar 2
Year
3Ye
ar 4
Year
5ra
teQ
1Q
2Q
3Q
4Q
1Q
2Q
3Q
4Q
1Q
2Q
3Q
4Q
1Q
2Q
3Q
4Q
1Q
2Q
3Q
4TO
TALS
INC
OM
E
Hou
sing
sal
esM
arke
t hou
sing
00
00
00
167
1,00
21,
002
1,00
21,
002
1,00
21,
002
1,00
21,
002
1,00
20
00
09,
181
Affo
rdab
le s
oc re
nt0
00
00
09
5656
5656
5656
5656
560
00
051
6Af
ford
able
sh
oshi
p0
00
00
01
88
88
88
88
80
00
077
Aff o
ther
20
00
00
00
00
00
00
00
00
00
00
Aff o
ther
20
00
00
00
00
00
00
00
00
00
00
Sale
s fe
es0
00
00
0-6
-35
-35
-35
-35
-35
-35
-35
-35
-35
00
00
-325
Tota
l inc
ome
00
00
00
178
1,06
61,
066
1,06
61,
066
1,06
61,
066
1,06
61,
066
1,06
60
00
09,
774
CO
STS
Land
Land
acq
uisi
tion
-932
-932
Stam
p du
ty0
0Pu
rcha
se fe
es-2
6-2
6To
tal
-957
Bui
ld c
osts
Mar
ket h
ousi
ng0
00
010
663
563
563
563
563
563
563
563
563
50
00
00
05,
824
Affo
rdab
le s
oc re
nt0
00
011
6464
6464
6464
6464
640
00
00
058
2Af
ford
able
sh
oshi
p0
00
01
77
77
77
77
70
00
00
065
Aff o
ther
20
00
00
00
00
00
00
00
00
00
00
Aff o
ther
20
00
00
00
00
00
00
00
00
00
00
Build
con
tinge
ncy
5.0%
00
00
635
3535
3535
3535
3535
00
00
00
324
Tota
l6,
795
Dev
cos
tsU
pfro
nt6.
5%11
011
011
011
044
2Bu
ild re
late
d6.
5%0
08
4848
4848
4848
4848
480
00
00
00
044
2Ab
norm
als
2%73
7314
5To
tal
1,02
9Fe
esFe
es o
n bu
ild c
osts
10.0
%0
00
012
7474
7474
7474
7474
740
00
00
067
9Fe
es o
n de
v co
sts
0.0%
00
00
00
00
00
00
00
00
00
00
0To
tal
679
PGPl
anni
ng g
ain
319
1919
1919
1919
1919
00
00
00
00
171
Tota
l17
1O
ther
Plan
ning
£281
55
515
Surv
ey£5
0028
28M
arke
ting
£00
00
00
00
00
00
00
00
00
00
Tota
l43
Sale
s fe
esb/
forw
ard
from
abo
ve0
00
00
06
3535
3535
3535
3535
350
00
032
5To
tal c
osts
-741
188
127
177
203
882
888
918
918
918
918
918
851
851
3535
00
00
8,08
4
Net
pro
fit/lo
ss fr
om q
uart
er74
1-1
88-1
27-1
77-2
03-8
82-7
1014
914
914
914
914
921
521
51,
031
1,03
10
00
01,
689
Prof
it/lo
ss b
f fro
m la
st q
uart
er0
755
578
460
288
87-8
10-1
,549
-1,4
27-1
,302
-1,1
75-1
,045
-913
-711
-505
536
1,59
61,
596
1,59
61,
596
Cum
ulat
ive
prof
it/lo
ss74
156
745
128
285
-795
-1,5
21-1
,400
-1,2
78-1
,153
-1,0
26-8
97-6
98-4
9652
61,
567
1,59
61,
596
1,59
61,
596
Inte
rest
Cha
rged
at
7.50
%7.
50%
7.50
%7.
50%
7.50
%7.
50%
7.50
%7.
50%
7.50
%7.
50%
7.50
%7.
50%
7.50
%7.
50%
7.50
%7.
50%
7.50
%0.
00%
0.00
%0.
00%
0.00
%To
tal
1411
85
2-1
5-2
9-2
6-2
4-2
2-1
9-1
7-1
3-9
1029
00
00
-95
Cum
ulat
ive
deve
lope
r pro
fit75
557
846
028
887
-810
-1,5
49-1
,427
-1,3
02-1
,175
-1,0
45-9
13-7
11-5
0553
61,
596
1,59
61,
596
1,59
61,
596
1,59
5ca
rrie
d fo
rwar
d to
RV
calc

Appendix 4 . F inanc ia l appra isa l summar ies
Page 79
SITE B5: Coal Yard Oswald St Burnley
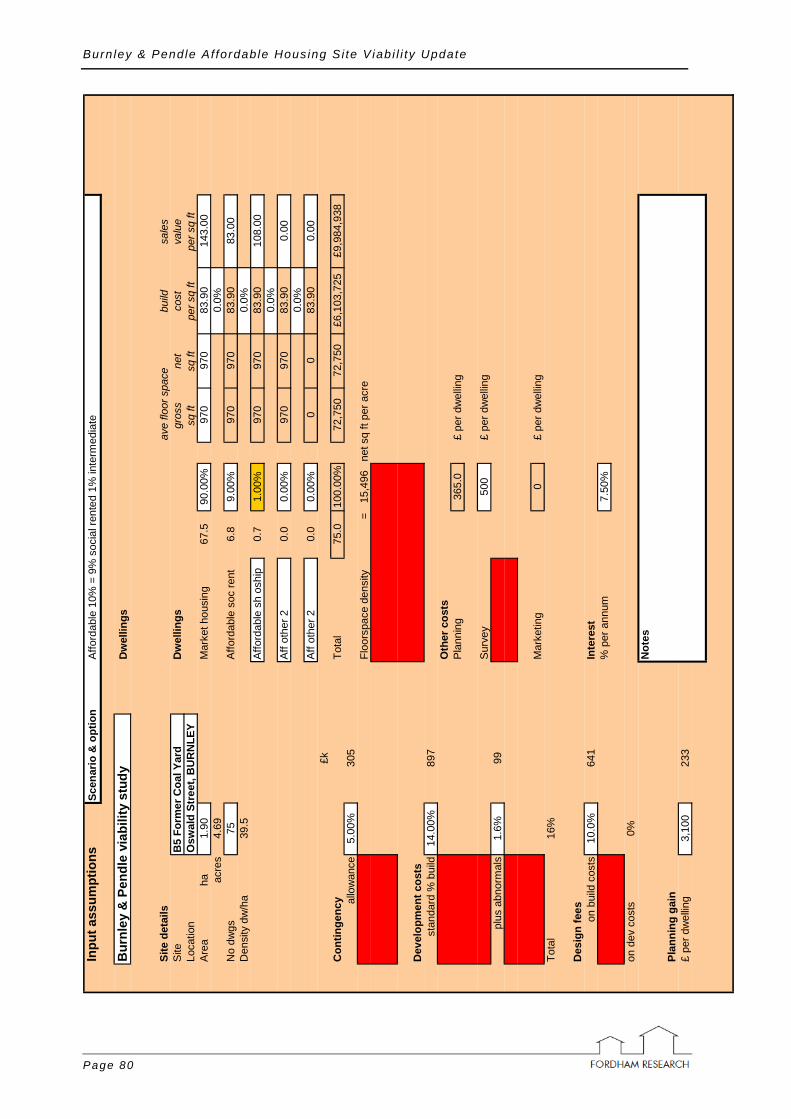
Burn ley & Pendle Af fordable Housing Si te V iab i l i ty Update
Page 80
Inpu
t ass
umpt
ions
Scen
ario
& o
ptio
nAf
ford
able
10%
= 9
% s
ocia
l ren
ted
1% in
term
edia
te
Bur
nley
& P
endl
e vi
abili
ty s
tudy
Dw
ellin
gs
Site
det
ails
ave
floor
spa
cebu
ildsa
les
Site
B5
Form
er C
oal Y
ard
Dw
ellin
gsgr
oss
net
cost
valu
eLo
catio
nO
swal
d St
reet
, BU
RN
LEY
sq ft
sq ft
per s
q ft
per s
q ft
Are
a
ha
1.90
Mar
ket h
ousi
ng67
.590
.00%
970
970
83.9
014
3.00
acre
s4.
690.
0%N
o dw
gs75
Affo
rdab
le s
oc re
nt6.
89.
00%
970
970
83.9
083
.00
Den
sity
dw
/ha
39.5
0.0%
Affo
rdab
le s
h os
hip
0.7
1.00
%97
097
083
.90
108.
000.
0%Af
f oth
er 2
0.0
0.00
%97
097
083
.90
0.00
0.0%
Aff o
ther
20.
00.
00%
00
83.9
00.
00£k
Con
tinge
ncy
Tota
l75
.010
0.00
%72
,750
72,7
50£6
,103
,725
£9,9
84,9
38al
low
ance
5.00
%30
5Fl
oors
pace
den
sity
=15
,496
net s
q ft
per a
cre
Dev
elop
men
t cos
tsst
anda
rd %
bui
ld14
.00%
897
Oth
er c
osts
Plan
ning
365.
0£
per d
wel
ling
Surv
ey50
0£
per d
wel
ling
plus
abn
orm
als
1.6%
99
Mar
ketin
g0
£ pe
r dw
ellin
gTo
tal
16%
Des
ign
fees
on b
uild
cos
ts10
.0%
641
Inte
rest
% p
er a
nnum
7.50
%
on d
ev c
osts
0%N
otes
Plan
ning
gai
n£
per d
wel
ling
3,10
023
3

Appendix 4 . F inanc ia l appra isa l summar ies
Page 81
SITE B5 LAND COST & PHASING
Prog
ram
me
Yea
r 1Ye
ar 2
Year
3Ye
ar 4
Year
5Q
1Q
2Q
3Q
4Q
1Q
2Q
3Q
4Q
1Q
2Q
3Q
4Q
1Q
2Q
3Q
4Q
1Q
2Q
3Q
4TO
TALS
Uni
tsM
arke
t hou
sing
4.5
6.3
6.3
6.3
6.3
6.3
6.3
6.3
6.3
6.3
6.3
0.0
0.0
0.0
0.0
0.0
0.0
0.0
67.5
star
ted
Affo
rdab
le s
oc re
nt0.
50.
60.
60.
60.
60.
60.
60.
60.
60.
60.
60.
00.
00.
00.
00.
00.
00.
06.
8A
fford
able
sh
oshi
p0.
00.
10.
10.
10.
10.
10.
10.
10.
10.
10.
10.
00.
00.
00.
00.
00.
00.
00.
7Af
f oth
er 2
0.0
0.0
0.0
0.0
0.0
0.0
0.0
0.0
0.0
0.0
0.0
0.0
0.0
0.0
0.0
0.0
0.0
0.0
0.0
Aff o
ther
20.
00.
00.
00.
00.
00.
00.
00.
00.
00.
00.
00.
00.
00.
00.
00.
00.
00.
00.
0TO
TAL
00
57
77
77
77
77
70
00
00
00
75.0
Uni
tsM
arke
t hou
sing
00
56
66
66
66
66
60
00
00
68'b
uilt' +2
QA
fford
able
soc
rent
00
01
11
11
11
11
10
00
00
7A
fford
able
sh
oshi
p0
00
00
00
00
00
00
00
00
01
Aff o
ther
20
00
00
00
00
00
00
00
00
00
Aff o
ther
20
00
00
00
00
00
00
00
00
00
Uni
tsM
arke
t hou
sing
00
56
66
66
66
66
60
00
068
com
plet
ed+3
QA
fford
able
soc
rent
00
01
11
11
11
11
10
00
07
Affo
rdab
le s
h os
hip
00
00
00
00
00
00
00
00
01
Aff o
ther
20
00
00
00
00
00
00
00
00
0Af
f oth
er 2
00
00
00
00
00
00
00
00
00
Uni
tsM
arke
t hou
sing
00
56
66
66
66
66
60
00
68pu
rcha
sed
+4Q
Affo
rdab
le s
oc re
nt0
00
11
11
11
11
11
00
07
Affo
rdab
le s
h os
hip
00
00
00
00
00
00
00
00
1Af
f oth
er 2
00
00
00
00
00
00
00
00
0Af
f oth
er 2
00
00
00
00
00
00
00
00
0
Land
Itera
te to
ach
ieve
20.
0% p
rofit
Affo
rdab
leN
o af
ford
able
Affo
rdab
leN
o af
ford
able
Land
pur
chas
e pr
ice
£
-467
,857
-236
,233
RV
per
acr
e£
-99,
652
-50,
317
-£24
6,24
0-£
124,
333
Dev
pro
fit£
1,62
9,58
91,
734,
145
Tota
l cos
ts£
8,35
6,62
38,
670,
380
prof
it as
% o
f cos
ts19
.50%
20.0
0%
Hec
tare

Burn ley & Pendle Af fordable Housing Si te V iab i l i ty Update
Page 82
SITE B5 CASH FLOW AFFORDABLE
Year
1Ye
ar 2
Year
3Ye
ar 4
Year
5ra
teQ
1Q
2Q
3Q
4Q
1Q
2Q
3Q
4Q
1Q
2Q
3Q
4Q
1Q
2Q
3Q
4Q
1Q
2Q
3Q
4TO
TALS
INC
OM
E
Hou
sing
sal
esM
arke
t hou
sing
00
00
00
624
874
874
874
874
874
874
874
874
874
874
00
09,
363
Affo
rdab
le s
oc re
nt0
00
00
036
5151
5151
5151
5151
5151
00
054
3Af
ford
able
sh
oshi
p0
00
00
05
77
77
77
77
77
00
079
Aff o
ther
20
00
00
00
00
00
00
00
00
00
00
Aff o
ther
20
00
00
00
00
00
00
00
00
00
00
Sale
s fe
es0
00
00
0-2
2-3
1-3
1-3
1-3
1-3
1-3
1-3
1-3
1-3
1-3
10
00
-332
Tota
l inc
ome
00
00
00
666
932
932
932
932
932
932
932
932
932
932
00
09,
985
CO
STS
Land
Land
acq
uisi
tion
-468
-468
Stam
p du
ty0
0Pu
rcha
se fe
es-1
3-1
3To
tal
-481
Bui
ld c
osts
Mar
ket h
ousi
ng0
00
036
651
351
351
351
351
351
351
351
351
351
30
00
00
5,49
3Af
ford
able
soc
rent
00
00
3751
5151
5151
5151
5151
510
00
00
549
Affo
rdab
le s
h os
hip
00
00
46
66
66
66
66
60
00
00
61Af
f oth
er 2
00
00
00
00
00
00
00
00
00
00
0Af
f oth
er 2
00
00
00
00
00
00
00
00
00
00
0Bu
ild c
ontin
genc
y5.
0%0
00
020
2828
2828
2828
2828
2828
00
00
030
5To
tal
6,40
9D
ev c
osts
Upf
ront
7.0%
112
112
112
112
449
Build
rela
ted
7.0%
00
3042
4242
4242
4242
4242
420
00
00
00
449
Abno
rmal
s2%
5050
99To
tal
997
Fees
Fees
on
build
cos
ts10
.0%
00
00
4360
6060
6060
6060
6060
600
00
00
641
Fees
on
dev
cost
s0.
0%0
00
00
00
00
00
00
00
00
00
00
Tota
l64
1PG
Plan
ning
gai
n16
2222
2222
2222
2222
2222
00
00
00
023
3To
tal
233
Oth
erPl
anni
ng£3
659
99
27Su
rvey
£500
3838
Mar
ketin
g£0
00
00
00
00
00
00
00
00
00
0To
tal
65Sa
les
fees
b/fo
rwar
d fro
m a
bove
00
00
00
2231
3131
3131
3131
3131
310
00
332
Tota
l cos
ts-2
7217
116
717
653
472
274
475
375
375
375
375
375
368
968
931
310
00
8,19
5
Net
pro
fit/lo
ss fr
om q
uart
er27
2-1
71-1
67-1
76-5
34-7
22-7
817
917
917
917
917
917
924
324
390
190
10
00
1,79
0
Prof
it/lo
ss b
f fro
m la
st q
uart
er0
277
109
-59
-239
-787
-1,5
37-1
,645
-1,4
93-1
,338
-1,1
80-1
,020
-856
-689
-454
-215
699
1,63
01,
630
1,63
0
Cum
ulat
ive
prof
it/lo
ss27
210
7-5
8-2
35-7
73-1
,509
-1,6
15-1
,466
-1,3
14-1
,159
-1,0
01-8
40-6
77-4
46-2
1168
61,
600
1,63
01,
630
1,63
0
Inte
rest
Cha
rged
at
7.50
%7.
50%
7.50
%7.
50%
7.50
%7.
50%
7.50
%7.
50%
7.50
%7.
50%
7.50
%7.
50%
7.50
%7.
50%
7.50
%7.
50%
7.50
%7.
50%
0.00
%0.
00%
0.00
%To
tal
52
-1-4
-14
-28
-30
-27
-25
-22
-19
-16
-13
-8-4
1330
00
0-1
62
Cum
ulat
ive
deve
lope
r pro
fit27
710
9-5
9-2
39-7
87-1
,537
-1,6
45-1
,493
-1,3
38-1
,180
-1,0
20-8
56-6
89-4
54-2
1569
91,
630
1,63
01,
630
1,63
01,
628
carr
ied
forw
ard
to R
V ca
lc

Appendix 4 . F inanc ia l appra isa l summar ies
Page 83
SITE B6: Langham Street Burnley
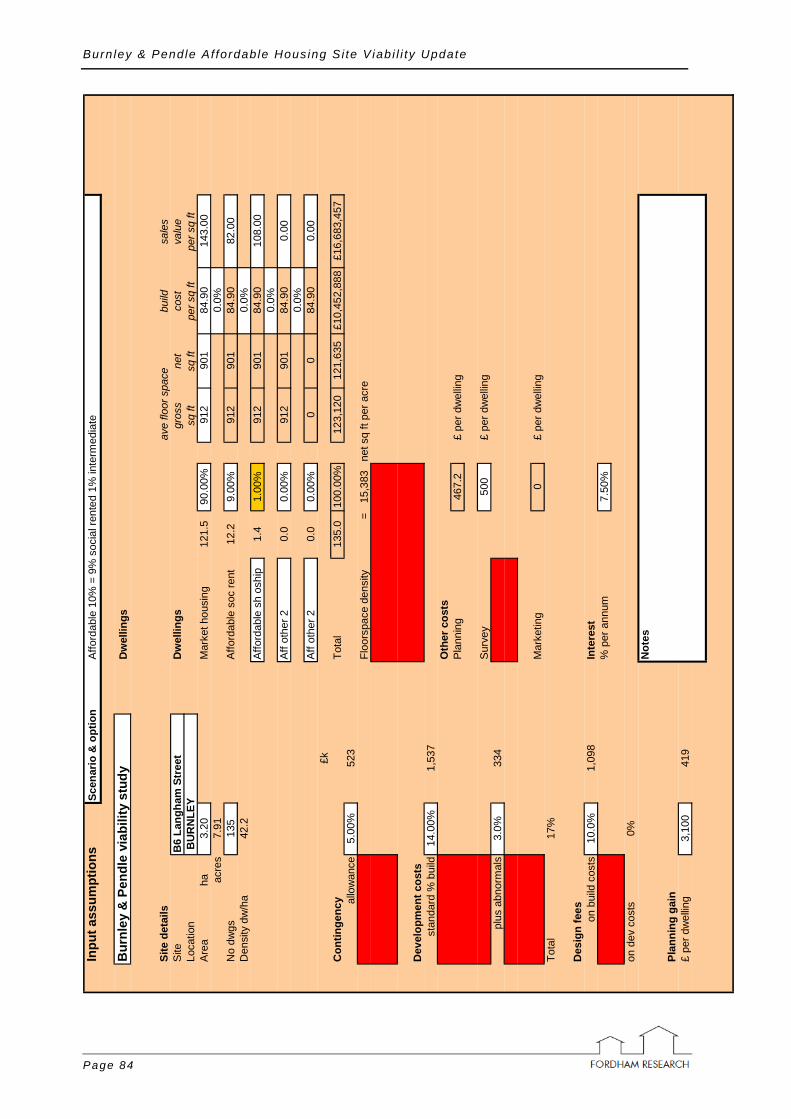
Burn ley & Pendle Af fordable Housing Si te V iab i l i ty Update
Page 84
Inpu
t ass
umpt
ions
Scen
ario
& o
ptio
nAf
ford
able
10%
= 9
% s
ocia
l ren
ted
1% in
term
edia
te
Bur
nley
& P
endl
e vi
abili
ty s
tudy
Dw
ellin
gs
Site
det
ails
ave
floor
spa
cebu
ildsa
les
Site
B6
Lang
ham
Str
eet
Dw
ellin
gsgr
oss
net
cost
valu
eLo
catio
n B
UR
NLE
Ysq
ftsq
ftpe
r sq
ftpe
r sq
ftA
rea
h
a3.
20M
arke
t hou
sing
121.
590
.00%
912
901
84.9
014
3.00
acre
s7.
910.
0%N
o dw
gs13
5Af
ford
able
soc
rent
12.2
9.00
%91
290
184
.90
82.0
0D
ensi
ty d
w/h
a42
.20.
0%Af
ford
able
sh
oshi
p1.
41.
00%
912
901
84.9
010
8.00
0.0%
Aff o
ther
20.
00.
00%
912
901
84.9
00.
000.
0%Af
f oth
er 2
0.0
0.00
%0
084
.90
0.00
£kC
ontin
genc
yTo
tal
135.
010
0.00
%12
3,12
012
1,63
5£1
0,45
2,88
8£1
6,68
3,45
7al
low
ance
5.00
%52
3Fl
oors
pace
den
sity
=15
,383
net s
q ft
per a
cre
Dev
elop
men
t cos
tsst
anda
rd %
bui
ld14
.00%
1,53
7O
ther
cos
tsPl
anni
ng46
7.2
£ pe
r dw
ellin
g
Surv
ey50
0£
per d
wel
ling
plus
abn
orm
als
3.0%
334
Mar
ketin
g0
£ pe
r dw
ellin
gTo
tal
17%
Des
ign
fees
on b
uild
cos
ts10
.0%
1,09
8In
tere
st%
per
ann
um7.
50%
on d
ev c
osts
0%N
otes
Plan
ning
gai
n£
per d
wel
ling
3,10
041
9

Appendix 4 . F inanc ia l appra isa l summar ies
Page 85
SITE B6 LAND COST & PHASING
Land
Itera
te to
ach
ieve
20.
0% p
rofit
Affo
rdab
leN
o af
ford
able
Affo
rdab
leN
o af
ford
able
Land
pur
chas
e pr
ice
£
-1,2
37,3
26-8
48,8
66R
V p
er a
cre
£-1
56,4
81-1
07,3
54-£
386,
664
-£26
5,27
1
Dev
pro
fit£
2,72
4,05
62,
899,
682
Tota
l cos
ts£
13,9
60,8
2514
,495
,548
prof
it as
% o
f cos
ts19
.51%
20.0
0%
Hec
tare
Prog
ram
me
Yea
r 1Y
ear 2
Yea
r 3Y
ear 4
Yea
r 5Q
1Q
2Q
3Q
4Q
1Q
2Q
3Q
4Q
1Q
2Q
3Q
4Q
1Q
2Q
3Q
4Q
1Q
2Q
3Q
4TO
TALS
Uni
tsM
arke
t hou
sing
2.7
9.9
9.9
9.9
9.9
9.9
9.9
9.9
9.9
9.9
9.9
9.9
9.9
0.0
0.0
0.0
0.0
0.0
121.
5st
arte
dA
fford
able
soc
rent
0.3
1.0
1.0
1.0
1.0
1.0
1.0
1.0
1.0
1.0
1.0
1.0
1.0
0.0
0.0
0.0
0.0
0.0
12.2
Affo
rdab
le s
h os
hip
0.0
0.1
0.1
0.1
0.1
0.1
0.1
0.1
0.1
0.1
0.1
0.1
0.1
0.0
0.0
0.0
0.0
0.0
1.4
Aff o
ther
20.
00.
00.
00.
00.
00.
00.
00.
00.
00.
00.
00.
00.
00.
00.
00.
00.
00.
00.
0Af
f oth
er 2
0.0
0.0
0.0
0.0
0.0
0.0
0.0
0.0
0.0
0.0
0.0
0.0
0.0
0.0
0.0
0.0
0.0
0.0
0.0
TOTA
L0
03
1111
1111
1111
1111
1111
1111
00
00
013
5.0
Uni
tsM
arke
t hou
sing
00
310
1010
1010
1010
1010
1010
100
00
122
'bui
lt' +2Q
Affo
rdab
le s
oc re
nt0
00
11
11
11
11
11
11
00
012
Affo
rdab
le s
h os
hip
00
00
00
00
00
00
00
00
00
1Af
f oth
er 2
00
00
00
00
00
00
00
00
00
0Af
f oth
er 2
00
00
00
00
00
00
00
00
00
0U
nits
Mar
ket h
ousi
ng0
03
1010
1010
1010
1010
1010
1010
00
122
com
plet
ed+3
QA
fford
able
soc
rent
00
01
11
11
11
11
11
10
012
Affo
rdab
le s
h os
hip
00
00
00
00
00
00
00
00
01
Aff o
ther
20
00
00
00
00
00
00
00
00
0Af
f oth
er 2
00
00
00
00
00
00
00
00
00
Uni
tsM
arke
t hou
sing
00
310
1010
1010
1010
1010
1010
100
122
purc
hase
d+4
QA
fford
able
soc
rent
00
01
11
11
11
11
11
10
12A
fford
able
sh
oshi
p0
00
00
00
00
00
00
00
01
Aff o
ther
20
00
00
00
00
00
00
00
00
Aff o
ther
20
00
00
00
00
00
00
00
00

Burn ley & Pendle Af fordable Housing Si te V iab i l i ty Update
Page 86
SITE B6 CASH FLOW AFFORDABLE
Year
1Ye
ar 2
Year
3Ye
ar 4
Year
5ra
teQ
1Q
2Q
3Q
4Q
1Q
2Q
3Q
4Q
1Q
2Q
3Q
4Q
1Q
2Q
3Q
4Q
1Q
2Q
3Q
4TO
TALS
INC
OM
E
Hou
sing
sal
esM
arke
t hou
sing
00
00
00
348
1,27
61,
276
1,27
61,
276
1,27
61,
276
1,27
61,
276
1,27
61,
276
1,27
61,
276
015
,654
Affo
rdab
le s
oc re
nt0
00
00
020
7373
7373
7373
7373
7373
7373
089
8Af
ford
able
sh
oshi
p0
00
00
03
1111
1111
1111
1111
1111
1111
013
1Af
f oth
er 2
00
00
00
00
00
00
00
00
00
00
0Af
f oth
er 2
00
00
00
00
00
00
00
00
00
00
0Sa
les
fees
00
00
00
-12
-45
-45
-45
-45
-45
-45
-45
-45
-45
-45
-45
-45
0-5
54
Tota
l inc
ome
00
00
00
371
1,35
91,
359
1,35
91,
359
1,35
91,
359
1,35
91,
359
1,35
91,
359
1,35
91,
359
016
,683
CO
STS
Land
Land
acq
uisi
tion
-1,2
37-1
,237
Stam
p du
ty0
0Pu
rcha
se fe
es-3
4-3
4To
tal
-1,2
71B
uild
cos
tsM
arke
t hou
sing
00
00
209
767
767
767
767
767
767
767
767
767
767
767
767
00
09,
408
Affo
rdab
le s
oc re
nt0
00
021
7777
7777
7777
7777
7777
7777
00
094
1Af
ford
able
sh
oshi
p0
00
02
99
99
99
99
99
99
00
010
5Af
f oth
er 2
00
00
00
00
00
00
00
00
00
00
0Af
f oth
er 2
00
00
00
00
00
00
00
00
00
00
0Bu
ild c
ontin
genc
y5.
0%0
00
012
4343
4343
4343
4343
4343
4343
00
052
3To
tal
10,9
76D
ev c
osts
Upf
ront
7.0%
192
192
192
192
768
Build
rela
ted
7.0%
00
1763
6363
6363
6363
6363
6363
630
00
00
768
Abno
rmal
s3%
167
167
334
Tota
l1,
870
Fees
Fees
on
build
cos
ts10
.0%
00
00
2489
8989
8989
8989
8989
8989
890
00
1,09
8Fe
es o
n de
v co
sts
0.0%
00
00
00
00
00
00
00
00
00
00
0To
tal
1,09
8PG
Plan
ning
gai
n9
3434
3434
3434
3434
3434
3434
00
00
041
9To
tal
419
Oth
erPl
anni
ng£4
6721
2121
63Su
rvey
£500
6868
Mar
ketin
g£0
00
00
00
00
00
00
00
00
00
0To
tal
131
Sale
s fe
esb/
forw
ard
from
abo
ve0
00
00
012
4545
4545
4545
4545
4545
4545
055
4To
tal c
osts
-824
380
239
289
365
1,08
01,
093
1,12
61,
126
1,12
61,
126
1,12
61,
126
1,12
61,
126
1,02
91,
029
4545
013
,775
Net
pro
fit/lo
ss fr
om q
uart
er82
4-3
80-2
39-2
89-3
65-1
,080
-722
234
234
234
234
234
234
234
234
330
330
1,31
41,
314
02,
908
Prof
it/lo
ss b
f fro
m la
st q
uart
er0
839
468
233
-57
-429
-1,5
38-2
,302
-2,1
07-1
,909
-1,7
06-1
,500
-1,2
90-1
,076
-858
-635
-311
201,
360
2,72
4
Cum
ulat
ive
prof
it/lo
ss82
446
022
9-5
6-4
22-1
,510
-2,2
60-2
,069
-1,8
74-1
,675
-1,4
72-1
,266
-1,0
56-8
42-6
24-3
0520
1,33
52,
674
2,72
4
Inte
rest
Cha
rged
at
7.50
%7.
50%
7.50
%7.
50%
7.50
%7.
50%
7.50
%7.
50%
7.50
%7.
50%
7.50
%7.
50%
7.50
%7.
50%
7.50
%7.
50%
7.50
%7.
50%
7.50
%7.
50%
0.00
%To
tal
159
4-1
-8-2
8-4
2-3
9-3
5-3
1-2
8-2
4-2
0-1
6-1
2-6
025
500
-185
Cum
ulat
ive
deve
lope
r pro
fit83
946
823
3-5
7-4
29-1
,538
-2,3
02-2
,107
-1,9
09-1
,706
-1,5
00-1
,290
-1,0
76-8
58-6
35-3
1120
1,36
02,
724
2,72
42,
723
carr
ied
forw
ard
to R
V ca
lc

Appendix 4 . F inanc ia l appra isa l summar ies
Page 87
SITE B7: Gorple Mill Worsthorne

Burn ley & Pendle Af fordable Housing Si te V iab i l i ty Update
Page 88
Inpu
t ass
umpt
ions
Scen
ario
& o
ptio
nAf
ford
able
10%
= 9
% s
ocia
l ren
ted
1% in
term
edia
te
Bur
nley
& P
endl
e vi
abili
ty s
tudy
Dw
ellin
gs
Site
det
ails
ave
floor
spa
cebu
ildsa
les
Site
B7
Gor
ple
Mill
, Gor
don
St.
Dw
ellin
gsgr
oss
net
cost
valu
eLo
catio
nW
orst
horn
e, B
UR
NLE
Ysq
ftsq
ftpe
r sq
ftpe
r sq
ftA
rea
h
a0.
90M
arke
t hou
sing
29.7
90.0
0%94
494
483
.40
161.
00ac
res
2.22
0.0%
No
dwgs
33Af
ford
able
soc
rent
3.0
9.00
%94
494
483
.40
83.0
0D
ensi
ty d
w/h
a36
.70.
0%Af
ford
able
sh
oshi
p0.
31.
00%
944
944
83.4
010
8.00
0.0%
Aff o
ther
20.
00.
00%
944
944
83.4
00.
000.
0%Af
f oth
er 2
0.0
0.00
%0
083
.40
0.00
£kC
ontin
genc
yTo
tal
33.0
100.
00%
31,1
5231
,152
£2,5
98,0
77£4
,780
,274
allo
wan
ce5.
00%
130
Floo
rspa
ce d
ensi
ty=
14,0
08ne
t sq
ft pe
r acr
e
Dev
elop
men
t cos
tsst
anda
rd %
bui
ld14
.00%
382
Oth
er c
osts
Plan
ning
515.
0£
per d
wel
ling
Surv
ey50
0£
per d
wel
ling
plus
abn
orm
als
3.5%
94
Mar
ketin
g0
£ pe
r dw
ellin
gTo
tal
17%
Des
ign
fees
on b
uild
cos
ts10
.0%
273
Inte
rest
% p
er a
nnum
7.50
%
on d
ev c
osts
0%N
otes
Plan
ning
gai
n£
per d
wel
ling
3,10
010
2

Appendix 4 . F inanc ia l appra isa l summar ies
Page 89
SITE B7 LAND COST & PHASING
Prog
ram
me
Year
1Y
ear 2
Yea
r 3Y
ear 4
Q1
Q2
Q3
Q4
Q1
Q2
Q3
Q4
Q1
Q2
Q3
Q4
Q1
Q2
Q3
Q4
TOTA
LS
Uni
tsM
arke
t hou
sing
0.9
3.6
3.6
3.6
3.6
3.6
3.6
3.6
3.6
0.0
0.0
0.0
0.0
0.0
29.7
star
ted
Affo
rdab
le s
oc re
nt0.
10.
40.
40.
40.
40.
40.
40.
40.
40.
00.
00.
00.
00.
03.
0A
fford
able
sh
oshi
p0.
00.
00.
00.
00.
00.
00.
00.
00.
00.
00.
00.
00.
00.
00.
3A
ff ot
her 2
0.0
0.0
0.0
0.0
0.0
0.0
0.0
0.0
0.0
0.0
0.0
0.0
0.0
0.0
0.0
Aff
othe
r 20.
00.
00.
00.
00.
00.
00.
00.
00.
00.
00.
00.
00.
00.
00.
0TO
TAL
00
14
44
44
44
40
00
00
33.0
Uni
tsM
arke
t hou
sing
00
14
44
44
44
40
00
30'b
uilt' +2
QA
fford
able
soc
rent
00
00
00
00
00
00
00
3A
fford
able
sh
oshi
p0
00
00
00
00
00
00
00
Aff
othe
r 20
00
00
00
00
00
00
00
Aff
othe
r 20
00
00
00
00
00
00
00
Uni
tsM
arke
t hou
sing
00
14
44
44
44
40
030
com
plet
ed+3
QA
fford
able
soc
rent
00
00
00
00
00
00
03
Affo
rdab
le s
h os
hip
00
00
00
00
00
00
00
Aff
othe
r 20
00
00
00
00
00
00
0A
ff ot
her 2
00
00
00
00
00
00
00
Uni
tsM
arke
t hou
sing
00
14
44
44
44
40
30pu
rcha
sed
+4Q
Affo
rdab
le s
oc re
nt0
00
00
00
00
00
03
Affo
rdab
le s
h os
hip
00
00
00
00
00
00
0A
ff ot
her 2
00
00
00
00
00
00
0A
ff ot
her 2
00
00
00
00
00
00
0
Land
Itera
te to
ach
ieve
20.
0% p
rofit
Affo
rdab
leN
o af
ford
able
Affo
rdab
leN
o af
ford
able
Land
pur
chas
e pr
ice
£
78,2
3821
1,98
7R
V p
er a
cre
£35
,180
95,3
22£8
6,93
1£2
35,5
41
Dev
pro
fit£
780,
247
836,
164
Tota
l cos
ts£
4,00
1,15
34,
180,
433
prof
it as
% o
f cos
ts19
.50%
20.0
0%
Hec
tare

Burn ley & Pendle Af fordable Housing Si te V iab i l i ty Update
Page 90
SITE B7 CASH FLOW AFFORDABLE
Yea
r 1Ye
ar 2
Yea
r 3Y
ear 4
rate
Q1
Q2
Q3
Q4
Q1
Q2
Q3
Q4
Q1
Q2
Q3
Q4
Q1
Q2
Q3
Q4
Q4
TOTA
LS
INC
OM
E
Hou
sing
sal
esM
arke
t hou
sing
00
00
00
137
547
547
547
547
547
547
547
547
00
4,51
4Af
ford
able
soc
rent
00
00
00
728
2828
2828
2828
280
023
3Af
ford
able
sh
oshi
p0
00
00
01
44
44
44
44
00
34Af
f oth
er 2
00
00
00
00
00
00
00
00
00
Aff o
ther
20
00
00
00
00
00
00
00
00
0Sa
les
fees
00
00
00
-5-1
9-1
9-1
9-1
9-1
9-1
9-1
9-1
90
0-1
60
Tota
l inc
ome
00
00
00
145
579
579
579
579
579
579
579
579
00
4,78
0C
OST
S
Land
Land
acq
uisi
tion
7878
Stam
p du
ty1
1Pu
rcha
se fe
es2
2To
tal
81B
uild
cos
tsM
arke
t hou
sing
00
00
7128
328
328
328
328
328
328
328
30
00
02,
338
Affo
rdab
le s
oc re
nt0
00
07
2828
2828
2828
2828
00
00
234
Affo
rdab
le s
h os
hip
00
00
13
33
33
33
30
00
026
Aff o
ther
20
00
00
00
00
00
00
00
00
0Af
f oth
er 2
00
00
00
00
00
00
00
00
00
Build
con
tinge
ncy
5.0%
00
00
416
1616
1616
1616
160
00
013
0To
tal
2,72
8D
ev c
osts
Upf
ront
7.0%
4848
4848
191
Build
rela
ted
7.0%
00
623
2323
2323
2323
230
00
00
191
Abno
rmal
s3%
4747
94To
tal
476
Fees
Fees
on
build
cos
ts10
.0%
00
00
833
3333
3333
3333
330
00
027
3Fe
es o
n de
v co
sts
0.0%
00
00
00
00
00
00
00
00
00
Tota
l27
3PG
Plan
ning
gai
n3
1212
1212
1212
1212
00
00
00
102
Tota
l10
2O
ther
Plan
ning
£515
66
617
Surv
ey£5
0017
17M
arke
ting
£00
00
00
00
00
00
00
00
0To
tal
33Sa
les
fees
b/fo
rwar
d fro
m a
bove
00
00
00
519
1919
1919
1919
190
016
0To
tal c
osts
198
100
6283
126
399
404
419
419
419
419
383
383
1919
00
3,85
3
Net
pro
fit/lo
ss fr
om q
uart
er-1
98-1
00-6
2-8
3-1
26-3
99-2
5916
116
116
116
119
619
656
056
00
092
7
Prof
it/lo
ss b
f fro
m la
st q
uart
er0
-202
-308
-377
-469
-606
-1,0
24-1
,308
-1,1
68-1
,026
-882
-734
-548
-358
206
780
780
Cum
ulat
ive
prof
it/lo
ss-1
98-3
02-3
70-4
60-5
95-1
,006
-1,2
84-1
,147
-1,0
08-8
66-7
21-5
38-3
5220
276
678
078
0
Inte
rest
Cha
rged
at
7.50
%7.
50%
7.50
%7.
50%
7.50
%7.
50%
7.50
%7.
50%
7.50
%7.
50%
7.50
%7.
50%
7.50
%7.
50%
7.50
%7.
50%
0.00
%0.
00%
Tota
l-4
-6-7
-9-1
1-1
9-2
4-2
2-1
9-1
6-1
4-1
0-7
414
00
-148
Cum
ulat
ive
deve
lope
r pro
fit-2
02-3
08-3
77-4
69-6
06-1
,024
-1,3
08-1
,168
-1,0
26-8
82-7
34-5
48-3
5820
678
078
078
077
9ca
rrie
d fo
rwar
d to
RV
calc

Appendix 4 . F inanc ia l appra isa l summar ies
Page 91
SITE B8: Albion Mill Padiham

Burn ley & Pendle Af fordable Housing Si te V iab i l i ty Update
Page 92
Inpu
t ass
umpt
ions
Scen
ario
& o
ptio
nAf
ford
able
10%
= 9
% s
ocia
l ren
ted
1% in
term
edia
te
Bur
nley
& P
endl
e vi
abili
ty s
tudy
Dw
ellin
gs
Site
det
ails
ave
floor
spa
cebu
ildsa
les
Site
B8
Albi
on M
ill, A
lbio
n St
.D
wel
lings
gros
sne
tco
stva
lue
Loca
tion
Padi
ham
, BU
RN
LEY
sq ft
sq ft
per s
q ft
per s
q ft
Are
a
ha
1.05
Mar
ket h
ousi
ng42
.390
.00%
888
856
87.5
013
9.00
acre
s2.
590.
0%N
o dw
gs47
Affo
rdab
le s
oc re
nt4.
29.
00%
888
856
87.5
081
.00
Den
sity
dw
/ha
44.8
0.0%
Affo
rdab
le s
h os
hip
0.5
1.00
%88
885
687
.50
108.
000.
0%Af
f oth
er 2
0.0
0.00
%88
885
687
.50
0.00
0.0%
Aff o
ther
20.
00.
00%
00
87.5
00.
00£k
Con
tinge
ncy
Tota
l47
.010
0.00
%41
,736
40,2
32£3
,651
,900
£5,3
69,7
65al
low
ance
5.00
%18
3Fl
oors
pace
den
sity
=15
,506
net s
q ft
per a
cre
Dev
elop
men
t cos
tsst
anda
rd %
bui
ld14
.00%
537
Oth
er c
osts
Plan
ning
515.
0£
per d
wel
ling
Surv
ey50
0£
per d
wel
ling
plus
abn
orm
als
4.2%
163
Mar
ketin
g0
£ pe
r dw
ellin
gTo
tal
18%
Des
ign
fees
on b
uild
cos
ts10
.0%
383
Inte
rest
% p
er a
nnum
7.50
%
on d
ev c
osts
0%N
otes
Plan
ning
gai
n£
per d
wel
ling
3,10
014
6

Appendix 4 . F inanc ia l appra isa l summar ies
Page 93
SITE B8 LAND COST & PHASING
Land
Itera
te to
ach
ieve
20.
0% p
rofit
Affo
rdab
leN
o af
ford
able
Affo
rdab
leN
o af
ford
able
Land
pur
chas
e pr
ice
£
-814
,224
-688
,944
RV
per
acr
e£
-313
,821
-265
,535
-£77
5,45
1-£
656,
137
Dev
pro
fit£
877,
118
932,
951
Tota
l cos
ts£
4,49
3,69
74,
660,
347
prof
it as
% o
f cos
ts19
.52%
20.0
2%
Hec
tare
Prog
ram
me
Year
1Y
ear 2
Yea
r 3Y
ear 4
Q1
Q2
Q3
Q4
Q1
Q2
Q3
Q4
Q1
Q2
Q3
Q4
Q1
Q2
Q3
Q4
TOTA
LS
Uni
tsM
arke
t hou
sing
4.5
5.4
5.4
5.4
5.4
5.4
5.4
5.4
0.0
0.0
0.0
0.0
0.0
0.0
42.3
star
ted
Affo
rdab
le s
oc re
nt0.
50.
50.
50.
50.
50.
50.
50.
50.
00.
00.
00.
00.
00.
04.
2A
fford
able
sh
oshi
p0.
00.
10.
10.
10.
10.
10.
10.
10.
00.
00.
00.
00.
00.
00.
5A
ff ot
her 2
0.0
0.0
0.0
0.0
0.0
0.0
0.0
0.0
0.0
0.0
0.0
0.0
0.0
0.0
0.0
Aff
othe
r 20.
00.
00.
00.
00.
00.
00.
00.
00.
00.
00.
00.
00.
00.
00.
0TO
TAL
00
56
66
66
66
00
00
00
47.0
Uni
tsM
arke
t hou
sing
00
55
55
55
55
00
00
42'b
uilt' +2
QA
fford
able
soc
rent
00
01
11
11
11
00
00
4A
fford
able
sh
oshi
p0
00
00
00
00
00
00
00
Aff
othe
r 20
00
00
00
00
00
00
00
Aff
othe
r 20
00
00
00
00
00
00
00
Uni
tsM
arke
t hou
sing
00
55
55
55
55
00
042
com
plet
ed+3
QA
fford
able
soc
rent
00
01
11
11
11
00
04
Affo
rdab
le s
h os
hip
00
00
00
00
00
00
00
Aff
othe
r 20
00
00
00
00
00
00
0A
ff ot
her 2
00
00
00
00
00
00
00
Uni
tsM
arke
t hou
sing
00
55
55
55
55
00
42pu
rcha
sed
+4Q
Affo
rdab
le s
oc re
nt0
00
11
11
11
10
04
Affo
rdab
le s
h os
hip
00
00
00
00
00
00
0A
ff ot
her 2
00
00
00
00
00
00
0A
ff ot
her 2
00
00
00
00
00
00
0

Burn ley & Pendle Af fordable Housing Si te V iab i l i ty Update
Page 94
SITE B8 CASH FLOW AFFORDABLE
Yea
r 1Ye
ar 2
Yea
r 3Y
ear 4
rate
Q1
Q2
Q3
Q4
Q1
Q2
Q3
Q4
Q1
Q2
Q3
Q4
Q1
Q2
Q3
Q4
Q4
TOTA
LS
INC
OM
E
Hou
sing
sal
esM
arke
t hou
sing
00
00
00
535
643
643
643
643
643
643
643
00
05,
033
Affo
rdab
le s
oc re
nt0
00
00
031
3737
3737
3737
370
00
293
Affo
rdab
le s
h os
hip
00
00
00
56
66
66
66
00
043
Aff o
ther
20
00
00
00
00
00
00
00
00
0Af
f oth
er 2
00
00
00
00
00
00
00
00
00
Sale
s fe
es0
00
00
0-1
9-2
3-2
3-2
3-2
3-2
3-2
3-2
30
00
-178
Tota
l inc
ome
00
00
00
571
686
686
686
686
686
686
686
00
05,
370
CO
STS
Land
Land
acq
uisi
tion
-814
-814
Stam
p du
ty0
0Pu
rcha
se fe
es-2
2-2
2To
tal
-837
Bui
ld c
osts
Mar
ket h
ousi
ng0
00
035
042
042
042
042
042
042
042
00
00
00
3,28
7Af
ford
able
soc
rent
00
00
3542
4242
4242
4242
00
00
032
9Af
ford
able
sh
oshi
p0
00
04
55
55
55
50
00
00
37Af
f oth
er 2
00
00
00
00
00
00
00
00
00
Aff o
ther
20
00
00
00
00
00
00
00
00
0Bu
ild c
ontin
genc
y5.
0%0
00
019
2323
2323
2323
230
00
00
183
Tota
l3,
834
Dev
cos
tsU
pfro
nt7.
0%67
6767
6726
8Bu
ild re
late
d7.
0%0
029
3434
3434
3434
340
00
00
026
8Ab
norm
als
4%81
8116
3To
tal
699
Fees
Fees
on
build
cos
ts10
.0%
00
00
4149
4949
4949
4949
00
00
038
3Fe
es o
n de
v co
sts
0.0%
00
00
00
00
00
00
00
00
00
Tota
l38
3PG
Plan
ning
gai
n16
1919
1919
1919
190
00
00
00
146
Tota
l14
6O
ther
Plan
ning
£515
88
824
Surv
ey£5
0024
24M
arke
ting
£00
00
00
00
00
00
00
00
0To
tal
48Sa
les
fees
b/fo
rwar
d fro
m a
bove
00
00
00
1923
2323
2323
2323
00
017
8To
tal c
osts
-657
156
119
120
502
591
610
614
614
614
561
561
2323
00
04,
452
Net
pro
fit/lo
ss fr
om q
uart
er65
7-1
56-1
19-1
20-5
02-5
91-3
971
7171
124
124
663
663
00
091
7
Prof
it/lo
ss b
f fro
m la
st q
uart
er0
669
522
411
296
-209
-815
-870
-814
-756
-698
-584
-468
198
877
877
877
Cum
ulat
ive
prof
it/lo
ss65
751
340
329
1-2
05-8
00-8
54-7
99-7
42-6
85-5
73-4
6019
486
187
787
787
7
Inte
rest
Cha
rged
at
7.50
%7.
50%
7.50
%7.
50%
7.50
%7.
50%
7.50
%7.
50%
7.50
%7.
50%
7.50
%7.
50%
7.50
%7.
50%
7.50
%0.
00%
0.00
%0.
00%
Tota
l12
108
5-4
-15
-16
-15
-14
-13
-11
-94
160
00
-41
Cum
ulat
ive
deve
lope
r pro
fit66
952
241
129
6-2
09-8
15-8
70-8
14-7
56-6
98-5
84-4
6819
887
787
787
787
787
6ca
rrie
d fo
rwar
d to
RV
calc

Appendix 4 . F inanc ia l appra isa l summar ies
Page 95
SITE P1: Lob Lane Mill Brierfield

Burn ley & Pendle Af fordable Housing Si te V iab i l i ty Update
Page 96
Inpu
t ass
umpt
ions
Scen
ario
& o
ptio
nAf
ford
able
10%
= 8
% s
ocia
l ren
ted
2% in
term
edia
te
Bur
nley
& P
endl
e vi
abili
ty s
tudy
Dw
ellin
gs
Site
det
ails
ave
floor
spa
cebu
ildsa
les
Site
PE1
Lobb
Lan
e C
lithe
roe
Rd
Dw
ellin
gsgr
oss
net
cost
valu
eLo
catio
nB
rierf
iled
Bur
nley
sq ft
sq ft
per s
q ft
per s
q ft
Are
a
ha
1.00
Mar
ket h
ousi
ng89
.190
.00%
857
769
101.
8014
2.00
acre
s2.
470.
0%N
o dw
gs99
Affo
rdab
le s
oc re
nt7.
98.
00%
857
769
101.
8078
.00
Den
sity
dw
/ha
99.0
0.0%
Affo
rdab
le s
h os
hip
2.0
2.00
%85
776
910
1.80
108.
000.
0%Af
f oth
er 2
0.0
0.00
%85
776
910
1.80
0.00
0.0%
Aff o
ther
20.
00.
00%
00
101.
800.
00£k
Con
tinge
ncy
Tota
l99
.010
0.00
%84
,843
76,1
31£8
,637
,017
£10,
369,
042
allo
wan
ce5.
00%
432
Floo
rspa
ce d
ensi
ty=
30,8
10ne
t sq
ft pe
r acr
e
Dev
elop
men
t cos
tsst
anda
rd %
bui
ld12
.00%
1,08
8O
ther
cos
tsPl
anni
ng42
0.8
£ pe
r dw
ellin
g
Surv
ey50
0£
per d
wel
ling
plus
abn
orm
als
1.2%
104
98M
arke
ting
0£
per d
wel
ling
Tota
l13
%
Des
ign
fees
on b
uild
cos
ts10
.0%
907
Inte
rest
% p
er a
nnum
7.50
%
on d
ev c
osts
0%N
otes
Plan
ning
gai
n£
per d
wel
ling
3,10
030
7

Appendix 4 . F inanc ia l appra isa l summar ies
Page 97
SITE B1 LAND COST & PHASING
Land
Itera
te to
ach
ieve
20.
0% p
rofit
Affo
rdab
leN
o af
ford
able
Affo
rdab
leN
o af
ford
able
Land
pur
chas
e pr
ice
£
-3,1
67,4
36-2
,902
,587
RV
per
acr
e£
-1,2
81,8
44-1
,174
,661
-£3,
167,
436
-£2,
902,
587
Dev
pro
fit£
1,69
9,23
61,
801,
660
Tota
l cos
ts£
8,67
0,48
19,
009,
617
prof
it as
% o
f cos
ts19
.60%
20.0
0%
Hec
tare
Prog
ram
me
Year
1Y
ear 2
Yea
r 3Y
ear 4
Q1
Q2
Q3
Q4
Q1
Q2
Q3
Q4
Q1
Q2
Q3
Q4
Q1
Q2
Q3
Q4
TOTA
LS
Uni
tsM
arke
t hou
sing
29.7
29.7
29.7
0.0
0.0
0.0
0.0
0.0
0.0
0.0
0.0
0.0
0.0
0.0
89.1
star
ted
Affo
rdab
le s
oc re
nt2.
62.
62.
60.
00.
00.
00.
00.
00.
00.
00.
00.
00.
00.
07.
9A
fford
able
sh
oshi
p0.
70.
70.
70.
00.
00.
00.
00.
00.
00.
00.
00.
00.
00.
02.
0A
ff ot
her 2
0.0
0.0
0.0
0.0
0.0
0.0
0.0
0.0
0.0
0.0
0.0
0.0
0.0
0.0
0.0
Aff
othe
r 20.
00.
00.
00.
00.
00.
00.
00.
00.
00.
00.
00.
00.
00.
00.
0TO
TAL
00
3333
330
00
00
00
00
00
99.0
Uni
tsM
arke
t hou
sing
00
3030
300
00
00
00
00
89'b
uilt' +2
QA
fford
able
soc
rent
00
33
30
00
00
00
00
8A
fford
able
sh
oshi
p0
01
11
00
00
00
00
02
Aff
othe
r 20
00
00
00
00
00
00
00
Aff
othe
r 20
00
00
00
00
00
00
00
Uni
tsM
arke
t hou
sing
00
3030
300
00
00
00
089
com
plet
ed+3
QA
fford
able
soc
rent
00
33
30
00
00
00
08
Affo
rdab
le s
h os
hip
00
11
10
00
00
00
02
Aff
othe
r 20
00
00
00
00
00
00
0A
ff ot
her 2
00
00
00
00
00
00
00
Uni
tsM
arke
t hou
sing
00
3030
300
00
00
00
89pu
rcha
sed
+4Q
Affo
rdab
le s
oc re
nt0
03
33
00
00
00
08
Affo
rdab
le s
h os
hip
00
11
10
00
00
00
2A
ff ot
her 2
00
00
00
00
00
00
0A
ff ot
her 2
00
00
00
00
00
00
0

Burn ley & Pendle Af fordable Housing Si te V iab i l i ty Update
Page 98
SITE B1 CASH FLOW AFFORDABLE
Year
1Ye
ar 2
Year
3Ye
ar 4
Year
5ra
teQ
1Q
2Q
3Q
4Q
1Q
2Q
3Q
4Q
1Q
2Q
3Q
4Q
1Q
2Q
3Q
4Q
1Q
2Q
3Q
4TO
TALS
INC
OM
E
Hou
sing
sal
esM
arke
t hou
sing
00
00
00
1,14
91,
149
1,14
91,
149
1,14
91,
149
1,14
91,
149
1,14
91,
149
1,14
90
00
12,6
37Af
ford
able
soc
rent
00
00
00
6161
6161
6161
6161
6161
610
00
674
Affo
rdab
le s
h os
hip
00
00
00
99
99
99
99
99
90
00
101
Aff o
ther
20
00
00
00
00
00
00
00
00
00
00
Aff o
ther
20
00
00
00
00
00
00
00
00
00
00
Sale
s fe
es0
00
00
0-4
1-4
1-4
1-4
1-4
1-4
1-4
1-4
1-4
1-4
1-4
10
00
-447
Tota
l inc
ome
00
00
00
1,21
91,
219
1,21
91,
219
1,21
91,
219
1,21
91,
219
1,21
91,
219
1,21
90
00
13,4
12C
OST
S
Land
Land
acq
uisi
tion
-1,1
68-1
,168
Stam
p du
ty0
0Pu
rcha
se fe
es-3
2-3
2To
tal
-1,2
01B
uild
cos
tsM
arke
t hou
sing
00
00
707
707
707
707
707
707
707
707
707
707
707
00
00
07,
780
Affo
rdab
le s
oc re
nt0
00
071
7171
7171
7171
7171
7171
00
00
077
8Af
ford
able
sh
oshi
p0
00
08
88
88
88
88
88
00
00
086
Aff o
ther
20
00
00
00
00
00
00
00
00
00
00
Aff o
ther
20
00
00
00
00
00
00
00
00
00
00
Build
con
tinge
ncy
5.0%
00
00
3939
3939
3939
3939
3939
390
00
00
432
Tota
l9,
076
Dev
cos
tsU
pfro
nt6.
5%14
714
714
714
759
0Bu
ild re
late
d6.
5%0
054
5454
5454
5454
5454
5454
00
00
00
059
0Ab
norm
als
3%11
811
823
7To
tal
1,41
7Fe
esFe
es o
n bu
ild c
osts
10.0
%0
00
083
8383
8383
8383
8383
8383
00
00
090
8Fe
es o
n de
v co
sts
0.0%
00
00
00
00
00
00
00
00
00
00
0To
tal
908
PGPl
anni
ng g
ain
3131
3131
3131
3131
3131
310
00
00
00
341
Tota
l34
1O
ther
Plan
ning
£438
1616
1648
Surv
ey£5
0055
55M
arke
ting
£00
00
00
00
00
00
00
00
00
00
Tota
l10
3Sa
les
fees
b/fo
rwar
d fro
m a
bove
00
00
00
4141
4141
4141
4141
4141
410
00
447
Tota
l cos
ts-8
6428
224
823
299
299
21,
033
1,03
31,
033
1,03
31,
033
1,03
31,
033
948
948
4141
00
011
,092
Net
pro
fit/lo
ss fr
om q
uart
er86
4-2
82-2
48-2
32-9
92-9
9218
618
618
618
618
618
618
627
127
11,
179
1,17
90
00
2,32
1
Prof
it/lo
ss b
f fro
m la
st q
uart
er0
880
609
368
138
-870
-1,8
97-1
,743
-1,5
85-1
,425
-1,2
62-1
,096
-926
-754
-492
-225
972
2,19
12,
191
2,19
1
Cum
ulat
ive
prof
it/lo
ss86
459
836
113
6-8
54-1
,862
-1,7
11-1
,556
-1,3
99-1
,239
-1,0
76-9
09-7
40-4
83-2
2195
42,
150
2,19
12,
191
2,19
1
Inte
rest
Cha
rged
at
7.50
%7.
50%
7.50
%7.
50%
7.50
%7.
50%
7.50
%7.
50%
7.50
%7.
50%
7.50
%7.
50%
7.50
%7.
50%
7.50
%7.
50%
7.50
%7.
50%
0.00
%0.
00%
0.00
%To
tal
1611
73
-16
-35
-32
-29
-26
-23
-20
-17
-14
-9-4
1840
00
0-1
31
Cum
ulat
ive
deve
lope
r pro
fit88
060
936
813
8-8
70-1
,897
-1,7
43-1
,585
-1,4
25-1
,262
-1,0
96-9
26-7
54-4
92-2
2597
22,
191
2,19
12,
191
2,19
12,
190
carr
ied
forw
ard
to R
V ca
lc

Appendix 4 . F inanc ia l appra isa l summar ies
Page 99
SITE P2: Richard St Brierfield

Burn ley & Pendle Af fordable Housing Si te V iab i l i ty Update
Page 100
Inpu
t ass
umpt
ions
Scen
ario
& o
ptio
nA
fford
able
10%
= 8
% s
ocia
l ren
ted
2% in
term
edia
te
Bur
nley
& P
endl
e vi
abili
ty s
tudy
Dwel
lings
Site
det
ails
ave
floor
spa
cebu
ildsa
les
Site
PE2
Ric
hard
Stre
etDw
ellin
gsgr
oss
net
cost
valu
eLo
catio
nB
rierf
ield
sq ft
sq ft
per s
q ft
per s
q ft
Are
a
ha
0.98
Mar
ket h
ousi
ng63
.090
.00%
753
679
99.2
014
4.00
acre
s2.
420.
0%N
o dw
gs70
Affo
rdab
le s
oc re
nt5.
68.
00%
753
679
99.2
076
.00
Den
sity
dw
/ha
71.4
0.0%
Affo
rdab
le s
h os
hip
1.4
2.00
%75
367
999
.20
108.
000.
0%A
ff ot
her 2
0.0
0.00
%75
367
999
.20
0.00
0.0%
Aff
othe
r 20.
00.
00%
00
99.2
00.
00£k
Cont
inge
ncy
Tota
l70
.010
0.00
%52
,710
47,5
30£5
,228
,832
£6,5
51,5
35al
low
ance
5.00
%26
1Fl
oors
pace
den
sity
=19
,628
net s
q ft
per a
cre
Deve
lopm
ent c
osts
stan
dard
% b
uild
13.0
0%71
4O
ther
cos
tsP
lann
ing
348.
6£
per d
wel
ling
Sur
vey
500
£ pe
r dw
ellin
gpl
us a
bnor
mal
s1.
7%91
Mar
ketin
g0
£ pe
r dw
ellin
gTo
tal
15%
Desi
gn fe
eson
bui
ld c
osts
10.0
%54
9In
tere
st%
per
ann
um7.
50%
on d
ev c
osts
0%No
tes
Plan
ning
gai
n£
per d
wel
ling
3,10
021
7

Appendix 4 . F inanc ia l appra isa l summar ies
Page 101
SITE P2 LAND COST & PHASING
Land
Itera
te to
ach
ieve
20.
0% p
rofit
Affo
rdab
leN
o af
ford
able
Affo
rdab
leN
o af
ford
able
Land
pur
chas
e pr
ice
£
-1,6
98,0
83-1
,531
,890
RV
per a
cre
£-7
01,2
30-6
32,5
99-£
1,73
2,73
8-£
1,56
3,15
3
Dev
pro
fit£
1,06
9,14
91,
140,
764
Tota
l cos
ts£
5,48
3,58
65,
704,
756
prof
it as
% o
f cos
ts19
.50%
20.0
0%
Hect
are
Prog
ram
me
Yea
r 1Y
ear 2
Yea
r 3Y
ear 4
Yea
r 5Q
1Q
2Q
3Q
4Q
1Q
2Q
3Q
4Q
1Q
2Q
3Q
4Q
1Q
2Q
3Q
4Q
1Q
2Q
3Q
4TO
TALS
Units
Mar
ket h
ousi
ng6.
36.
36.
36.
36.
36.
36.
36.
36.
36.
30.
00.
00.
00.
00.
00.
00.
00.
063
.0st
arte
dA
fford
able
soc
rent
0.6
0.6
0.6
0.6
0.6
0.6
0.6
0.6
0.6
0.6
0.0
0.0
0.0
0.0
0.0
0.0
0.0
0.0
5.6
Affo
rdab
le s
h os
hip
0.1
0.1
0.1
0.1
0.1
0.1
0.1
0.1
0.1
0.1
0.0
0.0
0.0
0.0
0.0
0.0
0.0
0.0
1.4
Aff
othe
r 20.
00.
00.
00.
00.
00.
00.
00.
00.
00.
00.
00.
00.
00.
00.
00.
00.
00.
00.
0A
ff ot
her 2
0.0
0.0
0.0
0.0
0.0
0.0
0.0
0.0
0.0
0.0
0.0
0.0
0.0
0.0
0.0
0.0
0.0
0.0
0.0
TOTA
L0
07
77
77
77
77
70
00
00
00
070
.0
Units
Mar
ket h
ousi
ng0
06
66
66
66
66
60
00
00
063
'bui
lt' +2Q
Affo
rdab
le s
oc re
nt0
01
11
11
11
11
10
00
00
06
Affo
rdab
le s
h os
hip
00
00
00
00
00
00
00
00
00
1A
ff ot
her 2
00
00
00
00
00
00
00
00
00
0A
ff ot
her 2
00
00
00
00
00
00
00
00
00
0Un
itsM
arke
t hou
sing
00
66
66
66
66
66
00
00
063
com
plet
ed+3
QA
fford
able
soc
rent
00
11
11
11
11
11
00
00
06
Affo
rdab
le s
h os
hip
00
00
00
00
00
00
00
00
01
Aff
othe
r 20
00
00
00
00
00
00
00
00
0A
ff ot
her 2
00
00
00
00
00
00
00
00
00
Units
Mar
ket h
ousi
ng0
06
66
66
66
66
60
00
063
purc
hase
d+4
QA
fford
able
soc
rent
00
11
11
11
11
11
00
00
6A
fford
able
sh
oshi
p0
00
00
00
00
00
00
00
01
Aff
othe
r 20
00
00
00
00
00
00
00
00
Aff
othe
r 20
00
00
00
00
00
00
00
00

Burn ley & Pendle Af fordable Housing Si te V iab i l i ty Update
Page 102
SITE P2 CASH FLOW AFFORDABLE
Yea
r 1Y
ear 2
Yea
r 3Y
ear 4
Yea
r 5ra
teQ
1Q
2Q
3Q
4Q
1Q
2Q
3Q
4Q
1Q
2Q
3Q
4Q
1Q
2Q
3Q
4Q
1Q
2Q
3Q
4TO
TALS
INC
OM
E
Hou
sing
sal
esM
arke
t hou
sing
00
00
00
616
616
616
616
616
616
616
616
616
616
00
00
6,16
0A
fford
able
soc
rent
00
00
00
2929
2929
2929
2929
2929
00
00
289
Affo
rdab
le s
h os
hip
00
00
00
1010
1010
1010
1010
1010
00
00
103
Aff
othe
r 20
00
00
00
00
00
00
00
00
00
00
Aff
othe
r 20
00
00
00
00
00
00
00
00
00
00
Sal
es fe
es0
00
00
0-2
2-2
2-2
2-2
2-2
2-2
2-2
2-2
2-2
2-2
20
00
0-2
19
Tota
l inc
ome
00
00
00
655
655
655
655
655
655
655
655
655
655
00
00
6,55
2C
OST
S
Land
Land
acq
uisi
tion
-1,6
98-1
,698
Sta
mp
duty
00
Pur
chas
e fe
es-4
7-4
7To
tal
-1,7
45B
uild
cos
tsM
arke
t hou
sing
00
00
471
471
471
471
471
471
471
471
471
471
00
00
00
4,70
6A
fford
able
soc
rent
00
00
4242
4242
4242
4242
4242
00
00
00
418
Affo
rdab
le s
h os
hip
00
00
1010
1010
1010
1010
1010
00
00
00
105
Aff
othe
r 20
00
00
00
00
00
00
00
00
00
00
Aff
othe
r 20
00
00
00
00
00
00
00
00
00
00
Bui
ld c
ontin
genc
y5.
0%0
00
026
2626
2626
2626
2626
260
00
00
026
1To
tal
5,49
0D
ev c
osts
Upf
ront
6.5%
8989
8989
357
Bui
ld re
late
d6.
5%0
036
3636
3636
3636
3636
360
00
00
00
035
7A
bnor
mal
s2%
4545
91To
tal
804
Fees
Fees
on
build
cos
ts10
.0%
00
00
5555
5555
5555
5555
5555
00
00
00
549
Fees
on
dev
cost
s0.
0%0
00
00
00
00
00
00
00
00
00
00
Tota
l54
9P
GP
lann
ing
gain
2222
2222
2222
2222
2222
00
00
00
00
217
Tota
l21
7O
ther
Pla
nnin
g£3
498
88
24S
urve
y£5
0035
35M
arke
ting
£00
00
00
00
00
00
00
00
00
00
Tota
l59
Sal
es fe
esb/
forw
ard
from
abo
ve0
00
00
022
2222
2222
2222
2222
220
00
021
9To
tal c
osts
-1,5
6714
315
514
766
166
168
368
368
368
368
368
362
662
622
220
00
05,
594
Net
pro
fit/lo
ss fr
om q
uart
er1,
567
-143
-155
-147
-661
-661
-28
-28
-28
-28
-28
-28
2929
633
633
00
00
958
Pro
fit/lo
ss b
f fro
m la
st q
uarte
r0
1,59
71,
481
1,35
11,
228
577
-86
-116
-147
-178
-210
-242
-275
-250
-225
416
1,06
91,
069
1,06
91,
069
Cum
ulat
ive
prof
it/lo
ss1,
567
1,45
41,
327
1,20
556
6-8
4-1
14-1
44-1
75-2
06-2
38-2
70-2
46-2
2140
81,
049
1,06
91,
069
1,06
91,
069
Inte
rest
Cha
rged
at
7.50
%7.
50%
7.50
%7.
50%
7.50
%7.
50%
7.50
%7.
50%
7.50
%7.
50%
7.50
%7.
50%
7.50
%7.
50%
7.50
%7.
50%
7.50
%0.
00%
0.00
%0.
00%
0.00
%To
tal
2927
2523
11-2
-2-3
-3-4
-4-5
-5-4
820
00
00
110
Cum
ulat
ive
deve
lope
r pro
fit1,
597
1,48
11,
351
1,22
857
7-8
6-1
16-1
47-1
78-2
10-2
42-2
75-2
50-2
2541
61,
069
1,06
91,
069
1,06
91,
069
1,06
8ca
rrie
d fo
rwar
d to
RV
calc

Appendix 4 . F inanc ia l appra isa l summar ies
Page 103
SITE P3: Lamberts Woodyard Nelson

Burn ley & Pendle Af fordable Housing Si te V iab i l i ty Update
Page 104
Inpu
t ass
umpt
ions
Scen
ario
& o
ptio
nA
fford
able
10%
= 8
% s
ocia
l ren
ted
2% in
term
edia
te
Bur
nley
& P
endl
e vi
abili
ty s
tudy
Dwel
lings
Site
det
ails
ave
floor
spa
cebu
ildsa
les
Site
PE3
Lam
berts
Woo
d Ya
rdDw
ellin
gsgr
oss
net
cost
valu
eLo
catio
nM
anch
este
r Rd
NELS
ON
sq ft
sq ft
per s
q ft
per s
q ft
Are
a
ha
1.04
Mar
ket h
ousi
ng46
.890
.00%
1,05
61,
001
99.2
014
5.00
acre
s2.
570.
0%N
o dw
gs52
Affo
rdab
le s
oc re
nt4.
28.
00%
1,05
61,
001
99.2
080
.00
Den
sity
dw
/ha
50.0
0.0%
Affo
rdab
le s
h os
hip
1.0
2.00
%1,
056
1,00
199
.20
108.
000.
0%A
ff ot
her 2
0.0
0.00
%1,
056
1,00
199
.20
0.00
0.0%
Aff
othe
r 20.
00.
00%
00
99.2
00.
00£k
Cont
inge
ncy
Tota
l52
.010
0.00
%54
,912
52,0
52£5
,447
,270
£7,2
38,3
51al
low
ance
5.00
%27
2Fl
oors
pace
den
sity
=20
,255
net s
q ft
per a
cre
Deve
lopm
ent c
osts
stan
dard
% b
uild
13.0
0%74
4O
ther
cos
tsP
lann
ing
263.
3£
per d
wel
ling
Sur
vey
500
£ pe
r dw
ellin
gpl
us a
bnor
mal
s2.
6%14
9
140
Mar
ketin
g0
£ pe
r dw
ellin
gTo
tal
16%
Desi
gn fe
eson
bui
ld c
osts
10.0
%57
2In
tere
st%
per
ann
um7.
50%
on d
ev c
osts
0%No
tes
Plan
ning
gai
n£
per d
wel
ling
3,10
016
1

Appendix 4 . F inanc ia l appra isa l summar ies
Page 105
SITE P3 LAND COST & PHASING
Land
Itera
te to
ach
ieve
20.
0% p
rofit
Affo
rdab
leN
o af
ford
able
Affo
rdab
leN
o af
ford
able
Land
pur
chas
e pr
ice
£
-1,4
89,6
83-1
,315
,508
RV
per a
cre
£-5
79,6
79-5
11,9
03-£
1,43
2,38
7-£
1,26
4,91
2
Dev
pro
fit£
1,18
2,39
71,
259,
342
Tota
l cos
ts£
6,05
7,07
96,
289,
323
prof
it as
% o
f cos
ts19
.52%
20.0
2%
Hect
are
Pro
gram
me
Yea
r 1Y
ear 2
Yea
r 3Y
ear 4
Q1
Q2
Q3
Q4
Q1
Q2
Q3
Q4
Q1
Q2
Q3
Q4
Q1
Q2
Q3
Q4
TOTA
LS
Units
Mar
ket h
ousi
ng3.
65.
45.
45.
45.
45.
45.
45.
45.
40.
00.
00.
00.
00.
046
.8st
arte
dA
fford
able
soc
rent
0.3
0.5
0.5
0.5
0.5
0.5
0.5
0.5
0.5
0.0
0.0
0.0
0.0
0.0
4.2
Affo
rdab
le s
h os
hip
0.1
0.1
0.1
0.1
0.1
0.1
0.1
0.1
0.1
0.0
0.0
0.0
0.0
0.0
1.0
Aff
othe
r 20.
00.
00.
00.
00.
00.
00.
00.
00.
00.
00.
00.
00.
00.
00.
0A
ff ot
her 2
0.0
0.0
0.0
0.0
0.0
0.0
0.0
0.0
0.0
0.0
0.0
0.0
0.0
0.0
0.0
TOTA
L0
04
66
66
66
66
00
00
052
.0
Units
Mar
ket h
ousi
ng0
04
55
55
55
55
00
047
'bui
lt' +2Q
Affo
rdab
le s
oc re
nt0
00
00
00
00
00
00
04
Affo
rdab
le s
h os
hip
00
00
00
00
00
00
00
1A
ff ot
her 2
00
00
00
00
00
00
00
0A
ff ot
her 2
00
00
00
00
00
00
00
0Un
itsM
arke
t hou
sing
00
45
55
55
55
50
047
com
plet
ed+3
QA
fford
able
soc
rent
00
00
00
00
00
00
04
Affo
rdab
le s
h os
hip
00
00
00
00
00
00
01
Aff
othe
r 20
00
00
00
00
00
00
0A
ff ot
her 2
00
00
00
00
00
00
00
Units
Mar
ket h
ousi
ng0
04
55
55
55
55
047
purc
hase
d+4
QA
fford
able
soc
rent
00
00
00
00
00
00
4A
fford
able
sh
oshi
p0
00
00
00
00
00
01
Aff
othe
r 20
00
00
00
00
00
00
Aff
othe
r 20
00
00
00
00
00
00

Burn ley & Pendle Af fordable Housing Si te V iab i l i ty Update
Page 106
SITE P3 CASH FLOW AFFORDABLE
Yea
r 1Y
ear 2
Yea
r 3Y
ear 4
rate
Q1
Q2
Q3
Q4
Q1
Q2
Q3
Q4
Q1
Q2
Q3
Q4
Q1
Q2
Q3
Q4
Q4
TOTA
LS
INC
OM
E
Hous
ing
sale
sM
arke
t hou
sing
00
00
00
523
784
784
784
784
784
784
784
784
00
6,79
3A
fford
able
soc
rent
00
00
00
2638
3838
3838
3838
380
033
3A
fford
able
sh
oshi
p0
00
00
09
1313
1313
1313
1313
00
112
Aff
othe
r 20
00
00
00
00
00
00
00
00
0A
ff ot
her 2
00
00
00
00
00
00
00
00
00
Sal
es fe
es0
00
00
0-1
9-2
8-2
8-2
8-2
8-2
8-2
8-2
8-2
80
0-2
41
Tota
l inc
ome
00
00
00
557
835
835
835
835
835
835
835
835
00
7,23
8C
OST
S
Land
Land
acq
uisi
tion
-1,4
90-1
,490
Sta
mp
duty
00
Pur
chas
e fe
es-4
1-4
1To
tal
-1,5
31Bu
ild c
osts
Mar
ket h
ousi
ng0
00
037
756
656
656
656
656
656
656
656
60
00
04,
903
Affo
rdab
le s
oc re
nt0
00
034
5050
5050
5050
5050
00
00
436
Affo
rdab
le s
h os
hip
00
00
813
1313
1313
1313
130
00
010
9A
ff ot
her 2
00
00
00
00
00
00
00
00
00
Aff
othe
r 20
00
00
00
00
00
00
00
00
0B
uild
con
tinge
ncy
5.0%
00
00
2131
3131
3131
3131
310
00
027
2To
tal
5,72
0De
v co
sts
Upf
ront
6.5%
9393
9393
372
Bui
ld re
late
d6.
5%0
029
4343
4343
4343
4343
00
00
037
2A
bnor
mal
s3%
7474
149
Tota
l89
2Fe
esFe
es o
n bu
ild c
osts
10.0
%0
00
044
6666
6666
6666
6666
00
00
572
Fees
on
dev
cost
s0.
0%0
00
00
00
00
00
00
00
00
0To
tal
572
PGP
lann
ing
gain
1219
1919
1919
1919
190
00
00
016
1To
tal
161
Oth
erP
lann
ing
£263
55
514
Sur
vey
£500
2626
Mar
ketin
g£0
00
00
00
00
00
00
00
00
Tota
l40
Sale
s fe
esb/
forw
ard
from
abo
ve0
00
00
019
2828
2828
2828
2828
00
241
Tota
l cos
ts-1
,333
172
139
154
545
787
806
815
815
815
815
754
754
2828
00
6,09
5
Net
pro
fit/lo
ss fr
om q
uart
er1,
333
-172
-139
-154
-545
-787
-249
2020
2020
8181
807
807
00
1,14
3
Prof
it/lo
ss b
f fro
m la
st q
uarte
r0
1,35
81,
208
1,09
095
341
5-3
79-6
40-6
32-6
23-6
14-6
05-5
34-4
6135
31,
182
1,18
2
Cum
ulat
ive
prof
it/lo
ss1,
333
1,18
61,
070
935
408
-372
-628
-620
-612
-603
-594
-524
-452
347
1,16
11,
182
1,18
2
Inte
rest
Cha
rged
at
7.50
%7.
50%
7.50
%7.
50%
7.50
%7.
50%
7.50
%7.
50%
7.50
%7.
50%
7.50
%7.
50%
7.50
%7.
50%
7.50
%7.
50%
0.00
%0.
00%
Tota
l25
2220
188
-7-1
2-1
2-1
1-1
1-1
1-1
0-8
622
00
38
Cum
ulat
ive
deve
lope
r pro
fit1,
358
1,20
81,
090
953
415
-379
-640
-632
-623
-614
-605
-534
-461
353
1,18
21,
182
1,18
21,
181
carr
ied
forw
ard
to R
V ca
lc
Appendix 4 . F inanc ia l appra isa l summar ies
Page 107
SITE P4: James Nelson Sports Club Nelson
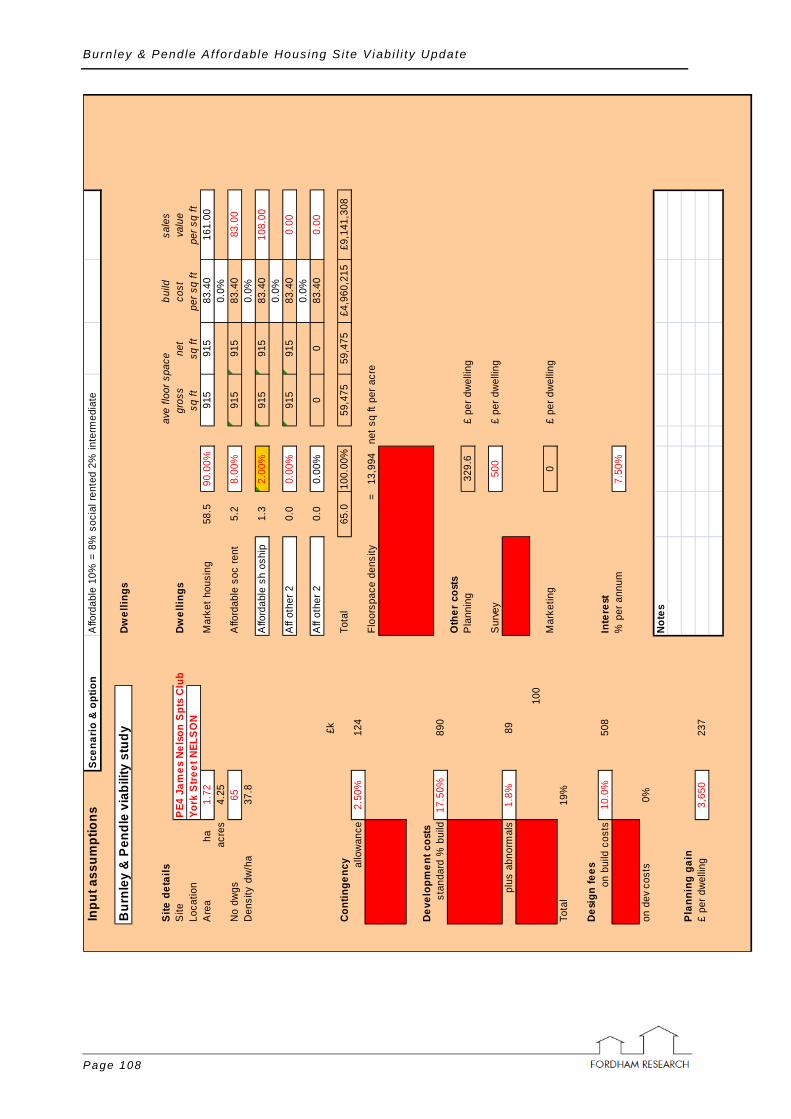
Burn ley & Pendle Af fordable Housing Si te V iab i l i ty Update
Page 108
Inpu
t ass
umpt
ions
Scen
ario
& o
ptio
nA
fford
able
10%
= 8
% s
ocia
l ren
ted
2% in
term
edia
te
Bur
nley
& P
endl
e vi
abili
ty s
tudy
Dwel
lings
Site
det
ails
ave
floor
spa
cebu
ildsa
les
Site
PE4
Jam
es N
elso
n Sp
ts C
lub
Dwel
lings
gros
sne
tco
stva
lue
Loca
tion
York
Stre
et N
ELSO
Nsq
ftsq
ftpe
r sq
ftpe
r sq
ftA
rea
h
a1.
72M
arke
t hou
sing
58.5
90.0
0%91
591
583
.40
161.
00ac
res
4.25
0.0%
No
dwgs
65A
fford
able
soc
rent
5.2
8.00
%91
591
583
.40
83.0
0D
ensi
ty d
w/h
a37
.80.
0%A
fford
able
sh
oshi
p1.
32.
00%
915
915
83.4
010
8.00
0.0%
Aff
othe
r 20.
00.
00%
915
915
83.4
00.
000.
0%A
ff ot
her 2
0.0
0.00
%0
083
.40
0.00
£kCo
ntin
genc
yTo
tal
65.0
100.
00%
59,4
7559
,475
£4,9
60,2
15£9
,141
,308
allo
wan
ce2.
50%
124
Floo
rspa
ce d
ensi
ty=
13,9
94ne
t sq
ft pe
r acr
e
Deve
lopm
ent c
osts
stan
dard
% b
uild
17.5
0%89
0O
ther
cos
tsP
lann
ing
329.
6£
per d
wel
ling
Sur
vey
500
£ pe
r dw
ellin
gpl
us a
bnor
mal
s1.
8%89
100
Mar
ketin
g0
£ pe
r dw
ellin
gTo
tal
19%
Desi
gn fe
eson
bui
ld c
osts
10.0
%50
8In
tere
st%
per
ann
um7.
50%
on d
ev c
osts
0%No
tes
Plan
ning
gai
n£
per d
wel
ling
3,65
023
7

Appendix 4 . F inanc ia l appra isa l summar ies
Page 109
SITE P4 LAND COST & PHASING
Land
Itera
te to
ach
ieve
20.
0% p
rofit
Affo
rdab
leN
o af
ford
able
Affo
rdab
leN
o af
ford
able
Land
pur
chas
e pr
ice
£
201,
982
451,
567
RV
per a
cre
£47
,524
106,
248
£117
,431
£262
,539
Dev
pro
fit£
1,49
4,53
31,
591,
800
Tota
l cos
ts£
7,64
8,04
97,
984,
950
prof
it as
% o
f cos
ts19
.54%
19.9
4%
Hect
are
Prog
ram
me
Yea
r 1Y
ear 2
Yea
r 3Y
ear 4
Yea
r 5Q
1Q
2Q
3Q
4Q
1Q
2Q
3Q
4Q
1Q
2Q
3Q
4Q
1Q
2Q
3Q
4Q
1Q
2Q
3Q
4TO
TALS
Units
Mar
ket h
ousi
ng4.
55.
45.
45.
45.
45.
45.
45.
45.
45.
45.
40.
00.
00.
00.
00.
00.
00.
058
.5st
arte
dA
fford
able
soc
rent
0.4
0.5
0.5
0.5
0.5
0.5
0.5
0.5
0.5
0.5
0.5
0.0
0.0
0.0
0.0
0.0
0.0
0.0
5.2
Affo
rdab
le s
h os
hip
0.1
0.1
0.1
0.1
0.1
0.1
0.1
0.1
0.1
0.1
0.1
0.0
0.0
0.0
0.0
0.0
0.0
0.0
1.3
Aff
othe
r 20.
00.
00.
00.
00.
00.
00.
00.
00.
00.
00.
00.
00.
00.
00.
00.
00.
00.
00.
0A
ff ot
her 2
0.0
0.0
0.0
0.0
0.0
0.0
0.0
0.0
0.0
0.0
0.0
0.0
0.0
0.0
0.0
0.0
0.0
0.0
0.0
TOTA
L0
05
66
66
66
66
66
00
00
00
065
.0
Units
Mar
ket h
ousi
ng0
05
55
55
55
55
55
00
00
059
'bui
lt' +2Q
Affo
rdab
le s
oc re
nt0
00
00
00
00
00
00
00
00
05
Affo
rdab
le s
h os
hip
00
00
00
00
00
00
00
00
00
1A
ff ot
her 2
00
00
00
00
00
00
00
00
00
0A
ff ot
her 2
00
00
00
00
00
00
00
00
00
0Un
itsM
arke
t hou
sing
00
55
55
55
55
55
50
00
059
com
plet
ed+3
QA
fford
able
soc
rent
00
00
00
00
00
00
00
00
05
Affo
rdab
le s
h os
hip
00
00
00
00
00
00
00
00
01
Aff
othe
r 20
00
00
00
00
00
00
00
00
0A
ff ot
her 2
00
00
00
00
00
00
00
00
00
Units
Mar
ket h
ousi
ng0
05
55
55
55
55
55
00
059
purc
hase
d+4
QA
fford
able
soc
rent
00
00
00
00
00
00
00
00
5A
fford
able
sh
oshi
p0
00
00
00
00
00
00
00
01
Aff
othe
r 20
00
00
00
00
00
00
00
00
Aff
othe
r 20
00
00
00
00
00
00
00
00

Burn ley & Pendle Af fordable Housing Si te V iab i l i ty Update
Page 110
SITE P4 CASH FLOW AFFORDABLE
Yea
r 1Y
ear 2
Yea
r 3Y
ear 4
Yea
r 5ra
teQ
1Q
2Q
3Q
4Q
1Q
2Q
3Q
4Q
1Q
2Q
3Q
4Q
1Q
2Q
3Q
4Q
1Q
2Q
3Q
4TO
TALS
INC
OM
E
Hou
sing
sal
esM
arke
t hou
sing
00
00
00
663
796
796
796
796
796
796
796
796
796
796
00
08,
618
Affo
rdab
le s
oc re
nt0
00
00
030
3636
3636
3636
3636
3636
00
039
5A
fford
able
sh
oshi
p0
00
00
010
1212
1212
1212
1212
1212
00
012
8A
ff ot
her 2
00
00
00
00
00
00
00
00
00
00
0A
ff ot
her 2
00
00
00
00
00
00
00
00
00
00
0S
ales
fees
00
00
00
-24
-28
-28
-28
-28
-28
-28
-28
-28
-28
-28
00
0-3
06
Tota
l inc
ome
00
00
00
703
844
844
844
844
844
844
844
844
844
844
00
09,
141
CO
STS
Land
Land
acq
uisi
tion
202
202
Sta
mp
duty
22
Pur
chas
e fe
es6
6To
tal
210
Bui
ld c
osts
Mar
ket h
ousi
ng0
00
034
341
241
241
241
241
241
241
241
241
241
20
00
00
4,46
4A
fford
able
soc
rent
00
00
3137
3737
3737
3737
3737
370
00
00
397
Affo
rdab
le s
h os
hip
00
00
89
99
99
99
99
90
00
00
99A
ff ot
her 2
00
00
00
00
00
00
00
00
00
00
0A
ff ot
her 2
00
00
00
00
00
00
00
00
00
00
0B
uild
con
tinge
ncy
2.5%
00
00
1011
1111
1111
1111
1111
110
00
00
124
Tota
l5,
084
Dev
cos
tsU
pfro
nt8.
8%11
111
111
111
144
5B
uild
rela
ted
8.8%
00
3441
4141
4141
4141
4141
410
00
00
00
445
Abn
orm
als
2%44
4489
Tota
l97
9Fe
esFe
es o
n bu
ild c
osts
10.0
%0
00
039
4747
4747
4747
4747
4747
00
00
050
8Fe
es o
n de
v co
sts
0.0%
00
00
00
00
00
00
00
00
00
00
0To
tal
508
PG
Pla
nnin
g ga
in18
2222
2222
2222
2222
2222
00
00
00
023
7To
tal
237
Oth
erP
lann
ing
£330
77
721
Sur
vey
£500
3333
Mar
ketin
g£0
00
00
00
00
00
00
00
00
00
0To
tal
54S
ales
fees
b/fo
rwar
d fro
m a
bove
00
00
00
2428
2828
2828
2828
2828
280
00
306
Tota
l cos
ts40
516
317
117
449
357
960
360
760
760
760
760
760
754
454
428
280
00
7,37
8
Net
pro
fit/lo
ss fr
om q
uart
er-4
05-1
63-1
71-1
74-4
93-5
7910
023
623
623
623
623
623
629
929
981
681
60
00
1,76
4
Pro
fit/lo
ss b
f fro
m la
st q
uart
er0
-412
-586
-771
-963
-1,4
83-2
,101
-2,0
38-1
,835
-1,6
29-1
,418
-1,2
04-9
86-7
63-4
73-1
7665
11,
495
1,49
51,
495
Cum
ulat
ive
prof
it/lo
ss-4
05-5
75-7
57-9
45-1
,456
-2,0
62-2
,000
-1,8
02-1
,599
-1,3
92-1
,182
-968
-749
-464
-173
639
1,46
71,
495
1,49
51,
495
Inte
rest
Cha
rged
at
7.50
%7.
50%
7.50
%7.
50%
7.50
%7.
50%
7.50
%7.
50%
7.50
%7.
50%
7.50
%7.
50%
7.50
%7.
50%
7.50
%7.
50%
7.50
%7.
50%
0.00
%0.
00%
0.00
%To
tal
-8-1
1-1
4-1
8-2
7-3
9-3
8-3
4-3
0-2
6-2
2-1
8-1
4-9
-312
280
00
-270
Cum
ulat
ive
deve
lope
r pro
fit-4
12-5
86-7
71-9
63-1
,483
-2,1
01-2
,038
-1,8
35-1
,629
-1,4
18-1
,204
-986
-763
-473
-176
651
1,49
51,
495
1,49
51,
495
1,49
3ca
rrie
d fo
rwar
d to
RV
calc

Appendix 4 . F inanc ia l appra isa l summar ies
Page 111
SITE P5: Spen Brook Mill Spen Brook

Burn ley & Pendle Af fordable Housing Si te V iab i l i ty Update
Page 112
Inpu
t ass
umpt
ions
Scen
ario
& o
ptio
nA
fford
able
10%
= 8
% s
ocia
l ren
ted
2% in
term
edia
te
Bur
nley
& P
endl
e vi
abili
ty s
tudy
Dwel
lings
Site
det
ails
ave
floor
spa
cebu
ildsa
les
Site
PE5
Spe
n Br
ook
Mill
Dwel
lings
gros
sne
tco
stva
lue
Loca
tion
New
chur
ch R
d, S
pn B
rook
sq ft
sq ft
per s
q ft
per s
q ft
Are
a
ha
0.90
Mar
ket h
ousi
ng46
.890
.00%
868
769
96.7
022
5.00
acre
s2.
220.
0%N
o dw
gs52
Affo
rdab
le s
oc re
nt4.
28.
00%
868
769
96.7
079
.00
Den
sity
dw
/ha
57.8
0.0%
Affo
rdab
le s
h os
hip
1.0
2.00
%86
876
996
.70
108.
000.
0%A
ff ot
her 2
0.0
0.00
%86
876
996
.70
0.00
0.0%
Aff
othe
r 20.
00.
00%
00
96.7
00.
00£k
Cont
inge
ncy
Tota
l52
.010
0.00
%45
,136
39,9
88£4
,364
,651
£8,4
36,6
68al
low
ance
5.00
%21
8Fl
oors
pace
den
sity
=17
,981
net s
q ft
per a
cre
Deve
lopm
ent c
osts
stan
dard
% b
uild
13.0
0%59
6O
ther
cos
tsP
lann
ing
263.
3£
per d
wel
ling
Sur
vey
500
£ pe
r dw
ellin
gpl
us a
bnor
mal
s2.
3%10
6
100
Mar
ketin
g0
£ pe
r dw
ellin
gTo
tal
15%
Desi
gn fe
eson
bui
ld c
osts
10.0
%45
8In
tere
st%
per
ann
um7.
50%
on d
ev c
osts
0%No
tes
Plan
ning
gai
n£
per d
wel
ling
3,10
016
1

Appendix 4 . F inanc ia l appra isa l summar ies
Page 113
SITE P5 LAND COST & PHASING
Land
Itera
te to
ach
ieve
20.
0% p
rofit
Affo
rdab
leN
o af
ford
able
Affo
rdab
leN
o af
ford
able
Land
pur
chas
e pr
ice
£
504,
394
825,
944
RV
per a
cre
£22
6,80
637
1,39
4£5
60,4
38£9
17,7
15
Dev
pro
fit£
1,37
1,08
31,
499,
946
Tota
l cos
ts£
7,06
6,71
07,
498,
479
prof
it as
% o
f cos
ts19
.40%
20.0
0%
Hect
are
Pro
gram
me
Yea
r 1Y
ear 2
Yea
r 3Y
ear 4
Q1
Q2
Q3
Q4
Q1
Q2
Q3
Q4
Q1
Q2
Q3
Q4
Q1
Q2
Q3
Q4
TOTA
LS
Units
Mar
ket h
ousi
ng3.
65.
45.
45.
45.
45.
45.
45.
45.
40.
00.
00.
00.
00.
046
.8st
arte
dA
fford
able
soc
rent
0.3
0.5
0.5
0.5
0.5
0.5
0.5
0.5
0.5
0.0
0.0
0.0
0.0
0.0
4.2
Affo
rdab
le s
h os
hip
0.1
0.1
0.1
0.1
0.1
0.1
0.1
0.1
0.1
0.0
0.0
0.0
0.0
0.0
1.0
Aff
othe
r 20.
00.
00.
00.
00.
00.
00.
00.
00.
00.
00.
00.
00.
00.
00.
0A
ff ot
her 2
0.0
0.0
0.0
0.0
0.0
0.0
0.0
0.0
0.0
0.0
0.0
0.0
0.0
0.0
0.0
TOTA
L0
04
66
66
66
66
00
00
052
.0
Units
Mar
ket h
ousi
ng0
04
55
55
55
55
00
047
'bui
lt' +2Q
Affo
rdab
le s
oc re
nt0
00
00
00
00
00
00
04
Affo
rdab
le s
h os
hip
00
00
00
00
00
00
00
1A
ff ot
her 2
00
00
00
00
00
00
00
0A
ff ot
her 2
00
00
00
00
00
00
00
0Un
itsM
arke
t hou
sing
00
45
55
55
55
50
047
com
plet
ed+3
QA
fford
able
soc
rent
00
00
00
00
00
00
04
Affo
rdab
le s
h os
hip
00
00
00
00
00
00
01
Aff
othe
r 20
00
00
00
00
00
00
0A
ff ot
her 2
00
00
00
00
00
00
00
Units
Mar
ket h
ousi
ng0
04
55
55
55
55
047
purc
hase
d+4
QA
fford
able
soc
rent
00
00
00
00
00
00
4A
fford
able
sh
oshi
p0
00
00
00
00
00
01
Aff
othe
r 20
00
00
00
00
00
00
Aff
othe
r 20
00
00
00
00
00
00

Burn ley & Pendle Af fordable Housing Si te V iab i l i ty Update
Page 114
SITE P5 CASH FLOW AFFORDABLE
Yea
r 1Y
ear 2
Yea
r 3Y
ear 4
rate
Q1
Q2
Q3
Q4
Q1
Q2
Q3
Q4
Q1
Q2
Q3
Q4
Q1
Q2
Q3
Q4
Q4
TOTA
LS
INC
OM
E
Hous
ing
sale
sM
arke
t hou
sing
00
00
00
623
934
934
934
934
934
934
934
934
00
8,09
8A
fford
able
soc
rent
00
00
00
1929
2929
2929
2929
290
025
3A
fford
able
sh
oshi
p0
00
00
07
1010
1010
1010
1010
00
86A
ff ot
her 2
00
00
00
00
00
00
00
00
00
Aff
othe
r 20
00
00
00
00
00
00
00
00
0S
ales
fees
00
00
00
-22
-33
-33
-33
-33
-33
-33
-33
-33
00
-286
Tota
l inc
ome
00
00
00
649
973
973
973
973
973
973
973
973
00
8,43
7C
OST
S
Land
Land
acq
uisi
tion
504
504
Sta
mp
duty
2020
Pur
chas
e fe
es14
14To
tal
538
Build
cos
tsM
arke
t hou
sing
00
00
302
453
453
453
453
453
453
453
453
00
00
3,92
8A
fford
able
soc
rent
00
00
2740
4040
4040
4040
400
00
034
9A
fford
able
sh
oshi
p0
00
07
1010
1010
1010
1010
00
00
87A
ff ot
her 2
00
00
00
00
00
00
00
00
00
Aff
othe
r 20
00
00
00
00
00
00
00
00
0B
uild
con
tinge
ncy
5.0%
00
00
1725
2525
2525
2525
250
00
021
8To
tal
4,58
3De
v co
sts
Upf
ront
6.5%
7474
7474
298
Bui
ld re
late
d6.
5%0
023
3434
3434
3434
3434
00
00
029
8A
bnor
mal
s2%
5353
106
Tota
l70
2Fe
esFe
es o
n bu
ild c
osts
10.0
%0
00
035
5353
5353
5353
5353
00
00
458
Fees
on
dev
cost
s0.
0%0
00
00
00
00
00
00
00
00
0To
tal
458
PGP
lann
ing
gain
1219
1919
1919
1919
190
00
00
016
1To
tal
161
Oth
erP
lann
ing
£263
55
514
Sur
vey
£500
2626
Mar
ketin
g£0
00
00
00
00
00
00
00
00
Tota
l40
Sale
s fe
esb/
forw
ard
from
abo
ve0
00
00
022
3333
3333
3333
3333
00
286
Tota
l cos
ts69
713
211
412
744
163
565
766
866
866
866
861
561
533
330
06,
769
Net
pro
fit/lo
ss fr
om q
uart
er-6
97-1
32-1
14-1
27-4
41-6
35-8
306
306
306
306
359
359
940
940
00
1,66
8
Prof
it/lo
ss b
f fro
m la
st q
uarte
r0
-710
-858
-990
-1,1
38-1
,609
-2,2
85-2
,336
-2,0
68-1
,795
-1,5
17-1
,234
-892
-543
405
1,37
11,
371
Cum
ulat
ive
prof
it/lo
ss-6
97-8
42-9
72-1
,117
-1,5
79-2
,243
-2,2
93-2
,030
-1,7
62-1
,489
-1,2
11-8
75-5
3339
81,
346
1,37
11,
371
Inte
rest
Cha
rged
at
7.50
%7.
50%
7.50
%7.
50%
7.50
%7.
50%
7.50
%7.
50%
7.50
%7.
50%
7.50
%7.
50%
7.50
%7.
50%
7.50
%7.
50%
0.00
%0.
00%
Tota
l-1
3-1
6-1
8-2
1-3
0-4
2-4
3-3
8-3
3-2
8-2
3-1
6-1
07
250
0-2
98
Cum
ulat
ive
deve
lope
r pro
fit-7
10-8
58-9
90-1
,138
-1,6
09-2
,285
-2,3
36-2
,068
-1,7
95-1
,517
-1,2
34-8
92-5
4340
51,
371
1,37
11,
371
1,37
0ca
rrie
d fo
rwar
d to
RV
calc

Appendix 4 . F inanc ia l appra isa l summar ies
Page 115
SITE P6: Glen Mill Colne

Burn ley & Pendle Af fordable Housing Si te V iab i l i ty Update
Page 116
Inpu
t ass
umpt
ions
Scen
ario
& o
ptio
nA
fford
able
10%
= 8
% s
ocia
l ren
ted
2% in
term
edia
te
Bur
nley
& P
endl
e vi
abili
ty s
tudy
Dwel
lings
Site
det
ails
ave
floor
spa
cebu
ildsa
les
Site
PE6
Gle
n M
ill, N
orth
Val
ley
RdDw
ellin
gsgr
oss
net
cost
valu
eLo
catio
nC
OLN
Esq
ftsq
ftpe
r sq
ftpe
r sq
ftA
rea
h
a1.
24M
arke
t hou
sing
40.5
90.0
0%1,
050
1,05
083
.90
146.
00ac
res
3.06
0.0%
No
dwgs
45A
fford
able
soc
rent
3.6
8.00
%1,
050
1,05
083
.90
83.0
0D
ensi
ty d
w/h
a36
.30.
0%A
fford
able
sh
oshi
p0.
92.
00%
1,05
01,
050
83.9
010
8.00
0.0%
Aff
othe
r 20.
00.
00%
1,05
01,
050
83.9
00.
000.
0%A
ff ot
her 2
0.0
0.00
%0
083
.90
0.00
£kCo
ntin
genc
yTo
tal
45.0
100.
00%
47,2
5047
,250
£3,9
64,2
75£6
,624
,450
allo
wan
ce5.
00%
198
Floo
rspa
ce d
ensi
ty=
15,4
21ne
t sq
ft pe
r acr
e
Deve
lopm
ent c
osts
stan
dard
% b
uild
15.0
0%62
4O
ther
cos
tsP
lann
ing
515.
0£
per d
wel
ling
Sur
vey
500
£ pe
r dw
ellin
gpl
us a
bnor
mal
s4.
4%18
3
183
Mar
ketin
g0
£ pe
r dw
ellin
gTo
tal
19%
Desi
gn fe
eson
bui
ld c
osts
10.0
%41
6In
tere
st%
per
ann
um7.
50%
on d
ev c
osts
0%No
tes
Plan
ning
gai
n£
per d
wel
ling
3,10
014
0

Appendix 4 . F inanc ia l appra isa l summar ies
Page 117
SITE P6 LAND COST & PHASING

Burn ley & Pendle Af fordable Housing Si te V iab i l i ty Update
Page 118
Land
Itera
te to
ach
ieve
20.
0% p
rofit
Affo
rdab
leN
o af
ford
able
Affo
rdab
leN
o af
ford
able
Land
pur
chas
e pr
ice
£
-379
,154
-225
,100
RV
per a
cre
£-1
23,7
43-7
3,46
5-£
305,
769
-£18
1,53
2
Dev
pro
fit£
1,08
1,19
11,
149,
983
Tota
l cos
ts£
5,54
4,30
95,
749,
567
prof
it as
% o
f cos
ts19
.50%
20.0
0%
Hec
tare

Appendix 4 . F inanc ia l appra isa l summar ies
Page 119
Pro
gram
me
Yea
r 1Y
ear 2
Yea
r 3Y
ear 4
Q1
Q2
Q3
Q4
Q1
Q2
Q3
Q4
Q1
Q2
Q3
Q4
Q1
Q2
Q3
Q4
TOTA
LS
Units
Mar
ket h
ousi
ng2.
75.
45.
45.
45.
45.
45.
45.
40.
00.
00.
00.
00.
00.
040
.5st
arte
dA
fford
able
soc
rent
0.2
0.5
0.5
0.5
0.5
0.5
0.5
0.5
0.0
0.0
0.0
0.0
0.0
0.0
3.6
Affo
rdab
le s
h os
hip
0.1
0.1
0.1
0.1
0.1
0.1
0.1
0.1
0.0
0.0
0.0
0.0
0.0
0.0
0.9
Aff
othe
r 20.
00.
00.
00.
00.
00.
00.
00.
00.
00.
00.
00.
00.
00.
00.
0A
ff ot
her 2
0.0
0.0
0.0
0.0
0.0
0.0
0.0
0.0
0.0
0.0
0.0
0.0
0.0
0.0
0.0
TOTA
L0
03
66
66
66
60
00
00
045
.0
Units
Mar
ket h
ousi
ng0
03
55
55
55
50
00
041
'bui
lt' +2Q
Affo
rdab
le s
oc re
nt0
00
00
00
00
00
00
04
Affo
rdab
le s
h os
hip
00
00
00
00
00
00
00
1A
ff ot
her 2
00
00
00
00
00
00
00
0A
ff ot
her 2
00
00
00
00
00
00
00
0Un
itsM
arke
t hou
sing
00
35
55
55
55
00
041
com
plet
ed+3
QA
fford
able
soc
rent
00
00
00
00
00
00
04
Affo
rdab
le s
h os
hip
00
00
00
00
00
00
01
Aff
othe
r 20
00
00
00
00
00
00
0A
ff ot
her 2
00
00
00
00
00
00
00
Units
Mar
ket h
ousi
ng0
03
55
55
55
50
041
purc
hase
d+4
QA
fford
able
soc
rent
00
00
00
00
00
00
4A
fford
able
sh
oshi
p0
00
00
00
00
00
01
Aff
othe
r 20
00
00
00
00
00
00
Aff
othe
r 20
00
00
00
00
00
00
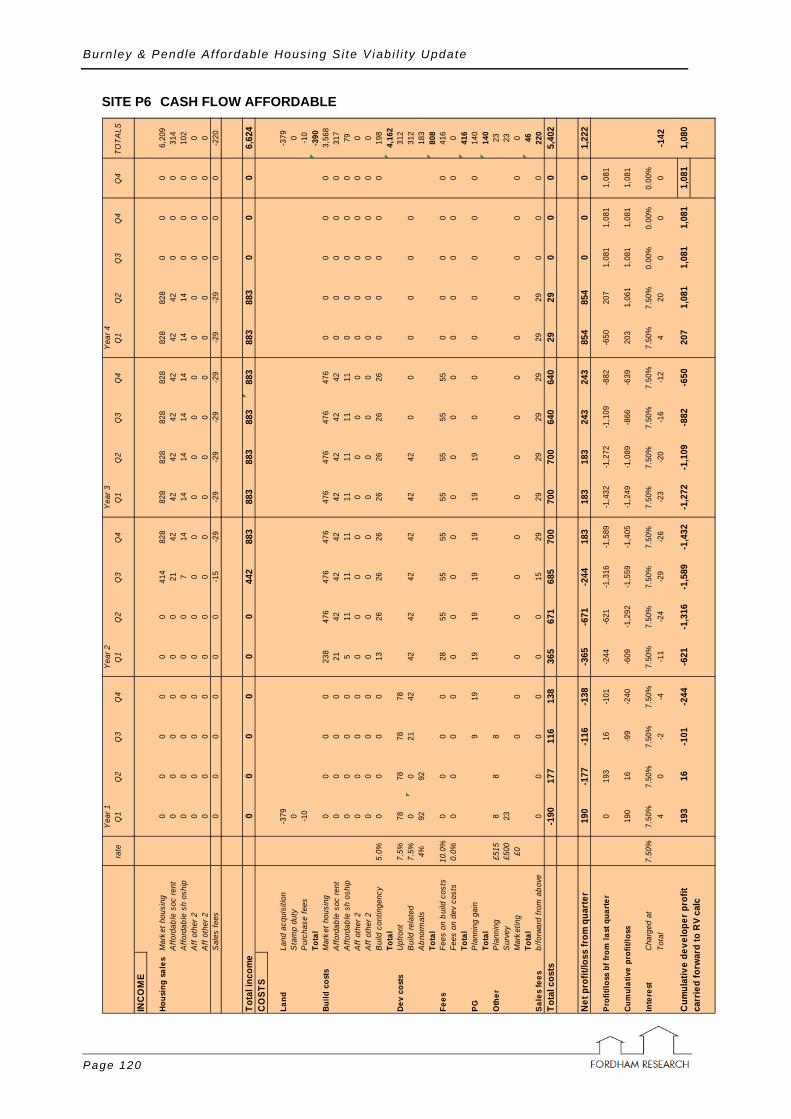
Burn ley & Pendle Af fordable Housing Si te V iab i l i ty Update
Page 120
SITE P6 CASH FLOW AFFORDABLE
Yea
r 1Y
ear 2
Yea
r 3Y
ear 4
rate
Q1
Q2
Q3
Q4
Q1
Q2
Q3
Q4
Q1
Q2
Q3
Q4
Q1
Q2
Q3
Q4
Q4
TOTA
LS
INC
OM
E
Hous
ing
sale
sM
arke
t hou
sing
00
00
00
414
828
828
828
828
828
828
828
00
06,
209
Affo
rdab
le s
oc re
nt0
00
00
021
4242
4242
4242
420
00
314
Affo
rdab
le s
h os
hip
00
00
00
714
1414
1414
1414
00
010
2A
ff ot
her 2
00
00
00
00
00
00
00
00
00
Aff
othe
r 20
00
00
00
00
00
00
00
00
0S
ales
fees
00
00
00
-15
-29
-29
-29
-29
-29
-29
-29
00
0-2
20
Tota
l inc
ome
00
00
00
442
883
883
883
883
883
883
883
00
06,
624
CO
STS
Land
Land
acq
uisi
tion
-379
-379
Sta
mp
duty
00
Pur
chas
e fe
es-1
0-1
0To
tal
-390
Build
cos
tsM
arke
t hou
sing
00
00
238
476
476
476
476
476
476
476
00
00
03,
568
Affo
rdab
le s
oc re
nt0
00
021
4242
4242
4242
420
00
00
317
Affo
rdab
le s
h os
hip
00
00
511
1111
1111
1111
00
00
079
Aff
othe
r 20
00
00
00
00
00
00
00
00
0A
ff ot
her 2
00
00
00
00
00
00
00
00
00
Bui
ld c
ontin
genc
y5.
0%0
00
013
2626
2626
2626
260
00
00
198
Tota
l4,
162
Dev
cost
sU
pfro
nt7.
5%78
7878
7831
2B
uild
rela
ted
7.5%
00
2142
4242
4242
4242
00
00
00
312
Abn
orm
als
4%92
9218
3To
tal
808
Fees
Fees
on
build
cos
ts10
.0%
00
00
2855
5555
5555
5555
00
00
041
6Fe
es o
n de
v co
sts
0.0%
00
00
00
00
00
00
00
00
00
Tota
l41
6PG
Pla
nnin
g ga
in9
1919
1919
1919
190
00
00
00
140
Tota
l14
0O
ther
Pla
nnin
g£5
158
88
23S
urve
y£5
0023
23M
arke
ting
£00
00
00
00
00
00
00
00
0To
tal
46Sa
les
fees
b/fo
rwar
d fro
m a
bove
00
00
00
1529
2929
2929
2929
00
022
0To
tal c
osts
-190
177
116
138
365
671
685
700
700
700
640
640
2929
00
05,
402
Net
pro
fit/lo
ss fr
om q
uart
er19
0-1
77-1
16-1
38-3
65-6
71-2
4418
318
318
324
324
385
485
40
00
1,22
2
Prof
it/lo
ss b
f fro
m la
st q
uarte
r0
193
16-1
01-2
44-6
21-1
,316
-1,5
89-1
,432
-1,2
72-1
,109
-882
-650
207
1,08
11,
081
1,08
1
Cum
ulat
ive
prof
it/lo
ss19
016
-99
-240
-609
-1,2
92-1
,559
-1,4
05-1
,249
-1,0
89-8
66-6
3920
31,
061
1,08
11,
081
1,08
1
Inte
rest
Cha
rged
at
7.50
%7.
50%
7.50
%7.
50%
7.50
%7.
50%
7.50
%7.
50%
7.50
%7.
50%
7.50
%7.
50%
7.50
%7.
50%
7.50
%0.
00%
0.00
%0.
00%
Tota
l4
0-2
-4-1
1-2
4-2
9-2
6-2
3-2
0-1
6-1
24
200
00
-142
Cum
ulat
ive
deve
lope
r pro
fit19
316
-101
-244
-621
-1,3
16-1
,589
-1,4
32-1
,272
-1,1
09-8
82-6
5020
71,
081
1,08
11,
081
1,08
11,
080
carr
ied
forw
ard
to R
V ca
lc

Appendix 4 . F inanc ia l appra isa l summar ies
Page 121
SITE P7: Warehouse Lane Foulridge
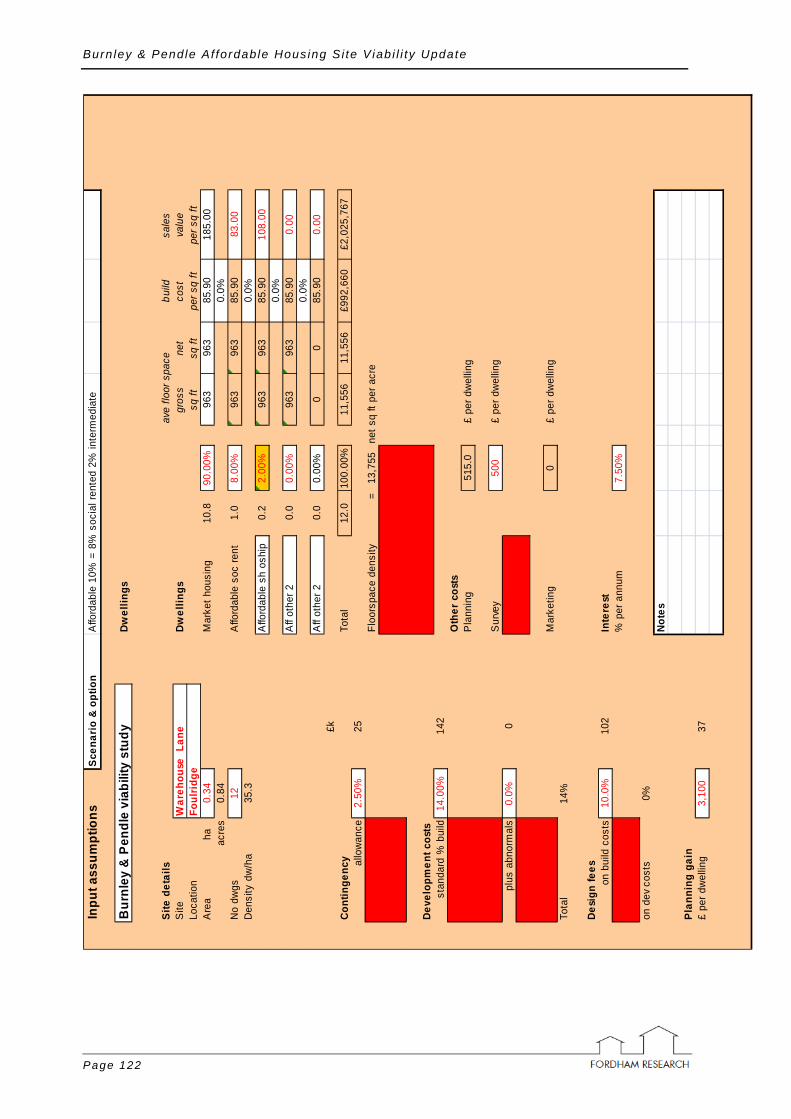
Burn ley & Pendle Af fordable Housing Si te V iab i l i ty Update
Page 122
Inpu
t ass
umpt
ions
Scen
ario
& o
ptio
nA
fford
able
10%
= 8
% s
ocia
l ren
ted
2% in
term
edia
te
Bur
nley
& P
endl
e vi
abili
ty s
tudy
Dwel
lings
Site
det
ails
ave
floor
spa
cebu
ildsa
les
Site
War
ehou
se L
ane
Dwel
lings
gros
sne
tco
stva
lue
Loca
tion
Foul
ridge
sq ft
sq ft
per s
q ft
per s
q ft
Are
a
ha
0.34
Mar
ket h
ousi
ng10
.890
.00%
963
963
85.9
018
5.00
acre
s0.
840.
0%N
o dw
gs12
Affo
rdab
le s
oc re
nt1.
08.
00%
963
963
85.9
083
.00
Den
sity
dw
/ha
35.3
0.0%
Affo
rdab
le s
h os
hip
0.2
2.00
%96
396
385
.90
108.
000.
0%A
ff ot
her 2
0.0
0.00
%96
396
385
.90
0.00
0.0%
Aff
othe
r 20.
00.
00%
00
85.9
00.
00£k
Cont
inge
ncy
Tota
l12
.010
0.00
%11
,556
11,5
56£9
92,6
60£2
,025
,767
allo
wan
ce2.
50%
25Fl
oors
pace
den
sity
=13
,755
net s
q ft
per a
cre
Deve
lopm
ent c
osts
stan
dard
% b
uild
14.0
0%14
2O
ther
cos
tsP
lann
ing
515.
0£
per d
wel
ling
Sur
vey
500
£ pe
r dw
ellin
gpl
us a
bnor
mal
s0.
0%0
Mar
ketin
g0
£ pe
r dw
ellin
gTo
tal
14%
Desi
gn fe
eson
bui
ld c
osts
10.0
%10
2In
tere
st%
per
ann
um7.
50%
on d
ev c
osts
0%No
tes
Plan
ning
gai
n£
per d
wel
ling
3,10
037

Appendix 4 . F inanc ia l appra isa l summar ies
Page 123
SITE P7 LAND COST & PHASING
Land
Itera
te to
ach
ieve
20.
0% p
rofit
Affo
rdab
leN
o af
ford
able
Affo
rdab
leN
o af
ford
able
Land
pur
chas
e pr
ice
£
227,
341
294,
624
RV
per a
cre
£27
0,59
935
0,68
5£6
68,6
51£8
66,5
42
Dev
pro
fit£
330,
581
356,
926
Tota
l cos
ts£
1,69
5,93
61,
781,
684
prof
it as
% o
f cos
ts19
.49%
20.0
3%
Hec
tare
Pro
gram
me
Yea
r 1Y
ear 2
Yea
r 3Y
ear 4
Q1
Q2
Q3
Q4
Q1
Q2
Q3
Q4
Q1
Q2
Q3
Q4
Q1
Q2
Q3
Q4
TOTA
LS
Units
Mar
ket h
ousi
ng2.
72.
72.
72.
70.
00.
00.
00.
00.
00.
00.
00.
00.
00.
010
.8st
arte
dA
fford
able
soc
rent
0.2
0.2
0.2
0.2
0.0
0.0
0.0
0.0
0.0
0.0
0.0
0.0
0.0
0.0
1.0
Affo
rdab
le s
h os
hip
0.1
0.1
0.1
0.1
0.0
0.0
0.0
0.0
0.0
0.0
0.0
0.0
0.0
0.0
0.2
Aff
othe
r 20.
00.
00.
00.
00.
00.
00.
00.
00.
00.
00.
00.
00.
00.
00.
0A
ff ot
her 2
0.0
0.0
0.0
0.0
0.0
0.0
0.0
0.0
0.0
0.0
0.0
0.0
0.0
0.0
0.0
TOTA
L0
03
33
30
00
00
00
00
012
.0
Units
Mar
ket h
ousi
ng0
03
33
30
00
00
00
011
'bui
lt' +2Q
Affo
rdab
le s
oc re
nt0
00
00
00
00
00
00
01
Affo
rdab
le s
h os
hip
00
00
00
00
00
00
00
0A
ff ot
her 2
00
00
00
00
00
00
00
0A
ff ot
her 2
00
00
00
00
00
00
00
0Un
itsM
arke
t hou
sing
00
33
33
00
00
00
011
com
plet
ed+3
QA
fford
able
soc
rent
00
00
00
00
00
00
01
Affo
rdab
le s
h os
hip
00
00
00
00
00
00
00
Aff
othe
r 20
00
00
00
00
00
00
0A
ff ot
her 2
00
00
00
00
00
00
00
Units
Mar
ket h
ousi
ng0
03
33
30
00
00
011
purc
hase
d+4
QA
fford
able
soc
rent
00
00
00
00
00
00
1A
fford
able
sh
oshi
p0
00
00
00
00
00
00
Aff
othe
r 20
00
00
00
00
00
00
Aff
othe
r 20
00
00
00
00
00
00

Burn ley & Pendle Af fordable Housing Si te V iab i l i ty Update
Page 124
SITE P7 CASH FLOW AFFORDABLE
Yea
r 1Y
ear 2
Yea
r 3Y
ear 4
rate
Q1
Q2
Q3
Q4
Q1
Q2
Q3
Q4
Q1
Q2
Q3
Q4
Q1
Q2
Q3
Q4
Q4
TOTA
LS
INC
OM
E
Hous
ing
sale
sM
arke
t hou
sing
00
00
00
481
481
481
481
00
00
00
01,
924
Affo
rdab
le s
oc re
nt0
00
00
019
1919
190
00
00
00
77A
fford
able
sh
oshi
p0
00
00
06
66
60
00
00
00
25A
ff ot
her 2
00
00
00
00
00
00
00
00
00
Aff
othe
r 20
00
00
00
00
00
00
00
00
0S
ales
fees
00
00
00
-17
-17
-17
-17
00
00
00
0-6
8
Tota
l inc
ome
00
00
00
506
506
506
506
00
00
00
02,
026
CO
STS
Land
Land
acq
uisi
tion
227
227
Sta
mp
duty
22
Pur
chas
e fe
es6
6To
tal
236
Build
cos
tsM
arke
t hou
sing
00
00
223
223
223
223
00
00
00
00
089
3A
fford
able
soc
rent
00
00
2020
2020
00
00
00
00
079
Affo
rdab
le s
h os
hip
00
00
55
55
00
00
00
00
020
Aff
othe
r 20
00
00
00
00
00
00
00
00
0A
ff ot
her 2
00
00
00
00
00
00
00
00
00
Bui
ld c
ontin
genc
y2.
5%0
00
06
66
60
00
00
00
00
25To
tal
1,01
7De
v co
sts
Upf
ront
7.0%
1818
1818
71B
uild
rela
ted
7.0%
00
1818
1818
00
00
00
00
00
71A
bnor
mal
s0%
00
0To
tal
142
Fees
Fees
on
build
cos
ts10
.0%
00
00
2525
2525
00
00
00
00
010
2Fe
es o
n de
v co
sts
0.0%
00
00
00
00
00
00
00
00
00
Tota
l10
2PG
Pla
nnin
g ga
in9
99
90
00
00
00
00
00
37To
tal
37O
ther
Pla
nnin
g£5
152
22
6S
urve
y£5
006
6M
arke
ting
£00
00
00
00
00
00
00
00
0To
tal
12Sa
les
fees
b/fo
rwar
d fro
m a
bove
00
00
00
1717
1717
00
00
00
068
Tota
l cos
ts26
220
4745
307
307
297
297
1717
00
00
00
01,
615
Net
pro
fit/lo
ss fr
om q
uart
er-2
62-2
0-4
7-4
5-3
07-3
0721
021
048
948
90
00
00
00
411
Prof
it/lo
ss b
f fro
m la
st q
uarte
r0
-267
-292
-345
-397
-717
-1,0
43-8
49-6
51-1
6533
133
133
133
133
133
133
1
Cum
ulat
ive
prof
it/lo
ss-2
62-2
86-3
39-3
90-7
04-1
,024
-834
-640
-162
324
331
331
331
331
331
331
331
Inte
rest
Cha
rged
at
7.50
%7.
50%
7.50
%7.
50%
7.50
%7.
50%
7.50
%7.
50%
7.50
%7.
50%
7.50
%0.
00%
0.00
%0.
00%
0.00
%0.
00%
0.00
%0.
00%
Tota
l-5
-5-6
-7-1
3-1
9-1
6-1
2-3
60
00
00
00
-81
Cum
ulat
ive
deve
lope
r pro
fit-2
67-2
92-3
45-3
97-7
17-1
,043
-849
-651
-165
331
331
331
331
331
331
331
331
330
carr
ied
forw
ard
to R
V ca
lc

Appendix 4 . F inanc ia l appra isa l summar ies
Page 125
SITE P8: Garage site Earby

Burn ley & Pendle Af fordable Housing Si te V iab i l i ty Update
Page 126
Inpu
t ass
umpt
ions
Scen
ario
& o
ptio
nA
fford
able
10%
= 8
% s
ocia
l ren
ted
2% in
term
edia
te
Bur
nley
& P
endl
e vi
abili
ty s
tudy
Dwel
lings
Site
det
ails
ave
floor
spa
cebu
ildsa
les
Site
PE8
Gar
age
Site
New
Roa
dDw
ellin
gsgr
oss
net
cost
valu
eLo
catio
nEA
RBY
sq ft
sq ft
per s
q ft
per s
q ft
Are
a
ha
0.63
Mar
ket h
ousi
ng31
.590
.00%
865
846
85.5
014
0.00
acre
s1.
560.
0%N
o dw
gs35
Affo
rdab
le s
oc re
nt2.
88.
00%
865
846
85.5
082
.00
Den
sity
dw
/ha
55.6
0.0%
Affo
rdab
le s
h os
hip
0.7
2.00
%86
584
685
.50
108.
000.
0%A
ff ot
her 2
0.0
0.00
%86
584
685
.50
0.00
0.0%
Aff
othe
r 20.
00.
00%
00
85.5
00.
00£k
Cont
inge
ncy
Tota
l35
.010
0.00
%30
,275
29,6
10£2
,588
,513
£3,9
89,0
59al
low
ance
5.00
%12
9Fl
oors
pace
den
sity
=19
,021
net s
q ft
per a
cre
Deve
lopm
ent c
osts
stan
dard
% b
uild
13.0
0%35
3O
ther
cos
tsP
lann
ing
515.
0£
per d
wel
ling
Sur
vey
500
£ pe
r dw
ellin
gpl
us a
bnor
mal
s3.
8%10
3
Mar
ketin
g0
£ pe
r dw
ellin
gTo
tal
17%
Desi
gn fe
eson
bui
ld c
osts
10.0
%27
2In
tere
st%
per
ann
um7.
50%
on d
ev c
osts
0%No
tes
Plan
ning
gai
n£
per d
wel
ling
3,10
010
9

Appendix 4 . F inanc ia l appra isa l summar ies
Page 127
SITE P8 LAND COST & PHASING
Land
Itera
te to
ach
ieve
20.
0% p
rofit
Affo
rdab
leN
o af
ford
able
Affo
rdab
leN
o af
ford
able
Land
pur
chas
e pr
ice
£
-430
,227
-342
,267
RV
per a
cre
£-2
76,3
66-2
19,8
63-£
682,
900
-£54
3,28
1
Dev
pro
fit£
651,
279
691,
172
Tota
l cos
ts£
3,33
8,75
53,
455,
203
prof
it as
% o
f cos
ts19
.51%
20.0
0%
Hec
tare
Pro
gram
me
Yea
r 1Y
ear 2
Yea
r 3Y
ear 4
Q1
Q2
Q3
Q4
Q1
Q2
Q3
Q4
Q1
Q2
Q3
Q4
Q1
Q2
Q3
Q4
TOTA
LS
Units
Mar
ket h
ousi
ng4.
54.
54.
54.
54.
54.
54.
50.
00.
00.
00.
00.
00.
00.
031
.5st
arte
dA
fford
able
soc
rent
0.4
0.4
0.4
0.4
0.4
0.4
0.4
0.0
0.0
0.0
0.0
0.0
0.0
0.0
2.8
Affo
rdab
le s
h os
hip
0.1
0.1
0.1
0.1
0.1
0.1
0.1
0.0
0.0
0.0
0.0
0.0
0.0
0.0
0.7
Aff
othe
r 20.
00.
00.
00.
00.
00.
00.
00.
00.
00.
00.
00.
00.
00.
00.
0A
ff ot
her 2
0.0
0.0
0.0
0.0
0.0
0.0
0.0
0.0
0.0
0.0
0.0
0.0
0.0
0.0
0.0
TOTA
L0
05
55
55
55
00
00
00
035
.0
Units
Mar
ket h
ousi
ng0
05
55
55
55
00
00
032
'bui
lt' +2Q
Affo
rdab
le s
oc re
nt0
00
00
00
00
00
00
03
Affo
rdab
le s
h os
hip
00
00
00
00
00
00
00
1A
ff ot
her 2
00
00
00
00
00
00
00
0A
ff ot
her 2
00
00
00
00
00
00
00
0Un
itsM
arke
t hou
sing
00
55
55
55
50
00
032
com
plet
ed+3
QA
fford
able
soc
rent
00
00
00
00
00
00
03
Affo
rdab
le s
h os
hip
00
00
00
00
00
00
01
Aff
othe
r 20
00
00
00
00
00
00
0A
ff ot
her 2
00
00
00
00
00
00
00
Units
Mar
ket h
ousi
ng0
05
55
55
55
00
032
purc
hase
d+4
QA
fford
able
soc
rent
00
00
00
00
00
00
3A
fford
able
sh
oshi
p0
00
00
00
00
00
01
Aff
othe
r 20
00
00
00
00
00
00
Aff
othe
r 20
00
00
00
00
00
00

Burn ley & Pendle Af fordable Housing Si te V iab i l i ty Update
Page 128
SITE P8 CASH FLOW AFFORDABLE
Yea
r 1Y
ear 2
Yea
r 3Y
ear 4
rate
Q1
Q2
Q3
Q4
Q1
Q2
Q3
Q4
Q1
Q2
Q3
Q4
Q1
Q2
Q3
Q4
Q4
TOTA
LS
INC
OM
E
Hous
ing
sale
sM
arke
t hou
sing
00
00
00
533
533
533
533
533
533
533
00
00
3,73
1A
fford
able
soc
rent
00
00
00
2828
2828
2828
280
00
019
4A
fford
able
sh
oshi
p0
00
00
09
99
99
99
00
00
64A
ff ot
her 2
00
00
00
00
00
00
00
00
00
Aff
othe
r 20
00
00
00
00
00
00
00
00
0S
ales
fees
00
00
00
-19
-19
-19
-19
-19
-19
-19
00
00
-133
Tota
l inc
ome
00
00
00
570
570
570
570
570
570
570
00
00
3,98
9C
OST
S
Land
Land
acq
uisi
tion
-430
-430
Sta
mp
duty
00
Pur
chas
e fe
es-1
2-1
2To
tal
-442
Build
cos
tsM
arke
t hou
sing
00
00
333
333
333
333
333
333
333
00
00
00
2,33
0A
fford
able
soc
rent
00
00
3030
3030
3030
300
00
00
020
7A
fford
able
sh
oshi
p0
00
07
77
77
77
00
00
00
52A
ff ot
her 2
00
00
00
00
00
00
00
00
00
Aff
othe
r 20
00
00
00
00
00
00
00
00
0B
uild
con
tinge
ncy
5.0%
00
00
1818
1818
1818
180
00
00
012
9To
tal
2,71
8De
v co
sts
Upf
ront
6.5%
4444
4444
177
Bui
ld re
late
d6.
5%0
025
2525
2525
2525
00
00
00
017
7A
bnor
mal
s4%
5252
103
Tota
l45
7Fe
esFe
es o
n bu
ild c
osts
10.0
%0
00
039
3939
3939
3939
00
00
00
272
Fees
on
dev
cost
s0.
0%0
00
00
00
00
00
00
00
00
0To
tal
272
PGP
lann
ing
gain
1616
1616
1616
160
00
00
00
010
9To
tal
109
Oth
erP
lann
ing
£515
66
618
Sur
vey
£500
1818
Mar
ketin
g£0
00
00
00
00
00
00
00
00
Tota
l36
Sale
s fe
esb/
forw
ard
from
abo
ve0
00
00
019
1919
1919
1919
00
00
133
Tota
l cos
ts-3
2310
291
8546
846
848
748
748
744
644
619
190
00
03,
281
Net
pro
fit/lo
ss fr
om q
uart
er32
3-1
02-9
1-8
5-4
68-4
6883
8383
124
124
551
551
00
00
708
Prof
it/lo
ss b
f fro
m la
st q
uarte
r0
329
231
143
59-4
16-9
00-8
32-7
63-6
93-5
80-4
6488
651
651
651
651
Cum
ulat
ive
prof
it/lo
ss32
322
714
058
-408
-884
-817
-749
-680
-569
-456
8763
965
165
165
165
1
Inte
rest
Cha
rged
at
7.50
%7.
50%
7.50
%7.
50%
7.50
%7.
50%
7.50
%7.
50%
7.50
%7.
50%
7.50
%7.
50%
7.50
%7.
50%
0.00
%0.
00%
0.00
%0.
00%
Tota
l6
43
1-8
-17
-15
-14
-13
-11
-92
120
00
0-5
8
Cum
ulat
ive
deve
lope
r pro
fit32
923
114
359
-416
-900
-832
-763
-693
-580
-464
8865
165
165
165
165
165
0ca
rrie
d fo
rwar
d to
RV
calc