building safe routes to school spring 2014. goals of safe routes to school create opportunities and...
TRANSCRIPT

BUILDING SAFE ROUTES TO SCHOOLSPRING 2014

Goals of Safe Routes To School• Create opportunities and increase the number of children
who actively commute to and from school which will... • Enhance children's health and well being by adding physical
activity to their day and help in weight maintenance.• Ease traffic congestion in school zones and neighborhoods. • Build a stronger sense of community within elementary.

National Research shows:• National commuting rates suggest 14-19% of children
actively commute to and from school (Ham et al, 2005). • 35 years ago, 42% of children walk/bike to school
• In our nation, the majority of short trips are taken in cars. 25% of trips are less than 1 mile and 75% are taken by car (Frumpkin, 2002).
• 0.5 miles for children in grades K-5 is considered as feasible walking distance (D’haese et al., 2011).

• About 1/3 of students were potential active commuters, living within 0.5 mile of school (Heelan et al., 2013).• 40.2% of students living within a 0.5 mile of school
was a commuted to school by car or bus.• The potential active commuter lived 0.34±0.1 mile
away on average

Results from Parents-March 2014
• 30%- 35% of parents at each school completed the survey

Distance from child’s home to school
* 59% of responders lived within ½ mile which is reasonable walking distance
Less than 1/4 mile
1/4 up to 1/2 mile 1/2 mile to 1 mile 1 mile to 2 miles More than 2 miles
0%
5%
10%
15%
20%
25%
30%
35% 33%
26%
15%
10%
17%

Typical mode of arrival to and from school
17-25% of students are active commuting
Walk Bike School Bus
Family Vehicle
Carpool Transit Other0%
10%
20%
30%
40%
50%
60%
70%
80%
12%
4% 4%
74%
5%1% 0%
21%
4%6%
60%
7%
2%
Morning
Departure

School Arrival
Distance Walk Bike School Bus Family Vehicle
Carpool Transit Other
Less than ¼ mile
24% 6% 0% 65% 5% 0% 0%
¼ mile to ½ mile
12% 7% 2% 68% 8% 2% 1%
½ mile to 1 mile
7% 0% 0% 86% 5% 2% 0%
1 mile to 2 miles
0% 0% 3% 90% 8% 0% 0%
More than 2 miles
0% 0% 20% 78% 2% 0% 0%
Distance Walk Bike School Bus
Family Vehicle
Carpool Transit Other
Less than ¼ mile
41% 6% 0% 45% 6% 2% 0%
¼ mile to ½ mile
19% 7% 3% 55% 12% 3% 1%
½ mile to 1 mile
12% 0% 0% 79% 7% 2% 0%
1 mile to 2 miles
0% 0% 5% 85% 10% 0% 0%
More than 2 miles
3% 0% 31% 63% 2% 2% 0%
School Departure

Percent of children who have asked permission to walk or bike to/from school by distance they lived from school
30%-47% of children are active communing
19%-26% of children are active commuting
Less than 1/4 mile
1/4 up to 1/2 mile
1/2 mile up to 1 mile
1 mile to 2 miles
More than 2 miles
0%
10%
20%
30%
40%
50%
60%
70%
80%
90%85%
83%
71%
58%
15%
Per
cen
t o
f C
hil
dre
n (
%)

Top Barriers Reported by Parents:Barrier Percent of children who do
not actively commutePercent of children who
actively commute
1. Weather or Climate 48% 75%
2. Amount of Traffic Along Route
61% 51%
2. Safety of Intersections and Crossings
57% 53%
4. Distance 48% 56%
5. Speed of Traffic Along Routes
59% 44%
6. Sidewalks or Pathways 24% 41%
7. Violence or Crime 28% 18%
8. Time 10% 29%
9. Adults to Bike/Walk With 20% 18%
10. Child’s Participation in After School Programs
8% 24%
11. Crossing Guards 17% 12%
12. Convenience of Driving 10% 12%

How do we overcome and work through barriers?
• Safety of Intersections and crossings-• Student/volunteer crossing guards• Parent, neighbor, or staff volunteers• What are current volunteers helping with?
• Amount of traffic along route-• Research shows 40.2% of students were passive commuters living
within ½ mile of school. • This increases traffic congestion and safety concerns. Ironically, it is a
primary reason why parents do not allow walking or biking to school (Heelan et al., 2013).
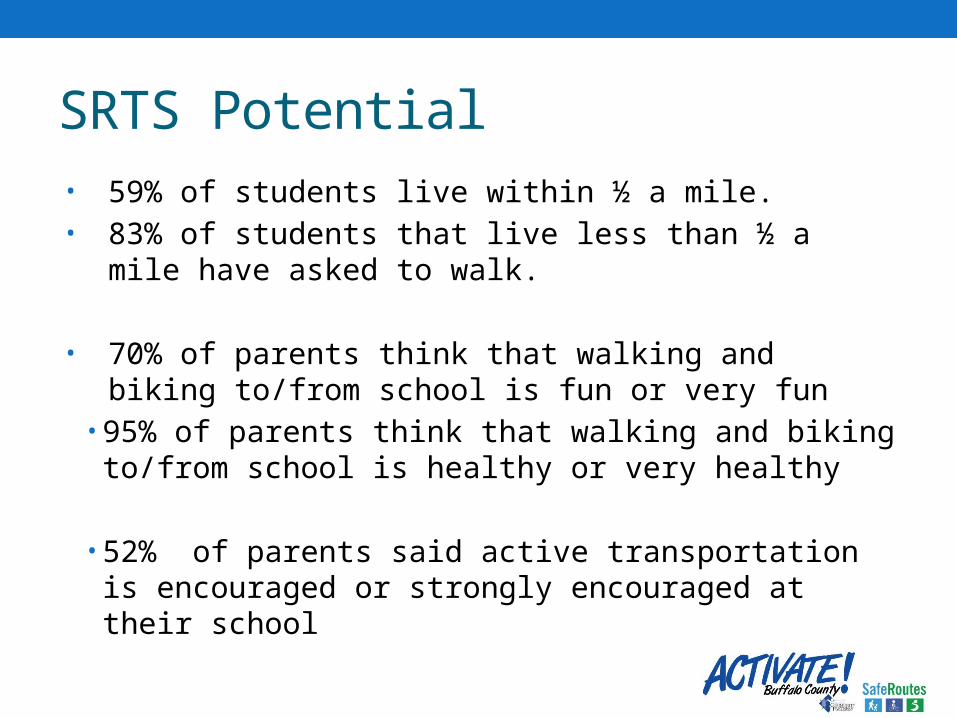
SRTS Potential• 59% of students live within ½ a mile.• 83% of students that live less than ½ a mile have asked
to walk.
• 70% of parents think that walking and biking to/from school is fun or very fun
• 95% of parents think that walking and biking to/from school is healthy or very healthy
• 52% of parents said active transportation is encouraged or strongly encouraged at their school

Possible solutions:• Create drop-off points that are supervised to allow
children to walk to school in groups• This in turn will decrease the amount of traffic around the school
during drop off and pick up times.
• Student/volunteer safety crossing guards at intersections
• Walking School Bus• Can lessen barriers associated with walking to school• Active commuting with peers or adult supervision

Moving forward• Developing partnerships to accomplish our goals
• Team with the great efforts of the wellness team• Other partners to bring around the table?
• Strategies to Implement Possible Solutions• Planning Back to School Kick off• Developing Incentives
