building fiscal performance graphs and forecasting...
TRANSCRIPT

Building Fiscal Performance Graphsand Forecasting Techniques
User Guide
February 2016

The opinions expressed in this guide are those of the authors and do not necessarily represent the views of the Department for
International Development.
Contents
1 Introduction and Context . . . . . . . . . . . . . . . . . . . . . . . . . . . . . . . . . . . . . . . . . . . . . . . . . . . . . . . . . . . . . . . . . . . . . . . . . . . . . . . . . . . . . . . . . .3
1.1 Introduction . . . . . . . . . . . . . . . . . . . . . . . . . . . . . . . . . . . . . . . . . . . . . . . . . . . . . . . . . . . . . . . . . . . . . . . . . . . . . . . . . . . . . . . . . . . . . . . . . . .3
1.2 Context – Best Practice in Budget Preparation . . . . . . . . . . . . . . . . . . . . . . . . . . . . . . . . . . . . . . . . . . . . . . . . . . . . . . . . . . . . . . . . . . . .3
2 Fiscal Performance Analysis . . . . . . . . . . . . . . . . . . . . . . . . . . . . . . . . . . . . . . . . . . . . . . . . . . . . . . . . . . . . . . . . . . . . . . . . . . . . . . . . . . . . . . .6
2.1 Data Collection and Validation . . . . . . . . . . . . . . . . . . . . . . . . . . . . . . . . . . . . . . . . . . . . . . . . . . . . . . . . . . . . . . . . . . . . . . . . . . . . . . . . . .6
2.2Graphical Representation . . . . . . . . . . . . . . . . . . . . . . . . . . . . . . . . . . . . . . . . . . . . . . . . . . . . . . . . . . . . . . . . . . . . . . . . . . . . . . . . . . . . . . .7
2.3 Written Analysis . . . . . . . . . . . . . . . . . . . . . . . . . . . . . . . . . . . . . . . . . . . . . . . . . . . . . . . . . . . . . . . . . . . . . . . . . . . . . . . . . . . . . . . . . . . . . .10
3 Fiscal Forecasting . . . . . . . . . . . . . . . . . . . . . . . . . . . . . . . . . . . . . . . . . . . . . . . . . . . . . . . . . . . . . . . . . . . . . . . . . . . . . . . . . . . . . . . . . . . . . . . . .11
3.1 Data Collection and Validation . . . . . . . . . . . . . . . . . . . . . . . . . . . . . . . . . . . . . . . . . . . . . . . . . . . . . . . . . . . . . . . . . . . . . . . . . . . . . . . . .11
3.2 Generating Forecasts . . . . . . . . . . . . . . . . . . . . . . . . . . . . . . . . . . . . . . . . . . . . . . . . . . . . . . . . . . . . . . . . . . . . . . . . . . . . . . . . . . . . . . . . . .12
3.2.1 Moving Average . . . . . . . . . . . . . . . . . . . . . . . . . . . . . . . . . . . . . . . . . . . . . . . . . . . . . . . . . . . . . . . . . . . . . . . . . . . . . . . . . . . . . . . . .12
3.2.2 Incremental . . . . . . . . . . . . . . . . . . . . . . . . . . . . . . . . . . . . . . . . . . . . . . . . . . . . . . . . . . . . . . . . . . . . . . . . . . . . . . . . . . . . . . . . . . . . .17
3.2.3 Elasticity . . . . . . . . . . . . . . . . . . . . . . . . . . . . . . . . . . . . . . . . . . . . . . . . . . . . . . . . . . . . . . . . . . . . . . . . . . . . . . . . . . . . . . . . . . . . . . .18
3.3 Graphical Representation . . . . . . . . . . . . . . . . . . . . . . . . . . . . . . . . . . . . . . . . . . . . . . . . . . . . . . . . . . . . . . . . . . . . . . . . . . . . . . . . . . . . . .21
3.4Analysis of Forecasts and Proposal . . . . . . . . . . . . . . . . . . . . . . . . . . . . . . . . . . . . . . . . . . . . . . . . . . . . . . . . . . . . . . . . . . . . . . . . . . . . .24

www.sparc-nigeria.com
Glossary
BS Balance Sheet (Statement of Assets and Liabilities)
CDF Capital Development Fund
CRF Consolidated Revenue Fund
EFU-FSP-BPS Economic and Fiscal Update, Fiscal Strategy Paper, Budget Policy Statement
FAAC Federation Accounts Allocation Committee
GPFS General Purpose Financial Statements
IPSAS International Public Sector Accounting Standards
MDA Ministries, Departments and Agencies
MTEF Medium Term Expenditure Framework
MTFF Medium Term Fiscal Framework
NCOA National Chart of Accounts
SPARC State Partnership for Accountability, Responsiveness and Capability
Note: This user guide is accompanied by six spreadsheets for practice and practical use:

3www.sparc-nigeria.com
1. Introduction and Context
1.1 Introduction
The DFID SPARC programme has developed various tools to support budget preparation at state and local government
including:
n GREAT – the Government Resource Estimation and Allocation Tool;
n LgRET – the Local government Revenue Estimation Tool; and
n RPT – the Revenue Projection Tool.
These tools have MS Excel based models that have in-built graphs and forecasting models that support:
n Fiscal Performance Analysis; and
n Fiscal Forecasting.
These guidelines show the step by step process in MS Excel to build the above graphs and models, and are accompanied by six
MS Excel files – three files that are the base data for the purposes of training / practice on building graphs and forecasting
models:
n 1.1 - Fiscal Performance Analysis - Raw Data Set
n 2.1.A - Revenue Forecasting - Raw Data Set (6 Years Data)
n 2.1.B - Revenue Forecasting - Raw Data Set (4 Years Data)
And three files that are the final built versions:
n 1.2 – Fiscal Performance Analysis - Raw Data and Graph
n 2.2.A – Revenue Forecasting - Forecasts and Graph (6 Years Data)
n 2.2.B – Revenue Forecasting - Forecasts and Graph (4 Years Data)
These guidelines provide a step-by-step process of producing the outputs, and then to analyse the outputs.
1.2 Context – Best Practice in Budget Preparation
Both multi-year (Medium Term Expenditure Framework - MTEF) and annual budget process are described in the diagram below,
including the key linkage to the policy framework.

www.sparc-nigeria.com4
An important pre-condition for developing a comprehensive medium term budgeting process is that a Policy Framework is in
place that includes a National Development Plan / Strategy that is regularly updated. This is the overarching basis on which
sector strategies and resource allocations should be made.
The MTEF process itself can be considered in two areas:
n Top Down Budgeting;
n Bottom Up Budgeting.
The Top Down proportion of the budget, which should kick start the budget preparation process, ordinarily consists of two key
stages - firstly the estimation of the overall resource envelope (Fiscal Framework), and secondly, to split the envelope by sector
or MDA (usually referred to as the Medium Term Budget Framework). These are the two key components captured within the
Economic Fiscal Update (EFU), Fiscal Strategy Paper (FSP) and Budget Policy Statement (BPS) documentation.
The Fiscal Framework, which might be referred to as a Medium Term Fiscal Framework (MTFF), is the first stage of the top down
budgeting process. Prior to the development of the Fiscal Framework, a backwards looking review of fiscal (state, budget vs.
actual for the major revenue and expenditure items) and economic performance (global, national and state) should be undertaken
- typically referred to as an Economic and Fiscal Update. This provides the key context for the forward looking Fiscal Strategy
and is key in informing the decisions on both the factors that affect the overall budget size (MTFF) and the allocations by sectors
(MTBF).
The Fiscal Strategy Paper starts with the key fiscal targets (debt ratios, revenue and expenditure growth targets and constraints,
and others) that underpin the Fiscal Framework, and then the key forecasts for revenue and expenditure aggregates for three
Figure 1: Best Practice Budget Preparation Process

5www.sparc-nigeria.com
years based on the statistical modelling. This should also include a section on Fiscal Risks.
The Budget Policy Statement starts with the key budget policy objectives in terms of where resources should be focussed, followed
by the numerical Medium term Budget Framework (MTBF), which as above essentially splits the overall envelope into sector
envelopes. This should be based both on the policy priorities of government and also taking into consideration historical trends
in expenditure by sector, on-going projects, and sources of external grant and loan funding. These three-year envelopes should
be the basis for updating of the Medium Term Sector Strategies (MTSSs), and subsequently the basis for the annual budget
ceilings. Also within the BPS, considerations might be given to some of the following:
n Criteria for including capital projects in the budget;
n Ceiling for increments to Personnel and Overheads;
n Any other key considerations that might be included in the Budget Call Circular.
The diagram below summarises the relationship between the MTFF, the MTBF and the MTSSs.
Both the Fiscal Framework and the Sectoral Allocations should be presented to Executive Council and the State House of
Assembly as part of the EFU-FSP-BPS document (or an executive summary of the document). The EFU-FSP-BPS should be
prepared as a publishable document, underpinned by sound statistical modelling and policy based decision making.
The Bottom Up budgeting process should commence with a review, at sector/MDA level, of prior year performance. Once the
sector envelopes (MTBF) are provided through the EFU-FSP, an update to the MTSS itself should be prepared.
The EFU and FSP also feed directly into the preparation of a Budget Policy Statement (BPS) which has a single perspective. It
describes the policy thrust of government and also provides more detailed single year envelopes that form the basis of the annual
budget call circular, as well as other key issues that should be considered by MDAs when preparing the annual budgets.
The MTEF process above should lay the key foundations for the Annual Budget Process - both via the Budget Call Circular and
through the work of the sectors to update their strategies, programmes and projects within the resource envelope. With several
months having transpired since the development of the EFU-FSP-BPS, including potentially a six-month review of the current
budget year, updated revenue estimates will inform the final annual budget ceilings, either by MDA or Sector. These feed into
the annual Budget Call Circular which formally commences the annual budget preparation.
Figure 2: Relationship between MTFF, MTBF and MTSSs

www.sparc-nigeria.com6
2. Fiscal Performance Analysis
There are three key stages to undertaking a Fiscal Performance analysis:
a) Data Collection and Validation;
b) Presentation of Fiscal Performance data in Graphical format; and
c) Written Analysis.
The sub-sections below provide guidance on how to prepare fiscal performance analysis.
2.1 Data Collection and Validation
Data on Fiscal Performance will usual involve budget data and accounts data, and should be for a minimum of three years, and
a maximum of 7 years. Budget data should normally be the “original” budget not “revised” or “supplementary” budgets as the
performance assessment is trying to analyse our ability to make ex-ante forecasts.
The usual source of budget data will be the published (online or hard copy) budget book / approved appropriations.
Data on accounts, or actual performance, will ideally come from audited financial statements. Alternatively, if audited financial
statements are not available, then Accountant General’s report or final performance figures (perhaps from Treasury, Department
of Final Accounts or equivalent) will suffice.
Most importantly, the sources of data must always be noted in report / analysis. Data should be compiled into a spreadsheet
(e.g. Microsoft Excel) as per the example in data file 1.1. (see below screen shot):
Notice that the format of the cells is a Currency, with no decimals.
Figure 3: Screen Shot – Fiscal Performance Data
7www.sparc-nigeria.com
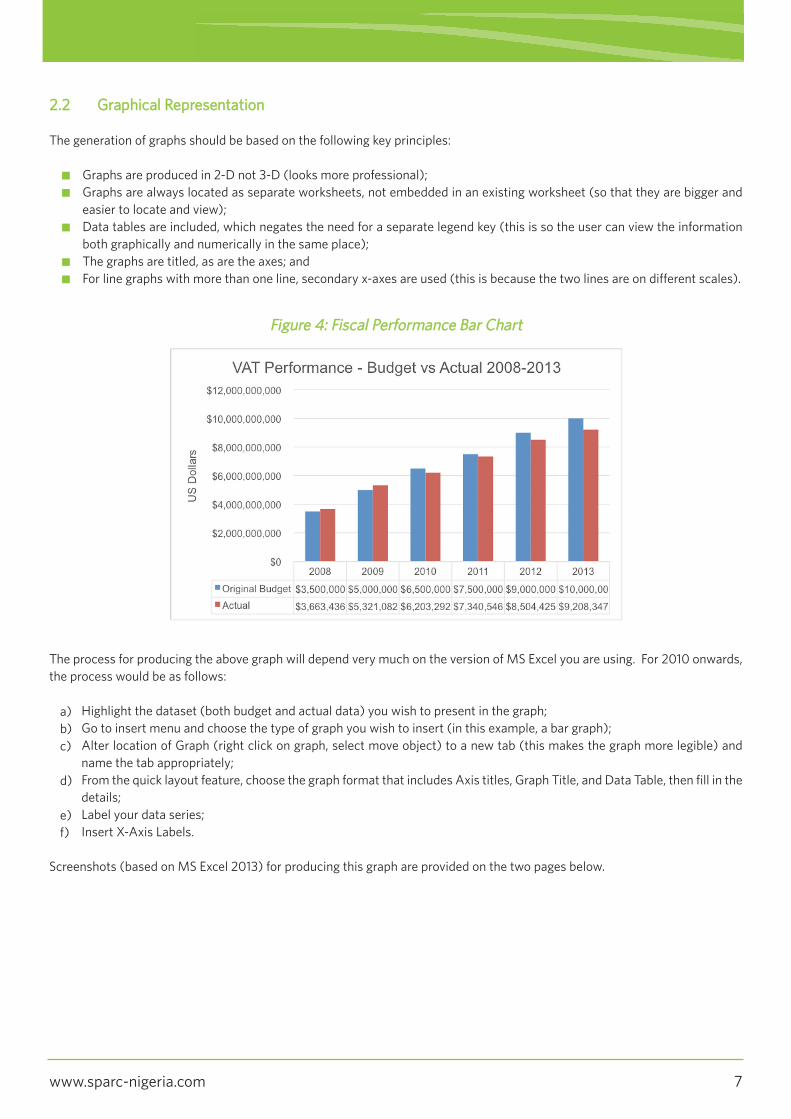
2.2 Graphical Representation
The generation of graphs should be based on the following key principles:
Graphs are produced in 2-D not 3-D (looks more professional);
Graphs are always located as separate worksheets, not embedded in an existing worksheet (so that they are bigger and
easier to locate and view);
Data tables are included, which negates the need for a separate legend key (this is so the user can view the information
both graphically and numerically in the same place);
The graphs are titled, as are the axes; and
For line graphs with more than one line, secondary x-axes are used (this is because the two lines are on different scales).
The process for producing the above graph will depend very much on the version of MS Excel you are using. For 2010 onwards,
the process would be as follows:
Highlight the dataset (both budget and actual data) you wish to present in the graph;
Go to insert menu and choose the type of graph you wish to insert (in this example, a bar graph);
Alter location of Graph (right click on graph, select move object) to a new tab (this makes the graph more legible) and
name the tab appropriately;
From the quick layout feature, choose the graph format that includes Axis titles, Graph Title, and Data Table, then fill in the
details;
Label your data series;
Insert X-Axis Labels.
Screenshots (based on MS Excel 2013) for producing this graph are provided on the two pages below.
Figure 4: Fiscal Performance Bar Chart
n
n
n
n
n
a)
b)
c)
d)
e)
f)

www.sparc-nigeria.com8
Figure 5: Step-by-Step Guide to Producing Fiscal Performance Graph
Highlight the dataset Go to insert menu and choose the type of graph you wish to
insert (in this example, a bar graph)
Right click on graph to alter location (Move Chart) To a new sheet (this make the graph more legible) and name
the tab appropriately
From the quick layout feature, choose the graph format that
includes Axis titles, Graph Title, and Data Table
Label your data series – right click on graph and go to “Select
Data”

9www.sparc-nigeria.com
Label your data series (Menu) Label your data series (menu continued)
Label your data series (Title) Label your data series (Data)
Label your X-Axis Label your X-Axis (selection of labels)
Other versions of MS Excel will differ slightly (MS Excel 2007 slightly, 2003 and earlier significantly), as will other spreadsheet
software.

www.sparc-nigeria.com10
2.3 Written Analysis
Performance Analysis - It should start with an examination of budget performance during the previous year, and considers the
extent to which actual revenue and expenditure has deviated from budgeted levels. The analysis should focus on:
What is the source of the revenue or nature of the expenditure (if not obvious from its title);
The trend in actual revenue or expenditure – has it been increasing, decreasing, stable, volatile;
Has the state typically over or under budgeted (any why), or has it been accurate;
What are the main factors behind the performance – can the state affect the performance or not, to achieve better
performance does the budget need to be decreased/increased, or the actual decreased/increased; and
Any key considerations for forecasting.
An example is provided in the course material.
n
n
n
n
n

11www.sparc-nigeria.com
3. Fiscal Forecasting
There are four key stages to producing fiscal forecasts:
a) Data Collection and Validation;
b) Generating of Forecasts using Moving Average, Elasticity, Regression or other technique;
c) Presentation of Forecasts in Graphic Format; and
d) Written Analysis and Proposal of which Forecast to adopt.
The sub-sections below provide guidance on how to make fiscal forecasts based on these four steps. The principles can be
applied to any dataset that needs to be forecast, and for anytime period.
3.1 Data Collection and Validation
The amount of data used for Fiscal Forecasting will depend on the type of forecasting technique used.
Fiscal Data - data on expenditure and revenue, or actual performance, will ideally come from audited financial statements.
Alternatively, if audited financial statements are not available, then the Accountant General’s report or final performance figures
(perhaps from Treasury, Department of Final Accounts or equivalent) will suffice.
Macro-economic data (only required if doing elasticity or some regression based forecasts) – this should come from the
government’s planning / statistics departments, otherwise some international organisations publish macroeconomic data
including:
n IMF World Economic Outlook, published twice yearly - Tables A2, A4 and A6 and A7 provide Real GDP Growth and
Inflation (Consumer Price) respectively, other data is also available (http://www.imf.org/external/publications/index);
n The World Bank publishes an annual World Economic Prospects report (http://www.worldbank.org/reference/); and
n African Development Bank publishes the African Economic Outlook report (www.afdb.org).
For elasticity based forecasting, it will be necessary to obtain both historical macro-economic data and also forward estimates.
As noted previously, it is most important that the sources of data must always be noted in report / analysis.
Data should be compiled into a spreadsheet (e.g. Microsoft Excel) as per the example in data file 2.1A or 2.2B as below examples.
Note that the cells with original data are coloured blue.
Figure 6: Screen Shot – Fiscal and Macroeconomic Data for Forecasting

www.sparc-nigeria.com12
3.2 Generating Forecasts
Provided below are step by step instructions for building the following forecasting models:
n Moving Average (three types);
n Incremental; and
n Elasticity.
The instructions are based on having six years of historical data, but the models can also be built with only four years historical
data. For the practical exercises, both a six year and a four year model are built.
3.2.1 Moving Average
3.2.1.1 Overview
Moving Averages can be used to forecast growth rates for a revenue aggregate based on historic observed growth rates. The
basic principles behind moving averages can be split into the two components:
n Moving - when forecasting a variable for multiple time periods, this refers to the rolling forward of the average used for
the forecast;
n Average - refers to using more than one piece of data to forecast.
Three different types of moving average that are recommended as the potential basis for forecasting are:
n Simple 3 -Year Moving Average - uses the three preceding years observations (e.g. growth rate) to forecast the
subsequent year;
n 5 Year Moving Average Excluding Outliers - uses the three of the five preceding years observations (e.g. growth rates),
excluding the highest and lowest observations;
n 4 Year Weighted Moving Average - uses the four preceding years observations (e.g. growth rate) but applies more
weight to the more recent observations.
3.2.1.2 Process for Building Forecast
3.2.1.2.1 Simple Moving Average
The process for building a simple moving average (in this instance 3 year) based on MS Excel files 2.1.A and 2.1.B is provided in
the figure below, and is based on a dataset from 2008-2013 and forecasting for 2014-2017.

13www.sparc-nigeria.com
Figure 7: Step-by-Step guide to Simple Moving Average
First year that growth can be estimated is 2009 – formula as
below in row 3
Copy Formula across. Ensure cells are showing percentages,
and title the row as Growth Rate
Calculate 3-Year moving average – 2011 is the first year this
can be done in row 4
Copy Formula across to 2013 (column G). Ensure cells areshowing percentages, and title the row as 3-Year MovingAverage
Use 3-Year MA in cell E4 (it covers 2011-2013) and 2013
actual VAT to forecast 2014 VAT
Copy Formulas across to 2017

www.sparc-nigeria.com14
MS Excel files 2.2.A and 2.2.B provide a built simple moving average model.
3.2.1.2.2 Moving Average Excluding Outliers
The process for building a moving average excluding outliers (in this instance 5 years) based on MS Excel files 2.1.A and 2.1.B is
provided in the figure below, and is based on a dataset from 2008-2013 and forecasting for 2014-2017.
Figure 8: Step-by-Step guide to Moving Average Excluding Outliers
First year that growth can be estimated is 2009 – formula as
below in row three
Copy Formula across. Ensure cells are showing percentages,
and title the row as Growth Rate
In row 4, calculate the sum of five years of growth rates (2013
is the first year you can do this)
In row 5, use the MAX formula to calculate the maximumgrowth rate in the five year range
In row 6, use the MIN formula to calculate the minimum
growth rate in the five year range
Calculate the 5-Year Moving Average (MA) Excluding Outliers(XO) in row 7 by taking the sum of five years (row 4) andminus the max (row 5) and min (row 6) and divide by 3(remaining observations)

15www.sparc-nigeria.com
MS Excel files 2.2.A and 2.2.B provide a built moving average excluding outliers model.
3.2.1.2.3 Weighted Moving Average
The process for building a moving average excluding outliers (in this instance 5 years) based on MS Excel files 2.1.A and 2.1.B is
provided in the figure below, and is based on a dataset from 2008-2013 and forecasting for 2014-2017.
Use 5-Year MA XO in cell G7 (it covers 2009-2013) and 2013
actual VAT to forecast 2014 VAT
Copy Formulas across to 2017
Figure 9: Step-by-Step guide to Weighted Moving Average
First year that growth can be estimated is 2009 – formula as
below in row three
Copy Formula across. Ensure cells are showing percentages,
and title the row as Growth Rate
In rows 4-7, define your weights for the years Y-1 to Y-4 (if youare forecasting for 2014, then Y-1 is 2013, and so on). Theweights must add up to 1
In row 8, enter a sum to ensure your weights add up to 1

H O W T O G U I D E
www.sparc-nigeria.com16
2012 is the first year a 4-year moving average can be calcu-
lated. Multiply the growth rates in row 3 by the weights in
rows 4-7
Use the $ symbol in front of the column reference for the
weight. When copying the formula unto subsequent columns,
this will ensure your formula is pegged to the correct column
reference for the weighting
In row 8, sum the weighted growth rates – this gives you the
4-Year Weighted Moving Average (MA)
Copy the formulas in rows 4-8 across to the 2013 column (G)
Use the 4-Year Weighted MA in row 8 for 2013 and 2013 ac-
tuals to forecast 2014
Copy Formulas across to 2017
MS Excel files 2.2.A and 2.2.B provide a built weighted moving average model.

H O W T O G U I D E
17www.sparc-nigeria.com
It is useful to calculate historical growth (and is a requirement
if the incremental growth rates are going to be shown in a
graph with the other forecasts). First year that growth can be
estimated is 2009 – formula as below in row three
Copy Formula across. Ensure cells are showing percentages,
and title the row as Growth Rate
Proposed increments should then be entered in row 3 for the
years 2014-2017
The estimate for 2014 is entered in row 2 using the proposedincrement and the prior year actual
3.2.2 Incremental
3.2.2.1 Overview
Incremental forecast is the most basic method of forecasting, and allows for a percentage increase (based on whatever
judgement) to be used to forecast. This can sometimes be useful as a reference point for other forecasts.
3.2.2.2 Process for Building Incremental Forecast
The process for building a simple incremental forecast based on MS Excel files 2.1.A and 2.1.B is provided in the figure below, and
is based on a dataset from 2008-2013 and forecasting for 2014-2017.
Figure 10: Step-by-Step guide to Incremental Budgeting

www.sparc-nigeria.com18
The formula should then be copied across to 2017 The growth rates in row 3 can be changed to whatever is mostappropriate
MS Excel files 2.2.A and 2.2.B provide a built simple moving average model.
3.2.3 Elasticity
3.2.3.1 Overview
The dictionary definition of “Elasticity” is the responsiveness of one variable (dependent variable) to changes in another
variable(s) (explanatory variable(s)). Essentially it is the ratio of growth rates between one variable and another, with the
relationship between the two being based on some economic or fiscal theory. For example, if a real GDP grows by 10% and Sales
Tax grows by 20%, the elasticity of Sales Tax growth to real GDP growth is 2 (20% divided by 10%).
By combining historically observed elasticities between revenue (or expenditure) items and macroeconomic forecasts, the future
forecasts for the macroeconomic variable can be used as the basis for forecasts of the revenue items. For example, if the
calculated elasticity between Sales Tax growth and Real GDP growth is 2, and GDP is forecast to grow by 5%, Sales Tax would
be forecast to grow by 10%.
3.2.3.2 Process for Building Incremental Forecast
The process for building an elasticity-based forecast based on MS Excel files 2.1.A and 2.1.B is provided in figure 11 below, and is
based on a dataset from 2008-2013 and forecasting for 2014-2017. It uses sales tax and Real GDP Growth and Inflation
macroeconomic data as the two explanatory variables.
19www.sparc-nigeria.com
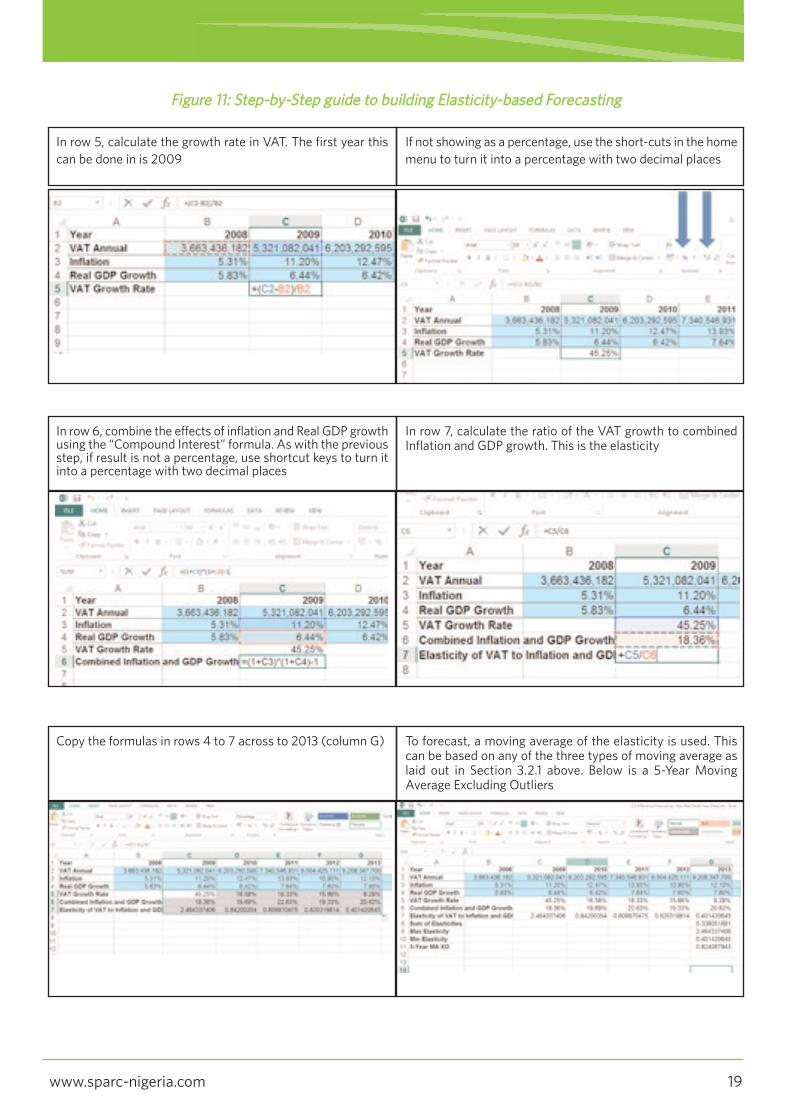
Figure 11: Step-by-Step guide to building Elasticity-based Forecasting
In row 5, calculate the growth rate in VAT. The first year this
can be done in is 2009
If not showing as a percentage, use the short-cuts in the home
menu to turn it into a percentage with two decimal places
In row 6, combine the effects of inflation and Real GDP growthusing the “Compound Interest” formula. As with the previousstep, if result is not a percentage, use shortcut keys to turn itinto a percentage with two decimal places
In row 7, calculate the ratio of the VAT growth to combinedInflation and GDP growth. This is the elasticity
Copy the formulas in rows 4 to 7 across to 2013 (column G) To forecast, a moving average of the elasticity is used. Thiscan be based on any of the three types of moving average aslaid out in Section 3.2.1 above. Below is a 5-Year MovingAverage Excluding Outliers

www.sparc-nigeria.com20
The VAT growth rate in 2014 is calculated in row 5. It willdepend on the macroeconomic outlook for 2014 (rows 3 and4) and the previously observed elasticity (row 11). First dragthe formula in row 6 across to 2014
Use this and the elasticity (row 11) to calculate the VATgrowth rate (row 5)
Use the growth rate in row 5 and the prior VAT (2013, row 2)
for 2014 to determine the VAT for 2014
Drag the formulas in rows 2, 5-11 all the way across to 2017(column k)
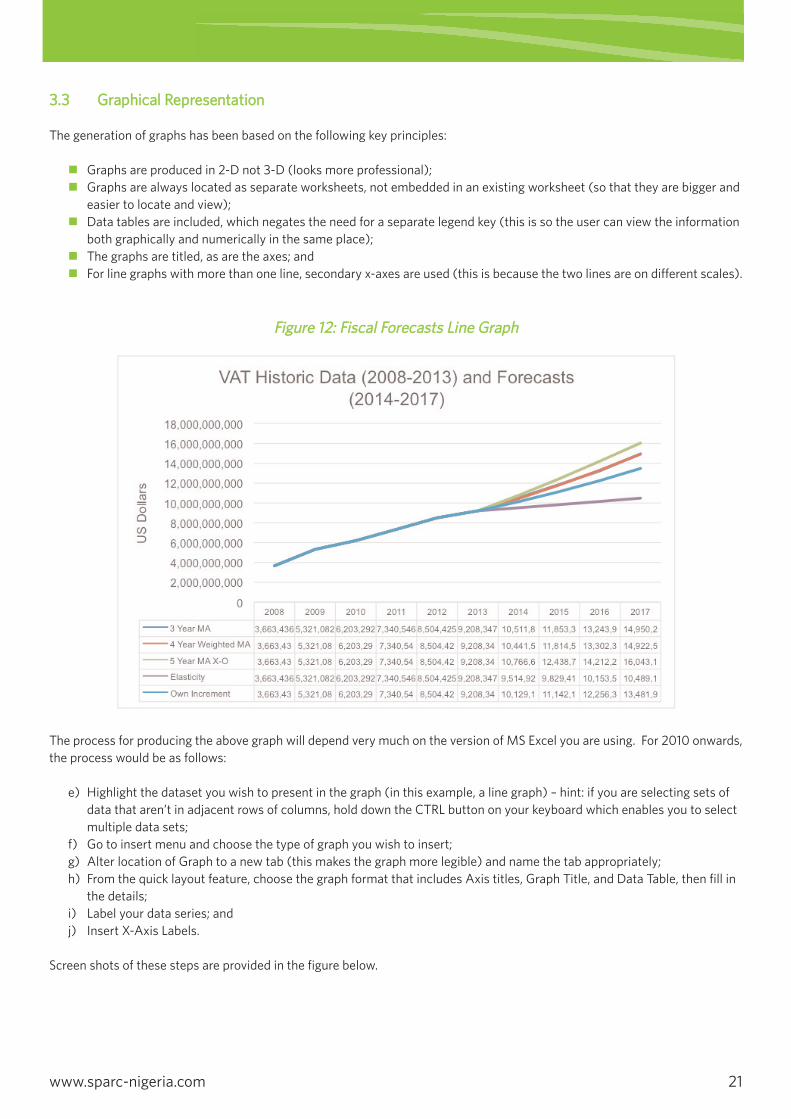
3.3 Graphical Representation
The generation of graphs has been based on the following key principles:
n Graphs are produced in 2-D not 3-D (looks more professional);
n Graphs are always located as separate worksheets, not embedded in an existing worksheet (so that they are bigger and
easier to locate and view);
n Data tables are included, which negates the need for a separate legend key (this is so the user can view the information
both graphically and numerically in the same place);
n The graphs are titled, as are the axes; and
n For line graphs with more than one line, secondary x-axes are used (this is because the two lines are on different scales).
The process for producing the above graph will depend very much on the version of MS Excel you are using. For 2010 onwards,
the process would be as follows:
e) Highlight the dataset you wish to present in the graph (in this example, a line graph) – hint: if you are selecting sets of
data that aren’t in adjacent rows of columns, hold down the CTRL button on your keyboard which enables you to select
multiple data sets;
f) Go to insert menu and choose the type of graph you wish to insert;
g) Alter location of Graph to a new tab (this makes the graph more legible) and name the tab appropriately;
h) From the quick layout feature, choose the graph format that includes Axis titles, Graph Title, and Data Table, then fill in
the details;
i) Label your data series; and
j) Insert X-Axis Labels.
Screen shots of these steps are provided in the figure below.
21www.sparc-nigeria.com
Figure 12: Fiscal Forecasts Line Graph
www.sparc-nigeria.com22
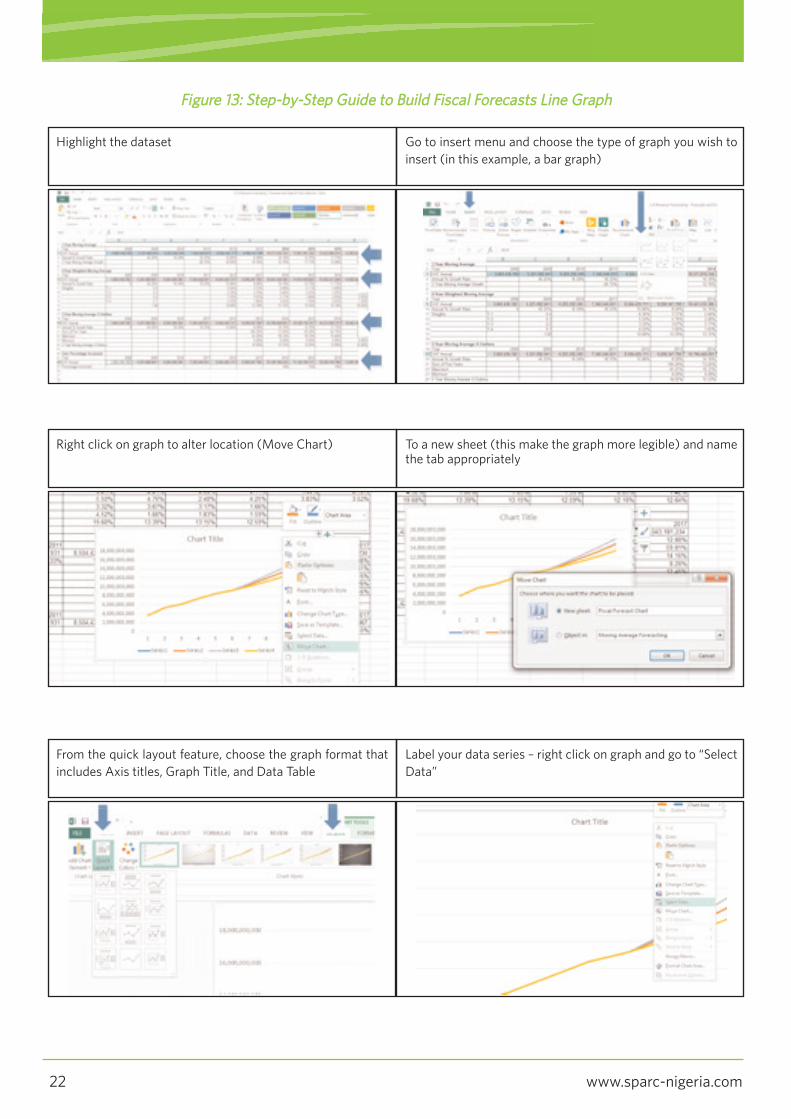
Figure 13: Step-by-Step Guide to Build Fiscal Forecasts Line Graph
Highlight the dataset Go to insert menu and choose the type of graph you wish to
insert (in this example, a bar graph)
Right click on graph to alter location (Move Chart) To a new sheet (this make the graph more legible) and namethe tab appropriately
From the quick layout feature, choose the graph format that
includes Axis titles, Graph Title, and Data Table
Label your data series – right click on graph and go to “Select
Data”
23www.sparc-nigeria.com
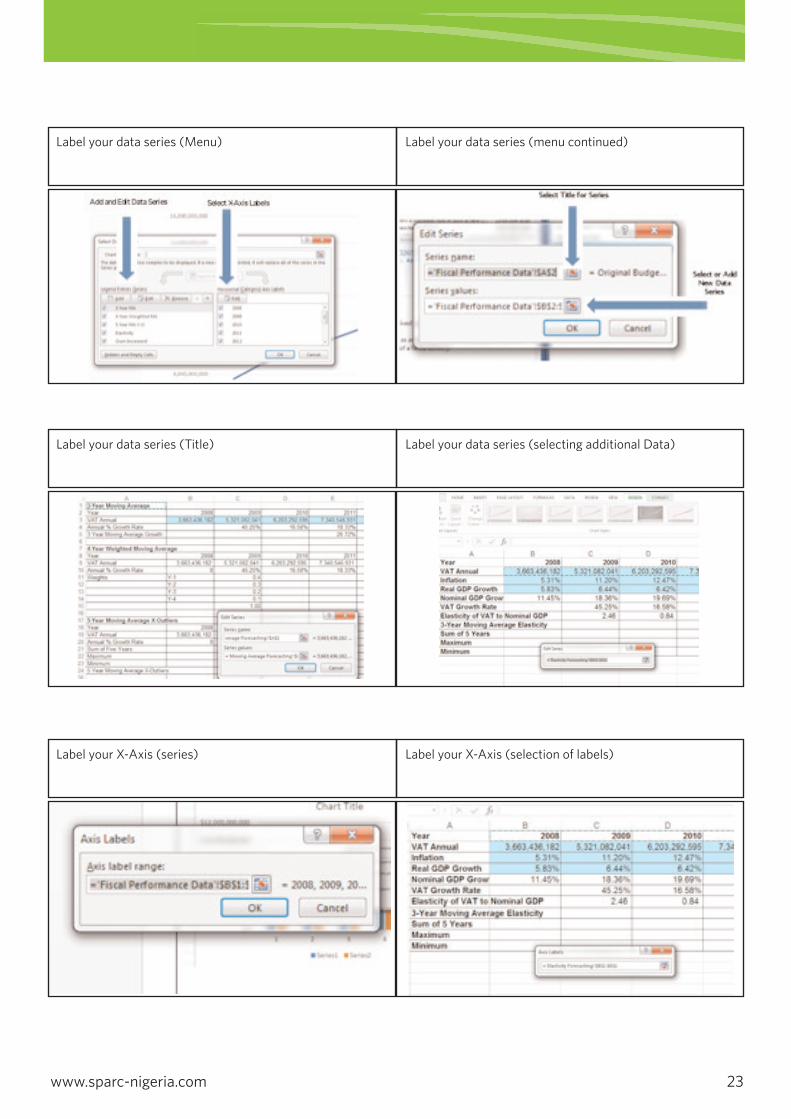
Label your data series (Menu) Label your data series (menu continued)
Label your data series (Title) Label your data series (selecting additional Data)
Label your X-Axis (series) Label your X-Axis (selection of labels)

www.sparc-nigeria.com24
Other versions of MS Excel will differ slightly (MS Excel 2007 slightly, 2003 and earlier significantly), as will other spreadsheet
software.
3.4 Analysis of Forecasts and Proposal
The graph prepared in the section above allows a comparison of the different forecasts and also compares them to the prior
trajectory of the fiscal item. Visually, this may allow Senior Management to make a decision of which of the forecasts to use in
the budgeting process. At the same time, the information below should also be taken into consideration.
In circumstances where more data and higher capacity is present in government, more complex regression based models
(time-series or macro-fiscal Vector Auto-Regressive) might be considered.
Figure 13: Step-by-Step Guide to Build Fiscal Forecasts Line Graph
MMeetthhoodd SSttrreennggtthhss WWeeaakknneesssseess EEllaassttiicciittyy More robust forecasting
technique Captures shifts in the macro-economic environment (both historic and outlook)
Relies on Accurate Data, which is not necessarily available A more difficult forecasting technique
MMoovviinngg AAvveerraaggee
A more simplistic forecasting technique Relies on a smaller data set that is more easily accessible
Does not capture shifts in the macro-economic environment (both historic and outlook)
IInnccrreemmeennttaall Requires very little data (only one year)
Has no statistical basis Does not take into consideration prior performance or future macroeconomic environment


Contact detailsSPARC has eleven offices in Nigeria. For more information on our work:
Email: [email protected]
Or
Telephone: +234 (0) 809 564 3426
Visit our website: www.sparc-nigeria.com
Find us on Facebook www.facebook.com/SparcGovernanceNews
The opinions expressed in this leaflet are those of the authors and do not necessarily representthe views of the Department for International Development.
www.sparc-nigeria.com