buffalo hunt: international trade and the virtual …ies/fall07/taylorpaper.pdf · buffalo hunt:...
TRANSCRIPT

NBER WORKING PAPER SERIES
BUFFALO HUNT: INTERNATIONAL TRADE AND THE VIRTUAL EXTINCTIONOF THE NORTH AMERICAN BISON
M. Scott Taylor
Working Paper 12969http://www.nber.org/papers/w12969
NATIONAL BUREAU OF ECONOMIC RESEARCH1050 Massachusetts Avenue
Cambridge, MA 02138March 2007
I am grateful to seminar participants at the University of British Columbia, the University of Calgary,the Environmental Economics workshop at the NBER Summer Institute 2006, the fall 2006 meetingsof the NBER ITI group, and participants at the SURED II conference in Ascona Switzerland. Thanksalso to Chris Auld, Ed Barbier, John Boyce, Ann Carlos, Charlie Kolstad, Herb Emery, Mukesh Eswaran,Francisco Gonzalez, Keith Head, Frank Lewis, Mike McKee, and Sjak Smulders for comments; toMichael Ferrantino for access to the International Trade Commission's library; and to Margarita Gres,Amanda McKee, Jeffrey Swartz, Judy Hasse of Buffalo Horn Ranch and Andy Strangeman of InvestraLtd. for research assistance. Funding for this research was provided by the SSHRC. The views expressedherein are those of the author(s) and do not necessarily reflect the views of the National Bureau ofEconomic Research.
© 2007 by M. Scott Taylor. All rights reserved. Short sections of text, not to exceed two paragraphs,may be quoted without explicit permission provided that full credit, including © notice, is given tothe source.
Buffalo Hunt: International Trade and the Virtual Extinction of the North American BisonM. Scott TaylorNBER Working Paper No. 12969March 2007JEL No. F1,Q2,Q5,Q56
ABSTRACT
In the 16th century, North America contained 25-30 million buffalo; by the late 19th century less than100 remained. While removing the buffalo east of the Mississippi took settlers over 100 years, theremaining 10 to 15 million buffalo on the Great Plains were killed in a punctuated slaughter in a littlemore than 10 years. I employ theory, data from international trade statistics, and first person accountsto argue that the slaughter on the plains was initiated by a foreign-made innovation and fueled by aforeign demand for industrial leather. Ironically, the ultimate cause of this sad chapter in Americanenvironmental history was of European, and not American, origin.
M. Scott TaylorIEE Canada Research ChairDepartment of EconomicsThe University of Calgary2500 University Drive, N.W.Calgary, Alberta CanadaT2N 1N4and [email protected]
1 Introduction
200 YEARS AGO, Meriwether Lewis and William Clark completed theirepic voyage of Western discovery. Their vivid account of the West�s naturalbeauty and its limitless wealth spurred on thousands of Americans to carveout a new life and new nation west of the Mississippi. Westward expansionwith its stories of frontier hardship have shaped much of American nationalidentity by showing how self-reliance, risk-taking and hard work could tame awild frontier. While the 19th century is surely one of the most inspirationalperiods in American history, it also bears witness to a less �attering recordwith regard to the environment: most signi�cantly, the slaughter of the plainsbison, or bu¤alo.1
This paper examines the slaughter using theory, empirics, and �rst personaccounts from diaries and other historical documents. It argues that thestory of the bu¤alo slaughter is surprisingly not, at bottom, an Americanone. Instead I argue that the slaughter on the plains was initiated by atanning innovation created in Europe, and maintained by a robust Europeandemand for bu¤alo hides. These market forces overwhelmed the ability of ayoung and still expanding nation, just out of a bloody civil war, to carefullysteward its natural resources.Speci�cally, I argue that three conditions are jointly necessary and suf-
�cient to explain the time pattern of bu¤alo destruction witnessed in thenineteenth century. These are: (1) a price for bu¤alo products that waslargely invariant to changes in supply; (2) open access conditions with noregulation of the bu¤alo kill; and (3), a newly invented tanning process thatmade bu¤alo hides into valuable commercial leather.In the 16th century, North America contained 25-30 million bu¤alo; by
the late 1880s less than 100 remained wild in the Great Plains states.2 Whileremoving bu¤alo east of the Mississippi took settlers over a 100 years, theremaining 10 to 15 million were killed in a punctuated slaughter in a little
1The term bu¤alo is a misnomer but I will use it throughout since this is commonusage. The description of the kill as a slaughter is also conventional. It is perhaps wiseto inform the reader at the outset that this paper is concerned exclusively with positivequestions. I leave it to the reader to determine for themselves whether the slaughter wasunfortunate or inevitable.
2The species Bison bison comes with two distinct varieties: the common Plains bison(Bison, bison, bison ) and the less common Woods bison (Bison, bison, athabascae) foundexclusively in Canada. I focus on the extinction of the plains bison or bu¤alo in the U.S.,leaving an examination of the Canadian case for future work.
1
over 10 years. Standard explanations hold some combination of U.S. Armypolicy, the Railroads, and changes in native hunting practices responsible.My claim is that (1), (2) and (3) are both necessary and su¢ cient.The argument I develop proceeds in three steps. First I build a novel
model of bu¤alo hunting. It assumes potential bu¤alo hunters di¤er in theirhunting skill, and allows for easy entry and exit. Entry and exit from huntingwas common, and skill di¤erences across hunters is an important part of thehistorical record.3 For the most part, I take world prices as given and assumethroughout that there are no controls over hunting. The model is madegeneral equilibrium by the addition of a numeraire good sector which servesas the outside option for potential bu¤alo hunters. The general equilibriumstructure is helpful to our discussion of export �ows, and necessary for ourconstruction of an autarky counterfactual.The theory delivers two key results. First, it shows how the combination
of an innovation in tanning, �xed world prices for hides, and open access tothe herds proved fatal to the bu¤alo. The innovation in tanning creates fren-zied entry into hunting, the bu¤alo herds decline rapidly, and the "harvest"of bu¤alo hides for export booms.4 Fixed prices ensure the new supply ofbu¤alo hides cannot dampen the incentive to hunt; open access ensures thatregulations limiting the kill are not forthcoming; and the tanning innovationplus hunter heterogeneity delivers a punctuated slaughter followed by rapidexit. Rigid prices, no controls on hunting, and a slaughter compressed intime are important and veri�able features of the historical record.Second, the theory show how rigid prices are necessary for the story.
An unexpected innovation is just not enough. For example, if prices adjustconsiderably to changes in supply - as they typically would if bu¤alo productshad only a domestic market - then the number of hunters can rise over timeeven as the bu¤alo are wiped out. The "punctuated slaughter" is relativelysmooth over time, and hide prices rise as the bu¤alo approach extinction. Allof these predictions are inconsistent with the historical record: hide pricesfell slightly over the period; there was massive entry and then exit; and the
3The model is most closely related to Brander and Taylor (1997), but bears someresemblance to resource models with entry such as Wilen (1976) or Brander and Taylor(1998).
4The pace of the slaughter was such that many contemporary writers thought extinctionwas all but inevitable. Allen, writing in 1876, said "The fate of none of our larger animalsis more interesting than is that of the bison, since total extermination is eventually surerto none than to this former "monarch of the prairies." p. 71 Allen (1876)
2
slaughter was in fact just that.In sum the theory provides a prima facie case for the importance of
international markets in the slaughter, and directs us to look at internationaltrade statistics for empirical evidence. Accordingly, the second step is toexamine evidence on U.S. exports of bu¤alo hides.A natural consequence of the rapid elimination of the bu¤alo is that
records of the number killed are non-existent, and only very partial shippingrecords exist. U.S. trade statistics from the 19th century contain categoriesof exports that contain bu¤alo products, but no individual entry is labelledbu¤alo meat, bu¤alo robes or bu¤alo hides. The key series I employ is "hideand skins exports" and this surely contains both cattle and bu¤alo hides.To solve this problem, I employ economic theory and independent work onthe U.S. cattle cycle to construct a time series of bu¤alo hide exports fromthe overall export �gures. This constructed series is then cross-checkedfor consistency against several pieces of independent evidence. The crosschecks examine the magnitude of the implied exports, their timing, and theirgeographic variation. I �nd direct supporting evidence of bu¤alo hide exportsin newspaper accounts, personal diaries, and business directories in importingcountries. In addition, I examine import data from Canada, the UK, andFrance that corroborate my �ndings. These numerous independent checkslend support to the constructed series.The �nal step in the argument is to examine the main alternative hy-
potheses in light of our new data. While the model�s analytic results provethat my three conditions are su¢ cient to generate the slaughter they do notprove necessity. To argue for necessity, I show that the new constructedexport data strongly support the export-driven slaughter hypothesis. Themagnitudes of the export �ows are considerable. Approximately 6 millionbu¤alo hides are exported over the 1871-1883 period and this represents abu¤alo kill of almost 9 million. The timing of greatest export �ows �ts thehistorical record extremely well. I then discuss the three major alternativehypotheses and argue that they do far less well in matching the data.There is of course a huge literature studying the bu¤alo and other related
aspects of westward expansion in the 19th century. This literature includesmany contributions from history, political science and sociology but only ahandful of contributions from economics. Perhaps the best known contri-bution is the 1889 monograph by William Temple Hornaday who was thenthe chief taxidermist of the Smithsonian Institute. Hornaday�s monograph"The Extermination of the American Bison" is the classic account of the
3

elimination of the bu¤alo both east and west of the Mississippi. Horna-day collects �gures on the number killed from various sources, and providesthe �rst de�nitive account of the slaughter. Hornaday�s account howevermake no mention of international trade. Other classic contributions such as"The Plains of the Great West" by Richard Irving Dodge (1877), and JoelAllen�s 1876 contribution "The American Bisons: Living and Extinct" o¤erus �rst person accounts (in the case of Dodge), and a scholarly examinationof the process from a naturalist at Harvard, but neither seek to identify theunderlying cause.More recent work by economists include Dean Lueck (2002) and Bruce
Benson (2006) who focus on property rights issues, and a series of papersby economic historians linking market forces to overuse and depletion ofrenewable resources in earlier centuries.5 Prominent among these are theseries of papers by Carlos and Lewis (1993, 1999) who examine the depletionof beaver in the 18th century; Patterson and Wilen (1977) who study thenorthern paci�c fur seal hunt; and most recently Allen and Keay (2004) whostudy the extinction of the Arctic Bowhead whale.The work presented here di¤ers from earlier contributions in several ways.
Most importantly the focus here is on the "slaughter." There is no realmystery as to why the bu¤alo were eliminated from their previous ranges- an expanding population, conversion to agriculture, and industrializationall spelt the end for the bu¤alo sometime during the late 19th or early 20thcentury. What is surprising is the rate of killing and its variation over time:one half of the pre-contact bu¤alo population was killed in just ten yearstime post 1870; the elimination of the other half took over 100 years.This focus on the slaughter is important, and absent from the other con-
tributions. It is important, because a rapid slaughter greatly constrainsthe ability of governments and agents to respond and strengthen propertyrights institutions. The existence of the slaughter also leads one to ask whymarkets didn�t adjust to the huge increase in the supply of bu¤alo productsand thereby slow the carnage. A focus on the slaughter naturally suggestsinternational markets may have soaked up the excess supply while keepingprices constant. Investigation of this possibility led to the major contribu-tion of this work: the identi�cation of international trade as a key driver inthe process.
5An early and excellent discussion of the slaughter, the hide trade, and the attemptsto legislate hunting is contained in Hanner (1981).
4
The earlier contributions from economic history explored rather di¤erentpositive and normative questions concerning resource depletion. Carlos andLewis link variation in depletion rates across trading posts to di¤erences inlocal competition; Patterson and Wilen examine how international rivalryand transboundary issues a¤ect depletion; and Allen and Keay ask whetherdepletion could have been avoided by enlightened public policy. In eachcase there was little debate as to the ultimate source of depletion. TheBowhead whale was eliminated by Dutch and English whalers over almostthree centuries; while the beaver and seal were depleted by the fur trade,albeit with the help of new technologies. In contrast, I argue that the usualsuspects held responsible for the slaughter on the plains - the Railroads, theU.S. Army, Environmental change or altered native hunting practices - arein fact innocent.An examination of the slaughter also provides important case study evi-
dence on the speed with which property rights institutions can adapt in theface of new circumstances. In this case the changed circumstance was aninnovation, and the adjustment, as measured by new regulation, was slow.In contrast, market responses were immediate and powerful. This relativespeed of adjustment is key to many policy debates. For example, even whenproperty rights over resources are absent or poorly enforced prior to a tradeliberalization, access to world markets may lead to a strengthening of pro-tection. It may do so because world markets often value domestic resourcesvery highly and this provides an incentive to improve resource management.If this protection is soon forthcoming, then opening up to world markets canprovide both conventional gains from trade and improved resource manage-ment.6 This tantalizing possibility is however just that - a theoretical pos-sibility, since there is currently very little empirical evidence directly linkingchanges in property rights protection, resource use, and trade liberalization.Indirect evidence can be gleaned from the empirical literature on trade andthe environment, the related literature linking income gains to pollution re-duction, and a handful of speci�c studies questioning the simple link betweenlax property rights and resource over use.7
Given the dearth of empirical evidence directly on point, case study evi-dence is of great value. Looking back to our past provides us with guidance
6See Copeland and Taylor (2004b) for a model with these features.7On trade, see Copeland and Taylor (2004a); on improved protection, see Grossman and
Krueger (1995); on property rights see Besley (1995); and on the links between protectionand resource over use see Bohn and Deacon (2003) and UNEP (2001).
5
for the future. For in the not too distant past, Europe was the high incomedeveloped region, while America was a young still developing country. In the1870s, America was a large resource exporter with little or no environmentalregulation, while Europe was a high income consumer of U.S. resource prod-ucts apparently indi¤erent to the impact their consumption had on America�snatural resources. Written in this way it is apparent that the story of thebu¤alo has as much relevance today as it did 130 years ago. Many develop-ing countries in the world today are heavily reliant on resource exports, arestruggling with active or recently past civil wars fueled by racial strife, andfew, if any, have stringent regulations governing resource use. The global-ization pressures these nations face today, and the policy choices they haveto make, are not too di¤erent from those facing the U.S. in the late 19thcentury.The rest of the paper proceeds as follows. In section 2, I set out impor-
tant background material on the history and biology of the bu¤alo which isgenerally not known. In section 3, I construct the hunting model to examinehow the time path of bu¤alo kills responds to an unexpected tanning inno-vation. In section 4 I construct the bu¤alo-hide-export data, and providea series of cross-checks. Section 5 considers alternative hypotheses, whilesection 6 concludes. Two appendices follow.
2 History and Biology
Bu¤alo are the largest terrestrial mammals in North America, and have beensince the Pleistocene extinctions over 10,000 years ago. Earliest recordedEuropean observations came from Spanish explorers in the early 1500s whoremarked on the vast herds of native cattle in present day Mexico. Similarobservations were subsequently made by French and English explorers inother regions of North America. The newcomers were unanimous in theirappraisal of bu¤alo as "innumberable" or "countless" and the country wasfamously described as "one black robe" of bu¤alo.The American explorers, Lewis and Clark, met bu¤alo at many points
along their voyage of discovery. On their return voyage in 1806 at themouth of the Yellowstone river where it meets the Missouri, they recorded:"The bu¤alo now appear in vast numbers. A herd happened to be on theirway across the river [the Missouri]. Such was the multitude of these animalsthat although the river, including an island over which they passed, was a
6
mile in length, the herd stretched as thick as they could swim completelyfrom one side to the other, and the party was obliged to stop for an hour."Since extrapolating from any �rst person account can lead to serious er-
ror, it is not surprising then that early estimates of the bu¤alo populationvary from over 100 million to less than 20 million.8 The most reliable popula-tion estimates come to a �gure somewhere between 25 and 30 million bu¤alo.The estimates are constructed by multiplying the carrying capacity on agri-cultural land with estimates of the original bu¤alo range of almost 3 millionsquare miles. Bu¤alo were in all of the lower 48 (save the New Englandstates), the four westernmost Canadian provinces and its two territories, andthe northernmost part of present day Mexico.
2.1 Habitat Destruction and Subsistence Hunting
The bu¤alo east of the Mississippi were removed by a combination of habitatdestruction and subsistence hunting. The gradual removal of bu¤alo pro-ceeded westward when settlers crossed the Allegheny mountains into Ken-tucky in the early 1800s. It continued unabated for the next �fty yearsas settlers moved towards the "Great Plains" at approximately the 98thmeridian. By 1820 or 1830, bu¤alo were largely gone east of the Mississippi.During much of this early period natives hunted the bu¤alo not only for theirown subsistence needs but also to trade bu¤alo robes at forts and towns. Abu¤alo robe is the thick and dark coat of a bu¤alo that is killed in mid winter.Robes could be used as throws for carriages, or cut to make bu¤alo coats andother fur items. They were a popular item in the 19th century and theymade their way to eastern markets by transport along the Missouri river toSt. Louis or overland via the Santa Fe trail. In the 1840s settlers pushedthrough the Great Plains into Oregon and California. The movement of the49ers to California and the Nevada gold rush years brought a steady streamof tra¢ c through the Platte river valley. Subsistence hunting along the trailplus the movement of cattle and supplies, divided the existing bu¤alo herdinto what became known as the Southern and Northern herds.The division of herds became permanent with the building of the Union
Paci�c railroad through the Platte River valley in the 1860s. The railroad
8The naturalist Thomas Seton (1909) estimated the population circa 1600 at 75 million,but with little factual basis. The historian Dan Flores (1991) employed a more transparentmethod to arrive at a �gure of 27 million.
7
created a local demand for bu¤alo meat, and brought sport hunters, inquis-itive easterners and foreign dignitaries eager to go out West on a bu¤alohunt. While subsistence hunting for the railroad crews surely had somee¤ect on bu¤alo numbers, as did the railroad�s popular day trips to kill buf-falo, the harried bu¤alo herds withdrew from the tracks creating a 50 milewide corridor centered on the Union Paci�c line.9 The railroads also providedtransportation for bu¤alo products to eastern and foreign markets, but in the1860s railway cars were not refrigerated, and hence bu¤alo meat was onlymarketed as salted, cured or smoked.Despite the railroads, the market for bu¤alo robes, the increase in sub-
sistence hunting, and the conversion of the high prairie to agriculture, Utleynotes that "contemporaries detected no major reduction in the abundanceof the species. Most observers thought the killing was not greater than thenatural increase of the species and expected the extermination of the bu¤alofrom the High Plains would occur gradually over a span of decades in a man-ner similar to what had happened east of the 99th meridian."10 The forceof habitat destruction was minimal on the Great Plains. In 1860, they heldonly 164 thousand people on an area of 416 million acres. Farms were lessthan 1% of the land area.The Civil War brought a temporary reprieve for the bu¤alo. Major bat-
tles occurred in regions with few or no bu¤alo, and these years provided abreak from the slow but steady destruction that had marched westward. De-spite this reprieve, settlement and habitat destruction had taken some toll:estimates of the bu¤alo population in 1865 range from 10 to 15 million.
9To see why subsistence and sport hunting could make only a small dent in the herda little calculation is helpful. If the carrying capacity of the Great Plains was 15 millionbu¤alo, and if we take their intrinsic growth rate at .2, then (using the logistic growthequation for the bu¤alo) a maximum sustainable yield population of 7.5 million allowsfor a yearly sustainable kill of 750,000 bu¤alo. To put this in perspective, the mostfamous bu¤alo hunter ever known - Bu¤alo Bill Cody - was an entrepreunial young boyof 18 when he o¤erred to supply the Union Paci�c workers with bu¤alo meat. WilliamCody got the contract with Union Paci�c, but even his own (perhaps in�ated) accountsindicate he killed only 4 to 5 thousand bu¤alo per year. Hornaday claims that killing bywhites, natives and half-breeds totalled less than 500,000 before 1870 and was sustainable(Hornaday, (1889) p.466.) .10See Utley (2003), p. 243.
8
2.2 The Innovation
The temporary reprieve ended quickly when in 1870 or 1871 tanners in Eng-land and Germany developed a method for tanning bu¤alo hides into usefulleather. While natives had always been able to tan the thick haired bu¤alohides taken in winter months into bu¤alo robes, their process was laboriousand required ingredients from bu¤alo themselves (the brain, liver, and fat ortallow). A cheap simple commercial process was as yet unknown. Varioushistorical accounts attribute the breakthrough to tanners in Germany andstill others to English tanners. Many accounts suggest the "innovation" wassoon imitated by U.S. tanners, but exactly when and where is unclear.There are several elements of the innovation that are important to dis-
cuss: its timing, the initial location of the innovation in one or more foreigncountries, the fact that it represented a shock to the bu¤alo hunting indus-try, the use to which bu¤alo hides were put once tanned, and the eventualdi¤usion of the innovation to other countries.The hardest evidence for timing and location is given by a London Times
article reporting from New York city in August of 1872. It reports that afew enterprising New Yorkers thought that bu¤alo hides might be tanned forleather, and when the hides arrived they were "sent to several of the moreprominent tanners who experimented upon them in various ways, but theymet with no success. Either from want of knowledge or a lack of propermaterials, they were unable to render the hides soft or pliable, and thereforethey were of no use to them."The report continues to note "several bales of these hides were sent to
England, where they were readily taken up and orders were immediatelysent to this country for 10,000 additional hides. These orders were ful�lled,and since then the trade has continued." Further still, the methods arespelt out "The hides are collected in the West by the agents of Easternhouses; they are simply dried, and then forwarded to either New York orBaltimore for export...The low price that these goods have reached on theEnglish market, and the prospect of a still further decline, may in time putan end to this trade, but at present the hides are hunted for vigorously, and,if it continues, it will take but a few years to wipe the herds out of existence(my emphasis)."11
11It appears this article is unknown to other researchers: see "Bu¤alo Hides: Someeight or ten months ago", The Times, August 17, 1872, pg. 4, Issue 27458, col. F. It isnot known who the enterprising New Yorkers were, although one possibility is William C.
9
A secondary account comes from Gard (1960, p.90) "In 1870, J. N.DuBois, a Kansas City dealer in hides, furs and wool shipped several bales ofbu¤alo hides to Germany, where tanners had developed a process for makingthem into good leather. Other orders followed, and soon some Americantanners either learned of this process or developed a similar one of their own.In the spring of 1871, DuBois sent hundreds of circulars out to the bu¤aloranges, o¤ering to buy at attractive price all hides taken at any time of theyear. DuBois also encouraged the hunters by telling them how to peg thehides, �esh side up, for drying. In addition, he sold them a poison, importedfrom South America, to kill the bugs that infested and damaged many of thehides."12
Putting these together it appears the innovation was made in Englandand Germany at roughly the same time in 1871. Importantly, U.S. tannerswere unable to tan bu¤alo hides at this time.The fact that the innovation was an unexpected shock is of little doubt,
and supported by many accounts. The account of bu¤alo hunter George"Hodoo" Brown is especially on point as it provides evidence on both thetiming and unexpectedness of the innovation. When returning from a meathunting trip in May of 1871 to Fort Wallace, Brown had the following con-versation with fellow hunters at the fort:"We told them the weather was getting so warm it was almost impossible
to get meat to market before it spoiled. They said to me, �Why don�t youskin them and just take the hides, and let the meat lay?� I says, �What thedevil would I do with the hides?�One man said, �Ship them to Leavenworthto W.C. Lobenstine. He�ll buy your hides and send a check�. So Burdettand I on our next trip went to skinning."13
Other accounts attest to the unexpectedness of the innovation and theintroduction of bu¤alo hides as a valuable commodity. It is less clear howeverhow bu¤alo tanned leather was used, and why it had such a strong foreigndemand. The literature mentions two uses for the leather. The �rst wasfor sole leather, with a burgeoning European demand coming from re�tting
Lobenstein (a pelt dealer with an o¢ ce in Levingworth Kansas) who "is well known as the�rst dealer to introduce bu¤alo hides to the market" Fort Gri¢ n Echo, April 19th, 1879.Lobenstein later lived on the Upper East side of Manhattan.12Spoilage was a problem. Green hides collected by farmers and hunters soon rotted.
Once commercial tanning was available, hides could be preserved before tanning by placingthem in a lime solution. This removed hair and facilitated shipping as a wet hide.13Interview with George W. Brown reported in Gilbert et al. (2003), page 55.
10
armies in the post 1870 period. Speci�cally, several sources mention theBritish Army and its demand for bu¤alo leather as it was tougher and thickerthan cow hide.Bu¤alo hunter John R. Cook�s account attests to this view. Cook re-
counts his conversation with J.L. Hickey (a buying agent of W.C. Lobenstinethe hide dealer mentioned above) when the two of them brought in Cook�shides for transport. "In a few moments we were saddled up and o¤. Ifound him to be a good conversationalist, well informed and in possession ofknowledge upon the latest current events. He said all of Loganstein [sic] &Company�s hides went to Europe, that all the English Army accoutermentsof leather were being replaced with bu¤alo leather."14
In addition to sole leather, the tough bu¤alo hides found use as industrialbelting for machinery in England and elsewhere on the continent. Manysecondary sources make this connection, but primary source evidence is alsoavailable from English business directories. For example, Slater�s RoyalNational Commercial Directories at the time list numerous tanners, hidemerchants, and leather belt manufacturers in their directory of trades. Thesebusinesses list as products bu¤alo hides, bu¤alo skips, bu¤alo hide shavings,bu¤alo pickers, and strapping for cotton gins.15
The eventual di¤usion of the innovation to tanners in the U.S. and otherEuropean countries is more di¢ cult to establish, although often claimed inthe literature (recall for example Gard�s account). The best evidence of di¤u-sion of the innovation to U.S. tanners comes from NY Chamber of CommerceAnnual reports that list price quotes for hemlock tanned sole leather madefrom a variety of hides (Buenos Ayres, California, etc.). These price quotesdo not include bison in the early 1870s, but price quotes for bison tannedleather soles �rst appear in the 1877/1878 report, continue for 1878/1879,and then disappear the following year. This suggests the innovation mayhave di¤used to U.S. tanners by the late 1870s.16
14Excerpted from Cook, John R. The Border and the Bu¤alo, Crane and Company,Topeka, 1907. Reprint by State House Press, Austin, 1989. Primary evidence for Hickey�srole in the hide trade is found in numerous ads placed in the Fort Gri¢ n Echo listing himas a buying agent for W.C. Lobenstein.15See for example in Slaters Business Directory, 1879 for Manchester and Salford, adver-
tising by John Tullis & Son Tanners and Curriers and Leather Belt Manufacturers, p.80;the list of hide dealers and merchants, p.103; the advertising by Heyworth & Law Tannersand Curriers and manufacturers of Machine Belting, p.126; the advertising of Hepburn &Sons, Tanners and Curriers & Leather Factors, p.85.16I say "may have" since the U.S. was importing large volumes of leather products
11
Evidence for di¤usion to other countries is also di¢ cult to establish, buthere again business directories help. For example, the Foreign Appendixto Slater�s Business Directory of London in 1884 lists the Poullain Brothersof Paris as Tanners specializing in straps and leather for steam works andbu¤alo leather rubbers for spinning mills. Given the di¤usion to U.S. tannersin the 1870s and the close proximity of most European countries, di¤usionfrom England and Germany to other countries seems highly likely.
2.3 The Flint Hide Market
Regardless of the innovation�s source, its e¤ect on the Great Plains waselectrifying. The market for bu¤alo hides boomed; bu¤alo hunters alreadyin the �eld - like George "Hodoo" Brown - started to skin bu¤alo for their�int (hairless) hides, and hundreds if not thousands of others soon joined inthe hunt. Previous to the innovation, hides taken from the Southern Herdor hides taken in all but three winter months were virtually worthless as furitems. The only saleable commodity from a bu¤alo killed in these regions ortimes was its meat, but this market was severely limited by transportationcosts. With the advent of a �int-hide market, killing a bu¤alo anywhere andat anytime became a pro�table venture. By 1872 a full scale hide-boom wasin progress.
Although no accurate �gures are available, Colonel Richard Irving Dodge(of Dodge city fame) estimated the bu¤alo kill in Kansas at close to 3.5million bu¤alo over the 1872-1874 period.17 Once the herd in Kansas dis-appeared the hunters turned south. Reports of large herds south of theArkansas river, lured hunters into land granted to the Comanches in theMedicine Lodge Treaty of 1867. Hunting south of the Arkansas was a dan-gerous game and a major battle between hide hunters and Comanches oc-curred at Adobe walls in June of 1874. A short bu¤alo war ensued, butthe U.S. Army eliminated the Indian threat by 1875. In doing so the Armyopened up the whole of present day Oklahoma, western Texas and easternNew Mexico to the hide hunters.The business of hide hunting did not last long - less than 7 years in Kansas
and areas to the south. And when the Southern Herd was eliminated in 1879,many hide hunters looked north to the only signi�cant herd left in existence.
at this time and the bison sole leather could have been imported rather than produceddomestically.17See Dodge (1877).
12
The key bottleneck in the north was the still hostile Sioux. After the defeat ofthe Sioux in the late 1870s, the Northern Paci�c Railroad extended its trackswest from Bismarck into the heart of the Montana plains reaching Glendivein 1880 and Miles City in 1881. The Northern Herd was already diminishedby the robe trade that, as early as 1850, sent 200,000 to 300,000 robes yearlydown the Missouri.18 With easy transportation and the elimination of theIndian threat, hide hunters �ooded the northern range. Hide hunting in thenorth reached a peak in 1881 or 1882, and by 1883 the commercial hide huntwas faltering. In 1884, the last of the �int hides were shipped east.19
2.4 The Road to Conservation
In 1886, William Templeton Hornaday urged his superiors at the Smithsonianto fund an expedition to kill and mount a grouping of bu¤alo for posterity.Although it took Hornaday two expeditions, four months of e¤ort, and thehelp of professional hunting guides, he �nally succeeded in collecting speci-mens for his innovative diorama of bu¤alo on the Montana plains.20 At thistime, Hornaday estimated the wild bu¤alo population in Great Plains statesat less than 100.21
The slaughter of the North American bu¤alo surely represents one of thesaddest chapters in American environmental history. To many Americansat the time, the slaughter seemed wasteful and wrong as many newspapereditorials and letters to Congressmen attest, but still little was done to stopthe slaughter. While several Great Plains states enacted legislation to limitand control the hunt, these laws were ine¤ective and unenforceable. Theonly serious piece of federal legislation was passed by both houses in 1874only to be killed by a pocket veto by President Grant.The destruction of the bu¤alo and the wanton slaughter of other big
18See Robinson (1995, p. 31).19See Hanner (1981, p. 246).20An updated version of Hornaday�s diorama can be seen today by visiting the American
Museum of Natural History in New York or via their website at www.amnh.org (searchfor bison and pronghorn diorama).21In response to the rising scarcity several ranchers thought it worthwhile to capture and
breed bison. Famed Texas Rancher Charles Goodnight obtained several bu¤alo from thepanhandle that were remnants of the great Southern herd. These animals became of one�ve foundation herds in the U.S. from which almost all bison are descended. Other bisonherds were collected and some of these became the foundation stock for the Yellowstoneherd set up in the early 1890s.
13
game across the west did however pay some dividend. The slaughter of thebu¤alo in particular was pivotal in the rise of the Conservation movementin the late 19th and early 20th century. Almost all of the important playersin the Conservation movement experienced the slaughter �rst hand - TeddyRoosevelt, John James Audobon, John Muir and William Hornaday.22 Thecreation of the national park system in general, and the Yellowstone herd inparticular, are a direct consequence of the revulsion many felt to the slaughteron the Great Plains. Because of these e¤orts, over 300,000 bu¤alo are alivetoday in reserves and commercial ranches across North America.
2.5 Bu¤alo Biology
Bu¤alo are enormous animals. Mature males are 10-12 feet in length, 6.5feet in height, and weigh up to 2500 lbs. Female bu¤alo are proportionatelysmaller but still very large weighing up to 1500 lbs. They are also surprisinglyagile given their size and weight: bu¤alo can broad jump over 15 feet, jump 6foot high fences and run at a top speed of 40 m.p.h. for several miles. Bu¤alohave very poor eyesight, good hearing and a very acute sense of smell. Theirnatural predators are few: grizzly bears are an occasional predator, whilewolves are a threat to the herd�s sick, old and the very young.Bu¤alo are perhaps more fecund than cattle with rates of net fertility in
the range of .15-.25. Breeding can occur at anytime of the year but peakseason is from early June to the fall. In a well nourished herd, 85 to 90%of the mature cows will bear a calf in the spring. Not surprisingly, giventheir original abundance, bu¤alo make very e¢ cient use of prairie grasses.While they have four stomachs like cattle and other bovines, their slowermetabolism withdraws more energy from the same grass.23
These features of bu¤alo biology determined much of their history. Giventheir size, dexterity and speed, killing a bu¤alo using stone tools is not asimple task. Even though natives used bu¤alo jumps, surrounds, and pensto kill bu¤alo en masse, subsistence hunting could only have a small impact
22The badge worn by National Park Service employees features a bu¤alo bull modeledafter the bull killed and mounted by Hornaday in his bu¤alo diorama. Hornady becamethe �rst director of the Bronx Zoo, and was the �rst head of the American Bison Society.The bu¤alo bull imortalized on the bu¤alo nickel was modeled after a large bull in the livebu¤alo collection created by Hornaday at the Bronx Zoo. There are numerous Hornadayawards given by Conservation groups all across America.23See Lott (2002).
14
on a population with such a robust growth rate. Before European contact,bu¤alo numbers were kept in check by natural and not man made limits.Given their 3 million square miles of range, huge bu¤alo herds result.Two other features of bu¤alo biology play an important role in their
history. Bu¤alo divide into sex segregated herds for much of the year. Bullherds and cow-calf herds are the predominate forms, although for some timeof the year yearlings also separate. Only during the spring and summer (Maythrough August depending on location) do these herds meet and congregateon the open plains. During the rest of the year the herds divide up intomuch smaller groups of 60 to 100 that seek out small river valleys and othersheltered locations where vegetation is more plentiful and winter storms lesssevere. As a consequence, the time to e¢ ciently kill large numbers of bu¤alois in the summer months when they are concentrated on the open plains.24
While hunting in winter meant facing di¢ cult winter conditions, �ndingonly small groups of bu¤alo, and obtaining less meat from the leaner bu¤alo,it is during winter that the bu¤alo�s thick coat reaches its pinnacle. Startingin early fall, bu¤alo regrow their winter coat which they then subsequentlyshed in the spring. Winter coats are dark and thick and make handsomebu¤alo robes when tanned; summer coats are thin, scru¤y and not suitablefor the robe market. Bu¤alo hides suitable for "bu¤alo robes" were takenonly during three months of the winter, and some bu¤alo on the southernmostranges never sported a robe worth taking.These last two features of bu¤alo biology played a critical role in limiting
the market for bu¤alo products. When bu¤alo were easy to kill, their robeswere virtually worthless; when they were di¢ cult to kill, their robes werevaluable. Nature inadvertently endowed the bu¤alo with a defense againstover exploitation.European contact and the conversion of lands east of the Mississippi to
agriculture, changed the bu¤alo�s limiting factor from nature to man. Hunt-ing increased and was spurred on by both a domestic and world demand forbu¤alo robes, but this demand could not exceed a supply constrained by thenatural rhythms of bu¤alo biology and the supply bottleneck created by alaborious native tanning process. Even after the civil war, the Great Plainswere virtually deserted, and this left the bu¤alo much of the most produc-
24The herds could be immense with many reported herds containing 50 to 100 thousandanimals. Colonel Irving Dodge in 1871 came across a herd along the Arkansas river nearFort Larned that was subsequently estimated (by Horndady see (1889, p.390) to contain4 million bu¤alo. Dodge�s original account is contained in Dodge (1877, p.120).
15

tive mid-grass prairie in Kansas, Oklahoma and northern Texas. Absent aninnovation that made full time bu¤alo hunting possible, the bu¤alo popula-tion would have trended slowly downward for decades as it had east of theMississippi. History however was not so kind to the bu¤alo.
3 The Model
I develop a simple dynamic model where agents hunt for bu¤alo or work inthe outside good sector. Bu¤alo hunters were typically young single menwith relatively low opportunity costs and limited skills. Many were civilwar veterans or new immigrants who had moved west seeking their fortune.Their alternative occupations as laborers in frontier towns, cow punchers,soldiers, or railroad crew workers rarely paid very well.25 To someone withlimited skills, except perhaps with a ri�e, bu¤alo hunting was a potentialroad to riches.Not surprisingly, entry and exit from bu¤alo hunting was common. In-
deed the explosion of activity at the start of hide hunting in the early 1870swas nothing less than spectacular. Historic accounts describe an industry ofhunters that grew from a small cottage industry that supplied nearby townsand railroad crews with meat to an army of thousands that lined rivers andclosed o¤ all avenues of escape. Since the entry and exit margin is so impor-tant to capture, I will determine the number of active hunters endogenouslywhile representing the pool of potential hunters by a continuum of agentswith mass N.
3.1 Individual Decisions
Potential bu¤alo hunters were distributed throughout the Great Plains, butconcentrated in small towns and forts near known bu¤alo ranges. I assumepotential hunters di¤er in their hunting skill but are equally productive work-ing in any one of the number of low-skilled occupations represented by theoutside good sector. Di¤erences in hunting skill are important in determin-
25Teddy Roosevelt described them as "absolutely shiftless and improvident; they hadno settled habits; they were inured to peril and hardship, but entirely unaccustomed tosteady work; and so they a¤orded just the materials which to make the bolder and moredesperate kinds of criminals", Roosevelt (1889, p.13). More detailed, and less harsh,personal accounts are compiled in Gilbert et al. (2003).
16
ing a margin for entry and exit, but they also re�ect the very real fact thatsome hunters are simply better than others.When faced with the opportunity to hunt, a potential hunter has two
choices: ignore the herd and remain in the outside good sector; or join inthe hunt. If an agent hunts, they earn the value of harvest ph over the nextincrement of time dt, where h is the quantity of bu¤alo killed and p the priceof bu¤alo products obtained from a kill. If the hunter remains in the outsidegood sector they earn the value of their marginal product given by their wagew. All prices and costs are measured in terms of the outside good which wetake as the numeraire; therefore p is the relative price of bu¤alo products.Let S(t) denote the size of the bu¤alo herd in physical units at time
t. Then assuming a hunter�s productivity is proportional to the size of theherd, a hunter with skill � earns ph = p�S(t) per unit time.26 To allow forskill di¤erences across hunters let � 2 [0;
_�] with F (�) being the distribution
function of hunting skill.27 With these assumptions in place the marginalhunter, if one exists, is de�ned by his/her productivity, ��, such that:
p��S = w (1)
where the dependence of S on time has been suppressed. Assuming freeentry and exit, we obtain a simple division of agents at any point in time.Any potential hunter with skill � � �� hunts; the remainder work in theoutside good sector.28
3.2 Resource constraints
Two aggregate constraints close the model. The �rst is simply an adding upconstraint. Agents hunting plus those in the outside good sector must addup to the entire population. If the mass of potential hunters is N , the total
26Setting ph = p�(S(t)) with (0) = 0, 0 > 0; and 00 < 0 makes little di¤erence tothe results.27Some productivity �gures are available in the literature; for example, W.S. Glenn
reports that a remarkable hunter can kill 75-100 per day; an average hunter 50; a commonhunter 25, and others hardly enough to run a camp. See Strickland (1949).28There were �xed and sunk set up costs in hunting which I am ignoring here for
simplicity. An earlier version of the model allowed hunters to make a truly dynamicinvestment decision when they choose to hunt. The more complicated model yieldedpredictions very close to those given by this simpler set up. Occam�s razor, and seminarparticipants, pushed me to adopt the simpler speci�cation.
17
number of active hunters is N [1�F (��)], while NF (��) work in the outsidegood sector. Since �� > 0 (recall 1), the outside good is always produced.Assuming constant returns in the outside goods sector, and choosing unitssuch that output equals labor input, w = 1 at all times.The second constraint links the bu¤alo kill to the evolution of herd size.
De�ne K(��; S), as the number of bu¤alo killed per unit time when the herdis of size S, and agents with productivity no less than �� are engaged inbu¤alo hunting; that is:
K(��; S) = SN
_�Z
��
�f(�)d� (2)
where the density of bu¤alo hunters with productivity � is F 0(�) = f(�),their mass is Nf(�), and their productivity in hunting is �S. I refer to2 as the kill function. Since the marginal hunter is determined at everymoment in time by the prevailing price and herd size using 1, we obtain witha slight abuse of notation, K(��(p; S); S) � K(p; S). K(p; S) is the numberof bu¤alo killed per unit time when the herd is of size S, and the price ofbu¤alo products is p.To determine how the kill responds to herd size, di¤erentiate 2 to obtain:
dK(p; S)
dS= N
_�Z
��
�f(�)d��NS��f(��)d��
dS> 0 (3)
where d��
dS< 0, from 1. When the herd grows in size two things happen: the
productivity of inframarginal hunters rises, and new hunters enter as huntingnow generates rents for even the low skilled. The combination of increasedentry and greater productivity for those already present means bu¤alo killsrise with herd size.When the herd becomes small just the opposite occurs: agents exit and
average productivity drops. As a result, there will exist a herd so smallthat only the most skilled �nd it worthwhile to hunt. Since the highestproductivity hunters have productivity,
_�, the smallest herd size ever hunted,
Ss must satisfy: _� = w=pSs (4)
When p is su¢ ciently high we have Ss � C where C is the carrying capacityof the Great Plains.
18
Rational agents will never hunt a herd if S < Ss. Taking this complica-tion into account, the kill function becomes:
K(p; S) = 0 if S � Ss (5)
K(p; S) = NS
_�Z
��
�f(�)d� if Ss < S � C
To determine the dynamics of herd size I combine the kill function withan assumption on how the herd grows over time. For simplicity, I assumeherd size grows in accordance with a standard compensatory growth functiondrawn from resource economics. Biological growth, G(S), is assumed to bea positive (strictly) concave function of herd size. Natural growth is zerowhen the bu¤alo are gone G(0) = 0, and zero when the bu¤alo reach thecarrying capacity of the Great Plains, G(C) = 0.The evolution of herd size can now be written as:
�S = G(S)�K(p; S) (6)
With no hunting at all, K(p; S) = 0 and the bu¤alo population would returnto its carrying capacity C. With active hunting the herd will be smaller, andcould in principle be driven to zero depending on parameter values. Solving6 (subject to an initial condition) generates a time pro�le for the bu¤aloherd, the kill, hunter numbers, and the output of the outside good.
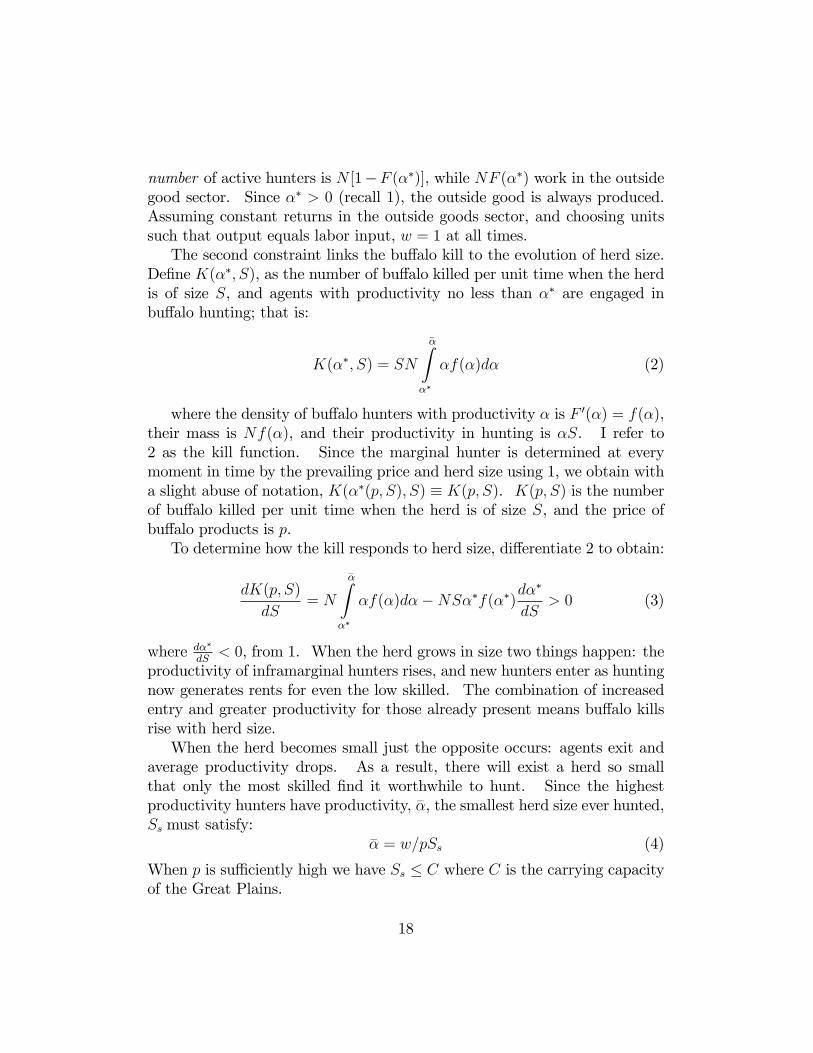
3.3 Steady State Solution
A typical interior steady state is shown in Figure 1. The growth functionG(S) starts at S = 0, rises and then returns to zero growth when the herdreaches its carrying capacity at C. A typical kill function is also shown. Thekill is zero for small herd sizes, but at Ss (p) hunting begins and then growsin intensity. The kill function is not necessarily convex (as shown), but evenwhen it is not, under mild conditions, there is a unique interior solution .
Proposition 1. Assume: C > Ss, then there existsi) a unique interior steady state herd size S� 2 [Ss; C];ii) a unique marginal hunter ��(p; S�) 2 (0;
_�); and,
iii) a unique division of agents across activities.Proof: See Appendix A.
19
Uniqueness and existence are guaranteed by very weak conditions. Aninterior steady state can only exist if bu¤alo hunting is pro�table for someagent at some herd size. If the carrying capacity is greater than the smallestpro�table herd size we have C > Ss, and p
_�C > w from 4. This implies
bu¤alo hunting can provide rents to the most productive hunters when theherd is close to carrying capacity. The steady state also determines theproductivity of the marginal hunter �� = m(p; S�), the number of huntersN [1�F (��)], their aggregate kill K(p; S�), and the number of agents in theoutside good sector NF (��).It is clear from Figure 1 that the interior steady state is globally stable.
Starting from any positive stock level S > 0, convergence to the steady stateis monotonic. If the initial stock is very low, no hunting occurs, the bu¤aloherd grows in response and this brings about the introduction of hunting anda reduced rate of herd growth. Starting with a very large herd size, the killexceeds natural growth and herd size falls. For future purposes we note:
Proposition 2. When a unique interior steady state exists, it is globallystable. Starting from any positive bu¤alo herd size S > 0, convergence tothe steady state is monotonic.Proof: See Appendix A.
3.4 Slaughter on the Great Plains
For the most part I focus on the destruction of the Southern Herd as this wasthe immediate result of the tanning innovation and signalled the introductionof the hide market.The introduction of bu¤alo hide tanning was a positive price shock for
bu¤alo products. Before the tanning innovation, a bu¤alo hunter would killfor some combination of the animal�s meat (including the tongue) and robe.A bu¤alo kill was a joint product yielding a �xed ratio of several outputseach with its own price. Once the tanning of bu¤alo hides was possible, thecomposition of these outputs changed to include hides. Historic accountsare clear that the introduction of the hide market vastly increased the returnto bu¤alo hunting so that most meat was left to rot on the plains, and killingtook place in regions where robes were of poor quality (much of the southernU.S.) and at times of the year when robes were virtually worthless. All ofthis implies that we should model the impact of the tanning innovation as
20
raising the e¤ective price for a bu¤alo kill from p to p0.29
The historical account is also fairly clear that before the tanning inno-vation, bu¤alo numbers were falling although slowly. Hunting pressure andeventually habitat destruction would have led bu¤alo numbers to fall as theyhad east of the Mississippi, but the strength of these two forces was weak inthe 1860s. To capture this feature of the pre-1870 period, I assume the econ-omy was operating somewhere along its transition path to an initial steadystate when the price shock hit.
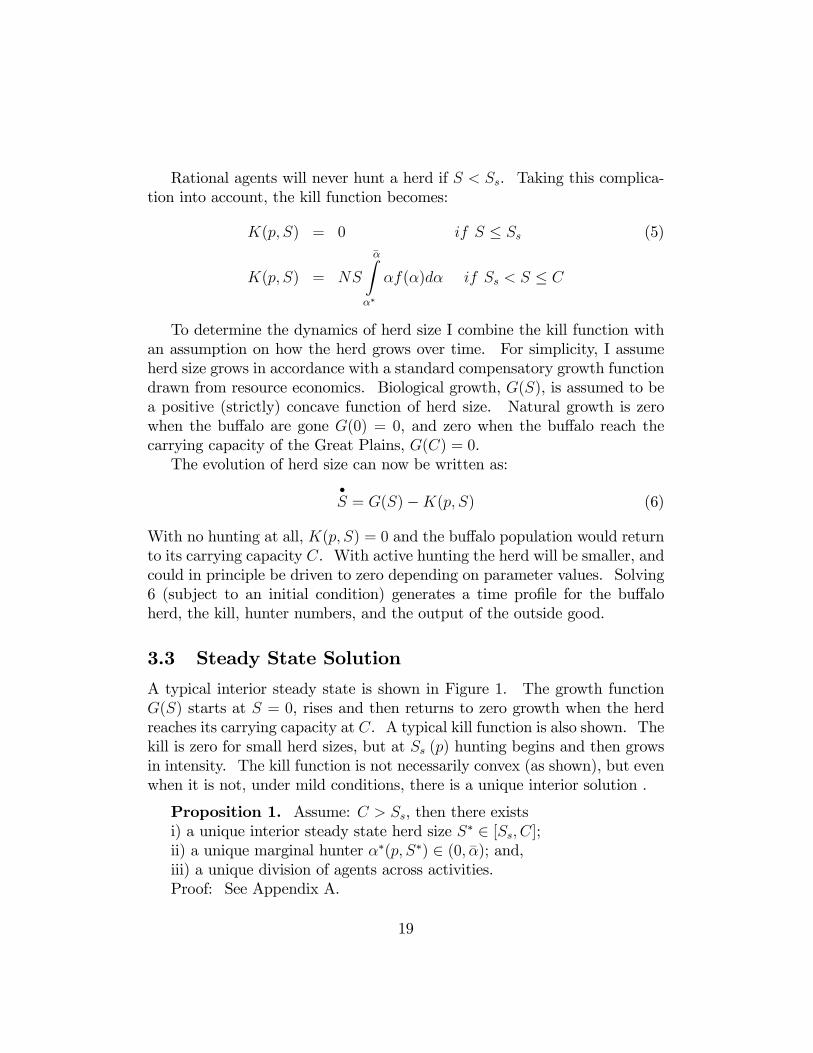
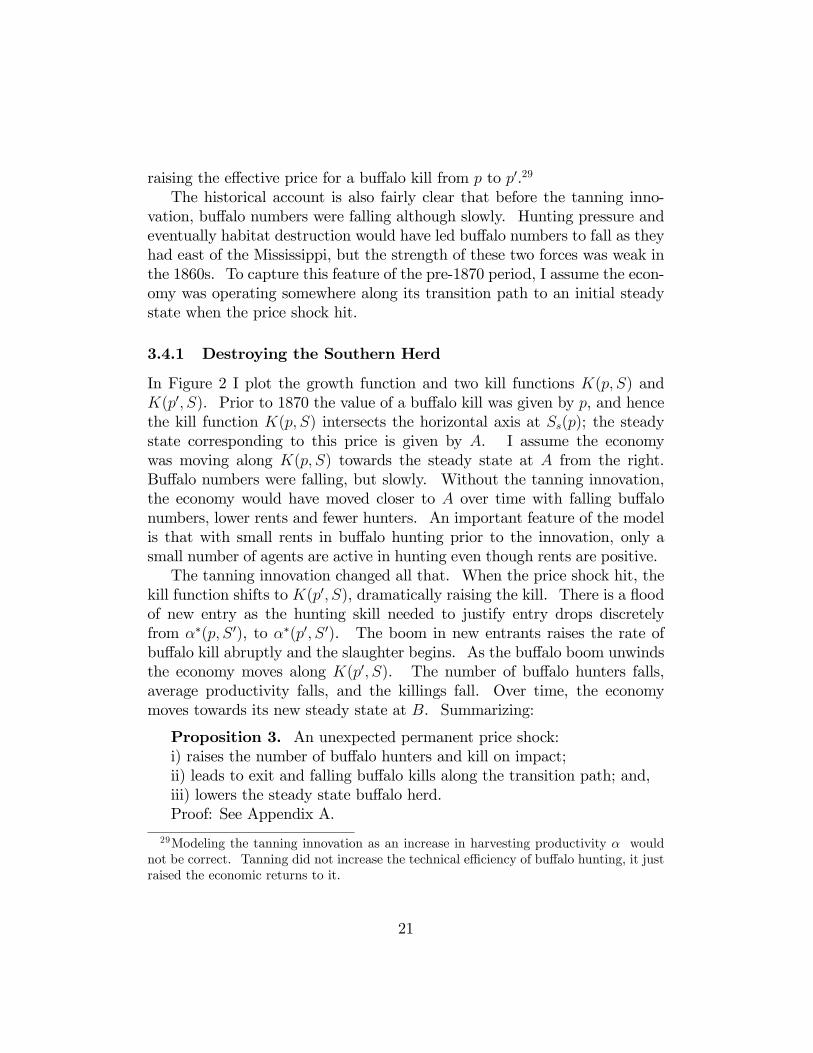
3.4.1 Destroying the Southern Herd
In Figure 2 I plot the growth function and two kill functions K(p; S) andK(p0; S). Prior to 1870 the value of a bu¤alo kill was given by p, and hencethe kill function K(p; S) intersects the horizontal axis at Ss(p); the steadystate corresponding to this price is given by A. I assume the economywas moving along K(p; S) towards the steady state at A from the right.Bu¤alo numbers were falling, but slowly. Without the tanning innovation,the economy would have moved closer to A over time with falling bu¤alonumbers, lower rents and fewer hunters. An important feature of the modelis that with small rents in bu¤alo hunting prior to the innovation, only asmall number of agents are active in hunting even though rents are positive.The tanning innovation changed all that. When the price shock hit, the
kill function shifts to K(p0; S), dramatically raising the kill. There is a �oodof new entry as the hunting skill needed to justify entry drops discretelyfrom ��(p; S 0), to ��(p0; S 0). The boom in new entrants raises the rate ofbu¤alo kill abruptly and the slaughter begins. As the bu¤alo boom unwindsthe economy moves along K(p0; S). The number of bu¤alo hunters falls,average productivity falls, and the killings fall. Over time, the economymoves towards its new steady state at B. Summarizing:
Proposition 3. An unexpected permanent price shock:i) raises the number of bu¤alo hunters and kill on impact;ii) leads to exit and falling bu¤alo kills along the transition path; and,iii) lowers the steady state bu¤alo herd.Proof: See Appendix A.
29Modeling the tanning innovation as an increase in harvesting productivity � wouldnot be correct. Tanning did not increase the technical e¢ ciency of bu¤alo hunting, it justraised the economic returns to it.
21
The transition path exhibits overshooting in the number of hide huntersfor a simple reason: rents cannot last. Relatively high cost hunters enter to-day knowing that this will be a short-lived game, and as the herd diminishes,more and more hunters retire from bu¤alo hunting. Only those with very lowhunting costs remain in the industry. The new steady state features morehunters chasing fewer but more valuable bu¤alo, with the marginal hunteragain receiving no rents at all.It is apparent from the �gure that both the bu¤alo herd and the number
of bu¤alo hunters adjusts when prices rise. Surprisingly, the steady statebu¤alo kill may rise or fall in response. The kill rises if the bu¤alo herdexceeded C=2 prior to the price shock and the price shock itself was marginal.In all other cases it falls. Since Hornaday estimated that less than 100bu¤alo were left in the wild by the late 1880s while C is perhaps 25 million,the S� < C=2 case is most relevant to our discussion. In this case, theaggregate kill, in steady state, falls with the price shock.
3.4.2 Destroying the Northern Herd
The history of the Northern Herd is slightly more complicated. By the mid1870s, the innovation and the advent of the �int hide market were all in place,but the boom in northern hunting did not occur until 1881. The reason forthe delay seems to be the hostile Sioux nation.30 The Sioux nation was thelast signi�cant Indian threat in the U.S., and after the defeat of Custer in1876 the U.S. Army began an unrelenting campaign to eliminate this threat.It was only in the early 1880s that the remaining Sioux were either killed orsettled peacefully on reservations. The legendary Crazy Horse surrenderedin 1877, while the chief who defeated Custer - Sitting Bull - surrenderedin 1881. During most of this period, hide hunting in the north was verydangerous. At virtually the same time, the Northern Paci�c railroad madeits way into Montana. This surely lowered transport costs and raised theprice bu¤alo hunters could obtain for a kill.In terms of our model, the change in hunter safety could be taken as
an exogenous shift rightward in the distribution F (�). The new railroadwould represent a small price shock, since transportation along the Mis-souri by steam ship was already an available and well used transportation
30At this time, the Sioux, Northern Cheyenne and Northern Arapho were not yet partof the reservation system. They were led by the most important non-treaty chief: SittingBull.
22
option. These two shocks work in much the same way and generate thesame dynamics as the initial tanning innovation. Therefore, while it is un-clear what determined the exact timing of the Northern Herd�s slaughter,the model�s assumptions combine to deliver excessive hunting, overshooting,and a punctuated bu¤alo slaughter. These are important features of thenorthern slaughter.
3.5 The Autarky Counterfactual
The model does a reasonable job in replicating the broad features of whatwe know about the hide hunt. The tanning innovation created a great dealof entry that was subsequently followed by exit. Early hunters earned largerents as they often left to buy ranches, saloons, or set up stores in frontiertowns.31 Late entrants and the stragglers seemed to do less well. Althoughthe model is successful in replicating the historical record, it does rely ona �xed price for bu¤alo products. As such it implies that large exportsof bu¤alo hides must have occurred over this period, and this is yet to beproven.An alternative hypothesis is that tanneries in the eastern U.S. provided
the demand for hides, and in many accounts a strong U.S. domestic demandfor leather is implicated in the slaughter. Evidence for this connection ishowever weak. Apart from the price quotes for bison sole leather in theN.Y. market for 1878 and 1879 (which I discovered), and some mention ofeastern tanneries in Hornaday, I have been unable to �nd any direct evidencein the form of shipments, tanned hide output, etc.32 Census �gures from thisperiod argue against the large scale use of bu¤alo in tanning, since the totalmeasured input of raw hides into U.S. tanning and currying, falls short ofthe number of cow hides imported plus the (estimated) domestic slaughter.This leaves no room at all for the millions of bu¤alo hides to be used in theU.S. tanning industry. These census �gures are only for two years, 1870 and1880, and we have only estimates for the domestic cow slaughter. Therefore,the data is not de�nitive on this issue, and it is useful to ask if the market
31See Gard (1955), the personal accounts reported in Gilbert et al. (2003), and thehighly entertaining �rst person account of Frank Mayer "the last living bu¤alo hunter"in Mayer and Roth (1958).32There is an often repeated story of 57 hides sent by Wright Moar to his brother in
N.Y. city who then sold them to Pennsylvannia tanners thus starting the U.S. domesticmarket.
23

had been purely domestic what would have happened to the bu¤alo? Is a�xed price and robust export market necessary to explain the slaughter onthe plains or is it merely su¢ cient?To examine these questions I develop an autarky counterfactual by in-
troducing domestic market clearing. Since the elasticity of demand oughtto be critical in determining the price response, I adopt a constant elasticityof demand formulation where tastes over the two goods: hides and manu-factures (the outside good) are homothetic. I again solve for the model�ssteady state and examine the response of hide hunters to a shock that raisesthe value of a bu¤alo kill (by making their hides useful leather products).I start by solving for the market clearing price, and then link the equi-
librium price to the prevailing herd size and solve for the marginal hunter��(p; S). This initial step is necessary because the dynamics of entry andexit are now more complicated as price adjustment alters the entry decision,while entry a¤ects price adjustment.
3.5.1 Market Clearing
The relative supply of hides to manufactures at any point in time is given bythe bu¤alo kill divided by output from the outside good sector.�
H
M
�S=
K(p; S)
F (��(p; S))N= RS(p; S) (7)
where ��(p; S) is implicitly de�ned in 1.33
The relative supply of hides to manufactures is increasing in p becausemore agents enter bu¤alo hunting and this generates larger kills while reduc-ing labor in the outside good sector. An increase in herd size has a similare¤ect.Relative demand is independent of income and can be written as:�
H
M
�D= '(p) = �[p]�� (8)
where � > 0 is a demand shifter. Equating supply and demand solvesfor the equilibrium price pe as a function of herd size and other parameters.
�[pe]�� = RS(pe; S) (9)
33RS(p; S) = 0 for p � w=_�S, and is positive otherwise; i.e. there exists a minimum
price needed to generate hunting at any stock.
24
Di¤erentiate 9 with respect to the herd size to �nd, after some rearrange-ment,
dpe
dS
S
pe= �
�1 + "rs;p� + "rs;p
�< 0 (10)
where "rs;p > 0 is the elasticity of the relative supply curve with respectto p.34 With this result in hand it is now possible to prove an importantintermediate result:
Lemma 1. Bu¤alo hunter numbers rise, stay constant, or fall with anincrease in the bu¤alo herd, S, as � is greater than, equal to, or less thanone in magnitude.Proof: See Appendix A.
The intuition for Lemma 1 is simple and familiar. Assume the number ofhunters in the �eld is �xed, and consider an increase in herd size. Relativesupply shifts outwards, lowers prices, and increases the quantity of bu¤alokilled. When demand is unitary elastic, the price decline is exactly matchedby the increase in herd size (evaluate 10 at � = 1). Therefore, the marginalhunter is indi¤erent to exit as before (recall 1), and the number of huntersin the �eld is una¤ected by herd size.When demand is inelastic, the quantity impact of the change in S is
swamped by the resulting price reduction. The marginal hunter must bemore able than before, �� rises, and exit occurs. When demand is elastic alarger herd size lowers prices only slightly and this tempts new - relativelyunproductive - entrants to join in the hunt.Not surprisingly, Lemma 1 has an important bearing on the model�s pre-
dictions. Using lemma 1 we know that when � is equal to one, �� is inde-pendent of herd size.35 The kill function is a straight line through the origin.When � is greater than one, d�
�
dS< 0, and the kill function is positively sloped
as it was before. In both of these cases we can employ the techniques usedin the proof of Proposition 1 to show the autarky steady state is also unique.But when � is less than one we cannot rule out a negatively sloped kill func-tion and multiple steady state equilibria. Despite these complications, wecan proceed. To do so we need another intermediate result.
34See the proof to Lemma 1 for a derivation.35In this case the marginal hunter is still fully determined. �� adjusts so that the share
of aggregate income spent on bu¤alo products is equal to the constant Cobb-Douglas share.
25
Lemma 2. A positive demand shock d� > 0 shifts the kill functionupwards and raises the domestic price for any given herd size, S.Proof: See Appendix A.
Lemma 2 tells us that an autarky demand shock created by the adventof tanning drives the price of �int hides upwards and raises the kill for anyherd size. Using Lemma 1 and 2 we can now prove.
Proposition 4. Starting from any stable steady state, an unexpectedand permanent demand shock, d� > 0:i) lowers the steady state bu¤alo herd, S;ii) raises bu¤alo hunter numbers on impact;iii) leads to falling (constant, rising) hunter numbers along the transition
path if � is greater than (equal to, or less than) one in magnitude.Proof: See Appendix A.
Proposition 4 tells us that the autarky counterfactual can only deliver aboom and bust pattern in hide hunting when demand is su¢ ciently elastic.When the innovation arrives the demand for bu¤alo shifts upwards along agiven supply curve. The surge of new entrants raises the kill on impact. Overtime the herd shrinks, the supply curve shifts back, prices rise and hunternumbers adjust to the combination of changing prices and a shrinking herdsize. When � is greater than one the transition period exhibits excessiveinitial entry and then exit along the path to the new steady state. Whendemand is unitary elastic, the initial surge of entry is followed by zero exit,and when demand is inelastic the initial entry is followed by further entry overtime. In all three cases, hide prices rise as the bu¤alo slaughter continues.The autarky counterfactual is important in demonstrating that the pat-
tern of boom and bust experienced on the Great Plains is consistent withthe slaughter being fueled by the tanning innovation together with an elasticdomestic demand for bu¤alo hides. While several authors have argued thatthe U.S. had a large domestic demand for industrial leather at the time andthis demand was pivotal in the slaughter, these accounts become less persua-sive in the face of evidence that the innovation was foreign made, that hideprices did not rise over the period, and that bu¤alo hide exports represent asigni�cant portion of the slaughter.
26
4 Empirical evidence
A natural consequence of the rapid and violent slaughter of the bu¤alo is thatrecords of the number of bu¤alo killed are non-existent. Existing academicwork instead relies on a variety of sources to quantify the extent and timingof the kill. One common estimate of the slaughter�s magnitude starts withestimates of an initial stock of bu¤alo using carrying capacity estimates ofthe Great Plains and then �nishes with the observation that by the late1880s the number in the wild was estimated at less than 100. The di¤erencesay, between a mid century estimated population of 15 million, and the �nal�gure of 100 represents the slaughter. While this procedure is valuable insetting rough parameters for a more detailed accounting, it says little aboutthe pace of the slaughter, its geographic location, or its ultimate cause.An alternative approach is to employ data that is available on shipments
of hides by the railroads operating in bu¤alo country and then amend theseto take account for wastage prior to delivery. In the mid-1870s, ColonelRichard Irving Dodge contacted the three major railroads serving the mainbu¤alo hunting areas. Dodge contacted the Atchison, Topeka and Santa Fe,the Kansas Paci�c and the Union Paci�c railroads asking for data on theshipments of bu¤alo products. Of these three, only the Atchison, Topekaand Santa Fe (ATS) responded and provided �gures for hides shipped in1872, 1873 and 1874.36 It is important to note that these three numbers (onefor each year) for hides shipped are the only data available on the number ofbu¤alo killed in the Southern Herd. Additional numbers are often presentedin secondary sources, but these additional data come from either extrapo-lations, estimated wastage adjustments, or estimates of kills by natives andsettlers.Dodge makes two adjustments to the shipping numbers. First, to correct
for the non-response of the other two major railroads, Dodge multiplied ATSnumbers by three since he viewed the other two as equally likely to haveshipped as many hides. Second, to account for the loss of killed or injuredanimals on the ground or the ruining of hides in skinning or transport, Dodge
36The lack of enthusiasm in reporting shipments is not surprising. Most of the statesin the Great Plains were considering or had put in place restrictions on bu¤alo hunting;in addition, sentiment out East was moving against the slaughter. The railroads howeverneeded cartage business and would not have wanted the bad publicity - and perhapsfederal legislation - such revelations could have brought. A good account of the history ofrestrictions on bu¤alo hunting can be found in Hanner (1981).
27
in�ates individual year shipment data by a factor representing the ratio ofbu¤alo killed to bu¤alo hides shipped. In the �rst years of the slaughter,waste was very high and Dodge estimates that in 1871 every hide shippedrepresents �ve dead bu¤alo. In 1872 this falls to three, and by 1873 oneshipped hide represents two dead bu¤alo; �nally in 1874 there was very littlewaste with one shipped hide representing one and a quarter dead bu¤alo.By these methods, Dodge arrives at the estimate of a little over 3 millionbu¤alo killed from 1872-1874 on the Southern plains. Hornaday (1889) addsto Dodge�s estimate a �gure representing hunting by natives and settlers toarrive at an estimate of 3.7 million.Estimates of the slaughter in the north are more tenuous. The northern
shipping point was Fort Benton, located in northern Montana on the Mis-souri until the Northern Paci�c Railroad hit Miles city. Koucky reports thenumber of hides shipped in the peak years of 1881 and 1882 at 270,000.37
Hornaday estimated that the kill o¤ in the north must have been less than1.5 million.It is obvious from this account that very little is known with certainty
about the magnitude and pace of the slaughter. Many observers lamentedthe sorry state of the plains at this time - the lines of putrid carcasses, thebone �elds, and the large stack of hides at railroad stations. From these it isclear that a punctuated slaughter did occur, but its extent and exact timingare far less certain. Individual eye witness accounts add colorful descriptionto more factual accounts, but are not of much use in distinguishing betweena slaughter of say 3 million and one of 10 million.To examine the potential role of international trade in the bu¤alo�s demise
it is of course natural to look at trade statistics, which until now, haveapparently been ignored by researchers in this area. The bene�t of tradestatistics is that they often provide estimates of key physical and value �owswhen production data are known to be either incomplete or entirely absent.Governments have a strong incentive to record and meter the value andvolume of materials entering and leaving their country since import andexport taxes were a major source of revenue at the time. Accordingly, tradestatistics often tell a story where production statistics alone cannot. Thesame appears to be true here, although with some caveats.
37Robinson (1995, p.140) however presents larger estimates. 250,000 from a dealer H.F.Douglas, another 180,000 from Custer county, and an additional 200,000 hauled on theNorthern Paci�c. I have been unable to �nd corroborating primary source evidence forthese �gures.
28
4.1 Bu¤alo Hide Exports
I employ a multi-step procedure for identifying bu¤alo products in the in-ternational trade statistics. The procedure starts with the value of U.S.hide exports from 1865 to 1886.38 To ensure that these are not re-exportsfrom Canada, Mexico or other countries, I employ an exports from domesticproduction series.I start by converting hide values into hide numbers by de�ating value
�gures for exports, using estimates for hide prices. Hide prices are providedinconsistently in the series. I generate a complete price series by taking indi-vidual estimates provided in the data and �lling in the gaps using a price in-dex for leather and leather products provided by Warren and Pearson (1933).The constructed price series is then checked against other individual pricequotes found in the literature. For example, an additional source for pricedata is the series of Annual Reports of the New York Chamber of Commercewhich report prices for important items in the New York market.39 Oneitem consistently reported over this period is sole leather (hemlock tanned).This price series can be used in place of the Warren and Pearson index asa check on our initial construction. There are also numerous price quotesgiven in historical documents that list prices paid to hunters for hides orrobes. For example, Hornaday (1886, p.439-440) contains two hide priceseries from the 1880s. These prices are for hides inclusive of delivery to east-ern markets: one gives prices ranging from $2.85 in 1880 to $3.25 in 1884,while the other presents slightly higher prices at $3.50 per hide throughout.As with other sources, this data is infrequent, varies with the location of thehunter, and the type of hide sold (bull, cow, calf, etc.). My own readingof diary accounts and other primary sources indicates common price quotesof $2.50 for bull hides, $3.00 for cow hides, and $1.00 for calf hides. Pricesappear to have fallen in the late 1870s, and selling hides was di¢ cult duringthe panic of 1873. There are diary accounts of hunters selling hides for aslittle as $.75, but I have not found an account where a hide sold for morethan $3.50. Prices to hunters di¤er of course from the export values sincethey exclude the margins introduced by transportation and distribution. A
38See United States, Department of Treasury, Bureau of Statistics, Foreign Commerceand Navigation of the United States. Available online through Archive of Americana, U.S.Congressional Serial Set, 1817-1980, published by Readex, a division of Newsbank, inc. athttp://infoweb.newsbank.com/.39See State of New York Chamber of Commerce Annual Report for the years 1865-1890.
29
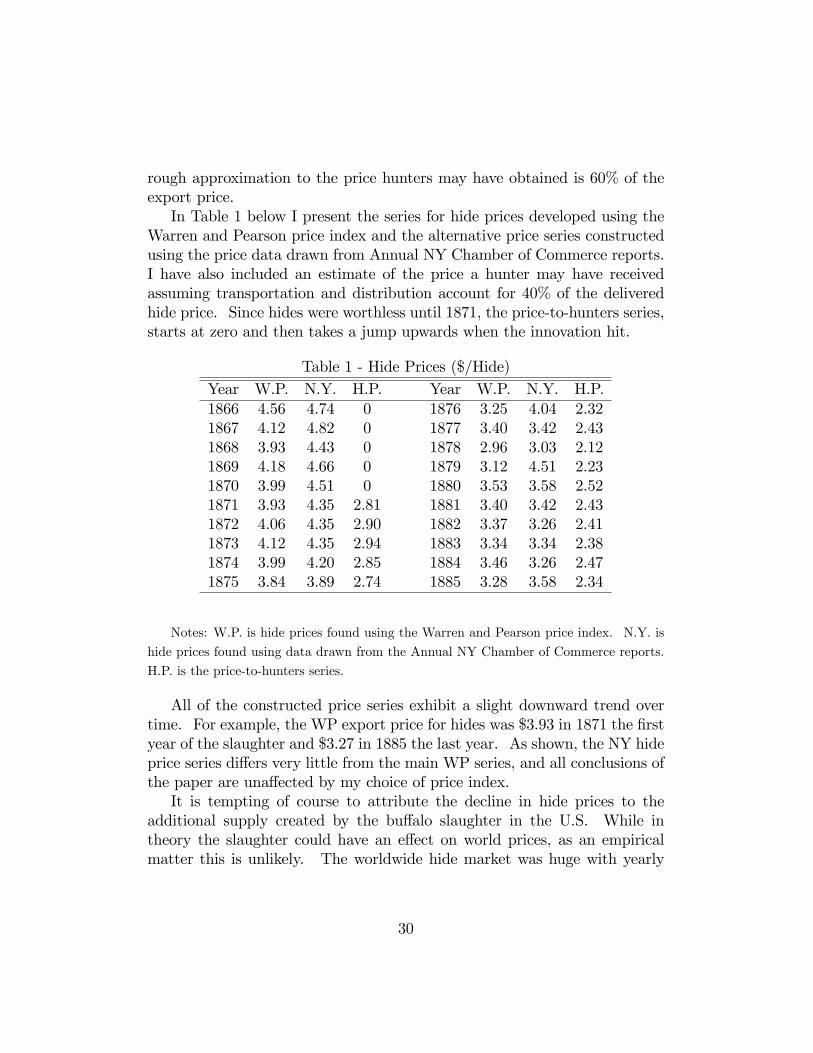
rough approximation to the price hunters may have obtained is 60% of theexport price.In Table 1 below I present the series for hide prices developed using the
Warren and Pearson price index and the alternative price series constructedusing the price data drawn from Annual NY Chamber of Commerce reports.I have also included an estimate of the price a hunter may have receivedassuming transportation and distribution account for 40% of the deliveredhide price. Since hides were worthless until 1871, the price-to-hunters series,starts at zero and then takes a jump upwards when the innovation hit.
Table 1 - Hide Prices ($/Hide)Year W.P. N.Y. H.P. Year W.P. N.Y. H.P.1866 4.56 4.74 0 1876 3.25 4.04 2.321867 4.12 4.82 0 1877 3.40 3.42 2.431868 3.93 4.43 0 1878 2.96 3.03 2.121869 4.18 4.66 0 1879 3.12 4.51 2.231870 3.99 4.51 0 1880 3.53 3.58 2.521871 3.93 4.35 2.81 1881 3.40 3.42 2.431872 4.06 4.35 2.90 1882 3.37 3.26 2.411873 4.12 4.35 2.94 1883 3.34 3.34 2.381874 3.99 4.20 2.85 1884 3.46 3.26 2.471875 3.84 3.89 2.74 1885 3.28 3.58 2.34
Notes: W.P. is hide prices found using the Warren and Pearson price index. N.Y. is
hide prices found using data drawn from the Annual NY Chamber of Commerce reports.
H.P. is the price-to-hunters series.
All of the constructed price series exhibit a slight downward trend overtime. For example, the WP export price for hides was $3.93 in 1871 the �rstyear of the slaughter and $3.27 in 1885 the last year. As shown, the NY hideprice series di¤ers very little from the main WP series, and all conclusions ofthe paper are una¤ected by my choice of price index.It is tempting of course to attribute the decline in hide prices to the
additional supply created by the bu¤alo slaughter in the U.S. While intheory the slaughter could have an e¤ect on world prices, as an empiricalmatter this is unlikely. The worldwide hide market was huge with yearly
30
exports exceeding 100 million US dollars by 1880.40 The US share of thismarket is always small during the relevant period ranging from a high of 3%in 1860 to .5% in both 1880 and 1890. The U.S. was truly a small player inthe world hide market.Finally, while the two or three dollar jump in the value of a bu¤alo hide
in 1871 seems relatively small to have such large e¤ects, it should be remem-bered that a seasoned hunter could kill several thousand bu¤alo a season.Alternatively he could earn perhaps 50$/month as a cattle hand. Clearlyeven at these relatively low hide prices, the rents to hide hunting were po-tentially very large.By using the WP hide price series shown in Table 1, I can now de�ate the
value of hide exports to obtain a volume of hide export series. This seriesis shown in Figure 3 as the top most line with the large bulge centered on1875. The line labelled Total Hides starts from a low of less than 100,000 in1867, peaks at a little over 1.2 million in 1875, then declines until it reaches200,000 in 1880. In the early 1880s, exports cycle back upwards only to fallagain in 1886. I will argue that the large bulge of exports in the mid 1870srepresents the destruction of the Southern Herd, while the smaller bulge inthe early 1880s corresponds to the destruction of the Northern Herd.To eliminate cattle hides from the volume of hide export series I construct
a measure of cattle slaughtered in the U.S. using a well known economicmodel of the cattle cycle. The U.S. Agricultural Department publishes datafrom 1867 onwards on the number of cattle in the U.S. I have graphed thisdata in Figure 3 as Cattle. Since the number of cattle in the U.S. in 1867 isapproximately 25 million and is over 55 million in the late 1880s, the slowlyrising line shown in the �gure is graphed against the alternate right handside axis which is measured in thousands of animals.To move from cattle numbers to an estimate of the number of cattle hides
exported several steps are required.41 First, I employ estimates drawn fromRosen, Scheinkman and Murphy, RSM, (1994) to generate an implied breed-ing stock from the overall cattle numbers. This step is necessary becausenot all cows are fertile, and not all cattle are cows. Using the implied breed-ing stock I then employ RSM�s empirical estimates to generate an impliedyearly slaughter. RSM develop a dynamic forward looking model of cattle
40For information on the magnitude of the world hide market see John R. Hanson, Tradein Transition: Exports from the Third World, 1840-1900, data sets are available online athttp://eh.net/databases/developing.41See appendix B for further details.
31
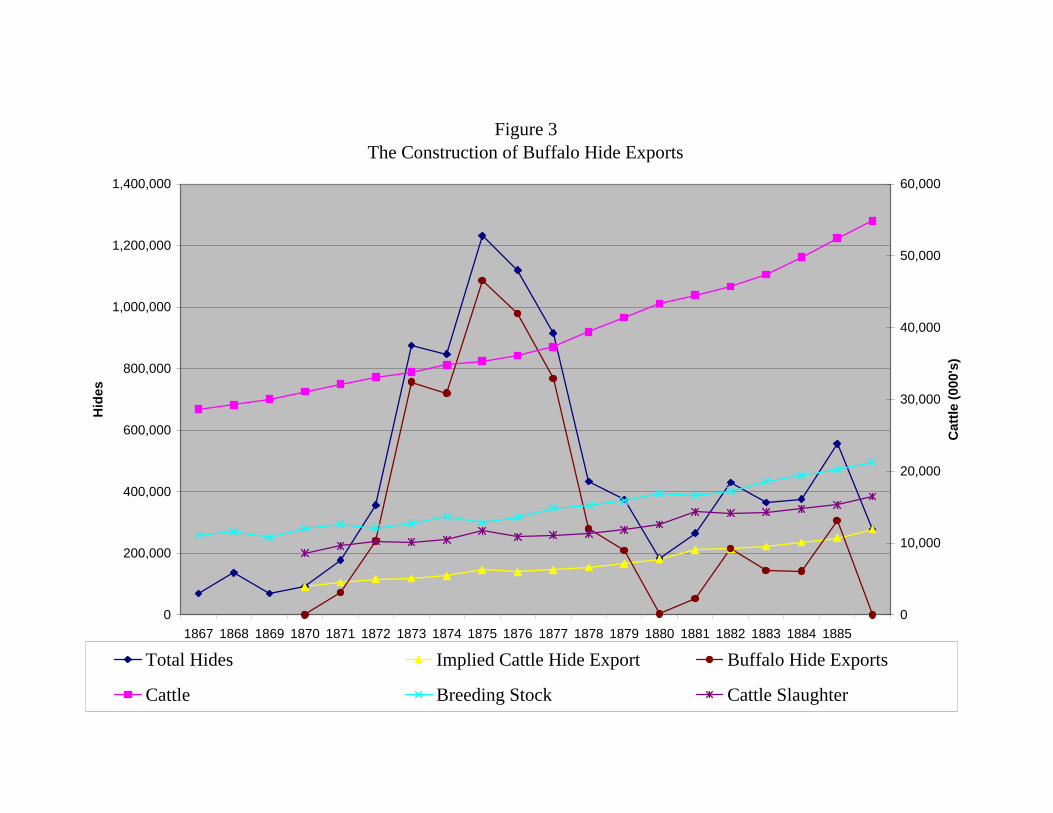
Figure 3The Construction of Buffalo Hide Exports
0
200,000
400,000
600,000
800,000
1,000,000
1,200,000
1,400,000
1867 1868 1869 1870 1871 1872 1873 1874 1875 1876 1877 1878 1879 1880 1881 1882 1883 1884 1885
Hid
es
0
10,000
20,000
30,000
40,000
50,000
60,000
Cat
tle (0
00's
)
Total Hides Implied Cattle Hide Export Buffalo Hide Exports
Cattle Breeding Stock Cattle Slaughter
supply to study the cattle cycle in the U.S. and estimate their model on datastarting in 1867. By employing their estimates I have calculated both theunderlying breeding stock and the slaughter coming from the stock. Theimplied breeding stock and slaughter numbers are shown in Figure 3 andgiven their magnitudes both are graphed against the right hand side axis.The �nal step in the identi�cation of bu¤alo hides in exports uses addi-
tional data from historical sources and makes one further assumption. His-torical sources all agree that prior to 1870, there was no market in bu¤alohides. Up to this point in time, bu¤alo was hunted for its robe, its meator killed for amusement. Without knowledge of how to tan a bu¤alo hide,the hide market was non-existent. This implies that in 1870 U.S. exportsof hides could only be those of cattle. Under this assumption, I �nd thatonly 1% of the hides from slaughtered cattle are being exported in 1870.Similarly, historical accounts indicate that hunting on the northern plainsstopped sometime during the 1883-84 season; shipment of hides down theMissouri by steamboat or via the Northern Paci�c by rail may have endedsometime later, and exports later still because of potential inventory e¤ects.Accordingly, I have assumed that in 1886, the export of hides must againrepresent only cattle. By 1886, I now �nd that 1.7% of the hides fromslaughtered cattle are exported. Using these two points as anchors, I thenuse a linear interpolation for the years in between. Doing so generates thelight colored line representing an estimate of that part of the existing U.S.cattle slaughter that is exported. Subtracting the implied cattle hides fromthe overall hide export numbers yields our estimate for the number of bu¤alohides exported from 1870 to 1886.
4.2 Variation over time and regions
The method of data construction is fairly lengthy and detailed. Were itnot for the absolute paucity of other data on the number of bu¤alo killedor exported, and the existence of other con�rming evidence that I shall nowpresent, there would be little to suggest its acceptance. The series as con-structed however has several desirable characteristics that argue in its favor.First, note that by construction the series reaches zero in 1870 and 1886
(the two "identi�cation points"), but also exhibits a severe dip in hide exportsin 1880.42 1879 was the last year of the Southern hunt; and 1881 the �rst
42It is also worthwhile to note that even the unadjusted export series (with cattle hides
32
signi�cant year of the Northern hide hunt. It is therefore striking that ourconstructed series exhibits a pause as hunters moved from south to north.Further con�rmation comes from other aspects of the series. Using the
series I calculate the implied number of bu¤alo hides exported during theentire 1871-1886 period. It sums to almost 6 million exported hides. Of the 6million hides exported, 5 million hides come from what I am calling the 1870sdestruction of the Southern Herd, and only 1 million from the destructionof the Northern Herd. This is consistent with the accounts of Hornadayand many others indicating the Southern Herd was much larger than theNorthern. For example, Hornaday estimates a northern kill of only 1.5million whereas Figure 1 generates a total close to 1 million. Therefore theseries generates a distribution across geographic region that roughly matchesthe historical account.The total of 5 million killed in the south is however higher than that given
in the estimates of Hornaday and Dodge, but both of these authors severelydownplayed the extent of the Southern Herd destruction that occurred post1874. As shown by the series in Figure 3, while exports peaked in 1875 therewas still substantial hide exports well into the late 1870s. My own reading ofthe historical accounts of bu¤alo hunters (not available to either Hornaday orDodge) indicates that hide hunting of signi�cant magnitude did occur post1874. For example, Dodge reports that in the "last year" of the Southernslaughter, 1874, the number of hides shipped by rail was only 126 thousandfalling from the peak of 750 thousand the year before. New evidence onhide shipments I uncovered in the Annual reports of the New York Chamberof Commerce is inconsistent with this view. For example, the Chamberof Commerce report for 1875/76 states that 200 thousand bison hides wereshipped by rail to the port of New York alone in that year.43 This new datafrom the Chamber of Commerce report strongly suggests the Southern Herdwas not destroyed by 1874 - a fact further corroborated by contemporarynews stories and numerous personal accounts of bu¤alo hunters which make
included) takes a suspicious jump in the early 1870s exactly when the London Times articledates the innovation and reports on a booming trade in hides. Had the series boomed in1868 or 1875 this coincidence in timing would not be present.43The Chamber of Commerce of New York 18th Annual Report for 1875/1876 contains
the throw away line "Included in the receipts by railroad are about 200,000 bison hides",p. 115. Since rail was only one of many transportation routes, and New York only oneof several large export ports, it is reasonable to assume the total number of bison hidesreaching the international market was much higher.
33
it clear that the Southern Herd was not destroyed until 1879.44
When considering the 1872-1874 period alone, my constructed series andDodge�s (constructed) numbers are much closer. For example, Dodge�s es-timate of hide shipments over the 1872-1874 period is approximately 1.4million hides; the implied shipment of hides for exports from Figure 3 issomewhat higher at 1.7 million. Therefore, the magnitude of the SouthernHerd destruction, and its pace in the early years of the slaughter, roughlymatch those available in the literature.
4.3 Across country and across hide variation
Further evidence is available if we exploit the variation across countries inhide exports. Historical accounts of the hide trade reveal that two individualswere critical in its progression. One was a Kansas city pelt trader calledJ.N. Dubois. The standard historical account given by Gard (1960, p. 90)appeared earlier in the paper. Another trader repeatedly mentioned inearly accounts was W.C. Lobenstein. Lobenstein was a well known traderin leather products who sometime in late 1870 or early 1871 started to �llorders for hides to ship to England. Given these historical accounts it isrevealing to note that the geographic distribution of U.S. hide exports o¤erstwo other pieces of con�rming evidence.U.S. export data show the value of hide exports to Germany being negli-
gible in the early 1860s, and then skyrocketing to over $100,000 in 1871-72,rising further to over $500,000 in 1874, and then declining to $50,000 in1880.45 It is striking that the sudden rise in exports of hides to Germany oc-curs just when other historical accounts place J.N. DuBois at center stage in
44For e.g., the Fort Worth Democrat, Nov. 8, 1876, has a front page story titled"Freighters Wanted. The Largest Bu¤alo Hunt Ever Known". The story reports countlessthousands of bu¤alo cover the prairies while the hunt is the largest ever known. Regardingthe end of the hunt see the Frontier Times article "The Last Bu¤alo Hunt Held in theLone Star State", reprinted by the Dallas Morning News Aug. 9, 1925. The article datesthe last hunt to Nov. 1879.45Prior to uni�cation of Germany in 1870, these exports are to cities in the Hanseatic
league; speci�cally Hamburg and Bremen. These towns disappear in the aggregate USexport data in 1870 and are replaced by Germany as an entry. City speci�c export data(from the port of NY) is available in the NY Chamber of Commerce Annual Reports,and these data con�rm that the Hanseatic cities are the leading destinations post 1870.Therefore, a change in the de�nition to German exports is unlikely to be responsible forthe blip in exports.
34

the bu¤alo hide trade. The English data is equally striking. In the post civilwar period, 1866-1870, U.S. hide exports to England averaged $50,000/year.Starting in 1872 however these exports took o¤ rising to over $2 million in1873 and averaging over $1.3 million dollars per year for the next six years.The sudden explosion in exports to England, together with the historicalaccounts of Lobenstein�s activities provides further corroboration.This evidence is however subject to critique. It may be inappropriate to
attribute all of the "explosion in exports to England", or the "sudden rise inexports to Germany" to the impact of the innovation. Exports of hides toEurope may have risen for many reasons. The 1870s was a very tumultuoustime in Europe with German uni�cation in 1870, the Franco-Prussian war in1871, and colonial expansion later in the decade. Perhaps the explosion inU.S. hide exports to Europe re�ects a temporary European event and not theavailability of bu¤alo hides from the U.S. One solution would be to examineU.S. exports to other European countries that did not have the ability totan bu¤alo hides. This however is not possible. The U.S. exported hidesto only a very few countries on a regular basis, and hence examining theexports to say Belgium, the Netherlands, etc. is not feasible because exportsto these markets are both sporadic and small. Even if the data did exist,what guarantee would we have that these European countries could not learnfrom their neighbors in France, Germany, or the UK?
4.3.1 Ruling out a European Demand Shock
An alternative is to examine European data on hide imports from countriesother than the U.S. If a European speci�c demand shock is driving U.S.hide exports upwards for reasons unrelated to the availability of bu¤alo, thisshock should show up in European imports from other countries as well. Toexamine this possibility, I collected, where possible, hide import data fromEuropean countries that were major destinations for U.S. hide exports. Themajor destinations for U.S. hide exports were France, Germany, and the UK.At present, I have collected this data from all countries except Germany.46
46For the France data see France, Direction général des douanes, Tableau général ducommerce de la France avec ses colonies et les puissance étrangères, published annually forthe years 1825-1895. For the UK data see Great Britain, Annual Statement of the Tradeand Navigation of the United Kingdom with Foreign Countries and British Possessions,for the years 1853-1870 and Annual Statement of the Trade of the United Kingdom withForeign Countries and British Possessions for the years 1871-1924. I currently have some
35
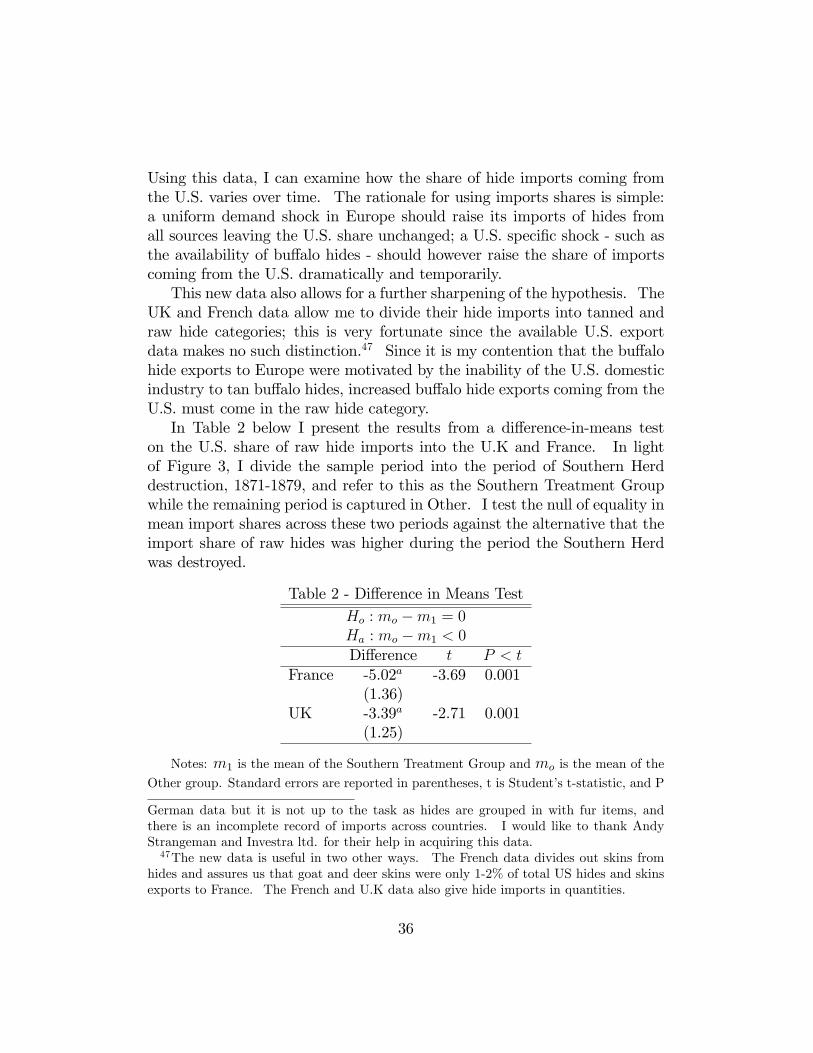
Using this data, I can examine how the share of hide imports coming fromthe U.S. varies over time. The rationale for using imports shares is simple:a uniform demand shock in Europe should raise its imports of hides fromall sources leaving the U.S. share unchanged; a U.S. speci�c shock - such asthe availability of bu¤alo hides - should however raise the share of importscoming from the U.S. dramatically and temporarily.This new data also allows for a further sharpening of the hypothesis. The
UK and French data allow me to divide their hide imports into tanned andraw hide categories; this is very fortunate since the available U.S. exportdata makes no such distinction.47 Since it is my contention that the bu¤alohide exports to Europe were motivated by the inability of the U.S. domesticindustry to tan bu¤alo hides, increased bu¤alo hide exports coming from theU.S. must come in the raw hide category.In Table 2 below I present the results from a di¤erence-in-means test
on the U.S. share of raw hide imports into the U.K and France. In lightof Figure 3, I divide the sample period into the period of Southern Herddestruction, 1871-1879, and refer to this as the Southern Treatment Groupwhile the remaining period is captured in Other. I test the null of equality inmean import shares across these two periods against the alternative that theimport share of raw hides was higher during the period the Southern Herdwas destroyed.
Table 2 - Di¤erence in Means TestHo : mo �m1 = 0Ha : mo �m1 < 0Di¤erence t P < t
France -5.02a -3.69 0.001(1.36)
UK -3.39a -2.71 0.001(1.25)
Notes: m1 is the mean of the Southern Treatment Group and mo is the mean of the
Other group. Standard errors are reported in parentheses, t is Student�s t-statistic, and P
German data but it is not up to the task as hides are grouped in with fur items, andthere is an incomplete record of imports across countries. I would like to thank AndyStrangeman and Investra ltd. for their help in acquiring this data.47The new data is useful in two other ways. The French data divides out skins from
hides and assures us that goat and deer skins were only 1-2% of total US hides and skinsexports to France. The French and U.K data also give hide imports in quantities.
36
indicates probability values. The superscripts. a;indicates signi�cance at the 0.01 level.The dependent variable is the share of raw hide imports from the U.S. in total raw hide
imports from all countries.
The results are consistent with my earlier claims. The equality of meansis rejected at very high levels of signi�cance. A �nding of equality of meanimport shares across these two periods would have suggested a Europeanspeci�c event raised raw hide imports from all countries and not just theU.S.. The alternative is that there was an increase in the U.S. import shareover this period due to the availability of bu¤alo.
4.3.2 Ruling out a U.S. Supply Shock
While the di¤erence-in-means test argues against a European demand shock,there still remains other explanations for the rise in raw hide exports fromthe U.S. For example, a U.S. speci�c event such as the completion of rail-roads, the creation of an open range cattle industry, or the concentration ofproduction in large slaughterhouses could have raised U.S. hide exports.48
Perhaps the bulge in exports shown in Figure 3 represents a U.S. supplyshock unrelated to the bu¤alo slaughter.To investigate this possibility I exploit one more feature of the data and
our knowledge concerning the innovation. The only non-European countryreceiving signi�cant hide exports from the U.S. is Canada.49 Since there isno evidence that the tanning industry in Canada was ever involved in thecommercial tanning of bu¤alo hides, whereas the innovation was known invarious European countries, I treat the innovation in tanning as a quasi-experiment with Canada as the control with no ability to tan bu¤alo hides,and the UK and France as treatment countries with the ability to tan.50
Canada is a reasonable but not perfect control: Canada was far less developed48Any explanation along these lines does however have to explain why these U.S. speci�c
events led to a temporary, and not permanent, rise in hide exports.49For the Canadian data see Canada, General Statement of Exports, Sessional Papers
1860-1890.50Canadian trade statistics do contain categories of exports tied to the bu¤alo (bu¤alo
hair was one such item), but despite this practice of speci�cally labeling bu¤alo productsthere is no category for exported bu¤alo hides from Canada. This is perhaps not surprisingbecause the Canadian bu¤alo episode is quite di¤erent from the American. In Canada,trade in bu¤alo robes was very important to depletion as was the associated hunting bynatives and Metis. As well, bu¤alo were driven to extinction in Canada prior to the arrivalof connecting Canadian railways. All of this suggests no hide exports came from Canada,
37
than France or the UK in the 1870s, and its distance from the U.S. marketis much smaller.The UK and France are reliable treatment groups, if the assignment to
treatment is exogenous. The London Times article, discussed previously,establishes that the timing of the innovation was exogenous to any charac-teristic of France or the UK, since these countries were not the intendedmarket for the hides. The subsequent shipment of hides to the UK waslikely determined by the sheer economic might of the UK at the time, theexistence of other trading relations between the two nations, knowledge thatthe UK tanning industry was advanced, or even a common language. Simi-lar shipments, if they occurred, to Germany or France would be determinedby similar factors. It is di¢ cult to see why any of these factors - whichdetermined assignment to treatment - should play a role in determining theover-time variation in the share of raw hide imports coming into these coun-tries from the U.S. As a consequence, the assignment to treatment maywell provide the exogenous variation we need to identify bu¤alo hides in thedata.The innovation was a necessary but not a su¢ cient condition for exports.
The herds had to exist for exports to occur. I date the availability of theinnovation at 1871, and as before assume the Southern Herd was availableuntil 1879. The Northern Herd was available to hide hunters in the early1880s, when the threat from the Sioux was eliminated, and was destroyed by1886. The most general speci�cation would allow for two treatment e¤ects(North and South), country speci�c time trends and country dummies asfollows:
sit = �i + �it+ TSit + �T
Nit + �it (11)
where sit is the U.S. share of raw hide imports in total raw hide importsinto country i = fCanada; France; UKg in year t from 1866 to 1887; �i isa country speci�c constant, and �it is a country speci�c time trend. T Sit isthe treatment e¤ect which takes on the value 1 during 1872-1879 and is zerootherwise; TNit takes on the value 1 from 1881 to 1886 and is zero otherwise.Summary statistics for the import shares are presented in Table 3 below.
and hence the import of cow hides into Canada was determined by the same forces drivingdemand for hides in Europe: a demand for leather for machinery, saddlery, and footwear.
38
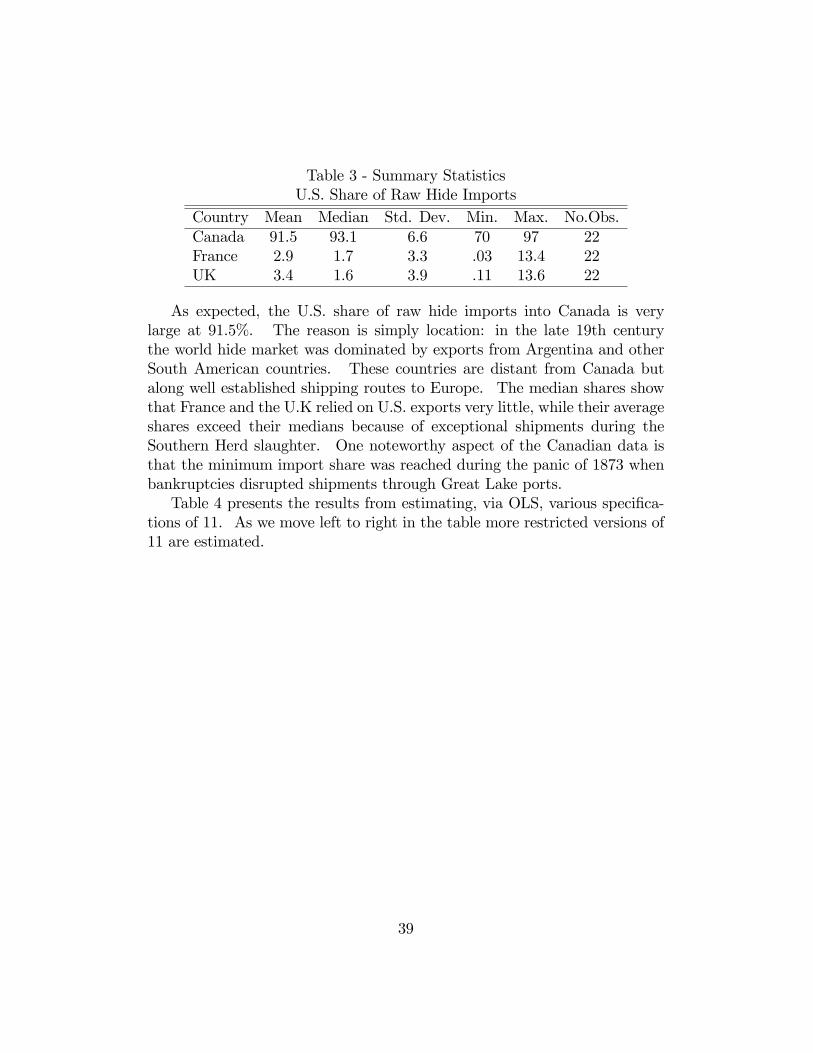
Table 3 - Summary StatisticsU.S. Share of Raw Hide Imports
Country Mean Median Std. Dev. Min. Max. No.Obs.Canada 91.5 93.1 6.6 70 97 22France 2.9 1.7 3.3 .03 13.4 22UK 3.4 1.6 3.9 .11 13.6 22
As expected, the U.S. share of raw hide imports into Canada is verylarge at 91.5%. The reason is simply location: in the late 19th centurythe world hide market was dominated by exports from Argentina and otherSouth American countries. These countries are distant from Canada butalong well established shipping routes to Europe. The median shares showthat France and the U.K relied on U.S. exports very little, while their averageshares exceed their medians because of exceptional shipments during theSouthern Herd slaughter. One noteworthy aspect of the Canadian data isthat the minimum import share was reached during the panic of 1873 whenbankruptcies disrupted shipments through Great Lake ports.Table 4 presents the results from estimating, via OLS, various speci�ca-
tions of 11. As we move left to right in the table more restricted versions of11 are estimated.
39
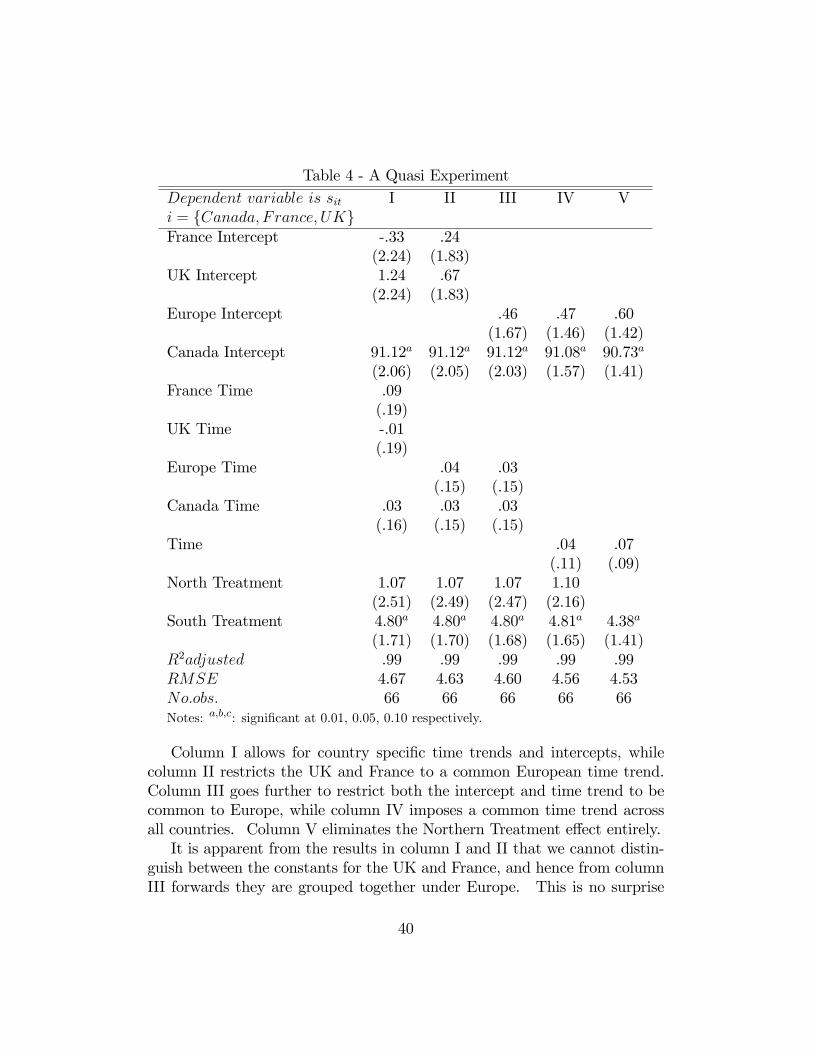
Table 4 - A Quasi ExperimentDependent variable is sit I II III IV Vi = fCanada; France; UKgFrance Intercept -.33 .24
(2.24) (1.83)UK Intercept 1.24 .67
(2.24) (1.83)Europe Intercept .46 .47 .60
(1.67) (1.46) (1.42)Canada Intercept 91.12a 91.12a 91.12a 91.08a 90.73a
(2.06) (2.05) (2.03) (1.57) (1.41)France Time .09
(.19)UK Time -.01
(.19)Europe Time .04 .03
(.15) (.15)Canada Time .03 .03 .03
(.16) (.15) (.15)Time .04 .07
(.11) (.09)North Treatment 1.07 1.07 1.07 1.10
(2.51) (2.49) (2.47) (2.16)South Treatment 4.80a 4.80a 4.80a 4.81a 4.38a
(1.71) (1.70) (1.68) (1.65) (1.41)R2adjusted .99 .99 .99 .99 .99RMSE 4.67 4.63 4.60 4.56 4.53No:obs: 66 66 66 66 66Notes: a;b;c: signi�cant at 0.01, 0.05, 0.10 respectively.
Column I allows for country speci�c time trends and intercepts, whilecolumn II restricts the UK and France to a common European time trend.Column III goes further to restrict both the intercept and time trend to becommon to Europe, while column IV imposes a common time trend acrossall countries. Column V eliminates the Northern Treatment e¤ect entirely.It is apparent from the results in column I and II that we cannot distin-
guish between the constants for the UK and France, and hence from columnIII forwards they are grouped together under Europe. This is no surprise
40
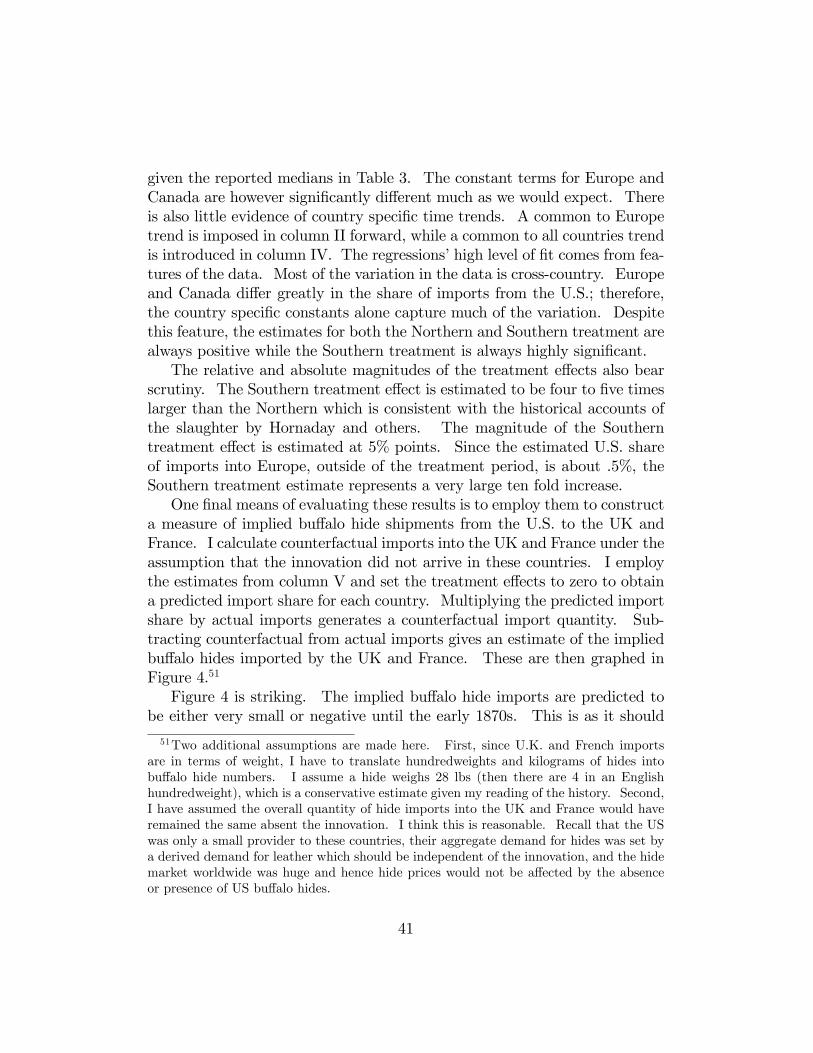
given the reported medians in Table 3. The constant terms for Europe andCanada are however signi�cantly di¤erent much as we would expect. Thereis also little evidence of country speci�c time trends. A common to Europetrend is imposed in column II forward, while a common to all countries trendis introduced in column IV. The regressions�high level of �t comes from fea-tures of the data. Most of the variation in the data is cross-country. Europeand Canada di¤er greatly in the share of imports from the U.S.; therefore,the country speci�c constants alone capture much of the variation. Despitethis feature, the estimates for both the Northern and Southern treatment arealways positive while the Southern treatment is always highly signi�cant.The relative and absolute magnitudes of the treatment e¤ects also bear
scrutiny. The Southern treatment e¤ect is estimated to be four to �ve timeslarger than the Northern which is consistent with the historical accounts ofthe slaughter by Hornaday and others. The magnitude of the Southerntreatment e¤ect is estimated at 5% points. Since the estimated U.S. shareof imports into Europe, outside of the treatment period, is about .5%, theSouthern treatment estimate represents a very large ten fold increase.One �nal means of evaluating these results is to employ them to construct
a measure of implied bu¤alo hide shipments from the U.S. to the UK andFrance. I calculate counterfactual imports into the UK and France under theassumption that the innovation did not arrive in these countries. I employthe estimates from column V and set the treatment e¤ects to zero to obtaina predicted import share for each country. Multiplying the predicted importshare by actual imports generates a counterfactual import quantity. Sub-tracting counterfactual from actual imports gives an estimate of the impliedbu¤alo hides imported by the UK and France. These are then graphed inFigure 4.51
Figure 4 is striking. The implied bu¤alo hide imports are predicted tobe either very small or negative until the early 1870s. This is as it should
51Two additional assumptions are made here. First, since U.K. and French importsare in terms of weight, I have to translate hundredweights and kilograms of hides intobu¤alo hide numbers. I assume a hide weighs 28 lbs (then there are 4 in an Englishhundredweight), which is a conservative estimate given my reading of the history. Second,I have assumed the overall quantity of hide imports into the UK and France would haveremained the same absent the innovation. I think this is reasonable. Recall that the USwas only a small provider to these countries, their aggregate demand for hides was set bya derived demand for leather which should be independent of the innovation, and the hidemarket worldwide was huge and hence hide prices would not be a¤ected by the absenceor presence of US bu¤alo hides.
41
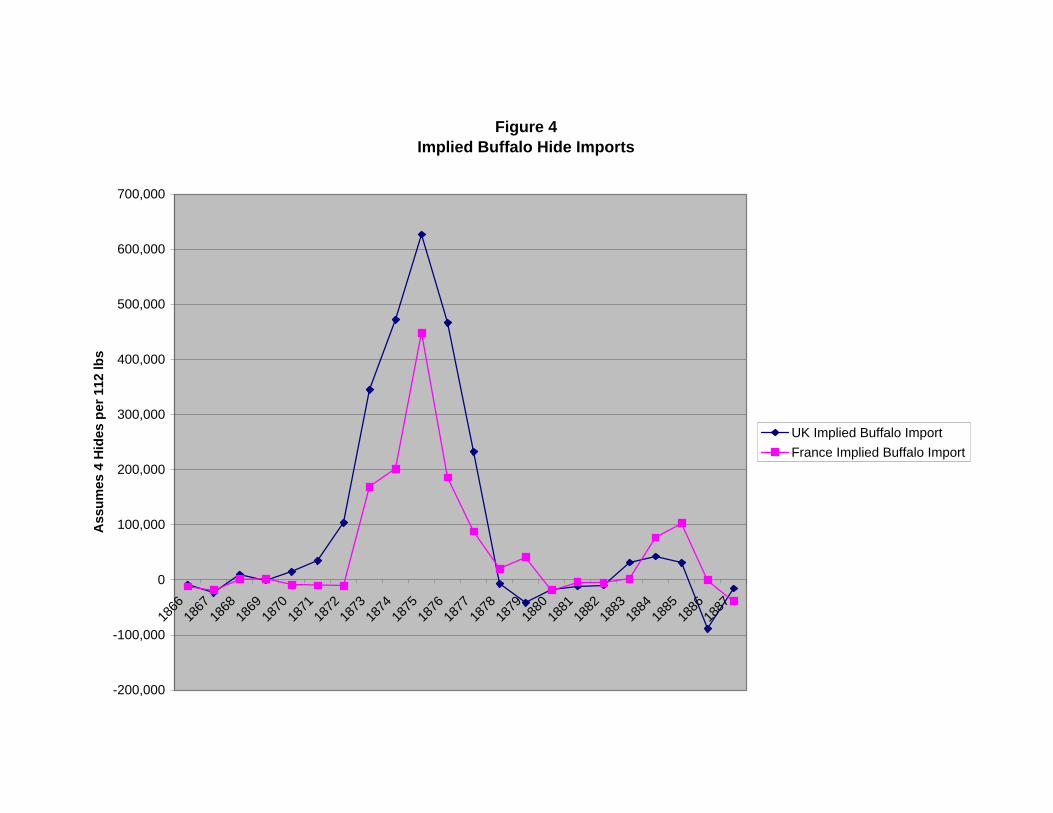
Figure 4Implied Buffalo Hide Imports
-200,000
-100,000
0
100,000
200,000
300,000
400,000
500,000
600,000
700,000
1866
1867
1868
1869
1870
1871
1872
1873
1874
1875
1876
1877
1878
1879
1880
1881
1882
1883
1884
1885
1886
1887
Ass
umes
4 H
ides
per
112
lbs
UK Implied Buffalo ImportFrance Implied Buffalo Import
be since bu¤alo hide imports must be zero prior to the innovation. Postinnovation, imports rise dramatically until 1875 only to fall again near tozero in the late 1870s. The �gure shows what may be a small NorthernHerd impact in the early 1880s that falls o¤ in 1886. It is interesting tonote that the UK series jumps upwards before that of France - consistentwith the UK being the original innovator and France the follower. Simplyadding the imported hides in 1875 shows the UK and France importing over 1million bu¤alo hides, which is consistent with the aggregate �gure presentedpreviously in Figure 1. Summing the hide imports over the entire period(including the negative elements) yields imports to the UK and France ofmore than 3.5 million bu¤alo. If we gross these up by Dodge�s wastageestimates, the implied kill would be larger still.Overall, the examination of the across country and across hide variation
in the data supports my earlier conclusions. The increase in raw hide im-ports from the U.S., during the time of the Southern Herd destruction, is aEuropean/U.S. speci�c event. Hide imports into Canada did not rise as theydid in the UK and France.52Despite the fact that the data used is di¤erent,the method of identifying bu¤alo hides is di¤erent, and the variable understudy is di¤erent (import shares of raw hides vs. export levels of all hides)the results are remarkably similar. There is strong evidence that the tanninginnovation led to an unusual and temporary level of raw hide imports intothe UK and France, but not Canada. It appears that this surge did notoccur because of a broad based demand shock in Europe, nor because of asupply shock to cattle production in the U.S.. While alternative explana-tions for this data remain, the set of credible alternatives has been narrowedconsiderably. In particular, I will now argue that none of the other leadingtheories is consistent with the evidence presented.
5 Alternative Hypotheses
Amazon.com lists over 4000 book entries when bu¤alo is entered as a searchterm; a library of congress search generates the maximum of hits; and anyvisit to your local bookseller will reveal several new books on bu¤alo history,biology, etc. printed in just the last few years. Given the importance ofthe bu¤alo to Native and Western history, and its role as a national sym-
52This is further corroborated by a di¤erence-in-means test (identical to that presentedin Table 3) for Canada which cannot reject the null of identical means across periods.
42
bol it should come as no surprise that there are numerous explanations forthe bu¤alo�s demise. Research contains numerous book length treatments,hundreds of scholarly articles and many theses and dissertations. It is notpossible here to develop in any detail a careful examination of all of thecompeting hypotheses; instead I will discuss how key alternatives are largelyinconsistent with the data and arguments presented here.
5.1 The Army
Many accounts of the bu¤alo slaughter contend that the elimination of thebu¤alo was a secret goal of government policy. Some authors go so faras to label it genocide. The evidence provided for this hypothesis is themany failed and stalled bills introduced in Congress, and various quotes fromgovernment o¢ cials noting the salutary e¤ect an extinction would have ondomiciling the natives. For example, a bill restricting the harvest of femalecows to only Indian hunters on all federal lands passed both the House andthe Senate in June of 1874, but was killed by a pocket veto by PresidentGrant. This result is not that surprising since Grant�s Secretary of theInterior, Columbus Delano, was in favor of the destruction of the bu¤alo.He refused to stop hide hunters from entering Sioux lands, and in his reportfor 1873 wrote "I would not seriously regret the total disappearance of thebu¤alo from our western prairies, in its e¤ect upon the Indians. I wouldregard it rather as a means of hastening their sense of dependence upon theproducts of the soil and their own labors " Gard (1960, p. 207).Other accounts coming from speeches made by General Sherman, Sheri-
dan or Custer are all similar in that these men thought the destruction of theherds would have a bene�cial e¤ect in reducing Indian resistance.53 Whilethis aspect of the story is surely true, and while federal legislation may havehelped stem the tide of the slaughter, the regulatory problem was formi-dable.54 The Great Plains is an incredibly large area that was only sparsely
53For example, General Sherman�s quote "I think it would be wise", he said of the Siouxinsistence on hunting on the Republican River, "to invite all the sportsmen of Englandand America there this fall for a Grand Bu¤alo hunt, and make one grand sweep of themall", Utley (2003, p.166).54The regulatory problem was well known. In 1866, a Harper�s Magazine writer com-
menting on the introduction of a bill to restrict bu¤alo hunting noted that "The di¢ cultywill be to secure its enforcement, as the extermination of these animals, which is nowimpending, is brought about by parties who, at a distance from any control, are a law
43
populated in 1870. Over much of the relevant time period, the federal gov-ernment already had its hands full managing Indian wars, economic crises,and the progress of reconstruction after a bloody civil war. While the ab-sence of federal regulation made the slaughter simple to conduct and legal,it was the economic incentive created by the tanning innovation that fueledthe frenzy.
5.2 New Railroads and New Ri�es
Two other new technologies are often linked to the bu¤alo slaughter: theextension of railroads into bu¤alo country, and the introduction of powerfulbreech loading ri�es after the Civil War.Various railroads promoted bu¤alo hunting excursions to eastern dandies
and allowed shooting from rail cars. Sunday bu¤alo hunting trips were adver-tised quite widely in the press, and surely played some role in the slaughter.However the natural growth rate of bu¤alo is reasonable high (with an in-trinsic rate of growth between .15 and .25), and this implies that localizedsport hunting along the tracks could never deplete the herds signi�cantly.Perhaps more importantly the railroads were a major transportation link inthe bu¤alo hide trade. While it is surely true that hundreds of thousandsof hides were shipped along the western railroads it is di¢ cult to argue thatthe extension of new railroads into bu¤alo country caused the slaughter. Forexample, the Union Paci�c railroad arrived in the heart of bu¤alo countryat Cheyenne Wyoming in 1867 a full 5 years before the Southern hide boom.In the north, there is no gap in time between the completion of the NorthernPaci�c�s line into Montana and the slaughter of the Northern Herd. In thiscase, the arrival of the railroad would seem critical, but this is not entirelyclear. Prior to and after the railroad arrived, goods came and went by riverboat on the Missouri. While the railroad may have lowered transportationcosts, this region had other transportation options. It seems likely in factthat the northern slaughter was delayed by the hostile Sioux Indians, and notany lack of transportation. It was not until the early 1880s that the north-ern bu¤alo range was made safe for bu¤alo hunters - and made safe for theNorthern Paci�c to complete its construction into Montana. The Canadianexperience also tells us that railroads were not a necessary condition for the
unto themselves, and who are not likely to be in�uenced by any enactments that do not in-volve the means of execution." Harper�s Magazine, April 15th, 1866, Scienti�c Intelligencesection.
44
extermination, since bu¤alo were exterminated in Canada before the arrivalof western railways.A similar argument applies to the new powerful breech loading ri�es in-
troduced after the Civil war. The new ri�es by Remington, Sharps andSpring�eld greatly facilitated the slaughter, but it is di¢ cult to argue theywere pivotal. For example, breech loading ri�es such as the infantry issueSpring�eld .50 calibre were in existence years before the slaughter occurred,while perhaps the most popular bu¤alo gun, the Sharp�s Big 50, was notintroduced until after the slaughter was already three years underway (in1874).Therefore, while the existence of the new railroad lines into southern
Kansas, northern Texas and Montana surely facilitated the slaughter, as didthe availability of more and better ri�es, it is di¢ cult to argue they werenecessary for the slaughter.
5.3 Environmental Change & Native Overhunting
A �nal explanation for the slaughter is environmental change and droughtcoupled with native over hunting.55 The Great Plains experienced a verywet period up to the early 1850s and had a series of serious droughts inthe subsequent 30 years. Some authors contend that these environmentalchanges weakened the bu¤alo and reduced their numbers considerably priorto 1870. If we add to this stress native overhunting, created by the robemarket and the breakdown of societal norms within the Indian community,it is possible to argue in favor of a much smaller bu¤alo number prior to thehide hunters.The evidence presented earlier is largely at odds with this explanation.
The bu¤alo slaughter was large and not small, and it was primarily propa-gated by white hide hunters. While it is virtually impossible to prove theherds were not larger in 1850 than at the start of hide hunting in the 1870s,it is clear that the slaughter during the 1870s and 1880s was spectacular inits magnitude. Environmental change may have contributed to an overalllessening of bu¤alo numbers, but had it not occurred I suspect hide huntingwould have just lasted longer. Long term change in the West�s environ-ment did not kill the bu¤alo - it was the simple pro�t motive created bytechnological change and maintained by robust export markets.
55Isenberg (2000) is the leading proponent of this view.
45
6 Conclusions
The purpose of this paper was to investigate the slaughter of the plains bu¤aloin the 19th century using a combination of theory, empirics and �rst handaccounts of bu¤alo hunters. I have presented an explanation for the slaughterthat is not conventional. While hide hunting, the U.S. Army, native overhunting and the Railroads are typically held responsible for the slaughter,the role of international trade has featured minimally if at all. Instead,I have argued that free trade in bu¤alo hides was critical to the explosionof activity on the plains in the 1870s. By employing insights from theory,I have pieced together statistical evidence from numerous countries, diaryand newspaper accounts, and logic to present a largely circumstantial, buthopefully compelling case that the plains bu¤alo was not eliminated by theusual suspects - it was instead the victim of global markets and technologicalprogress.The introduction to this paper claimed that (1) a price for bu¤alo prod-
ucts that was largely invariant to changes in supply; (2) open access condi-tions with no regulation of the bu¤alo kill; and (3), a newly invented tanningprocess that made bu¤alo hides into valuable commercial leather were jointlynecessary and su¢ cient for the slaughter on the Great Plains. The theo-retical results demonstrate that the combination of a tanning innovation,open access to bu¤alo hunting, and �xed world prices delivers a punctuatedslaughter that matches that witnessed on the Great Plains. I take this asproof of su¢ ciency.I have also demonstrated that the slaughter can only be generated when
demand is very elastic. This establishes the necessity of a market price that is"largely invariant" to changes in supply. The tanning innovation was provento be necessary by the absence of the slaughter during the �ve years priorto 1872 when the Union Paci�c had reached the heart of bu¤alo country.And the necessity of open access for the slaughter is proven by numerousprivate parties who found bu¤alo to be such a valuable resource that theyestablished property rights on their own by capturing and then breeding livebu¤alo. Several entrepreneurial ranchers in the 1870s and 1880s establishedprivate herds that, until federal legislation arrived in the mid 1890s, probablysaved the bu¤alo from extinction.It is somewhat ironic, that what must be the saddest chapter in U.S.
environmental history was not written by Americans; it was instead, the workof Europeans. Europe in the 19th century was the high income developed
46

region, while America was a young developing country recently rocked by abloody civil war caused by racial strife. In the 1870s, America was a largeresource exporter with little or no environmental regulation while Europe wasa high income consumer of U.S. resource products apparently indi¤erent tothe impact their consumption had on America�s natural resources. Writtenin this way it is apparent that the story of the bu¤alo has as much relevancetoday as it did 130 years ago. Many developing countries in the worldtoday are heavily reliant on resource exports, are struggling with active orrecently past civil wars fueled by racial strife, and few, if any, have stringentregulations governing resource use. The slaughter on the plains tells usthat waiting for development to foster better environmental protection canbe a risky proposition: in just a few short years, international markets anddemand from high income countries can destroy resources that otherwisewould have taken centuries to deplete.
47
7 Appendix
7.1 Appendix A: Proofs
Proposition 1. Suppose not. Let both S1 6= S2 solve K(p; S) = G(S).Let S1 < S2, then G(S1)=S1 > G(S2)=S2 by the strict concavity of G.Since K(p; S1) = G(S1) and K(p; S2) = G(S2) by assumption, we must
have K(p; S1)=S1 > K(p; S2)=S2, or N
_�R�1��f(�)d� > N
_�R�2��f(�)d�. Note
�1 = w=pS1 > �2 = w=pS2, and hence N
_�R�1��f(�)d� > N
_�R�1�vf(�)d� +
N�1�R�2��f(�)d� implies 0 > N
��1R�2��f(�)d� which is a contradiction. The
uniqueness of �� follows directly as does the unique division of labor acrosssectors.
Proposition 2. Under the conditions necessary for Proposition 1, Figure
1 depicts the determination of a unique steady state. By inspection�S < 0
for S above S�, and�S > 0 for S positive but below S�.
Proposition 3. i) For given S, d��=dp < 0 and hence N
_�R���f(�)d�
rises with p on impact. Di¤erentiating K(p; S) w.r.t. p establishes Kp =
���NSf(��)[d��=dp] > 0: ii)�S < 0 for S above S�
0; d��=dt = �[w=[pS2]]
�S
> 0 for S above S�0; and, dK=dt = Ks
�S < 0 for S above S�
0. iii) Dif-
ferentiating K(p; S�) = G(S�), yields dS�=dp = [Kp=[G0 � KS]]: This is
negative because we know G(S) is cut from below at S� by K(p; S) andhence [G0 �KS] < 0.
Lemma 1. The number of bu¤alo hunters is [1� F (��)]N , where �� isgiven by 1 and hence is a function of both p and S. If �� rises (stays constant,falls) hunter numbers fall (stay constant, rise). In autarky p is determinedby S at every moment in time by market clearing. To prove the result, notefrom 1 that the elasticity of �� with respect to S and p are equal at �1. To
determine how S a¤ects p, note RS(p; S) = SN
_�R���f(�)d�=[F (��(p; S))N ],
and hence by inspection RS falls with ��. This implies RS(p; S) is increasingin both S and p and establishes that their partial elasticities must be positive
48
"rs;p > 0; "rs;s > 0. Di¤erentiating RS shows "rs;s = 1+"rs;p > 0. Using thisinformation di¤erentiate the market clearing condition 9 to �nd 10. Finally,di¤erentiating 1 and using 10 yields [d��=dS][S=��] = [ 1+"rs;p
�+"rs;p�1]. Therefore
when � is greater (equal to, less) than one, �� falls (stays constant, rises)with herd size, and bu¤alo hunter numbers rise (stay constant, fall) withherd size.
Lemma 2. Di¤erentiating 9 with respect to � holding S constant yields[dpe=d�][�=pe] = [ 1
�+"rs;p] > 0.
Proposition 4. Steady state is de�ned by G(S�) = K(��; S�), where�� = m(pe; S�) is given by 1, and pe = g(�; S�) is given by 9. Substitutefor equilibrium prices and the marginal hunter in the steady state condition.Di¤erentiate with respect to � to �nd: dS=d� = [K�mpg�]=[G
0 � dKdS]where
subscripts denote partial derivatives. We have already established K� < 0and mp < 0: Lemma 2 established g� > 0. Therefore the numerator of
dS=d� is positive. Local stability of any steady state requires�S < 0 for
S above S�, and�S > 0 for S below S�. Using 6, this requires
�dS=dS =
[G0 � dKdS] < 0, where dK
dSis a total derivative taking into account price
adjustment in autarky. Requiring local stability signs dS=d� < 0.
7.2 Appendix B: Data
7.2.1 Hide Prices
There are a variety of sources for hide prices. Information on prices isimportant for three reasons. First, in some cases I need to de�ate exportvalues to obtain quantities so it is important that the prices be right in orderfor the quantities to be right. Second, if there was a huge change in hideprices during the period this may suggest alternative hypotheses that arenot considered here. Third, it would be useful to know how much bu¤alohunters obtained for their e¤orts in order to understand just how pro�tablehunting may have been.Prices used to de�ate values were obtained from several sources to ensure
that no one source could be responsible for the results. The primary sourcefor hide prices is the limited number of hide prices given in Foreign Commerceand Navigation �gures for hides and skins exports. To construct the priceindex for hides I employ price per hide data from 1864, 1865 and 1866. Price
49
per hide is found by dividing that year�s export revenue by the number ofhides exported. I then take a simple average of these three years, and employthe leather and leather goods price index of Warren and Pearson to generatean estimated price per hide for 1865 to 1886. I employ exactly the samemethod when I use the price series drawn from the Annual Reports of theNew York Chamber of Commerce.
7.2.2 Hide Exports
I assume the number of cattle hides produced is equal to the annual slaughterof U.S. cattle. To calculate the slaughter over the 1870-1886 period, I proceedin two steps. In step one, I calculate the breeding stock of cattle. I followRosen, Murphy and Scheinkman (1994) by relating the total head count y(t)of all cattle to current and past values of the breeding stock x(t). Thetotal stock of cattle is equal to this year�s breeding stock x(t), plus last yearscalves, gx(t � 1) plus yearlings that have yet to be slaughtered gx(t � 2).That is:
y(t) = x(t) + gx(t� 1) + gx(t� 2) (12)
where g is the natural growth rate set equal to .85. The U.S. data fory(t) starts in 1867. Since 1867 is close to the period of time we are mostinterested in, I follow RMS by initializing the series employing the historicalgrowth rate of the cattle population and making a steady state assumption.In particular, set
x(1867) = y(1867)=[1 + (g=1:045) + (g=1:045)2] (13)
x(1868) = 1:045x(1867) (14)
where the �rst equation follows from the steady state version of 12. g isgiven by the average annual growth rate of the U.S. cattle population overthe 1875-1990 period which is approximately 4.5 %. The second equationalso re�ects a steady state assumption. By using the initial breeding stock�gures for 1867 and 1868, it is now straightforward to manipulate 12 to solvefor x(1869) and all subsequent years using data on the series y(t) alone.To calculate the implied slaughter of cows I employ the empirical esti-
mates RMS obtain when they run the following regression over the 1900-1990period.
x(t) + c(t) = b0 + b1x(t� 1) + b2x(t� 2) + b3x(t� 3) + ut (15)
50
where x(t) is the breeding stock RMS generate when they assume g = :85and c(t) is the actual slaughter �gure (only available from 1900 onwards).The addition of these two �gures is then regressed on the lagged breedingstock plus a constant. I employ RMS�s estimates of bi from their Table 1,and by rearranging obtain an implied slaughter:
c(t) = �1; 524 + 1:01x(t� 1) + :09x(t� 2) + :92x(t� 3)� x(t) (16)
With the implied slaughter �gures in hand I employ my three identifyingassumptions. One, I assume hide exports in 1870 can only be from cattle;therefore, h(1870) = f(1870)c(1870) where f(t) is the fraction of total cattlehides exported in year t. Two, I assume the same is true for 1886, henceh(1886) = f(1886)c(1886). And three, for any year between these two pointsI employ a linear interpolation for f ; that is
f(t0) = f(t0 � 1) + [[f(1886)� f(1870)]=16] (17)
h(t0) = f(t0)c(t0) (18)
The exported slaughter h(t) is approximately 1% of the total slaughterin 1870 c(t), but rises to 1.7% in 1886. Therefore, these estimates imply thevast majority of hides coming from the U.S. cattle slaughter are used in theU.S. This seems reasonable since the U.S. was a large importer of hides overthis period.The estimate for bu¤alo hides exported is calculated as:
bh(t) = th(t)� h(t) (19)
where th(t) is the total export number for hides calculated from U.S.trade statistics, bh(t) is the estimated bu¤alo hides exported as shown inFigure 2, and h(t) is the estimated cattle hide exports calculated using theprocedure above.An alternate procedure is to assume exports of cow hides are proportional
to total domestically available hides which would include the U.S. slaughterplus imports into the U.S. market. US import data is available, and usingthe Warren and Pearson index we can again obtain hide numbers from thevalue estimates. Then again using 1870 and 1886 as points of identi�cation,we �nd that exports as a function of total domestic availability is .7% in1870 rising to 1.1% in 1886. Employing a linear interpolation between these
51

years we can again construct implied cow hide exports and then bu¤alo hideexports. This alternative series is very similar to the one presented in thetext (for eg. the total Southern hides exported is 5.15 million from 1871-1879,while the total Northern Herd exports equals .85 million from 1881-1885).The reason the two series are similar is that imports are only a fractionof the US domestic slaughter and imports are relatively smooth over thistime period. This further check is useful. Although the export series weemploy contains only exports from domestic production (and not imports),it is possible that a perfectly timed import surge of cow hides could havemet domestic US demand therefore freeing up domestically produced hidesto create the aberration in exports we are associating with the bu¤alo. Thisalternative procedure demonstrates that including variation in hide importsinto our calculations cannot generate the boom in hide exports.
52
8 References
Allen, Robert and Ian Keay, "Saving the Whales: Lessons from the Extinc-tion of the Eastern Arctic Bowhead Whale�, Journal of Economic History,June 2004, Vol. 64, No. 2, pp. 400-432.Allen, Joel Asaph, "The American Bisons: Living and Extinct", Vol. IV,
No. 10, Memoirs of the Museum of Comparative Zoology at Harvard College,University Press, Cambridge, 1876.Benson, Bruce L., "Property Rights and the Bu¤alo Economy of the Great
Plains", in Self Determination: the Other Path for Native Americans, ed.Terry Anderson, Bruce Benson, and Thomas Flanagan, Stanford UniversityPress, 2006.Besley, T., "Property Rights and Investment Incentives: Theory and Ev-
idence from Ghana", Journal of Political Economy, 1995, Vol. 103, No. 5.Bohn, Henning, and Robert T. Deacon, "Ownership Risk, Investment,
and the Use of Natural Resources", The American Economic Review, Vol.90, No. 3, June 2000, pp.526-549.Brander J.A. and M.S. Taylor, "International Trade and Open Access
Renewable Resources: The Small Open Economy Case", Canadian Journalof Economics, Vol. 30, No. 3, August 1997a, pp. 526-552.Brander J.A. and M.S. Taylor, "The Simple Economics of Easter Island:
A Ricardo-Malthus Model of Renewable Resource Use," American EconomicReview, Vol. 88, No. 1, March 1998, pp. 119-138.Burlingame, Merrill G., "The Bu¤alo in Trade and Commerce", North
Dakota Historical Quarterly, Vol. 3, No. 4, 1928, pp. 262-291.Canada, General Statement of Exports, Sessional Papers, for the years
1868-1890.Carbyn, L., The Bu¤alo Wolf: Predators, Prey, and the Politics of Na-
ture, Smithsonian Books, Washington, 2003.Carlos, Ann M., and Frank D. Lewis, "Property Rights, Competition,
and Depletion in the Eighteenth-Century Canadian Fur Trade: The Role ofthe European Market", Canadian Journal of Economics, Vol. 32, No. 3,May 1999, pp. 705-728.Carlos, Ann M., and Frank D. Lewis, "Indians, the Beaver, and the Bay:
The Economics of Depletion in the Lands of the Hudson�s Bay Company,1700-1763", The Journal of Economic History, Vol. 53, No. 3, September1993, pp. 465-494.
53
Cook, John R., The Border and the Bu¤alo, Crane and Company, Topeka,1907, reprint by State House Press, Austin, 1989.Copeland, Brian R., and M. Scott Taylor, "Trade Growth, and the Envi-
ronment", Journal of Economic Literature, Vol. 42, No. 1, March 2004a.Copeland, Brian R., and M. Scott Taylor, "Trade, Tragedy and the Com-
mons", NBER Working Paper No. 10836, October 2004b.Cutright, Paul R., Theodore Roosevelt the Naturalist, Harper, New York,
1956.Davis, Theodore, R., "The Bu¤alo Range", Harpers New Monthly maga-
zine, pp. 147-163,Dodge, Richard I., The Plains of the Great West and their Inhabitants,
Archer House, Inc. New York, 1877.Farrow, S., "Extinction and market forces: two case studies," Ecological
Economics, Vol. 13 1995, pp. 115-123.Foster, J.E., "The Metis and the End of the Plains Bu¤alo in Alberta",
in Bu¤alo edited by J.E. Foster, D. Harrison, and I.S. MacLaren, Universityof Alberta Press, 1992, pp. 61-77.Flores, Dan., "Bison Ecology and Bison Diplomacy: The Southern Plains
from 1800 to 1850", The Journal of American History, Vol. 78, No. 2,September 1991, pp. 465-485.France, Direction général des douanes, Tableau général du commerce de
la France avec ses colonies et les puissance étrangères, Renaud, Paris, for theyears 1863-1890.Gard, W., The Great Bu¤alo Hunt, Alred Knopf, New York, 1960.Gard, W., "Mightiest Hunter on Bu¤alo Range", Dallas Morning News,
1955, March 12.Gilbert, Miles., Leo Remiger, and Sharon Cunningham, Encyclopedia of
Bu¤alo Hunters and Skinners, Pioneer Press, Union City, Tennessee, 2003.Great Britain, Annual Statement of the Trade of the United Kingdom
with Foreign Countries and British Possessions, London, H.M.S.O., for theyears 1860-1890.Grossman G.M. and A.B. Krueger, "Economic Growth and the Environ-
ment", Quarterly Journal of Economics, Vol. 2, 1995, pp. 353-77.Hanner, John. "Government Response to the Bu¤alo Hide Trade: 1873-
1883", Journal of Law and Economics, Vol. 24, No. 2, October 1981, pp.239-271.Hanson, John R., Trade in Transition: Exports from the Third World,
1840-1900, Academic Press, New York, 1980.
54
Hornaday, William T., The Extermination of the American Bison, Smith-sonian Institution Press, Washington, 1889.Isenberg, A.C., The Destruction of the Bu¤alo, Studies in Environment
and History, editor D. Worster and A.W. Crosby, Cambridge UniversityPress, New York, 2000.Kincaid, Naomi H., "Rath City",West Texas Historical Association Year
Book, Vol. XXIV, October 1948, pp. 40-46.Koucky, Rudolph.W., "The Bu¤alo Disaster of 1882", North Dakota His-
tory, Vol. 50, Winter 1983, pp. 23-30.Krech, Shepard, III., The Ecological Indian: Myth and History, WW.
Norton and Company, New York.Lobenstine, Belle W., Extracts from the Diary of William C. Lobenstine:
December 31, 1851-1858, Privately Published 1920, provided on request fromthe Kansas State Historical Society, Topeka KS.Lobenstine W.C. Personal correspondence from the Merchants National
Bank Records (MC 115), various years, obtained from the Montana StateHistorical Society, Helena, MT.Lott, Dale, F., American Bison: A Natural History, University of Cali-
fornia Press, Berkeley, 2002.Lueck, Dean., "The Extermination and Conservation of the American
Bison", Journal of Legal Studies, Vol. XXXI, No. 2, June 2002, pp. 609�652.Matthiessen, P., Wildlife in America, The Viking Press, New York, 1959.Mayer, Frank H., and Charles B. Roth., The Bu¤alo Harvest, Sage Books,
Denver, 1958.McHugh, Tom., The Time of the Bu¤alo, Alfred Knopf, New York, 1972.Patterson, Don., and James E. Wilen, �Depletion and Diplomacy: the
North Paci�c Seal Hunt, 1886-1910, Research in Economic History, Vol. 2,1977, pp. 81-139.Rath, Ida Ellen., The Rath Trail, Dodge City, Kansas, Wichita KS:
McCormick-Armstrong Co. Inc., 1961.Rath, Ida Ellen, Early Ford County, Mennonite Press, North Newton,
Kansas 1964.Robinson, Charles, M. III,The Bu¤alo Hunters, State House Press, Austin
Texas, 1995.Roe, Frank Gilbert., The North American Bu¤alo: A critical study of the
species in its wild state, University of Toronto Press, 1951.
55
Roenigk, Adolph, Pioneer History of Kansas, KanColl Books, KansasState Historical Society, 1933.Roosevelt, Theodore., "Bu¤alo Hunting", St. Nicholas, Vol. 17, 1889,
pp. 136-143.Rosen, Sherwin & Murphy, Kevin M & Scheinkman, Jose A., "Cattle
Cycles", Journal of Political Economy, Vol. 102, No. 3, June 1994, pp.468-492.Satterthwaite, Franklin., "TheWestern Outlook for Sportsmen", Harper�s
New Monthly Magazine, Vol. 78, No. 468, May 1889, pp. 873-880.Schlebecker, John.T., Cattle Raising on the Plains 1900-1961, University
of Nebraska Press, Lincoln, 1963.Seton, Ernest Thompson, Lives of Game Animals, Vol. III, Part II,
Hoofed Animals, Charles T. Branford, Company, Boston, 1909.Seton, Ernest Thompson, "The American Bison or Bu¤alo", Scribners
Magazine, October 1906, Vol. XL, No. 4, pp. 385-405.Shaw, James H, "How many Bison originally populated Western Range-
lands," Rangelands, Vol. 17, No.5, (October 1995), pp. 148-150.Smits, David D., "The Frontier Army and the Destruction of the Bu¤alo:
1865-1883", The Western Historical Quarterly, Vol. 25, No. 3, Autumn,1994, pp. 312-338.State of New York Chamber of Commerce Annual Report, Press of the
Chamber of Commerce, New York, for the years 1870-1886.Steelquist, Robert U., Field Guide to the North American Bison: a nat-
ural history and viewing guide to the Great Plains Bu¤alo, Sasquatch books,Seattle, 1998.Steinberg, T., Down to Earth: Nature�s Role in American History, Oxford
Univesity Press, New York, 2002.Strickland, R.W., ed., "The Recollections of W.S. Glenn, Bu¤alo Hunter,"
Panhandle-Plains Historical Review, 22 (1949), 25-31.The Times of London, "Bu¤alo Hides- Some eight or ten months ago",
Aug. 17, 1872, pp 4, Issue 27458, Col. F.UNEP Economics and Trade Unit, "Economic Reforms, Trade Liber-
alization and the Environment: A Synthesis of UNEP Country Projects,"Synthesis Report, November 2001.United States, Department of Treasury, Bureau of Statistics, Foreign
Commerce and Navigation of the United States, Government Printing O¢ ce,Washington, for the years 1825-1890.
56
Utley, R.M., The Indian Frontier 1846-1890, revised edition, History ofthe American Frontier Series, R. Allen Billington, General Editor, H. R.Lamar, M. Ridge, and D.J. Weber, co-editor, University of New MexicoPress, Albuguerque, 2003.Warren, George and Frank Pearson, Prices, New York: John Wiley &
Sons, 1933.West, Elliot, The Way to the West: Essays on the Central Plain, Univer-
sity of New Mexico Press, 1995, pp 71-83.Wilen, James, E. "Common Property Resources and the Dynamics of
Overexploitation: the Case of the North Paci�c Fur Seal", U.B.C. discussionpaper, No. 3, 1976.
57