bta_q2_2015 tourism industry performance
TRANSCRIPT

7/26/2019 BTA_Q2_2015 Tourism Industry Performance
http://slidepdf.com/reader/full/btaq22015-tourism-industry-performance 1/12
GoToBermuda.com
Advancing the National Tourism Plan
2015 Update
1

7/26/2019 BTA_Q2_2015 Tourism Industry Performance
http://slidepdf.com/reader/full/btaq22015-tourism-industry-performance 2/12
GoToBermuda.com
Q2 Arrivals and Statistics
at June 30th 2015
2

7/26/2019 BTA_Q2_2015 Tourism Industry Performance
http://slidepdf.com/reader/full/btaq22015-tourism-industry-performance 3/12
GoToBermuda.com
BTA 2015 Key Performance Indicators
Management
Metrics
OrganizationalPerformanceMeasures
Destination/
MarketPerformance
3

7/26/2019 BTA_Q2_2015 Tourism Industry Performance
http://slidepdf.com/reader/full/btaq22015-tourism-industry-performance 4/12
GoToBermuda.com
Q2 Vacation Air Arrivals – Visitor Expenditure
• The average per person expenditure in this category increased by $41.17 in Q2 2015 vs. Q2 2014
• Year-to-date the average per person expenditure increased by $74.32 over 2014
• This increase in vacation visitor spend contributed $1.3M more in Q2 and $3.4M more year-to-
date to the economy than in 2014
Q2
2014
Q2
2015
% CHG
YOY
# CHG
YOY
YTD
2014
YTD
2015
% CHG
YOY
# CHG
YOY
Average per Person
Spend$1,183 $1,225 3% $41.17 $1,121 $1,196 7% $74.32
Estimated Economic
Impact$55.3 M $56.6 M 2% $1.3 M $71.0 M $74.4 M 5% $3.4 M
YOY = Year over year
Not included in the above numbers are business and visiting friends/relatives (VFR) spending.
Visitor spending data is collected during exit surveys with visitors. Q2 data is based on a weighted sample of 2,770 air visitors.
Q2 2015 is the first quarter using online methodology to conduct surveys rather than intercept.
4
7/26/2019 BTA_Q2_2015 Tourism Industry Performance
http://slidepdf.com/reader/full/btaq22015-tourism-industry-performance 5/12
GoToBermuda.com
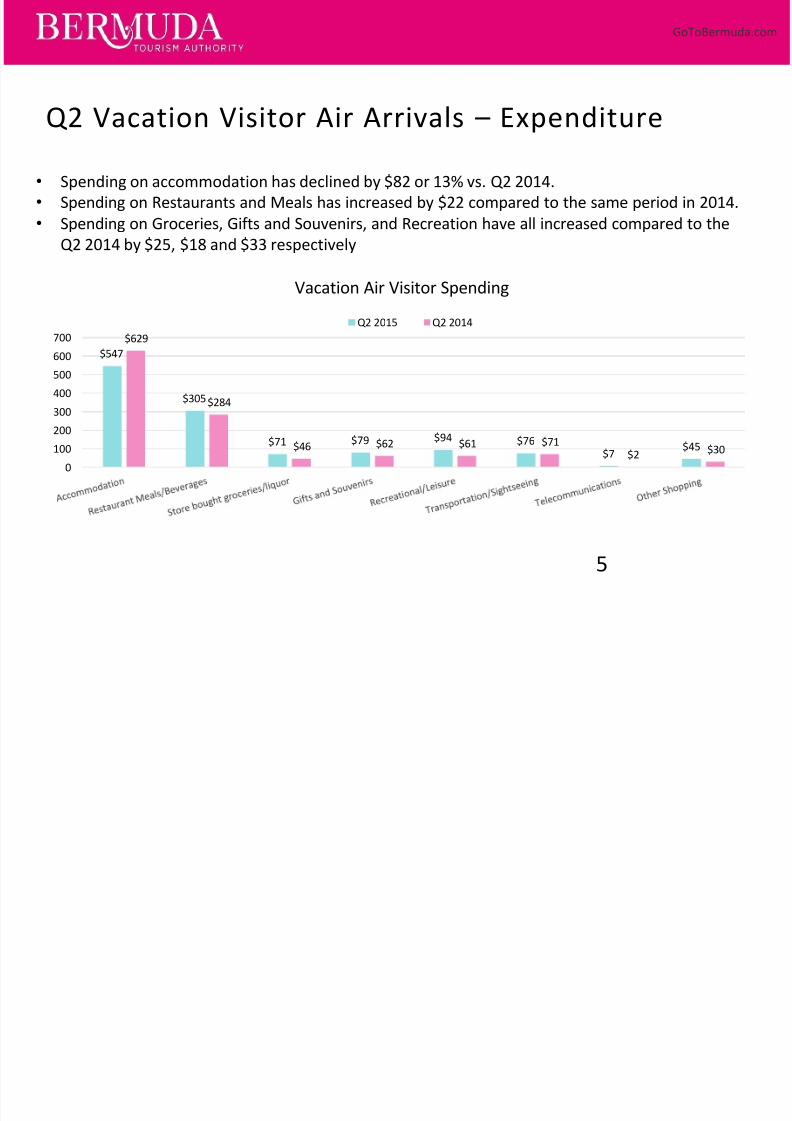
Q2 Vacation Visitor Air Arrivals – Expenditure
5
• Spending on accommodation has declined by $82 or 13% vs. Q2 2014.
• Spending on Restaurants and Meals has increased by $22 compared to the same period in 2014.
• Spending on Groceries, Gifts and Souvenirs, and Recreation have all increased compared to the
Q2 2014 by $25, $18 and $33 respectively
$547
$305
$71 $79 $94 $76$7
$45
$629
$284
$46 $62 $61 $71$2 $30
0
100
200300
400
500
600
700
Vacation Air Visitor Spending
Q2 2015 Q2 2014

7/26/2019 BTA_Q2_2015 Tourism Industry Performance
http://slidepdf.com/reader/full/btaq22015-tourism-industry-performance 6/12
GoToBermuda.com
Q2 Vacation Visitor Air Arrivals – Expenditure
6
“The Chamber is extremely pleased with this increase in spending,
especially in the gifts and souvenirs area which has struggled for so
long.” – Kristi Grayston, Chamber of Commerce President
"Confidence amongst restaurateurs is growing and statistics like
this are evidence that things are slowly on the rebound." – Chris
Garland, Chamber of Commerce Restaurant Division President
$305
$79
$284
$62
0
100
200
300
400
Restaurant Meals/Beverages Gifts and Souvenirs
Q2 2015 Q2 2014

7/26/2019 BTA_Q2_2015 Tourism Industry Performance
http://slidepdf.com/reader/full/btaq22015-tourism-industry-performance 7/12
GoToBermuda.com
Q2 Total Vacation Visitor Arrivals
7
Vacation Arrivals Q2 2014 Q2 2015YOY %
Change
YOY #
ChangeYTD 2014 YTD 2015
YOY %
Change
YOY #
Change
Air - Vacation 46,722 46,221 -1% (501) 63,334 62,227 -2% (1,107)
Cruise 146,916 146,498 -0.3% (418) 146,916 146,498 -0.3% (418)
Yacht 3,367 2,143 -36% (1,224) 3,622 2,467 -32% (1,155)
Total 197,005 194,862 -1% (2,143) 213,872 211,192 -1% (2,680)
*Total excludes air arrivals in categories other than Vacation
Q2 Total Arrivals were down by 1.1% as all arrival
types showed varying weakness. Yacht arrivalsexperienced the most pronounced decline
(36.4%) as it is an off year for the Newport
Bermuda Race.
Air – Vacation = Air arrivals indicating purpose of visit upon arrival as
Vacation, America’s Cup Vacation or Destination Wedding.
24%
75%
1%
Q2 Vacation Visitor Arrivals
Air-
Vacation
Cruise
Yacht
7/26/2019 BTA_Q2_2015 Tourism Industry Performance
http://slidepdf.com/reader/full/btaq22015-tourism-industry-performance 8/12
GoToBermuda.com
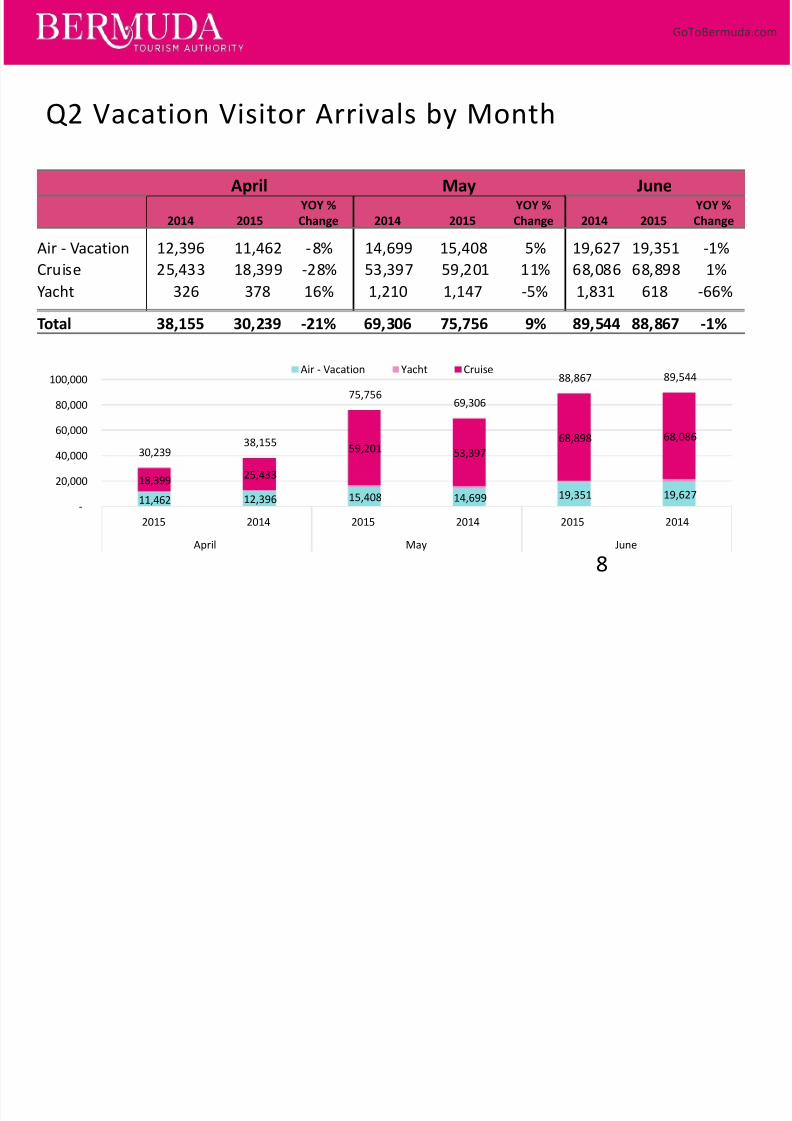
Q2 Vacation Visitor Arrivals by Month
8
April May June
2014 2015
YOY %
Change 2014 2015
YOY %
Change 2014 2015
YOY %
Change
Air - Vacation 12,396 11,462 -8% 14,699 15,408 5% 19,627 19,351 -1%
Cruise 25,433 18,399 -28% 53,397 59,201 11% 68,086 68,898 1%
Yacht 326 378 16% 1,210 1,147 -5% 1,831 618 -66%
Total 38,155 30,239 -21% 69,306 75,756 9% 89,544 88,867 -1%
11,462 12,396 15,408 14,699 19,351 19,627
18,39925,433
59,201 53,397
68,898 68,086
30,23938,155
75,75669,306
88,867 89,544
-
20,000
40,000
60,000
80,000
100,000
2015 2014 2015 2014 2015 2014
April May June
Air - Vacation Yacht Cruise

7/26/2019 BTA_Q2_2015 Tourism Industry Performance
http://slidepdf.com/reader/full/btaq22015-tourism-industry-performance 9/12
GoToBermuda.com
Q2 Vacation Air Arrivals – Accommodation Type
9
• In Q2 of 2015, 18% of vacation
visitors stayed in some type ofprivate home.
• Going forward as a result of new
visitor landing cards, the BTA will be
able to determine the quantity of
visitors staying in private homes,
broken down by - vacation rentals vs
persons staying with Friends and
Relatives. Q2 contains 2 months
with this more detailed breakdown.
82%
10%
5%
2% 1%Hotels or Similar
(Includes Hotels, B&Band Guest Houses)
Rental
House/Apartment
Friends and Relatives
Other

7/26/2019 BTA_Q2_2015 Tourism Industry Performance
http://slidepdf.com/reader/full/btaq22015-tourism-industry-performance 10/12
GoToBermuda.com
Q2 Air Visitor Arrivals by Type
10
Q2
2014
Q2
2015YOY %
Change
YOY #
Change YTD 2014 YTD 2015YOY %
Change
YOY #
Change
Vacation 46,722 46,221 -1.1% (501) 63,334 62,227 -1.7% (1,107)
Vacation 46,722 44,319 -5.1% (2,403) - - - -
Destination Wedding - 1,799 - 1,799 - - - -
America's Cup Vacation - 103 - 103 - - - -
The BTA has recently changed the Visitor Arrival forms to include a broader selection of options, allowing a more
granular view of visitor data. The cards took effect in late April and therefore there is no year-over-year
comparison. These new categories will be included in BTA reporting going forward.
Q2
2015
New Business Visitor Categories
America's Cup Business 144
Incentive Groups 234Conference/Meeting 3,703
New Visiting Friends & Relatives Category
Vacation 8,542
Total 12,623
The Business categories have been expanded to capture America’s Cup related business, Incentive Groups
and Conference/Meeting.
The Visiting Friends & Relatives category has been expanded to capture vacation and personal. The visitors
visiting friends & relatives that are on vacation will be monitored closely by the BTA.

7/26/2019 BTA_Q2_2015 Tourism Industry Performance
http://slidepdf.com/reader/full/btaq22015-tourism-industry-performance 11/12
GoToBermuda.com
Q2 Bermuda Hotel Statistics
11
0%
50%
100%
April May June YTD Total
2012 2013 2014 2015
ADR % CHG YOY # CHG YOY
April 4.2% $4.42
May 6.1% $23.56
June -1.6% $(7.61)
YTD Total +4.3% $13.85
RevPAR % CHG YOY # CHG YOY
April -3.6% $(1.96)
May 5.7% $14.37
June 4.3% $12.83
YTD Total 1.2% $1.90
• Average daily rate year-to-date has increased by almost $14 vs. 2014.
• Increasing ADR(Average daily rate) and relatively flat occupancy have increased RevPAR(Revenue per available room) by almost $2.
Source: STR Destination report including data from 10 hotels or approximately 75% of Bermuda’s room inventory
“This is a trend that we anticipate will continue to reflect positively on Bermuda as a year
round travel destination and is also reflective of the ongoing efforts of the BTA, and our
association members, to increase overall visitor arrivals for the remainder of the year.”
– Stephen Todd, Bermuda Hotel Association

7/26/2019 BTA_Q2_2015 Tourism Industry Performance
http://slidepdf.com/reader/full/btaq22015-tourism-industry-performance 12/12
GoToBermuda.com
Items of note – Q2
12
• Air Vacation Visitor Arrivals – While the USA saw a slight increase and the UK saw a 9%
increase year-to-date the Canadian market has seen an 18% decrease. The Canadian dollar
has declined to its lowest level since 2014 and we believe this is affecting the conversion of
Canadian travelers to purchase a vacation to Bermuda.
• As in Q1, air capacity continued to be a challenge in Q2 but on a smaller scale. Q2 sawalmost 5% (or 7,214 fewer seats) flying into Bermuda. Year-to-date that is a decrease of
8.8% (23,254 seats) fewer.