bringing student’s fitness scores to life keith valley middle school horsham, pennsylvania
TRANSCRIPT

Bringing Student’s Fitness Scores to Life
Keith Valley Middle School
Horsham, Pennsylvania

Health and Physical Education Teachers
• KV H/PE Curriculum Coordinator
• KV H/PE Team Captain
• Synergy Committee Member
• Emergency Response Team Member
• Presenter at “09 and ’10 PSAHPERD ConventionMr. Eric Shea

Mr. Angelo Lafratta
• 8th grade Boys Soccer Coach
• 7th/8th grade Boys Track Coach
• 8th grade Boys Basketball Coach
• KV Ski Club Advisor• Presenter at ’09 and
’10 PSAHPERD Convention

Bringing Student Fitness Scores To Life
Today’s topics• Overview of KV Health/PE
• Communication
• Student Database
• Individual Fitness Project (IFP)–Graphing–Analysis/Recommendation

Keith Valley Middle School
• 1237 students (grades 6-8)
• Nine Health/PE teachers
• Students have Physical Education
class every other day for the year
• 83 minute blocks (All PE 1st/4th m.p.)
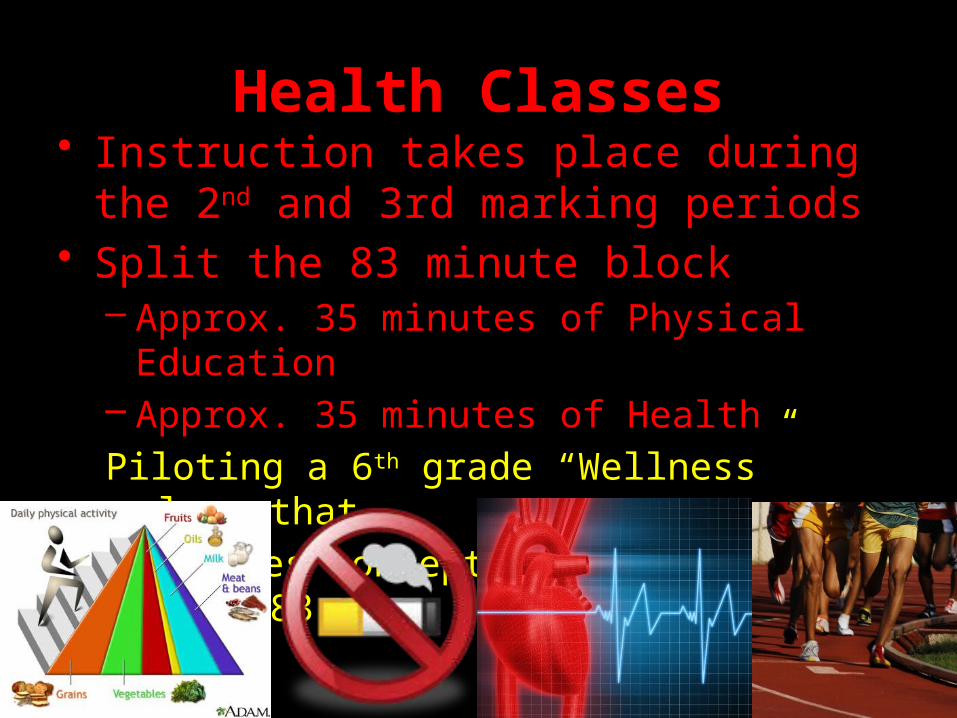
Health Classes• Instruction takes place during the 2nd and
3rd marking periods• Split the 83 minute block
– Approx. 35 minutes of Physical Education– Approx. 35 minutes of Health
Piloting a 6th grade “Wellness” class that
combines concepts of Health and P.E. -83 min.

Typical Class (83 min)
• Warm up– Cardiovascular– Stretching– Strength exercises– Locomotors/Agility
• Activity– Skill work– Partner practice– Group activity– Team sports ,
individual activities, cooperative games

Assessment• Students are graded TWICE per class period…
1. Cardio/Fitness (20-30 minutes) -Proper technique -Pacing-Exercise completion -Improvement
2. Basic skills necessary to perform the activity, including-Improvement-Cooperation-Preparation
Visit our Health/PE website for more detailed information
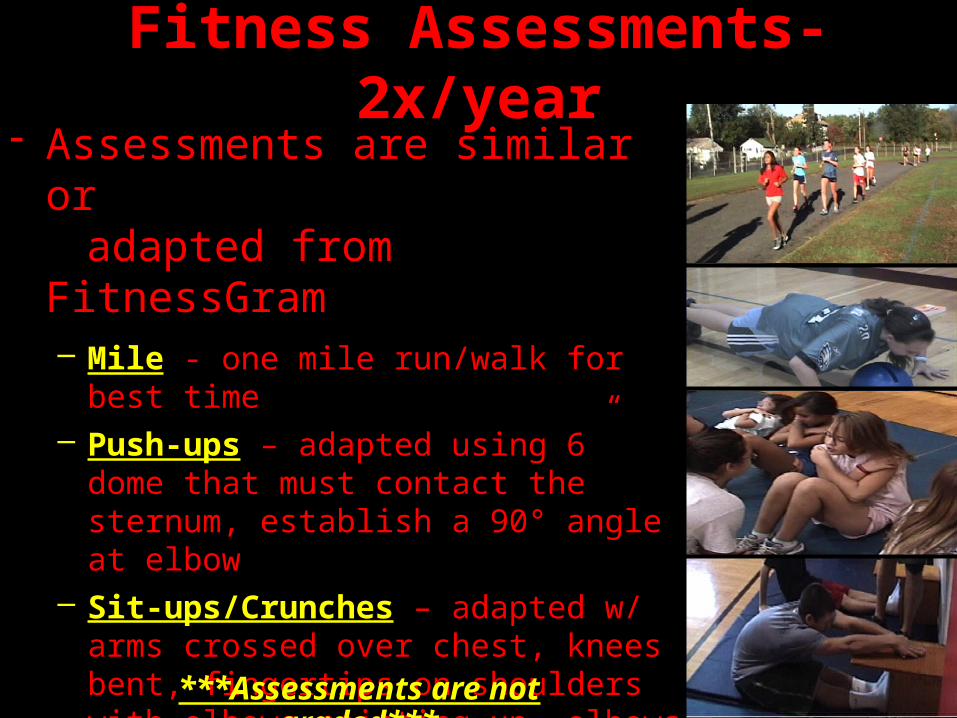
Fitness Assessments-2x/year- Assessments are similar or adapted from FitnessGram
– Mile - one mile run/walk for best time – Push-ups – adapted using 6” dome that
must contact the sternum, establish a 90° angle at elbow
– Sit-ups/Crunches – adapted w/ arms crossed over chest, knees bent, fingertips on shoulders with elbows pointing up– elbows must touch mid-thigh
– Sit &Reach – two legged, two handed
***Assessments are not graded***

Questions We Considered• Is our curriculum relevant to our student’s lives?• Are we doing our part as Health/PE teachers to help
improve and/or maintain PSSA scores?• Are we able to provide H/PE across the curriculum,
incorporating what we teach with other subject areas (Lang Arts, Math, Science, Technology)?
• Are we promoting healthy, responsible decision making to members of the community?
• Do the parents see our program as valuable?• Does the administration see H/PE as a valuable
department?• Are we effectively promoting our program?
We believe the answer is

What We Know• KV Averages for Fitness Assessments exceed
the Fitnessgram HFZ’s (pre-2010) and Presidential (1994/1998)
• That our Fitness Data from the last 5-7 years is reliable historical source to formulate our own averages/fitness zones
• Using KV Fitness Data and Performance Tracker that 75% of our current 8th grade students scored Proficient or Advanced on PSSAs AND Fitness Assessments

The importance of
Communication
Keith Valley Middle SchoolHealth and Physical Education

Communication• With?
– H/PE department colleagues– Parents/guardians/community– Individual students– Administrators and other teachers within
our/other buildings• Why?
– Develops relationships– Increase credibility and validity of H/PE– Advocate for our program

PE Teachers• 9 department members, over 1200
students, obvious need for organization and documentation
• Microsoft Access database to document and share information with each other
Locker numbers and lock combinations
No dresses/unprepared, doctor and parent notes
Fitness Scores
Fitness Reports and Recommendations

Locker Info
IDLocker . Combo SN Tchr Day
1042450I 20-26-
0019556174 Shea 6a
1026754C 32-34-
2422381565 Shea 6a
1026814f 01-27-
1312465734 Lafratta 6b
4248125B 22-00-
2222381631 Lafratta 7a
1529434I 04-26-
1219556154 Shea 6b
4243654I 04-14-
04 3209 Shea 6a
1406745B 36-26-
12 709308 Shea 7a
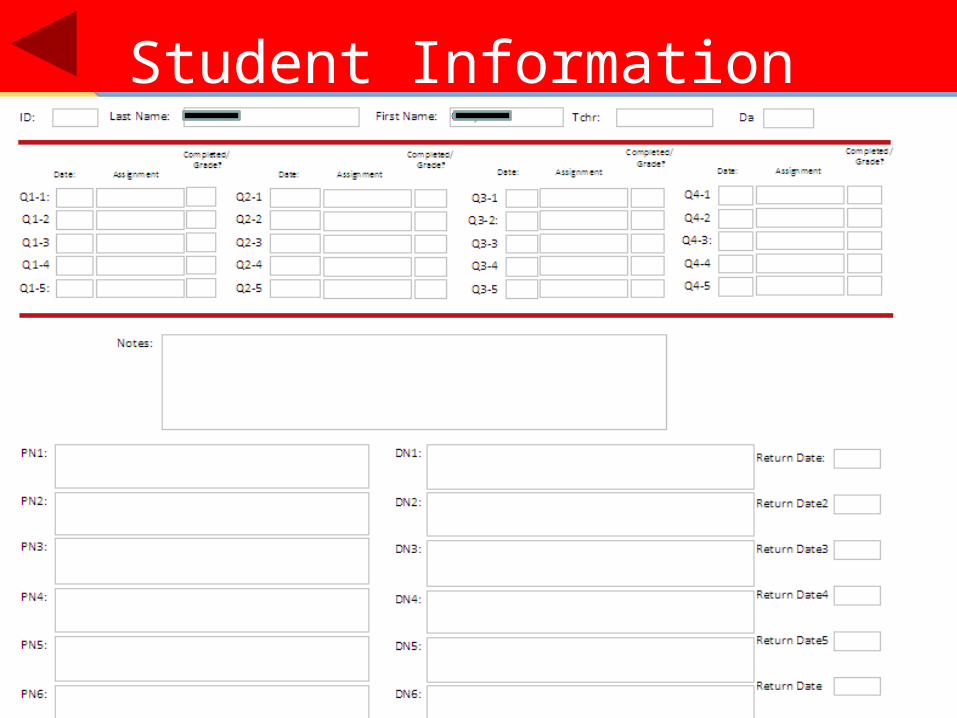
Student Information

Teacher-Parent/Guardian
• Quarterly newsletter including – Updates – Health & Fitness tips– “What’s New”
• Fitness assessment report (sent with newsletter)– Individual fitness scores – Recommendations for improving/maintaining scores
• E-mails and phone calls• 24/7 access to updated grades on PowerSchool • Updated team and individual teacher websites


Fitness Database


Teacher-Administration (And Other Building Teachers)
• Compile and graph data to send to principals and superintendents
• Analysis by administration of scores for validity, compare to PSSA scores, GPA, Attendance, and local school districts
• Results sent to High School H/PE teachers
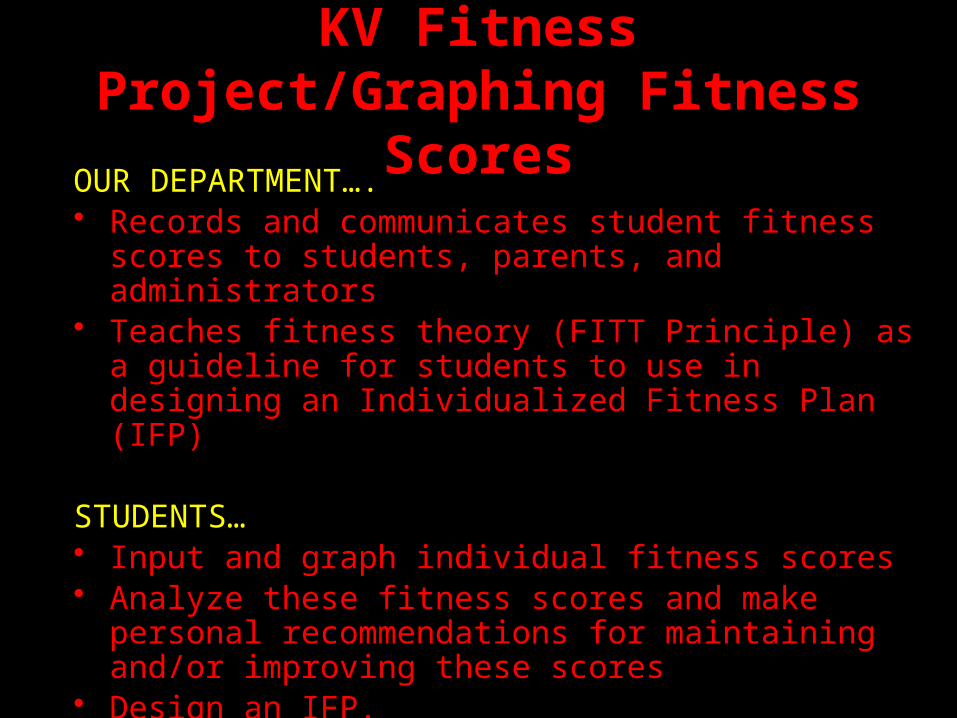
KV Fitness Project/Graphing Fitness Scores
OUR DEPARTMENT….• Records and communicates student fitness scores to
students, parents, and administrators• Teaches fitness theory (FITT Principle) as a guideline for
students to use in designing an Individualized Fitness Plan (IFP)
STUDENTS…• Input and graph individual fitness scores • Analyze these fitness scores and make personal
recommendations for maintaining and/or improving these scores
• Design an IFP.
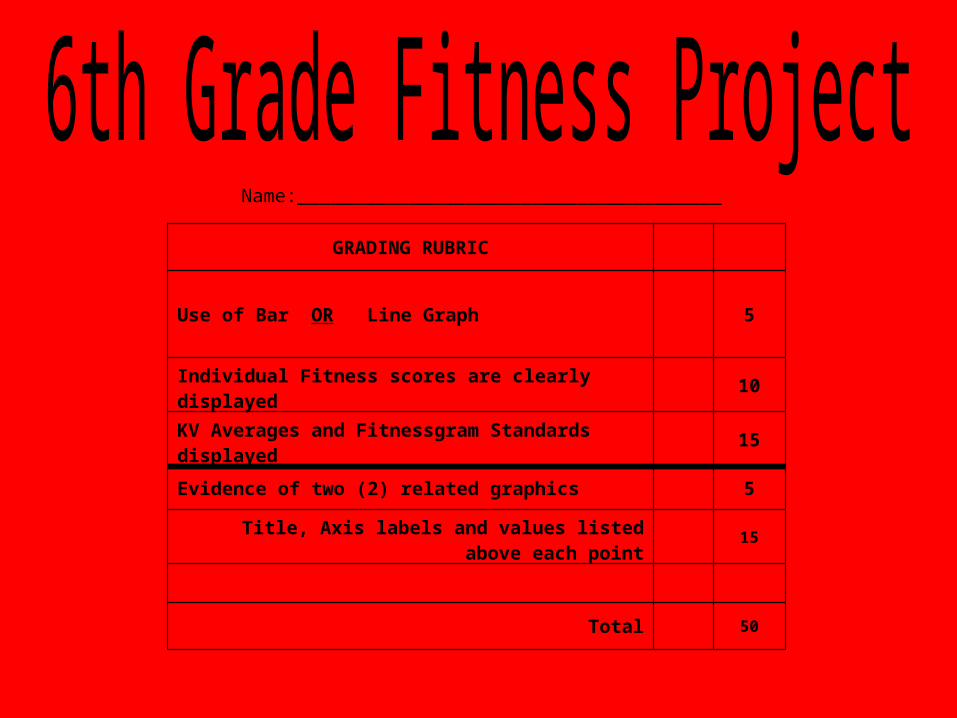
Name:______________________________________
GRADING RUBRIC
Use of Bar OR Line Graph 5
Individual Fitness scores are clearly displayed 10
KV Averages and Fitnessgram Standards displayed 15
Evidence of two (2) related graphics 5
Title, Axis labels and values listed above each point
15
Total 50

Excel Spreadsheet
Fitness Assessment Tests Me
KV Averag
e Fitnessgra
m Low Fitnessgra
m High
Push-ups 30 17 8 20
Sit-ups 52 47 15 36
Sit and Reach 10 9 8 8
Mile 7.3 9.17 11 8
Enter mile times with a decimal point to work properly with graph
Create a spreadsheet like the one above. Fitness Assessments down
the side. Student scores, school average, Fitnessgram high and low
scores across the top.
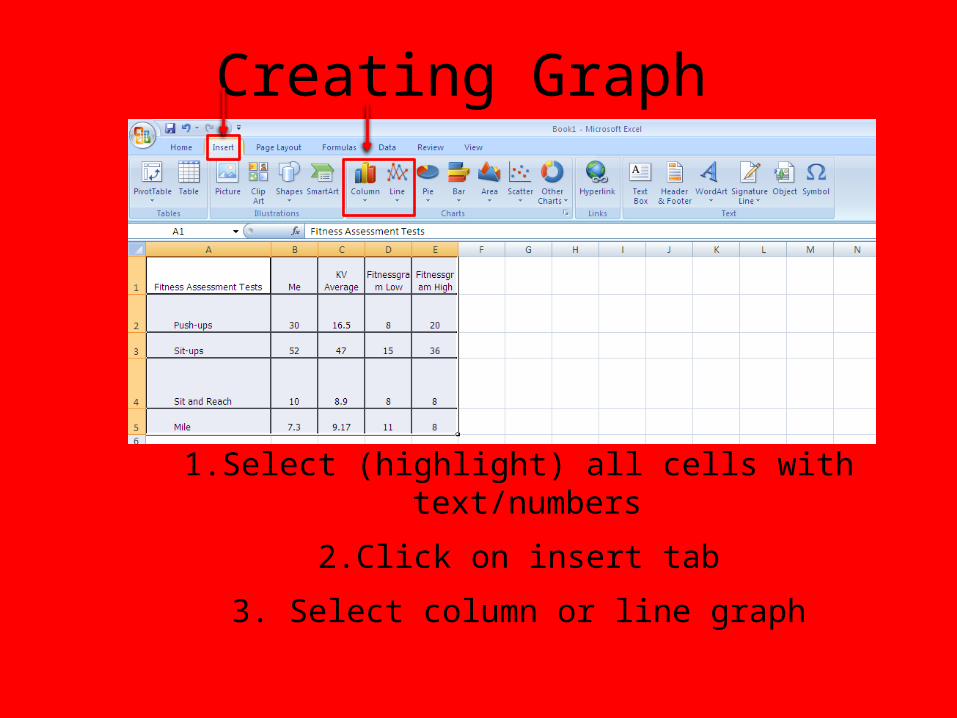
Creating Graph
1. Select (highlight) all cells with text/numbers
2. Click on insert tab
3. Select column or line graph
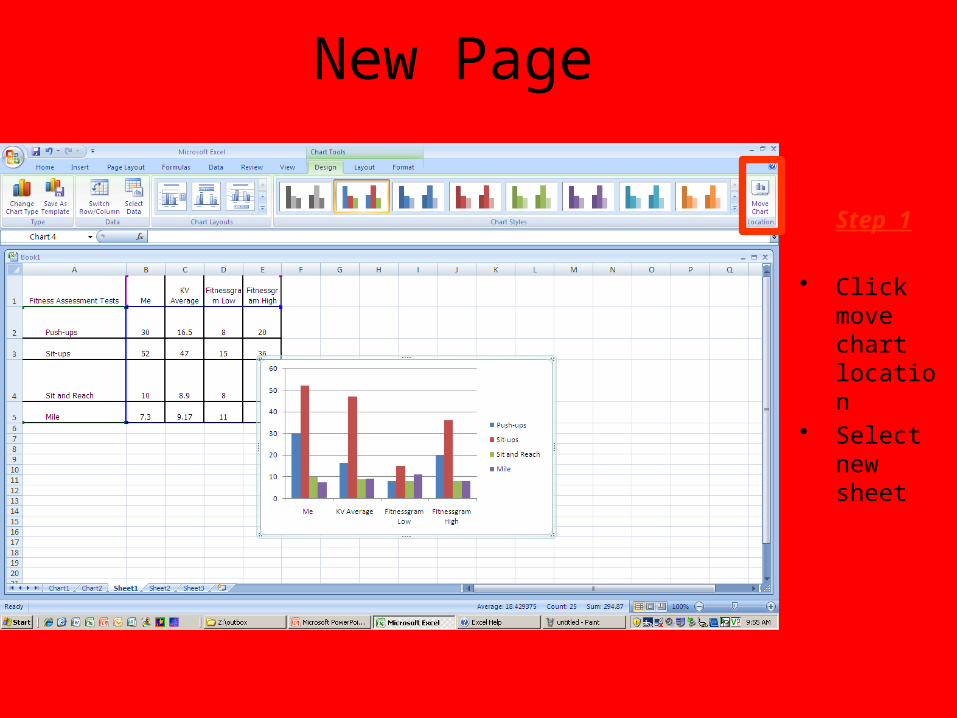
New Page
Step 1
• Click move chart location
• Select new sheet

FormattingStep 2
Click switch row/column
The fitness assessments should be along the x axis

Step 3
1. Select layout tab
2. Click chart title
2a. Insert chart
title
3. Click axis titles
4. Select primary
horizontal axis title
4a. Enter
horizontal title
5. Select primary
vertical axis title
5a. Enter
vertical title
Inserting Chart Titles

Step 4• Select data
labels button
• Select layout
Enter Data Labels
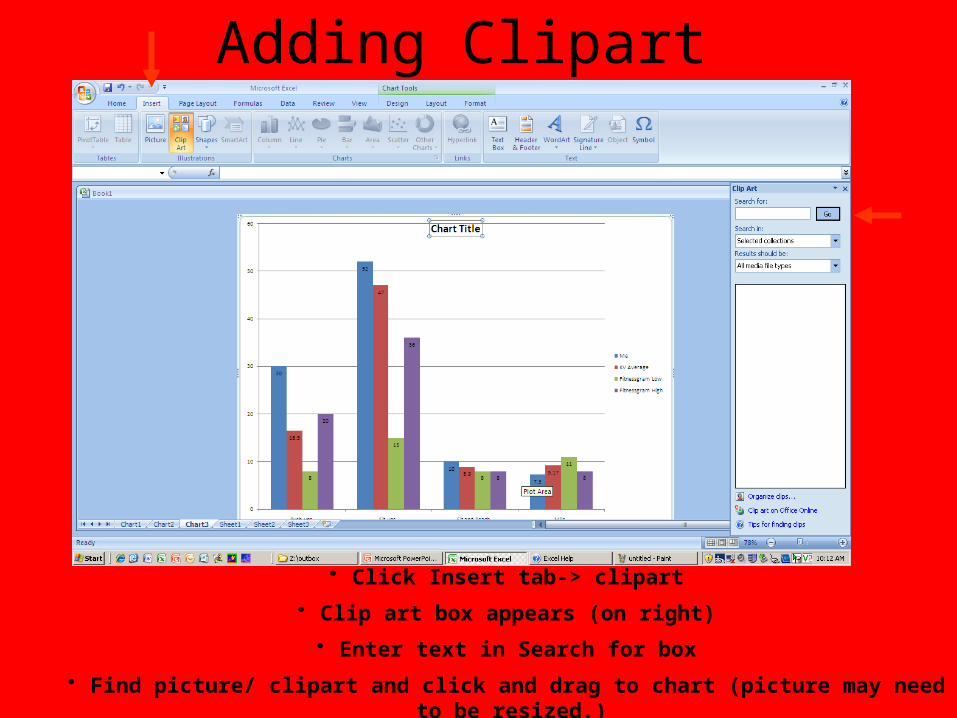
Adding Clipart
• Click Insert tab-> clipart
• Clip art box appears (on right)
• Enter text in Search for box
• Find picture/ clipart and click and drag to chart (picture may need to be resized.)
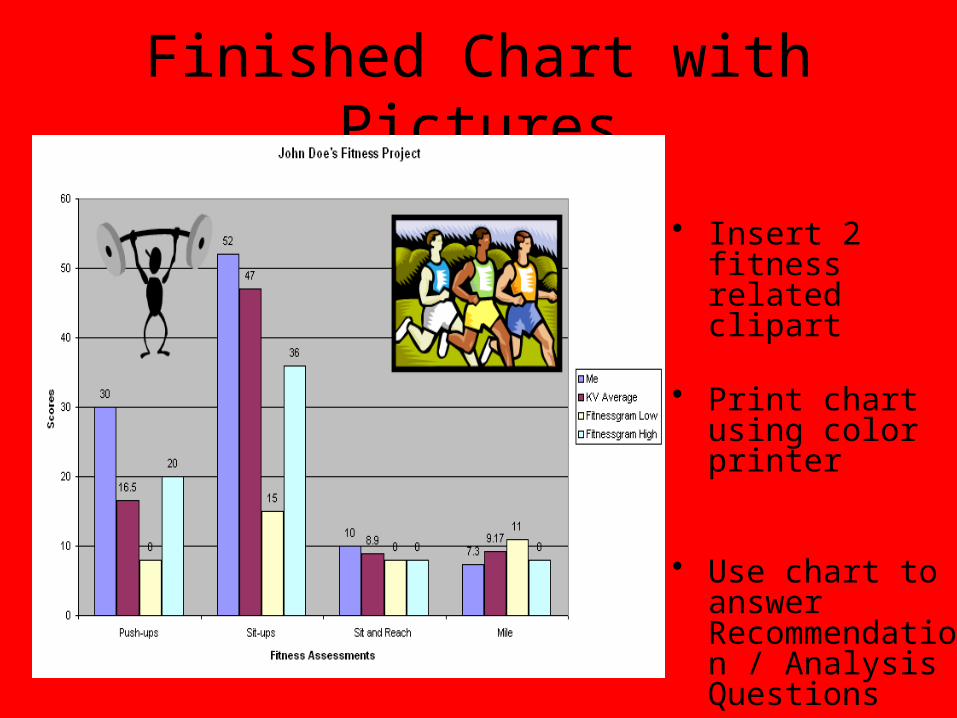
Finished Chart with Pictures
• Insert 2 fitness related clipart
• Print chart using
color printer
• Use chart to answer Recommendation / Analysis Questions

Seventh/Eighth Grade Charts
Push-Ups Sit-Ups Mile Sit and Reach 0
10
20
30
40
50
60
70
80
10
15
10.1512.5
11
75
9.38
12.5
6
47
9.0812
25
75
8.54
13
20
55
9.42
1411
47
9.3
12.5
Fitness Profile.
6th Fall
6th Spring
7th Fall
7th Spring
8th Fall
Girls KV Average
Fitness Assessments
Scores

Seventh/Eighth Grade Charts
Push-Ups Sit-Ups Mile Sit and Reach 0
10
20
30
40
50
60
70
80
31
75
5.53
10
26
57
8.51 8.912
21
108
30
45
79
Vs. Averages
Fall 2010
KV Average
Boys Low Fitness Zone
Boys High Fitness Zone
Assessments
Scores
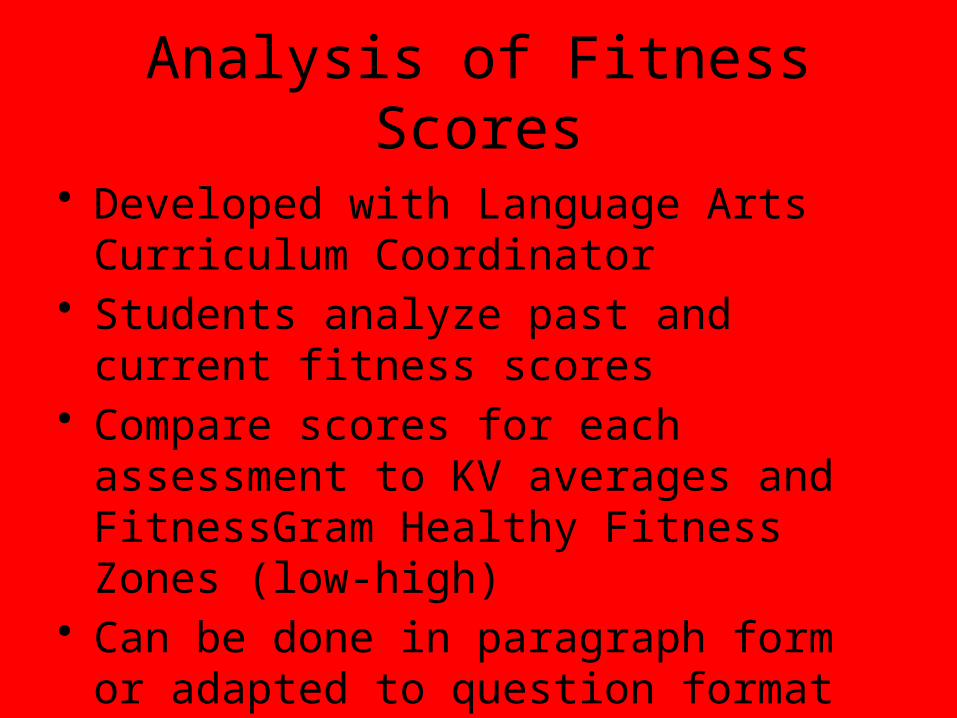
Analysis of Fitness Scores
• Developed with Language Arts Curriculum Coordinator
• Students analyze past and current fitness scores
• Compare scores for each assessment to KV averages and FitnessGram Healthy Fitness Zones (low-high)
• Can be done in paragraph form or adapted to question format

Recommendations for Improvement
• Students use F.I.T.T Principle to explain how they will improve or maintain their respective scores– F.I.T.T to improve cardiovascular endurance– F.I.T.T to improve upper body
strength/endurance – F.I.T.T to improve core strength/endurance– F.I.T.T to improve flexibility
GRADING RUBRICYour score
Total score
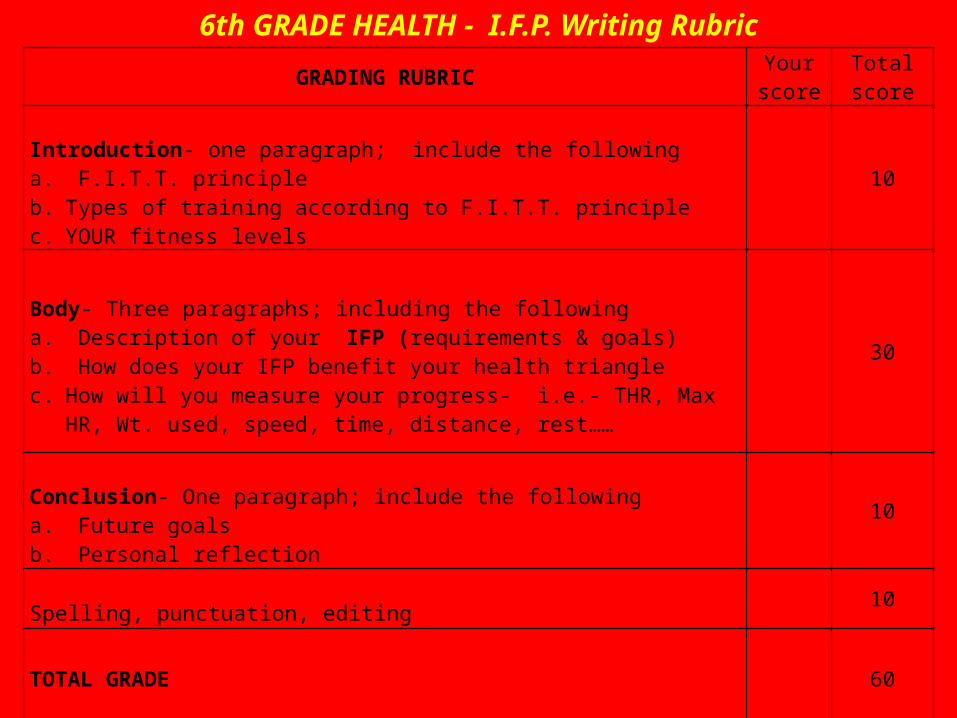
Introduction- one paragraph; include the followinga. F.I.T.T. principleb. Types of training according to F.I.T.T. principlec. YOUR fitness levels
10
Body- Three paragraphs; including the followinga. Description of your IFP (requirements & goals)b. How does your IFP benefit your health trianglec. How will you measure your progress- i.e.- THR, Max HR, Wt. used,
speed, time, distance, rest……
30
Conclusion- One paragraph; include the followinga. Future goalsb. Personal reflection
10
Spelling, punctuation, editing 10
TOTAL GRADE 60
6th GRADE HEALTH - I.F.P. Writing Rubric

QUESTIONS FOR ANALYSIS/REFLECTION AND RECOMMENDATIONS1. Do you feel that your 8th grade fitness scores show that you did the best you can do for
each of the tests?
A: For most of my tests it shows that I did my best. I always try my best and I never slack off. Many people know me and they would say the same but there was on assessment I did not do the best on. This assessment is my scores for push-ups in the spring of seventh grade and fall of eighth grade. I have not been trying my best on those because I feel it is my weakest so I do not worry about it.
2. How do your 8th grade scores for each test compare to the average scores for Keith
Valley?
A: Not to brag, but my scores, all of them, are WAY above the average. I have nine more push-ups than the girl’s average, 28 more sit-ups than the average, 2.5 better than the average for sit and reach, and my mile is better by about 2 minutes and thirty seconds. So the scores are higher.
3. Do your 8th grade scores for each test fall between the low and high scores for the
Fitness gram standards? Explain.
A: No, my tests do not fall between the high and low. Every one of my scores are better than the high and low so my push-ups, sit-ups, mile and sit and reach is higher than normal.
4. Are there any of your scores on your fitness assessment that you would like to
improve? Which ones?
A: Yes there are two that I would like to improve on the most. Obviously I want to improve in every assessment but my top two to work on are push-ups and my mile. I really need to work on my mile time because I play many sports and need to improve my speed and cardiovascular endurance.

• Recommendations• I would improve my mile time by doing a mix of cardiovascular exercises such
as swimming, jogging, and walking. I will do this four times a week and make each exercise intense by doing each exercise until I cannot do it anymore (overload principle). So there will be no specific time, but I will make myself do each exercise for at least an hour, possibly taking 5-20 second rests in order to make this possible. The type will vary, but I will make sure it works my entire lower body such as swimming in order to make the most progress.
• I would improve my push-ups by weight training 3-4 times a week, aiming to do 10-15 reps per set, and 3-4 sets each time I am done my 1-5 minute break. I will also apply the overload principle to increase my strength as best as I can. I will choose to start at 8 pound weights, and add at least 2 pounds every two weeks. Generally I will do triceps- curls and actual push-ups to work on my form, and also my ability to adapt to the way to do push-ups, and being able to lift my weight.
• I would improve my sit- ups by doing an overload principle for sit- ups and crunches, and aiming to do 100 each time before breaking for about 2-5 minutes. I would increase this by 10 each week, and also swim once every 4 days to improve my sit- ups. I would do this workout plan 4 times a week, each week with this work out.
• I would improve my sit-and-reach by stretching 10-20 minutes each day, for 3-4 days each week. I would also do yoga for 30-60 minutes a day in order to increase my flexibility. I would work on increasing how far down I go to touch my toes each week until I can see a major improvement in my flexibility in order to increase and improve my sit-and-reach score.

Words of Encouragement!!• “Great work Eric. I am really impressed with all the work your team has
done with the Fitness Database. I think this is a really great project. “
SarahStout – KV Asst. Principal
• “The fitness report is exceptionally well done! Also, kudos on the presentation. ”Jean DiSabatino- Dir. Of Curr./Supervision
• “I wanted to thank you for the wonderful presentation that you and your staff gave at the conference. I was much moved.” Benjamin Greer-Physical Education Mariana Bracetti Academy Charter School
• “Nicely done....I am not surprised even for a minute about the recognition and respect your department receives. I have said it once, and I will say it again. I believe our KV Health and Physical Education department is the best middle school department I have ever worked with. Congratulations!”
William Lessa-Retired HH Superintendent

THANK YOU For Your Time
QUESTIONS?