bp33 groundwater investigation report
TRANSCRIPT

BP33 Groundwater Investigation Report - 1 -
BP33 Groundwater
Investigation Report November 2020
PREPARED FOR Core Lithium Pty Ltd

BP33 Groundwater Investigation Report - 2 -
Copyright notice
This document and its contents are confidential and may not be disclosed, copied, quoted or published unless prior written permission is obtained from Groundwater Enterprises.
Disclaimer
Groundwater Enterprises accepts no liability for any loss or damage arising as a result of any person other than the named client “Core Lithium Pty Ltd” in reliance on any information, opinion or advice contained in this document. This document may not be relied upon by any other person other than the client, its officers and employees.
Groundwater Enterprises accepts no liability and gives no warranty as to the accuracy or completeness of the information provided to it, by, or on behalf of the client, or its representatives and takes no account of matters that existed when the document was transmitted to the client but which were not know to Groundwater Enterprises until subsequently.
Groundwater Enterprises accepts no liability for any matters arising if any recommendations contained in this document are not carried out, or are partially carried out, without further advice being obtained from Groundwater Enterprises.

BP33 Groundwater Investigation Report - 3 -
Contents
1 Introduction ..................................................................................................................................- 4 -
1.1 Project Description ....................................................................................................................... - 4 -
1.2 Scope ........................................................................................................................................... - 4 -
2 Site Characterisation .....................................................................................................................- 5 -
2.1 Topography and Drainage ............................................................................................................ - 5 -
2.2 Geology ........................................................................................................................................ - 6 -
2.3 Hydrogeology ............................................................................................................................... - 6 -
2.4 Groundwater Receptors ............................................................................................................... - 7 -
3 Methods .......................................................................................................................................- 9 -
3.1 Drilling and Construction .............................................................................................................. - 9 -
3.2 Slug Tests and Recovery Test ........................................................................................................ - 9 -
3.3 Water Quality ............................................................................................................................. - 10 -
4 Investigation Drilling ................................................................................................................... - 11 -
4.1 Program Design .......................................................................................................................... - 11 -
4.2 Drilling Results ........................................................................................................................... - 11 -
5 Slug and Recovery Tests .............................................................................................................. - 15 -
6 Conclusions and Recommendations ............................................................................................ - 18 -
7 References .................................................................................................................................. - 19 -
Appendix A Composite Bore Logs ....................................................................................................... - 20 -
Appendix B Aquifer Testing Analysis ................................................................................................... - 35 -

BP33 Groundwater Investigation Report - 4 -
1 Introduction Core Lithium are scoping an underground mining operation at their BP33 deposit located 30 km south-east of Darwin on exploration leases EL30015 and EL29698. The BP33 deposit is situated approximately 5km south-east of Grants Lithium prospect. The environmental assessment report (NTEPA, 2019) for an open cut lithium mine at the Grants deposit was completed in June, 2019.
Core Lithium commissioned a desktop groundwater study of the BP33 prospect in October 2019 (GE, 2019). The study recommended the installation of a series of nested bore to investigate groundwater conditions around BP33 and to establish a monitoring network for the collection of baseline water level and quality data for the mine approval process. This document forms a field completion report from the site groundwater investigation.
1.1 Project Description The proposed mining activities at BP33 involve the construction of a box cut to remove the weathered zone from the Burrell Creek Formation. The box cut will be excavated to a depth of approximately 60 m. A 400 m long decline stemming from the base of the box cut will allow access to the spodumene deposit located beneath the previously worked open pit. The deposit will be mined using sub-level retreat mining to an estimated depth of 320 m (Orewin, 2019). The mined ore will be trucked to the Grants processing facility and there will be no requirement for tailings storage at the BP33 site. There will be a waste rock dump at the BP33 site comprised of the oxide waste from the box cut, which will be pushed back into the box cut on completion of mining. Both the box cut and the underground mine will require de-watering. Water sourced from de-watering activities will be pumped to Observation Hill Dam (OHD), which is being recommissioned as a water supply for ore processing at the Grants site.
1.2 Scope The field completion report has the following scope:
Report on findings from the investigation program drilling including documenting groundwater observations, field water quality, bore construction and bore completion details.
Document hydraulic testing of investigation bores including methods, results and analysis.
Provide monitoring recommendations to enable the collection of a baseline water quality and water level data set.

BP33 Groundwater Investigation Report - 5 -
2 Site Characterisation The following section is sourced from the BP33 desktop groundwater study (GE, 2019).
2.1 Topography and Drainage The regional topography surrounding BP33 is largely subdued and flat lying. Locally BP33 is situated in a subtle valley with a south to south-west orientation. Higher elevations (40 mAHD) occur to the north-east around Observation Hill Dam (OHD). The land surface falls away from this area to the south-west with the lowest lying areas (10 maHD) found along drainage lines running into Bynoe Harbour.
BP33 is located in the Finniss River drainage basin and falls within the Bynoe Harbour catchment. There are no permanent water courses in the immediate vicinity of BP33. The area is drained by a number of small unnamed ephemeral water courses which rise in the higher elevations to the north-west of BP33 and drain south-west into the Charlotte River and ultimately Bynoe Harbour. BP33 is located on the western edge of a small drainage line connects OHD to the Charlotte River. Both OHD and the BP33 pit lake contain surface water that typically persists through the dry season. While OHD is fed by a drainage line, BP33 is not connected to any channels and the water present in the pit is likely to represent a groundwater discharge feature. The generalised topography and drainage around BP33 are shown in Figure 2-1.

BP33 Groundwater Investigation Report - 6 -
2.2 Geology
Regionally, BP33 is located in the north-west of the Pine Creek Geosyncline, a thick sequence of Proterozoic
metasediments that overlies Archean basement rocks and underwent extensive folding and uplift around
1800 million years ago. After a long hiatus during which significant weathering and erosion occurred a drape
of flat bedded Cretaceous and Cainozoic sedimentary formations were deposited over the Proterozoic rocks.
The lithium prospect at BP33 is hosted in a pegmatite, which is one of a swarm of complex zoned rare
element pegmatites forming the 55km long by 10km wide West Arm–Mt Finniss pegmatite belt. The Finniss
pegmatites are intruded into the early Proterozoic Burrell Creek Formation which is distributed along the
northwest margin of the Pine Creek Geosyncline. The BP33 pegmatite is north-east trending and steeply
dipping, it is approximately 75 m long with a width of between 25 – 40 m (Frater, 2005). From exploration
drilling the top of the BP33 pegmatite ranges in depth from 30 – 180 m below surface, with an average depth
of 90 m.
The Burrell Creek Formation is comprised of shale, siltstone, sandstone and strongly foliated phyllite with
lenses of quartz pebble conglomerate. The Burrell Creek Formation is extensively weathered at surface where
it often forms a laterite horizon. The underlying shale and phyllite is typically heavily weathered and
decomposed into mottled clay. Exploration drilling at BP33 indicates the weathered zone in the Burrell Creek
is on average 60 m thick with the upper 30 m typically showing extensive weathering and the bottom 30 m
showing moderate to slight weathering.
Where the Burrell Creek Formation is not exposed at surface it subcrops beneath a thin veneer of Tertiary
and Quaternary aged sediments. These include alluvial deposits (Qa) along the drainage lines as well as
colluvium and laterite formed by in-situ weathering of the Burrell Creek Formation. The colluvium (Cz)
comprises ferruginous clayey, sandy and gravelly soils. Both the colluvium and laterite deposits are typically
less than 4 m in thickness (Pietsch, 1986).
The alluvial deposits centre around active drainage lines and can extend up to several kilometres in length
and up to 200-300 m in width (Frater, 2005). They are typically less than 4 m in thickness but can exceed 6 m
in the southern sections of the Booths drainage (Mollemans and Hatcher, 1988) - Booths is the drainage line
running south from Observation Hill dam to the immediate east of BP33. Mollemans and Hatcher (1988)
describes the following three sedimentary layers in alluvial deposits around BP33/Observation Hill area:
A-layer: Less than 0.5 m thick and may contain a thin band of pebbles (5–10 mm diameter) at its base. It is essentially un-mineralised and is capped by an organic clay layer.
B-layer. A minor gravel layer up to 1 m thick, directly overlying the C-layer or separated from it by thin bands of clayey sand.
C-layer. This earliest layer consists of basal clayey sand or gravel up to 2.5 m thick, containing sub-angular quartz and siltstone clasts up to 200 mm in length.
Mollemans and Hatcher (1988) note that in some areas the alluvial deposits have been completely reworked
with black soil, and that the bedrock under the main alluvial channel is typically heavily weathered.
2.3 Hydrogeology
BURRELL CREEK FORMATION
The Burrell Creek Formation forms the principal aquifer across the BP33 site. It is a marginal fractured rock aquifer with typical bore yields of less than 0.5 L/s; largely due to the lack of primary porosity and open fracturing within the formation. Higher yields (2 L/s) can occur where drilling intersects fracture zones or bands of quartz veining. Groundwater is typically intersected at the base of the weathering zone/transition into fresh Burrell Creek Formation. At the Grant’s deposit 5 km to the north-east groundwater investigation bores intersected the upper groundwater zone in the Burrell Creek Formation between 50 and 60 m below ground level. Limited information is available at BP33, however, anecdotal observations from mineral drilling suggests holes intersect groundwater between 60 and 80 m depth. The Burrell Creek Formation is largely fine grained and characteristically weathers to clay. Where heavily weathered the Burrell Creek Formation is less permeable as open fractures are less prevalent where the formation is decomposed to clay.

BP33 Groundwater Investigation Report - 7 -
Groundwater flow directions within the Burrell Creek Formation are likely to reflect the topographic gradient with groundwater moving from higher groundwater elevations in the north-east around OHD to lower elevations around Bynoe Harbour south-west of BP33. The pit lake at BP33 appears to operate as a groundwater discharge feature, the loss of water from the lake through evaporation may create a local groundwater gradient in the surrounding aquifer toward the pit lake.
ALLUVIAL AQUIFER
There is limited information on the groundwater characteristics of the alluvial deposits as no bores have been constructed in this unit at BP33. Auger drilling and costeaning undertaken by Greenex Mining along the drainage lines south of OHD in the 1980s provide some insight into groundwater occurrence within the alluvial deposits. Mollemans and Hatcher (1988) report that costeans (a shallow exploration pit/trench) excavated along the Booths alluvial deposit north of BP33 frequently collapsed due to the ingress of water. They suggest that seepage from OHD may provide a permanent source of water to the alluvial channels downstream of the dam. The presence of relatively persistent pools of water along the drainage line south of OHD and shallow groundwater levels (<5 m) in mineral holes adjacent to BP33 support this theory.
The aquifers are likely to operate at a very local scale, being of both limited lateral extent (200 – 300 m) and thickness (up to 6 m). Groundwater flow directions within the alluvial aquifer are likely to be consistent with the surface water gradient and generally flow from north to south past BP33.
2.4 Groundwater Receptors
GROUNDWATER BORES
There are no active groundwater bores within 9 km of the BP33 site. The closest groundwater bore to BP33
is RN023177, located 2.5 km north of the pit (see Figure 2-2). RN023177 was drilled in 1984 and was
constructed in the Burrell Creek Formation as a potential water supply bore for Greenex mining operations
at Observation Hill. The bore is not currently in use. The next closest groundwater bore RN038217 is
located 9 km south of BP33 on the Fog Bay Road. RN038217 was drilled in 2013 to provide a domestic
water supply.
ENVIRONMENTAL RECEPTORS
Groundwater Dependant Ecosystems Atlas
Groundwater dependent Ecosystems (GDEs) have been identified using the GDE Atlas, a national dataset of Australian GDEs developed by the Bureau of Meteorology (BOM, 2019) to assist groundwater management and planning. Figure 2-2 maps the terrestrial ecosystem layer in the vicinity of BP33. This layer shows the potential for ecosystems that rely on the subsurface presence of groundwater – including vegetation ecosystems such as forests and riparian vegetation. Four mapped categories are presented: known GDEs based on regional studies and high, medium and low GDE potential based on remote sensing and image analysis.
The GDE Atlas maps an area of medium GDE potential (shown in green in Figure 2-2) along the drainage lines to the immediate east and south of BP33.
Field Surveys
EcOz Environmental Consultants (EcOz) was engaged by Core Lithium to map riparian vegetation communities and collect baseline information on community structure and condition along the drainage line downstream of OHD. The field survey (EcOz, 2019) mapped 3.6 hectares of GDE vegetation within the riparian zone of the drainage line. Three vegetation monitoring sites were established (see Figure 2-2 for locations) as part of the survey. At the time of surveying in June 2019, pools of water were observed around the northern two monitoring sites, RVS4 and RVS5.
As part of the Environmental Impact Assessment (EIS) for the Grants Lithium mine EcOz established two surface water monitoring sites on the drainage line south of OHD: BPUS SW1 and BPUS SW2 (Figure 2-2). The sites have been monitored at a quarterly frequency since October 2017. Surface water flows at the

BP33 Groundwater Investigation Report - 8 -
monitoring sites generally cease early in the dry season (April/May). Anecdotal information suggests that in wetter years pools of surface water persist throughout the dry season.
Figure 2.2 Groundwater receptors around BP33

BP33 Groundwater Investigation Report - 9 -
3 Methods
3.1 Drilling and Construction Drilling was undertaken by Bores NT using a truck mounted Bourne drilling rig equipped to drill using rotary air and rotary mud methods. Bores were constructed in accordance with the Minimum Construction Requirements for Water Bores in Australia, 4th Edition (NUDLC, 2020).
Shallow bores (< 10 m deep) were drilled with a 200 mm mill claw and were constructed with 50 mm or 100 mm Class 12 PVC casing and machine slotted screens. The bores were gravel packed with 3 mm washed gravel, sealed with a bentonite plug (minimum expanded thickness of 1 m) and grouted to surface with a cement-bentonite grout.
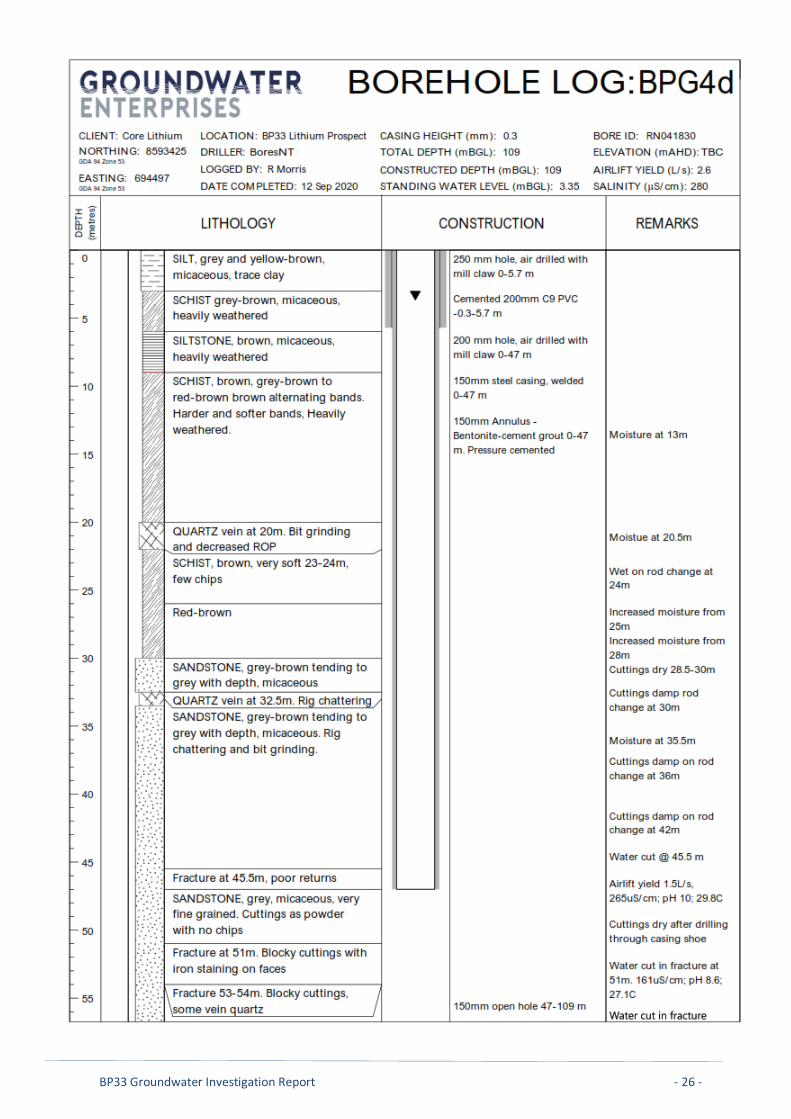
Intermediate depth bores were constructed with Class 9 PVC surface casing (205 mm) installed and cemented to a depth of 5.7 m. In accordance with licensing conditions the cement was left to cure 24-hours before drilling recommenced with a 200 mm mill claw. Where groundwater yields in excess of 0.5 L/s were intersected in the weathered zone of the Burrell Creek Formation bores were constructed with 100 mm PVC casing and screens, gravel packed with 3 mm washed gravel and sealed with bentonite pellets. The annulus of the bores was backfilled with cuttings to a depth of 5 m and grouted to surface with a cement-bentonite grout. Holes which did not produce free water through the weathering zone had 158 mm steel casing run. The casing was seated at the base of the 200 mm hole and was necessary to prevent hole collapse in the weathered Burrell Creek Formation. Drilling continued through fresh Burrell Creek Formation using a 152 mm hammer bit until free water was intersected. Bores were then constructed with 100 mm Class 12 PVC casing and screens, 3 mm washed gravel and a bentonite plug, which was placed within the 152 mm hole. Bores were backfilled with cuttings and grouted to surface from a depth of 5 m. In the deep bore (BPG4) the 158 mm steel casing was pressure cemented from 47 m to surface with cement bentonite-grout. The cement was allowed 24-hours to cure before drilling continued with a 152 mm hammer bit through fresh Burrell Creek Formation. The hole was drilled to a total depth of 109 m.
Drill cuttings were collected every 3 m (twice for each 6 m drilling rod) and laid out in order of increasing depth for logging by the site hydrogeologist. Bore yields were gauged by measuring flow from the discharge line and where necessary by damning the area around the surface casing and diverting flow through a short section of 200 mm casing. The flow was then measured using 10 L/23 L buckets or in the case of higher yielding site BPG4 by use of a V-notch weir. Airlift rates were recorded at each visible increase in yield. Field parameters - Electrical Conductivity (EC), pH, temperature – were recorded at each yield measurement using a portable water quality meter (see Section 3.3 for further detail).
3.2 Slug Tests and Recovery Test Slug tests were completed using a solid slug and a Solinst Level Logger pressure transducer/data logger. The Level Logger was lowered on a stainless-steel cable to a depth approximately 5 m below the standing water level. Two solid slugs (40 mm and 80 mm diameter) were constructed from weighted PVC tubing with external endcaps. The two sizes allowed testing of both 50 mm and 100 mm diameter monitoring bores. The slug was gradually lowered on nylon rope until it was positioned immediately above the water level and was then rapidly released to approximate an instantaneous upward displacement of the water level (falling head test). Following a recovery period (up to several hours in low-K bores), the slug was rapidly removed, resulting in a downward displacement of the water level (rising head test). The water level data was downloaded and processed in Microsoft excel. Slug test analysis was completed using Aqtesolv® for Windows (Hydrosolve, 2007).
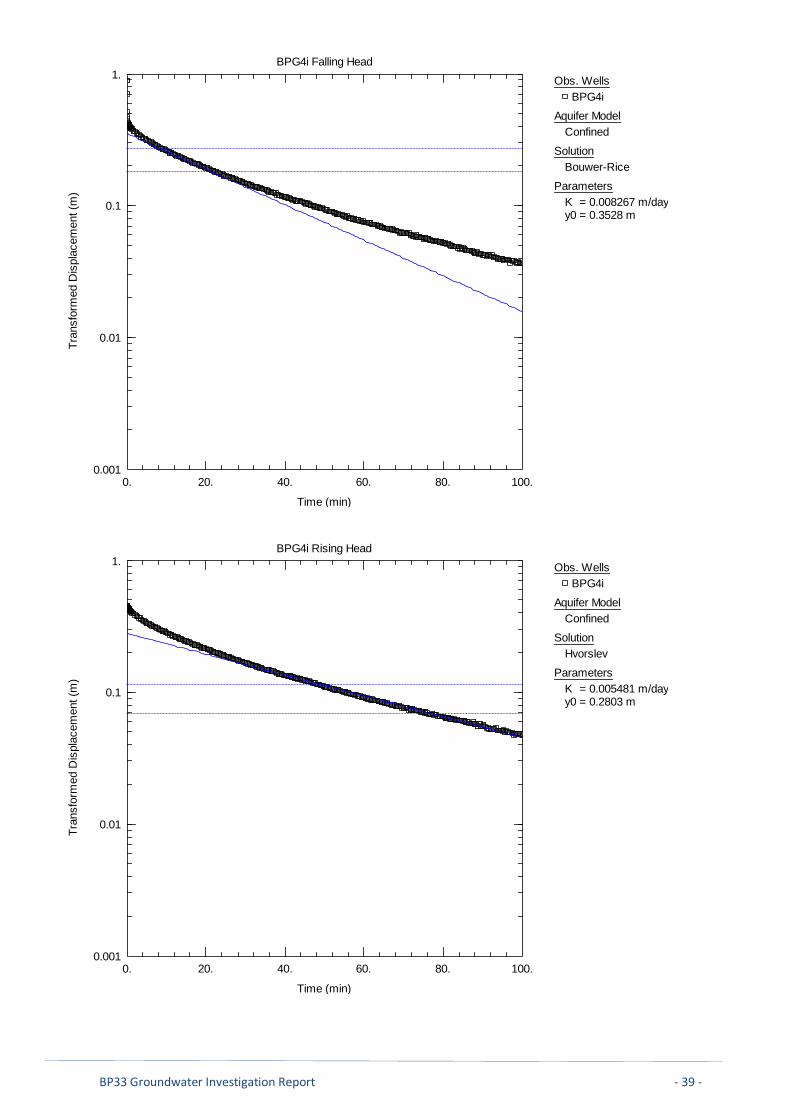
A recovery test was completed on (BPG4i). A Solinst level logger was installed in the base of the bore immediately following airlifting. As the bore has a very low yield the airlift effectively removed all groundwater from the casing, which approximated the instantaneous displacement required for the slug test. Recovery was recorded using the level logger and the recovery test was analysed as a standard rising head test using the Bouwer-Rice (1976) solution.

BP33 Groundwater Investigation Report - 10 -
3.3 Water Quality
Field parameters (temperature, Electrical Conductivity (EC) and pH) were measured using a TPS Water Quality meter (model WP-81). EC and pH were field calibrated against standard solutions for a precision of ±1 % and ±0.01 units respectively. Temperature measurements have an instrument precision of ±0.4°C.

BP33 Groundwater Investigation Report - 11 -
4 Investigation Drilling
4.1 Program Design Thirteen investigation bores were recommended to characterise groundwater conditions around BP33. Nested bore sites with shallow and deep bores were located up-gradient and down-gradient of the BP33 deposit to investigate the extent of the alluvial aquifer, the potential for Groundwater Dependent Ecosystems and interactions with the drainage line running to the east of the pit lake. A triple nested site was positioned immediately east of the BP33 pit-lake with a shallow bore in the top of the BCF/Alluvial aquifer, a bore in the weathered BCF and a bore in the deeper, fresh BCF. A summary of the program design and the investigation rationale for each site is provided in Table 4.1.
Table 4.1 Planned drilling locations and site rationale
SITE NAME
SITE TYPE
NO. BORES
TARGET AQUIFER
RATIONALE
BPG1 Single bore
1 BCF Assess groundwater conditions up gradient of proposed box cut
BPG2 Nested 2 Alluvial Aquifer BCF
Assess groundwater conditions up gradient between proposed box cut and Observation Hill Dam in area of mapped GDE potential
BPG3 Nested 2 Alluvial Aquifer BCF
Assess groundwater conditions and establish a groundwater monitoring point at field verified GDE and vegetation monitoring site RVS5
BPG4 Nested 3 Alluvial Aquifer BCF (weathered) BCF
Establish a nested monitoring site to investigate the degree of vertical connection between Burrell Creek Formation aquifer, the weathered zone in the Burrell Creek Formation and the Alluvial Aquifer in the immediate vicinity of the proposed mine workings
BPG5 Nested 2 Alluvial Aquifer BCF
Assess groundwater conditions and establish monitoring at field verified GDE and surface water monitoring site BPUS SW2
BGP6 Single bore
1 BCF Assess conditions downgradient of proposed box cut
BPG7 Nested 2 Alluvial Aquifer BCF
Assess groundwater conditions downgradient of proposed mine in area of mapped GDE potential
4.2 Drilling Results
The investigation program at BP33 was undertaken over a two-week period in early September, 2020 and involved the drilling and construction of 13 monitoring bores. A map of bore locations is provided in Figure 4.1 and a summary of drilling results shown in Table 4.2. Further detail on the investigation drilling and bore construction is provided in Appendix A (Composite Drilling Logs). The following general comments can be made from the investigation drilling:
The alluvial sediments have limited thickness (0 - 4.5 m) and were unsaturated at drilling locations sites BPG3, BPG4, BPG5 located around surface water and vegetation monitoring points near the eastern drainage line. Results suggest that any permanent groundwater features or GDEs are more likely reliant on water sourced from the weathered top of the Burrell Creek Formation. The alluvial aquifer has limited saturated extent and is either not continuous along the length of the drainage line or is restricted to the immediate area around the active drainage channel.

BP33 Groundwater Investigation Report - 12 -
Bore yields in the BCF ranged from < 0.1 L/s (seepage) to 3 L/s. The BCF displays negligible primary porosity and higher yielding groundwater intersections occur around quartz veins or in discrete fracture zones within the metasediments. These typically occur in top 20 m of fresh BCF. Generally, the weathered zone exhibited low permeability and does not produce free groundwater, the exception being in the north of the site (BPG1, BPG2) and BPG7 where the weathering profile was less extensive and groundwater was intersected in fractured and weathered metasediments.
Groundwater levels area shallow ranging from 3.4 - 7.9 metres below ground level (mBGL). The depth to groundwater is correlated with surface elevation (i.e., shallower groundwater occurs in lower lying areas and deeper groundwater depths occur in topographically elevated areas).
Field measurements of water quality taken during bore development indicate groundwater
Electrical Conductivity (EC) ranges from 50 - 310 S/cm and has a lower EC in the northernmost sites (BPG1, BPG2). There is no uniform trend of increasing or decreasing EC with bore depth or aquifer.

BP33 Groundwater Investigation Report - 13 -
Table 4.1 Summary of drilling results from BP33 investigation drilling
SITE ID AQUIFER TYPE
DRILLED DEPTH (mBLG)*
CONSTRUCTED DEPTH (mBLG)*
AIRLIFT YIELD (L/S) ^
ELEVATION TOP OF CASING (mAHD)
STANDING WATER LEVEL (mBLG)*
ELECTRICAL CONDUCTIVITY
(S/CM)
COMMENT
BPG1 Fractured/weathered BCF with pegmatite
37 36 1.5 31.63 7.87 60
Bore drilled directly into outcropping BCF with no alluvial cover present. Only moderate weathering observed in BCF. Groundwater was intersected around thin pegmatite/quartz band and in the underlying fractured sandstone
BPG2i Fractured/weathered BCF with quartz veins
29.5 28.3 0.4 19.07 3.51 50
Groundwater was intersected around quartz veins and in fractured weathered schist. As with BPG1 the weathering profile in BCF was less extensive and the formation more competent relative to sites further to the south.
BPG2s Alluvial Sediments (Silty sand with laterite band)
4 3.5 Seepage 19.01 3.47 170 Bore constructed across a thin alluvial sequence (4.5 m) comprising sand and silty-sand, which had a saturated thickness of 1 m at time of drilling.
BPG3i Fresh BCF 49 48.75 0.1 14.68 4.22 270
BCF sequence displayed limited fracturing. No groundwater observed in the weathered zone (4.5 – 30 m), minor water cuts occurred within the fresh schists.
BPG3s Alluvial Sediments 4.5 4.5 Dry 14.52 Dry N/A Bore constructed across a thin alluvial sequence (4.5 m) comprising silt, laterite and quartz. The alluvials were unsaturated at time of drilling.
BP4d Fractured Fresh BCF 109 109 2.6
13.52
3.35 280
Groundwater was intersected in fractured schist and sandstone just below the weathered zone of the BCF. Airlift yields (measured using a V-notch weir) of up to 5.5 L/s were recorded through a discrete fracture zone (50 – 54 m). Yield dropped progressively with increased drilling depth to a final yield of 2.5 L/s from 109 m. As there were no problems with hole integrity the decrease in yield suggests the fracture zone has limited spatial extent.

BP33 Groundwater Investigation Report - 14 -
SITE ID AQUIFER TYPE
DRILLED DEPTH (mBLG)*
CONSTRUCTED DEPTH (mBLG)*
AIRLIFT YIELD (L/S) ^
ELEVATION TOP OF CASING (mAHD)
STANDING WATER LEVEL (mBLG)*
ELECTRICAL CONDUCTIVITY
(S/CM)
COMMENT
No additional water bearing zones encountered from 54 – 109 m. Produced groundwater had a strong hydrogen sulphide smell.
BPG4i Weathered BCF 35.4 35.4 Seepage 13.54 3.82 310 Bore constructed in the heavily weathered schists and sandstones of the BCF. Cuttings were damp but no free water encountered during drilling.
BPG4s Weathered BFC 8 8 Seepage 13.52 3.68 120 Only 2 m of unsaturated alluvial sediments intersected. Bore constructed in heavily weathered top of the BCF.
BPG5i Fractured Fresh BCF 57.3 57.3 3 12.51 4.72 180
Seepage (<0.1 L/s) observed in the base of the weathered zone with a significant water strike (3 L/s) recorded around a discrete quartz vein in the top of the fresh BCF at 53 m.
BPG5s Weathered BCF 8 8 Seepage 12.26 5.17 180 Only 2 m of unsaturated alluvial sediments intersected. Bore constructed in heavily weathered top of the BCF.
BPG6 Fractured Fresh BCF 73 73 1.5 24.26 7.53 210
No groundwater observed in weathered BCF. Groundwater (2.8 L/s during drilling) intersected in fractured siltstone/quartz vein from a depth of 70 – 71 m.
BPG7i Fractured Fresh BCF 53.2 53.2 0.5 13.62 4.03 230
Groundwater (0.7 L/s) intersected in discrete fracture zone at 16 m in the weathered zone, which was cased off. Deeper groundwater intersection (0.7 L/s) at 47 m occurred around a quartz band within fresh schist.
BPG7s Weathered BCF 7 7 Seepage 13.41 4.23 100
Drilling intersected around 4 m of alluvial sediments (silt and silty-sand) which were unsaturated at time of drilling. The bore was constructed in the heavily weathered top of the BCF.
* mBGL (metres below ground level ^ Airlift yields are final constructed yield

BP33 Groundwater Investigation Report - 15 -
5 Slug and Recovery Tests The slug test and recovery results are summarised in Table 5.1. Individual summary of the data and analysis for each of the tests completed are provided in Appendix B. Displacement was calculated from the water level logger data. The data was parsed to ensure that time zero represented the maximum displacement in accordance with the translation method (Butler, 1998). The translated data is presented in the individual bore summaries in Appendix B. Aqtesolv® for Windows (Hydrosolve, 2007), a groundwater industry standard hydraulic analysis package, was used to analyse the data, with the Bouwer-Rice (1976) and Dagan (1978) the primary solutions used to calculate hydraulic conductivity in the bores showing over-damped responses (Newcomer, 2008). These are straight line solutions that assume a quasi-stead-state by neglecting storativity (Hydrosolve, 2007). Type-curves were matched to the head ranges recommended by Butler (1989), particularly when the data did not present as a straight line. The straight-line methods readily allow observation of the double straight-line effect in bores that may be screened across the water table due to filter pack drainage (Bouwer, 1989). A confined Bouwer-Rice (1976) solution was used for the deeper bores constructed in the Burrell Creek. An unconfined Bouwer-Rice (1976) solution was applied in the shallow bores constructed in the top of the weathered Burrell Creek and alluvial sediments. In shallow bores screened across the watertable (BG2S, BG5S, BG7S) a secondary analysis was undertaken using the Dagan (1978) solution, which allows correction of the displacement data to account for the effective porosity of the filter pack.
The test results reveal that the permeability of the Burrell Creek Formation is dependent on secondary porosity (i.e., fracture and joint development). Fresh and weathered Burrell Creek Formation with negligible fracturing displayed a hydraulic conductivity range of 0.003 – 0.08 m/day. Bores that intersected fractured Burrell Creek Formation (fresh or weathered) showed a hydraulic conductivity two orders of magnitude higher with a range from 0.27 – 2.6 m/day. The alluvial sediments (silty sand) tested with a hydraulic conductivity in the order of 0.4 m/day.

BP33 Groundwater Investigation Report - 16 -
Table 5.1 Summary of slug test and recovery test results
SITE ID EASTING GDA94 Z52
NORTHING GDA94 Z52
AQUIFER TYPE BORE DEPTH (mBGL)
TEST TYPE
HYDRAULIC CONDUCTIVITY (m/day) BOUWER-RICE DAGAN
DAGAN (1978)
COMMENTS
Falling Rising Falling Rising
BPG1 694131 8594616
Fractured/weathered BCF with pegmatite
35.8 Slug 1.7 1.95 - -
Aquifer zone in fracture around pegmatite intrusion and underlying sandstone. Thickness based on water bearing zone. Best characterised as K of fracture zone, BCF less weathered in north of BP33 site and is more representative of fresh, fractured BCF
BPG2i 694784 8594336 Fractured/weathered BCF with quartz veins
28.3 Slug 0.56 0.58 - -
Small yields within BCF associated with water intersections around discrete quartz veins, bore in north of site where the BCF is more competent/slightly less weathered than to the south of BP33
BPG2s 694784 8594342
Alluvial Sediments (Silty sand with laterite band)
3.5 Slug 0.4 - 0.43 -
Water level was at the base of the screens at the time of testing so no rising head test could be undertaken. The Dagan (1978) method has been used to approximate K in bores which are unconfined and screened across the watertable
BPG3i 694617 8593873 Fresh BCF 49 Slug 0.027 0.038 - - Bore screens fresh BCF with minor water intersections around slightly more weathered bands and micro fractures
BPG3s 694614 8593869 - 4.5 - - - - -
Bore screened across alluvial sequence. Sediments were unsaturated at time of construction so no slug test could be completed.

BP33 Groundwater Investigation Report - 17 -
SITE ID EASTING GDA94 Z52
NORTHING GDA94 Z52
AQUIFER TYPE BORE DEPTH (mBGL)
TEST TYPE
HYDRAULIC CONDUCTIVITY (m/day) BOUWER-RICE DAGAN
DAGAN (1978)
COMMENTS
Falling Rising Falling Rising
BP4d 694492 8593426 Fractured Fresh BCF
109 Slug - - - -
Displacement data could not be analysed due to inertial effects largely due to large casing diameter and relatively high transmissivity. Recommended that a conventional pumping test be undertaken to determine the K of the fracture zone
BPG4i 694486 8593420 Weathered BCF 35.4 Slug 0.005 0.008 - - Constructed in heavily weathered BCF (schist,
quartz and sandstone) toward the base of the weathering profile
Recovery - 0.003 - -
BPG4s 694492 8593427 Weathered BFC 8 Slug 0.024 0.021 - - Constructed in heavily weathered schist and siltstone (BCF) at the top of the formation, screens fully submerged.
BPG5i 694422 8593016 Fractured Fresh BCF
57.3 Slug 1.26 1.34 - - Groundwater intersected around quartz veins and fractures in fresh BCF schist
BPG5s 694423 8593020 Weathered BCF 8 Slug 0.048 0.035 0.042 0.043 Constructed in heavily weathered schist (BCF)
BPG6 693929 8593846 Fractured Fresh BCF
73 Slug 2.58 2.24 - - Groundwater intersected in heavily fractured siltstone, aquifer response relates to the fracture zone rather than bulk BCF material
BPG7i 693984 8593099 Fractured Fresh BCF
53.2 Slug 0.43 0.27 - - Groundwater intersected around quartz veining at the transition from weathered to fresh schist (BCF)
BPG7s 693980 8593100 Weathered BCF 7 Slug 0.077 0.073 0.068 0.075 Bore constructed in extremely weathered schist with quartz veining at the top of the BCF

BP33 Groundwater Investigation Report - 18 -
6 Conclusions and Recommendations The findings from the investigation drilling and hydraulic testing program can be summarised as follows:
The geology of the BP33 site is dominated by metasediments of the Burrell Creek Formation comprising schists, phyllite, siltstone and sandstone. Groundwater is hosted in discrete zones that are associated with quartz veins or fractured metasediments. The fracture zones have limited thickness, typically less than 1 m, and generally occur below the weathering zone.
The alluvial sediments have limited spatial extent and thickness (< 4.5 m). At time of drilling the alluvial sediments were unsaturated at the drilling sites between the BP33 pit/proposed mine workings and the active drainage line to the east. Results suggest that any groundwater dependent ecosystems along the drainage line are more likely to source water from the weathered top of the Burrell Creek Formation than the alluvial sediments.
Hydraulic testing reveals the permeability of the Burrell Creek Formation is dependent on secondary porosity (i.e., fracturing). Fresh and weathered Burrell Creek Formation with negligible fracturing has a low hydraulic conductivity (0.003 – 0.08 m/day). Fractured Burrell Creek Formation (fresh or weathered) has a hydraulic conductivity two orders of magnitude higher (0.27 – 2.6 m/day). The alluvial sediments (silty sand) have a hydraulic conductivity in the order of 0.4 m/day.
Groundwater quality can be classified as fresh with an Electrical Conductivity (EC) range of 50 - 310
S/cm. The EC is lower in the northernmost sites (BPG1, BPG2). There is no uniform trend of increasing or decreasing EC with bore depth or aquifer.
The report makes the following recommendations:
Water level loggers should be installed in all monitoring bores and the BP33 pit-lake to allow for the collection of a baseline groundwater level data set prior to any mine activity commencing.
Water quality sampling should be undertaken with an initial monthly frequency for the first six months post drilling. After an appropriate baseline data set has been collected the monitoring frequency should be reviewed and site specific trigger levels developed. This process should be guided by outputs from the numerical groundwater model.
A pumping test program is recommended to assess whether the aquifer has potential to augment project water supplies at Observation Hill Dam and to confirm the extent of the fractured aquifer around the monitoring bores. This should comprise of a longer pumping test (minimum 24-hours) on deep bore (BPG4) to better characterise the hydraulic conductivity of the fractured BCF and connections between this system and the shallow groundwater system. Shorter pumping tests (8-hours) are also recommended on higher yielding bores BPG1, BPG5, BPG6.

BP33 Groundwater Investigation Report - 19 -
7 References Bouwer, H. 1989. The Bouwer and Rice slug test--an update, Ground Water, vol. 27, no. 3, pp. 304-309.
Bouwer, H. and Rice, R.C. 1976. A slug test method for determining hydraulic conductivity of unconfined aquifers with completely or partially penetrating wells, Water Resources Research, vol. 12, no. 3, pp. 423-428
Bureau of Meteorology, 2019. Groundwater Dependent Ecosystem Atlas. http://www.bom.gov.au/water/groundwater/gde/
Butler, J.J., Jr. 1998. The Design, Performance, and Analysis of Slug Tests, Lewis Publishers, New York, 252p.
Dagan, G. 1978. A note on packer, slug and recovery tests in unconfined aquifers. Water Resources Research, vol. 14, No. 5, pp 929-934.
EcOz, 2019. Mangrove and Riparian Vegetation Assessment Grants Lithium Project. Unpublished report prepared by EcOz Environmental Consultants for Core Lithium, October 2019.
Frater K. M, 2005. Tin-tantalum pegmatite mineralisation of the Northern Territory. Northern Territory Geological Survey, Report 16.
Groundwater Enterprises. 2019. BP33 Lithium Prospect Preliminary Groundwater Assessment. Prepared for Core Lithium, October 2019.
Hydrosolve 2007. AQTESOLV® for Windows Version 4.50 – Professional.
Mollemans, F. and Hatcher, M. 1988. Annual report MLN 16. Prepared by Greenex, March 1988. CR19880150
Newcomer, D.R. 2008. BP-5 Remedial Investigation Slug-Test Characterization Results for Well 699-52-55A. Prepared for the U.S. Department of Energy. Pacific Northwest National Laboratory.
NTEPA, 2019. Assessment Report 89 – Grants Lithium Project, Core Lithium Limited. Northern Territory Environmental Assessment Agency, June 2019.
NUDLC, 2020. Minimum Construction Requirements for Water Bores in Australia 4th Edition. National Uniform Drillers Licensing Committee 2020.
Orewin, 2019. Finniss underground mining study. Unpublished report prepared for Core Lithium by Orewin Independent Mining Consultants. September 2019.
Pietsch, B. A, and Stuart-Smith, P. G. 1988. Darwin 1:250 000 Geological Map Series SD 52-4. Northern Territory Geological Survey.
Pietsch, B. A. 1986. 1:100 000 Geological Map Series Explanatory Notes – Bynoe 5072. Northern Territory Geological Survey.

BP33 Groundwater Investigation Report - 20 -
Appendix A Composite Bore Logs

BP33 Groundwater Investigation Report - 21 -

BP33 Groundwater Investigation Report - 22 -

BP33 Groundwater Investigation Report - 23 -

BP33 Groundwater Investigation Report - 24 -

BP33 Groundwater Investigation Report - 25 -
BP33 Groundwater Investigation Report - 26 -

BP33 Groundwater Investigation Report - 27 -

BP33 Groundwater Investigation Report - 28 -

BP33 Groundwater Investigation Report - 29 -

BP33 Groundwater Investigation Report - 30 -

BP33 Groundwater Investigation Report - 31 -

BP33 Groundwater Investigation Report - 32 -

BP33 Groundwater Investigation Report - 33 -

BP33 Groundwater Investigation Report - 34 -

BP33 Groundwater Investigation Report - 35 -
Appendix B Aquifer Testing Analysis
BPG1 Falling Head
0. 0.6 1.2 1.8 2.4 3.1.0E-4
0.001
0.01
0.1
1.
Time (min)
Dis
pla
cem
ent (m
)
Obs. Wells
BPG1
Aquifer Model
Confined
Solution
Bouwer-Rice
Parameters
K = 1.952 m/dayy0 = 0.314 m
BPG1 Rising Head
0. 1. 2. 3. 4. 5.0.001
0.01
0.1
1.
Time (min)
Dis
pla
cem
ent (m
)
Obs. Wells
BPG1
Aquifer Model
Confined
Solution
Bouwer-Rice
Parameters
K = 1.7 m/dayy0 = 0.278 m

BP33 Groundwater Investigation Report - 36 -
BPG2i Falling Head
0. 2. 4. 6. 8. 10.1.0E-4
0.001
0.01
0.1
1.
Time (min)
Dis
pla
cem
ent (m
)Obs. Wells
BPG2i
Aquifer Model
Confined
Solution
Bouwer-Rice
Parameters
K = 0.5804 m/dayy0 = 0.3748 m
BPG2i Rising Head
0. 3. 6. 9. 12. 15.1.0E-4
0.001
0.01
0.1
1.
Time (min)
Dis
pla
cem
ent (m
)
Obs. Wells
BPG2i
Aquifer Model
Confined
Solution
Bouwer-Rice
Parameters
K = 0.563 m/dayy0 = 0.3897 m

BP33 Groundwater Investigation Report - 37 -
BPG2s Falling Head
0. 12. 24. 36. 48. 60.0.001
0.01
0.1
1.
Time (min)
Norm
aliz
ed H
ead (
m/m
)Obs. Wells
BPG2s
Aquifer Model
Unconfined
Solution
Bouwer-Rice
Parameters
K = 0.4011 m/dayy0 = 0.2577 m
BPG2s Falling Head
0. 12. 24. 36. 48. 60.0.001
0.01
0.1
1.
Time (min)
Tra
nsfo
rmed D
ispla
cem
ent (m
/m)
Obs. Wells
BPG2s
Aquifer Model
Unconfined
Solution
Dagan
Parameters
K = 0.4335 m/dayy0 = 0.2253 m

BP33 Groundwater Investigation Report - 38 -
BPG3i Falling Head
0. 12. 24. 36. 48. 60.0.001
0.01
0.1
1.
Time (min)
Norm
aliz
ed H
ead (
m/m
)Obs. Wells
BPG3i
Aquifer Model
Confined
Solution
Bouwer-Rice
Parameters
K = 0.03797 m/dayy0 = 0.3684 m
BPG3i Rising Head
0. 12. 24. 36. 48. 60.0.001
0.01
0.1
1.
Time (min)
Norm
aliz
ed H
ead (
m/m
)
Obs. Wells
BPG3i
Aquifer Model
Confined
Solution
Bouwer-Rice
Parameters
K = 0.02671 m/dayy0 = 0.3446 m
BP33 Groundwater Investigation Report - 39 -
BPG4i Falling Head
0. 20. 40. 60. 80. 100.0.001
0.01
0.1
1.
Time (min)
Tra
nsfo
rmed D
ispla
cem
ent (m
)Obs. Wells
BPG4i
Aquifer Model
Confined
Solution
Bouwer-Rice
Parameters
K = 0.008267 m/dayy0 = 0.3528 m
BPG4i Rising Head
0. 20. 40. 60. 80. 100.0.001
0.01
0.1
1.
Time (min)
Tra
nsfo
rmed D
ispla
cem
ent (m
)
Obs. Wells
BPG4i
Aquifer Model
Confined
Solution
Hvorslev
Parameters
K = 0.005481 m/dayy0 = 0.2803 m

BP33 Groundwater Investigation Report - 40 -
BPG4i Recovery Analysis
0. 200. 400. 600. 800. 1000.0.001
0.01
0.1
1.
10.
100.
Time (min)
Tra
nsfo
rmed D
ispla
cem
ent (m
)Obs. Wells
BPG4i
Aquifer Model
Confined
Solution
Bouwer-Rice
Parameters
K = 0.003082 m/dayy0 = 24.12 m

BP33 Groundwater Investigation Report - 41 -
BPG4s Falling Head
0. 20. 40. 60. 80. 100.1.0E-4
0.001
0.01
0.1
1.
Time (min)
Tra
nsfo
rmed D
ispla
cem
ent (m
)Obs. Wells
BPG4s
Aquifer Model
Unconfined
Solution
Bouwer-Rice
Parameters
K = 0.0211 m/dayy0 = 0.3963 m
BPG4s Rising Head
0. 20. 40. 60. 80. 100.0.001
0.01
0.1
1.
Time (min)
Tra
nsfo
rmed D
ispla
cem
ent (m
)
Obs. Wells
BPG4s
Aquifer Model
Unconfined
Solution
Bouwer-Rice
Parameters
K = 0.02357 m/dayy0 = 0.3675 m

BP33 Groundwater Investigation Report - 42 -
BPG5i Falling Head
0. 1. 2. 3. 4. 5.0.001
0.01
0.1
1.
Time (min)
Dis
pla
cem
ent (m
)Obs. Wells
BPG5i
Aquifer Model
Confined
Solution
Bouwer-Rice
Parameters
K = 1.262 m/dayy0 = 0.3177 m
BPG5i Rising Head
0. 1. 2. 3. 4. 5.0.001
0.01
0.1
1.
Time (min)
Dis
pla
cem
ent (m
)
Obs. Wells
BPG5i
Aquifer Model
Confined
Solution
Bouwer-Rice
Parameters
K = 1.342 m/dayy0 = 0.3362 m

BP33 Groundwater Investigation Report - 43 -
BPG5s Rising Head
0. 34. 68. 102. 136. 170.0.001
0.01
0.1
1.
Time (min)
Norm
aliz
ed H
ead (
m/m
)Obs. Wells
BPG5s
Aquifer Model
Unconfined
Solution
Bouwer-Rice
Parameters
K = 0.0475 m/dayy0 = 0.2905 m
BPG5s Falling Head
0. 34. 68. 102. 136. 170.0.001
0.01
0.1
1.
Time (min)
Norm
aliz
ed H
ead (
m/m
)
Obs. Wells
BPG5s
Aquifer Model
Unconfined
Solution
Bouwer-Rice
Parameters
K = 0.03533 m/dayy0 = 0.2148 m

BP33 Groundwater Investigation Report - 44 -
BPG5s Falling Head
0. 34. 68. 102. 136. 170.0.001
0.01
0.1
1.
Time (min)
Tra
nsfo
rmed D
ispla
cem
ent (m
/m)
Obs. Wells
BPG5s
Aquifer Model
Unconfined
Solution
Dagan
Parameters
K = 0.04191 m/dayy0 = 0.2085 m
BPG5s Rising Head
0. 34. 68. 102. 136. 170.0.001
0.01
0.1
1.
Time (min)
Tra
nsfo
rmed D
ispla
cem
ent (m
/m)
Obs. Wells
BPG5s
Aquifer Model
Unconfined
Solution
Dagan
Parameters
K = 0.04332 m/dayy0 = 0.2084 m

BP33 Groundwater Investigation Report - 45 -
BPG6 Falling Head
0. 1. 2. 3. 4. 5.0.001
0.01
0.1
1.
Time (min)
Norm
aliz
ed H
ead (
m/m
)Obs. Wells
BPG6
Aquifer Model
Confined
Solution
Bouwer-Rice
Parameters
K = 2.239 m/dayy0 = 0.3764 m
BPG6 Rising Head
0. 1. 2. 3. 4. 5.0.001
0.01
0.1
1.
Time (min)
Norm
aliz
ed H
ead (
m/m
)
Obs. Wells
BPG6
Aquifer Model
Confined
Solution
Bouwer-Rice
Parameters
K = 2.583 m/dayy0 = 0.3917 m

BP33 Groundwater Investigation Report - 46 -
BPG7i Falling Head
0. 4. 8. 12. 16. 20.0.001
0.01
0.1
1.
Time (min)
Dis
pla
cem
ent (m
)Obs. Wells
BPG7i
Aquifer Model
Confined
Solution
Bouwer-Rice
Parameters
K = 0.2685 m/dayy0 = 0.2346 m
BPG7i Rising Head
0. 2. 4. 6. 8. 10.0.001
0.01
0.1
1.
Time (min)
Dis
pla
cem
ent (m
)
Obs. Wells
BPG7i
Aquifer Model
Confined
Solution
Bouwer-Rice
Parameters
K = 0.4341 m/dayy0 = 0.2648 m

BP33 Groundwater Investigation Report - 47 -
BPG7s Falling Head
0. 20. 40. 60. 80. 100.0.01
0.1
1.
Time (min)
Norm
aliz
ed H
ead (
m/m
)Obs. Wells
BPG7s
Aquifer Model
Unconfined
Solution
Bouwer-Rice
Parameters
K = 0.07313 m/dayy0 = 0.2485 m
BPG7s Rising Head
0. 20. 40. 60. 80. 100.0.01
0.1
1.
Time (min)
Tra
nsfo
rmed D
ispla
cem
ent (m
)
Obs. Wells
BPG7s
Aquifer Model
Unconfined
Solution
Bouwer-Rice
Parameters
K = 0.07694 m/dayy0 = 0.2641 m

BP33 Groundwater Investigation Report - 48 -
BPG7s Falling Head
0. 20. 40. 60. 80. 100.0.001
0.01
0.1
1.
Time (min)
Tra
nsfo
rmed D
ispla
cem
ent (m
/m)
Obs. Wells
BPG7s
Aquifer Model
Unconfined
Solution
Dagan
Parameters
K = 0.06849 m/dayy0 = 0.2231 m
BPG7s Rising Head
0. 20. 40. 60. 80. 100.0.001
0.01
0.1
1.
Time (min)
Tra
nsfo
rmed D
ispla
cem
ent (m
/m)
Obs. Wells
BPG7s
Aquifer Model
Unconfined
Solution
Dagan
Parameters
K = 0.07531 m/dayy0 = 0.2448 m