subject: phase 1 pre-design investigation groundwater
TRANSCRIPT

AMEC Environment & Infrastructure, Inc. 2101 Webster Street, 12th Floor Oakland, California 94612-3066 USA Tel (510) 663-4100 Fax (510) 663-4141 amec.com
August 15, 2013
Project 4088115718
Mr. Jamey Watt U.S. Environmental Protection Agency, Region IX 75 Hawthorne Street San Francisco, California 94105 Subject: Phase 1 Pre-Design Investigation – Groundwater Sampling, Vertical Flow
Measurements, and Slug Test Findings North Hollywood Operable Unit, Second Interim Remedy Groundwater Remediation Design
Dear Mr. Watt: AMEC Environment & Infrastructure, Inc. (AMEC), is pleased to submit this Phase 1 Pre-Design Investigation findings letter, on behalf of Honeywell International Inc., and Lockheed Martin Corporation to the U.S. EPA. This letter summarizes findings associated with our first of two semiannual sampling events.
If you have any questions regarding the contents in this letter, please contact Michael Taraszki at (510) 663-3996.
Sincerely yours, AMEC Environment & Infrastructure, Inc.
Michael Taraszki, PG, CHG, PMP Principal Hydrogeologist
MT/cpr \\oad-fs1\doc_safe\16000s\162830\3000\phase i_pre-design investigation summary\01_text_cvr_letter\cvr_ltr.docx
Distribution:
Ms. Carolyn Monteith (Lockheed Martin) Mr. Benny Dehghi (Honeywell) Mr. Vahe Dabbaghian (LADWP) Ms. Poonam Acharya (DTSC) Mr. Chi Diep and Susan Brownstein (CDPH) Mr. Larry Moore (RWQCB-LA) Mr. Richard Slade (ULARA Watermaster) Mr. John Lindquist (CH2M Hill)
SEMS-RM DOCID # 1164449

AMEC Environment & Infrastructure, Inc. 2101 Webster Street, 12th Floor Oakland, California 94612-3066 USA Tel (510) 663-4100 Fax (510) 663-4141 amec.com
August 9, 2013
Project 4088115718
Mr. Benny Dehghi Remediation Manager, Honeywell International, Inc. 2525 W. 190th Street Torrance, California 90504 Ms. Carolyn Monteith Remediation Project Lead 2950 North Hollywood Way, Suite 125 Burbank, California 91505 Subject: Phase I Pre-Design Investigation – Groundwater Sampling, Vertical Flow
Measurements, and Slug Test Findings North Hollywood Operable Unit, Second Interim Remedy Groundwater Remediation Design
Dear Mr. Dehghi and Ms. Monteith: This letter summarizes our findings from the first sampling event of the Phase 1 Pre-Design Investigation. All activities were performed in accordance with our Work Plan and Sampling and Analysis Plan (SAP), both dated September 10, 2012. The intent of this summary memo is to present the results of the first semiannual sampling event and the first two quarterly groundwater depth measurement events associated with the Phase 1 – Pre-Design Investigation. A detailed evaluation of these results will be presented under separate cover following completion of the second semiannual sampling event and last two quarterly groundwater depth measurement events associated with the Phase 1 Pre-Design Investigation.
SURVEYING ACTIVITIES
The horizontal locations and top-of-casing elevations of 29 wells were surveyed with respect to horizontal datum NAD83, Zone 5, and vertical datum NAVD88 by Dulin and Boynton Surveyors of Signal Hill, California on December 20, 2012, in accordance with the SAP. Surveyed top-of casing elevations are included in Table 1.
The survey was primarily performed because older North Hollywood Operable Unit (NHOU) wells were originally surveyed with respect to the NGVD29 vertical datum. In addition, the surveying was necessary because casing elevations may have been altered by incidental damage or natural settling as discussed in the Final Data Gap Analysis (DGA), dated March 14, 2012. Differences between measured top-of-casing elevations and those historically reported ranged from 0.70 to 5.76 feet.

Mr. Benny Dehghi and Ms. Carolyn Monteith Phase I Pre-Design Investigation – First Semiannual Groundwater Sampling Findings August 9, 2013 Page 2
DEPTH TO WATER MEASUREMENTS
Depth to water and total well depth measurements were collected from 59 monitoring wells on December 20, 2012 and from 56 wells on March 7, 2013, in accordance with the SAP. Depth to water measurements and groundwater elevations are presented in Table 1. Groundwater elevation contours based on the December 2012 measurements are illustrated on Figures 1a through 4b. Historically, there have been several interpretations regarding the hydrogeology of the NHOU area. Most recently, based on geophysical data analyses performed on selected wells within the NHOU study area, the subsurface has been divided into three hydrostratigraphic units including the following: the A-Zone, which is generally finer grained and has a relatively lower hydraulic conductivity, extending to depths ranging from the water table, which is currently approximately 270 feet below ground surface (bgs), to 400 feet bgs; the underlying B-Zone, which is generally coarser grained and has a relatively higher conductivity extending approximately 60 to 80 feet below the bottom of the A-Zone; and the Deeper Units underlying the B-Zone, which are generally associated with higher salinity. The eight NHOU extraction wells penetrate the A-Zone. As a result, contours on figures illustrating A-Zone groundwater elevations were interpreted with respect to the influence of pumping from these extraction wells.
Results of the December 2012 depth to water measurements indicate the following:
Based on analysis of measurements collected at wells screened in the A-Zone, the lateral hydraulic gradient in the northeast portion of the study area was to the south-southwest with an approximate magnitude of 0.001 feet/foot (ft/ft). To the south and southeast of this area, the groundwater gradient rotates counter-clockwise, shifting to the south by approximately Saticoy Street (0.50 miles north of the Former Bendix facility), then to the southeast, and ultimately to the east with increasing magnitudes in the southeast portion of the NHOU. In the southeast corner of the NHOU, the magnitude of the lateral hydraulic gradient was approximately 0.007 ft/ft where the influence of the Burbank Operable Unit (BOU) extraction wells is evident in the interpolated groundwater contours, which are presented on A-Zone Figures 1a through 4a.
Depth to water measurements were collected in A-Zone wells NH-VPB-09 and NH-VPB-10 within the northeast portion of the study area; however, calculated groundwater elevations for these wells were not used for contouring because they are approximately 20 to 30 feet higher than those in the nearest adjacent wells also screened in the A-Zone. The differences in water level elevation may be a result of inhibited groundwater flow across the Verdugo Fault, which parallels the base of the Verdugo Mountains to the northeast, or associated fault splays.
Groundwater contours for the B-Zone are presented in Figures 1b through 4b. Based on analysis of groundwater elevation measurements collected at wells screened in the B-Zone, groundwater flow directions and magnitudes of lateral hydraulic gradients in this zone were generally consistent with those in the A-Zone in the western portion of the NHOU. Based partly on groundwater elevations reported in the Semiannual Groundwater Monitoring Report, Fourth Quarter 2012, Burbank
Mr. Benny Dehghi and Ms. Carolyn Monteith Phase I Pre-Design Investigation – First Semiannual Groundwater Sampling Findings August 9, 2013 Page 3
Operable Unit (Arcadis, 2013), groundwater in the eastern B-Zone appears to be less influenced by the BOU extraction wells than in the A-Zone resulting in more shallow gradients and more east-southeasterly flow directions in the B-Zone as compared with an easterly flow direction in the A-Zone in the eastern portion of the NHOU.
Based on groundwater elevation measurements at collocated wells (Table 1), slight upward or downward vertical gradients up to approximately 0.005 feet/foot (ft/ft) were calculated between the A- and B-zones and within the A-Zone at most locations. Although these small values approach the limit of accuracy associated with manual depth to water measurements, these potential vertical flow directions are consistent with electronic borehole flow measurements conducted at select monitoring wells as discussed below.
Results of the March 2013 measurements indicate the following:
Generally, groundwater elevation measurements in March 2013 were within 1 to 2 feet of measurements in December 2012 with approximately half of the measurements indicating higher elevations and half indicating lower (Table 1). Lateral hydraulic gradient directions and magnitudes were also generally consistent with those calculated for December 2012.
Based on measurements collected in March 2013 at collocated wells screened at different depths, slight downward vertical gradients up to approximately 0.005 ft/ft were calculated between the A and B-Zones and within the A-Zone at most locations.
GROUNDWATER SAMPLING
Between December 4, 2012 and January 7, 2013, low-flow sampling methods were used to collect 41 depth-discrete groundwater samples from 25 monitoring wells screened in either the A-Zone, B-Zone, or across both zones in accordance with the SAP. Each sample was analyzed for the chemicals of concern (COCs) including VOCs and emerging contaminants, and also general chemistry constituents. The analytical suites and associated methods for each sample were based on Table 2-1 of the SAP. The analyses included the following:
Volatile organic compounds by EPA Methods 8260 and 524.2;
1,2,3-trichloropropane by EPA Method SRL 524M-TCP;
1,4-dioxane by EPA Methods 8270C and 522;
N-nitrosodimethylamine (NDMA) by EPA Methods 1625CM and 521;
N-nitrosodibutylamine (NDBA) by EPA Method 521;
N-nitrosodi-n-propylamine (NDPA) by EPA Method 521;
N-nitrosodiethylamine (NDEA) by EPA Method 521;

Mr. Benny Dehghi and Ms. Carolyn Monteith Phase I Pre-Design Investigation – First Semiannual Groundwater Sampling Findings August 9, 2013 Page 4
N-nitrosomethylethyl amine (NMEA) by EPA Method 521;
N-nitrosopyrollidine (NPYR) by EPA Method 521;
Perchlorate by EPA Method 314.0;
Total chromium by EPA Method 200.8;
Hexavalent chromium by EPA Method 218.6;
Cations (Ca, Mg, Na, K, Fe) by EPA Method 200.7
Anions (nitrate, nitrite, Cl, SO4, total nitrate/nitrate) by EPA Method300.0;
Total hardness by EPA Method 200.7;
Alkalinity by EPA Method SM2320B; and
Total dissolved solids by EPA Method SM2540C.
Additional depth-discrete samples were collected from four wells for VOC analyses using passive diffusion bags (PDBs) to provide vertical chemistry profiles within the wells in accordance with the SAP. In these four wells, samples were collected at 10-foot increments throughout the screened intervals beginning at 3 feet below the top of each screen. A total of 24 vertical profile samples were collected in the four wells.
Isoconcentration contours for the four primary COCs - trichloroethene (TCE), tetrachloroethene (PCE), 1,4-dioxane, and hexavalent chromium in the A-Zone are illustrated on Figures 1a through 4a, and in the B-Zone on Figures 1b through 4b, respectively. The contours are based on the analytical results from the December 2012 first semi-annual Phase 1 Pre-Design groundwater sampling event, fourth quarter 2012 data reported for the former Bendix and Lockheed Martin facilities, and the most recent data available from other wells in the investigation area. Laboratory analytical results from the December 2012 semi-annual sampling event are summarized in Tables 2a and 3a for the A-Zone and Tables 2b and 3b for the B-Zone, respectively.
Cluster wells screened across the A-Zone and B-Zone were preferentially selected for sampling during the first semi-annual Phase 1 Pre-Design investigation groundwater sampling event so that depth-discrete results from those zones could be compared with historical results designated as associated with Depth Region 2, which roughly corresponds to the B-Zone extending slightly into the overlying A-Zone and down into the underlying deeper units. A comparison of current and historical analytical results for the four primary COCs by depth region and zone is presented in Table 4. Sampling the A-Zone wells at these locations during the second semi-annual sampling event will be performed to further delineate the COC distribution in these areas (see “Additional Sampling” table below).
Analytical laboratory reports were reviewed for accuracy and completeness and data validation was performed with a qualified third party pursuant to the National Functional Guidelines (USEPA, 2008, 2010). Data validation results are described in a narrative included in

Mr. Benny Dehghi and Ms. Carolyn Monteith Phase I Pre-Design Investigation – First Semiannual Groundwater Sampling Findings August 9, 2013 Page 5
Attachment C. The distribution of the primary COCs is discussed below, with a focus on concentrations greater than ten times (10x) the maximum contaminant level (MCL), or other relevant regulatory level.
A-Zone TCE
The lateral extent of TCE distribution in the A-Zone (Figure 1a) was similar to the kriged distribution based on maximum concentrations between 2007 and 2011as illustrated in the DGA, but concentrations were generally lower in December 2012.
Concentration areas that exceed 50 μg/L (10x the 5 μg/L MCL) are largely represented by wells that have not been sampled recently, such as 4918B at the Penrose Landfill, NH-C09-310 downgradient of Hewitt Pit, and NH-C17-255 and 3831Q in the southeast corner of the NHOU. Given the overall decreasing trend in concentrations, these wells should be sampled during the second semi-annual event. NH-C12-280, for which the most recent available TCE data is from October 2011, is located between Victory/Vineland Landfill and the former Lockheed Martin facilities down/cross-gradient of concentrations that exceed 10x the MCL at well LC1-CW06 and should be sampled during the next semi-annual event.
Wells PST-MW1P and PST-MW2P at the Pacific Steel facility could not be located and their status is unknown according the Regional Water Board. The wells are located on the eastern margin of an area of TCE concentrations in excess of 10x the MCL in the vicinity of NHE-3 and could provide useful TCE concentration data to delineate the A-Zone TCE plume. The wells should be located and sampled during the next semi-annual event, if possible. If not, installation of replacement wells is recommended. NH-C10-280, which is located downgradient of this area, should also be sampled during the next event because the most recent available data from this well are from October 2010.
A-Zone PCE
The lateral extent of PCE distribution in the A-Zone was also similar to that presented in the DGA (Figure 2a). Generally, PCE is less broadly distributed than TCE.
With the exception of NH-C01-325 downgradient of the Strathern Inert Landfill, PCE concentrations exceeding 50 μg/L (10x the 5 μg/L MCL) were limited to wells downgradient of the Lockheed Martin facility in the BOU.
Near the Lockheed Martin facility, the area with PCE concentrations greater than 10x the MCL is largely represented by older data from LB6-CW03R, LB6-CW09, LB6-CW10, and LB6-CW17, which are not currently sampled as part of the BOU monitoring program. Thus, the PCE distribution presented the eastern portion of the NHOU (Figure 2a) is not consistent with the interpretation of PCE in the adjacent western portion of the BOU presented in the Semiannual Groundwater Monitoring Report, Fourth Quarter 2012, Burbank Operable Unit (Arcadis, 2013), which limited

Mr. Benny Dehghi and Ms. Carolyn Monteith Phase I Pre-Design Investigation – First Semiannual Groundwater Sampling Findings August 9, 2013 Page 6
data on the figures to recent sampling events. Due to the presentation of older data (elevated concentrations), the PCE distribution presented in Figure 2a is significantly greater than that indicated in the corresponding PCE distribution presented in the BOU (Arcadis, 2013).
NH-C10-280 and PST-MW1P, PST-MW2P (if located) should be sampled during the next semiannual event, as discussed above, with regard to TCE. The wells could also provide valuable PCE data in the area between the former Bendix facility and the downgradient NHE wells.
A-Zone 1,4-Dioxane
The lateral extent of 1,4-dioxane distribution in the A-Zone (Figure 3a) was similar to that presented in the DGA with the exception of the eastern border of the NHOU where the most recent data indicate concentrations greater than the 1 μg/L notification level (NL). The distribution of 1,4-dioxane above the NL in this area is consistent with the limited 1,4-dioxane data presented in the adjacent portion of the BOU (Arcadis,2013).
Fourth Quarter 2012 data reported near the former Bendix facility indicate concentrations exceeding 10 μg/L (10x the 1 μg/L NL) were restricted to a small area onsite and immediately downgradient of the facility.
Outside the vicinity of the former Bendix facility, the only groundwater sample with a 1,4-dioxane concentration that exceeded 10x the 1 μg/L notification level was collected from well 4918A adjacent to the southern boundary of the Penrose Landfill.
A-Zone Hexavalent Chromium
The lateral extent of hexavalent chromium distribution in the A-Zone (Figure 4a) was generally consistent with that presented in the DGA.
Hexavalent chromium concentrations that exceeded the Los Angeles Department of Water and Power (LADWP) voluntary 5 μg/L cleanup level were primarily associated with wells in the area south of the former Bendix facility.
The NH-C18 and NH-C21 cluster wells are located cross-gradient (south) relative to the former Bendix facility and are hydraulically isolated from the facility by extraction wells NHE-2 and NHE-3. In addition to the isolated location of the wells relative to the former Bendix facility, the deeper occurrence of elevated concentrations of hexavalent chromium in these wells makes its origin(s) in this area unclear.
Recent concentrations in NHE-4 and the NH-C10 well cluster did not exceed the voluntary cleanup level. Data from wells PST-MW1P and PST-MW2P, if located or replaced, could help to define the plume in this area.
The hexavalent chromium concentration in NH-C11-295 at the Hewitt Pit slightly exceeded the voluntary cleanup level; however, the most recent available analytical result is from December 2010. The well should be sampled during the next semi-

Mr. Benny Dehghi and Ms. Carolyn Monteith Phase I Pre-Design Investigation – First Semiannual Groundwater Sampling Findings August 9, 2013 Page 7
annual event. The concentration in 3850AB, near the eastern area of the NHOU, also slightly exceeded the cleanup level.
B-Zone TCE
The lateral extent of TCE distribution in the B-Zone was larger than that presented in the DGA, and comprises an elongated plume extending south and southeast from NH-C05-460 (Figure 1b).
Concentrations of TCE in the B-Zone that exceeded 50 μg/L (10x the 5 μg/L MCL) largely occur upgradient and cross-gradient of the former Bendix facility, which indicates a source in the northern portion of the study area, and possibly also in the vicinity of the former Hewitt Pit (based on data from downgradient well NH-C20-380). A concentration greater than 50 μg/L was also detected in GW-11-352, south and cross-gradient of the former Bendix facility.
The highest TCE concentration in the B-Zone was measured in the groundwater sample collected from well NH-C05-460, for which the most recent available analysis is from January 2010. If analytical results from recent samples collected by LADWP are not available prior to the next semiannual event, this well should be included in that sampling effort.
B-Zone PCE
The lateral extent of PCE distribution was similar to that presented in the DGA, and elevated concentrations were limited to the area downgradient of the Lockheed Martin facility (Figure 2b).
PCE concentrations in the B-Zone that exceeded 50 μg/L (10x the 5 μg/L MCL) were limited to wells LB6-CW08 and LB6-CW14 at the BOU, for which the most recent available data are from January 1997 and December 2006, respectively.
B-Zone 1,4-Dioxane
The lateral extent of 1,4-dioxane distribution in the B-Zone was more widespread than that presented in the DGA because samples were collected from a larger number of wells than was previously available (Figure 3b).
The maximum concentration of 1,4-dioxane detected in the B-Zone was 9.7 μg/L in well 4918A, which is located immediate downgradient of the closed Penrose landfill in the northern portion of the NHOU.
1,4-Dioxane concentrations in the B-Zone did not exceed 10 μg/L (10x the 1 μg/L notification level) in any of the samples collected.

Mr. Benny Dehghi and Ms. Carolyn Monteith Phase I Pre-Design Investigation – First Semiannual Groundwater Sampling Findings August 9, 2013 Page 8
B-Zone Hexavalent Chromium
The lateral extent of hexavalent chromium distribution was smaller than that presented in the DGA; however, concentrations were higher in the area south of the former Bendix facility and in the western NHE wells (Figure 4b).
Hexavalent chromium concentrations in NH-C18-365 and NH-C21-340 exceeded the LADWP voluntary 5 μg/L cleanup level. The occurrence of hexavalent chromium in the B-Zone at these locations further suggests concentrations in this area may be distinct from those observed in the A-Zone north of the NHE extraction wells, as discussed above. A depth discrete B-Zone sample should be collected from NH-C15-330, which is the nearest downgradient well, during the next semiannual sampling event.
TCE Vertical Profiles
Concentrations of TCE measured in A-Zone vertical profile samples were generally consistent throughout the screened intervals of NH-C23-310 and NH-C19-290, respectively, west of the former Bendix facility (Figure 1a). TCE concentrations in NH-C19-360, which is screened across the A and B-Zones, decreased with depth. The decreasing concentrations in this well are consistent with the occurrence of higher concentrations in the A-Zone at this location, the well being screened across the A and B-Zones, and vertical flow logging that indicated downward flow within the screen at the time sampling occurred (as discussed below).
Concentrations of TCE detected in B-Zone vertical profile samples within NH-C19-360 were within 10% of one another. TCE concentrations within NH-C23-400 were generally consistent in the middle depths, but lower at the top and bottom of the screened interval. The lower concentration at the top of the NH-C23-400 screen is consistent with the occurrence of lower concentrations in the A-Zone at this location. Downward vertical flow was measured within the screen of NH-C23-400 (discussed below). Based on the electronic borehole flow measurements, the lower concentrations at the bottom of the screened interval correlate with depths below the zone of downward vertical flow and, therefore, may be more representative of groundwater at that depth than samples collected within the zone of downward flow, which were subjected to more in-well mixing.
PCE Vertical Profiles
Concentrations of PCE in vertical profile samples were generally consistent throughout the screened intervals. Concentrations are low in the western portion of the study area where vertical profile samples were collected and concentrations in each screen typically varied by less than 1 μg/L, and never by more than 2 μg/L.

Mr. Benny Dehghi and Ms. Carolyn Monteith Phase I Pre-Design Investigation – First Semiannual Groundwater Sampling Findings August 9, 2013 Page 9
Inorganic Groundwater Quality Parameter Evaluation
Several inorganic groundwater quality parameters were selected for analysis during the first semi-annual Phase 1 Pre-Design investigation groundwater sampling event (primarily December 2012) including, major cations (calcium, sodium, manganese, and potassium) and anions (nitrate, sulfate, chloride and carbonate). Carbonate was reflected in a total alkalinity analysis as calcium carbonate. The results of these analyses were plotted on Piper diagrams utilizing AQ∙QA software (Rockware). Piper, or tri-linear, diagrams plot general water quality data in a form that visually differentiates samples based on relative percent differences for specific anions and/or cations.
The figures presented in Attachment A (Figure A-1, A-Zone and B-Zone wells; Figure A-2, A-Zone wells; and Figure A-3, B-Zone wells) suggest generally similar water quality parameters in all wells and in B-Zone wells, in particular. Analytical data from A-Zone wells suggest a slightly greater variability in water quality parameters as might be expected due to the influence of surface infiltration and vulnerability to various surface sources. As indicated In Figures A-1 and A-2, the general chemistry signatures for groundwater samples collected from two A-Zone wells, 4909C at 293 feet bgs and NH-C18-270 at 270 feet bgs, samples were significantly different than the other samples.
The AQ∙QA software also identified a general cation/anion imbalance for about two-thirds of the samples, typically indicating a surplus of cations (or deficit of anions), suggesting there are additional anionic species that were not assessed by the Piper analysis. (The software regards an acceptable balance to be no more than 2 percent difference between cations and anions.) The nature of the missing components of the ion balance is not apparent in the data set.
ELECTRONIC BOREHOLE FLOW MEASUREMENTS
Vertical flow was measured within nine monitoring wells between December 10, 2012 and January 28, 2013 using a Quantum Engineering, Inc. electronic borehole flow (EBF) meter. These wells were selected because they were constructed with well screens that penetrate both the A- and B-Zones. Flow was measured under ambient conditions (i.e., without pumping stress at the test well) within the screened interval of each well in accordance with the SAP. Table 5 summarizes the results of EBF profiling and graphs of flow rate data from each measured well are illustrated on Figures 5 through 13 (positive and negative values reflect upward and downward vertical flow, respectively).
Downward vertical flow was observed in seven of the nine wells measured. The highest downward flow rate was measured at 0.21 gallons per minute (gpm) in NH-C10-360. In NH-C10-360 and NH-C19-290, which are screened across the A and B-Zones, the inflection point above which water was entering the well screen and below which water was leaving the well screen was generally consistent with previous estimates of the A-Zone/B-Zone contact depth at those well locations. Upward flow was measured within A-Zone well NH-C23-310, which is consistent with groundwater elevation measurements collected at that well cluster

Mr. Benny Dehghi and Ms. Carolyn Monteith Phase I Pre-Design Investigation – First Semiannual Groundwater Sampling Findings August 9, 2013 Page 10
indicating an upward vertical gradient in the A-Zone, although the cause of the upward vertical gradient in this area is unknown. Upward flow was also observed near the bottom of NH-C19-290 over an interval that correlates with a silt unit, although it is not clear if this flow reversal is the result of local geologic conditions. Flow data from B-Zone well NH-C05-460 comprise an incomplete flow profile because the cable of the meter was not long enough to reach the entire screened interval.
PNEUMATIC SLUG TESTS
Pneumatic slug tests were performed at 14 monitoring wells between January 3 and February 6, 2013. Tests were performed in accordance with the methods described in the SAP. The static water column at the test wells was displaced by the introduction of compressed nitrogen at multiple pressures to induce water column displacements of up to 2.5 feet. Table 6 summarizes the results of the pneumatic slug tests. Time-drawdown curves were analyzed to estimate hydraulic conductivity (K) in each well using the AQTESOLV ® software package. Calculated K values at each well relative to midpoint screen depth are graphically depicted on Figure 14 and individual curve matches are included in Attachment B.
No significant correlation between pressure and hydraulic conductivity was observed in the data. Generally, K results for wells screened within the A-Zone ranged between 20 and 50 feet/day and for wells screened in either the B-Zone or between the A and the B-Zone between 60 and 120 feet/day. Qualitatively, time-drawdown curves for wells screened within the A-Zone tended to show critically damped, or non-oscillatory, conditions. For time-drawdown curve analysis, unconfined conditions were assumed for each test. The Springer-Gelhar analysis for curve fitting was employed for all time-drawdown curves. For non-oscillatory tests, the Bouwer-Rice analysis was also performed, which yielded similar results to the Springer-Gelhar curve fits. For all analyses, it was assumed that there was no vertical anisotropy in the vicinity of the test well. Although this assumption may not necessarily be valid in all cases, and adjusting vertical anisotropy to match the groundwater flow model may yield greater K value estimates, the A-Zone and B-Zone pneumatic slug test data are consistent with the site conceptual model of a hydraulically distinct A-Zone overlying a relatively more permeable B-Zone.
SUMMARY OF DEVIATIONS FROM THE WORK PLAN
Investigation activities included in the work plan that could not be completed are summarized below.
Quarterly groundwater level measurements could not be collected at the following wells:
NH-VPB-04 in December 2012 and March 2013 because a car was parked above it. NH-VPB-04 was intended as a substitute for NH-C04-240 which was specified in the work plan.
The NH-C02 cluster in March 2013 because the road had been repaved and the wells were covered with asphalt.

Mr. Benny Dehghi and Ms. Carolyn Monteith Phase I Pre-Design Investigation – First Semiannual Groundwater Sampling Findings August 9, 2013 Page 11
Groundwater samples could not be collected from the following wells:
PST-MW-1P and PST-MW-2P at the Pacific Steel Treating facility because they could not be located; the wells may have been paved over or destroyed, although records indicating their destruction cannot be found.
4909F because access was denied by Vulcan Materials, which requested sampling be deferred until a replacement well is installed.
4928A because access was denied by Los Angeles County, and
NH-10 because it has been destroyed.
Vertical groundwater flow could not be measured in the following wells:
NH-C05-320 because the dedicated pump could not be removed from the well.
NH-C05-460 could not be completely logged because the meter cable was not long enough to span the entire interval.
Pneumatic slug tests could not be performed on the following wells:
NH-C07-300 because the water table was below the top of the well screen preventing pressurization of the well, and
NH-C24-410 and NH-VPB-04 because the exposed well casings were not long enough to attach the test manifold.
ADDITIONAL SAMPLING
Based on findings from the first semiannual groundwater sampling event and testing activities, the following wells will be additionally included in the second Phase 1 Pre-Design semi-annual sampling event:

Mr. Benny Dehghi and Ms. Carolyn Monteith Phase I Pre-Design Investigation – First Semiannual Groundwater Sampling Findings August 9, 2013 Page 12
Well Rationale
4928A Pending access from LA County; access denied during first event
4909F Pending replacement of well by Vulcan Materials; access denied during first event
PST-MW1P, PST MW2P
Pending location of wells or replacement; provide data near Pacific Steel facility
NH-C05-320 Collect sample to verify April 2012 results; pending removal of stuck submersible pump, also perform EBF vertical flow log
NH-C05-460 Last sampled January 2010; highest TCE detection in B-Zone
NH-C07-300 A-Zone Well last sampled October 2011; provide data between former Bendix facility and NHE wells
NH-C09-310 A-Zone well last sampled October 2011; provide data near Hewitt Pit
NH-C10-280 A-Zone well last sampled October 2011; provide data near Pacific Steel/Fleetwood Machine Products
NH-C11-295 A-Zone well last sampled December 2010; provide data near Hewitt Pit
NH-C17-235 A-Zone well last sampled October 2011; provide data downgradient of Victory-Vineland Landfill
3831Q A-Zone well last sampled December 2010; recent maximum TCE concentrations greater than 10x MCL but decreasing
4918B A-Zone well last sampled March 2007; provide data near Penrose Landfill
Otherwise, the scope of work associated with the second semiannual sampling event will proceed as described in the Phase 1 Pre-Design Work Plan (AMEC, 2012).
Please contact me at (510) 663-3996 should you have any questions regarding this matter.
Sincerely yours, AMEC Environment & Infrastructure, Inc.
Mike Taraszki, PG, CHG, PMP Project Manager
MT/DH/cpr x:\16000s\162830\3000\phase i_pre-design investigation summary\01_text_cvr_letter\amec_13_162830_finalphase i design investigation_20130809.docx

Mr. Benny Dehghi and Ms. Carolyn Monteith Phase I Pre-Design Investigation – First Semiannual Groundwater Sampling Findings August 9, 2013 Page 13
cc: Robert Hartwell, PE Ms. Carolyn Monteith (Lockheed Martin) Mr. Benny Dehghi (Honeywell) Mr. Vahe Dabbaghian (LADWP) Ms. Poonam Acharya (DTSC) Mr. Chi Diep and Susan Brownstein (CDPH) Mr. Larry Moore (RWQCB-LA) Mr. Richard Slade (ULARA Watermaster) Mr. John Lindquist (CH2M Hill)
Mr. Benny Dehghi and Ms. Carolyn Monteith Phase I Pre-Design Investigation – First Semiannual Groundwater Sampling Findings August 9, 2013 Page 14
Attachments: Table 1 Groundwater Elevations Table 2a Organic Analytical Results – A-Zone Table 2b Organic Analytical Results – B-Zone Table 3a Inorganic Analytical Results – A-Zone Table 3b Inorganic Analytical Results – B-Zone Table 4 Comparison of Recent Analytical Results by Depth
Region/Zone Table 5 Vertical Flow Measurement Results Table 6 Pneumatic Slug Test Results Figure 1a Trichloroethene Distribution in Groundwater – First Semiannual
Sampling Event – A-Zone Figure 1b Trichloroethene Distribution in Groundwater – First Semiannual
Sampling Event – B-Zone Figure 2a Tetrachloroethene Distribution in Groundwater – First
Semiannual Sampling Event – A-Zone Figure 2b Tetrachloroethene Distribution in Groundwater – First
Semiannual Sampling Event – B-Zone Figure 3a 1,4-Dioxane Distribution in Groundwater – First Semiannual
Sampling Event – A-Zone Figure 3b 1,4-Dioxane Distribution in Groundwater – First Semiannual
Sampling Event – B-Zone Figure 4a Chromium VI Distribution in Groundwater – First Semiannual
Sampling Event – A-Zone Figure 4b Chromium VI Distribution in Groundwater – First Semiannual
Sampling Event – B-Zone Figure 5 NH-C05-460 Vertical Flow Profile Figure 6 NH-C10-280 Vertical Flow Profile Figure 7 NH-C10-360 Vertical Flow Profile Figure 8 NH-C16-320 Vertical Flow Profile Figure 9 NH-C16-390 Vertical Flow Profile Figure 10 NH-C19-290 Vertical Flow Profile Figure 11 NH-C19-360 Vertical Flow Profile Figure 12 NH-C23-310 Vertical Flow Profile Figure 13 NH-C23-400 Vertical Flow Profile Figure 14 Pneumatic Slug Test Results Attachment A Inorganic Groundwater Parameters Attachment B Attachment C
Pneumatic Slug Test Curves Data Validation Narrative

TABLES

Station Name Date
Casing
Elevations
(feet,
NAVD88)
Depth to Water
(feet) /a/
Water Level
Elevation
(feet
NAVD88) Comments
17-Dec-12 757.02 249.02 5087-Mar-13 757.02 250.22 506.8
17-Dec-12 807.48 295.75 511.737-Mar-13 807.48 296.14 511.34
17-Dec-12 769.96 261.44 508.527-Mar-13 769.96 261.98 507.98
18-Dec-12 739.96 236.67 503.297-Mar-13 739.96 236.45 503.51
18-Dec-12 740.15 237.98 502.177-Mar-13 740.15 237.49 502.66
18-Dec-12 740.46 238.43 502.037-Mar-13 740.46 237.95 502.51
18-Dec-12 783.66 274.6 509.067-Mar-13 783.66 274.73 508.93
18-Dec-12 783.63 274.19 509.447-Mar-13 783.63 274.64 508.99
18-Dec-12 783.73 274.1 509.637-Mar-13 783.73 275.39 508.34
18-Dec-12 783.74 274.11 509.637-Mar-13 783.74 275.71 508.03
17-Dec-12 660.32 170.11 490.217-Mar-13 660.32 NM Paved over
17-Dec-12 659.42 169.07 490.357-Mar-13 659.42 NM Paved over
17-Dec-12 659.89 165.82 494.077-Mar-13 659.89 NM Paved over
17-Dec-12 659.87 160.71 499.167-Mar-13 659.87 NM Paved over
17-Dec-12 711.34 206.7 504.647-Mar-13 711.34 207.06 504.28
17-Dec-12 710.8 207.86 502.947-Mar-13 710.8 208.03 502.77
17-Dec-12 711.52 205.94 505.587-Mar-13 711.52 207 504.52
17-Dec-12 710.75 204.65 506.17-Mar-13 710.75 206.55 504.2
17-Dec-12 775.03 266.67 508.367-Mar-13 775.03 265.8 509.23
17-Dec-12 774.85 266.65 508.27-Mar-13 774.85 266.38 508.47
TABLE 1
GROUND WATER ELEVATIONS
Phase I Pre-Design Investigation, NHOU Second Interim RemedyLos Angeles County, California
NH-C03-380
NH-C05-460
NH-C05-320
NH-C03-800
NH-C03-680
NH-C03-580
NH-C02-520
NH-C02-325
NH-C02-681
NH-C02-220
NH-C01-780
NH-C01-660
NH-C01-450
NH-C01-325
4909C
4918A
4919D
LC1-CW01
LC1-CW03
LC1-CW02
X:\16000s\162830\3000\Phase I_Pre-Design Investigation Summary\02_tables\Table1_GWElevations.xlsx Page 1 of 3

Station Name Date
Casing
Elevations
(feet,
NAVD88)
Depth to Water
(feet) /a/
Water Level
Elevation
(feet
NAVD88) Comments
TABLE 1
GROUND WATER ELEVATIONS
Phase I Pre-Design Investigation, NHOU Second Interim RemedyLos Angeles County, California
17-Dec-12 737.88 232.96 504.927-Mar-13 737.88 232.62 505.26
17-Dec-12 736.83 230.55 506.287-Mar-13 736.83 231.43 505.4
17-Dec-12 710.04 206.94 503.17-Mar-13 710.04 206.71 503.33
17-Dec-12 710.15 206.87 503.287-Mar-13 710.15 206.86 503.29
18-Dec-12 730.87 221.62 509.257-Mar-13 730.87 223.42 507.45
17-Dec-12 705.35 208.75 496.67-Mar-13 705.35 207.01 498.34
17-Dec-12 705.31 208.23 497.087-Mar-13 705.31 206.72 498.59
17-Dec-12 760.47 251.78 508.697-Mar-13 760.47 252.73 507.74
17-Dec-12 694.2 195.19 499.017-Mar-13 694.2 194.13 500.07
17-Dec-12 679.04 181.28 497.767-Mar-13 679.04 179.66 499.38
17-Dec-12 679.11 180.91 498.27-Mar-13 679.11 179.56 499.55
17-Dec-12 777.29 268.2 509.097-Mar-13 777.29 268.2 509.09
17-Dec-12 777.33 268.28 509.057-Mar-13 777.33 268.39 508.94
17-Dec-12 675.61 183.18 492.437-Mar-13 675.61 181.98 493.63
17-Dec-12 675.77 182.49 493.287-Mar-13 675.77 181.54 494.23
17-Dec-12 717.87 212.97 504.97-Mar-13 717.87 211.71 506.16
17-Dec-12 717.96 213.18 504.787-Mar-13 717.96 212.68 505.28
17-Dec-12 732.23 226.03 506.27-Mar-13 732.23 225.79 506.44
17-Dec-12 732.08 225.55 506.537-Mar-13 732.08 226.22 505.86
18-Dec-12 749.34 241.44 507.97-Mar-13 749.34 242.33 507.01
NH-C15-240
NH-C14-250
NH-C13-385
NH-C12-360
NH-C12-280
NH-C11-295
NH-C10-360
NH-C10-280
NH-C09-310
NH-C08-295
NH-C16-390
NH-C16-320
NH-C15-330
NH-C18-270
NH-C17-339
NH-C17-255
NH-C19-360
NH-C19-290
NH-C18-365
NH-C20-380
X:\16000s\162830\3000\Phase I_Pre-Design Investigation Summary\02_tables\Table1_GWElevations.xlsx Page 2 of 3

Station Name Date
Casing
Elevations
(feet,
NAVD88)
Depth to Water
(feet) /a/
Water Level
Elevation
(feet
NAVD88) Comments
TABLE 1
GROUND WATER ELEVATIONS
Phase I Pre-Design Investigation, NHOU Second Interim RemedyLos Angeles County, California
18-Dec-12 704.85 201.09 503.767-Mar-13 704.85 200.66 504.19
18-Dec-12 705.06 201.04 504.027-Mar-13 705.06 201.3 503.76
18-Dec-12 802.34 292.09 510.257-Mar-13 802.34 291.56 510.78
17-Dec-12 802.62 292.34 510.287-Mar-13 802.62 291.99 510.63
17-Dec-12 802.5 292.16 510.347-Mar-13 802.5 292.21 510.29
17-Dec-12 745.5 238.76 506.747-Mar-13 745.5 238.66 506.84
17-Dec-12 745.49 238.52 506.977-Mar-13 745.49 238.84 506.65
17-Dec-12 731.44 228.05 503.397-Mar-13 731.44 227.56 503.88
17-Dec-12 731.48 228.03 503.457-Mar-13 731.48 227.64 503.84
18-Dec-12 725.7 228.1 497.67-Mar-13 725.7 227.35 498.35
18-Dec-12 712.28 206.98 505.37-Mar-13 712.28 207.09 505.19
17-Dec-12 677.84 177.09 500.757-Mar-13 677.84 176.01 501.83
17-Dec-12 634.12 NM Parked over7-Mar-13 634.12 NM Parked over, unable to access
17-Dec-12 657.94 169.74 488.27-Mar-13 657.94 168.44 489.5
18-Dec-12 749.41 241.72 507.697-Mar-13 749.41 242.46 506.95
17-Dec-12 757.99 251.34 506.657-Mar-13 757.99 251.03 506.96
18-Dec-12 670.49 174.79 495.77-Mar-13 670.49 173.48 497.01
17-Dec-12 796.85 257.89 538.967-Mar-13 796.85 259.48 537.37
18-Dec-12 765.92 235.93 529.997-Mar-13 765.92 236.2 529.72
18-Dec-12 792.42 282.68 509.747-Mar-13 792.42 283.62 508.8
Notes:/a/ Depth to water is measured from top of well casing
Cluster monitoring wells with the same station names (e.g., NH-C05-XXX) are collocated
NH-C24-305
NH-C23-400
NH-C23-310
NH-VPB-11
NH-VPB-10
NH-VPB-09
NH-VPB-08
NH-VPB-07
NH-VPB-06
NH-C22-600
NH-C22-460
NH-C22-360
NH-C21-340
NH-C21-260
NH-VPB-05
NH-VPB-04
NH-VPB-03
NH-VPB-02
NH-C25-290
NH-C24-410
X:\16000s\162830\3000\Phase I_Pre-Design Investigation Summary\02_tables\Table1_GWElevations.xlsx Page 3 of 3

TABLE 2A
ORGANIC ANALYTICAL RESULTS - A ZONE
Phase 1 Pre-design Investigation, NHOU Second Interim RemedyLos Angeles County, California
Test Method EPA 522
Analyte/
Units:
N-Nitrosodiethylamine
(ng/l)
N-Nitrosodimethylamine
(ng/l)
N-Nitrosomorpholine
(ng/l)
1,4-Dioxane
(µg/L)
1,1,1-
Trichloroethane
(µg/L)
1,1-
Dichloroethane
(µg/L)
1,1-
Dichloroethene
(µg/L)
1,2,4-
Trimethylbenzene
(µg/L)
1,2-
Dichloroethane
(µg/L)
1,2-
Dichloropropane
(µg/L)
1,3,5-
Trimethylbenzene
(µg/L)
Acetone
(µg/L)
Bromodichloro-
methane
(µg/L)
Sample Date Value Qual Value Qual Value Qual Value Qual Value Qual Value Qual Value Qual Value Qual Value Qual Value Qual Value Qual Value Qual Value Qual
4909C_293 01/07/13 1.4 J/J ND(2.0) U/J 0.75 J/J ND(0.27) U ND(0.50) U 3.7 1.8 0.038 J/J ND(0.50) U 0.15 J/J ND(0.50) U ND(10.0) R ND(0.50) U4918A_297.5 12/20/12 1.8 J/J ND(2.0) U 2.4 16.0 0.95 1.7 13.0 ND(0.50) U 0.21 J/J ND(0.50) U ND(0.50) U 1.7 J/J ND(0.50) U4919D_295 12/06/12 ND(2.0) U ND(2.0) U/J 2.8 0.67 ND(0.50) U 0.047 J/J ND(0.50) U ND(0.50) U ND(0.50) U ND(0.50) U ND(0.50) U ND(10.0) R ND(0.50) UNH-C10-360_313 12/14/12 ND(2.0) U ND(2.0) U 1.1 J/J 1.6 ND(0.50) U 1.1 ND(0.50) U ND(0.50) U 0.41 J/J 0.16 J/J ND(0.50) U ND(10.0) U/J ND(0.50) UNH-C12-360_313 12/26/12 ND(2.0) U ND(2.0) U 1.7 J/J 1.2 ND(0.50) U 0.78 0.084 J/J ND(0.50) U ND(0.50) U ND(0.50) U ND(0.50) U ND(10.0) R ND(0.50) UNH-C13-385_338 12/12/12 ND(2.0) ND(2.0) 0.60 J/J ND(0.14) U ND(0.50) U ND(0.50) U ND(0.50) U ND(0.50) U ND(0.50) U ND(0.50) U ND(0.50) U ND(10.0) R ND(0.50) UNH-C14-250_203 12/26/12 ND(2.0) U ND(2.0) U 1.9 J/J ND(0.44) U ND(0.50) U 0.18 J/J 0.39 J/J ND(0.50) U 2.6 0.23 J/J ND(0.50) U ND(10.0) R 1.1
NH-C16-390_343 12/04/12 ND(2.0) U ND(2.0) U 2.1 3.4 0.31 J/J 0.36 J/J 1.8 ND(0.50) U 0.15 J/J ND(0.50) U ND(0.50) U 1.7 J/J ND(0.50) UNH-C17-339_281 01/02/13 ND(2.0) U 0.41 J/J 0.90 J/J 1.2 ND(0.50) U 0.92 0.18 J/J ND(0.50) U ND(0.50) U ND(0.50) U ND(0.50) U ND(10.0) R ND(0.50) UNH-C18-270_223 12/11/12 ND(2.0) U ND(2.0) U 0.56 J/J ND(0.24) U ND(0.50) U ND(0.50) U ND(0.50) U ND(0.50) U ND(0.50) U ND(0.50) U ND(0.50) U ND(10.0) R ND(0.50) UNH-C18-365_308 12/07/12 ND(2.0) U ND(2.0) U 3.2 1.6 ND(0.50) U 0.50 J/J 0.41 J/J ND(0.50) U 0.18 J/J 0.13 J/J ND(0.50) U ND(10.0) R 0.28 J/J
NH-C19-290_233 12/21/12 ND(2.0) U ND(2.0) U 24.0 ND(0.76) U ND(0.50) U 0.14 J/J 0.35 J/J ND(0.50) U ND(0.50) U ND(0.50) U ND(0.50) U ND(10.0) R 0.19 J/J
NH-C19-290_233 01/11/13 NT NT NT NT ND(0.50) U 0.15 J/J 0.71 0.03 J/J 0.56 ND(0.50) U ND(0.50) U 1.5 J/J 0.22 J/J
NH-C19-290_233_DUP-5 01/11/13 NT NT NT NT 0.046 J/J 0.12 J/J 0.63 ND(0.50) U 0.50 J/J ND(0.50) U ND(0.50) U 1.8 J/J 0.21 J/J
NH-C19-290_243 01/11/13 NT NT NT NT 0.046 J/J 0.11 J/J 0.63 ND(0.50) U 0.67 ND(0.50) U ND(0.50) U 2.5 J/J 0.26 J/J
NH-C19-290_253 01/11/13 NT NT NT NT ND(0.50) U 0.13 J/J 0.72 ND(0.50) U 0.80 ND(0.50) U ND(0.50) U 1.5 J/J 0.21 J/J
NH-C19-290_263 01/11/13 NT NT NT NT 0.063 J/J 0.15 J/J 0.65 ND(0.50) U 0.91 ND(0.50) U ND(0.50) U 1.9 J/J 0.24 J/J
NH-C19-290_273 01/11/13 NT NT NT NT 0.045 J/J 0.14 J/J 0.66 ND(0.50) U 0.46 J/J 0.089 J/J ND(0.50) U 2.7 J/J 0.22 J/J
NH-C19-290_283 01/11/13 NT NT NT NT 0.051 J/J 0.19 J/J 0.76 ND(0.50) U 0.45 J/J ND(0.50) U ND(0.50) U 1.6 J/J 0.17 J/J
NH-C19-360_303 12/21/12 ND(2.0) U ND(2.0) U 23.0 1.8 0.06 J/J 0.27 J/J 0.41 J/J ND(0.50) U ND(0.50) U ND(0.50) U ND(0.50) U ND(10.0) R ND(0.50) UNH-C19-360_303 01/11/13 NT NT NT NT 0.18 J/J 0.30 J/J 1.2 ND(0.50) U 0.30 J/J 0.11 J/J ND(0.50) U 1.7 R/J ND(0.50) UNH-C19-360_313 01/11/13 NT NT NT NT 0.15 J/J 0.29 J/J 1.0 ND(0.50) U 0.19 J/J 0.10 J/J ND(0.50) U 2.4 R/J ND(0.50) UNH-C19-360_323 01/11/13 NT NT NT NT 0.10 J/J 0.30 J/J 0.76 0.036 J/J 0.24 J/J ND(0.50) U 0.034 J/J 1.9 R/J ND(0.50) UNH-C19-360_333 01/11/13 NT NT NT NT 0.096 J/J 0.32 J/J 0.74 ND(0.50) U 0.35 J/J ND(0.50) U ND(0.50) U 2.5 R/J ND(0.50) UNH-C20-380_322 12/19/12 ND(2.0) U ND(2.0) U/J ND(2.4) U 1.6 ND(0.50) U 0.18 J/J 0.15 J/J ND(0.50) U ND(0.50) U ND(0.50) U ND(0.50) U ND(10.0) R ND(0.50) UNH-C21-260_213 01/03/13 ND(2.0) U ND(2.0) U 4.1 0.79 ND(0.50) U ND(0.50) U 0.25 J/J ND(0.50) U ND(0.50) U ND(0.50) U ND(0.50) U ND(10.0) R 0.13 J/J
NH-C21-260_213_DUP-3 01/03/13 ND(2.0) U ND(2.0) U/J 2.7 0.86 ND(0.50) U ND(0.50) U 0.26 J/J ND(0.50) U ND(0.50) U ND(0.50) U ND(0.50) U ND(10.0) R 0.13 J/J
NH-C21-340_283 01/04/13 ND(2.0) U ND(2.0) U 2.7 2.1 ND(0.50) U 0.61 0.30 J/J 0.045 J/J 0.18 J/J ND(0.50) U ND(0.50) U ND(10.0) R ND(0.50) UNH-C23-310_253 12/28/12 ND(2.0) U ND(2.0) U 2.4 2.7 ND(0.50) U 0.30 J/J ND(0.50) U ND(0.50) U ND(0.50) U ND(0.50) U ND(0.50) U ND(10.0) R ND(0.50) UNH-C23-310_253 01/11/13 NT NT NT NT ND(0.50) U 0.27 J/J 0.052 J/J ND(0.50) U 0.44 J/J ND(0.50) U ND(0.50) U 2.2 R/J ND(0.50) UNH-C23-310_263 01/11/13 NT NT NT NT 0.073 J/J 0.31 J/J 0.077 J/J ND(0.50) U 0.14 J/J ND(0.50) U ND(0.50) U 1.5 R/J ND(0.50) UNH-C23-310_273 01/11/13 NT NT NT NT 0.078 J/J 0.29 J/J 0.084 J/J ND(0.50) U 0.10 J/J ND(0.50) U ND(0.50) U 2.6 R/J ND(0.50) UNH-C23-310_283 01/11/13 NT NT NT NT 0.064 J/J 0.37 J/J 0.089 J/J ND(0.50) U 0.15 J/J ND(0.50) U ND(0.50) U 1.6 R/J ND(0.50) UNH-C23-310_293 01/11/13 NT NT NT NT ND(0.50) U 0.33 J/J ND(0.50) U ND(0.50) U 0.14 J/J ND(0.50) U ND(0.50) U 1.7 R/J ND(0.50) UNH-C23-310_303 01/11/13 NT NT NT NT 0.14 J/J 0.30 J/J 0.12 J/J ND(0.50) U 0.13 J/J ND(0.50) U ND(0.50) U ND(10.0) R 0.087 J/J
NH-C24-305_247 12/18/12 ND(2.0) ND(2.0) ND(2.0) U/J 0.89 ND(0.50) U 0.27 J/J ND(0.50) U ND(0.50) U ND(0.50) U ND(0.50) U ND(0.50) U ND(10.0) R ND(0.50) UNHE-1_240 12/11/12 ND(2.0) U ND(2.0) U/J 77.0 3.2 0.21 J/J 0.90 0.30 J/J ND(0.50) U 0.23 J/J ND(0.50) U ND(0.50) U 3.3 R/J ND(0.50) U
EPA 521 EPA 524.2
X:\16000s\162830\3000\Phase I_Pre-Design Investigation Summary\02_tables\Table2a_Organic_AZone_rev1.xlsx Page 1 of 4

TABLE 2A
ORGANIC ANALYTICAL RESULTS - A ZONE
Phase 1 Pre-design Investigation, NHOU Second Interim RemedyLos Angeles County, California
Test Method
Analyte/
Units:
Sample Date
4909C_293 01/07/134918A_297.5 12/20/124919D_295 12/06/12NH-C10-360_313 12/14/12NH-C12-360_313 12/26/12NH-C13-385_338 12/12/12NH-C14-250_203 12/26/12NH-C16-390_343 12/04/12NH-C17-339_281 01/02/13NH-C18-270_223 12/11/12NH-C18-365_308 12/07/12NH-C19-290_233 12/21/12NH-C19-290_233 01/11/13NH-C19-290_233_DUP-5 01/11/13NH-C19-290_243 01/11/13NH-C19-290_253 01/11/13NH-C19-290_263 01/11/13NH-C19-290_273 01/11/13NH-C19-290_283 01/11/13NH-C19-360_303 12/21/12NH-C19-360_303 01/11/13NH-C19-360_313 01/11/13NH-C19-360_323 01/11/13NH-C19-360_333 01/11/13NH-C20-380_322 12/19/12NH-C21-260_213 01/03/13NH-C21-260_213_DUP-3 01/03/13NH-C21-340_283 01/04/13NH-C23-310_253 12/28/12NH-C23-310_253 01/11/13NH-C23-310_263 01/11/13NH-C23-310_273 01/11/13NH-C23-310_283 01/11/13NH-C23-310_293 01/11/13NH-C23-310_303 01/11/13NH-C24-305_247 12/18/12NHE-1_240 12/11/12
Carbon
tetrachloride
(µg/L)
Chlorobenzene
(µg/L)
Chloroethane
(µg/L)
Chloroform
(µg/L)
Chloromethane
(µg/L)
cis-1,2-
Dichloroethene
(µg/L)
Dibromochloro-
methane
(µg/L)
Dichlorodifluoro-
methane
(µg/L)
Diethyl Ether
(µg/L)
Ethanol
(µg/L)
Ethylbenzene
(µg/L)
Methylene
chloride
(µg/L)
o-Xylene
(µg/L)
tert-Butyl methyl
ether
(µg/L)
Tetrachloroethene
(µg/L)
Value Qual Value Qual Value Qual Value Qual Value Qual Value Qual Value Qual Value Qual Value Qual Value Qual Value Qual Value Qual Value Qual Value Qual Value Qual
ND(0.50) U ND(0.50) U 0.096 J/J 0.074 J/J ND(0.50) U/J 1.3 ND(0.50) U 5.3 0.13 J/J ND(50.0) R ND(0.50) U ND(0.50) U ND(0.50) U ND(0.50) U 14.0
ND(0.50) U 0.36 J/J ND(0.50) U ND(0.50) U ND(0.50) U 3.9 ND(0.50) U 0.29 J/J 0.26 J/J ND(50.0) R ND(0.50) U ND(0.50) U 0.081 J/J ND(0.50) U ND(0.50) U ND(0.50) U ND(0.50) U ND(0.50) U 0.67 ND(0.50) U/B,J 0.27 J/J ND(0.50) U 0.13 J/J ND(0.50) U ND(50.0) R ND(0.50) U ND(0.50) U ND(0.50) U 0.39 J/J 0.55
ND(0.50) U ND(0.50) U ND(0.50) U 0.18 J/J ND(0.50) U/B,J 8.3 ND(0.50) U 3.2 J ND(0.50) U ND(50.0) R ND(0.50) U ND(0.50) U ND(0.50) U ND(0.50) U 3.3
0.18 J/J ND(0.50) U ND(0.50) U 0.14 J/J ND(0.50) U/J 0.29 J/J ND(0.50) U 0.71 ND(0.50) U ND(50.0) R ND(0.50) U ND(0.50) U ND(0.50) U ND(0.50) U 1.0
ND(0.50) U ND(0.50) U ND(0.50) U 0.13 J/J ND(0.50) U ND(0.50) U ND(0.50) U ND(0.50) U ND(0.50) U ND(50.0) R ND(0.50) U ND(0.50) U 0.044 J/J ND(0.50) U 0.25 J/J
0.38 J/J ND(0.50) U ND(0.50) U 2.6 ND(0.50) U/J 0.72 0.19 J/J 0.48 J/J ND(0.50) U ND(50.0) R ND(0.50) U ND(0.50) U ND(0.50) U ND(0.50) U 16.0
ND(0.50) U ND(0.50) U ND(0.50) U 0.29 J/J ND(0.50) U 2.8 ND(0.50) U 1.0 ND(0.50) U ND(50.0) R 0.048 J/J ND(0.50) U 0.075 J/J ND(0.50) U 1.5
0.14 J/J ND(0.50) U ND(0.50) U 0.20 J/J ND(0.50) U 0.60 ND(0.50) U 2.6 ND(0.50) U ND(50.0) R ND(0.50) U ND(0.50) U ND(0.50) U ND(0.50) U 1.7
ND(0.50) U ND(0.50) U ND(0.50) U 18.0 ND(0.50) U ND(0.50) U ND(0.50) U ND(0.50) U ND(0.50) U ND(50.0) R ND(0.50) U ND(0.50) U ND(0.50) U ND(0.50) U ND(0.50) U 0.16 J/J ND(0.50) U ND(0.50) U 8.6 0.13 J/J 2.6 ND(0.50) U 6.2 ND(0.50) U ND(50.0) R ND(0.50) U ND(0.50) U ND(0.50) U ND(0.50) U 2.5
0.18 J/J ND(0.50) U ND(0.50) U 2.3 ND(0.50) U/B,J 0.39 J/J ND(0.50) U 3.0 ND(0.50) U ND(50.0) R ND(0.50) U ND(0.50) U ND(0.50) U ND(0.50) U 2.0
0.30 J/J ND(0.50) U ND(0.50) U 2.3 0.065 J/J 0.47 J/J ND(0.50) U 2.4 ND(0.50) U ND(50.0) R ND(0.50) U ND(0.50) U ND(0.50) U ND(0.50) U 2.1
0.24 J/J ND(0.50) U ND(0.50) U 2.4 0.063 J/J 0.56 ND(0.50) U 2.5 ND(0.50) U ND(50.0) R ND(0.50) U ND(0.50) U ND(0.50) U ND(0.50) U 2.1
0.20 J/J ND(0.50) U ND(0.50) U 2.3 0.074 J/J 0.48 J/J ND(0.50) U 2.7 ND(0.50) U ND(50.0) R ND(0.50) U ND(0.50) U ND(0.50) U ND(0.50) U 1.6
0.23 J/J ND(0.50) U ND(0.50) U 2.4 0.074 J/J 0.51 ND(0.50) U 2.6 ND(0.50) U ND(50.0) R ND(0.50) U ND(0.50) U ND(0.50) U ND(0.50) U 1.9
0.26 J/J ND(0.50) U ND(0.50) U 2.5 0.061 J/J 0.48 J/J ND(0.50) U 2.6 ND(0.50) U ND(50.0) R ND(0.50) U ND(0.50) U ND(0.50) U ND(0.50) U 1.7
0.24 J/J ND(0.50) U ND(0.50) U 2.3 0.064 J/J 0.48 J/J ND(0.50) U 2.7 ND(0.50) U 23.0 J/J ND(0.50) U 0.13 J/J ND(0.50) U ND(0.50) U 2.1
0.30 J/J ND(0.50) U ND(0.50) U 2.0 ND(0.50) U 0.51 ND(0.50) U 2.9 ND(0.50) U ND(50.0) R ND(0.50) U 0.12 J/J ND(0.50) U ND(0.50) U 2.0
0.32 J/J ND(0.50) U ND(0.50) U 1.0 ND(0.50) U/B,J 1.1 ND(0.50) U 4.9 ND(0.50) U ND(50.0) R ND(0.50) U ND(0.50) U ND(0.50) U ND(0.50) U 1.7
0.44 J/J ND(0.50) U ND(0.50) U 1.1 ND(0.50) U/B,J 1.3 ND(0.50) U 4.8 ND(0.50) U ND(50.0) R ND(0.50) U ND(0.50) U ND(0.50) U ND(0.50) U 2.0
0.42 J/J ND(0.50) U ND(0.50) U 0.88 ND(0.50) U/B,J 1.7 ND(0.50) U 3.7 ND(0.50) U ND(50.0) R ND(0.50) U 0.16 J/J ND(0.50) U ND(0.50) U 2.5
0.25 J/J ND(0.50) U ND(0.50) U 0.70 ND(0.50) U/B,J 2.2 ND(0.50) U 2.6 ND(0.50) U ND(50.0) R ND(0.50) U 0.19 J/J ND(0.50) U ND(0.50) U 3.3
0.30 J/J ND(0.50) U ND(0.50) U 0.67 ND(0.50) U/B,J 2.3 ND(0.50) U 2.6 ND(0.50) U ND(50.0) R ND(0.50) U 0.14 J/J ND(0.50) U ND(0.50) U 2.6
ND(0.50) U ND(0.50) U ND(0.50) U 0.35 J/J ND(0.50) U 1.2 ND(0.50) U 0.43 J/J ND(0.50) U ND(50.0) R ND(0.50) U ND(0.50) U ND(0.50) U ND(0.50) U 1.3
ND(0.50) U ND(0.50) U ND(0.50) U 14.0 ND(0.50) U 0.087 J/J ND(0.50) U 0.88 ND(0.50) U ND(50.0) R ND(0.50) U ND(0.50) U 0.043 J/J ND(0.50) U 0.76
ND(0.50) U ND(0.50) U ND(0.50) U 14.0 ND(0.50) U ND(0.50) U ND(0.50) U 1.0 ND(0.50) U ND(50.0) R ND(0.50) U ND(0.50) U ND(0.50) U ND(0.50) U 0.70
ND(0.50) U ND(0.50) U ND(0.50) U 0.79 ND(0.50) U 3.6 ND(0.50) U 1.5 ND(0.50) U ND(50.0) R ND(0.50) U ND(0.50) U 0.076 J/J ND(0.50) U 0.51
ND(0.50) U ND(0.50) U ND(0.50) U 1.5 ND(0.50) U 1.8 ND(0.50) U 0.43 J/J ND(0.50) U ND(50.0) R ND(0.50) U ND(0.50) U ND(0.50) U ND(0.50) U 1.7
ND(0.50) U ND(0.50) U ND(0.50) U 1.0 0.073 J/J 1.8 ND(0.50) U 0.30 J/J ND(0.50) U ND(50.0) R ND(0.50) U 0.22 J/J ND(0.50) U ND(0.50) U 1.2
ND(0.50) U ND(0.50) U ND(0.50) U 1.3 ND(0.50) U 2.2 ND(0.50) U 0.40 J/J ND(0.50) U ND(50.0) R ND(0.50) U ND(0.50) U ND(0.50) U ND(0.50) U 2.1
ND(0.50) U ND(0.50) U ND(0.50) U 1.2 0.05 J/J 2.1 ND(0.50) U 0.33 J/J ND(0.50) U ND(50.0) R ND(0.50) U 0.21 J/J ND(0.50) U ND(0.50) U 2.4
ND(0.50) U ND(0.50) U ND(0.50) U 1.3 ND(0.50) U 2.3 ND(0.50) U 0.36 J/J ND(0.50) U ND(50.0) R ND(0.50) U ND(0.50) U ND(0.50) U ND(0.50) U 2.5
ND(0.50) U ND(0.50) U ND(0.50) U 1.1 0.056 J/J 2.2 ND(0.50) U 0.49 J/J ND(0.50) U ND(50.0) R ND(0.50) U ND(0.50) U ND(0.50) U ND(0.50) U 2.4
ND(0.50) U ND(0.50) U ND(0.50) U 1.3 ND(0.50) U 1.7 ND(0.50) U 0.28 J/J ND(0.50) U ND(50.0) R ND(0.50) U ND(0.50) U ND(0.50) U ND(0.50) U 2.3
0.22 J/J ND(0.50) U ND(0.50) U 0.33 J/J ND(0.50) U/J 0.23 J/J ND(0.50) U 1.4 J ND(0.50) U ND(50.0) R ND(0.50) U ND(0.50) U ND(0.50) U ND(0.50) U 1.6
ND(0.50) U ND(0.50) U ND(0.50) U 0.72 ND(0.50) U/J 0.53 ND(0.50) U 0.36 J/J ND(0.50) U ND(50.0) R ND(0.50) U ND(0.50) U ND(0.50) U ND(0.50) U 2.6
EPA 524.2
X:\16000s\162830\3000\Phase I_Pre-Design Investigation Summary\02_tables\Table2a_Organic_AZone_rev1.xlsx Page 2 of 4

TABLE 2A
ORGANIC ANALYTICAL RESULTS - A ZONE
Phase 1 Pre-design Investigation, NHOU Second Interim RemedyLos Angeles County, California
Test Method
Analyte/
Units:
Sample Date
4909C_293 01/07/134918A_297.5 12/20/124919D_295 12/06/12NH-C10-360_313 12/14/12NH-C12-360_313 12/26/12NH-C13-385_338 12/12/12NH-C14-250_203 12/26/12NH-C16-390_343 12/04/12NH-C17-339_281 01/02/13NH-C18-270_223 12/11/12NH-C18-365_308 12/07/12NH-C19-290_233 12/21/12NH-C19-290_233 01/11/13NH-C19-290_233_DUP-5 01/11/13NH-C19-290_243 01/11/13NH-C19-290_253 01/11/13NH-C19-290_263 01/11/13NH-C19-290_273 01/11/13NH-C19-290_283 01/11/13NH-C19-360_303 12/21/12NH-C19-360_303 01/11/13NH-C19-360_313 01/11/13NH-C19-360_323 01/11/13NH-C19-360_333 01/11/13NH-C20-380_322 12/19/12NH-C21-260_213 01/03/13NH-C21-260_213_DUP-3 01/03/13NH-C21-340_283 01/04/13NH-C23-310_253 12/28/12NH-C23-310_253 01/11/13NH-C23-310_263 01/11/13NH-C23-310_273 01/11/13NH-C23-310_283 01/11/13NH-C23-310_293 01/11/13NH-C23-310_303 01/11/13NH-C24-305_247 12/18/12NHE-1_240 12/11/12
Tetrahydrofuran
(µg/L)
Toluene
(µg/L)
trans-1,2-
Dichloroethene
(µg/L)
Trichloroethene
(µg/L)
Trichlorofluoro-
methane
(µg/L)
Vinyl chloride
(µg/L)
Value Qual Value Qual Value Qual Value Qual Value Qual Value Qual
ND(5.0) U/J ND(0.50) U/B,J ND(0.50) U 50.0 0.17 J/J ND(0.50) U 2.4 J/J ND(0.50) U/B,J ND(0.50) U 1.9 0.15 J/J 0.11 J/J
ND(5.0) U 0.13 J/J ND(0.50) U 15.0 0.074 J/J ND(0.50) U ND(5.0) U ND(0.50) U/J 0.39 J/J 3.2 0.12 J/J ND(0.50) U ND(5.0) U ND(0.50) U/J ND(0.50) U 0.50 J/J ND(0.50) U ND(0.50) U ND(5.0) U ND(0.50) U/J ND(0.50) U 7.7 ND(0.50) U ND(0.50) U ND(5.0) U ND(0.50) U/J ND(0.50) U 6.1 ND(0.50) U ND(0.50) U ND(5.0) U 0.16 J/J ND(0.50) U 19.0 0.89 ND(0.50) U ND(5.0) U 0.069 J/J ND(0.50) U 0.91 0.25 J/J ND(0.50) U ND(5.0) U ND(0.50) U/J ND(0.50) U 0.59 ND(0.50) U ND(0.50) U ND(5.0) U ND(0.50) U/J 0.13 J/J 70.0 0.39 J/J ND(0.50) U ND(5.0) U 0.078 J/J ND(0.50) U 60.0 0.19 J/J ND(0.50) U 2.1 J/J ND(0.50) U ND(0.50) U 78.0 0.25 J/J ND(0.50) U 2.3 J/J ND(0.50) U ND(0.50) U 79.0 0.27 J/J ND(0.50) U 2.3 J/J ND(0.50) U ND(0.50) U 76.0 0.27 J/J ND(0.50) U 2.4 J/J ND(0.50) U ND(0.50) U 77.0 J 0.26 J/J ND(0.50) U 2.1 J/J ND(0.50) U ND(0.50) U 77.0 0.27 J/J ND(0.50) U 2.1 J/J ND(0.50) U ND(0.50) U 79.0 0.26 J/J ND(0.50) U 2.3 J/J ND(0.50) U ND(0.50) U 82.0 0.26 J/J ND(0.50) U ND(5.0) U 0.13 J/J ND(0.50) U 42.0 0.28 J/J ND(0.50) U 2.5 J/J ND(0.50) U ND(0.50) U 69.0 J 0.44 J/J ND(0.50) U 2.6 J/J ND(0.50) U ND(0.50) U 55.0 0.28 J/J ND(0.50) U 2.6 J/J ND(0.50) U ND(0.50) U 45.0 0.17 J/J ND(0.50) U 2.4 J/J ND(0.50) U ND(0.50) U 45.0 0.21 J/J ND(0.50) U ND(5.0) U ND(0.50) U/B,J ND(0.50) U 46.0 0.12 J/J ND(0.50) U ND(5.0) U 0.078 J/J ND(0.50) U 23.0 ND(0.50) U ND(0.50) U ND(5.0) U 0.086 J/J ND(0.50) U 24.0 0.08 J/J ND(0.50) U ND(5.0) U ND(0.50) U/B,J ND(0.50) U 15.0 ND(0.50) U ND(0.50) U ND(5.0) U ND(0.50) U/J ND(0.50) U 1.9 ND(0.50) U ND(0.50) U 2.3 J/J ND(0.50) U ND(0.50) U 1.7 ND(0.50) U ND(0.50) U 2.4 J/J ND(0.50) U ND(0.50) U 2.4 ND(0.50) U ND(0.50) U 2.5 J/J ND(0.50) U ND(0.50) U 2.2 ND(0.50) U ND(0.50) U 2.2 J/J ND(0.50) U ND(0.50) U 2.2 ND(0.50) U ND(0.50) U 2.4 J/J ND(0.50) U ND(0.50) U 2.5 ND(0.50) U ND(0.50) U 2.3 J/J ND(0.50) U ND(0.50) U 2.0 ND(0.50) U ND(0.50) U ND(5.0) U ND(0.50) U/B,J ND(0.50) U 0.24 J/J 0.10 J/J ND(0.50) U ND(5.0) U 0.72 ND(0.50) U 38.0 0.38 J/J ND(0.50) U
EPA 524.2
X:\16000s\162830\3000\Phase I_Pre-Design Investigation Summary\02_tables\Table2a_Organic_AZone_rev1.xlsx Page 3 of 4

TABLE 2A
ORGANIC ANALYTICAL RESULTS - A ZONE
Phase 1 Pre-design Investigation, NHOU Second Interim RemedyLos Angeles County, California
AbbreviationsEPA = The United States Environmental Protection Agencyng/L = Nanogram per liter
NT = Not Testedµg/L = Microgram per liter
Validation QualifiersA minus sign (-) indicates the numerical value has a low bias. A plus sign (+) indicates the numerical value has a high bias.J = The analyte was positively identified; the associated numerical value is the approximate concentration of the analyte in the sample. R The sample results are rejected. The presence or absence of the analyte cannot be verified. Rejected results are not usable for any purpose.U = The analyte was analyzed for, but was not detected above the reported sample quantitation limit.UJ = The analyte was analyzed for but was not detected above the reported value. The reported quantitation limit is approximate.
Laboratory QualifiersB = Compound is also detected in the laboratory method blank.J = Result is detected below the reporting limit or is an estimated concentration.
ND = Not Detected at the specific reporting level in parentheses
X:\16000s\162830\3000\Phase I_Pre-Design Investigation Summary\02_tables\Table2a_Organic_AZone_rev1.xlsx Page 4 of 4

TABLE 2B
ORGANIC ANALYTICAL RESULTS - B ZONE
Phase 1 Pre-Design Investigation, NHOU Second Interim RemedyLos Angeles County, California
Test Method EPA 522
Analyte/
Units:
N-
Nitrosodiethylamine
(ng/l)
N-Nitrosodi-n-
butylamine
(ng/l)
N-
Nitrosomorpholine
(ng/l)
1,4-Dioxane
(µg/L)
1,1,1-
Trichloroethane
(µg/L)
1,1-
Dichloroethane
(µg/L)
1,1-
Dichloroethene
(µg/L)
1,2,4-
Trimethylbenzene
(µg/L)
1,2-
Dichlorobenzene
(µg/L)
1,2-
Dichloroethane
(µg/L)
Sample Date Value Qual Value Qual Value Qual Value Qual Value Qual Value Qual Value Qual Value Qual Value Qual Value Qual
4909C_392 01/07/13 ND(2.0) U ND(2.0) U 0.72 J/J ND(0.13) U ND(0.50) U ND(0.50) U ND(0.50) U ND(0.50) U ND(0.50) U ND(0.50) U4909C_398 01/07/13 ND(2.0) U ND(2.0) U ND(2.0) U ND(0.14) U ND(0.50) U ND(0.50) U ND(0.50) U ND(0.50) U ND(0.50) U ND(0.50) U4918A_483 12/20/12 1.1 J/J ND(2.0) U/J 2.4 8.7 2.8 1.5 24.0 ND(0.50) U ND(0.50) U ND(0.50) UGW-18B_402 12/05/12 ND(2.0) U ND(2.0) U 0.67 J/J ND(0.38) U ND(0.50) U ND(0.50) U ND(0.50) U ND(0.50) U ND(0.50) U ND(0.50) UGW-18B_405 12/06/12 ND(2.0) U ND(2.0) U ND(2.0) J 0.41 ND(0.50) U ND(0.50) U ND(0.50) U ND(0.50) U ND(0.50) U ND(0.50) UGW-18B_405_DUP-1 12/06/12 ND(2.0) U ND(2.0) U 0.54 J/J 0.39 ND(0.50) U ND(0.50) U ND(0.50) U ND(0.50) U ND(0.50) U ND(0.50) UGW-19B_401.5 12/13/12 ND(2.0) ND(2.0) ND(2.0) ND(0.082) U ND(0.50) U ND(0.50) U ND(0.50) U ND(0.50) U ND(0.50) U ND(0.50) UGW-19B_401.5_DUP-2 12/13/12 ND(2.0) ND(2.0) 0.51 J/J ND(0.07) U/J ND(0.50) U ND(0.50) U ND(0.50) U ND(0.50) U ND(0.50) U ND(0.50) UGW-19B_405.5 12/13/12 ND(2.0) ND(2.0) U/J 0.56 J/J ND(0.10) U ND(0.50) U ND(0.50) U ND(0.50) U ND(0.50) U ND(0.50) U ND(0.50) ULA1-CW05_339 12/10/12 ND(2.0) U ND(2.0) U 25.0 1.8 ND(0.50) U ND(0.50) U 0.11 J/J ND(0.50) U ND(0.50) U ND(0.50) ULA1-CW05_356 12/10/12 ND(2.0) U ND(2.0) U 23.0 1.9 J ND(0.50) U ND(0.50) U 0.10 J/J ND(0.50) U ND(0.50) U ND(0.50) UNH-C01-450_403 12/27/12 ND(2.0) U 0.99 J/J 4.4 1.8 2.6 0.34 J/J 13.0 ND(0.50) U ND(0.50) U 0.11 J/J
NH-C01-450_447 12/27/12 ND(2.0) U ND(2.0) U 2.8 1.9 1.4 0.34 J/J 6.5 0.041 J/J ND(0.50) U ND(0.50) UNH-C10-360_340 12/14/12 ND(2.0) U ND(2.0) U 1.0 J/J 1.5 ND(0.50) U 1.3 ND(0.50) U ND(0.50) U ND(0.50) U 0.34 J/J
NH-C12-360_343 12/26/12 ND(2.0) U ND(2.0) U 2.9 0.86 ND(0.50) U 1.4 0.10 J/J ND(0.50) U ND(0.50) U ND(0.50) UNH-C13-385_363 12/12/12 ND(2.0) 0.59 J/J 1.1 J/J ND(0.16) U ND(0.50) U ND(0.50) U ND(0.50) U ND(0.50) U ND(0.50) U ND(0.50) UNH-C16-390_375 12/04/12 ND(2.0) U ND(2.0) U 2.4 1.3 0.30 J/J 0.24 J/J 1.1 ND(0.50) U ND(0.50) U ND(0.50) UNH-C17-339_313 01/02/13 ND(2.0) U ND(2.0) U/J 0.96 J/J 1.2 ND(0.50) U 0.77 0.17 J/J ND(0.50) U ND(0.50) U ND(0.50) UNH-C18-365_348 12/07/12 ND(2.0) U ND(2.0) UJ ND(2.1) U 3.3 J ND(0.50) U 0.70 0.24 J/J ND(0.50) U ND(0.50) U 0.26 J/J
NH-C19-360_343 01/11/13 NT NT NT NT 0.12 J/J 0.30 J/J 0.84 ND(0.50) U ND(0.50) U 0.25 J/J
NH-C19-360_343_DUP-6 01/11/13 NT NT NT NT 0.076 J/J 0.37 J/J 0.78 ND(0.50) U ND(0.50) U 0.30 J/J
NH-C19-360_349 12/21/12 ND(2.0) U ND(2.0) U 12.0 2.3 ND(0.50) U 0.31 J/J 0.41 J/J ND(0.50) U ND(0.50) U ND(0.50) UNH-C19-360_353 01/11/13 NT NT NT NT 0.07 J/J 0.31 J/J 0.74 ND(0.50) U ND(0.50) U 0.54
NH-C20-380_361 12/19/12 ND(2.0) U ND(2.0) U/J ND(2.0) U/J 1.3 ND(0.50) U 0.085 J/J 0.18 J/J ND(0.50) U ND(0.50) U ND(0.50) UNH-C21-340_325 01/04/13 ND(2.0) U ND(2.0) U 2.0 2.0 ND(0.50) U 0.70 0.32 J/J 0.037 J/J ND(0.50) U 0.18 J/J
NH-C21-340_325_DUP-4 01/04/13 ND(2.0) U ND(2.0) U 1.9 J/J 2.1 ND(0.50) U 0.64 0.23 J/J 0.054 J/J ND(0.50) U 0.19 J/J
NH-C23-400_343 12/28/12 ND(2.0) U ND(2.0) U 1.8 J/J 2.2 ND(0.50) U 0.16 J/J 0.20 J/J ND(0.50) U ND(0.50) U ND(0.50) UNH-C23-400_397 12/28/12 ND(2.0) U ND(2.0) U 1.9 J/J 1.4 ND(0.50) U ND(0.50) U ND(0.50) U ND(0.50) U ND(0.50) U ND(0.50) UNH-C23-400_343 01/11/13 NT NT NT NT ND(0.50) U 0.13 J/J 0.17 J/J ND(0.50) U ND(0.50) U 2.4
NH-C23-400_353 01/11/13 NT NT NT NT ND(0.50) U 0.18 J/J 0.39 J/J ND(0.50) U 0.04 J/J 0.23 J/J
NH-C23-400_363 01/11/13 NT NT NT NT ND(0.50) U 0.16 J/J 0.34 J/J ND(0.50) U 0.035 J/J 0.14 J/J
NH-C23-400_373 01/11/13 NT NT NT NT 0.045 J/J 0.099 J/J 0.38 J/J ND(0.50) U ND(0.50) U 0.23 J/J
NH-C23-400_383 01/11/13 NT NT NT NT ND(0.50) U 0.12 J/J 0.32 J/J ND(0.50) U ND(0.50) U 0.28 J/J
NH-C23-400_393 01/11/13 NT NT NT NT ND(0.50) U 0.096 J/J 0.33 J/J ND(0.50) U ND(0.50) U 0.33 J/J
EPA 521 EPA 524.2
X:\16000s\162830\3000\Phase I_Pre-Design Investigation Summary\02_tables\Table2b_Organic_BZone_rev1.xlsx Page 1 of 4

TABLE 2B
ORGANIC ANALYTICAL RESULTS - B ZONE
Phase 1 Pre-Design Investigation, NHOU Second Interim RemedyLos Angeles County, California
Test Method
Analyte/
Units:
Sample Date
4909C_392 01/07/134909C_398 01/07/134918A_483 12/20/12GW-18B_402 12/05/12GW-18B_405 12/06/12GW-18B_405_DUP-1 12/06/12GW-19B_401.5 12/13/12GW-19B_401.5_DUP-2 12/13/12GW-19B_405.5 12/13/12LA1-CW05_339 12/10/12LA1-CW05_356 12/10/12NH-C01-450_403 12/27/12NH-C01-450_447 12/27/12NH-C10-360_340 12/14/12NH-C12-360_343 12/26/12NH-C13-385_363 12/12/12NH-C16-390_375 12/04/12NH-C17-339_313 01/02/13NH-C18-365_348 12/07/12NH-C19-360_343 01/11/13NH-C19-360_343_DUP-6 01/11/13NH-C19-360_349 12/21/12NH-C19-360_353 01/11/13NH-C20-380_361 12/19/12NH-C21-340_325 01/04/13NH-C21-340_325_DUP-4 01/04/13NH-C23-400_343 12/28/12NH-C23-400_397 12/28/12NH-C23-400_343 01/11/13NH-C23-400_353 01/11/13NH-C23-400_363 01/11/13NH-C23-400_373 01/11/13NH-C23-400_383 01/11/13NH-C23-400_393 01/11/13
1,2-
Dichloropropane
(µg/L)
Acetone
(µg/L)
Benzene
(µg/L)
Carbon disulfide
(µg/L)
Carbon
tetrachloride
(µg/L)
Chlorobenzene
(µg/L)
Chloroform
(µg/L)
Chloromethane
(µg/L)
cis-1,2-
Dichloroethene
(µg/L)
Dichlorodifluoro-
methane
(µg/L)
Ethylbenzene
(µg/L)
Value Qual Value Qual Value Qual Value Qual Value Qual Value Qual Value Qual Value Qual Value Qual Value Qual Value Qual
ND(0.50) U ND(10.0) R ND(0.50) U ND(0.50) U ND(0.50) U ND(0.50) U ND(0.50) U ND(0.50) U ND(0.50) U ND(0.50) U ND(0.50) U ND(0.50) U ND(10.0) R ND(0.50) U ND(0.50) U ND(0.50) U ND(0.50) U ND(0.50) U ND(0.50) U ND(0.50) U 0.062 J/J ND(0.50) U ND(0.50) U ND(10.0) R ND(0.50) U ND(0.50) U ND(0.50) U 0.22 J/J 0.16 J/J ND(0.50) U 2.5 0.39 J/J ND(0.50) U ND(0.50) U 1.4 R/J ND(0.50) U ND(0.50) U ND(0.50) U ND(0.50) U 0.15 J/J 0.062 J/J 0.058 J/J 0.15 J/J 0.034 J/J
ND(0.50) U ND(10.0) R ND(0.50) U ND(0.50) U ND(0.50) U ND(0.50) U 0.13 J/J ND(0.50) U/B,J 0.072 J/J 0.13 J/J 0.039 J/J
ND(0.50) U 1.5 J/J ND(0.50) U ND(0.50) U ND(0.50) U ND(0.50) U 0.15 J/J ND(0.50) U/B,J 0.036 J/J 0.11 J/J 0.034 J/J
ND(0.50) U 1.5 R/J ND(0.50) U ND(0.50) U ND(0.50) U ND(0.50) U ND(0.50) U ND(0.50) U/J ND(0.50) U 0.045 J/J ND(0.50) U ND(0.50) U 3.5 R/J 0.038 J/J ND(0.50) U ND(0.50) U ND(0.50) U ND(0.50) U ND(0.50) U/J ND(0.50) U ND(0.50) U 0.038 J/J
ND(0.50) U 2.0 R/J 0.037 J/J ND(0.50) U ND(0.50) U ND(0.50) U ND(0.50) U ND(0.50) U/J ND(0.50) U 0.093 J/J 0.045 J/J
ND(0.50) U ND(10.0) R ND(0.50) U ND(0.50) U ND(0.50) U ND(0.50) U 0.21 J/J ND(0.50) U/J ND(0.50) U 0.061 J/J ND(0.50) U/J ND(0.50) U ND(10.0) R ND(0.50) U ND(0.50) U ND(0.50) U ND(0.50) U 0.22 J/J ND(0.50) U/J ND(0.50) U ND(0.50) U ND(0.50) U ND(0.50) U 1.8 R/J ND(0.50) U ND(0.50) U ND(0.50) U 0.11 J/J 0.17 J/J ND(0.50) U/J 0.85 1.0 ND(0.50) U ND(0.50) U 2.8 R/J ND(0.50) U 0.049 J/J ND(0.50) U ND(0.50) U 0.14 J/J ND(0.50) U/J 0.81 0.48 J/J 0.04 J/J
0.18 J/J ND(10.0) R ND(0.50) U ND(0.50) U ND(0.50) U ND(0.50) U 0.22 J/J ND(0.50) U/B,J 7.6 3.5 J 0.032 J/J
ND(0.50) U ND(10.0) R ND(0.50) U ND(0.50) U ND(0.50) U ND(0.50) U 0.079 J/J ND(0.50) U/J 0.55 1.5 ND(0.50) U ND(0.50) U ND(10.0) R ND(0.50) U ND(0.50) U ND(0.50) U ND(0.50) U 0.13 J/J ND(0.50) U ND(0.50) U ND(0.50) U ND(0.50) U ND(0.50) U 1.9 J/J ND(0.50) U ND(0.50) U ND(0.50) U ND(0.50) U 0.31 J/J ND(0.50) U/J 0.68 0.21 J/J 0.033 J/J
ND(0.50) U ND(10.0) R ND(0.50) U ND(0.50) U 0.14 J/J ND(0.50) U 0.14 J/J ND(0.50) U 0.59 2.2 ND(0.50) U 0.092 J/J 1.6 R/J ND(0.50) U ND(0.50) U ND(0.50) U ND(0.50) U 2.4 ND(0.50) U 4.9 3.0 ND(0.50) U/J 0.083 J/J 2.1 R/J ND(0.50) U ND(0.50) U 0.25 J/J ND(0.50) U 0.68 ND(0.50) U/B,J 2.2 2.5 ND(0.50) U 0.094 J/J 1.7 R/J ND(0.50) U ND(0.50) U 0.23 J/J ND(0.50) U 0.71 ND(0.50) U/B,J 2.2 2.7 ND(0.50) U ND(0.50) U ND(10.0) R ND(0.50) U ND(0.50) U 0.34 J/J ND(0.50) U 0.81 ND(0.50) U/B,J 2.0 3.5 ND(0.50) U ND(0.50) U 2.0 R/J ND(0.50) U ND(0.50) U 0.23 J/J ND(0.50) U 0.71 ND(0.50) U/B,J 2.2 2.6 ND(0.50) U ND(0.50) U ND(10.0) R ND(0.50) U ND(0.50) U ND(0.50) U ND(0.50) U 0.36 J/J ND(0.50) U 0.93 0.27 J/J ND(0.50) U ND(0.50) U ND(10.0) R ND(0.50) U ND(0.50) U ND(0.50) U ND(0.50) U 0.53 ND(0.50) U 3.9 2.0 ND(0.50) U ND(0.50) U ND(10.0) R ND(0.50) U ND(0.50) U ND(0.50) U ND(0.50) U 0.50 ND(0.50) U 3.9 1.9 ND(0.50) U ND(0.50) U ND(10.0) R ND(0.50) U ND(0.50) U ND(0.50) U ND(0.50) U 0.37 J/J ND(0.50) U 1.6 0.32 J/J ND(0.50) U ND(0.50) U ND(10.0) R ND(0.50) U ND(0.50) U ND(0.50) U ND(0.50) U 0.32 J/J ND(0.50) U 0.60 0.18 J/J ND(0.50) U ND(0.50) U 5.0 R/J ND(0.50) U ND(0.50) U ND(0.50) U ND(0.50) U 0.23 J/J ND(0.50) U/B,J 0.91 0.18 J/J ND(0.50) U ND(0.50) U 4.9 R/J ND(0.50) U ND(0.50) U ND(0.50) U ND(0.50) U 0.34 J/J ND(0.50) U/B,J 1.8 0.30 J/J ND(0.50) U ND(0.50) U 2.3 R/J ND(0.50) U ND(0.50) U ND(0.50) U ND(0.50) U 0.31 J/J ND(0.50) U/B,J 1.6 0.24 J/J ND(0.50) U ND(0.50) U 4.9 R/J ND(0.50) U ND(0.50) U ND(0.50) U ND(0.50) U 0.29 J/J ND(0.50) U/B,J 1.1 0.23 J/J ND(0.50) U ND(0.50) U 4.4 R/J ND(0.50) U ND(0.50) U ND(0.50) U ND(0.50) U 0.30 J/J 0.056 J/J 1.1 0.22 J/J ND(0.50) U ND(0.50) U 1.7 R/J ND(0.50) U ND(0.50) U ND(0.50) U ND(0.50) U 0.25 J/J 0.051 J/J 1.0 0.21 J/J ND(0.50) U
EPA 524.2
X:\16000s\162830\3000\Phase I_Pre-Design Investigation Summary\02_tables\Table2b_Organic_BZone_rev1.xlsx Page 2 of 4
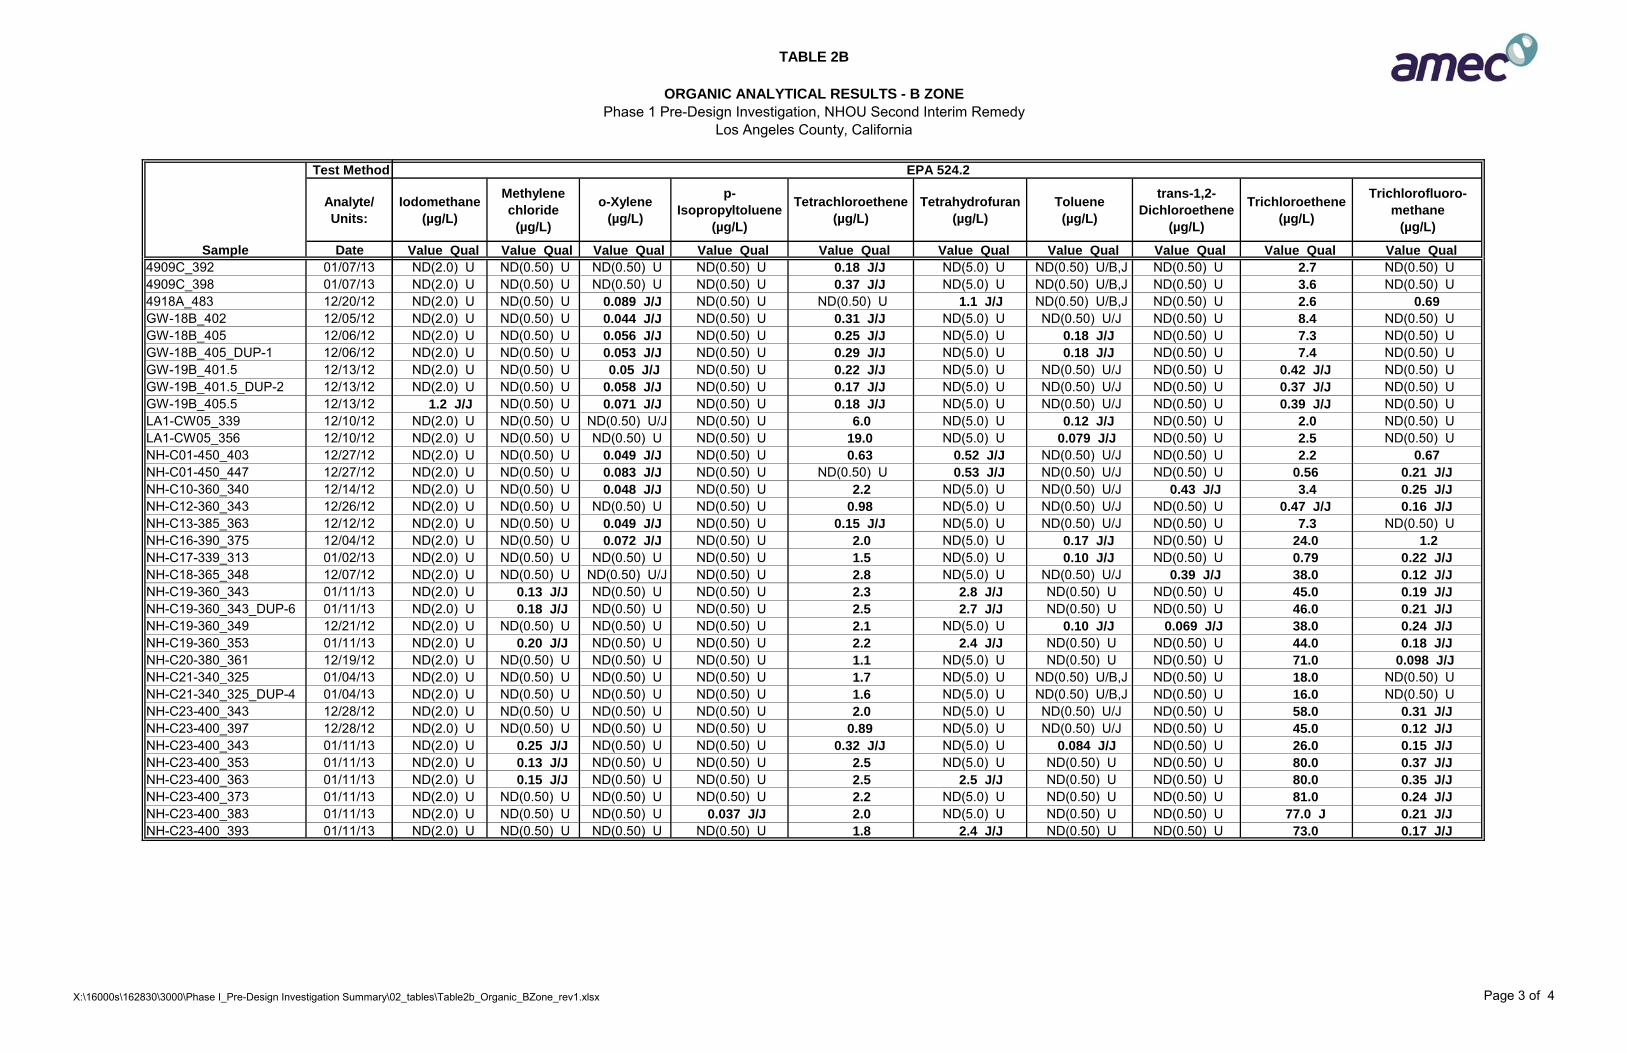
TABLE 2B
ORGANIC ANALYTICAL RESULTS - B ZONE
Phase 1 Pre-Design Investigation, NHOU Second Interim RemedyLos Angeles County, California
Test Method
Analyte/
Units:
Sample Date
4909C_392 01/07/134909C_398 01/07/134918A_483 12/20/12GW-18B_402 12/05/12GW-18B_405 12/06/12GW-18B_405_DUP-1 12/06/12GW-19B_401.5 12/13/12GW-19B_401.5_DUP-2 12/13/12GW-19B_405.5 12/13/12LA1-CW05_339 12/10/12LA1-CW05_356 12/10/12NH-C01-450_403 12/27/12NH-C01-450_447 12/27/12NH-C10-360_340 12/14/12NH-C12-360_343 12/26/12NH-C13-385_363 12/12/12NH-C16-390_375 12/04/12NH-C17-339_313 01/02/13NH-C18-365_348 12/07/12NH-C19-360_343 01/11/13NH-C19-360_343_DUP-6 01/11/13NH-C19-360_349 12/21/12NH-C19-360_353 01/11/13NH-C20-380_361 12/19/12NH-C21-340_325 01/04/13NH-C21-340_325_DUP-4 01/04/13NH-C23-400_343 12/28/12NH-C23-400_397 12/28/12NH-C23-400_343 01/11/13NH-C23-400_353 01/11/13NH-C23-400_363 01/11/13NH-C23-400_373 01/11/13NH-C23-400_383 01/11/13NH-C23-400_393 01/11/13
Iodomethane
(µg/L)
Methylene
chloride
(µg/L)
o-Xylene
(µg/L)
p-
Isopropyltoluene
(µg/L)
Tetrachloroethene
(µg/L)
Tetrahydrofuran
(µg/L)
Toluene
(µg/L)
trans-1,2-
Dichloroethene
(µg/L)
Trichloroethene
(µg/L)
Trichlorofluoro-
methane
(µg/L)
Value Qual Value Qual Value Qual Value Qual Value Qual Value Qual Value Qual Value Qual Value Qual Value Qual
ND(2.0) U ND(0.50) U ND(0.50) U ND(0.50) U 0.18 J/J ND(5.0) U ND(0.50) U/B,J ND(0.50) U 2.7 ND(0.50) U ND(2.0) U ND(0.50) U ND(0.50) U ND(0.50) U 0.37 J/J ND(5.0) U ND(0.50) U/B,J ND(0.50) U 3.6 ND(0.50) U ND(2.0) U ND(0.50) U 0.089 J/J ND(0.50) U ND(0.50) U 1.1 J/J ND(0.50) U/B,J ND(0.50) U 2.6 0.69
ND(2.0) U ND(0.50) U 0.044 J/J ND(0.50) U 0.31 J/J ND(5.0) U ND(0.50) U/J ND(0.50) U 8.4 ND(0.50) U ND(2.0) U ND(0.50) U 0.056 J/J ND(0.50) U 0.25 J/J ND(5.0) U 0.18 J/J ND(0.50) U 7.3 ND(0.50) U ND(2.0) U ND(0.50) U 0.053 J/J ND(0.50) U 0.29 J/J ND(5.0) U 0.18 J/J ND(0.50) U 7.4 ND(0.50) U ND(2.0) U ND(0.50) U 0.05 J/J ND(0.50) U 0.22 J/J ND(5.0) U ND(0.50) U/J ND(0.50) U 0.42 J/J ND(0.50) U ND(2.0) U ND(0.50) U 0.058 J/J ND(0.50) U 0.17 J/J ND(5.0) U ND(0.50) U/J ND(0.50) U 0.37 J/J ND(0.50) U 1.2 J/J ND(0.50) U 0.071 J/J ND(0.50) U 0.18 J/J ND(5.0) U ND(0.50) U/J ND(0.50) U 0.39 J/J ND(0.50) U ND(2.0) U ND(0.50) U ND(0.50) U/J ND(0.50) U 6.0 ND(5.0) U 0.12 J/J ND(0.50) U 2.0 ND(0.50) U ND(2.0) U ND(0.50) U ND(0.50) U ND(0.50) U 19.0 ND(5.0) U 0.079 J/J ND(0.50) U 2.5 ND(0.50) U ND(2.0) U ND(0.50) U 0.049 J/J ND(0.50) U 0.63 0.52 J/J ND(0.50) U/J ND(0.50) U 2.2 0.67
ND(2.0) U ND(0.50) U 0.083 J/J ND(0.50) U ND(0.50) U 0.53 J/J ND(0.50) U/J ND(0.50) U 0.56 0.21 J/J
ND(2.0) U ND(0.50) U 0.048 J/J ND(0.50) U 2.2 ND(5.0) U ND(0.50) U/J 0.43 J/J 3.4 0.25 J/J
ND(2.0) U ND(0.50) U ND(0.50) U ND(0.50) U 0.98 ND(5.0) U ND(0.50) U/J ND(0.50) U 0.47 J/J 0.16 J/J
ND(2.0) U ND(0.50) U 0.049 J/J ND(0.50) U 0.15 J/J ND(5.0) U ND(0.50) U/J ND(0.50) U 7.3 ND(0.50) U ND(2.0) U ND(0.50) U 0.072 J/J ND(0.50) U 2.0 ND(5.0) U 0.17 J/J ND(0.50) U 24.0 1.2
ND(2.0) U ND(0.50) U ND(0.50) U ND(0.50) U 1.5 ND(5.0) U 0.10 J/J ND(0.50) U 0.79 0.22 J/J
ND(2.0) U ND(0.50) U ND(0.50) U/J ND(0.50) U 2.8 ND(5.0) U ND(0.50) U/J 0.39 J/J 38.0 0.12 J/J
ND(2.0) U 0.13 J/J ND(0.50) U ND(0.50) U 2.3 2.8 J/J ND(0.50) U ND(0.50) U 45.0 0.19 J/J
ND(2.0) U 0.18 J/J ND(0.50) U ND(0.50) U 2.5 2.7 J/J ND(0.50) U ND(0.50) U 46.0 0.21 J/J
ND(2.0) U ND(0.50) U ND(0.50) U ND(0.50) U 2.1 ND(5.0) U 0.10 J/J 0.069 J/J 38.0 0.24 J/J
ND(2.0) U 0.20 J/J ND(0.50) U ND(0.50) U 2.2 2.4 J/J ND(0.50) U ND(0.50) U 44.0 0.18 J/J
ND(2.0) U ND(0.50) U ND(0.50) U ND(0.50) U 1.1 ND(5.0) U ND(0.50) U ND(0.50) U 71.0 0.098 J/J
ND(2.0) U ND(0.50) U ND(0.50) U ND(0.50) U 1.7 ND(5.0) U ND(0.50) U/B,J ND(0.50) U 18.0 ND(0.50) U ND(2.0) U ND(0.50) U ND(0.50) U ND(0.50) U 1.6 ND(5.0) U ND(0.50) U/B,J ND(0.50) U 16.0 ND(0.50) U ND(2.0) U ND(0.50) U ND(0.50) U ND(0.50) U 2.0 ND(5.0) U ND(0.50) U/J ND(0.50) U 58.0 0.31 J/J
ND(2.0) U ND(0.50) U ND(0.50) U ND(0.50) U 0.89 ND(5.0) U ND(0.50) U/J ND(0.50) U 45.0 0.12 J/J
ND(2.0) U 0.25 J/J ND(0.50) U ND(0.50) U 0.32 J/J ND(5.0) U 0.084 J/J ND(0.50) U 26.0 0.15 J/J
ND(2.0) U 0.13 J/J ND(0.50) U ND(0.50) U 2.5 ND(5.0) U ND(0.50) U ND(0.50) U 80.0 0.37 J/J
ND(2.0) U 0.15 J/J ND(0.50) U ND(0.50) U 2.5 2.5 J/J ND(0.50) U ND(0.50) U 80.0 0.35 J/J
ND(2.0) U ND(0.50) U ND(0.50) U ND(0.50) U 2.2 ND(5.0) U ND(0.50) U ND(0.50) U 81.0 0.24 J/J
ND(2.0) U ND(0.50) U ND(0.50) U 0.037 J/J 2.0 ND(5.0) U ND(0.50) U ND(0.50) U 77.0 J 0.21 J/J
ND(2.0) U ND(0.50) U ND(0.50) U ND(0.50) U 1.8 2.4 J/J ND(0.50) U ND(0.50) U 73.0 0.17 J/J
EPA 524.2
X:\16000s\162830\3000\Phase I_Pre-Design Investigation Summary\02_tables\Table2b_Organic_BZone_rev1.xlsx Page 3 of 4

TABLE 2B
ORGANIC ANALYTICAL RESULTS - B ZONE
Phase 1 Pre-Design Investigation, NHOU Second Interim RemedyLos Angeles County, California
AbbreviationsEPA = The United States Environmental Protection Agencyng/L = Nanogram per liter
NT = Not Testedµg/L = Microgram per liter
Validation QualifiersJ = The analyte was positively identified; the associated numerical value is the approximate concentration of the analyte in the sample. A minus sign (-) indicates the numerical value has a low bias. A plus sign (+) indicates the numerical value has a high bias.U = The analyte was analyzed for, but was not detected above the reported sample quantitation limit.UJ = The analyte was analyzed for but was not detected above the reported value. The reported quantitation limit is approximate.R The sample results are rejected. The presence or absence of the analyte cannot be verified. Rejected results are not usable for any purpose.
Laboratory QualifiersB = Compound is also detected in the laboratory method blank.J = Result is detected below the reporting limit or is an estimated concentration.
ND = Not Detected at the specific
X:\16000s\162830\3000\Phase I_Pre-Design Investigation Summary\02_tables\Table2b_Organic_BZone_rev1.xlsx Page 4 of 4

TABLE 3A
INORGANIC ANALYTICAL RESULTS - A ZONE
Phase 1 Pre-Design Investigation, NHOU Second Interim RemedyLos Angeles County, California
Test Method EPA 200.8 EPA 218.6 EPA 314.0 SM 2540C SM 2320B
Analyte/
Units:
Calcium
(Dissolved)
(mg/l)
Hardness Calcium
(as CaCO3)
(mg/l)
Iron (Dissolved)
(mg/l)
Magnesium
(Dissolved)
(mg/l)
Potassium
(Dissolved)
(mg/l)
Sodium
(Dissolved)
(mg/l)
Chromium
(Dissolved)
(mg/l)
Chromium VI
(µg/L)
Chloride
(mg/l)
Nitrate as NO3
(mg/l)
Nitrite as NO2
(mg/l)
Sulfate as SO4
(mg/l)
Perchlorate
(µg/L)
Total Dissolved
Solids
(mg/l)
Alkalinity, Total
(As CaCO3)
(mg/l)
Sample Date Value Qual Value Qual Value Qual Value Qual Value Qual Value Qual Value Qual Value Qual Value Qual Value Qual Value Qual Value Qual Value Qual Value Qual Value Qual
4909C_293 01/07/13 37.9 156 0.0123 J/J 14.8 10.5 49.5 ND(0.001) U/J ND(0.20) U 15.0 ND(0.10) U ND(0.10) U 28.0 ND(2.0) U 275 230
4918A_297.5 12/20/12 102 370 0.0515 J+/J 27.6 6.45 48.3 ND(0.001) U ND(0.20) UJ 51.0 0.044 J/J ND(0.10) U 61.0 ND(2.0) U 515 341
4919D_295 12/06/12 94.6 339 ND(0.10) U 25.1 /B 4.99 31.1 /B ND(0.001) U ND(0.20) U 50.0 17.0 J- ND(0.10) U 74.0 ND(2.0) UJ 495 212
NH-C10-360_313 12/14/12 95.2 330 ND(0.10) U 22.5 /B 4.19 30.1 0.00172 1.4 21.0 2.5 0.026 J/J 61.0 ND(2.0) U 385 282
NH-C12-360_313 12/26/12 85.7 304 ND(0.10) U 21.8 4.76 31.5 0.000652 J/J 0.58 20.0 1.9 ND(0.10) U 68.0 ND(2.0) U 410 262
NH-C13-385_338 12/12/12 68.6 235 0.0307 J/J 15.5 3.9 28.6 0.00159 1.4 14.0 3.3 0.069 J/J 75.0 ND(2.0) U 315 182
NH-C14-250_203 12/26/12 96.6 338 ND(0.10) U 23.6 4.15 26.1 0.00314 2.7 49.0 8.0 ND(0.10) U 56.0 ND(2.0) U 460 228
NH-C16-390_343 12/04/12 109 375 ND(0.10) U 25.3 /B 5.2 J- 33.3 0.000701 J/J 0.53 30.0 5.1 ND(0.10) U 78.0 ND(2.0) UJ 450 316
NH-C17-339_281 01/02/13 89.2 320 ND(0.10) U 23.7 4.13 31.2 0.00094 J/J 0.68 21.0 3.2 ND(0.10) U 58.0 ND(2.0) UJ 470 278
NH-C18-270_223 12/11/12 90.5 292 ND(0.10) U 15.9 /B 5.19 J+ 48.8 0.00256 2.1 32.0 2.6 ND(0.10) U 140 ND(2.0) UJ 415 166
NH-C18-365_308 12/07/12 112 388 ND(0.10) U 26.2 /B 4.69 32.4 0.00861 8.1 31.0 7.7 ND(0.10) U 89.0 2.9 J- 585 307
NH-C19-290_233 12/21/12 129 416 0.0119 J/J 22.8 4.92 33.4 0.00264 2.4 42.0 13.0 J-/BU ND(0.10) U 72.0 ND(2.0) U 530 289
NH-C19-360_303 12/21/12 113 383 ND(0.10) U 24.6 4.9 39.4 0.00174 1.5 35.0 15.0 J-/BU ND(0.10) U 66.0 ND(2.0) U 595 296
NH-C20-380_322 12/19/12 85.7 283 ND(0.10) U 19.3 4.28 30.3 0.000767 J/J 0.48 25.0 7.3 ND(0.10) U 70.0 ND(2.0) U 440 242
NH-C21-260_213 01/03/13 111 364 ND(0.10) U 21.1 4.27 28.5 0.0171 15.0 35.0 6.5 ND(0.10) U 130 ND(2.0) UJ 535 226
NH-C21-260_213_DUP-3 01/03/13 113 370 ND(0.10) U 21.3 4.35 28.9 0.0173 15.0 35.0 6.5 ND(0.10) U 140 ND(2.0) UJ 525 224
NH-C21-340_283 01/04/13 87.6 310 ND(0.10) U 22.0 4.11 29.3 0.0217 19.0 23.0 3.7 0.068 J/J 67.0 ND(2.0) U 385 246
NH-C23-310_253 12/28/12 127 441 ND(0.10) U 29.8 5.35 31.1 0.00136 0.96 44.0 14.0 ND(0.10) U 75.0 ND(2.0) UJ 590 312
NH-C24-305_247 12/18/12 119 415 ND(0.10) U 28.9 /B 5.11 31.9 0.00107 0.80 39.0 9.1 ND(0.10) U 67.0 ND(2.0) U 655 370
NHE-1_240 12/11/12 113 389 ND(0.10) U 26.2 /B 6.29 J+ 43.8 ND(0.001) U 0.20 J/J 39.0 16.0 ND(0.10) U 71.0 ND(2.0) UJ 545 278
Abbreviations:EPA = The United States Environmental Protection Agencymg/L = Milligram per liter
NT = Not TestedSM = Standard Methodµg/L = Microgram per liter
Validation Qualifiers:J = The analyte was positively identified; the associated numerical value is the approximate concentration of the analyte in the sample. A minus sign (-) indicates the numerical value has a low bias. A plus sign (+) indicates the numerical value has a high bias.U = The analyte was analyzed for, but was not detected above the reported sample quantitation limit.UJ = The analyte was analyzed for but was not detected above the reported value. The reported quantitation limit is approximate.R The sample results are rejected. The presence or absence of the analyte cannot be verified. Rejected results are not usable for any purpose.
Laboratory Qualifiers:B = Compound is also detected in the laboratory method blank.J = Result is detected below the reporting limit or is an estimated concentration.
EPA 200.7 EPA 300.0
ND = Not Detected at the specific
X:\16000s\162830\3000\Phase I_Pre-Design Investigation Summary\02_tables\Table3a_ Inorganic_AZone_rev1.xlsx Page 1 of 1

TABLE 3B
INORGANIC ANALYTICAL RESULTS - B ZONE
Phase 1 Pre-Design Investigation, NHOU Second Interim RemedyLos Angeles County, California
Test Method EPA 200.8 EPA 218.6 SM 2540C SM 2320B
Analyte/
Units:
Calcium
(Dissolved)
(mg/l)
Hardness Calcium
(as CaCO3)
(mg/l)
Iron (Dissolved)
(mg/l)
Magnesium
(Dissolved)
(mg/l)
Potassium
(Dissolved)
(mg/l)
Sodium
(Dissolved)
(mg/l)
Chromium
(Dissolved)
(mg/l)
Chromium VI
(µg/L)
Chloride
(mg/l)
Nitrate as NO3
(mg/l)
Nitrite as NO2
(mg/l)
Sulfate as SO4
(mg/l)
Total Dissolved
Solids
(mg/l)
Alkalinity, Total
(As CaCO3)
(mg/l)
Sample Date Value Qual Value Qual Value Qual Value Qual Value Qual Value Qual Value Qual Value Qual Value Qual Value Qual Value Qual Value Qual Value Qual Value Qual
4909C_392 01/07/13 70.8 247 0.0414 J/J 17.0 4.0 26.8 ND(0.00136) U 0.41 11.0 2.2 ND(0.10) U 76.0 ND(260) U 193
4909C_398 01/07/13 70.0 244 0.0251 J/J 16.7 4.01 26.4 ND(0.00119) U 0.32 11.0 2.2 ND(0.10) U 76.0 335 213
4918A_483 12/20/12 98.5 352 0.0748 J+/J 25.7 6.46 44.7 0.000613 J/J ND(0.20) UJ 39.0 0.053 J/J ND(0.10) U 76.0 425 293
GW-18B_402 12/05/12 65.9 241 ND(0.10) U 18.6 /B 3.1 25.7 ND(0.001) U/J 0.39 21.0 3.0 0.05 J/J 77.0 310 166
GW-18B_405 12/06/12 65.8 240 ND(0.10) U 18.5 /B 3.48 26.7 /B 0.000649 J/J 0.40 22.0 2.9 ND(0.10) U 78.0 415 176
GW-18B_405_DUP-1 12/06/12 62.3 230 ND(0.10) U 18.1 /B 3.25 25.1 /B 0.000612 J/J 0.41 22.0 2.7 ND(0.10) U 78.0 176
GW-19B_401.5 12/13/12 68.5 230 ND(0.10) U 14.2 4.4 25.5 0.000638 J/J 0.53 11.0 1.7 ND(0.10) U 61.0 240 182
GW-19B_401.5_DUP-2 12/13/12 66.7 225 ND(0.10) U 14.2 4.26 25.1 0.000659 J/J 0.55 11.0 1.7 ND(0.10) U 62.0 260 186
GW-19B_405.5 12/13/12 67.9 228 ND(0.10) U 14.3 4.31 25.5 0.000821 J/J 0.55 11.0 1.7 ND(0.10) U 63.0 245 182
LA1-CW05_339 12/10/12 84.8 308 0.514 23.3 4.96 34.4 0.00079 J/J 0.30 31.0 3.2 ND(0.10) U 83.0 307 232
LA1-CW05_356 12/10/12 88.1 317 0.84 23.5 5.25 34.2 0.00451 0.26 31.0 3.2 ND(0.10) U 85.0 415 236
NH-C01-450_403 12/27/12 103 360 ND(0.10) U 24.8 5.46 37.3 ND(0.001) U ND(0.20) U 27.0 2.2 ND(0.10) U 88.0 470 290
NH-C01-450_447 12/27/12 109 378 0.0498 J/J 25.8 6.07 38.6 0.000475 J/J ND(0.20) U 27.0 1.7 ND(0.10) U 91.0 480 296
NH-C10-360_340 12/14/12 90.4 318 ND(0.10) U 22.3 /B 3.98 29.8 0.0017 1.4 23.0 2.5 ND(0.10) U 64.0 405 276
NH-C12-360_343 12/26/12 89.6 316 ND(0.10) U 22.5 4.76 32.9 0.000601 J/J 0.51 J-/BU 18.0 1.7 ND(0.10) U 67.0 415 270
NH-C13-385_363 12/12/12 66.6 229 ND(0.10) U 15.2 4.04 28.2 0.00155 1.5 14.0 3.3 ND(0.10) U 72.0 295 184
NH-C16-390_375 12/04/12 92.6 321 ND(0.10) U 21.8 /B 4.87 J- 31.4 0.000515 J/J 0.43 26.0 6.8 ND(0.10) U 74.0 400 252
NH-C17-339_313 01/02/13 84.7 305 ND(0.10) U 22.6 3.95 30.6 0.001 0.72 20.0 3.1 ND(0.10) U 58.0 475 268
NH-C18-365_348 12/07/12 98.5 343 ND(0.10) U 23.6 /B 4.53 31.9 0.00724 6.8 31.0 6.3 ND(0.10) U 80.0 525 275
NH-C19-360_349 12/21/12 108 368 ND(0.10) U 23.5 4.78 38.3 0.00172 1.4 33.0 12.0 J-/BU ND(0.10) U 69.0 485 278
NH-C20-380_361 12/19/12 84.5 289 ND(0.10) U 18.9 4.5 31.4 0.000634 J/J 0.43 22.0 6.9 ND(0.10) U 69.0 425 224
NH-C21-340_325 01/04/13 86.8 310 ND(0.10) U/J 22.6 4.21 29.2 0.023 21.0 23.0 3.3 0.047 J/J 66.0 380 244
NH-C21-340_325_DUP-4 01/04/13 85.6 303 ND(0.10) U 21.8 4.03 28.5 0.0234 21.0 23.0 3.3 0.053 J/J 66.0 375 244
NH-C23-400_343 12/28/12 93.6 322 ND(0.10) U 21.4 4.6 33.5 0.000797 J/J 0.42 25.0 7.4 ND(0.10) U 69.0 425 248
NH-C23-400_397 12/28/12 81.9 283 ND(0.10) U 19.1 4.24 30.3 0.000748 J/J 0.45 24.0 5.5 ND(0.10) U 75.0 405 210
AbbreviationsEPA = The United States Environmental Protection Agencymg/L = Milligram per liter
NT = Not TestedSM = Standard Methodµg/L = Microgram per liter
Validation QualifiersJ = The analyte was positively identified; the associated numerical value is the approximate concentration of the analyte in the sample. A minus sign (-) indicates the numerical value has a low bias. A plus sign (+) indicates the numerical value has a high bias.U = The analyte was analyzed for, but was not detected above the reported sample quantitation limit.UJ = The analyte was analyzed for but was not detected above the reported value. The reported quantitation limit is approximate.R The sample results are rejected. The presence or absence of the analyte cannot be verified. Rejected results are not usable for any purpose.
Laboratory QualifiersB = Compound is also detected in the laboratory method blank.J = Result is detected below the reporting limit or is an estimated concentration.
EPA 200.7 EPA 300.0
ND = Not Detected at the specific
X:\16000s\162830\3000\Phase I_Pre-Design Investigation Summary\02_tables\Table3b_Inorganic_BZone_rev1.xlsx Page 1 of 1

WellSample
Date
Sample
Depth
(feet)
Measured
Verical Flow
Depth
Region/
Zone
Trichloroethene
(µg/l)
Tetrachloroethene
(µg/l)
1,4-Dioxane
(µg/l)
Chromium VI
(µg/l)
NH-C16-390 10/08/09 345.0 DR 2 3.6 0.77 1.8 0.23
NH-C16-390 12/15/10 345.0 DR 2 16.0 1.4 3.1 0.83
NH-C16-390 12/04/12 343.0 A Zone 19.0 1.5 3.4 0.53
NH-C16-390 12/04/12 375.0 B Zone 24.0 2.0 1.3 0.43
NH-C18-365 10/19/09 236.2 DR 2 160 4.7 1.2 33.0
NH-C18-365 12/16/10 236.2 DR 2 130 11.0 3.3 51.0
NH-C18-365 10/25/11 236.2 DR 2 100 6.4 0.59 67.0
NH-C18-365 12/07/12 308.0 A Zone 70.0 2.5 1.6 8.1
NH-C18-365 12/07/12 348.0 B Zone 38.0 2.8 3.3 6.8
NH-C19-360 10/09/09 305.0 DR 2 95.0 2.0 ND 2.2
NH-C19-360 12/15/10 305.0 DR 2 94.0 5.8 1.6 1.9
NH-C19-360 10/27/11 305.0 DR 2 37.0 1.9 0.82 2.5
NH-C19-360 12/21/12 303.0 A Zone 42.0 1.7 1.8 1.5
NH-C19-360 12/21/12 349.0 B Zone 38.0 2.1 2.3 1.4
NH-C19-360 01/11/13 303.0 A Zone 69.0 2.0 NT NT NH-C19-360 01/11/13 313.0 A Zone 55.0 2.5 NT NT NH-C19-360 01/11/13 323.0 A Zone 45.0 3.3 NT NT NH-C19-360 01/11/13 333.0 A Zone 45.0 2.6 NT NT NH-C19-360 01/11/13 343.0 B Zone 46.0 2.5 NT NT NH-C19-360 01/11/13 349.0 B Zone 38.0 2.1 NT NT NH-C19-360 01/11/13 353.0 B Zone 44.0 2.2 NT NT NH-C20-380 10/09/09 325.0 DR 2 34.0 5.2 3.6 0.47
NH-C20-380 12/14/10 325.0 DR 2 38.0 5.1 4.9 0.43
NH-C20-380 10/26/11 325.0 DR 2 45.0 1.6 1.8 0.32
NH-C20-380 12/19/12 322.0 A Zone 46.0 1.3 1.6 0.48
NH-C20-380 12/19/12 361.0 B Zone 71.0 1.1 1.3 0.43
NH-C21-340 10/09/09 285.0 DR 2 170 4.6 1.5 3.0
NH-C21-340 12/17/10 285.0 DR 2 21.0 3.3 1.1 4.6
NH-C21-340 10/24/11 285.0 DR 2 20.0 1.8 ND 5.4
NH-C21-340 01/04/13 283.0 A Zone 15.0 0.51 2.1 19.0
NH-C21-340 01/04/13 325.0 B Zone 18.0 1.7 2.1 21.0
Abbreviations:DR 2 = Depth Region 2ND = not detectedNT = not tested
TABLE 4
COMPARISON OF RECENT ANALYTICAL RESULTS BY DEPTH REGION/ZONE
Phase 1 Pre-Design Investigation, NHOU Second Interim RemedyLos Angeles County, California
NT
NT
Downward
Downward
NT
X:\16000s\162830\3000\Phase I_Pre-Design Investigation Summary\02_tables\Table4_DepthRegionZone.xlsx Page 1 of 1

Well Date Tested
Top of
Screen
[feet bgs]
Bottom
of Screen
[feet bgs]
Geological unit
assignment
(estimated)
A/B zone
contact
[feet bgs]
Max Flow
Rate
[gpm]1
In/Out
Inflection
Depth
[feet bgs] Comments
NH-C05-460 1/17/2013 390 460 B Zone 349.33 0.128 N/AUpward flow between 390 and 398 feet bgs and below. Could not profile entire screened interval due to data cable length restriction.
NH-C10-280 12/12/2012 220 280 A Zone 320.74 -0.04 272 Downward flow between 242 and 280 feet bgs.
NH-C10-360 12/12/2012 310 360 A and B Zone 320.74 -0.21 342 Downward flow between 320 and 360 feet bgs. Greatest downward flow rate of any well tested.
NH-C16-320 12/10/2012 250 300 A and B Zone 359.61 -0.07 N/A No significant flow.NH-C16-390 12/10/2012 340 390 A Zone 359.61 -0.085 366 Downward flow between 358 and 390 feet bgs.NH-C19-290 1/28/2013 230 290 A Zone 337.5 -0.032 270 Downward flow between 260 and 280 feet bgs.NH-C19-360 1/28/2013 300 360 A and B Zone 337.5 -0.08 342 Downward flow between 310 and 360 feet bgs.NH-C23-310 1/17/2013 250 310 A Zone 340 0.165 294 Upward flow between 268 and 310 feet bgs.NH-C23-400 12/10/2012 340 400 B Zone 340 -0.09 366 Downward flow between 351 and 390 feet bgs.
Notes1. Negative values reflect downward flow, positive values reflect upward flow
Abreviationsbgs = below ground surface
TABLE 5
VERTICAL FLOW MEASUREMENT RESULTS
Phase 1 Pre-Design Investigation, NHOU Second Interim RemedyLos Angeles County, California
X:\16000s\162830\3000\Phase I_Pre-Design Investigation Summary\02_tables\Table5_EBFSummary.xlsx Page 1 of 1

Springer-Gelhar Bouwer-Rice
K (ft/day)1
K (ft/day)2
0.17 68.81 assume unconfined, 0.83 95.75 saturated thickness = bottom of 0.83 61.33 screen to water table1.25 86.631.67 61.330.17 85.35 assume unconfined, 0.17 76.07 saturated thickness = bottom 0.42 88.26 of screen to water table0.42 75.500.83 79.991.25 81.522.08 81.472.08 82.900.42 123.90 assume unconfined, 0.83 101.50 saturated thickness = bottom 0.83 98.39 of screen to water table2.50 110.400.42 48.71 unconfined, 0.83 43.42 saturated thickness = bottom of 1.67 41.34 A Zone to water table, 2.50 40.91 critically damped0.42 47.70 36.73 unconfined, 0.83 47.40 40.81 saturated thickness from bottom 2.08 37.18 40.33 of A zone to water table0.42 48.01 unconfined, 0.83 43.81 saturated thickness = from 1.67 50.74 bottom of A zone to water table, 2.50 40.30 critically damped0.42 105.30 assume unconfined, 0.83 83.68 saturated thickness = bottom of 1.67 74.58 screen to water table2.50 93.890.50 26.78 20.22 unconfined, 0.83 22.08 19.46 saturated thickness = bottom 1.67 23.93 17.37 of A zone to water table2.50 23.87 17.920.42 61.70 assume unconfined, 0.83 56.80 saturated thickness = bottom of 1.67 57.00 screen to water table1.67 56.000.42 43.62 37.91 unconfined, 1.25 34.65 46.45 saturated thickness = bottom of 1.67 35.39 48.34 A zone to water table0.42 37.26 unconfined, 0.42 52.64 saturated thickness = bottom of 0.83 68.68 A zone to water table, 1.67 43.34 critically damped2.50 34.420.42 114.30 assume unconfined, 0.83 64.26 saturated thickness = bottom of1.67 64.28 screen to water table1.67 63.000.42 75.60 assume unconfined, 0.83 75.00 saturated thickness = bottom of 1.67 82.00 screen to water table2.50 88.000.42 34.92 23.79 unconfined, 0.83 33.17 21.44 saturated thickness = bottom of 1.67 29.39 21.1 A zone to water table1.67 28.78 18.482.50 27.50 21.97
Notes:1. All K estimates assume no vertical anisotropy2. Additional analysis for non-oscillatory time-drawdown curves
A and B zone337.53603002/6/2013
1/29/2013 390 460 367.87 B zone
A zone3403102501/29/2013
A and B zone
A zone306.2250200
A zone
A zone286.03255185
1/29/2013
2/6/2013 230 290 337.5
1/30/2013
1/30/2013 340 390 359.61
1/30/2013
NH-C16-390
NH-C14-250
B Zone321.283803401/29/2013
A zone329.833102501/29/2013
A and B zone342.59385335
NH-C23-310
NH-C22-460
NH-C19-360
NH-C19-290
NH-C17-255
B Zone
NH-C13-385
NH-C12-280
NH-C10-280
NH-C09-310
NH-C03-380
1/29/2013
A zone326.172802101/30/2013
A zone320.74280220
NH-C02-325 1/4/2013 275 325 268.52
B ZoneNH-C01-450 1/3/2013 400 450 366.08
PNEUMATIC SLUG TEST RESULTS
Phase 1 Pre-Design Investigation, NHOU Second Interim RemedyLos Angeles County, California
TABLE 6
Screened in Comments
Analytical method
Test Date
A Zone/B
Zone
Contact
Cepth
[feet bgs]Well
Top of
Screen
[feet bgs]
Bottom of
Screen
[feet bgs]
Approximate
Displacement
[feet]
X:\16000s\162830\3000\Phase I_Pre-Design Investigation Summary\02_tables\Table6_SlugSummary.xlsx Page 1 of 1

FIGURES

#0
#0
#0
#0
#0
#0#0 #0
!
!
!
!
!
!
!!!! !
!!!
!!!
!
!
!
! !!!
! ! !!
!
!!
!
!!
!
!
!
!
!
!
!
!
!
!
!
!
!!
!
!
!
!!
!
!
!
!
!
!
!
!
!
!
!
!!!
!!!!!
!
4918A*1.9
NH-C24-3050.24 J/J
NH-C23-310253.0: 1.9263.0: 2.4273.0: 2.2283.0: 2.2293.0: 2.5303.0: 2
NH-C21-34015
NH-C21-26024
NH-C20-38046
NH-C19-360303.0: 69 J313.0: 55323.0: 45333.0: 45
NH-C19-290233.0: 79243.0: 76
253.0: 77 J263.0: 77273.0: 79283.0: 82
NH-C18-36570
NH-C17-3390.91
NH-C16-39019
NH-C14-2506.1
NH-C13-3857.7
NH-C12-3600.5 J/J
NHE-138
NH-C10-3603.2
4909C50
4919D 15
NH-C18-2700.59
GW-910/12: 13.0
GW-810/12: 4.6
GW-510/12: 0.8
GW-410/12: 4.7
GW-210/12: 6.6
GW-310/12: 14.0
GW-2110/12: ND(1.0)GW-20
10/12: ND(1.0)
3851M4/12: 22.0
NHE-87/12: 17.2
NHE-47/12: 13.0
GW-18A10/12: 9.2
3850AB9/12: 21.0
3831Q12/10: 92.0
3830S4/12: 5.7
4918B3/07: 36.6
GW-19A10/12: 170.0
4949C4/12: 1.7
NHE-77/12: 10.9
NHE-37/12: 79.0
LC1-CW0810/12: 0.6
LB6-CW103/07: 36.0
LB5-CW0310/12: 11.0
LA1-CW0910/12: 16.0
NHE-210/12: 120.0
PA1-MW64/12: 19.0
PA1-MW54/12: 14.0
PA1-MW34/12: 13.0
NH-VPB-083/10: 13.0
NH-VPB-064/12: 4.5
NH-VPB-054/12: 78.0
NH-VPB-024/12: 8.6
NH-C08-29510/11: 2.1
LC1-CW0310/12: ND(0.5)
GW-11-31610/12: 25.0
NH-C15-33012/10: 9.5
NH-C12-28010/11: 18.0
NH-C07-30010/11: ND(5.0)
NH-C02-2204/12: 7.9
LA1-CW03R3/07: 130.0
NH-VPB-074/12: 1.2
NH-C22-36012/10: 7.3
NH-C11-29512/10: 9.0
NH-C10-28010/11: 110
NH-C09-31010/11: 73.0
NH-C05-3204/12: 20.0
NH-C01-3254/12: 12.0
LC1-CW0610/12: 190.0
LA1-CW0710/12: 340.0
GW-610/12: 1.9
GW-110/12: 25.0
GW-2310/12: 1.8
GW-2210/12: 15.0
GW-1510/12: 15.0 GW-14B
10/12: 5.6
GW-14A10/12: 3.2
GW-1010/12: 15.0
GW-710/12: 12.0
PA1-MW44/12: 9.6
LB6-CW1712/07: 6.1
GW-16-27710/12: 52.0
GW-11-27310/12: 22.0
LB6-CW1610/12: 9.1
GW-12A-28410/11: 36.0
NH-VPB-10**11/07: 0.7
NH-C25-29011/11: 2.3
NH-C17-25510/11: 59.0
GW-17-28210/12: 460.0
LB6-CW091/97: 34.2
GW-16-31710/12: 47.0
NH-C16-32010/11: 7.8
NH-C15-24012/10: 14.0
NH-VPB-09**4/12: 0.5
§̈¦5
5
Former Lockheed Martin Facilities
Valhalla Memorial Park
Hewitt Pit (closed)
Former BendixFacility
Penrose Landfill (closed)
Newberry Landfill (closed)
Strathern Inert Landfill(active)
Victory-Vineland Landfill (closed)
Hawker Pacific
Strathern Elementary School
Tujunga Pit (closed)
Pacific Steel
Fleetwood Machine Products
PST-MW1PNS
PST-MW2PNS
100
100
100
100
5
10
10
10
?
?
25
25
25
25
50
50
50
50
50
5
525
25
10
25
50
4928A3/07: ND(0.5)
4928C3/07: ND(0.5)
474476
478
480
512
482
484
486
488
490
492494
496
510
498
502500
504
506
508
474
476
478480
512
482
484486488490492494496
510
498
502
500
504506
508
NHE-5
NHE-6
1aRJP 4088115718
7/2013
Trichloroethene Distributionin A Zone Groundwater
First Semiannual Sampling EventDecember 2012
AS SHOWN Phase I Pre-design InvestigationNorth Hollywood Operable UnitLos Angeles County, California
FIGURE
Prep
ared b
y: reu
ben.p
illsbu
ry F
riday
, Aug
ust 0
9, 20
13 4:
54:19
PMP:\
4088
\1157
18_N
HOU\
GIS\
Proje
cts\Ph
aseI\
PreD
esign
_Inve
stiga
tion\1
2Q4_
withC
urren
tValue
\Figu
re01a
_TCE
-A.m
xd
DRAWN:
REV:
CHECKED:
SCALE:
APPROVED:
DATE:
PROJECT NO:
DATE:
DCD
7/2013MDT
Aerial Photograph: DigitalGlobe, June 2009
EXPLANATION
0 1,500 3,000
Feet
±
Monitoring WellSampled December 2012
NHOU Extraction Well#0
Approximate BoundarySan Fernando ValleyInvestigation Area 1
J Estimated Value.
TrichloroetheneConcentrationin Groundwater (µg/L)Samples not collectedin December 2012indicated in italics.Recent sampling results are indicated in bold.Depths of multipledepth-discrete samples areindicated in feet belowtop of casing.
13
Line of Estimated EqualElevation of GroundwaterDecember 2012(Feet NAVD88)** Anomalous groundwater elevation data not used for contouring.
514
* Anomolous trichloroetheneconcentration, data not used for contouring
Trichloroethene ConcentrationIn Micrograms per Liter (µg/L)Groundwater Monitoring WellSampled in A Zone
<5!(
5 - 10!(
10 - 25!(
50 - 100!(
> 100 !(
25 - 50!(
*Isoconcentration lines are based on December 2012samples and may not reflect groundwater basindynamics resulting rom variable pumping schedulesor complexity due to multiple COC sources.
1025
100
Concentration Contours (µg/L)*Dashed Where Inferred
5 50

#0
!
!
!
!
!
!
!
!
!
!
!
!!
!
NH-C01-450403.0: 2.2
447.0: 0.56
NH-C21-34018
NH-C18-36538
NH-C13-3857.3
4918A*2.6
GW-19B401.5: 0.42 J/J405.5: 0.39 J/J
GW-18B402.0: 8.4405.0: 7.4
LA1-CW05339.0: 2
356.0: 2.5
NH-C23-400343.0: 58353.0: 80363.0: 80373.0: 81
383.0: 77 J393.0: 73397.0: 45
NH-C20-38071
NH-C19-360343.0: 46349.0: 38353.0: 44
NH-C17-3390.79
NH-C16-39024
NH-C12-3600.47 J/J
NH-C10-3603.4
4909C392.0: 2.7398.0: 3.6
LC1-CW0510/12: ND(0.5)
3851N4/12: 0.5
LB5-CW0210/12: ND(0.5)
NH-C02-3254/12: 3.1
NH-C24-41011/11: 0.4
NH-C22-46012/10: 7.2
NH-C05-4601/10: 120.0
LC1-CW0210/12: ND(0.5)
GW-16-34710/12: 35.0
GW-11-35210/12: 56.0
GW-12A-34910/12: 2.5
NH-C03-3804/12: 0.8
LB6-CW1412/06: 8.0
LB6-CW081/97: 7.3
§̈¦5
Former Lockheed Martin Facilities
Valhalla Memorial Park
Hewitt Pit (closed)Former BendixFacility
Penrose Landfill (closed)
Newberry Landfill (closed)
Strathern Inert Landfill (active)
Victory-Vineland Landfill (closed)
Hawker Pacific
Strathern Elementary School
Tujunga Pit (closed)
Pacific SteelFleetwood Machine Products
50
5
5
5
50
?
100
10
10
25
25
25
100
10
50
5
NHE-66.8
3/12
478
480
482
512
484
486
488
490
492494496
510
498
502500
504
506
508
478480482
512
484486488490492494496
510
498
502
500
504506
508
1bRJP 4088115718
7/2013
Trichloroethene Distributionin B Zone Groundwater
First Semiannual Sampling EventDecember 2012
AS SHOWN Phase I Pre-design InvestigationNorth Hollywood Operable UnitLos Angeles County, California
FIGURE
Prep
ared b
y: reu
ben.p
illsbu
ry F
riday
, Aug
ust 0
9, 20
13 4:
59:43
PMP:\
4088
\1157
18_N
HOU\
GIS\
Proje
cts\Ph
aseI\
PreD
esign
_Inve
stiga
tion\1
2Q4_
withC
urren
tValue
\Figu
re01b
_TCE
-B.m
xd
DRAWN:
REV:
CHECKED:
SCALE:
APPROVED:
DATE:
PROJECT NO:
DATE:
DCD
7/2013MDT
Aerial Photograph: DigitalGlobe, June 2009
EXPLANATION
Monitoring WellSampled December 2012TrichloroetheneConcentrationin Groundwater (µg/L)Samples not collectedin December 2012indicated in italics.Recent sampling results are indicated in bold.Depths of multipledepth-discrete samples areindicated in feet belowtop of casing.
8
* Anomalous trichloroetheneconcentration, result notused for contouring
Approximate BoundarySan Fernando ValleyInvestigation Area 1
NHOU Extraction Well#0
Line of Estimated EqualElevation of GroundwaterDecember 2012(Feet NAVD88)
514
J Estimated Value
Trichloroethene ConcentrationIn Micrograms per Liter (µg/L)Groundwater Monitoring WellSampled in B Zone
50 - 100!(
>100!(
5 - 10!(
10 - 25!(
25 - 50!(<5!(
0 1,500 3,000
Feet
±*Isoconcentration lines are based on December 2012samples and may not reflect groundwater basindynamics resulting rom variable pumping schedulesor complexity due to multiple COC sources.
1025
100
Concentration Contours (µg/L)*Dashed Where Inferred
5 50

#0
#0
#0
#0
#0
#0#0 #0
!
!
!
!
!
!
!!!! !
!!!
!!!
!
!
!
! !!!
! ! !!
!
!!
!
!!
!
!
!
!
!
!
!
!
!
!
!
!
!!
!
!
!
!!
!
!
!
!
!
!
!
!
!
!
!
!!!
!!
!
4918AND(0.5)
NH-C24-3051.6
NH-C23-310253.0: 1.7263.0: 2.1273.0: 2.4283.0: 2.5293.0: 2.4303.0: 2.3
NH-C21-3400.51
NH-C21-2600.76
NH-C20-3801.3
NH-C19-360303.0: 2
313.0: 2.5323.0: 3.3333.0: 2.6
NH-C19-290233.0: 2.1243.0: 1.6253.0: 1.9263.0: 1.7273.0: 2.1283.0: 2
NH-C18-3652.5
NH-C17-3391.7
NH-C16-3901.5
NH-C14-25016
NH-C13-3850.25 J/J
NH-C12-3601
NHE-12.6
NH-C10-3603.3
4909C14
4919D 0.55
NH-C18-270ND(0.5)
GW-910/12: 4.7
4918B3/07: 6.3
GW-19A10/12: 11.0
4949C4/12: 2.2
3851M4/12: 35.0
3850AB9/12: 100.0
NHE-87/12: 6.5
3830S4/12: 13.0NHE-3
7/12: 8.6
PA1-MW64/12: 69.0
PA1-MW34/12: 65.0
NH-VPB-024/12: 1.6
NH-C22-36012/10: ND(1.02)
LB6-CW103/07: 270.0
LA1-CW0910/12: 21.0
NH-VPB-074/12: 3.1
NH-VPB-064/12: 2.0
NH-C12-28010/11: 4.9
NH-C10-28010/11: 21
NH-C09-31010/11: 32.0
LB5-CW0310/12: 14.0
LA1-CW03R3/07: 200.0
NH-C16-32010/11: 12.0
NH-C11-29512/10: 9.7
NH-C08-29510/11: 4.6
NH-C07-30010/11: ND(0.5)
NH-C05-3204/12: 4.1
LA1-CW0710/12: 210.0
GW-710/12: 4.0
GW-610/12: 0.9
GW-510/12: ND(1.0)
GW-410/12: 0.7
GW-310/12: 8.2
GW-110/12: 2.5
GW-2210/12: 2.2
GW-810/12: 4.3
GW-210/12: 5.3
GW-2110/12: ND(1.0)
NHE-47/12: 4.2
GW-2310/12: 1.4
GW-2010/12: ND(1.0)
GW-18A10/12: 3.0
GW-1510/12: 4.0
GW-1010/12: 5.2
3831Q12/10: 5.5
GW-14B10/12: 10.0
GW-14A10/12: 2.1
NHE-77/12: 6.6
NHE-210/12: 21.0
PA1-MW54/12: 51.0PA1-MW44/12: 43.0
GW-17-28210/12: 23.0
GW-16-27710/12: 12.0
GW-11-27310/12: 11.0
LC1-CW0810/12: 7.9
GW-12A-28410/11: 6.6
NH-VPB-083/10: 1.9
NH-VPB-054/12: 3.6
NH-C25-29011/11: 24.0
NH-C01-3254/12: 61.0
LC1-CW0610/12: 12.0
LC1-CW0310/12: 5.6
LB6-CW1712/07: 99.5
LB6-CW1610/12: 26.0
NH-VPB-10**11/07: 0.1
NH-C17-25510/11: 5.1
NH-C15-24012/10: 8.8
NH-C02-2204/12: 0.4
GW-11-31610/12: 10.0
LB6-CW091/97: 370.0
NH-C15-33012/10: 6.7
GW-16-31710/12: 9.3
NH-VPB-09**4/12: 2.4
§̈¦5
100
25
Former Lockheed Martin Facilities
Valhalla Memorial Park
Hewitt Pit (closed)Former Bendix
Facility
Penrose Landfill (closed)
Newberry Landfill (closed)
Strathern InertLandfill (active)
Victory-Vineland Landfill (closed)
Hawker Pacific
Strathern Elementary School
Tujunga Pit (closed)
Pacific Steel
Fleetwood Machine Products
50
50
50
5
5
5
5
5
100
10
10
10
10
10
10
10
25
25
25
25
PST-MW1PNS
PST-MW2PNS
4928A1.8
4928C2.4
474476
478
480
512
482
484
486
488
490
492494
496
510
498
502500
504
506
508
474
476
478480
512
482
484486488490492494496
510
498
502
500
504506
508
NHE-5
2aRJP 4088115718
7/2013
Tetrachloroethene Distributionin A Zone Groundwater
First Semiannual Sampling EventDecember 2012
AS SHOWN Phase I Pre-design InvestigationNorth Hollywood Operable UnitLos Angeles County, California
FIGURE
Prep
ared b
y: reu
ben.p
illsbu
ry F
riday
, Aug
ust 0
9, 20
13 4:
58:57
PMP:\
4088
\1157
18_N
HOU\
GIS\
Proje
cts\Ph
aseI\
PreD
esign
_Inve
stiga
tion\1
2Q4_
withC
urren
tValue
\Figu
re02a
_PCE
-A.m
xd
DRAWN:
REV:
CHECKED:
SCALE:
APPROVED:
DATE:
PROJECT NO:
DATE:
DCD
7/2013MDT
Aerial Photograph: DigitalGlobe, June 2009
EXPLANATION
Monitoring WellSampled December 2012TetrachloroetheneConcentrationin Groundwater (µg/L)Samples not collectedin December 2012indicated in italics.Recent sampling results are indicated in bold.Depths of multipledepth-discrete samples areindicated in feet belowtop of casing.
6.2
J Estimated Value
Approximate BoundarySan Fernando ValleyInvestigation Area 1
Line of Estimated EqualElevation of GroundwaterDecember 2012(Feet NAVD88)** Anomalous groundwater elevation data not used for contouring
514
NHOU Extraction Well#0
* Anomaloustetrachloroetheneconcentation, data notused for contouring
Tetrachloroethene ConcentrationIn Micrograms per Liter (µg/L)Groundwater Monitoring WellSampled in A Zone
<5!(
5 - 10!( 50 - 100!(
>100!(10 - 25!(
25 - 50!(
0 1,500 3,000
Feet
±*Isoconcentration lines are based on December 2012samples and may not reflect groundwater basindynamics resulting rom variable pumping schedulesor complexity due to multiple COC sources.
1025
100
Concentration Contours (µg/L)*Dashed Where Inferred
5 50

#0
!
! !!
!
!
!
!
!
!
!
!
!
!
NH-C01-450403.0: 0.63
447.0: ND(0.5)
NH-C21-3401.7
NH-C18-3652.8
NH-C13-3850.15 J/J
4918AND(0.5)
GW-19B401.5: 0.22 J/J405.5: 0.18 J/J
GW-18B402.0: 0.31 J/J405.0: 0.29 J/J
LA1-CW05339.0: 6
356.0: 19
NH-C23-400343.0: 2
353.0: 2.5363.0: 2.5373.0: 2.2383.0: 2
393.0: 1.8397.0: 0.89
NH-C20-3801.1
NH-C19-360343.0: 2.5349.0: 2.1353.0: 2.2
NH-C17-3391.5
NH-C16-3902
NH-C12-3600.98
NH-C10-3602.2
4909C392.0: 0.18 J/J398.0: 0.37 J/J
NH-C24-41011/11: 1.0
3851N4/12: 2.3
GW-11-35210/12: 4.9
NH-C22-46012/10: ND(1.02)
LC1-CW0510/12: 0.8
GW-16-34710/12: 3.5
GW-12A-34910/12: ND(1.0)
LC1-CW0210/12: 0.7
LB5-CW0210/12: 3.8
NH-C05-4601/10: 1.2
NH-C03-3804/12: ND(0.5)
NH-C02-3254/12: 2.5
LB6-CW1412/06: 130.0
LB6-CW081/97: 91.5
§̈¦5
5
Former Lockheed Martin Facilities
Valhalla Memorial Park
Hewitt Pit (closed)Former BendixFacility
Penrose Landfill (closed)
Newberry Landfill (closed)
Strathern Inert Landfill (active)
Victory-Vineland Landfill (closed)
Hawker Pacific
Strathern Elementary School
Tujunga Pit (closed)
Pacific SteelFleetwood Machine Products
50
100
1025
NHE-63.1
3/12
478
480
482
512
484
486
488
490
492494496
510
498
502500
504
506
508
478480482
512
484486488490492494496
510
498
502
500
504506
508
2bRJP 4088115718
7/2013
Tetrachloroethene Distributionin B Zone Groundwater
First Semiannual Sampling EventDecember 2012
AS SHOWN Phase I Pre-design InvestigationNorth Hollywood Operable UnitLos Angeles County, California
FIGURE
Prep
ared b
y: reu
ben.p
illsbu
ry F
riday
, Aug
ust 0
9, 20
13 4:
58:15
PMP:\
4088
\1157
18_N
HOU\
GIS\
Proje
cts\Ph
aseI\
PreD
esign
_Inve
stiga
tion\1
2Q4_
withC
urren
tValue
\Figu
re02b
_PCE
-B.m
xd
DRAWN:
REV:
CHECKED:
SCALE:
APPROVED:
DATE:
PROJECT NO:
DATE:
DCD
7/2013MDT
Aerial Photograph: DigitalGlobe, June 2009
EXPLANATION
Monitoring WellSampled December 2012
NHOU Extraction Well#0
Approximate BoundarySan Fernando ValleyInvestigation Area 1
TetrachloroetheneConcentrationin Groundwater (µg/L)Samples not collectedin December 2012indicated in italics.Recent sampling results are indicated in bold.Depths of multipledepth-discrete samples areindicated in feet belowtop of casing.
140
J Estimated Value
Line of Estimated EqualElevation of GroundwaterDecember 2012(Feet NAVD88)
514
Tetrachloroethene ConcentrationIn Micrograms per Liter (µg/L)Groundwater Monitoring WellSampled in B Zone
5 - 10!(
10 - 25!(
25 - 50!(<5!(
50 - 100!(
>100!(
0 1,500 3,000
Feet
±*Isoconcentration lines are based on December 2012samples and may not reflect groundwater basindynamics resulting rom variable pumping schedulesor complexity due to multiple COC sources.
1025
100
Concentration Contours (µg/L)*Dashed Where Inferred
5 50

#*
#*
#*
#*
#*
#*
#* #*
!
!
!
!
!
!
!!!! !
!!!
!!!
!
!
!
! !!!
! ! !!
!
!!
!
!!
!
!
!
!
!
!
!
!
!
!
!
!
!!
!
!
!
!!
!
!
!
!
!
!
!
!
!
!
!
!!!
!
4918A16
NH-C24-3050.89
NH-C23-3102.7
NH-C21-3402.1
NH-C21-2600.86
NH-C20-3801.6
NH-C19-3601.8
NH-C19-290ND(0.76)
NH-C18-3651.6
NH-C17-3391.2
NH-C16-3903.4
NH-C14-250ND(0.44)
NH-C13-385ND(0.14)
NH-C12-3601.2
NHE-13.2
NH-C10-3601.6
4909CND(0.27)
4919D 0.67
NH-C18-270ND(0.24)
NHE-37/12: 2.0
PA1-MW64/12: 1.7
NHE-87/12: 1.1NH-VPB-02
10/11: ND(0.5)
NH-C11-29512/10: ND(0.8)
LB6-CW103/07: 1.7
LA1-CW03R3/07: 1.5
GW-710/12: 5.8
GW-510/12: 38.0
GW-410/12: 34.0
GW-110/12: 27.0
NHE-77/12: 1.3
NHE-210/12: 4.6
GW-910/12: 6.7
GW-810/12: 8.0
GW-610/12: 3.0
GW-310/12: 11.0 GW-2
10/12: 6.1
GW-2310/12: 2.2
GW-2010/12: 22.0
PA1-MW54/12: ND(1.0)
PA1-MW44/12: ND(1.0)
PA1-MW34/12: 1.4
GW-2210/12: 3.7
GW-2110/12: 15.0
GW-1510/12: 5.9
GW-14A10/12: 4.7
GW-1010/12: 4.2
3830S4/12: 2.5
NHE-47/12: 1.1
4918B3/07: 5.2
GW-19A10/12: 2.8
GW-18A10/12: 7.4
GW-14B10/12: 7.2
LC1-CW084/12: 3.0
LB6-CW164/12: ND(1.0)
LB6-CW094/12: 0.6
LB5-CW034/11: 4.5
LA1-CW074/12: 1.3
3850AB4/12: 1.3
3831Q12/10: 0.8
NH-VPB-074/12: ND(100.0)
NH-VPB-0510/11: ND(0.5)
GW-17-28210/12: 29.0
GW-16-31710/12: 6.4
NH-C22-36012/10: ND(0.8)
NH-C15-24012/10: ND(0.8)
NH-C05-3204/11: 3.0
NH-C01-3254/12: ND(100.0)
LC1-CW064/12: 1.2
LC1-CW034/12: 1.7
LA1-CW0912/10: 1.4
GW-12A-28410/11: 4.5
GW-11-31610/12: 8.3
NH-C10-28010/11: 1.9
NH-C09-31010/11: 7.0 NH-C07-300
10/11: 28.0
LB6-CW174/12: 0.7
NH-C25-29011/11: 4.5
NH-C17-25510/11: 2.2
NH-C12-28010/11: 1.1
NH-C08-29510/11: 1.4
4949C12/06: ND(2.0)
3851M6/06: ND(2.0)
NH-VPB-10**12/04: ND(0.5)
NH-VPB-064/12: ND(100.0)
NH-C02-22010/11: ND(0.5)
NH-VPB-0812/06: ND(20.0)
NH-C16-32010/11: 1.6
NH-C15-33012/10: ND(0.8)
GW-16-27710/12: 8.7
GW-11-27310/12: 6.6
NH-VPB-09**10/98: ND(5.0)
§̈¦5
5
5
11
1
1
20
3
Former Lockheed Martin Facilities
Valhalla Memorial Park
Hewitt Pit (closed)
Former BendixFacility
Penrose Landfill (closed)
Newberry Landfill (closed)
Strathern Inert Landfill (active)
Victory-Vineland Landfill (closed)
Hawker Pacific
Strathern Elementary School
Tujunga Pit (closed)
Pacific Steel
Fleetwood Machine Products
1
1
20
3
10
10
1010
3
PST-MW1PNS
PST-MW2PNS
NHE-5
NHE-6
474476
478
480
512
482
484
486
488
490
492494
496
510
498
502500
504
506
508
474
476
478480
512
482
484486488490492494496
510
498
502
500
504506
508
3aRJP 4088115718
7/2013
1,4-Dioxane Distributionin A Zone Groundwater
First Semiannual Sampling EventDecember 2012
AS SHOWN Phase I Pre-design InvestigationNorth Hollywood Operable UnitLos Angeles County, California
FIGURE
Prep
ared b
y: reu
ben.p
illsbu
ry F
riday
, Aug
ust 0
9, 20
13 4:
55:36
PMP:\
4088
\1157
18_N
HOU\
GIS\
Proje
cts\Ph
aseI\
PreD
esign
_Inve
stiga
tion\1
2Q4_
withC
urren
tValue
\Figu
re03a
_Diox
-A.m
xd
DRAWN:
REV:
CHECKED:
SCALE:
APPROVED:
DATE:
PROJECT NO:
DATE:
DCD
7/2013MDT
Aerial Photograph: DigitalGlobe, June 2009
EXPLANATION
Monitoring WellSampled December 2012
Approximate BoundarySan Fernando ValleyInvestigation Area 1
1,4-DioxaneConcentrationin Groundwater (µg/L)Samples not collectedin December 2012indicated in italics.Recent sampling results are indicated in bold.Depths of multipledepth-discrete samples areindicated in feet belowtop of casing.
4.2
NHOU Extraction Well#0
J Estimated Value
Line of Estimated EqualElevation of GroundwaterDecember 2012(Feet NAVD88)** Anomalous groundwater elevation data not used for contouring.
514
1,4-Dioxane ConcentrationIn Micrograms per Liter (µg/L)Groundwater Monitoring WellSampled in A Zone
5 - 10!(
<1!(
1 - 5!( >20!(
10 - 20!(
0 1,500 3,000
Feet
±*Isoconcentration lines are based on December 2012samples and may not reflect groundwater basindynamics resulting rom variable pumping schedulesor complexity due to multiple COC sources.
Concentration Contours (µg/L)*Dashed Where Inferred
1013 20

#0
!
! !!
!
!
!
!
!
!
!
!
!
!
NH-C01-450403.0: 1.8447.0: 1.9
NH-C21-3402.1
NH-C18-3653.3 J
NH-C13-385ND(0.16)
4918A8.7
GW-19B401.5: ND(0.07)405.5: ND(0.1)
GW-18B402.0: ND(0.38)
405.0: 0.41
LA1-CW05339.0: 1.8
356.0: 1.9 J
NH-C23-400343.0: 2.2397.0: 1.4
NH-C20-3801.3
NH-C19-3602.3
NH-C17-3391.2
NH-C16-3901.3
NH-C12-3600.86
NH-C10-3601.5
4909C392.0: ND(0.13)398.0: ND(0.14)
LB6-CW144/12: 1.0LC1-CW05
4/12: 0.4
LB6-CW084/12: 0.6
LB5-CW024/12: 1.5
NH-C24-41012/10: ND(0.8)
NH-C22-46012/10: ND(0.8)
NH-C03-3804/11: ND(1.0)
NH-C02-32510/11: ND(0.5)
LC1-CW024/12: 1.0
GW-16-34710/12: 3.3
GW-11-35210/12: 3.6
GW-12A-34910/12: 3.1
3851N12/04: ND(2.0)
NH-C05-46010/06: ND(20.0)
§̈¦53
13
Former Lockheed Martin Facilities
Valhalla Memorial Park
Hewitt Pit (closed)Former BendixFacility
Penrose Landfill (closed)
Newberry Landfill (closed)Strathern Inert Landfill (active)
Victory-Vineland Landfill (closed)
Hawker Pacific
Strathern Elementary School
Tujunga Pit (closed)
Pacific Steel
Fleetwood MachineProducts
1
1
13
3
NHE-6ND3/12
478
480
482
512
484
486
488
490
492494496
510
498
502500
504
506
508
478480482
512
484486488490492494496
510
498
502
500
504506
508
3bRJP 4088115718
7/2013
1,4-Dioxane Distributionin B Zone Groundwater
First Semiannual Sampling EventDecember 2012
AS SHOWN Phase 1 Pre-design InvestigationNorth Hollywood Operable UnitLos Angeles County, California
FIGURE
Prep
ared b
y: reu
ben.p
illsbu
ry F
riday
, Aug
ust 0
9, 20
13 4:
57:38
PMP:\
4088
\1157
18_N
HOU\
GIS\
Proje
cts\Ph
aseI\
PreD
esign
_Inve
stiga
tion\1
2Q4_
withC
urren
tValue
\Figu
re03b
_Diox
-B.m
xd
DRAWN:
REV:
CHECKED:
SCALE:
APPROVED:
DATE:
PROJECT NO:
DATE:DCD
7/2013MDT
Aerial Photograph: DigitalGlobe, June 2009
Monitoring WellSampled December 2012
J Estimated Value.Analyte Detected at a LevelLess Than the ReportingLimit (RL) and Greater Than or Equal to the MethodDetection Limit (MDL)
EXPLANATION
1,4-DioxaneConcentrationin Groundwater (µg/L)Samples not collectedin December 2012indicated in italics.Recent sampling results are indicated in bold.Depths of multipledepth-discrete samples areindicated in feet belowtop of casing.
1.0
Line of Estimated EqualElevation of Groundwaterin Feet Relative to MeanSea Level
514
Approximate BoundarySan Fernando ValleyInvestigation Area 1
NHOU Extraction Well#0
Concentration Contours (µg/L)*1 3
1,4-Dioxane ConcentrationIn Micrograms per Liter (µg/L)Groundwater Monitoring WellSampled in B Zone
<1!( 1 - 5!(
0 1,500 3,000
Feet
±*Isoconcentration lines are based on December 2012samples and may not reflect groundwater basindynamics resulting rom variable pumping schedulesor complexity due to multiple COC sources.

#0
#0
#0
#0
#0
#0#0 #0
!
!
!
!
!
!
!!!! !
!!!
!!!
!
!
!
! !!!
! ! !!
!
!!
!
!!
!
!
!
!
!
!
!
!
!
!
!
!
!!
!
!
!
!!
!
!
!
!
!
!
!
!
!
!
!
!!!
!4918AND(0.2)
NH-C24-3050.8
NH-C23-3100.96
NH-C21-34019
NH-C21-26015
NH-C20-3800.48
NH-C19-3601.5
NH-C19-2902.4
NH-C18-3658.1
NH-C17-3390.68
NH-C16-3900.53
NH-C14-2502.7
NH-C13-3851.4
NH-C12-3600.58
NHE-10.2 J/J
NH-C10-3601.4
4909CND(0.2)
4919D ND(0.2)
NH-C18-2702.1
NH-VPB-064/12: 1.2
GW-610/12: 1.2
4918B3/07: ND(1.0)
GW-910/12: 0.6
GW-810/12: 0.9
GW-510/12: 9.0
GW-410/12: 31.0
GW-2310/12: 1.0
GW-1010/12: 0.8
NHE-37/12: 33.8
GW-2110/12: 15.0GW-20
10/12: 13.0
GW-19A10/12: 66.0
GW-1510/12: 1.5
3851M10/12: 1.4
3850AB9/12: 5.8
3831Q12/10: 3.2
NHE-87/12: 0.6
NHE-210/12: 44.0
LB6-CW103/07: ND(0.3)
LB6-CW094/12: ND(1.0)
3830S4/12: ND(1.0)
NHE-77/12: 1.0NHE-4
7/12: 4.0
PA1-MW54/12: 1.7
PA1-MW44/12: 1.3
PA1-MW34/12: 1.4
GW-710/12: 5.9
GW-310/12: 520.0
GW-210/12: 33.0
GW-110/12: 10,000.0
GW-2210/12: 200.0
GW-18A10/12: 0.9
NH-VPB-10**11/07: ND(0.2)
NH-VPB-083/10: 2.9
NH-VPB-054/12: 4.3
LA1-CW03R3/07: ND(0.3)
PA1-MW64/12: 1.5
GW-14B10/12: 74.0
GW-11-27310/12: 17.0
NH-C11-29512/10: 7.0
LB6-CW174/12: 1.6
NH-VPB-074/12: 0.9
NH-VPB-024/12: 3.1
NH-C10-28010/11: 1.3
LC1-CW0810/12: ND(1.0)
LC1-CW0610/12: 0.6
LC1-CW0310/12: 0.4
LB6-CW1610/12: 0.1
LB5-CW0310/12: 1.4
LA1-CW0710/12: 0.7
GW-14A10/12: ND(1.0)
NH-C17-25510/11: 3.2
NH-C15-24012/10: 4.1
NH-C09-31010/11: 1.8
NH-C07-30010/11: 8.8
NH-C05-3204/12: 1.3
NH-C02-2204/12: 2.8
GW-17-28210/12: 230.0
GW-16-27710/12: 21.0
NH-C25-29011/11: 0.6
NH-C22-36012/10: 0.6
NH-C12-28010/11: 0.8
NH-C08-29510/11: 0.7
NH-C01-3254/12: 0.1
GW-12A-28410/11: 23.0
4949C12/06: 1.2
LA1-CW096/06: 1.8
NH-C16-32010/11: 0.5
NH-C15-33012/10: 1.9
GW-16-31710/12: 0.6
GW-11-31610/12: 0.6
NH-VPB-09**4/12: ND(0.02)
§̈¦5
50
Former Lockheed Martin Facilities
ValhallaMemorial Park
Hewitt Pit (closed)
Former BendixFacility
Penrose Landfill (closed)
Newberry Landfill (closed)
Strathern Inert Landfill (active)
Victory-Vineland Landfill (closed)
Hawker Pacific
Strathern Elementary School
Tujunga Pit (closed)
Pacific Steel
Fleetwood Machine Products
50
5
5
5
10
1025
100PST-MW1P
NS
PST-MW2PNS
474476
478
480
512
482
484
486
488
490
492494
496
510
498
502500
504
506
508
474
476
478480
512
482
484486488490492494496
510
498
502
500
504506
508
NHE-5
NHE-6
4aRJP 4088115718
7/2013
Chromium VI Distributionin A Zone Groundwater
First Semiannual Sampling EventDecember 2012
AS SHOWN Phase I Pre-design InvestigationNorth Hollywood Operable UnitLos Angeles County, California
FIGURE
Prep
ared b
y: reu
ben.p
illsbu
ry F
riday
, Aug
ust 0
9, 20
13 4:
56:24
PMP:\
4088
\1157
18_N
HOU\
GIS\
Proje
cts\Ph
aseI\
PreD
esign
_Inve
stiga
tion\1
2Q4_
withC
urren
tValue
\Figu
re04a
_Cr6-
A.mxd
DRAWN:
REV:
CHECKED:
SCALE:
APPROVED:
DATE:
PROJECT NO:
DATE:
DCD
7/2013MDT
Aerial Photograph: DigitalGlobe, June 2009
EXPLANATION
Monitoring WellSampled December 2012
Approximate BoundarySan Fernando ValleyInvestigation Area 1
Line of Estimated EqualElevation of GroundwaterDecember 2012(Feet NAVD88)** Anomalous groundwater elevation data not used for contouring.
514
J Estimated Value.
Chromium VIConcentrationin Groundwater (µg/L)Samples not collectedin December 2012indicated in italics.Recent sampling results are indicated in bold.Depths of multipledepth-discrete samples areindicated in feet belowtop of casing.
1.8
NHOU Extraction Well#0
Chromium VI ConcentrationIn Micrograms per Liter (µg/L)Groundwater Monitoring WellSampled in A Zone
5 - 10!(
50 - 100!(
<1!( 25 - 50!(
10 - 25!(
>100!(
1 - 5!(
0 1,500 3,000
Feet
±*Isoconcentration lines are based on December 2012samples and may not reflect groundwater basindynamics resulting rom variable pumping schedulesor complexity due to multiple COC sources.
1025
100
Concentration Contours (µg/L)*Dashed Where Inferred
5 50

#0
!
! !!
!
!
!
!
!
!
!
!
!
!
NH-C01-450403.0: ND(0.2)447.0: ND(0.2)
NH-C21-34021
NH-C18-3656.8
NH-C13-3851.5
4918AND(0.2)
GW-19B401.5: 0.55405.5: 0.55
GW-18B402.0: 0.39405.0: 0.41
LA1-CW05339.0: 0.3356.0: 0.26
NH-C23-400343.0: 0.42397.0: 0.45
NH-C20-3800.43
NH-C19-3601.4
NH-C17-3390.72
NH-C16-3900.43
NH-C12-3600.51 U/J-
NH-C10-3601.4
4909C392.0: 0.41398.0: 0.32
LB6-CW144/12: ND(1.0)
LC1-CW0510/12: ND(1.0)
LB6-CW084/12: ND(1.0)
GW-16-34710/12: ND(1.0)
LC1-CW0210/12: ND(1.0)
LB5-CW0210/12: ND(1.0)
GW-12A-34910/12: 0.5
GW-11-35210/12: 4.9
NH-C24-41011/11: 0.5
NH-C03-3804/12: 2.7
NH-C02-3254/12: 1.1
NH-C22-46012/10: 0.1
NH-C05-4601/10: 0.2
3851N12/04: 0.5
§̈¦5
Former Lockheed Martin Facilities
Valhalla Memorial Park
Hewitt Pit (closed)Former BendixFacility
Penrose Landfill (closed)
Newberry Landfill (closed)
Strathern Inert Landfill (active)
Victory-Vineland Landfill (closed)
Hawker Pacific
Strathern Elementary School
Tujunga Pit (closed)
Pacific SteelFleetwood Machine Products
510
NHE-63.2
3/12
478
480
482
512
484
486
488
490
492494496
510
498
502500
504
506
508
478480482
512
484486488490492494496
510
498
502
500
504506
508
4bRJP 4088115718
7/2013
Chromium VI Distributionin B Zone Groundwater
First Semiannual Sampling EventDecember 2012
AS SHOWN Phase 1 Pre-design InvestigationNorth Hollywood Operable UnitLos Angeles County, California
FIGURE
Prep
ared b
y: reu
ben.p
illsbu
ry F
riday
, Aug
ust 0
9, 20
13 4:
56:58
PMP:\
4088
\1157
18_N
HOU\
GIS\
Proje
cts\Ph
aseI\
PreD
esign
_Inve
stiga
tion\1
2Q4_
withC
urren
tValue
\Figu
re04b
_Cr6-
B.mxd
DRAWN:
REV:
CHECKED:
SCALE:
APPROVED:
DATE:
PROJECT NO:
DATE:
DCD
7/2013MDT
Aerial Photograph: DigitalGlobe, June 2009
EXPLANATION
Line of Estimated EqualElevation of Groundwaterin Feet Relative to MeanSea Level
514
Approximate BoundarySan Fernando ValleyInvestigation Area 1
Chromium VI ConcentrationIn Micrograms per Liter (µg/L)Groundwater Monitoring WellSampled in B Zone
<1!(
1 - 5!(
>5!(
NHOU Extraction Well#0
J Estimated Value
Chromium VIConcentrationin Groundwater (µg/L)Samples not collectedin December 2012indicated in italics.Recent sampling results are indicated in bold.Depths of multipledepth-discrete samples areindicated in feet belowtop of casing.
0.5
Monitoring WellSampled December 2012
0 1,500 3,000
Feet
±*Isoconcentration lines are based on December 2012samples and may not reflect groundwater basindynamics resulting rom variable pumping schedulesor complexity due to multiple COC sources.
Concentration Contours (µg/L)*Dashed Where Inferred
5 10

ATTACHMENT A
Inorganic Groundwater Parameters

X:\16000s\162830\3000\Phase I_Pre-Design Investigation Summary\04_ATT A\Figures A1_A3.xlsA-1 8/9/2013
INORGANIC GROUNDWATER PARAMETERS A AND B ZONE WELLS
Phase I Pre-Design INvestigation NHOU Second Interim Remedy
Project No.: 162830
A-1
Date: 08/09/13 By: DAH
Figure

X:\16000s\162830\3000\Phase I_Pre-Design Investigation Summary\04_ATT A\Figures A1_A3.xlsA-2 8/9/2013
INORGANIC GROUNDWATER PARAMETERS A ZONE WELLS
Phase I Pre-Design INvestigation NHOU Second Interim Remedy
Project No.: 162830
A-2
Date: 08/09/13 By: DAH
Figure

X:\16000s\162830\3000\Phase I_Pre-Design Investigation Summary\04_ATT A\Figures A1_A3.xlsA-3 8/9/2013
INORGANIC GROUNDWATER PARAMETERS B ZONE WELLS
Phase I Pre-Design INvestigation NHOU Second Interim Remedy
Project No.: 162830
A-3
Date: 08/09/13 By: DAH
Figure

ATTACHMENT B
Pneumatic Slug Test Curves

0.1 1. 10. 100.-0.2
0.
0.2
0.4
0.6
0.8
Time (sec)
Dis
pla
cem
ent (f
t)
WELL TEST ANALYSIS
Data Set: C:\...\NH-C01-450-10psi-1.aqtDate: 03/11/13 Time: 10:49:57
PROJECT INFORMATION
Company: AMECLocation: NHOUTest Well: NH-C01-450Test Date: 12/3/13
AQUIFER DATA
Saturated Thickness: 175.8 ft Anisotropy Ratio (Kz/Kr): 1.
WELL DATA (NH-C01-450)
Initial Displacement: 0.993 ft Static Water Column Height: 175.8 ftTotal Well Penetration Depth: 175.8 ft Screen Length: 50. ftCasing Radius: 0.1667 ft Well Radius: 0.25 ft
SOLUTION
Aquifer Model: Unconfined Solution Method: Springer-Gelhar
K = 61.33 ft/day Le = 117.8 ft
Well screened in the B Zone

0.1 1. 10. 100.-0.4
0.08
0.56
1.04
1.52
2.
Time (sec)
Dis
pla
cem
ent (f
t)
WELL TEST ANALYSIS
Data Set: C:\...\NH-C01-450-15psi-2.aqtDate: 03/11/13 Time: 10:49:49
PROJECT INFORMATION
Company: AMECLocation: NHOUTest Well: NH-C01-450Test Date: 12/3/13
AQUIFER DATA
Saturated Thickness: 175.8 ft Anisotropy Ratio (Kz/Kr): 1.
WELL DATA (NH-C01-450)
Initial Displacement: 1.22 ft Static Water Column Height: 175.8 ftTotal Well Penetration Depth: 175.8 ft Screen Length: 50. ftCasing Radius: 0.1667 ft Well Radius: 0.25 ft
SOLUTION
Aquifer Model: Unconfined Solution Method: Springer-Gelhar
K = 86.63 ft/day Le = 107.4 ft
Well screened in the B Zone

0.1 1. 10. 100. 1000.-0.3
0.16
0.62
1.08
1.54
2.
Time (sec)
Dis
pla
cem
ent (f
t)
WELL TEST ANALYSIS
Data Set: C:\...\NH-C01-450-20psi-1.aqtDate: 03/11/13 Time: 10:49:40
PROJECT INFORMATION
Company: AMECLocation: NHOUTest Well: NH-C01-450Test Date: 12/3/13
AQUIFER DATA
Saturated Thickness: 175.8 ft Anisotropy Ratio (Kz/Kr): 1.
WELL DATA (NH-C01-450)
Initial Displacement: 1.692 ft Static Water Column Height: 175.8 ftTotal Well Penetration Depth: 175.8 ft Screen Length: 50. ftCasing Radius: 0.1667 ft Well Radius: 0.25 ft
SOLUTION
Aquifer Model: Unconfined Solution Method: Springer-Gelhar
K = 61.33 ft/day Le = 107.4 ft
Well screened in the B Zone
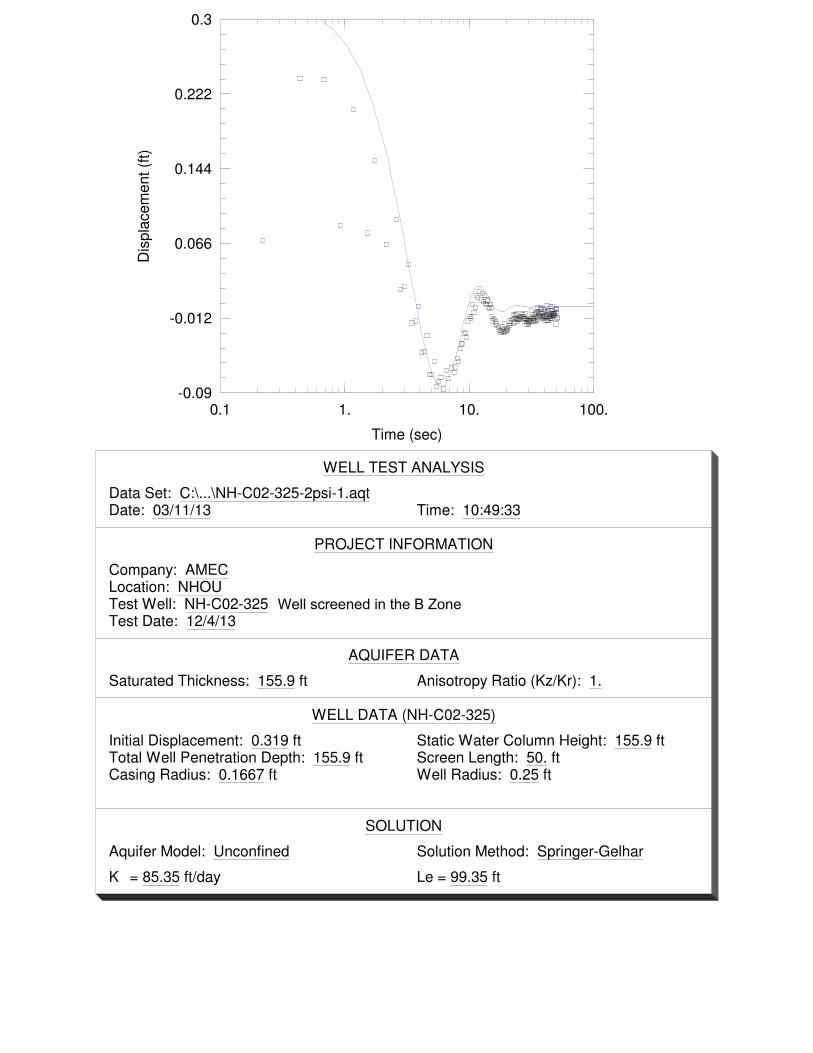
0.1 1. 10. 100.-0.09
-0.012
0.066
0.144
0.222
0.3
Time (sec)
Dis
pla
cem
ent (f
t)
WELL TEST ANALYSIS
Data Set: C:\...\NH-C02-325-2psi-1.aqtDate: 03/11/13 Time: 10:49:33
PROJECT INFORMATION
Company: AMECLocation: NHOUTest Well: NH-C02-325Test Date: 12/4/13
AQUIFER DATA
Saturated Thickness: 155.9 ft Anisotropy Ratio (Kz/Kr): 1.
WELL DATA (NH-C02-325)
Initial Displacement: 0.319 ft Static Water Column Height: 155.9 ftTotal Well Penetration Depth: 155.9 ft Screen Length: 50. ftCasing Radius: 0.1667 ft Well Radius: 0.25 ft
SOLUTION
Aquifer Model: Unconfined Solution Method: Springer-Gelhar
K = 85.35 ft/day Le = 99.35 ft
Well screened in the B Zone

0.1 1. 10. 100.-0.08
-0.004
0.072
0.148
0.224
0.3
Time (sec)
Dis
pla
cem
ent (f
t)
WELL TEST ANALYSIS
Data Set: C:\...\NH-C02-325-2psi-2.aqtDate: 03/11/13 Time: 10:49:26
PROJECT INFORMATION
Company: AMECLocation: NHOUTest Well: NH-C02-325Test Date: 12/4/13
AQUIFER DATA
Saturated Thickness: 155.9 ft Anisotropy Ratio (Kz/Kr): 1.
WELL DATA (NH-C02-325)
Initial Displacement: 0.294 ft Static Water Column Height: 155.9 ftTotal Well Penetration Depth: 155.9 ft Screen Length: 50. ftCasing Radius: 0.1667 ft Well Radius: 0.25 ft
SOLUTION
Aquifer Model: Unconfined Solution Method: Springer-Gelhar
K = 76.07 ft/day Le = 108.9 ft
Well screened in the B Zone

0.1 1. 10. 100.-0.2
-0.08
0.04
0.16
0.28
0.4
Time (sec)
Dis
pla
cem
ent (f
t)
WELL TEST ANALYSIS
Data Set: C:\...\NH-C02-325-5psi-1.aqtDate: 03/11/13 Time: 10:49:18
PROJECT INFORMATION
Company: AMECLocation: NHOUTest Well: NH-C02-325Test Date: 12/4/13
AQUIFER DATA
Saturated Thickness: 153.9 ft Anisotropy Ratio (Kz/Kr): 1.
WELL DATA (NH-C02-325)
Initial Displacement: 0.339 ft Static Water Column Height: 155.9 ftTotal Well Penetration Depth: 155.9 ft Screen Length: 50. ftCasing Radius: 0.1667 ft Well Radius: 0.25 ft
SOLUTION
Aquifer Model: Unconfined Solution Method: Springer-Gelhar
K = 88.26 ft/day Le = 123.8 ft
Well screened in the B Zone

0.1 1. 10. 100.-0.2
-0.08
0.04
0.16
0.28
0.4
Time (sec)
Dis
pla
cem
ent (f
t)
WELL TEST ANALYSIS
Data Set: C:\...\NH-C02-325-5psi-2.aqtDate: 03/11/13 Time: 10:49:10
PROJECT INFORMATION
Company: AMECLocation: NHOUTest Well: NH-C02-325Test Date: 12/4/13
AQUIFER DATA
Saturated Thickness: 155.9 ft Anisotropy Ratio (Kz/Kr): 1.
WELL DATA (NH-C02-325)
Initial Displacement: 0.458 ft Static Water Column Height: 155.9 ftTotal Well Penetration Depth: 155.9 ft Screen Length: 50. ftCasing Radius: 0.1667 ft Well Radius: 0.25 ft
SOLUTION
Aquifer Model: Unconfined Solution Method: Springer-Gelhar
K = 75.5 ft/day Le = 103. ft
Well screened in the B Zone

0.001 0.01 0.1 1.-0.3
-0.08
0.14
0.36
0.58
0.8
Time (min)
Dis
pla
cem
ent (f
t)
WELL TEST ANALYSIS
Data Set: C:\...\NH-C02-325-10psi-1.aqtDate: 03/11/13 Time: 10:49:03
PROJECT INFORMATION
Company: AMECLocation: NHOUTest Well: NH-C02-325Test Date: 12/4/13
AQUIFER DATA
Saturated Thickness: 155.9 ft Anisotropy Ratio (Kz/Kr): 1.
WELL DATA (NH-C02-325)
Initial Displacement: 0.832 ft Static Water Column Height: 155.9 ftTotal Well Penetration Depth: 155.9 ft Screen Length: 50. ftCasing Radius: 0.1667 ft Well Radius: 0.25 ft
SOLUTION
Aquifer Model: Unconfined Solution Method: Springer-Gelhar
K = 79.99 ft/day Le = 108.9 ft
Well screened in the B Zone
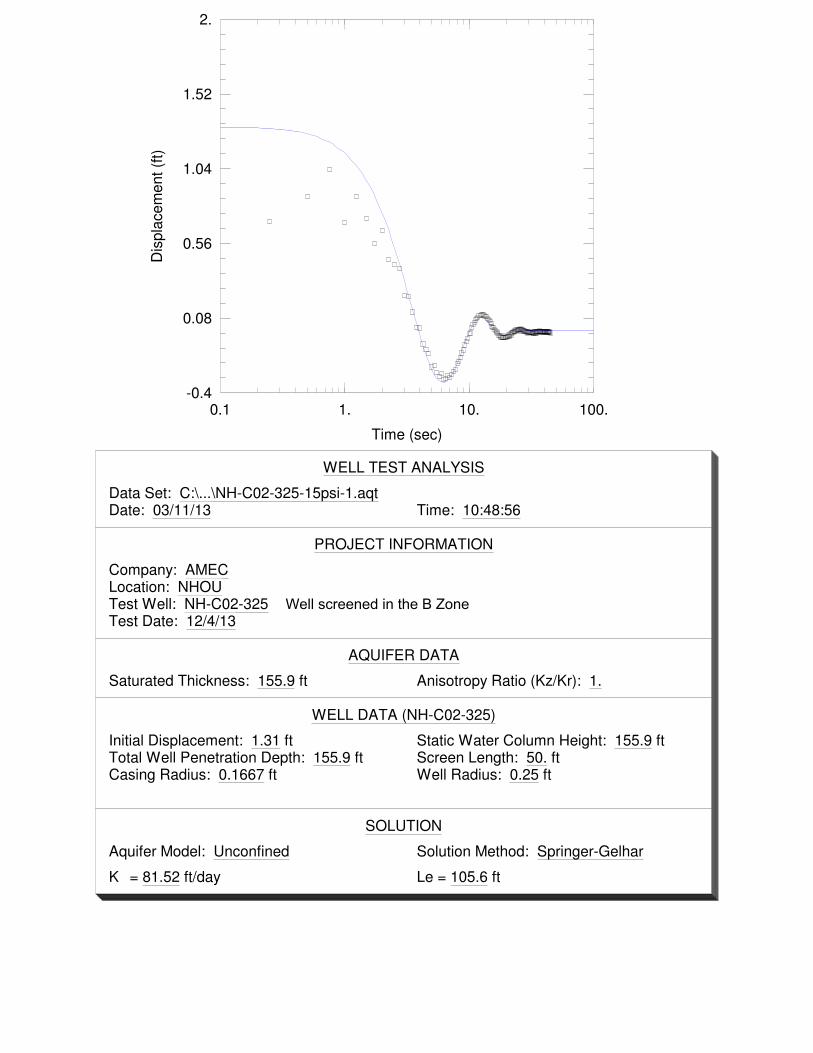
0.1 1. 10. 100.-0.4
0.08
0.56
1.04
1.52
2.
Time (sec)
Dis
pla
cem
ent (f
t)
WELL TEST ANALYSIS
Data Set: C:\...\NH-C02-325-15psi-1.aqtDate: 03/11/13 Time: 10:48:56
PROJECT INFORMATION
Company: AMECLocation: NHOUTest Well: NH-C02-325Test Date: 12/4/13
AQUIFER DATA
Saturated Thickness: 155.9 ft Anisotropy Ratio (Kz/Kr): 1.
WELL DATA (NH-C02-325)
Initial Displacement: 1.31 ft Static Water Column Height: 155.9 ftTotal Well Penetration Depth: 155.9 ft Screen Length: 50. ftCasing Radius: 0.1667 ft Well Radius: 0.25 ft
SOLUTION
Aquifer Model: Unconfined Solution Method: Springer-Gelhar
K = 81.52 ft/day Le = 105.6 ft
Well screened in the B Zone

0.1 1. 10. 100.-0.5
0.
0.5
1.
1.5
2.
Time (sec)
Dis
pla
cem
ent (f
t)
WELL TEST ANALYSIS
Data Set: C:\...\NH-C02-325-25psi-1.aqtDate: 03/11/13 Time: 10:48:45
PROJECT INFORMATION
Company: AMECLocation: NHOUTest Well: NH-C02-325Test Date: 12/4/13
AQUIFER DATA
Saturated Thickness: 155.9 ft Anisotropy Ratio (Kz/Kr): 1.
WELL DATA (NH-C02-325)
Initial Displacement: 1.85 ft Static Water Column Height: 155.9 ftTotal Well Penetration Depth: 155.9 ft Screen Length: 50. ftCasing Radius: 0.1667 ft Well Radius: 0.25 ft
SOLUTION
Aquifer Model: Unconfined Solution Method: Springer-Gelhar
K = 81.47 ft/day Le = 110.1 ft
Well screened in the B Zone

0.1 1. 10. 100.-0.5
0.
0.5
1.
1.5
2.
Time (sec)
Dis
pla
cem
ent (f
t)
WELL TEST ANALYSIS
Data Set: C:\...\NH-C02-325-25psi-2.aqtDate: 03/11/13 Time: 10:48:36
PROJECT INFORMATION
Company: AMECLocation: NHOUTest Well: NH-C02-325Test Date: 12/4/13
AQUIFER DATA
Saturated Thickness: 155.9 ft Anisotropy Ratio (Kz/Kr): 1.
WELL DATA (NH-C02-325)
Initial Displacement: 1.933 ft Static Water Column Height: 155.9 ftTotal Well Penetration Depth: 155.9 ft Screen Length: 50. ftCasing Radius: 0.1667 ft Well Radius: 0.25 ft
SOLUTION
Aquifer Model: Unconfined Solution Method: Springer-Gelhar
K = 82.9 ft/day Le = 108.9 ft
Well screened in the B Zone
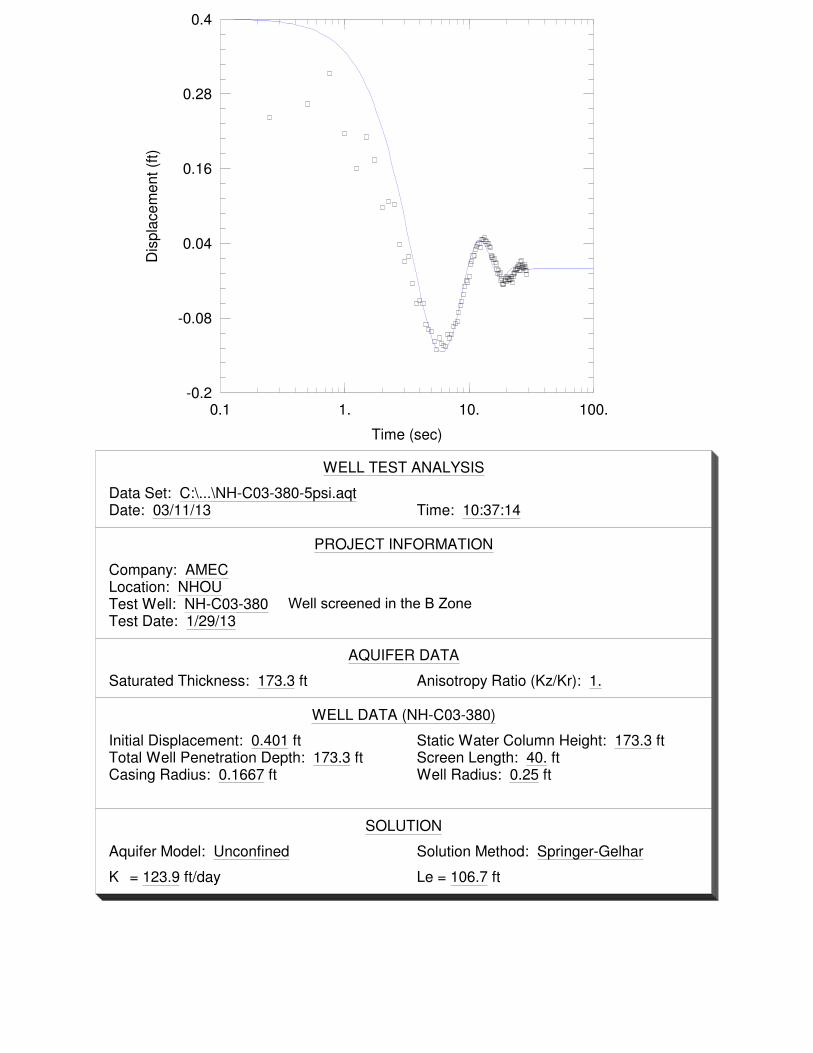
0.1 1. 10. 100.-0.2
-0.08
0.04
0.16
0.28
0.4
Time (sec)
Dis
pla
cem
ent (f
t)
WELL TEST ANALYSIS
Data Set: C:\...\NH-C03-380-5psi.aqtDate: 03/11/13 Time: 10:37:14
PROJECT INFORMATION
Company: AMECLocation: NHOUTest Well: NH-C03-380Test Date: 1/29/13
AQUIFER DATA
Saturated Thickness: 173.3 ft Anisotropy Ratio (Kz/Kr): 1.
WELL DATA (NH-C03-380)
Initial Displacement: 0.401 ft Static Water Column Height: 173.3 ftTotal Well Penetration Depth: 173.3 ft Screen Length: 40. ftCasing Radius: 0.1667 ft Well Radius: 0.25 ft
SOLUTION
Aquifer Model: Unconfined Solution Method: Springer-Gelhar
K = 123.9 ft/day Le = 106.7 ft
Well screened in the B Zone

0.1 1. 10. 100.-0.2
-0.02
0.16
0.34
0.52
0.7
Time (sec)
Dis
pla
cem
ent (f
t)
WELL TEST ANALYSIS
Data Set: C:\...\NH-C03-380-10psi.aqtDate: 03/11/13 Time: 10:38:12
PROJECT INFORMATION
Company: AMECLocation: NHOUTest Well: NH-C03-380Test Date: 1/29/13
AQUIFER DATA
Saturated Thickness: 173.3 ft Anisotropy Ratio (Kz/Kr): 1.
WELL DATA (NH-C03-380)
Initial Displacement: 0.766 ft Static Water Column Height: 173.3 ftTotal Well Penetration Depth: 173.3 ft Screen Length: 40. ftCasing Radius: 0.1667 ft Well Radius: 0.25 ft
SOLUTION
Aquifer Model: Unconfined Solution Method: Springer-Gelhar
K = 101.5 ft/day Le = 130. ft
Well screened in the B Zone

0.1 1. 10. 100. 1000.-0.3
-0.1
0.1
0.3
0.5
0.7
Time (sec)
Dis
pla
cem
ent (f
t)
WELL TEST ANALYSIS
Data Set: C:\...\NH-C03-380-10psi-2.aqtDate: 03/11/13 Time: 10:39:49
PROJECT INFORMATION
Company: AMECLocation: NHOUTest Well: NH-C03-380Test Date: 1/29/13
AQUIFER DATA
Saturated Thickness: 173.3 ft Anisotropy Ratio (Kz/Kr): 1.
WELL DATA (NH-C03-380)
Initial Displacement: 0.826 ft Static Water Column Height: 173.3 ftTotal Well Penetration Depth: 173.3 ft Screen Length: 40. ftCasing Radius: 0.1667 ft Well Radius: 0.25 ft
SOLUTION
Aquifer Model: Unconfined Solution Method: Springer-Gelhar
K = 98.39 ft/day Le = 139.8 ft
Well screened in the B Zone
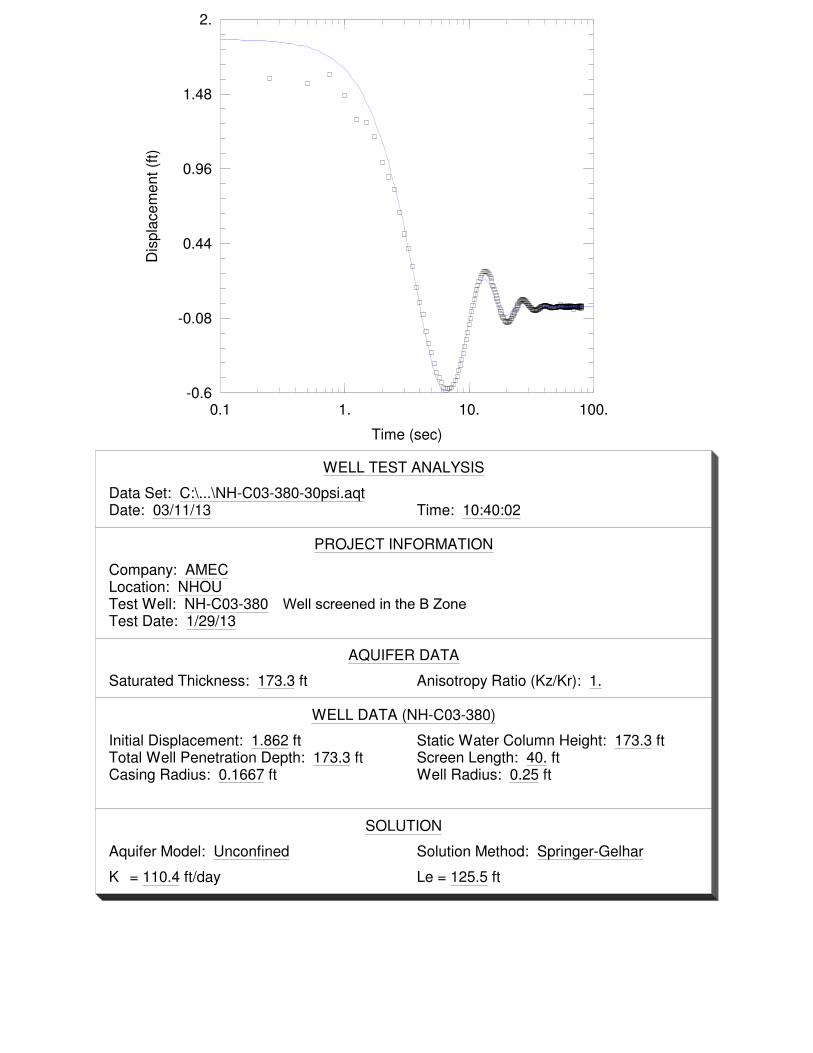
0.1 1. 10. 100.-0.6
-0.08
0.44
0.96
1.48
2.
Time (sec)
Dis
pla
cem
ent (f
t)
WELL TEST ANALYSIS
Data Set: C:\...\NH-C03-380-30psi.aqtDate: 03/11/13 Time: 10:40:02
PROJECT INFORMATION
Company: AMECLocation: NHOUTest Well: NH-C03-380Test Date: 1/29/13
AQUIFER DATA
Saturated Thickness: 173.3 ft Anisotropy Ratio (Kz/Kr): 1.
WELL DATA (NH-C03-380)
Initial Displacement: 1.862 ft Static Water Column Height: 173.3 ftTotal Well Penetration Depth: 173.3 ft Screen Length: 40. ftCasing Radius: 0.1667 ft Well Radius: 0.25 ft
SOLUTION
Aquifer Model: Unconfined Solution Method: Springer-Gelhar
K = 110.4 ft/day Le = 125.5 ft
Well screened in the B Zone

0.1 1. 10. 100.-0.03
0.056
0.142
0.228
0.314
0.4
Time (sec)
Dis
pla
cem
ent (f
t)
WELL TEST ANALYSIS
Data Set: C:\...\NH-C09-310-5psi.aqtDate: 03/11/13 Time: 10:40:12
PROJECT INFORMATION
Company: AMECLocation: NHOUTest Well: NH-C09-310Test Date: 1/29/13
AQUIFER DATA
Saturated Thickness: 99.28 ft Anisotropy Ratio (Kz/Kr): 1.
WELL DATA (NH-C09-310)
Initial Displacement: 0.544 ft Static Water Column Height: 79.45 ftTotal Well Penetration Depth: 79.45 ft Screen Length: 60. ftCasing Radius: 0.1667 ft Well Radius: 0.25 ft
SOLUTION
Aquifer Model: Unconfined Solution Method: Springer-Gelhar
K = 48.71 ft/day Le = 45.25 ft
Well screened in the A Zone

0.1 1. 10. 100.-0.04
0.128
0.296
0.464
0.632
0.8
Time (sec)
Dis
pla
cem
ent (f
t)
WELL TEST ANALYSIS
Data Set: C:\...\NH-C09-310-10psi.aqtDate: 03/11/13 Time: 10:40:45
PROJECT INFORMATION
Company: AMECLocation: NHOUTest Well: NH-C09-310Test Date: 1/29/13
AQUIFER DATA
Saturated Thickness: 99.28 ft Anisotropy Ratio (Kz/Kr): 1.
WELL DATA (NH-C09-310)
Initial Displacement: 0.929 ft Static Water Column Height: 79.45 ftTotal Well Penetration Depth: 79.45 ft Screen Length: 60. ftCasing Radius: 0.1667 ft Well Radius: 0.25 ft
SOLUTION
Aquifer Model: Unconfined Solution Method: Springer-Gelhar
K = 43.42 ft/day Le = 56.97 ft
Well screened in the A Zone

0.1 1. 10. 100.-0.05
0.36
0.77
1.18
1.59
2.
Time (sec)
Dis
pla
cem
ent (f
t)
WELL TEST ANALYSIS
Data Set: C:\...\NH-C09-310-20psi.aqtDate: 03/11/13 Time: 10:40:54
PROJECT INFORMATION
Company: AMECLocation: NHOUTest Well: NH-C09-310Test Date: 1/29/13
AQUIFER DATA
Saturated Thickness: 99.28 ft Anisotropy Ratio (Kz/Kr): 1.
WELL DATA (NH-C09-310)
Initial Displacement: 1.419 ft Static Water Column Height: 79.45 ftTotal Well Penetration Depth: 79.45 ft Screen Length: 60. ftCasing Radius: 0.1667 ft Well Radius: 0.25 ft
SOLUTION
Aquifer Model: Unconfined Solution Method: Springer-Gelhar
K = 41.34 ft/day Le = 58.41 ft
Well screened in the A Zone

0.1 1. 10. 100.-0.05
0.36
0.77
1.18
1.59
2.
Time (sec)
Dis
pla
cem
ent (f
t)
WELL TEST ANALYSIS
Data Set: C:\...\NH-C09-310-30psi.aqtDate: 03/11/13 Time: 10:41:04
PROJECT INFORMATION
Company: AMECLocation: NHOUTest Well: NH-C09-310Test Date: 1/29/13
AQUIFER DATA
Saturated Thickness: 99.28 ft Anisotropy Ratio (Kz/Kr): 1.
WELL DATA (NH-C09-310)
Initial Displacement: 2.082 ft Static Water Column Height: 79.45 ftTotal Well Penetration Depth: 79.45 ft Screen Length: 60. ftCasing Radius: 0.1667 ft Well Radius: 0.25 ft
SOLUTION
Aquifer Model: Unconfined Solution Method: Springer-Gelhar
K = 40.91 ft/day Le = 47.59 ft
Well screened in the A Zone

0.1 1. 10. 100.-0.02
0.384
0.788
1.19
1.6
2.
Time (sec)
Dis
pla
cem
ent (f
t)
WELL TEST ANALYSIS
Data Set: C:\...\NH-C10-280-5psi.aqtDate: 03/11/13 Time: 10:41:13
PROJECT INFORMATION
Company: AMECLocation: NHOUTest Well: NH-C10-280Test Date: 1/29/13
AQUIFER DATA
Saturated Thickness: 113.8 ft Anisotropy Ratio (Kz/Kr): 1.
WELL DATA (NH-C10-280)
Initial Displacement: 2.09 ft Static Water Column Height: 73.06 ftTotal Well Penetration Depth: 73.06 ft Screen Length: 60. ftCasing Radius: 0.1667 ft Well Radius: 0.25 ft
SOLUTION
Aquifer Model: Unconfined Solution Method: Springer-Gelhar
K = 37.18 ft/day Le = 0.1 ft
Well screened in the A Zone

0. 12. 24. 36. 48. 60.0.001
0.01
0.1
1.
10.
Time (sec)
Dis
pla
cem
ent (f
t)
WELL TEST ANALYSIS
Data Set: C:\...\NH-C10-280-5psi_BR.aqtDate: 03/11/13 Time: 10:41:23
PROJECT INFORMATION
Company: AMECLocation: NHOUTest Well: NH-C10-280Test Date: 1/29/13
AQUIFER DATA
Saturated Thickness: 113.8 ft Anisotropy Ratio (Kz/Kr): 1.
WELL DATA (NH-C10-280)
Initial Displacement: 2.09 ft Static Water Column Height: 73.06 ftTotal Well Penetration Depth: 73.06 ft Screen Length: 60. ftCasing Radius: 0.1667 ft Well Radius: 0.25 ft
SOLUTION
Aquifer Model: Unconfined Solution Method: Bouwer-Rice
K = 36.73 ft/day y0 = 1.776 ft
Well screened in the A Zone

0.1 1. 10. 100.-0.02
0.384
0.788
1.19
1.6
2.
Time (sec)
Dis
pla
cem
ent (f
t)
WELL TEST ANALYSIS
Data Set: C:\...\NH-C10-280-10psi.aqtDate: 03/11/13 Time: 10:41:32
PROJECT INFORMATION
Company: AMECLocation: NHOUTest Well: NH-C10-280Test Date: 1/29/13
AQUIFER DATA
Saturated Thickness: 113.8 ft Anisotropy Ratio (Kz/Kr): 1.
WELL DATA (NH-C10-280)
Initial Displacement: 1.106 ft Static Water Column Height: 73.06 ftTotal Well Penetration Depth: 73.06 ft Screen Length: 60. ftCasing Radius: 0.1667 ft Well Radius: 0.25 ft
SOLUTION
Aquifer Model: Unconfined Solution Method: Springer-Gelhar
K = 47.4 ft/day Le = 0.1 ft
Well screened in the A Zone
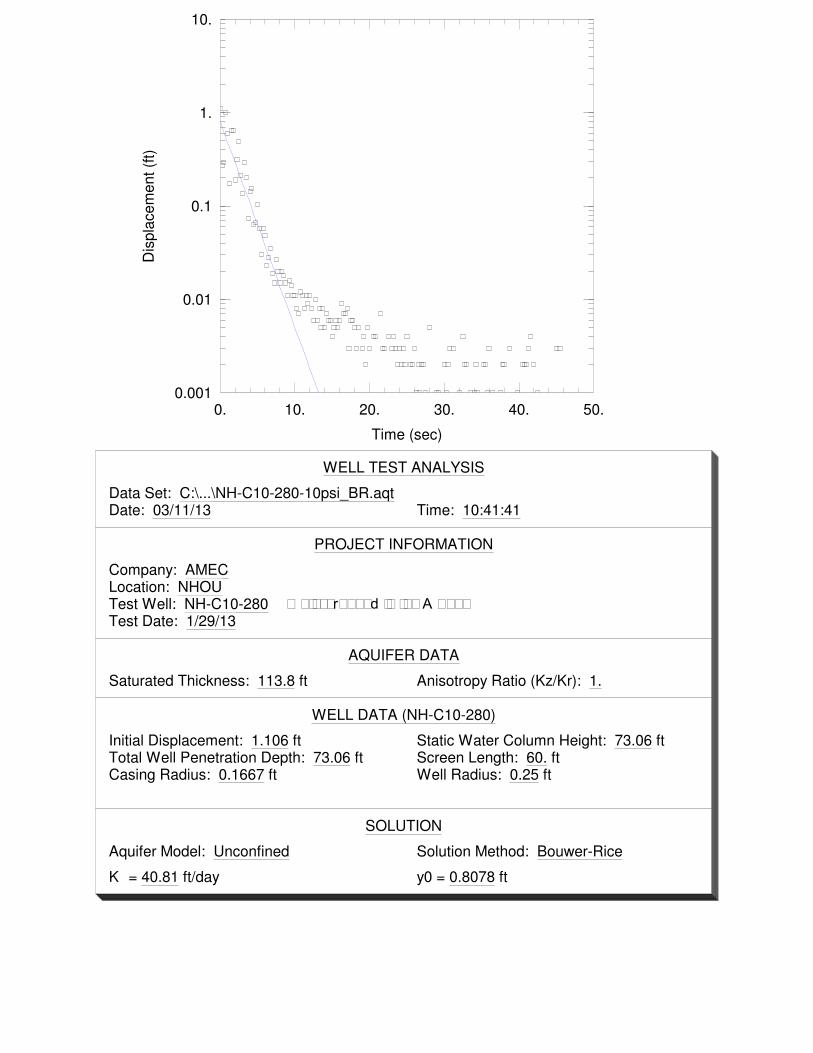
0. 10. 20. 30. 40. 50.0.001
0.01
0.1
1.
10.
Time (sec)
Dis
pla
cem
ent (f
t)
WELL TEST ANALYSIS
Data Set: C:\...\NH-C10-280-10psi_BR.aqtDate: 03/11/13 Time: 10:41:41
PROJECT INFORMATION
Company: AMECLocation: NHOUTest Well: NH-C10-280Test Date: 1/29/13
AQUIFER DATA
Saturated Thickness: 113.8 ft Anisotropy Ratio (Kz/Kr): 1.
WELL DATA (NH-C10-280)
Initial Displacement: 1.106 ft Static Water Column Height: 73.06 ftTotal Well Penetration Depth: 73.06 ft Screen Length: 60. ftCasing Radius: 0.1667 ft Well Radius: 0.25 ft
SOLUTION
Aquifer Model: Unconfined Solution Method: Bouwer-Rice
K = 40.81 ft/day y0 = 0.8078 ft
Well screened in the A Zone

0.1 1. 10. 100.-0.02
0.384
0.788
1.19
1.6
2.
Time (sec)
Dis
pla
cem
ent (f
t)
WELL TEST ANALYSIS
Data Set: C:\...\NH-C10-280-25psi.aqtDate: 03/11/13 Time: 10:41:49
PROJECT INFORMATION
Company: AMECLocation: NHOUTest Well: NH-C10-280Test Date: 1/29/13
AQUIFER DATA
Saturated Thickness: 113.8 ft Anisotropy Ratio (Kz/Kr): 1.
WELL DATA (NH-C10-280)
Initial Displacement: 2.09 ft Static Water Column Height: 73.06 ftTotal Well Penetration Depth: 73.06 ft Screen Length: 60. ftCasing Radius: 0.1667 ft Well Radius: 0.25 ft
SOLUTION
Aquifer Model: Unconfined Solution Method: Springer-Gelhar
K = 37.18 ft/day Le = 0.1 ft
Well screened in the A Zone

0. 12. 24. 36. 48. 60.0.001
0.01
0.1
1.
10.
Time (sec)
Dis
pla
cem
ent (f
t)
WELL TEST ANALYSIS
Data Set: C:\...\NH-C10-280-25psi_BR.aqtDate: 03/11/13 Time: 10:41:59
PROJECT INFORMATION
Company: AMECLocation: NHOUTest Well: NH-C10-280Test Date: 1/29/13
AQUIFER DATA
Saturated Thickness: 113.8 ft Anisotropy Ratio (Kz/Kr): 1.
WELL DATA (NH-C10-280)
Initial Displacement: 2.09 ft Static Water Column Height: 73.06 ftTotal Well Penetration Depth: 73.06 ft Screen Length: 60. ftCasing Radius: 0.1667 ft Well Radius: 0.25 ft
SOLUTION
Aquifer Model: Unconfined Solution Method: Bouwer-Rice
K = 40.33 ft/day y0 = 2.339 ft
Well screened in the A Zone

0.1 1. 10. 100.-0.03
0.096
0.222
0.348
0.474
0.6
Time (sec)
Dis
pla
cem
ent (f
t)
WELL TEST ANALYSIS
Data Set: C:\...\NH-C12-280-5psi.aqtDate: 03/11/13 Time: 10:42:09
PROJECT INFORMATION
Company: AMECLocation: NHOUTest Well: NH-C12-280Test Date: 1/30/13
AQUIFER DATA
Saturated Thickness: 117.4 ft Anisotropy Ratio (Kz/Kr): 1.
WELL DATA (NH-C12-280)
Initial Displacement: 0.85 ft Static Water Column Height: 71.25 ftTotal Well Penetration Depth: 71.25 ft Screen Length: 70. ftCasing Radius: 0.1667 ft Well Radius: 0.25 ft
SOLUTION
Aquifer Model: Unconfined Solution Method: Springer-Gelhar
K = 48.01 ft/day Le = 28.84 ft
Well screened in the A Zone

0.1 1. 10. 100.-0.03
0.376
0.782
1.19
1.59
2.
Time (sec)
Dis
pla
cem
ent (f
t)
WELL TEST ANALYSIS
Data Set: C:\...\NH-C12-280-10psi.aqtDate: 03/11/13 Time: 10:42:18
PROJECT INFORMATION
Company: AMECLocation: NHOUTest Well: NH-C12-280Test Date: 1/30/13
AQUIFER DATA
Saturated Thickness: 117.4 ft Anisotropy Ratio (Kz/Kr): 1.
WELL DATA (NH-C12-280)
Initial Displacement: 1.356 ft Static Water Column Height: 71.25 ftTotal Well Penetration Depth: 71.25 ft Screen Length: 70. ftCasing Radius: 0.1667 ft Well Radius: 0.25 ft
SOLUTION
Aquifer Model: Unconfined Solution Method: Springer-Gelhar
K = 43.81 ft/day Le = 27.54 ft
Well screened in the A Zone
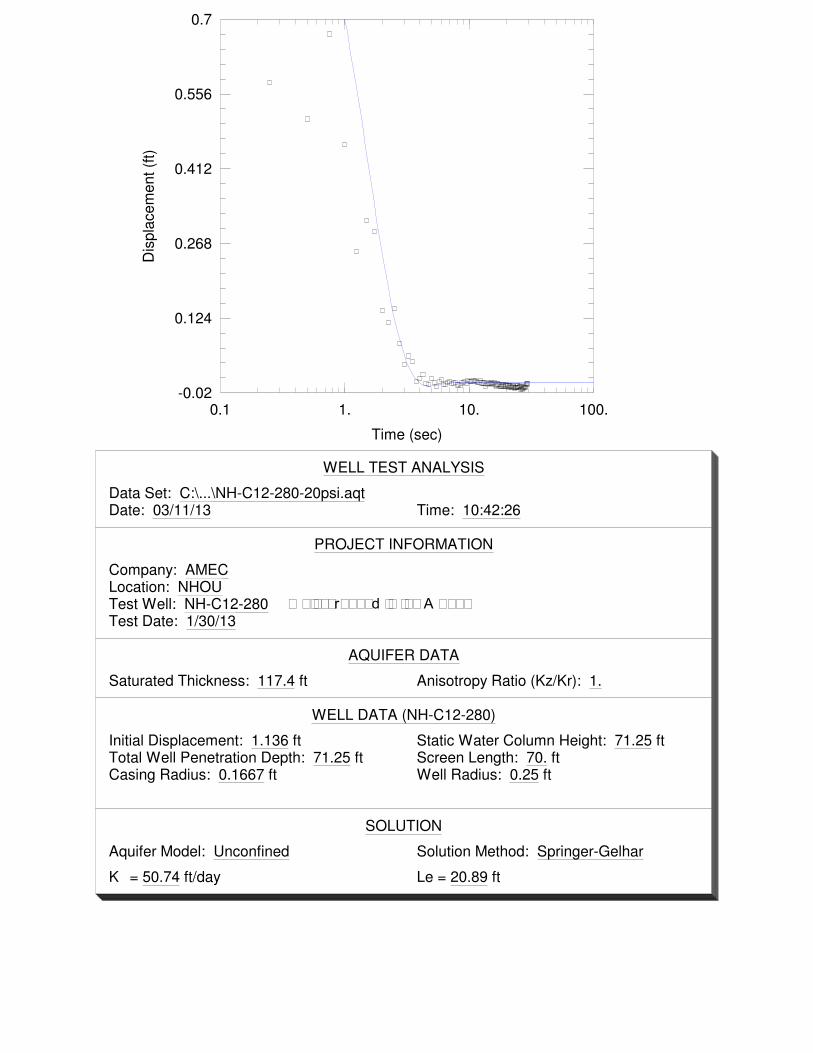
0.1 1. 10. 100.-0.02
0.124
0.268
0.412
0.556
0.7
Time (sec)
Dis
pla
cem
ent (f
t)
WELL TEST ANALYSIS
Data Set: C:\...\NH-C12-280-20psi.aqtDate: 03/11/13 Time: 10:42:26
PROJECT INFORMATION
Company: AMECLocation: NHOUTest Well: NH-C12-280Test Date: 1/30/13
AQUIFER DATA
Saturated Thickness: 117.4 ft Anisotropy Ratio (Kz/Kr): 1.
WELL DATA (NH-C12-280)
Initial Displacement: 1.136 ft Static Water Column Height: 71.25 ftTotal Well Penetration Depth: 71.25 ft Screen Length: 70. ftCasing Radius: 0.1667 ft Well Radius: 0.25 ft
SOLUTION
Aquifer Model: Unconfined Solution Method: Springer-Gelhar
K = 50.74 ft/day Le = 20.89 ft
Well screened in the A Zone

0.1 1. 10. 100.-0.03
0.576
1.18
1.79
2.39
3.
Time (sec)
Dis
pla
cem
ent (f
t)
WELL TEST ANALYSIS
Data Set: C:\...\NH-C12-280-30psi.aqtDate: 03/11/13 Time: 10:42:36
PROJECT INFORMATION
Company: AMECLocation: NHOUTest Well: NH-C12-280Test Date: 1/30/13
AQUIFER DATA
Saturated Thickness: 117.4 ft Anisotropy Ratio (Kz/Kr): 1.
WELL DATA (NH-C12-280)
Initial Displacement: 2.995 ft Static Water Column Height: 71.25 ftTotal Well Penetration Depth: 71.25 ft Screen Length: 70. ftCasing Radius: 0.1667 ft Well Radius: 0.25 ft
SOLUTION
Aquifer Model: Unconfined Solution Method: Springer-Gelhar
K = 40.3 ft/day Le = 27.54 ft
Well screened in the A Zone

0.1 1. 10. 100.-0.2
-0.1
0.
0.1
0.2
0.3
Time (sec)
Dis
pla
cem
ent (f
t)
WELL TEST ANALYSIS
Data Set: C:\...\NH-C13-385-5psi.aqtDate: 03/11/13 Time: 10:42:47
PROJECT INFORMATION
Company: AMECLocation: NHOUTest Well: NH-C13-385Test Date: 1/29/13
AQUIFER DATA
Saturated Thickness: 133.2 ft Anisotropy Ratio (Kz/Kr): 1.
WELL DATA (NH-C13-385)
Initial Displacement: 0.364 ft Static Water Column Height: 133.2 ftTotal Well Penetration Depth: 133.2 ft Screen Length: 50. ftCasing Radius: 0.1667 ft Well Radius: 0.25 ft
SOLUTION
Aquifer Model: Unconfined Solution Method: Springer-Gelhar
K = 105.3 ft/day Le = 78.46 ft
Well screened in the A and B Zones

0.1 1. 10. 100.-0.2
-0.02
0.16
0.34
0.52
0.7
Time (sec)
Dis
pla
cem
ent (f
t)
WELL TEST ANALYSIS
Data Set: C:\...\NH-C13-385-10psi.aqtDate: 03/11/13 Time: 10:42:55
PROJECT INFORMATION
Company: AMECLocation: NHOUTest Well: NH-C13-385Test Date: 1/29/13
AQUIFER DATA
Saturated Thickness: 133.2 ft Anisotropy Ratio (Kz/Kr): 1.
WELL DATA (NH-C13-385)
Initial Displacement: 0.864 ft Static Water Column Height: 133.2 ftTotal Well Penetration Depth: 133.2 ft Screen Length: 50. ftCasing Radius: 0.1667 ft Well Radius: 0.25 ft
SOLUTION
Aquifer Model: Unconfined Solution Method: Springer-Gelhar
K = 83.68 ft/day Le = 98.78 ft
Well screened in the A and B Zones

0.1 1. 10. 100.-0.4
0.08
0.56
1.04
1.52
2.
Time (sec)
Dis
pla
cem
ent (f
t)
WELL TEST ANALYSIS
Data Set: C:\...\NH-C13-385-20psi.aqtDate: 03/11/13 Time: 10:43:03
PROJECT INFORMATION
Company: AMECLocation: NHOUTest Well: NH-C13-385Test Date: 1/29/13
AQUIFER DATA
Saturated Thickness: 133.2 ft Anisotropy Ratio (Kz/Kr): 1.
WELL DATA (NH-C13-385)
Initial Displacement: 1.351 ft Static Water Column Height: 133.2 ftTotal Well Penetration Depth: 133.2 ft Screen Length: 50. ftCasing Radius: 0.1667 ft Well Radius: 0.25 ft
SOLUTION
Aquifer Model: Unconfined Solution Method: Springer-Gelhar
K = 74.58 ft/day Le = 103.4 ft
Well screened in the A and B Zones

0.1 1. 10. 100.-0.5
0.
0.5
1.
1.5
2.
Time (sec)
Dis
pla
cem
ent (f
t)
WELL TEST ANALYSIS
Data Set: C:\...\NH-C13-385-30psi.aqtDate: 03/11/13 Time: 10:43:12
PROJECT INFORMATION
Company: AMECLocation: NHOUTest Well: NH-C13-385Test Date: 1/29/13
AQUIFER DATA
Saturated Thickness: 133.2 ft Anisotropy Ratio (Kz/Kr): 1.
WELL DATA (NH-C13-385)
Initial Displacement: 1.59 ft Static Water Column Height: 133.2 ftTotal Well Penetration Depth: 133.2 ft Screen Length: 50. ftCasing Radius: 0.1667 ft Well Radius: 0.25 ft
SOLUTION
Aquifer Model: Unconfined Solution Method: Springer-Gelhar
K = 93.89 ft/day Le = 86.03 ft
Well screened in the A and B Zones

0. 10. 20. 30. 40. 50.-0.008
0.134
0.275
0.417
0.558
0.7
Time (sec)
Dis
pla
cem
ent (f
t)
WELL TEST ANALYSIS
Data Set: C:\...\NH-C14-250-6psi.aqtDate: 03/11/13 Time: 10:43:23
PROJECT INFORMATION
Company: AMECLocation: NHOUTest Well: NH-C14-250Test Date: 1/30/13
AQUIFER DATA
Saturated Thickness: 111. ft Anisotropy Ratio (Kz/Kr): 1.
WELL DATA (NH-C14-250)
Initial Displacement: 0.916 ft Static Water Column Height: 54.81 ftTotal Well Penetration Depth: 54.81 ft Screen Length: 50. ftCasing Radius: 0.1667 ft Well Radius: 0.25 ft
SOLUTION
Aquifer Model: Unconfined Solution Method: Springer-Gelhar
K = 26.78 ft/day Le = 0.1 ft
Well screened in the A Zone

0. 10. 20. 30. 40. 50.0.001
0.01
0.1
1.
Time (sec)
Dis
pla
cem
ent (f
t)
WELL TEST ANALYSIS
Data Set: C:\...\NH-C14-250-6psi_BR.aqtDate: 03/11/13 Time: 10:43:31
PROJECT INFORMATION
Company: AMECLocation: NHOUTest Well: NH-C14-250Test Date: 1/30/13
AQUIFER DATA
Saturated Thickness: 111. ft Anisotropy Ratio (Kz/Kr): 1.
WELL DATA (NH-C14-250)
Initial Displacement: 0.916 ft Static Water Column Height: 54.81 ftTotal Well Penetration Depth: 54.81 ft Screen Length: 50. ftCasing Radius: 0.1667 ft Well Radius: 0.25 ft
SOLUTION
Aquifer Model: Unconfined Solution Method: Bouwer-Rice
K = 20.22 ft/day y0 = 0.6058 ft
Well screened in the A Zone

0. 6. 12. 18. 24. 30.0.
0.14
0.28
0.42
0.56
0.7
Time (sec)
Dis
pla
cem
ent (f
t)
WELL TEST ANALYSIS
Data Set: C:\...\NH-C14-250-10psi.aqtDate: 03/11/13 Time: 10:43:39
PROJECT INFORMATION
Company: AMECLocation: NHOUTest Well: NH-C14-250Test Date: 1/30/13
AQUIFER DATA
Saturated Thickness: 111. ft Anisotropy Ratio (Kz/Kr): 1.
WELL DATA (NH-C14-250)
Initial Displacement: 0.812 ft Static Water Column Height: 54.81 ftTotal Well Penetration Depth: 54.81 ft Screen Length: 50. ftCasing Radius: 0.1667 ft Well Radius: 0.25 ft
SOLUTION
Aquifer Model: Unconfined Solution Method: Springer-Gelhar
K = 22.08 ft/day Le = 0.1 ft
Well screened in the A Zone

0. 6. 12. 18. 24. 30.0.001
0.01
0.1
1.
Time (sec)
Dis
pla
cem
ent (f
t)
WELL TEST ANALYSIS
Data Set: C:\...\NH-C14-250-10psi_BR.aqtDate: 03/11/13 Time: 10:43:49
PROJECT INFORMATION
Company: AMECLocation: NHOUTest Well: NH-C14-250Test Date: 1/30/13
AQUIFER DATA
Saturated Thickness: 111. ft Anisotropy Ratio (Kz/Kr): 1.
WELL DATA (NH-C14-250)
Initial Displacement: 0.812 ft Static Water Column Height: 54.81 ftTotal Well Penetration Depth: 54.81 ft Screen Length: 50. ftCasing Radius: 0.1667 ft Well Radius: 0.25 ft
SOLUTION
Aquifer Model: Unconfined Solution Method: Bouwer-Rice
K = 19.46 ft/day y0 = 0.5745 ft
Well screened in the A Zone
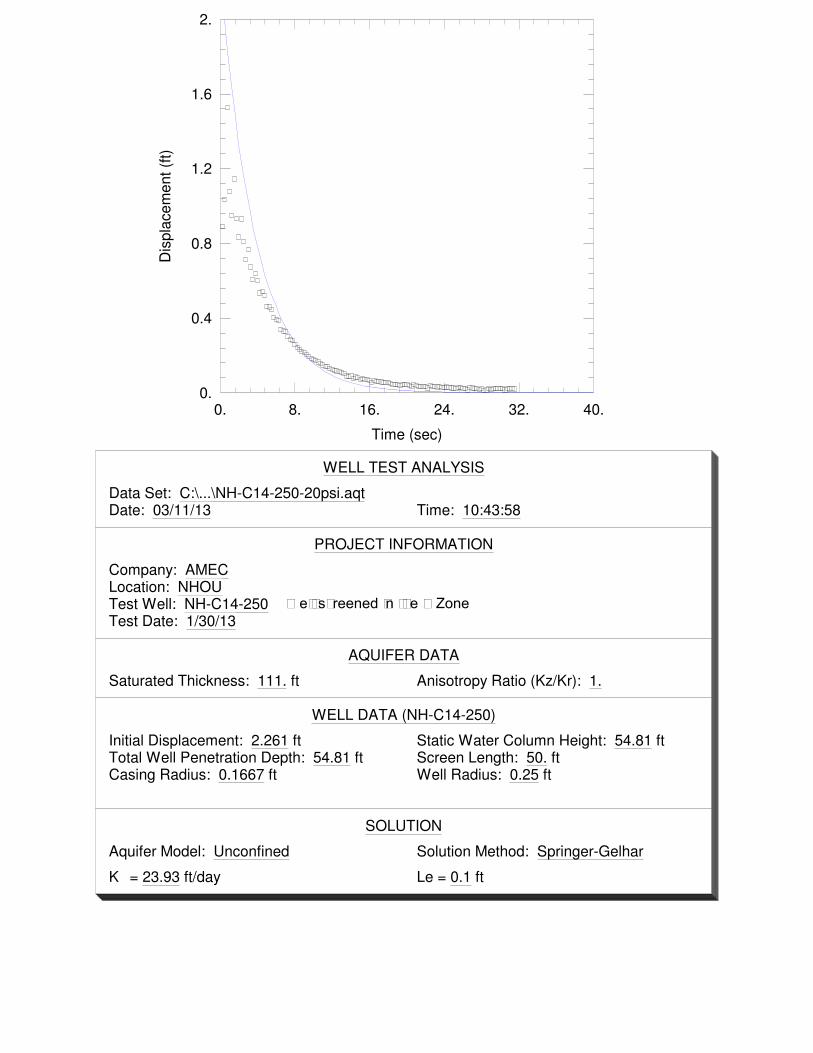
0. 8. 16. 24. 32. 40.0.
0.4
0.8
1.2
1.6
2.
Time (sec)
Dis
pla
cem
ent (f
t)
WELL TEST ANALYSIS
Data Set: C:\...\NH-C14-250-20psi.aqtDate: 03/11/13 Time: 10:43:58
PROJECT INFORMATION
Company: AMECLocation: NHOUTest Well: NH-C14-250Test Date: 1/30/13
AQUIFER DATA
Saturated Thickness: 111. ft Anisotropy Ratio (Kz/Kr): 1.
WELL DATA (NH-C14-250)
Initial Displacement: 2.261 ft Static Water Column Height: 54.81 ftTotal Well Penetration Depth: 54.81 ft Screen Length: 50. ftCasing Radius: 0.1667 ft Well Radius: 0.25 ft
SOLUTION
Aquifer Model: Unconfined Solution Method: Springer-Gelhar
K = 23.93 ft/day Le = 0.1 ft
Well screened in the A Zone

0. 8. 16. 24. 32. 40.0.01
0.1
1.
10.
Time (sec)
Dis
pla
cem
ent (f
t)
WELL TEST ANALYSIS
Data Set: C:\...\NH-C14-250-20psi_BR.aqtDate: 03/11/13 Time: 10:44:06
PROJECT INFORMATION
Company: AMECLocation: NHOUTest Well: NH-C14-250Test Date: 1/30/13
AQUIFER DATA
Saturated Thickness: 111. ft Anisotropy Ratio (Kz/Kr): 1.
WELL DATA (NH-C14-250)
Initial Displacement: 2.261 ft Static Water Column Height: 54.81 ftTotal Well Penetration Depth: 54.81 ft Screen Length: 50. ftCasing Radius: 0.1667 ft Well Radius: 0.25 ft
SOLUTION
Aquifer Model: Unconfined Solution Method: Bouwer-Rice
K = 17.37 ft/day y0 = 1.278 ft
Well screened in the A Zone

0. 8. 16. 24. 32. 40.0.
0.6
1.2
1.8
2.4
3.
Time (sec)
Dis
pla
cem
ent (f
t)
WELL TEST ANALYSIS
Data Set: C:\...\NH-C14-250-30psi.aqtDate: 03/11/13 Time: 10:44:14
PROJECT INFORMATION
Company: AMECLocation: NHOUTest Well: NH-C14-250Test Date: 1/30/13
AQUIFER DATA
Saturated Thickness: 111. ft Anisotropy Ratio (Kz/Kr): 1.
WELL DATA (NH-C14-250)
Initial Displacement: 3.611 ft Static Water Column Height: 54.81 ftTotal Well Penetration Depth: 54.81 ft Screen Length: 50. ftCasing Radius: 0.1667 ft Well Radius: 0.25 ft
SOLUTION
Aquifer Model: Unconfined Solution Method: Springer-Gelhar
K = 23.87 ft/day Le = 0.1 ft
Well screened in the A Zone

0. 8. 16. 24. 32. 40.0.001
0.01
0.1
1.
10.
Time (sec)
Dis
pla
cem
ent (f
t)
WELL TEST ANALYSIS
Data Set: C:\...\NH-C14-250-30psi_BR.aqtDate: 03/11/13 Time: 10:44:23
PROJECT INFORMATION
Company: AMECLocation: NHOUTest Well: NH-C14-250Test Date: 1/30/13
AQUIFER DATA
Saturated Thickness: 111. ft Anisotropy Ratio (Kz/Kr): 1.
WELL DATA (NH-C14-250)
Initial Displacement: 3.611 ft Static Water Column Height: 54.81 ftTotal Well Penetration Depth: 54.81 ft Screen Length: 50. ftCasing Radius: 0.1667 ft Well Radius: 0.25 ft
SOLUTION
Aquifer Model: Unconfined Solution Method: Bouwer-Rice
K = 17.92 ft/day y0 = 2.254 ft
Well screened in the A Zone

0.1 1. 10. 100.-0.06
0.032
0.124
0.216
0.308
0.4
Time (sec)
Dis
pla
cem
ent (f
t)
WELL TEST ANALYSIS
Data Set: C:\...\NH-C16-390-5psi.aqtDate: 03/11/13 Time: 10:44:32
PROJECT INFORMATION
Company: AMECLocation: NHOUTest Well: NH-C16-390Test Date: 1/30/13
AQUIFER DATA
Saturated Thickness: 121.7 ft Anisotropy Ratio (Kz/Kr): 1.
WELL DATA (NH-C16-390)
Initial Displacement: 0.504 ft Static Water Column Height: 121.7 ftTotal Well Penetration Depth: 121.7 ft Screen Length: 50. ftCasing Radius: 0.1667 ft Well Radius: 0.25 ft
SOLUTION
Aquifer Model: Unconfined Solution Method: Springer-Gelhar
K = 61.7 ft/day Le = 82.83 ft
Well screened in the A and B Zones

0.1 1. 10. 100.-0.09
0.068
0.226
0.384
0.542
0.7
Time (sec)
Dis
pla
cem
ent (f
t)
WELL TEST ANALYSIS
Data Set: C:\...\NH-C16-390-10psi.aqtDate: 03/11/13 Time: 10:44:42
PROJECT INFORMATION
Company: AMECLocation: NHOUTest Well: NH-C16-390Test Date: 1/30/13
AQUIFER DATA
Saturated Thickness: 121.7 ft Anisotropy Ratio (Kz/Kr): 1.
WELL DATA (NH-C16-390)
Initial Displacement: 0.899 ft Static Water Column Height: 121.7 ftTotal Well Penetration Depth: 121.7 ft Screen Length: 50. ftCasing Radius: 0.1667 ft Well Radius: 0.25 ft
SOLUTION
Aquifer Model: Unconfined Solution Method: Springer-Gelhar
K = 56.8 ft/day Le = 91.2 ft
Well screened in the A and B Zones

0.1 1. 10. 100.-0.2
0.44
1.08
1.72
2.36
3.
Time (sec)
Dis
pla
cem
ent (f
t)
WELL TEST ANALYSIS
Data Set: C:\...\NH-C16-390-30psi.aqtDate: 03/11/13 Time: 10:44:50
PROJECT INFORMATION
Company: AMECLocation: NHOUTest Well: NH-C16-390Test Date: 1/30/13
AQUIFER DATA
Saturated Thickness: 121.7 ft Anisotropy Ratio (Kz/Kr): 1.
WELL DATA (NH-C16-390)
Initial Displacement: 2.276 ft Static Water Column Height: 121.7 ftTotal Well Penetration Depth: 121.7 ft Screen Length: 50. ftCasing Radius: 0.1667 ft Well Radius: 0.25 ft
SOLUTION
Aquifer Model: Unconfined Solution Method: Springer-Gelhar
K = 56. ft/day Le = 87.1 ft
Well screened in the A and B Zones

0.1 1. 10. 100.-0.02
0.084
0.188
0.292
0.396
0.5
Time (sec)
Dis
pla
cem
ent (f
t)
WELL TEST ANALYSIS
Data Set: C:\...\NH-C17-255-5psi.aqtDate: 03/11/13 Time: 10:44:57
PROJECT INFORMATION
Company: AMECLocation: NHOUTest Well: NH-C17-255Test Date: 1/30/13
AQUIFER DATA
Saturated Thickness: 102.8 ft Anisotropy Ratio (Kz/Kr): 1.
WELL DATA (NH-C17-255)
Initial Displacement: 0.558 ft Static Water Column Height: 71.83 ftTotal Well Penetration Depth: 71.82 ft Screen Length: 70. ftCasing Radius: 0.1667 ft Well Radius: 0.25 ft
SOLUTION
Aquifer Model: Unconfined Solution Method: Springer-Gelhar
K = 43.62 ft/day Le = 0.1 ft
Well screened in the A Zone

0. 10. 20. 30. 40. 50.0.001
0.01
0.1
1.
Time (sec)
Dis
pla
cem
ent (f
t)
WELL TEST ANALYSIS
Data Set: C:\...\NH-C17-255-5psi_BR.aqtDate: 03/11/13 Time: 10:45:06
PROJECT INFORMATION
Company: AMECLocation: NHOUTest Well: NH-C17-255Test Date: 1/30/13
AQUIFER DATA
Saturated Thickness: 102.8 ft Anisotropy Ratio (Kz/Kr): 1.
WELL DATA (NH-C17-255)
Initial Displacement: 0.558 ft Static Water Column Height: 71.83 ftTotal Well Penetration Depth: 71.82 ft Screen Length: 70. ftCasing Radius: 0.1667 ft Well Radius: 0.25 ft
SOLUTION
Aquifer Model: Unconfined Solution Method: Bouwer-Rice
K = 37.91 ft/day y0 = 0.4735 ft
Well screened in the A Zone

0.1 1. 10. 100.-0.005
0.196
0.397
0.598
0.799
1.
Time (sec)
Dis
pla
cem
ent (f
t)
WELL TEST ANALYSIS
Data Set: C:\...\NH-C17-255-15psi.aqtDate: 03/11/13 Time: 10:45:21
PROJECT INFORMATION
Company: AMECLocation: NHOUTest Well: NH-C17-255Test Date: 1/30/13
AQUIFER DATA
Saturated Thickness: 102.8 ft Anisotropy Ratio (Kz/Kr): 1.
WELL DATA (NH-C17-255)
Initial Displacement: 1.179 ft Static Water Column Height: 71.83 ftTotal Well Penetration Depth: 71.82 ft Screen Length: 70. ftCasing Radius: 0.1667 ft Well Radius: 0.25 ft
SOLUTION
Aquifer Model: Unconfined Solution Method: Springer-Gelhar
K = 34.65 ft/day Le = 26.3 ft
Well screened in the A Zone

0. 8. 16. 24. 32. 40.0.001
0.01
0.1
1.
Time (sec)
Dis
pla
cem
ent (f
t)
WELL TEST ANALYSIS
Data Set: C:\...\NH-C17-255-15psi_BR.aqtDate: 03/11/13 Time: 10:45:30
PROJECT INFORMATION
Company: AMECLocation: NHOUTest Well: NH-C17-255Test Date: 1/30/13
AQUIFER DATA
Saturated Thickness: 102.8 ft Anisotropy Ratio (Kz/Kr): 1.
WELL DATA (NH-C17-255)
Initial Displacement: 1.179 ft Static Water Column Height: 71.83 ftTotal Well Penetration Depth: 71.82 ft Screen Length: 70. ftCasing Radius: 0.1667 ft Well Radius: 0.25 ft
SOLUTION
Aquifer Model: Unconfined Solution Method: Bouwer-Rice
K = 46.45 ft/day y0 = 1.21 ft
Well screened in the A Zone

0.1 1. 10. 100.-0.004
0.397
0.798
1.2
1.6
2.
Time (sec)
Dis
pla
cem
ent (f
t)
WELL TEST ANALYSIS
Data Set: C:\...\NH-C17-255-20psi.aqtDate: 03/11/13 Time: 10:45:37
PROJECT INFORMATION
Company: AMECLocation: NHOUTest Well: NH-C17-255Test Date: 1/30/13
AQUIFER DATA
Saturated Thickness: 102.8 ft Anisotropy Ratio (Kz/Kr): 1.
WELL DATA (NH-C17-255)
Initial Displacement: 1.42 ft Static Water Column Height: 71.83 ftTotal Well Penetration Depth: 71.82 ft Screen Length: 70. ftCasing Radius: 0.1667 ft Well Radius: 0.25 ft
SOLUTION
Aquifer Model: Unconfined Solution Method: Springer-Gelhar
K = 35.39 ft/day Le = 23.99 ft
Well screened in the A Zone

0. 10. 20. 30. 40. 50.0.001
0.01
0.1
1.
10.
Time (sec)
Dis
pla
cem
ent (f
t)
WELL TEST ANALYSIS
Data Set: C:\...\NH-C17-255-20psi_BR.aqtDate: 03/11/13 Time: 10:45:46
PROJECT INFORMATION
Company: AMECLocation: NHOUTest Well: NH-C17-255Test Date: 1/30/13
AQUIFER DATA
Saturated Thickness: 102.8 ft Anisotropy Ratio (Kz/Kr): 1.
WELL DATA (NH-C17-255)
Initial Displacement: 1.42 ft Static Water Column Height: 71.83 ftTotal Well Penetration Depth: 71.82 ft Screen Length: 70. ftCasing Radius: 0.1667 ft Well Radius: 0.25 ft
SOLUTION
Aquifer Model: Unconfined Solution Method: Bouwer-Rice
K = 48.34 ft/day y0 = 1.961 ft
Well screened in the A Zone

0.1 1. 10. 100.-0.2
-0.02
0.16
0.34
0.52
0.7
Time (sec)
Dis
pla
cem
ent (f
t)
WELL TEST ANALYSIS
Data Set: C:\...\NH-C19-290-5psi-1.aqtDate: 03/11/13 Time: 10:53:25
PROJECT INFORMATION
Company: AMECLocation: NHOUTest Well: NH-C19-290Test Date: 2/6/13
AQUIFER DATA
Saturated Thickness: 111.5 ft Anisotropy Ratio (Kz/Kr): 1.
WELL DATA (NH-C19-290)
Initial Displacement: 0.702 ft Static Water Column Height: 63.97 ftTotal Well Penetration Depth: 63.97 ft Screen Length: 60. ftCasing Radius: 0.1667 ft Well Radius: 0.25 ft
SOLUTION
Aquifer Model: Unconfined Solution Method: Springer-Gelhar
K = 37.26 ft/day Le = 60.26 ft
Well screened in the A Zone

0.1 1. 10. 100.-0.2
-0.06
0.08
0.22
0.36
0.5
Time (sec)
Dis
pla
cem
ent (f
t)
WELL TEST ANALYSIS
Data Set: C:\...\NH-C19-290-5psi-2.aqtDate: 03/11/13 Time: 10:53:17
PROJECT INFORMATION
Company: AMECLocation: NHOUTest Well: NH-C19-290Test Date: 2/6/13
AQUIFER DATA
Saturated Thickness: 111.5 ft Anisotropy Ratio (Kz/Kr): 1.
WELL DATA (NH-C19-290)
Initial Displacement: 0.639 ft Static Water Column Height: 63.97 ftTotal Well Penetration Depth: 63.97 ft Screen Length: 60. ftCasing Radius: 0.1667 ft Well Radius: 0.25 ft
SOLUTION
Aquifer Model: Unconfined Solution Method: Springer-Gelhar
K = 52.64 ft/day Le = 25.12 ft
Well screened in the A Zone

0.1 1. 10. 100.-0.06
0.092
0.244
0.396
0.548
0.7
Time (sec)
Dis
pla
cem
ent (f
t)
WELL TEST ANALYSIS
Data Set: C:\...\NH-C19-290-10psi.aqtDate: 03/11/13 Time: 10:53:07
PROJECT INFORMATION
Company: AMECLocation: NHOUTest Well: NH-C19-290Test Date: 2/6/13
AQUIFER DATA
Saturated Thickness: 111.5 ft Anisotropy Ratio (Kz/Kr): 1.
WELL DATA (NH-C19-290)
Initial Displacement: 1.161 ft Static Water Column Height: 63.97 ftTotal Well Penetration Depth: 63.97 ft Screen Length: 60. ftCasing Radius: 0.1667 ft Well Radius: 0.25 ft
SOLUTION
Aquifer Model: Unconfined Solution Method: Springer-Gelhar
K = 68.68 ft/day Le = 6.918 ft
Well screened in the A Zone

0.1 1. 10. 100.-0.04
0.368
0.776
1.18
1.59
2.
Time (sec)
Dis
pla
cem
ent (f
t)
WELL TEST ANALYSIS
Data Set: C:\...\NH-C19-290-20psi.aqtDate: 03/11/13 Time: 10:52:58
PROJECT INFORMATION
Company: AMECLocation: NHOUTest Well: NH-C19-290Test Date: 2/6/13
AQUIFER DATA
Saturated Thickness: 111.5 ft Anisotropy Ratio (Kz/Kr): 1.
WELL DATA (NH-C19-290)
Initial Displacement: 1.689 ft Static Water Column Height: 63.97 ftTotal Well Penetration Depth: 63.97 ft Screen Length: 60. ftCasing Radius: 0.1667 ft Well Radius: 0.25 ft
SOLUTION
Aquifer Model: Unconfined Solution Method: Springer-Gelhar
K = 43.34 ft/day Le = 21.88 ft
Well screened in the A Zone

0.1 1. 10. 100. 1000.-0.04
0.568
1.18
1.78
2.39
3.
Time (sec)
Dis
pla
cem
ent (f
t)
WELL TEST ANALYSIS
Data Set: C:\...\NH-C19-290-30psi.aqtDate: 03/11/13 Time: 10:52:51
PROJECT INFORMATION
Company: AMECLocation: NHOUTest Well: NH-C19-290Test Date: 2/6/13
AQUIFER DATA
Saturated Thickness: 111.5 ft Anisotropy Ratio (Kz/Kr): 1.
WELL DATA (NH-C19-290)
Initial Displacement: 1.973 ft Static Water Column Height: 63.97 ftTotal Well Penetration Depth: 63.97 ft Screen Length: 60. ftCasing Radius: 0.1667 ft Well Radius: 0.25 ft
SOLUTION
Aquifer Model: Unconfined Solution Method: Springer-Gelhar
K = 34.42 ft/day Le = 30.2 ft
Well screened in the A Zone

0.1 1. 10. 100.-0.7
-0.46
-0.22
0.02
0.26
0.5
Time (sec)
Dis
pla
cem
ent (f
t)
WELL TEST ANALYSIS
Data Set: C:\...\NH-C19-360-5psi.aqtDate: 03/11/13 Time: 10:52:44
PROJECT INFORMATION
Company: AMECLocation: NHOUTest Well: NH-C19-360Test Date: 2/6/13
AQUIFER DATA
Saturated Thickness: 134.4 ft Anisotropy Ratio (Kz/Kr): 1.
WELL DATA (NH-C19-360)
Initial Displacement: 0.565 ft Static Water Column Height: 134.4 ftTotal Well Penetration Depth: 134.4 ft Screen Length: 60. ftCasing Radius: 0.1667 ft Well Radius: 0.25 ft
SOLUTION
Aquifer Model: Unconfined Solution Method: Springer-Gelhar
K = 114.3 ft/day Le = 91.92 ft
Well screened in the A and B Zones

0.1 1. 10. 100.-0.2
-0.02
0.16
0.34
0.52
0.7
Time (sec)
Dis
pla
cem
ent (f
t)
WELL TEST ANALYSIS
Data Set: C:\...\NH-C19-360-10psi.aqtDate: 03/11/13 Time: 10:52:36
PROJECT INFORMATION
Company: AMECLocation: NHOUTest Well: NH-C19-360Test Date: 2/6/13
AQUIFER DATA
Saturated Thickness: 134.4 ft Anisotropy Ratio (Kz/Kr): 1.
WELL DATA (NH-C19-360)
Initial Displacement: 0.87 ft Static Water Column Height: 134.4 ftTotal Well Penetration Depth: 134.4 ft Screen Length: 60. ftCasing Radius: 0.1667 ft Well Radius: 0.25 ft
SOLUTION
Aquifer Model: Unconfined Solution Method: Springer-Gelhar
K = 64.26 ft/day Le = 91.92 ft
Well screened in the A and B Zones

0.1 1. 10. 100.-0.3
0.16
0.62
1.08
1.54
2.
Time (sec)
Dis
pla
cem
ent (f
t)
WELL TEST ANALYSIS
Data Set: C:\...\NH-C19-360-20psi.aqtDate: 03/11/13 Time: 10:52:27
PROJECT INFORMATION
Company: AMECLocation: NHOUTest Well: NH-C19-360Test Date: 2/6/13
AQUIFER DATA
Saturated Thickness: 134.4 ft Anisotropy Ratio (Kz/Kr): 1.
WELL DATA (NH-C19-360)
Initial Displacement: 1.5 ft Static Water Column Height: 134.4 ftTotal Well Penetration Depth: 134.4 ft Screen Length: 60. ftCasing Radius: 0.1667 ft Well Radius: 0.25 ft
SOLUTION
Aquifer Model: Unconfined Solution Method: Springer-Gelhar
K = 64.28 ft/day Le = 91.92 ft
Well screened in the A and B Zones

0.1 1. 10. 100.-0.5
0.
0.5
1.
1.5
2.
Time (sec)
Dis
pla
cem
ent (f
t)
WELL TEST ANALYSIS
Data Set: C:\...\NH-C19-360-30psi.aqtDate: 03/11/13 Time: 10:52:19
PROJECT INFORMATION
Company: AMECLocation: NHOUTest Well: NH-C19-360Test Date: 2/6/13
AQUIFER DATA
Saturated Thickness: 134.4 ft Anisotropy Ratio (Kz/Kr): 1.
WELL DATA (NH-C19-360)
Initial Displacement: 1.973 ft Static Water Column Height: 134.4 ftTotal Well Penetration Depth: 134.4 ft Screen Length: 60. ftCasing Radius: 0.1667 ft Well Radius: 0.25 ft
SOLUTION
Aquifer Model: Unconfined Solution Method: Springer-Gelhar
K = 63. ft/day Le = 105.5 ft
Well screened in the A and B Zones

0.1 1. 10. 100.-0.2
-0.06
0.08
0.22
0.36
0.5
Time (sec)
Dis
pla
cem
ent (f
t)
WELL TEST ANALYSIS
Data Set: C:\...\NH-C22-460-5psi.aqtDate: 03/11/13 Time: 10:45:56
PROJECT INFORMATION
Company: AMECLocation: NHOUTest Well: NH-C22-460Test Date: 1/29/13
AQUIFER DATA
Saturated Thickness: 167.7 ft Anisotropy Ratio (Kz/Kr): 1.
WELL DATA (NH-C22-460)
Initial Displacement: 0.623 ft Static Water Column Height: 167.7 ftTotal Well Penetration Depth: 167.7 ft Screen Length: 70. ftCasing Radius: 0.1667 ft Well Radius: 0.25 ft
SOLUTION
Aquifer Model: Unconfined Solution Method: Springer-Gelhar
K = 75.6 ft/day Le = 98.61 ft
Well screened in the B Zone

0.1 1. 10. 100.-0.4
-0.18
0.04
0.26
0.48
0.7
Time (sec)
Dis
pla
cem
ent (f
t)
WELL TEST ANALYSIS
Data Set: C:\...\NH-C22-460-10psi.aqtDate: 03/11/13 Time: 10:46:06
PROJECT INFORMATION
Company: AMECLocation: NHOUTest Well: NH-C22-460Test Date: 1/29/13
AQUIFER DATA
Saturated Thickness: 167.7 ft Anisotropy Ratio (Kz/Kr): 1.
WELL DATA (NH-C22-460)
Initial Displacement: 1.004 ft Static Water Column Height: 167.7 ftTotal Well Penetration Depth: 167.7 ft Screen Length: 70. ftCasing Radius: 0.1667 ft Well Radius: 0.25 ft
SOLUTION
Aquifer Model: Unconfined Solution Method: Springer-Gelhar
K = 75. ft/day Le = 108.1 ft
Well screened in the B Zone
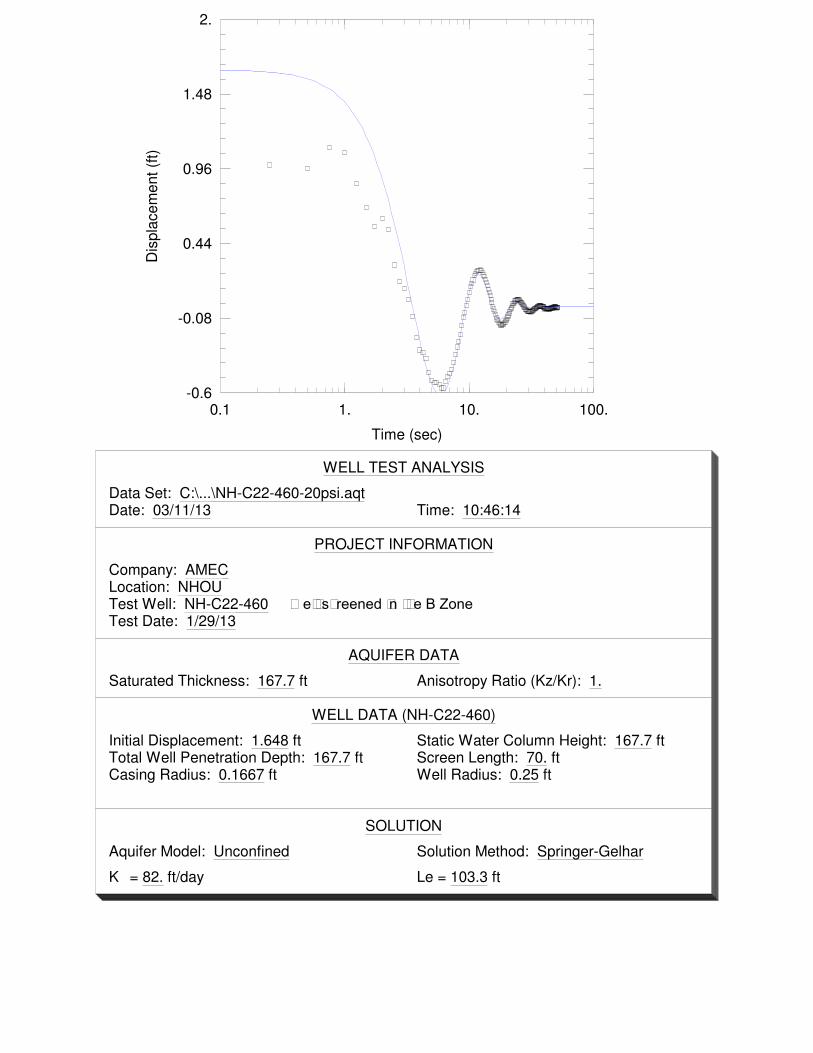
0.1 1. 10. 100.-0.6
-0.08
0.44
0.96
1.48
2.
Time (sec)
Dis
pla
cem
ent (f
t)
WELL TEST ANALYSIS
Data Set: C:\...\NH-C22-460-20psi.aqtDate: 03/11/13 Time: 10:46:14
PROJECT INFORMATION
Company: AMECLocation: NHOUTest Well: NH-C22-460Test Date: 1/29/13
AQUIFER DATA
Saturated Thickness: 167.7 ft Anisotropy Ratio (Kz/Kr): 1.
WELL DATA (NH-C22-460)
Initial Displacement: 1.648 ft Static Water Column Height: 167.7 ftTotal Well Penetration Depth: 167.7 ft Screen Length: 70. ftCasing Radius: 0.1667 ft Well Radius: 0.25 ft
SOLUTION
Aquifer Model: Unconfined Solution Method: Springer-Gelhar
K = 82. ft/day Le = 103.3 ft
Well screened in the B Zone

0.1 1. 10. 100.-0.8
-0.24
0.32
0.88
1.44
2.
Time (sec)
Dis
pla
cem
ent (f
t)
WELL TEST ANALYSIS
Data Set: C:\...\NH-C22-460-30psi.aqtDate: 03/11/13 Time: 10:46:22
PROJECT INFORMATION
Company: AMECLocation: NHOUTest Well: NH-C22-460Test Date: 1/29/13
AQUIFER DATA
Saturated Thickness: 167.7 ft Anisotropy Ratio (Kz/Kr): 1.
WELL DATA (NH-C22-460)
Initial Displacement: 1.992 ft Static Water Column Height: 167.7 ftTotal Well Penetration Depth: 167.7 ft Screen Length: 70. ftCasing Radius: 0.1667 ft Well Radius: 0.25 ft
SOLUTION
Aquifer Model: Unconfined Solution Method: Springer-Gelhar
K = 88. ft/day Le = 103.3 ft
Well screened in the B Zone

0.1 1. 10. 100.-0.008
0.0936
0.195
0.297
0.398
0.5
Time (sec)
Dis
pla
cem
ent (f
t)
WELL TEST ANALYSIS
Data Set: C:\...\NH-C23-310-5psi.aqtDate: 03/11/13 Time: 10:46:30
PROJECT INFORMATION
Company: AMECLocation: NHOUTest Well: NH-C23-310Test Date: 1/29/13
AQUIFER DATA
Saturated Thickness: 101.2 ft Anisotropy Ratio (Kz/Kr): 1.
WELL DATA (NH-C23-310)
Initial Displacement: 0.513 ft Static Water Column Height: 71.24 ftTotal Well Penetration Depth: 71.24 ft Screen Length: 60. ftCasing Radius: 0.1667 ft Well Radius: 0.25 ft
SOLUTION
Aquifer Model: Unconfined Solution Method: Springer-Gelhar
K = 34.92 ft/day Le = 0.1 ft
Well screened in the A Zone

0. 14. 28. 42. 56. 70.0.001
0.01
0.1
1.
Time (sec)
Dis
pla
cem
ent (f
t)
WELL TEST ANALYSIS
Data Set: C:\...\NH-C23-310-5psi_BR.aqtDate: 03/11/13 Time: 10:46:39
PROJECT INFORMATION
Company: AMECLocation: NHOUTest Well: NH-C23-310Test Date: 1/29/13
AQUIFER DATA
Saturated Thickness: 101.2 ft Anisotropy Ratio (Kz/Kr): 1.
WELL DATA (NH-C23-310)
Initial Displacement: 0.513 ft Static Water Column Height: 71.24 ftTotal Well Penetration Depth: 71.24 ft Screen Length: 60. ftCasing Radius: 0.1667 ft Well Radius: 0.25 ft
SOLUTION
Aquifer Model: Unconfined Solution Method: Bouwer-Rice
K = 23.79 ft/day y0 = 0.43 ft
Well screened in the A Zone

0.1 1. 10. 100.-0.005
0.156
0.317
0.478
0.639
0.8
Time (sec)
Dis
pla
cem
ent (f
t)
WELL TEST ANALYSIS
Data Set: C:\...\NH-C23-310-10psi.aqtDate: 03/11/13 Time: 10:46:47
PROJECT INFORMATION
Company: AMECLocation: NHOUTest Well: NH-C23-310Test Date: 1/29/13
AQUIFER DATA
Saturated Thickness: 101.2 ft Anisotropy Ratio (Kz/Kr): 1.
WELL DATA (NH-C23-310)
Initial Displacement: 1.137 ft Static Water Column Height: 71.24 ftTotal Well Penetration Depth: 71.24 ft Screen Length: 60. ftCasing Radius: 0.1667 ft Well Radius: 0.25 ft
SOLUTION
Aquifer Model: Unconfined Solution Method: Springer-Gelhar
K = 33.17 ft/day Le = 0.1 ft
Well screened in the A Zone

0. 18. 36. 54. 72. 90.0.001
0.01
0.1
1.
Time (sec)
Dis
pla
cem
ent (f
t)
WELL TEST ANALYSIS
Data Set: C:\...\NH-C23-310-10psi_BR.aqtDate: 03/11/13 Time: 10:46:56
PROJECT INFORMATION
Company: AMECLocation: NHOUTest Well: NH-C23-310Test Date: 1/29/13
AQUIFER DATA
Saturated Thickness: 101.2 ft Anisotropy Ratio (Kz/Kr): 1.
WELL DATA (NH-C23-310)
Initial Displacement: 1.137 ft Static Water Column Height: 71.24 ftTotal Well Penetration Depth: 71.24 ft Screen Length: 60. ftCasing Radius: 0.1667 ft Well Radius: 0.25 ft
SOLUTION
Aquifer Model: Unconfined Solution Method: Bouwer-Rice
K = 21.44 ft/day y0 = 0.6775 ft
Well screened in the A Zone

0.1 1. 10. 100.-0.008
0.394
0.795
1.2
1.6
2.
Time (sec)
Dis
pla
cem
ent (f
t)
WELL TEST ANALYSIS
Data Set: C:\...\NH-C23-310-20psi.aqtDate: 03/11/13 Time: 10:47:06
PROJECT INFORMATION
Company: AMECLocation: NHOUTest Well: NH-C23-310Test Date: 1/29/13
AQUIFER DATA
Saturated Thickness: 101.2 ft Anisotropy Ratio (Kz/Kr): 1.
WELL DATA (NH-C23-310)
Initial Displacement: 2.116 ft Static Water Column Height: 71.24 ftTotal Well Penetration Depth: 71.24 ft Screen Length: 60. ftCasing Radius: 0.1667 ft Well Radius: 0.25 ft
SOLUTION
Aquifer Model: Unconfined Solution Method: Springer-Gelhar
K = 29.39 ft/day Le = 0.1 ft
Well screened in the A Zone

0. 10. 20. 30. 40. 50.0.001
0.01
0.1
1.
10.
Time (sec)
Dis
pla
cem
ent (f
t)
WELL TEST ANALYSIS
Data Set: C:\...\NH-C23-310-20psi_BR.aqtDate: 03/11/13 Time: 10:47:15
PROJECT INFORMATION
Company: AMECLocation: NHOUTest Well: NH-C23-310Test Date: 1/29/13
AQUIFER DATA
Saturated Thickness: 101.2 ft Anisotropy Ratio (Kz/Kr): 1.
WELL DATA (NH-C23-310)
Initial Displacement: 2.116 ft Static Water Column Height: 71.24 ftTotal Well Penetration Depth: 71.24 ft Screen Length: 60. ftCasing Radius: 0.1667 ft Well Radius: 0.25 ft
SOLUTION
Aquifer Model: Unconfined Solution Method: Bouwer-Rice
K = 21.1 ft/day y0 = 1.649 ft
Well screened in the A Zone

0.1 1. 10. 100. 1000.-0.006
0.395
0.796
1.2
1.6
2.
Time (sec)
Dis
pla
cem
ent (f
t)
WELL TEST ANALYSIS
Data Set: C:\...\NH-C23-310-20psi-2.aqtDate: 03/11/13 Time: 10:47:23
PROJECT INFORMATION
Company: AMECLocation: NHOUTest Well: NH-C23-310Test Date: 1/29/13
AQUIFER DATA
Saturated Thickness: 101.2 ft Anisotropy Ratio (Kz/Kr): 1.
WELL DATA (NH-C23-310)
Initial Displacement: 1.898 ft Static Water Column Height: 71.24 ftTotal Well Penetration Depth: 71.24 ft Screen Length: 60. ftCasing Radius: 0.1667 ft Well Radius: 0.25 ft
SOLUTION
Aquifer Model: Unconfined Solution Method: Springer-Gelhar
K = 28.78 ft/day Le = 0.1 ft
Well screened in the A Zone

0. 40. 80. 120. 160. 200.0.001
0.01
0.1
1.
10.
Time (sec)
Dis
pla
cem
ent (f
t)
WELL TEST ANALYSIS
Data Set: C:\...\NH-C23-310-20psi-2_BR.aqtDate: 03/11/13 Time: 10:47:31
PROJECT INFORMATION
Company: AMECLocation: NHOUTest Well: NH-C23-310Test Date: 1/29/13
AQUIFER DATA
Saturated Thickness: 101.2 ft Anisotropy Ratio (Kz/Kr): 1.
WELL DATA (NH-C23-310)
Initial Displacement: 1.898 ft Static Water Column Height: 71.24 ftTotal Well Penetration Depth: 71.24 ft Screen Length: 60. ftCasing Radius: 0.1667 ft Well Radius: 0.25 ft
SOLUTION
Aquifer Model: Unconfined Solution Method: Bouwer-Rice
K = 18.48 ft/day y0 = 1.359 ft
Well screened in the A Zone

0.1 1. 10. 100.-0.003
0.598
1.2
1.8
2.4
3.
Time (sec)
Dis
pla
cem
ent (f
t)
WELL TEST ANALYSIS
Data Set: C:\...\NH-C23-310-30psi.aqtDate: 03/11/13 Time: 10:47:40
PROJECT INFORMATION
Company: AMECLocation: NHOUTest Well: NH-C23-310Test Date: 1/29/13
AQUIFER DATA
Saturated Thickness: 101.2 ft Anisotropy Ratio (Kz/Kr): 1.
WELL DATA (NH-C23-310)
Initial Displacement: 2.919 ft Static Water Column Height: 71.24 ftTotal Well Penetration Depth: 71.24 ft Screen Length: 60. ftCasing Radius: 0.1667 ft Well Radius: 0.25 ft
SOLUTION
Aquifer Model: Unconfined Solution Method: Springer-Gelhar
K = 27.5 ft/day Le = 0.1 ft
Well screened in the A Zone
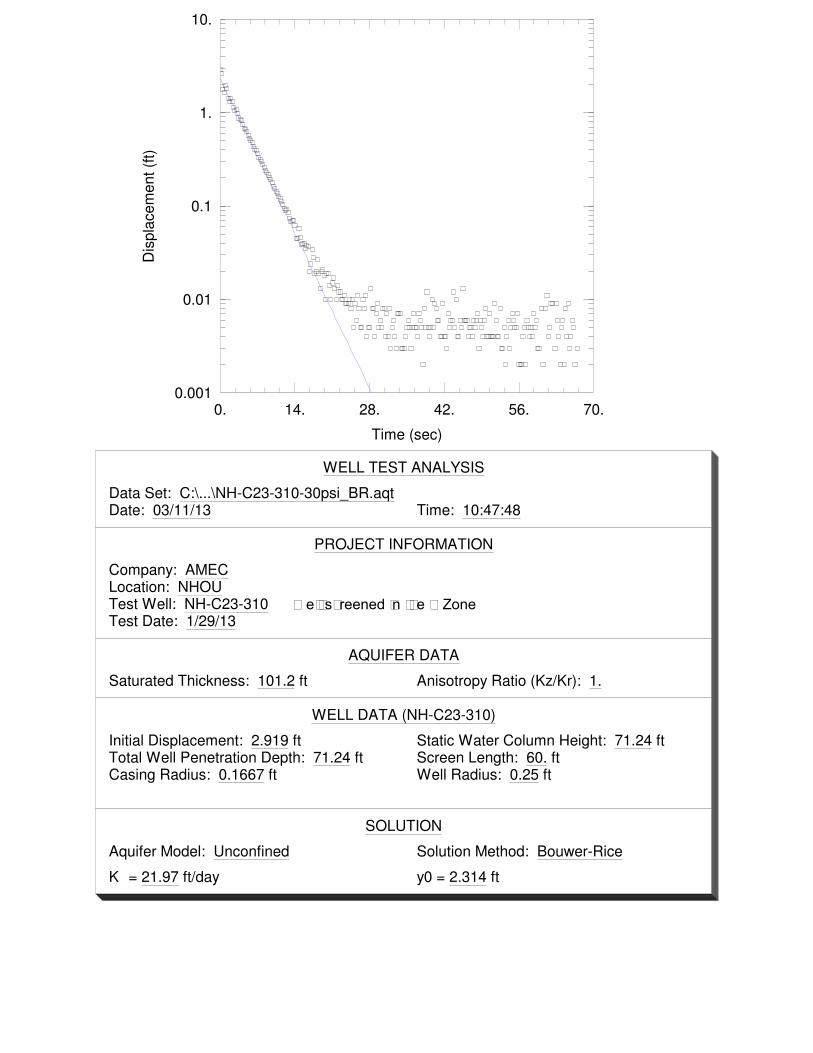
0. 14. 28. 42. 56. 70.0.001
0.01
0.1
1.
10.
Time (sec)
Dis
pla
cem
ent (f
t)
WELL TEST ANALYSIS
Data Set: C:\...\NH-C23-310-30psi_BR.aqtDate: 03/11/13 Time: 10:47:48
PROJECT INFORMATION
Company: AMECLocation: NHOUTest Well: NH-C23-310Test Date: 1/29/13
AQUIFER DATA
Saturated Thickness: 101.2 ft Anisotropy Ratio (Kz/Kr): 1.
WELL DATA (NH-C23-310)
Initial Displacement: 2.919 ft Static Water Column Height: 71.24 ftTotal Well Penetration Depth: 71.24 ft Screen Length: 60. ftCasing Radius: 0.1667 ft Well Radius: 0.25 ft
SOLUTION
Aquifer Model: Unconfined Solution Method: Bouwer-Rice
K = 21.97 ft/day y0 = 2.314 ft
Well screened in the A Zone

ATTACHMENT C
Data Validation Narrative

Sampling Date Lab Report Number Samples Included
NH-C16-390_375NH-C16-390_343
TB-1_120412EB-1_120412FB-1_120412GW18B_402TB-2_120512EB-2_1205124919D_295
TB-3_120612EB-3_120612GW-18B_405
GW-18B_405-DUP-1NH-C18-365_308NH-C18-365_348
TB-4_120712EB-4_120712
LA1-CW05-339LA1-CW05-356TB-5_121012EB-5_121012
NH-C18-270_223NHE-1_240
TB-6_121112EB-6_121112
NH-C13-385_338NH-C13-385_363
TB-7_121212EB-7_121212GB19B_401.5
GB19B_401.5-DUP-2GB19B_405.5TB-8_121312EB-8_121312
NH-C10-360_313NH-C10-360_340
TB-9_121412EB-9_121412
NH-C24-305_247TB-10_121812EB-10_121812
NH-C20-380_361NH-C20-380_322
TB-11_121912EB-11_121912
12/4/2012
12/5/2012
12/6/2012
12/6/2012
12/7/2012
12/10/2012
12/11/2012
12/12/2012
12/13/2012
12/14/2012
12/18/2012
12/19/2012
12-12-0592
12-12-0681
12-12-0198
12-12-0392
12-12-0278
12-12-0492
12-12-0393
12-12-0779
12-12-0871
12-12-1004
12-12-1196
12-12-1314
DATA VALIDATION REPORTS INDEX
Phase 1 Pre-Design InvestigationNorth Hollywood Operable Unit
ATTACHMENT C
X:\16000s\162830\3000\Phase I_Pre-Design Investigation Summary\06_ATT C\Validation Reports Index.xlsx Page 1 of 3

DATA VALIDATION REPORTS INDEX
Phase 1 Pre-Design InvestigationNorth Hollywood Operable Unit
ATTACHMENT C
4918A_297.54918A_483
TB-12_122012EB-12_122012
NH-C19-290_233NH-C19-360_349NH-C19-360_303
TB-13_122112EB-13_122112
NH-C12-360_343NH-C12-360_313NH-C14-250_203
TB-14_122612EB-14_122612
NH-C01-450_447NH-C01-450_403
TB-15_122712EB-15_122712
NH-C23-400_397NH-C23-400_343NH-C23-310_253
TB-16_122812EB-16_122812
NH-C17-339_281NH-C17-339_313
EB-17_010213TB-17_010213
NH-C21-260_213NH-C21-260_213_DUP-3
EB-18_010313TB-18_010313
NH-C21-340_283NH-C21-340_325
NH-C21-340_325_DUP-4EB-19_010413TB-19_010413
4909C-2934909C-3924909C-398
EB-20_010713TB-20_01013
NH-C19-290_233NH-C19-290_233_DUP-5
NH-C19-290_243NH-C19-290_253NH-C19-290_263NH-C19-290_273NH-C19-290_283
12/26/2012
1/7/2013
1/11/2013
12/27/2012
12/28/2012
1/2/2013
1/3/2013
1/4/2013
13-01-0662
12/20/2012
12/21/2012
13-01-0107
13-01-0196
13-01-0313
12-12-1763
12-12-1533
13-01-0042
12-12-1420
12-12-1627
12-12-1698
X:\16000s\162830\3000\Phase I_Pre-Design Investigation Summary\06_ATT C\Validation Reports Index.xlsx Page 2 of 3

DATA VALIDATION REPORTS INDEX
Phase 1 Pre-Design InvestigationNorth Hollywood Operable Unit
ATTACHMENT C
NH-C19-360_303NH-C19-360_313NH-C19-360_323NH-C19-360_333NH-C19-360_343
NH-C19-360_343_DUP-6NH-C19-360_353NH-C23-310_253NH-C23-310_263NH-C23-310_273NH-C23-310_283NH-C23-310_293NH-C23-310_303NH-C23-400_343NH-C23-400_353NH-C23-400_363NH-C23-400_373NH-C23-400_383NH-C23-400_393
TB-21_011113
1/11/2013 13-01-0663
X:\16000s\162830\3000\Phase I_Pre-Design Investigation Summary\06_ATT C\Validation Reports Index.xlsx Page 3 of 3