bp energy-outlook-2016
TRANSCRIPT


© BP p.l.c. 2016
Disclaimer
This presentation contains forward-looking statements, particularly those regarding global
economic growth, population and productivity growth, energy consumption, energy efficiency,
policy support for renewable energies, sources of energy supply and growth of carbon emissions.
Forward-looking statements involve risks and uncertainties because they relate to events, and
depend on circumstances, that will or may occur in the future. Actual outcomes may differ
depending on a variety of factors, including product supply, demand and pricing; political stability;
general economic conditions; demographic changes; legal and regulatory developments;
availability of new technologies; natural disasters and adverse weather conditions; wars and acts
of terrorism or sabotage; and other factors discussed elsewhere in this presentation. BP disclaims
any obligation to update this presentation. Neither BP p.l.c. nor any of its subsidiaries (nor their
respective officers, employees and agents) accept liability for any inaccuracies or omissions or for
any direct, indirect, special, consequential or other losses or damages of whatsoever kind in
connection to this presentation or any information contained in it.
2016 Energy Outlook 1
Unless noted otherwise, data definitions are based on the BP Statistical Review of World Energy,
and historical energy data up to 2014 are consistent with the 2015 edition of the Review. Gross
Domestic Product (GDP) is expressed in terms of real Purchasing Power Parity (PPP) at 2010 prices.

© BP p.l.c. 2016
Contents
Page
Introduction and executive summary 4
Base case
Primary energy 9
Fuel by fuel detail 19
Key issues
• What drives energy demand? 44
• The changing outlook for carbon emissions 48
• What have we learned about US shale? 52
• China’s changing energy needs 58
Main changes 63
2016 Energy Outlook 2
© BP p.l.c. 2016
Page
Key uncertainties 71
• Slower global GDP growth 74
• Faster transition to a lower-carbon world 78
• Shale oil and gas have even greater potential 82
Conclusions 86
Annex
• Key figures and fast facts 90
• Annual revisions in detail 92
• Comparison with other energy outlooks 94
• Data sources 96
2016 Energy Outlook 3
Contents (continued)

© BP p.l.c. 2016
Welcome to the 2016 edition of BP’s Energy Outlook.
Our industry remains focussed on the continuing weakness in the oil market. There are
clear signs that the market is adjusting and that it will gradually rebalance. But the
adjustment process is likely to be painful, and energy companies need to adapt to weather
the storm. That is what BP has been doing over the past year and will continue to do.
But in order to adapt successfully, we must have a clear sense of where we are heading, so
that we not only emerge from the current weakness leaner and fitter, but do so better
equipped to meet the longer-term challenges facing our industry.
That is the role of the Energy Outlook: to help lift our focus from the here-and-now and
consider how the energy landscape might evolve over the next twenty years. With that in
mind, three key features of this year’s Outlook stood out for me.
First, energy demand will continue to grow. Put simply, as the world economy expands,
more energy will be needed to fuel the higher levels of activity and living standards. The
growth in energy will be curbed by faster gains in energy efficiency. And there is of course
considerable uncertainty as to exactly how quickly global GDP will grow. Even so, it seems
clear that significantly more energy will be required over the next twenty years to enable
the world economy to grow and prosper.
4 2016 Energy Outlook

© BP p.l.c. 2016
Second, the fuel mix continues to shift. Fossil fuels remain the dominant source of energy
powering the world economy, supplying 60% of the energy increase out to 2035. Within
that, gas looks set to become the fastest growing fossil fuel, spurred on by ample supplies
and supportive environmental policies. In contrast, the growth of global coal consumption
is likely to slow sharply as the Chinese economy rebalances. Renewables are set to grow
rapidly, as their costs continue to fall and the pledges made in Paris support their
widespread adoption.
Third, the outlook for carbon emissions is changing significantly. In particular, the rate of
growth of carbon emissions is projected to more than halve over the Outlook period
relative to the past twenty years. That reflects both faster gains in energy efficiency and the
shift towards lower-carbon fuels. Despite this, carbon emissions are likely to continue to
increase, indicating the need for further policy action. In BP, we believe carbon pricing has
an important part to play as it provides incentives for everyone to play their part.
2016 looks set to be another tough year for our industry. But we have faced similar
episodes in the past and we know that the market will eventually rebalance. We need to
respond to the near-term challenges, but we mustn’t lose sight of the longer-term role of
our industry in providing the energy the world needs to grow and prosper, and doing so in
a safe and sustainable manner. We hope that this edition of the BP Energy Outlook can
make a useful contribution to informing discussions about future energy needs and trends.
Bob Dudley
Group chief executive
5 2016 Energy Outlook
© BP p.l.c. 2016
Executive summary
The Energy Outlook considers a base case, outlining the 'most likely'
path for energy demand by fuel based on assumptions and judgements
about future changes in policy, technology and the economy, and
develops a number of alternative cases to explore key uncertainties.
In the base case, world GDP more than doubles, but unprecedented
gains in energy efficiency mean that the energy required to fuel the
higher level of activity grows by only around a third over the Outlook.
Fossil fuels remain the dominant form of energy powering the global
expansion: providing around 60% of the additional energy and
accounting for almost 80% of total energy supplies in 2035.
Gas is the fastest growing fossil fuel supported by strong supply growth,
particularly of US shale gas and liquefied natural gas (LNG), and by
environmental policies.
The oil market gradually rebalances, with the current low level of prices
boosting demand and dampening supply.
2016 Energy Outlook 6

© BP p.l.c. 2016
Oil demand increases by almost 20 Mb/d over the Outlook, with growing
use in Asia for both transport and industry. Tight oil continues to grow,
although at a gradually moderating pace.
The continuing reform of China’s economy causes growth in China’s
energy demand to slow sharply. This slowing weighs heavily on global
coal, which grows at less than a fifth of its rate over the past 20 years.
Renewables grow rapidly, almost quadrupling by 2035 and supplying a
third of the growth in power generation.
The rate of growth of carbon emissions more than halves relative to the
past 20 years, reflecting gains in energy efficiency and the changing fuel
mix. But emissions continue to rise, suggesting the need for further
action.
The uncertainty around the base case is explored in three alternative
cases: slower global GDP growth; a faster transition to a lower-carbon
world; and shale oil and gas having even greater potential.
2016 Energy Outlook 7
Executive summary (continued)

8
© BP p.l.c. 2016 2016 Energy Outlook
9
Base case
Primary energy
© BP p.l.c. 2016
0
60
120
180
240
1965 2000 2035
0
3
6
9
1965 2000 2035
0 10 20 30
Other
India
Africa
China
OECD
Population
Productivity
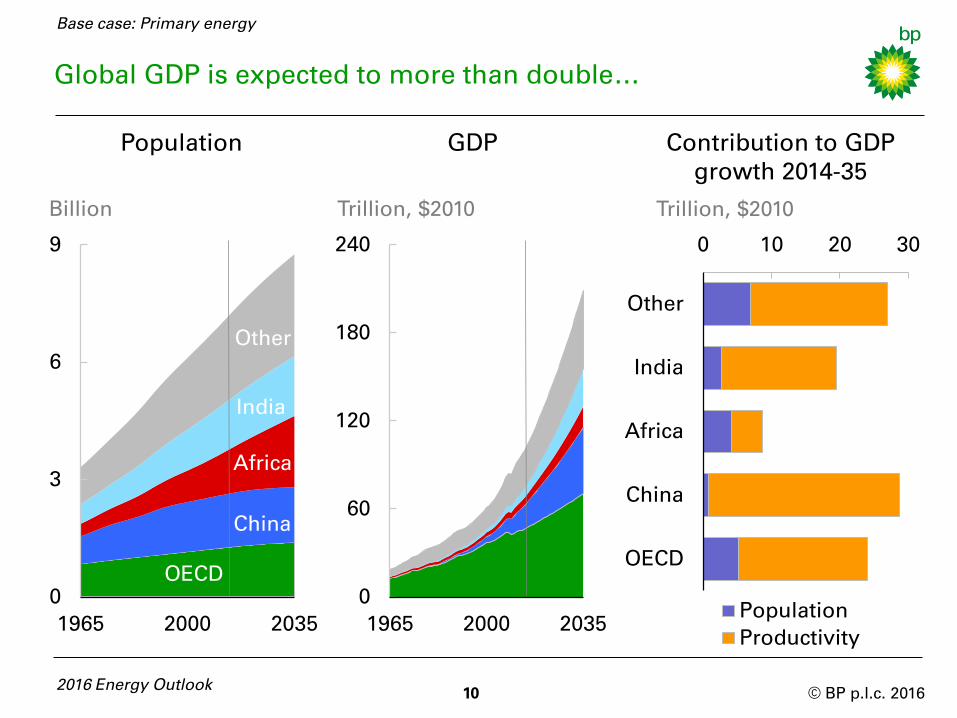
Global GDP is expected to more than double…
Contribution to GDP
growth 2014-35
OECD
2016 Energy Outlook 10
Trillion, $2010 Trillion, $2010
GDP Population
Billion
Other
China
Africa
India
Base case: Primary energy
© BP p.l.c. 2016
…driven by strong growth in emerging Asia
Population and income are the key drivers behind growing demand for
energy.
The world’s population is projected to increase by around 1.5 billion
people to reach nearly 8.8 billion people by 2035.
Over the same period, GDP is expected to more than double; around
one-fifth of that increase comes from population growth and four-fifths
from improvements in productivity (i.e. GDP per person).
China and India together account for almost half of the increase in global
GDP, with OECD economies accounting for around a quarter.
Africa accounts for almost half of the increase in the world’s population,
such that by 2035 it is projected to have 30% more people than China and
20% more than India. Yet Africa accounts for less than 10% of the
increase in both global GDP and energy consumption over the Outlook.
2016 Energy Outlook
11
Base case: Primary energy

© BP p.l.c. 2016
Growth in the world economy requires more energy…
2016 Energy Outlook 12
Billion toe
Consumption by region
Consumption growth by region
10 year average, % per annum
Transport
Other
Industry
-2%
0%
2%
4%
6%
8%
10%
12%
1975 1995 2015 2035
OECD
China
Other Asia
Other
World
0
3
6
9
12
15
18
1965 2000 2035
Th
ou
san
ds
OECD
Other
China
Other
Asia
Base case: Primary energy
© BP p.l.c. 2016
…largely consumed by fast-growing emerging economies
The growth in the world economy means more energy is required;
energy consumption increases by 34% between 2014 and 2035.
Virtually all of the additional energy is consumed in fast-growing
emerging economies; energy demand within the OECD barely grows.
The growth of energy is slower than in the recent past – 1.4% per annum
(p.a.) versus 2.3% p.a. in 2000-14 – reflecting significantly faster falls in
energy intensity (energy used per unit of GDP).
China’s energy demand growth slows as its economy rebalances,
towards a more sustainable rate. By the final decade of the Outlook,
China contributes less than 30% of global energy growth, compared with
nearly 60% over the past decade.
The sharp slowing in China’s energy demand growth is partially offset by
a pickup in other developing countries. India accounts for more than a
quarter of the growth in global energy demand in the final decade of the
Outlook, double its contribution over the past decade.
2016 Energy Outlook 13
Base case: Primary energy

© BP p.l.c. 2016
0%
10%
20%
30%
40%
50%
1965 2000 2035
The fuel mix is set to change significantly…
2016 Energy Outlook 14
*Includes biofuels
Annual demand growth by fuel
0
50
100
150
200
250
1994-2014 2014-35
Renew.*
Hydro
Nuclear
Coal
Gas
Oil
Mtoe per annum
Shares of primary energy
Oil
Coal
Gas
Hydro
Nuclear Renewables*
Base case: Primary energy
© BP p.l.c. 2016
…although oil and gas remain key sources of energy growth
Fossil fuels remain the dominant source of energy powering the global
economy, providing around 60% of the growth in energy and accounting
for almost 80% of total energy supply in 2035 (down from 86% in 2014).
Gas is the fastest growing fossil fuel (1.8% p.a.), with its share in primary
energy gradually increasing. Oil grows steadily (0.9% p.a.), although the
trend decline in its share continues.
The combined increase of oil and gas over the Outlook is similar to the
past 20 years.
In contrast, coal suffers a sharp reversal in its fortunes. After gaining
share since 2000, the growth of coal is projected to slow sharply
(0.5% p.a.), such that by 2035 the share of coal in primary energy is at an
all-time low, with gas replacing it as the second-largest fuel source.
Among non-fossil fuels, renewables (including biofuels) grow rapidly
(6.6% p.a.), causing their share in primary energy to rise from around
3% today to 9% by 2035.
2016 Energy Outlook 15
Base case: Primary energy

© BP p.l.c. 2016
Much of the growth in energy is used for power generation…
0%
25%
50%
75%
100%
1965 2000 2035
Primary inputs to power
16 2016 Energy Outlook
Coal
Gas
Oil
Hydro
Nuclear Renew.
Inputs to power as a share of
total primary energy
20%
30%
40%
50%
1965 2000 2035
Base case: Primary energy

© BP p.l.c. 2016
…as the trend towards global electrification continues
More than half of the increase in global energy consumption is used for
power generation as the long-run trend towards global electrification
continues: the share of energy used for power generation rises from 42%
today to 45% by 2035.
More than a third of the growth in power generation takes place in
regions where a large part of the population lack adequate access to
electricity – India, other developing Asia (excluding China), and Africa.
Power generation is the main sector where all fuels compete and so it
plays a major role in the evolution of the global fuel mix, with
renewables and gas gaining share relative to coal.
The outcome is a more balanced and diversified portfolio of fuels for
power generation. The share of coal declines from 43% in 2014 to around
a third in 2035. In contrast, the share of non-fossil fuels increases,
reaching nearly 45% by 2035.
2016 Energy Outlook 17
Base case: Primary energy

18
© BP p.l.c. 2016 2016 Energy Outlook
19
Base case
Fuel by fuel detail
© BP p.l.c. 2016
Strong growth in Asia drives increases in oil demand…
2016 Energy Outlook 20
Mb/d
80
85
90
95
100
105
110
115
2014 OECD
decline
Non-OECD
growth
2014 Non-OPEC
growth
OPEC
growth
Other
India
Mid East
China
Other
Other Asia
2035 level
Brazil
US
Demand Supply
Base case: Fuel by fuel detail

© BP p.l.c. 2016
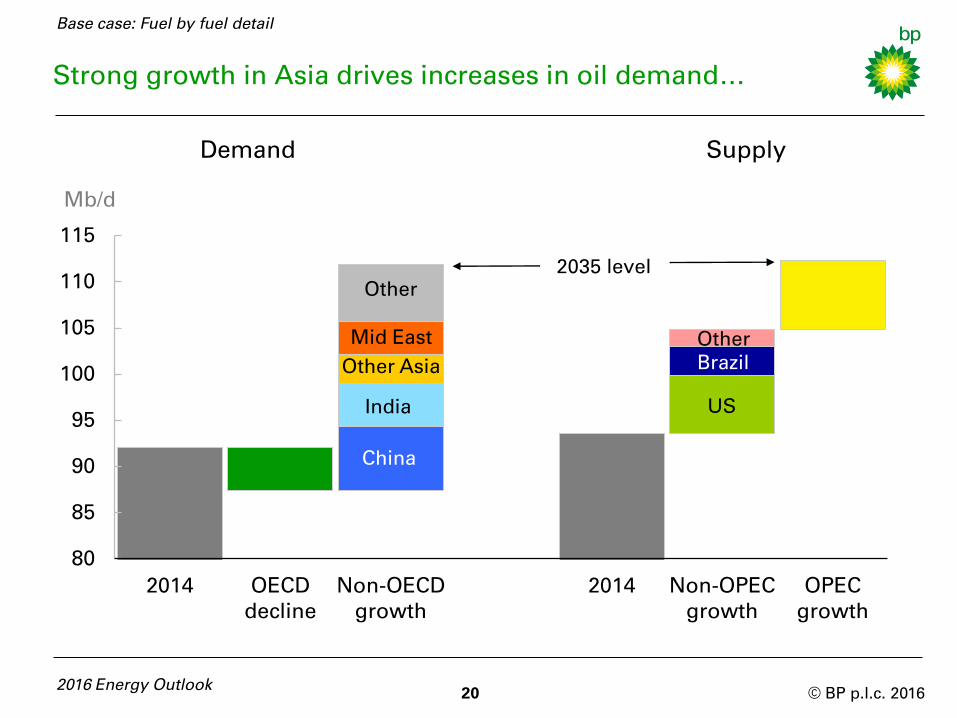
…met by increased supply from the Americas and OPEC
The oil market gradually rebalances, with the current low level of prices
boosting demand and dampening supply.
Global liquids demand (oil, biofuels, and other liquids) increases by
around 20 Mb/d, to reach 112 Mb/d by 2035.
All of this increased demand comes from emerging economies, with
China and India accounting for over half of the increase. In contrast, oil
consumption in OECD economies continues its secular decline (-5 Mb/d).
Non-OPEC supply accounts for the majority of the supply increase,
growing by 11 Mb/d, while OPEC increases by 7 Mb/d. All of the net
increase in non-OPEC supply comes from the Americas: US shale,
Brazilian deepwater and Canadian oil sands.
2016 Energy Outlook 21
Base case: Fuel by fuel detail

© BP p.l.c. 2016
Growth in liquids demand is driven by transport and industry…
22 2016 Energy Outlook
Mb/d
Liquids demand by sector
Billion toe
Transport demand by fuel
0
10
20
30
40
50
60
70
1965 2000 2035
Transport
Industry
Other
Power
0
1
2
3
4
1965 2000 2035
Electricity
Coal
Gas
Biofuels
Oil
(OECD)
Oil
(non-
OECD)
Base case: Fuel by fuel detail
© BP p.l.c. 2016
…helped by limited competition from alternative fuels
The growth in the global consumption of liquid fuels is driven by
transport and industry, with transport accounting for almost two-thirds
of the increase.
The growth in transport demand reflects rapid increases in vehicle
ownership in emerging economies, partially offset by sustained gains in
vehicle efficiency, which slow the sector’s growth post-2025.
Transport fuel continues to be dominated by oil (88% in 2035). The share
of non-oil alternatives increases from 7% in 2014 to 12% in 2035, with
natural gas the fastest growing transport fuel (6.3% p.a.).
The other major source of demand growth for liquid fuels is industrial
use, especially in petrochemicals, which is the fastest growing source of
demand.
Growth in industrial use of oil is aided by the relatively limited scope for
efficiency gains and fuel switching. Moreover, over 40% of oil used in
industry is not combusted and so is less affected by climate policies.
2016 Energy Outlook 23
Base case: Fuel by fuel detail

© BP p.l.c. 2016
The global vehicle fleet more than doubles…
Vehicle fleet
0
1
2
3
1975 1995 2015 2035
Non-OECD
OECD
2016 Energy Outlook 24
Billion vehicles
0
5
10
15
20
1975 1995 2015 2035
US light vehicles
EU
China
Fuel economy of new cars
Litres per 100 km
Vehicle ownership
Vehicles per 1000 people
US
Germany
Japan
China
India
Base case: Fuel by fuel detail
0
300
600
900
1975 1995 2015 2035

© BP p.l.c. 2016
The global vehicle fleet (commercial vehicles and passenger cars) more
than doubles over the Outlook, from around 1.2 billion today to 2.4 billion
by 2035.
Almost all of that growth is in emerging economies: the non-OECD
vehicle fleet more than triples from about 0.5 to 1.5 billion over the
Outlook, overtaking the OECD in the early 2020s.
Growth in mature economies is much slower, as markets such as the US
and Japan are close to saturation levels in terms of vehicle ownership.
The efficiency of the vehicle fleet increases substantially over the
Outlook, improving by 2-3% p.a. compared with 1.5% p.a. over the past
decade.
As a result, in 2035, an average passenger car is expected to achieve 50
miles per gallon, compared with only 30 miles per gallon today.
2016 Energy Outlook
25
…as vehicle ownership in emerging economies grows rapidly
Base case: Fuel by fuel detail

© BP p.l.c. 2016
-50
-25
0
25
50
75
1990 2005 2020 2035
Middle East FSU
Europe Asia Pacific
S&C America Africa
N America
Non-OPEC is the largest source of supply growth...
26 2016 Energy Outlook
Mb/d
Liquids supply by type
0%
20%
40%
60%
80%
100%
0
20
40
60
80
100
120
1990 2005 2020 2035
OPEC share
(right axis)
OPEC*
Regional net balances
Mb/d
Non-OPEC
conventional
crude
Other
non-OPEC
Base case: Fuel by fuel detail
Share
*Includes crude and natural gas liquids (NGLs)
© BP p.l.c. 2016
Base case: Fuel by fuel detail
…shifting the pattern of supply and regional trade
Global liquids supply expands by nearly 19 Mb/d by 2035, led by growth
in non-OPEC supply. US shale (crude and NGLs), tight oil elsewhere,
Brazilian deepwater, Canadian oil sands and biofuels together grow by
16 Mb/d, accounting for around half of non-OPEC production in 2035.
We assume that OPEC acts to maintain its market share of around 40%,
increasing output (crude and NGLs) by 7 Mb/d to 44 Mb/d by 2035.
The shifting pattern of demand and supply cause regional oil imbalances
to shift and become more concentrated.
In particular, the increase in tight oil production, coupled with declining
demand, further reduces North America’s reliance on oil imports, with
the region set to become self-sufficient in oil over the next few years. The
removal of the US crude export ban helps this adjustment process.
In contrast, Asia’s dependence on oil imports increases significantly,
accounting for virtually all of the growth in global imports over the
Outlook and for nearly 80% of inter-regional net imports by 2035.
2016 Energy Outlook 27

© BP p.l.c. 2016
0 5 10 15 20
2020
2025
2030
2035
Refiners are challenged by spare capacity…
28 Energy Outlook 2035
NGLs production growth
Mb/d, cumulative from 2014
Global liquids supply growth
Crude and
condensate
NGLs
Other liquids
Biofuels
0 2 4 6 8
2020
2025
2030
2035
US
Middle East
Other
Mb/d, cumulative from 2014
Base case: Fuel by fuel detail

© BP p.l.c. 2016 29 Energy Outlook 2035
Of the 19 Mb/d projected growth in supplies of liquids, almost half
(9 Mb/d) is expected to be accounted for by NGLs, biofuels and other
liquids that do not require refining.
Current spare refining capacity plus planned refinery additions over the
next five years is already enough to meet the incremental growth in crude
and condensate supplies projected over the next two decades (10 Mb/d).
Assuming growth regions, such as China and India, continue to invest in
refining capacity, our Outlook implies a long period of volatile margins,
with capacity reductions required in disadvantaged refining centres.
NGLs provide the largest increment of non-refined liquids, expanding by
more than 6 Mb/d to 2035 and supporting the growth in petrochemicals
demand.
Growth is driven by the US (4 Mb/d) and the Middle East (2 Mb/d), with
the US expected to become a major exporter of LPG, to both Europe and
the Asia Pacific markets.
…and alternative supplies, particularly from NGLs
Base case: Fuel by fuel detail
© BP p.l.c. 2016
2016 Energy Outlook
30
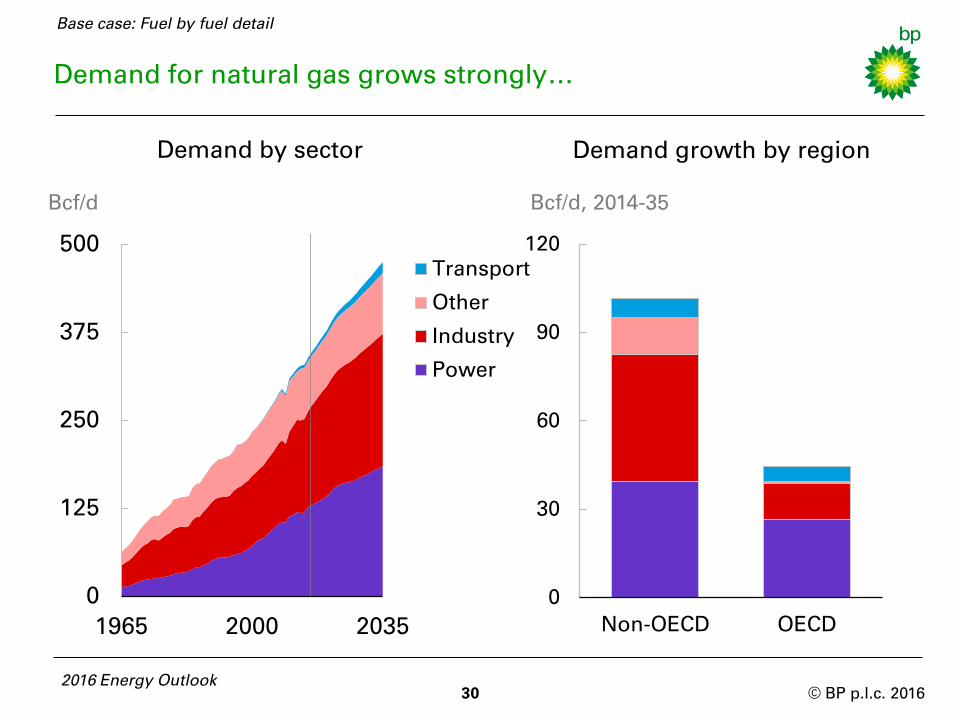
Demand for natural gas grows strongly…
Demand by sector
0
30
60
90
120
Non-OECD OECD
Transport
Other
Industry
Power
Demand growth by region
0
125
250
375
500
1965 2000 2035
Bcf/d Bcf/d, 2014-35
Base case: Fuel by fuel detail

© BP p.l.c. 2016
…driven by increasing consumption in emerging economies
Demand for natural gas grows by 1.8% p.a., making it the fastest growing
fossil fuel. This robust growth is helped by ample supplies and
supportive environmental policies.
The majority of the increase in demand comes from emerging
economies, with China and India together accounting for around 30% of
the increase and the Middle East over 20%.
The increased use of gas in emerging markets is fairly evenly split
between use in the industrial sector, as these economies continue to
industrialize, and use for power generation.
In contrast, growth in OECD gas consumption is more concentrated in
the power sector.
2016 Energy Outlook 31
Base case: Fuel by fuel detail

© BP p.l.c. 2016 2016 Energy Outlook
32
Global supplies of natural gas grow robustly…
Gas production by type and region
0
125
250
375
500
1985 2010 2035
Bcf/d
Ten year increments
Bcf/d
-25
0
25
50
75
100
1985-
1995
1995-
2005
2005-
2015
2015-
2025
2025-
2035
Non-OECD
shale
OECD shale
Non-OECD
other
OECD other
Base case: Fuel by fuel detail
Total

© BP p.l.c. 2016
…underpinned by increases in shale gas around the world
The increase in global gas supplies is roughly evenly split between
increases in conventional production and shale gas.
Much of the increase in conventional production comes from non-OECD
countries, with marked increases in the Middle East, China, and Russia.
Shale gas grows strongly (5.6% p.a.) throughout the Outlook, with the
share of shale gas in total production increasing from just over 10% in
2014 to nearly a quarter by 2035.
In the first half of the Outlook period, almost all of the growth in shale
output stems from the US. Further out, growth in China’s shale gas
production increases, such that by 2035, China is the largest contributor
to growth in shale gas production.
2016 Energy Outlook 33
Base case: Fuel by fuel detail

© BP p.l.c. 2016
0%
10%
20%
30%
40%
1990 2005 2020 2035
Trade in gas grows broadly in line with global consumption…
2016 Energy Outlook 34
Imports as share of consumption
Total trade
Pipeline
LNG
Trade as share of global consumption
-40%
-20%
0%
20%
40%
60%
80%
1990 2005 2020 2035
US
China
Europe
Base case: Fuel by fuel detail
© BP p.l.c. 2016
…with LNG playing an increasingly important role
International trade in gas grows broadly in line with global consumption,
such that the global trade share of gas remains around 30%.
But within that, LNG trade grows twice as fast as consumption, with
LNG’s share of world demand rising from 10% in 2014 to 15% in 2035.
Over 40% of the increase in global LNG supplies is expected to occur
over the next five years as a series of in-flight projects are completed.
This equates to a new LNG train coming on stream every eight weeks for
the next five years.
By 2035, LNG surpasses pipeline imports as the dominant form of traded
gas. The growing importance of LNG trade is likely to cause regional gas
prices to become increasingly integrated.
The growth in LNG coincides with a significant shift in the regional
pattern of trade. The US is likely to become a net exporter of gas later this
decade, while the dependence of Europe and China on imported gas is
projected to increase further.
2016 Energy Outlook 35
Base case: Fuel by fuel detail

© BP p.l.c. 2016
-0.4
0.0
0.4
0.8
1.2
1975-
1985
1985-
1995
1995-
2005
2005-
2015
2015-
2025
2025-
2035
Other India
China OECD
Total
36
Ten year increments by region
Billion toe
Coal consumption by region
0
1
2
3
4
5
1975 1995 2015 2035
OECD
China
India
Other
Billion toe
Growth in global coal demand slows sharply…
2016 Energy Outlook
Base case: Fuel by fuel detail
© BP p.l.c. 2016
...driven by China’s changing energy needs
Growth in global coal demand is expected to slow sharply, growing by
just 0.5% p.a. over the Outlook compared with almost 3% p.a. over the
past 20 years.
This slowdown can be largely accounted for by the deceleration in
China’s coal consumption as its economy rebalances. China’s demand
for coal grows by just 0.2% p.a. over the Outlook, down from over 8%
p.a. during 2000-14, and by 2030 it is in decline.
Even so, China remains the world’s largest coal market, consuming
almost half of global coal supplies in 2035. India shows the largest
growth in coal consumption (435 Mtoe), overtaking the US to become
the world’s second biggest consumer of coal. Over two-thirds of India’s
increased coal demand feeds into the power sector.
Coal demand is projected to fall by more than 50% in both the US and
OECD Europe, driven by plentiful supplies of gas, the falling cost of
renewables, and stronger environmental regulation.
37 2016 Energy Outlook
Base case: Fuel by fuel detail
© BP p.l.c. 2016
0
1
2
3
4
5
6
1965 2000 2035
Other
Brazil
North America
Europe
China
0
1
2
3
4
5
6
1965 2000 2035
OECD Pacific
Other
North America
Europe
China
Thousand TWh
Nuclear generation by region
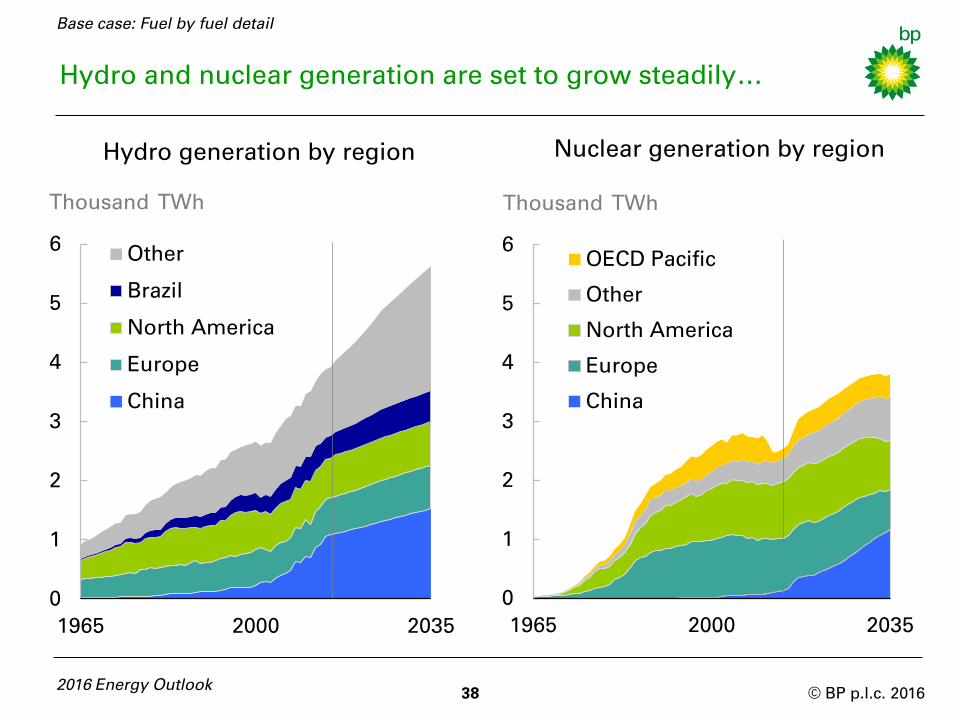
Hydro and nuclear generation are set to grow steadily…
2016 Energy Outlook 38
Thousand TWh
Hydro generation by region
Base case: Fuel by fuel detail
© BP p.l.c. 2016
…mostly driven by increases in Asia
Both hydroelectric and nuclear energy are projected to increase steadily,
growing at 1.8% p.a. and 1.9% p.a. respectively.
The period of unprecedented growth of hydro in China is coming to an
end: China hydro is expected to grow at 1.7% p.a. over the Outlook,
compared with almost 10% p.a. over the previous two decades.
Brazil supplies the second largest increase in hydro power (after China),
overtaking Canada to be the world’s second largest hydro producer.
China’s nuclear output increases rapidly (11.2% p.a.) over the Outlook – a
faster pace of growth than China’s hydro power over the past 20 years –
more than doubling by 2020 and increasing nine-fold by 2035.
Nuclear output declines in the EU (-29%) and North America (-13%), as
ageing plants are gradually decommissioned and the economic and
political challenges of nuclear energy stunt new investments.
Japanese reactors are expected to restart over the next five years to
reach 60% of their 2010 levels by 2020.
2016 Energy Outlook 39
Base case: Fuel by fuel detail
© BP p.l.c. 2016
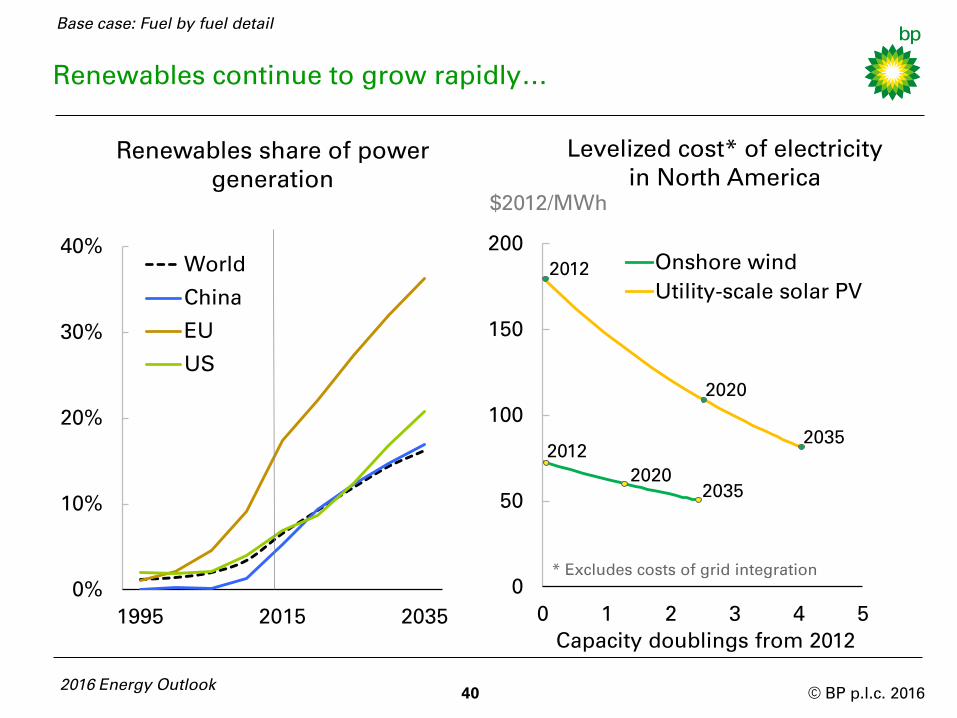
Renewables continue to grow rapidly…
40 2016 Energy Outlook
0%
10%
20%
30%
40%
1995 2015 2035
World
China
EU
US
Renewables share of power
generation
0
50
100
150
200
0 1 2 3 4 5
Onshore wind
Utility-scale solar PV
Levelized cost* of electricity
in North America
$2012/MWh
Capacity doublings from 2012
2012
2035
* Excludes costs of grid integration
Base case: Fuel by fuel detail
2020
2035
2020
2012

© BP p.l.c. 2016
…supported by significant cost reductions
Renewables are projected to be the fastest growing fuel (6.6% p.a.),
almost quadrupling over the Outlook.
Renewables account for over a third of the growth in power generation,
causing their share of global power to increase to 16% by 2035.
The EU continues to lead the way in the use of renewable power.
However, in terms of volume growth to 2035 the EU is surpassed by the
US, and China adds more than the EU and US combined.
By 2035, the penetration of renewables in some OECD markets is
expected to reach levels where the challenge of integrating intermittent
sources into the power grid becomes an increasing constraint: for
example, renewables are expected to account for more than a third of EU
power generation by 2035.
The rapid growth in renewables is supported by the expected pace of
cost reductions: the costs of onshore wind and utility-scale solar PV are
likely to fall by around 25% and 40% over the next 20 years.
2016 Energy Outlook 41
Base case: Fuel by fuel detail

42

© BP p.l.c. 2016
Base case
Key issues
What drives energy demand?
The changing outlook for carbon emissions
What have we learned about US shale?
China’s changing energy needs
2016 Energy Outlook 43
© BP p.l.c. 2016
0.0
0.1
0.2
0.3
0.4
0.5
0.6
0.7
1965 2000 2035
World
US
China
EU
India
Africa
0
200
400
600
800
1000
1200
1965 2000 2035
GDP
Primary
energy
Index (1965=100)
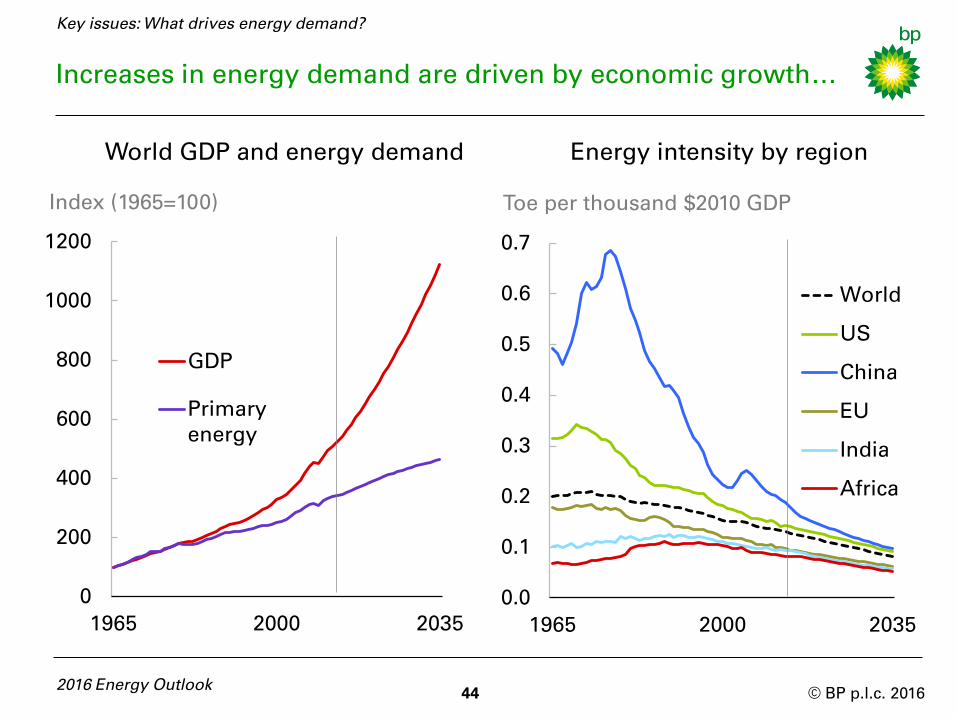
Increases in energy demand are driven by economic growth…
2016 Energy Outlook 44
World GDP and energy demand Energy intensity by region
Toe per thousand $2010 GDP
Key issues: What drives energy demand?

© BP p.l.c. 2016
…offset by significant improvements in energy intensity
As the world economy grows, more energy is required to fuel the
increased level of activity.
However, rapid improvements in energy intensity – the amount of energy
used per unit of GDP – mean that energy demand grows far less quickly
than global GDP: 34% versus 107%.
Global energy intensity is projected to decline by 2.1% p.a. over the
forecast period. This is faster than in any 20-year period in history since
our data begins in 1965, and significantly quicker than the 1.5% p.a.
average rate of decline seen over the past 20 years.
OECD energy intensity declines at a faster rate than in the past 20 years,
and the growing importance of China means the continuing declines in
China’s energy intensity have a bigger impact on the global trend.
The energy intensity of other major non-OECD economies, including
India and Africa, is projected to continue falling even as they go through
the industrialization phase of their economic development.
2016 Energy Outlook 45
Key issues: What drives energy demand?

© BP p.l.c. 2016
Alternative assumptions about energy intensity…
2016 Energy Outlook 46
World energy demand
Billion toe
Decline in world energy intensity
% per annum
Key issues: What drives energy demand?
Fastest
20-year
average
0
5
10
15
20
25
1965 2000 2035
Th
ou
san
ds
1965-2014
1994-2014
Base case
Flat demand
-4%-3%-2%-1%0%
1965-2014
1994-2014
Base case
2014-35
Flat
demand

© BP p.l.c. 2016
…can have a material impact on prospects for energy demand
For a given GDP growth path, alternative assumptions about energy
intensity can imply very different profiles for energy demand.
For example, if energy intensity declined at its average rate over the past
50 years (-0.9% p.a.), growth in energy demand by 2035 would be around
double that in the base case (71% versus 34%).
Alternatively, if energy intensity declined at the fastest rate seen in any
20 year period since 1965 (1994-2014, -1.4% p.a.), the growth in energy
demand to 2035 would be nearly 60% more than in the base case.
In order for energy demand not to grow at all over the Outlook period
('flat demand'), energy intensity would need to decline on average by
3.5% p.a.. This is far faster than any 20-year rate of decline experienced
since at least 1965 (and probably far longer) and more than double the
average rate of decline seen over the past 20 years.
2016 Energy Outlook 47
Key issues: What drives energy demand?

© BP p.l.c. 2016
The growth rate of carbon emissions more than halves…
48 Energy Outlook 2035
Decoupling emissions growth from GDP growth
% per annum
1994-2014 2014-35
GDP
CO2
Decline in
energy
intensity
Decline in
carbon
intensity
Key issues: The changing outlook for carbon emissions
0%
1%
2%
3%
4%

© BP p.l.c. 2016
…driven by faster efficiency gains and the changing fuel mix
The growth rate of carbon emissions over the Outlook is expected to
more than halve relative to the past 20 years: 0.9% p.a. versus 2.1% p.a..
Given that GDP is projected to grow only slightly slower than the
historical trend, this represents a significant degree of 'decoupling' of
carbon emissions from GDP.
This decoupling reflects significant increases in the expected pace of
decline of both energy intensity (energy used per unit of GDP) and
carbon intensity (carbon emissions per unit of energy consumption).
The world is embarking on a transition to a lower-carbon energy system.
The pledges made by participating countries in their Intended Nationally
Determined Contributions (INDCs) ahead of the COP21 meeting in Paris,
and the level of agreement reached in Paris, have increased our
confidence that the world will achieve this break from past trends.
The potential impact of an even sharper break with history, and a faster
transition to a lower carbon world, is explored in the alternative case
described later (pages 78-81).
2016 Energy Outlook 49
Key issues: The changing outlook for carbon emissions

© BP p.l.c. 2016
But carbon emissions continue to rise…
Changes in intensity
Energy intensity
Carbon
intensity
IEA 450
2013-40
Base case
2014-35
1994-2014
1965-85
Billion tonnes CO2
Carbon emissions
0
10
20
30
40
1965 2000 2035
Non-OECD
OECD
IEA 450
% per annum
50 2016 Energy Outlook
Key issues: The changing outlook for carbon emissions
-3%
-2%
-1%
0%
-3%-2%-1%0%

© BP p.l.c. 2016
…creating pressure for more policy action
Despite the slowdown in emissions growth, the level of carbon
emissions continues to grow, increasing by 20% between 2014 and 2035.
The widening gap between the projected path for emissions and, for
example, the IEA’s 450 Scenario illustrates the remaining challenge,
despite the expected reduction in the growth of carbon emissions.
Our base case already has global energy intensity declining at an
unprecedented pace, and a fall in carbon intensity that matches what the
world achieved 1965-85, when first cheap oil displaced coal from the fuel
mix and then nuclear displaced both oil and coal.
For the given projected path of GDP, achieving anything close to the
IEA’s 450 Scenario by 2035 would require an unprecedented pace of
improvement in both global energy intensity and carbon intensity.
A meaningful global price for carbon is likely to be the most efficient
mechanism through which to achieve these improvements.
2016 Energy Outlook 51
Key issues: The changing outlook for carbon emissions
© BP p.l.c. 2016
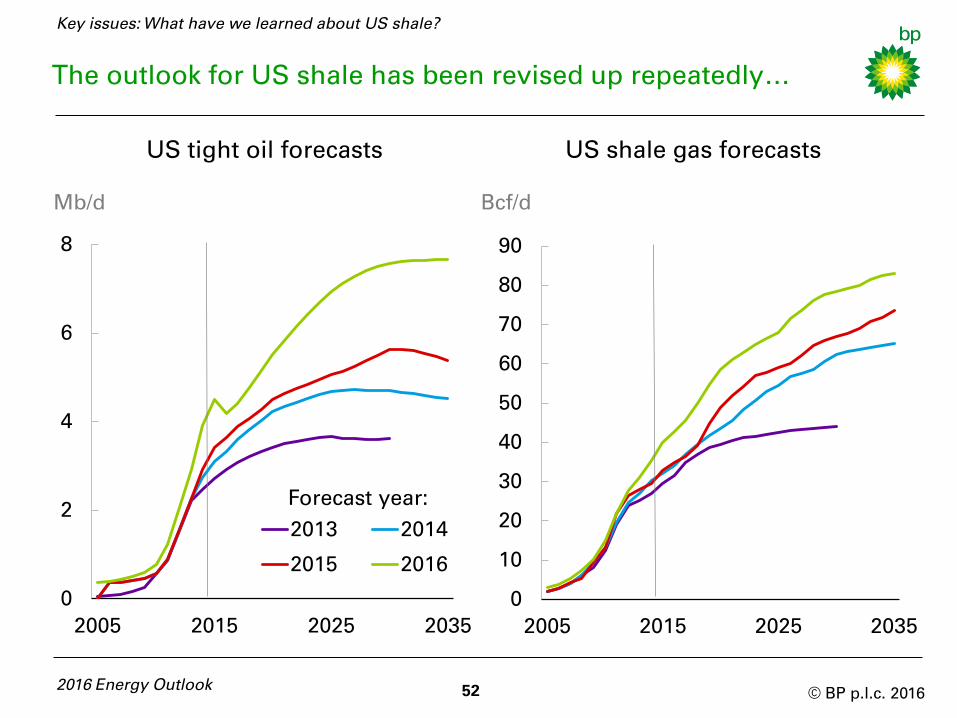
The outlook for US shale has been revised up repeatedly…
0
2
4
6
8
2005 2015 2025 2035
2013 2014
2015 2016
Mb/d
US tight oil forecasts
0
10
20
30
40
50
60
70
80
90
2005 2015 2025 2035
US shale gas forecasts
Bcf/d
2016 Energy Outlook 52
Key issues: What have we learned about US shale?
Forecast year:

© BP p.l.c. 2016
…as technology and productivity gains unlock new resources
We have been repeatedly surprised by the strength of US tight oil and
shale gas. Technological innovation and productivity gains have unlocked
vast resources of tight oil and shale gas, causing us to revise the outlook
for US production successively higher.
In the 2013 Energy Outlook, US tight oil was projected to reach 3.6 Mb/d
by 2030 – that level was surpassed in 2014. After a brief retrenchment due
to low prices and falling investment, US tight oil production is now
expected to plateau in the 2030s at nearly 8 Mb/d, accounting for almost
40% of total US oil production.
US shale gas is expected to grow by around 4% p.a. over the Outlook.
This causes US shale gas to account for around three-quarters of total
US gas production in 2035 and almost 20% of global output.
The past surprises in the strength of the shale revolution underline the
considerable uncertainty concerning its future growth. This uncertainty is
explored later in an alternative case (pages 82-85).
2016 Energy Outlook 53
Key issues: What have we learned about US shale?

© BP p.l.c. 2016
0%
2%
4%
6%
8%
10%
12%
0
2
4
6
8
10
12
2005 2015 2025 2035
Tight oil
Share of liquids
production (right axis)
2016 Energy Outlook 54
The global growth in tight oil slows…
Global tight oil production
Mb/d
Ten year increments by region
0
1
2
3
4
5
2005-15 2015-25 2025-35
S & C America
Europe & Eurasia
Asia Pacific
North America
Mb/d Share
Key issues: What have we learned about US shale?

© BP p.l.c. 2016
...as North American growth gradually moderates
Global tight oil production increases by 5.7 Mb/d over the Outlook to
around 10 Mb/d. Despite this sizeable growth, tight oil accounts for less
than 10% of all liquids production in 2035.
Growth in North American tight oil – which has been the dominant
source of growth over the past 10 years – slows gradually over the
Outlook period, constrained by the size of the resource base.
North American production is expected to grow by 2.5 Mb/d between
2015-25, and by just 1 Mb/d between 2025-35, compared with 4.5 Mb/d
during the past 10 years.
This slowing is partially offset by increased production in the rest of the
world. During the final ten years of the Outlook, almost half (0.9 Mb/d) of
the increase in tight oil production is from outside North America.
2016 Energy Outlook 55
Key issues: What have we learned about US shale?
© BP p.l.c. 2016 2016 Energy Outlook
56
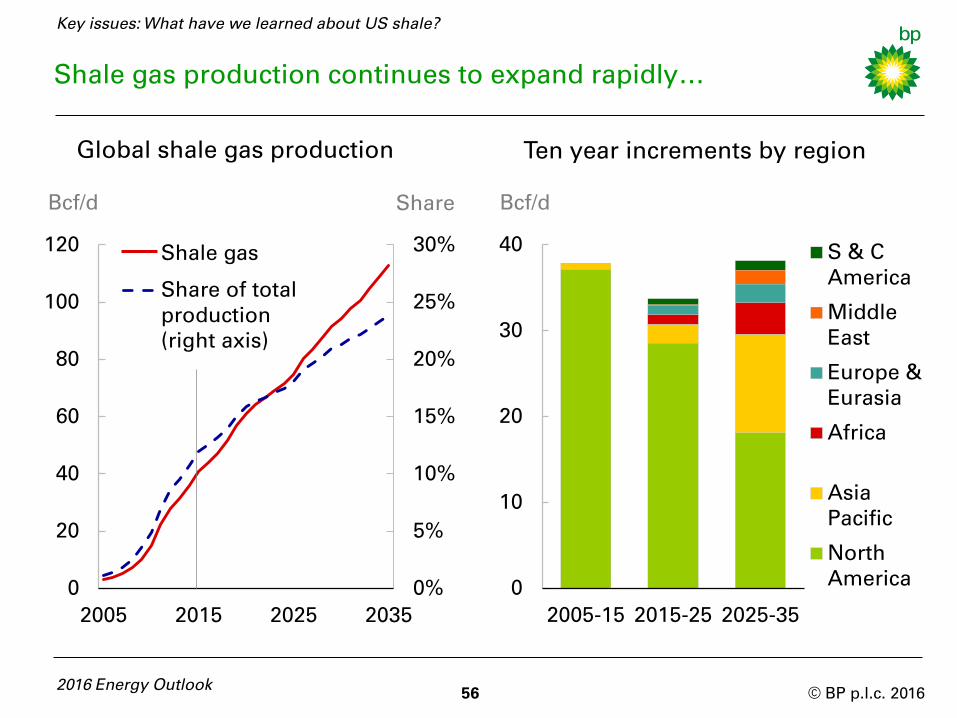
Shale gas production continues to expand rapidly…
Global shale gas production
Bcf/d
Ten year increments by region
Bcf/d
0
10
20
30
40
2005-15 2015-25 2025-35
S & C
America
Middle
East
Europe &
Eurasia
Africa
Asia
Pacific
North
America0%
5%
10%
15%
20%
25%
30%
0
20
40
60
80
100
120
2005 2015 2025 2035
Share of total
production
(right axis)
Key issues: What have we learned about US shale?
Share
Shale gas
© BP p.l.c. 2016
…helped by increasing production outside North America
Global shale gas is expected to grow by 5.6% p.a. over the Outlook, well
in excess of the growth of total gas production. As a result, the share of
shale gas in global gas production more than doubles, from 11% in 2014
to 24% by 2035.
The growth of shale gas supply is dominated by North American
production – as it has been for the past decade – which accounts for
around two-thirds of the increase in global shale gas supplies.
But over the Outlook period, we expect shale gas to expand outside
North America, most notably in Asia Pacific and particularly in China,
where shale gas production reaches 13 Bcf/d by 2035.
In the last 10 years of the Outlook, around half of the increase in shale
gas supplies comes from outside North America, with the Asia Pacific
region accounting for over 10% of global shale gas production by 2035.
2016 Energy Outlook 57
Key issues: What have we learned about US shale?

© BP p.l.c. 2016
China’s energy needs are changing…
0%
2%
4%
6%
8%
10%
2014-35
No change in
economic structure
Base case
Faster change
GDP and primary energy growth
% per annum
Primary energy growth and
changing economic structure
% per annum
0%
2%
4%
6%
8%
10%
2000-14 2014-25 2025-35
GDP
Primary energy
58 2016 Energy Outlook
Key issues: China’s changing energy needs
2000-14
© BP p.l.c. 2016
...as it adjusts to a more sustainable path
China is the world’s largest consumer of energy and has been the most
important source of growth for global energy demand over the past 20
years. But China’s energy needs are changing.
China’s demand for energy is expected to grow by less than 2% p.a. over
the Outlook, far slower than the 8% p.a. seen since 2000.
Part of this reduction is driven by slower economic growth: annual GDP
growth is projected to average close to 5% over 2014-35, around half the
average pace of growth since 2000.
But China’s energy demand growth slows by more than its GDP growth.
In part this reflects improvements in energy efficiency, and in part the
changing pattern of economic growth; with growth becoming less
dependent on highly energy-intensive industrial sectors.
The extent of the shift in China’s economic structure will have a major
bearing on China’s future energy needs. If there is little change, energy
demand might be stronger. But a bigger change, say to something akin
to the US economy by 2035, might lead to weaker energy demand.
2016 Energy Outlook 59
Key issues: China’s changing energy needs

© BP p.l.c. 2016
-0.4
0.0
0.4
0.8
1.2
1.6
2005 2015 2025 2035
China’s fuel mix is also likely to change significantly…
0%
40%
80%
1985 2010 2035
Coal
Oil
Gas
Non-fossils
2016 Energy Outlook
Ratio of coal demand growth
to GDP growth
Shares of primary energy in China
60
Average ratio during previous five years
Key issues: China’s changing energy needs
© BP p.l.c. 2016
…as China reduces its reliance on coal
China’s fuel mix is also likely to change significantly, driven by its
changing economic structure and environmental and climate policies.
In particular, China reduces its reliance on coal, with the importance of
coal in fuelling economic growth falling sharply: by the last five years of
the Outlook coal demand falls while the economy still grows.
Coal consumption grows by just 0.2% p.a. over the whole Outlook
period, and coal’s share of primary energy falls from around two-thirds
in 2014 (and over 85% in 1965) to a little less than half by 2035.
This plateauing in China’s coal demand reflects a combination of: slower
energy demand growth; the economy becoming less dependent on coal-
intensive sectors; and policies encouraging the use of alternative fuels.
The use of non-fossil fuels and gas are both expected to increase rapidly,
with their combined share in China’s energy mix more than doubling,
from just over 15% today to around a third by 2035.
2016 Energy Outlook 61
Key issues: China’s changing energy needs

62

© BP p.l.c. 2016 2016 Energy Outlook
63
Base case
Main changes

© BP p.l.c. 2016
-300
-200
-100
0
100
200
Energy Coal Renew* Gas Oil Hydro Nuclear
Range of annual revisions for
2012-2015 Outlooks**
Energy demand in 2035 has been revised down…
Mtoe
* Renewables including biofuels
-0.8%
-6.0%
13.9%
-2.8%
0.6% 2.0% 2.1%
Changes to level in 2035 relative to previous Outlook
** Revision in final year of Outlook
64 2016 Energy Outlook
Percentage revision to level in 2035
Base case: Main changes

© BP p.l.c. 2016
…due to increased energy efficiency
Energy demand in 2035 has been revised down by nearly 1% (-150 Mtoe)
relative to the 2015 Outlook. Compared with previous Outlooks, this
represents a relatively large revision to energy demand, reflecting the
judgement that energy intensity is likely to decline faster than previously
thought, helped by the agreements reached at Paris COP21.
The large downward revision to coal demand by 2035 (-6%, -270 Mtoe)
reflects both a lower expected profile for Chinese economic growth, and
environmental and climate policies encouraging a faster switch to lower
carbon fuels.
Renewables have been revised up by 14% (180 Mtoe) – the largest
revision in percentage terms – driven by faster-than-expected cost
reductions, particularly for solar, and the anticipation of more supportive
environmental policy.
Gas demand is almost 3% lower than in the 2015 Outlook (-130 Mtoe),
with downward revisions in both China (-50 Mtoe) and the EU (-37 Mtoe).
2016 Energy Outlook 65
Base case: Main changes

© BP p.l.c. 2016
-400
-300
-200
-100
0
100
200
300
400
500
2015 2020 2025 2030
Renewables
Hydro
Biofuels
Nuclear
Total
Renewables have been revised up repeatedly...
Renewable power forecasts
Mtoe
Revisions to non-fossil fuels
vs 2011 Outlook
Mtoe
0
200
400
600
800
1000
1200
1400
2010 2015 2020 2025 2030 2035
2016 2015
2014 2013
2012 2011
66 2016 Energy Outlook
Base case: Main changes
Forecast year:
Note: Projected growth from each Outlook applied to latest 2010 data
© BP p.l.c. 2016
…while other non-fossil fuels have been revised down
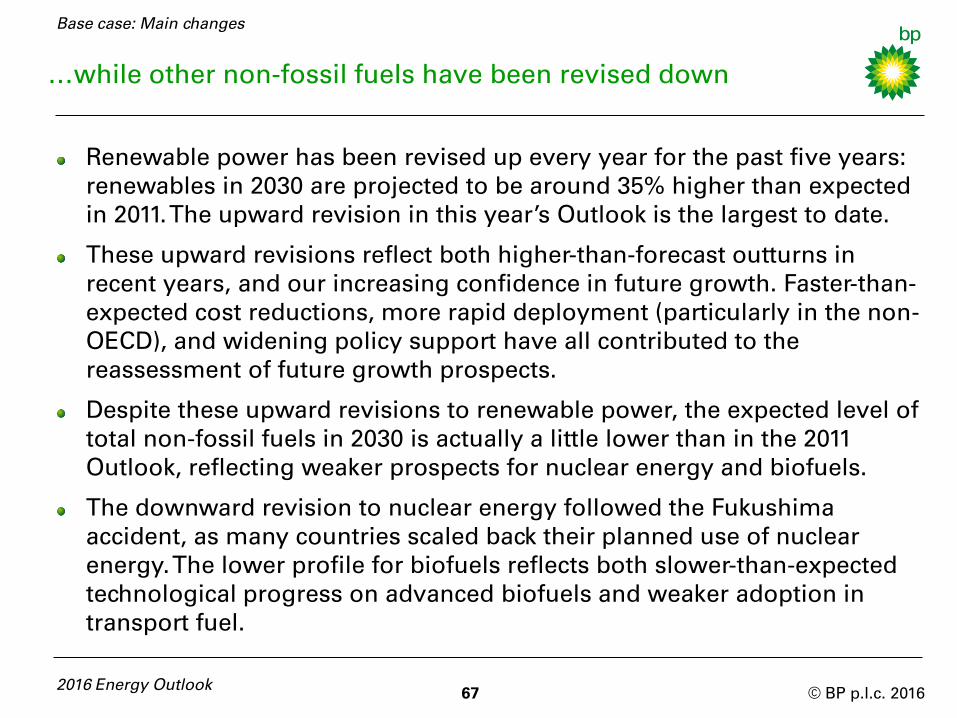
Renewable power has been revised up every year for the past five years:
renewables in 2030 are projected to be around 35% higher than expected
in 2011. The upward revision in this year’s Outlook is the largest to date.
These upward revisions reflect both higher-than-forecast outturns in
recent years, and our increasing confidence in future growth. Faster-than-
expected cost reductions, more rapid deployment (particularly in the non-
OECD), and widening policy support have all contributed to the
reassessment of future growth prospects.
Despite these upward revisions to renewable power, the expected level of
total non-fossil fuels in 2030 is actually a little lower than in the 2011
Outlook, reflecting weaker prospects for nuclear energy and biofuels.
The downward revision to nuclear energy followed the Fukushima
accident, as many countries scaled back their planned use of nuclear
energy. The lower profile for biofuels reflects both slower-than-expected
technological progress on advanced biofuels and weaker adoption in
transport fuel.
2016 Energy Outlook 67
Base case: Main changes

© BP p.l.c. 2016
Gas demand growth has been weaker than expected…
2016 Energy Outlook
Gas consumption forecasts
68
Billion toe
Key revisions in 2030 by region
(relative to 2011 Outlook)
2.5
3.0
3.5
4.0
4.5
2010 2020 2030
2016
2011
-300 -150 0 150 300
Europe
Middle East
Non-OECD Asia
North America
Mtoe
Note: Projected growth applied to latest 2010 data
-26%
-13%
-9%
25%
Base case: Main changes
Forecast year:

© BP p.l.c. 2016
…but this weakness is not expected to persist
The growth of gas consumption has been weaker than expected in recent
years, as gas has been crowded out by cheaper and more abundant coal
and, in Europe, also by the rapid growth in renewables.
As a result, gas consumption in 2030 is expected to be around 5% lower
than in the 2011 Outlook (-230 Mtoe), with significant downward revisions
to gas demand in Europe, the Middle East, and non-OECD Asia.
But this recent weakness in the growth of gas is not expected to persist,
with global gas demand projected to grow at 1.8% p.a. over 2015-30,
similar to the 2011 Outlook.
The judgement that the recent weakness in gas consumption will not
persist is based on the view that strong supply growth, particularly of US
shale gas and LNG, combined with stronger environmental policies, will
allow gas to compete against coal in Europe and Asia, as well as in North
America.
2016 Energy Outlook 69
Base case: Main changes

70

© BP p.l.c. 2016
Key uncertainties
Slower global GDP growth
Faster transition to a lower-carbon world
Shale oil and gas have even greater potential
2016 Energy Outlook 71

© BP p.l.c. 2016
Exploring the impact of alternative assumptions…
Case 1: Slower global GDP growth
Case 2: Faster transition to a lower-carbon world
Case 3: Shale oil and gas have even greater potential
72 2016 Energy Outlook
Key uncertainties

© BP p.l.c. 2016
…illustrates some of the uncertainties around the Outlook
73 2016 Energy Outlook
The base case in the Outlook presents the single 'most likely' path for
energy demand and the various fuels over the next 20 years. As such, it
helps to highlight the main trends and forces that are likely to shape
energy markets over the next two decades.
But there are of course many risks and uncertainties surrounding the
base case. It is possible to explore some of these uncertainties by
varying a few of the key assumptions and judgements underpinning the
base case and assessing their impact.
We explore three key uncertainties, which are described in more detail in
the following pages. This is not intended to be an exhaustive list, but
these alternative cases provide useful insights into how varying some of
the key assumptions might affect the projected trends.
Key uncertainties
Beyond our forecasting horizon, technological advances could radically alter the
choices available to us. The role of technology in shaping the energy landscape
over the next 30 to 40 years is explored in the BP Technology Outlook.

© BP p.l.c. 2016
Case 1: Slower global GDP growth...
74 2016 Energy Outlook
Slower GDP growth
% per annum, 20-year moving average
Historical growth rates Projected growth rates, 2014-35
Growth, % per annum
GDP
Primary energy
Base case
GDP
Primary energy
0%
1%
2%
3%
4%
5%
1985 1995 2005 2015
0%
1%
2%
3%
4%
5%
China World China World
© BP p.l.c. 2016
…has a significant impact on energy demand
The pace of growth in China and other emerging economies is a major
source of uncertainty for global GDP growth and hence energy demand.
The 'slower GDP growth' case assumes that China grows at 3.5% p.a.
over the Outlook, compared with nearly 5% p.a. in the base case.
Allowing for trade and other spill-over effects, this causes world GDP to
grow at a little below 3% p.a., 0.5% p.a. below the base case and
comparable to one of the weakest periods of economic growth seen in
recent history.
World energy demand in this alternative case increases at just 1.0% p.a.,
down from 1.4% p.a. in the base. This is far slower than seen for any
sustained period in recent history (reflecting the expectation that energy
efficiency improves at a faster rate than in the past, so low global GDP
growth translates into very low energy demand growth).
The slower growth of global GDP reduces the overall increase in energy
demand by around a third relative to the base case.
75 2016 Energy Outlook
Slower GDP growth

© BP p.l.c. 2016
-800 -600 -400 -200 0
China
Other non-
OECD Asia
Rest of World
Middle East
OECD
Demand growth is slower across all fuels...
2016 Energy Outlook 76
Energy demand by region
Differences from base case in 2035:
Mtoe Mtoe
-400 -300 -200 -100 0
Oil
Gas
Coal
Nuclear
Hydro
Renew.
-5%
-7%
-8%
-7%
-5%
-10%
-14%
-7%
-6%
-10%
-1%
Energy demand by fuel
Slower GDP growth

© BP p.l.c. 2016
…with the main reductions concentrated in emerging Asia
The slower growth in GDP affects all fuels.
Within fossil fuels, coal demand shows the largest absolute and
percentage decline relative to the base case, followed by gas and then oil.
These differential impacts largely reflect the pattern of growth of fuel use
in emerging Asia (the focus of the slower economic growth).
The lower price of fossil fuels in this alternative case, together with the
lower income and wealth stemming from the slower economic growth,
lead to a materially weaker profile for renewables.
The reduction in energy demand relative to the base case outweighs the
shift in the fuel mix, such that annual carbon emissions in 2035 are lower
than the base case level by around 7% or 3 billion tonnes of CO2.
77 2016 Energy Outlook
Slower GDP growth
© BP p.l.c. 2016
-3%
-2%
-1%
0%
-3%-2%-1%0%
0
10
20
30
40
1975 1995 2015 2035
Base case
IEA New Policies
Faster transition
IEA 450
The speed of transition to a lower-carbon energy system…
Changes in intensity
Energy intensity
Carbon
intensity
IEA 450
Base
case
1994-2014
Billion tonnes CO2
Carbon emissions
Faster
transition
Faster transition
% per annum
IEA NP
2016 Energy Outlook 78

© BP p.l.c. 2016
…has a significant impact on the outlook for energy
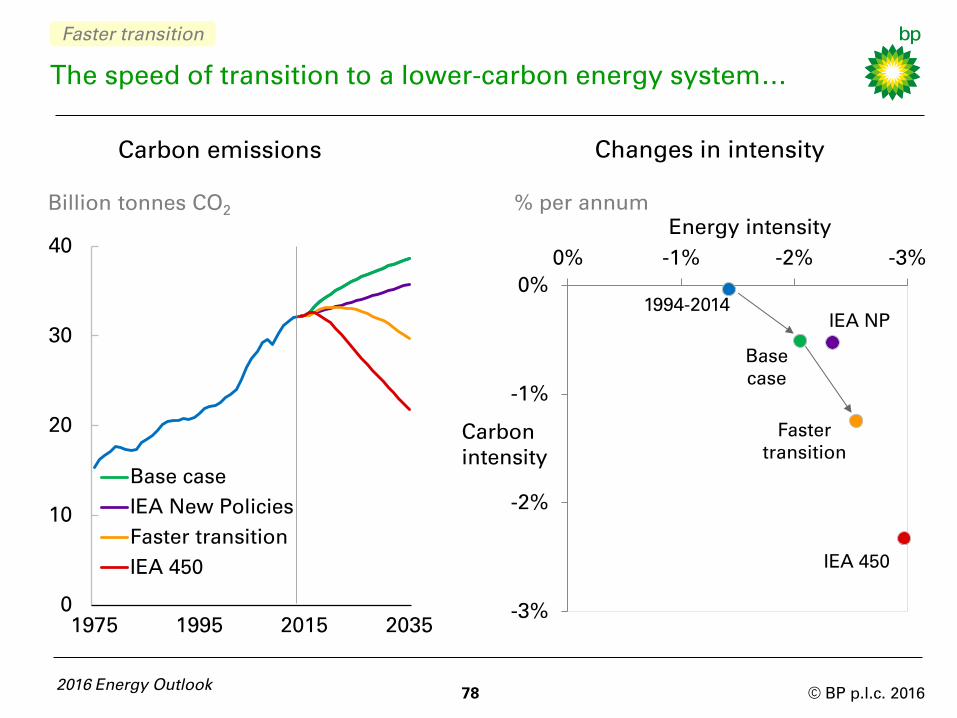
The speed of transition to a lower-carbon energy system is a key source
of uncertainty affecting the Outlook.
The 'faster transition' case is based on:
a carbon price rising to $100/tonne (real $2015) by 2035 in the OECD
and other leading economies, and at least $50/tonne elsewhere
in transport, tougher vehicle CO2 standards, policies to encourage
purchases of smaller vehicles, higher mandated biofuel blending, and
improved public transport and urban planning to reduce mileage
measures to ensure that 80% of the estimated potential for energy
efficiency gains in industry and buildings are captured by 2035.
As a result, both global energy intensity and carbon intensity improve at
unprecedented rates. Emissions peak in 2020 and by 2035 are nearly 8%
below the 2014 level. That still falls short of the IEA 450 Scenario, but goes
well beyond the pledges made in participating countries’ INDCs at Paris
(as approximated by, for example, the IEA New Policies Scenario).
79 2016 Energy Outlook
Faster transition

© BP p.l.c. 2016
The faster transition has a significant impact…
80 2016 Energy Outlook
CO2
0
1
2
3
4
5
1965 2000 2035
Hydro &
Nuclear Renewables*
Billion toe
Oil
Coal
Gas
Consumption by fuel
-100
-50
0
50
100
150
200
250
1994-
2014
Renew.*
Hydro
Nuclear
Coal
Gas
Oil
Total
Mtoe per annum
Base Faster
transition
2014-35
Faster transition
*Includes biofuels
Annual demand growth by fuel

© BP p.l.c. 2016
…on both overall energy demand and the fuel mix
Total energy demand still grows in the 'faster transition' case, but at a
reduced pace (0.9% p.a. versus 1.4% p.a. in the base case).
Non-fossil fuels supply all of the increase in energy. Fossil fuels decline
slightly, with the share of fossil fuels in total energy falling from 86%
today to around 70% by 2035.
Natural gas and oil still increase in the 'faster transition' case, accounting
for a little over half of total energy supplies in 2035, although oil demand
is declining by the second half of the Outlook. Coal consumption suffers
the most, falling by more than 30% to its lowest level since 2002.
The big winner in the 'faster transition' case is renewables, with an
almost six-fold increase in output (nearly 9% p.a.) and a 15% share of
energy by 2035. The rate at which renewables gain share from 2020 to
2035 matches oil’s gain over the 15 years of 1908-23 – years that included
the Texas oil boom, the discovery of oil in the Middle East, the British
Navy switching to oil, and the Model T Ford starting mass motorization.
81 2016 Energy Outlook
Faster transition

© BP p.l.c. 2016
0
200
400
600
800
2015 2025 2035
Shale gas
Tight oil
Case 3: Tight oil and shale gas having even greater potential…
82 2016 Energy Outlook
Differences in supply from base case
Mtoe
Shares of total oil/gas production
0%
10%
20%
30%
40%
2015 2025 2035
Shale gas
Tight oil
Stronger shale
Base case
Base case
Stronger shale
Stronger shale

© BP p.l.c. 2016
…has significant implications for global energy supplies
The continued growth of tight oil and shale gas in the US, and the spread
of shale outside North America, are key uncertainties in our Outlook.
The 'stronger shale' case assumes global shale resources are significantly
bigger than in the base case (in the US by 50% for oil and 30% for gas;
elsewhere by 100% and 50%), and productivity is 20% higher by 2035.
As a result, global supplies of tight oil and shale gas are much greater than
in the base case. The higher weight of shale gas within global gas supplies,
and the greater ability of gas to substitute for other fuels, means the
impact is more marked for shale gas than for tight oil.
Shale gas production is around 76 Bcf/d higher by 2035, with shale gas
accounting for more than a third of global gas supplies in the ‘stronger
shale' case
Global tight oil output increases to 20 Mb/d by 2035, twice its level in the
base case, with its share of total liquids output reaching 18%.
83 2016 Energy Outlook
Stronger shale

© BP p.l.c. 2016 2016 Energy Outlook
84
Higher shale output crowds out conventional production…
Consumption by fuel
Mtoe Mtoe
Differences from base case in 2035:
Stronger shale
Oil and gas production
-500
-250
0
250
500
750
1000
1250
Oil Gas
OPEC crude
Shale and tight
Other
Total
-300
-200
-100
0
100
200
300
400
Industry Power Transport Other
Other Coal Gas Oil Total

© BP p.l.c. 2016
…and other fuels
The stronger growth in shale oil and gas crowds out both conventional
supplies of oil and gas as well as other fuels.
In the oil market, tight oil is around 10 Mb/d higher by 2035 than in the
base case, whereas total oil production is only 6 Mb/d higher.
OPEC is assumed to respond to the stronger growth in tight oil by
increasing its own production in order to maintain its market share. As a
result, the decline in non-shale supplies relative to the base case (-4 Mb/d)
is concentrated within non-OPEC.
In the gas market, shale and tight gas (included in the positive supply
shock) are up by a combined 100 Bcf/d in 2035 versus the base case.
Conventional gas and coal-bed methane supplies are down by 45 Bcf/d in
aggregate, leaving total gas production 56 Bcf/d higher by 2035.
Fuel substitution is most pronounced in the power sector where gas
competes with all other fuels. The main casualty is coal, which is 260 Mtoe
lower by 2035 than in the base case; renewables are 110 Mtoe lower.
85 2016 Energy Outlook
Stronger shale

© BP p.l.c. 2016
Conclusions
2016 Energy Outlook 86

© BP p.l.c. 2016
Conclusions
87 2016 Energy Outlook
Growth rate of carbon emissions
slows sharply
– but not by enough without further
policy changes
−
Global demand for energy continues to rise
– to power increased levels of activity as the world economy
continues to grow
Fuel mix changes significantly
– coal losing, renewables gaining, and oil and gas combined
holding steady

88

© BP p.l.c. 2016
Annex
Key figures and fast facts
Annual revisions in detail
Comparison with other energy outlooks
Data sources
2016 Energy Outlook 89
© BP p.l.c. 2016 2016 Energy Outlook
90
Growth
2014-35
(p.a.)
Growth
2014-35
(cumulative)
2014
(share)
2035
(share)
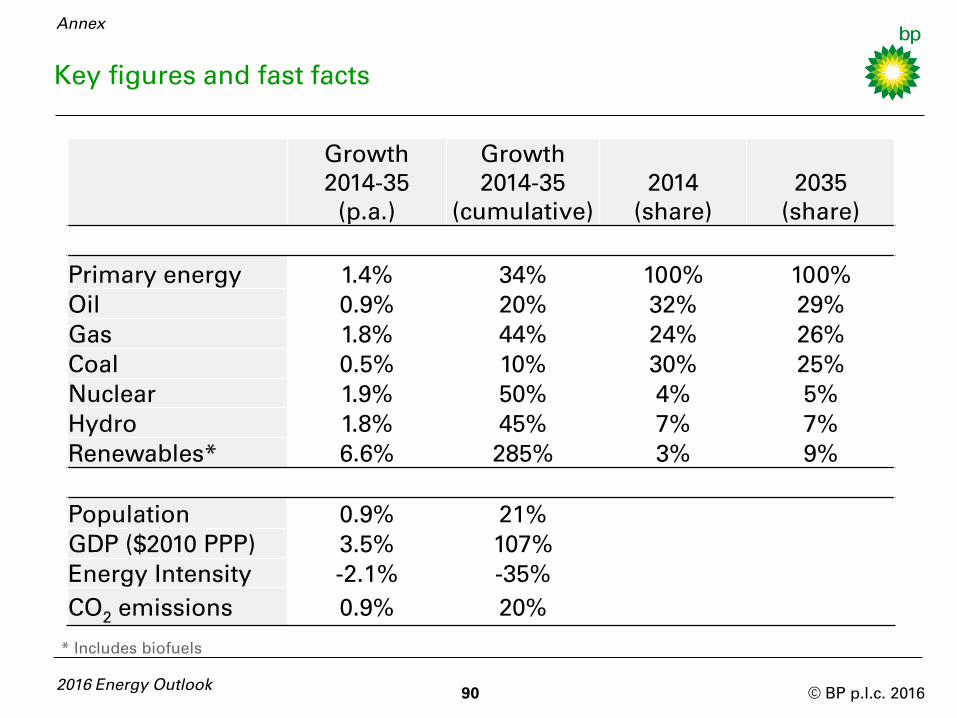
Primary energy 1.4% 34% 100% 100%
Oil 0.9% 20% 32% 29%
Gas 1.8% 44% 24% 26%
Coal 0.5% 10% 30% 25%
Nuclear 1.9% 50% 4% 5%
Hydro 1.8% 45% 7% 7%
Renewables* 6.6% 285% 3% 9%
Population 0.9% 21%
GDP ($2010 PPP) 3.5% 107%
Energy Intensity -2.1% -35%
CO2 emissions 0.9% 20%
* Includes biofuels
Annex
Key figures and fast facts

© BP p.l.c. 2016 91 2016 Energy Outlook
Renewables account for a quarter of global primary energy growth out to
2035 and over a third of the growth in global power generation.
EU energy demand in 2035 is back to where it was 50 years earlier,
despite the economy being almost 150% bigger.
The US achieves overall energy self-sufficiency by 2021 and oil self-
sufficiency by 2030.
China surpasses the US as the world’s leading oil consumer by 2035, but
per capita oil consumption will remain just 27% of the US.
The growth of global gas consumption from 2014 to 2035 is more than
the current gas production of US and Russia combined.
By 2035 coal accounts for less than 25% of primary energy, its lowest
share since the industrial revolution.
China adds more renewable power over the Outlook than the EU and US
combined.
Spare refining capacity plus planned additions over the next five years is
enough to meet the growth in crude supplies over the Outlook.
Annex

© BP p.l.c. 2016
-400 -300 -200 -100 0 100 200 300
Non-fossil fuels
Coal demand
Gas supply
Liquids supply
Energy demand
US
Other OECD
China
India
Africa
Middle East
Other non-OECD
Annual revisions in detail
Changes in 2035 levels versus the February 2015 Outlook
Mtoe
Revised down Revised up
2016 Energy Outlook 92
Annex

© BP p.l.c. 2016
Total primary energy has been revised down in 2035 by around 150 Mtoe
(or 1%) reflecting the judgement that energy intensity is likely to decline
faster than previously thought, helped by the agreements reached at
Paris COP21.
Oil supply has been revised up in the US (reflecting higher tight oil) and
Iran (due to improved investment prospects), partially offset by lower
output in Canada and Kazakhstan. The higher supply is largely matched
by higher transport demand, helped in part by current low prices.
Lower gas demand, combined with more US shale gas, has led to a
downward revision to non-OECD gas supply, particularly in Africa.
Coal demand has been revised down, due to a weaker profile for China
GDP growth and increased environmental polices.
Non-fossil fuels have been revised up in most regions, driven by faster
technological progress in solar and more supportive environmental
policy.
2016 Energy Outlook 93
Annex
© BP p.l.c. 2016
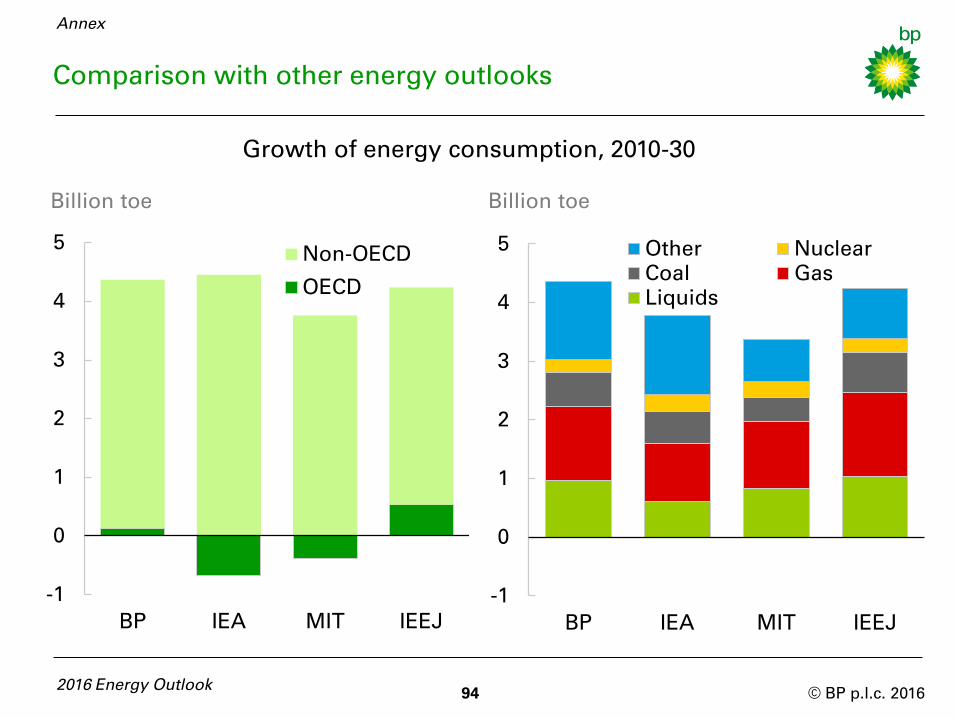
Comparison with other energy outlooks
Billion toe
-1
0
1
2
3
4
5
BP IEA MIT IEEJ
Other Nuclear
Coal Gas
Liquids
2016 Energy Outlook 94
Growth of energy consumption, 2010-30
Billion toe
-1
0
1
2
3
4
5
BP IEA MIT IEEJ
Non-OECD
OECD
Annex
© BP p.l.c. 2016
Long-run energy projections are available from several organizations. The
comparison here, against some of the outlooks in the public domain,
illustrates the range of views within a sample of central case projections.
There is broad consensus on the role of emerging markets as drivers of
energy consumption growth, with OECD economies showing little growth
or outright declines. All the outlooks show gas as the fastest growing
fossil fuel, and continuing modest growth in oil.
Beyond that, there are some significant differences among the outlooks,
at both the regional and fuel level, which reflect differences on key
assumptions, such as: the availability and cost of oil and gas supplies; the
speed of deployment of new technologies; the pace of structural change
in China; the impact of energy and environmental policies.
95 2016 Energy Outlook
Technical note: in order to facilitate the comparison, all the outlooks have been rebased to a
common set of data for 2010, taken from the BP Statistical Review of World Energy.
IEA: 'World Energy Outlook 2015', New Policies Scenario.
MIT: 'Energy & Climate Outlook, perspectives from 2015'
IEEJ: 'Asia/World Energy Outlook 2015', Reference Case
Annex
© BP p.l.c. 2016
Data sources
BP p.l.c., BP Statistical Review of World Energy, London, United Kingdom, June 2015
BP p.l.c., BP Technology Outlook, London, United Kingdom, November 2015
Energy Information Administration, Annual Energy Outlook, Washington, D.C., United States, April 2015
European Environment Agency, Monitoring CO2 emissions from new passenger cars and vans in 2014, Copenhagen,
Denmark, November 2015
IHS Automotive, Winfor International Database - World Car and Truck Data 1970-2024, Englewood, CO , United States,
December 2015
Institute of Energy Economics Japan, Asia/World Energy Outlook 2015, Tokyo, Japan, October 2015
International Council for Clean Transportation, Global passenger vehicle standards, Washington D.C., United States,
August 2015
International Energy Agency, CO2 Emissions from Fuel Combustion 2015, Paris, France, 2015
International Energy Agency, Energy Balances of Non-OECD Countries, Paris, France, 2015
International Energy Agency, Energy Balances of OECD Countries, Paris, France, 2015
International Energy Agency, World Energy Outlook 2015, Paris, France, 2015
MIT Joint Program on the Science and Policy of Global Change, Energy & Climate Outlook, perspectives from 2015,
Cambridge, USA, 2015
Mitchell, B.R., International Historical Statistics 1750-2005, Palgrave Macmillan, New York, United States, 2007
Oxford Economics Ltd, Oxford, United Kingdom
UN Population Division, World Population Prospects: The 2015 Revision, New York, United States, 2015
US Environmental Protection Agency, Light-Duty Automotive Technology, Carbon Dioxide Emissions, and Fuel Economy
Trends: 1975 through 2015, Washington D.C., United States, December 2015
2016 Energy Outlook 96
Annex