book sugarcane crop in guatemala
TRANSCRIPT

SSuuggaarrccaannee CCrroopp iinn GGuuaatteemmaallaa
EDITORS Mario Melgar Adlai Meneses Héctor Orozco Ovidio Pérez Rodolfo Espinosa
engicañaengicañaengicañaengicaña
Artemis Edinter

The Guatemalan Sugarcane Research and Training Center CENGICANA, was created by the Guatemalan Sugar Association, ASAZGUA in 1992, to support the technological advance of the sugar agroindustry, with the aim of improving the production and productivity of sugarcane crop and its derivatives. It is funded by the sugar mills of the Guatemalan Sugarcane Agro-industry, who make their contributions to the budget of the Center, in proportion to the sugar production obtained. According to the Strategic Plan (2005-2015), our Vision is "To be leaders in creating technology to increase the competitiveness of the Sugarcane Agro-industry in the region"; and our Mission is: "We are the organization of the Sugar Agroindustry responsible for generating, adapting, and transferring quality technology for profitable and sustainable development". The Board of Directors of the Center is constituted by representatives of the sugar mills and canegrowers. The Strategic and Operational Plans are made with the input from the Board of Directors, the Technical Advisory Committee, and the Technical Industrial Committee. The research areas are determined with the participation of managers and technical personnel of the sugar mills, who develop applied and specific research. The coordination of activities is the responsibility of the General Director. The Quality Management System of CENGICANA is certified according to ISO 9001:2008 standards. Research activities are carried out through the following research programs: Varieties Program, Integrated Pest Management Program, Agronomic Program and Industrial Research Program, and also the Technology Transfer and Training Program, the Analytical Services Laboratory and the Administration Unit.
i
Sugarcane Crop in Guatemala
EDITORS Mario Melgar Adlai Meneses Héctor Orozco Ovidio Pérez Rodolfo Espinosa
CENGICANA Guatemalan Sugarcane Research and Training Center
ii
Sugarcane Crop in Guatemala
EDITORS Mario Melgar Adlai Meneses Héctor Orozco Ovidio Pérez Rodolfo Espinosa
Cover design and layout: Priscila López de Alvarado (Cover photo courtesy of Dr. Mario Melgar)
© Librerías Artemis Edinter, S.A. ISBN: 978-9929-40-376-5 Printed in Guatemala by: Litografías Modernas S.A. 5ta. Calle 18-27, zona 8 de Mixco, San Cristóbal II Tel. (502) 2478-2770 CENGICANA (Guatemalan Sugarcane Research and Training Center). 2012. Sugarcane Crop in
Guatemala. Melgar, M.; Meneses, A.; Orozco, H.; Pérez, O.; and Espinosa, R. (eds.). Guatemala. 495 p.
2012
Librerías Artemis Edinter, S.A. 12 calle 10-55, zona 1. PBX: (502) 2419 9191 Fax: (502) 2238 0866
www.artemisedinter.com Guatemala, C.A.

iii
CENGICANA Guatemalan Sugarcane Research and Training Center Km. 92.5 Carretera a Santa Lucía Cotzumalguapa, Escuintla, Guatemala Phone: (502) 7828 1000 Fax: (502) 7828 1000 Email: [email protected] Email: [email protected] Web: www.cengicana.org
iv
Content
Page
Acronyms and Abreviations vi
Preface viii
I. Technological Development of the Sucarcane Agro-Industry and Perspectives Mario Melgar
1
II. Characterization of Sugarcane Growing Areas Braulio Villatoro, Ovidio Pérez
33
III. Sugarcane Breeding and Selection Héctor Orozco, José Luis Quemé, Werner Ovalle and Fredy Rosales Longo
45
IV. Biotechnology Applied to Sugarcane Crop Luis Molina and Mario Melgar
77
V. Crop Establishment Work 103
Soil Preparation for Sugarcane Planting Joel García, Braulio Villatoro, Fernando Díaz and Gil Sandoval
104
Nurseries and Commercial Planting Werner Ovalle, José Luis Quemé, Héctor Orozco and Ovidio Pérez
115
VI. Weed Control and Management Gerardo Espinoza
125
VII. Crop Nutrition And Fertilization Ovidio Pérez
141
VIII. Irrigation of Sugarcane Crop Otto Castro
171
v
Page
IX. Integrated Pest Management José Manuel Márquez
195
X. Diseases in Sugarcane Crop Werner Ovalle
225
XI. Sugarcane Ripening and Sugarcane Flowering and their Management Sugarcane Ripening Gerardo Espinoza Sugarcane Flowering and its Managment
Gerardo Espinoza and José Luis Quemé
251
252
274
XII. Sugarcane Harvesting Adlai Meneses
289
XIII. The Sugar Production Process 301 José Luis Alfaro, Enrique Velásquez, Luis Monterroso
and Rodolfo Espinosa
XIV. Sugar Agroindustry Diversification 351
Co-Generation in the Sugar Industry Mario Muñoz
352
Production of Ethanol Rodolfo Espinosa and Claudia Ovando
371
Coproducer Perspectives on Sugarcane Mario Muñoz
407
XV. Meteorology in Sugarcane Otto Castro and Alfredo Suárez
433
XVI. Climate Change and the Sugarcane Crop Alex Guerra and Alejandra Hernández
463

vi
ACRONYMS AND ABBREVIATIONS Institutions
AGG Guatemalan Managers Association
ASAZGUA Guatemalan Sugar Association
ATAGUA Guatemalan Society of Sugarcane Technologists
CAÑAMIP Integrated Pests Management Committee
CENGICANA Guatemalan Sugarcane Research and Training Center
CIASA Sugar Mills Consultants
CIRAD Centre de Coopération Internationale en Recherche Agronomique pour le Développement
CENICAÑA Centro de Investigación de la Caña de Azúcar de Colombia
COPERSUCAR Cooperative of Sugarcane, Sugar and Ethanol Producers of the State of Sao Paulo
CONCYT National Council for Science and Technology
EEGSA Electric Company of Guatemala
ENCA National Central School of Agriculture
ICC Private Institute for Climate Change Research
ICSB International Consortium of Sugarcane Biotechnology
ICTA Institute of Science and Agricultural Technology
ICUMSA International Commission for Uniform Methods of Sugar Analysis
INDE National Institute of Electrification
INSIVUMEH National Institute of Seismology, Volcanology, Meteorology and Hydrology
INTECAP Technical Institute for Training and Productivity
IPNI International Plant Nutrition Institute
ISSCT International Society of Sugar Cane Technologists
MAGA Ministry of Agriculture, Livestock and Food
TECNICAÑA Colombia Association of Sugarcane Technologists
URL Rafael Landivar University
USAC San Carlos University
USDA United States Departament of Agriculture
UVG Del Valle University
vii
Technical expressions and units Atm atmosphere dap days after planting ha hectare km kilometer Mz 0.7 hectare min minute qq 46 kilogrames TSH tonnes of sugar per hectare TCH tonnes of cane per hectare Tchd tonnes of cane/man/day t metric tonnes t cane/ha tonnes of cane per hectare t sugar/ha tonnes of sugar per hectare Sugarcane varieties B Barbados C Cuba CC CENICAÑA Colombia CG CENGICANA Guatemala Co Coimbatore CP Canal Point CTC Centro de Tecnología Canavieira ECU Ecuador Ja Jaronu L Louisiana M Mauritius MEX Mexico MPT MitrPhol, Thailand My Mayari NA North of Argentina PGM Pantaleon Guatemala Mexico PPQK Cuba PR Puerto Rico Q Queensland RB Republic of Brazil SP São Paulo
viii
PREFACE Without books, history is silent, literature dumb, science crippled, thought and speculation at a standstill.
BARBARA W. TUCHMAN
Sugarcane began to be cultivated in Guatemala in 1536, the first Guatemalan trapiches were founded in the central valley of Guatemala and in the Salama Valley, during the 16th century. In the 17th century the number of trapiches increased, the most important were in hands of religious orders. It was until the middle of the 19th century that Guatemala began to export sugar in small amounts. In 1957 the Guatemalan Sugar Association, ASAZGUA was founded and in1960, when the total production of sugar was 68,000 metric tones, the country received its first quota from the United States. The year 1960, is taken as a starting point for the modern history of sugarcane; in the world, the industrial era was highly developed and changes in the world dynamics were foreseen, it was then that sugar mills defined their modernization and growth strategy. Sugar factories evolved from local to exporting industries, becoming one of the most important agro-industrial activities of the country. When Guatemalan sugar exports expanded, the ASAZGUA started to develop a series of projects and strategies that were the driving force of the national Sugar Agro-industry. In order to increase sugarcane production, the sugar mills introduced improvements in the crop, harvest, factory, distribution and product commercialization, as well as better life conditions for the workers of the sugarcane agro-industry. In 1971, the Guatemalan Society of Sugarcane Technologists, ATAGUA was founded with the purpose of promoting the exchange of experiences and technology; as well as the spreading of technical knowledge to promote the development of the Sugarcane Agro-industry. This favored the transference of technology in congresses and symposiums with other sugarcane technical associations of Central and Latin America. In the decade of 1970 various sugar mills began to hire Guatemalan professionals and sugarcane technicians and foreign consultants, in order to improve the efficiency in the industrial operation and to design expansion and modernization projects for some sugar mills.
ix
The ASAZGUA created the Department of Agricultural Experimentation in 1974; and in 1978 Pantaleon Sugar Mill began to develop research projects. Afterwards, Santa Ana, Concepcion and La Union Sugar Mills, did it as well. The ASAZGUA created FUNDAZUCAR in 1990, the Guatemalan Sugarcane Research and Training Center CENGICANA in 1992, EXPOGRANEL in 1994; and the Department of Environmental Management. Since 1990 the Sugarcane Agro-industry started to gain a worldwide position, being among the tenth most important countries in export volume, according to the International Sugar Organization (ISO); and the third place worldwide in productivity, according to International LMC. In 2001 in Brisbane, Australia, Guatemala was designated venue for the most important sugarcane technological event worldwide. The XXV Congress of the International Society of Sugar Cane Technologists (ISSCT), which took place successfully in January 2005 in Guatemala. The Guatemalan Sugarcane Agro-industry has been permanently growing since 1960 to place Guatemala in the fifth position as sugarcane exporter in the world, the second position in Latin America and the third place in productivity worldwide (metric tons of sugar/ha). Sugar is the second agricultural product in Guatemala that creates foreign income, becoming a very important contribution to the national economy. The increase in productivity has been more remarkable in the last 20 years. In the decade of 1980-1990 an average of 6.77 tons of sugar were produced per hectare (TSH), while in the decade 2000-2010 the average was 10.11 TSH. The main factors that have had relevance in the development of the Guatemalan Sugarcane Agro-industry are: ECOLOGIC: the agro-ecologic conditions have been favorable. ORGANIZATIONAL MANAGEMENT: private industry, trade organization, export terminal, diversification (cogeneration and ethanol). TECHNOLOGIC: field operations, factory operations, research, training, technology transfer, benchmarking. SOCIAL: corporate social responsibility. The technological component has had an important part in the development of this Agro-industry. CENGICANA has formed a research and technological development system for sugarcane. Thus, it has established policies, regulatory framework, plans, organization, quality management, and a technology management system.
x
It has been also developed applied research for the cultivation of sugarcane in diverse areas of the agronomic system to increase the productivity. The research areas are: Plant Breeding, Plant Pathology, Biotechnology, Integrated Pest Management, Fertilization and Vegetal Nutrition, Irrigation, Agrometeorology, Geographic Information System and Sucrose Recovery. The research has been done jointly with the associated sugar mills. The results of all research have been presented in more than 900 publications; most of them are available at CENGICANA website www.cengicana.org. Methodologies and technologies have been generated or adapted in all areas. In this book we present in 13 chapters, the experience in research and technology transfer, in the sugarcane crop areas, where CENGICANA has worked with the sugar mills. In Chapter XIII we present: The Process of Sugar Fabrication, in Chapter XIV Sugarcane Agro-industry Diversification; and in Chapter XVI presents Climate Change and the Cultivation of Sugarcane, written by professionals of the Private Research Institute of Climate Change ICC, which is the newest organization created by the ASAZGUA in 2010. We are gratefull with the associated sugar mills, editors, authors, coauthors, translators especially to Wendy Cano, Erika Monterroso and contributors of this publication. Our desire is that this book will be useful for professionals, technicians, sugarcane growers, students and personnel of the Sugarcane Agro-industry.
Board of Directors CENGICANA 2011-2012 President: Ing. Mauricio Cabarrus Pantaleon-Concepcion Sugar Mills Vicepresident: Ing. Max Zepeda Madre Tierra Sugar Mill Secretary: Ing. Jorge Leal Magdalena Sugar Mill Treasurer: Ing. Herman Jensen Santa Ana Sugar Mill First vocal member: Ing. Jaime Botran Tulula Sugar Mill Second vocal member: Dr. Freddie Perez San Diego-Trinidad Sugar Mills Third vocal member: Ing. Jorge Sandoval La Union Sugar Mill Fourth vocal member: Ing. Arturo Gandara Sugarcane Growers Joint vocal member: Ing. Hector Ranero ASAZGUA Financial Advisor: Lic. William Calvillo ASAZGUA General Director: Dr. Mario Melgar CENGICANA
1
I. TECHNOLOGICAL DEVELOPMENT OF THE
SUGARCANE AGRO-INDUSTRY AND PERSPECTIVES
2
TECHNOLOGICAL DEVELOPMENT OF THE SUGARCANE AGRO-INDUSTRY AND
PERSPECTIVES
Mario Melgar
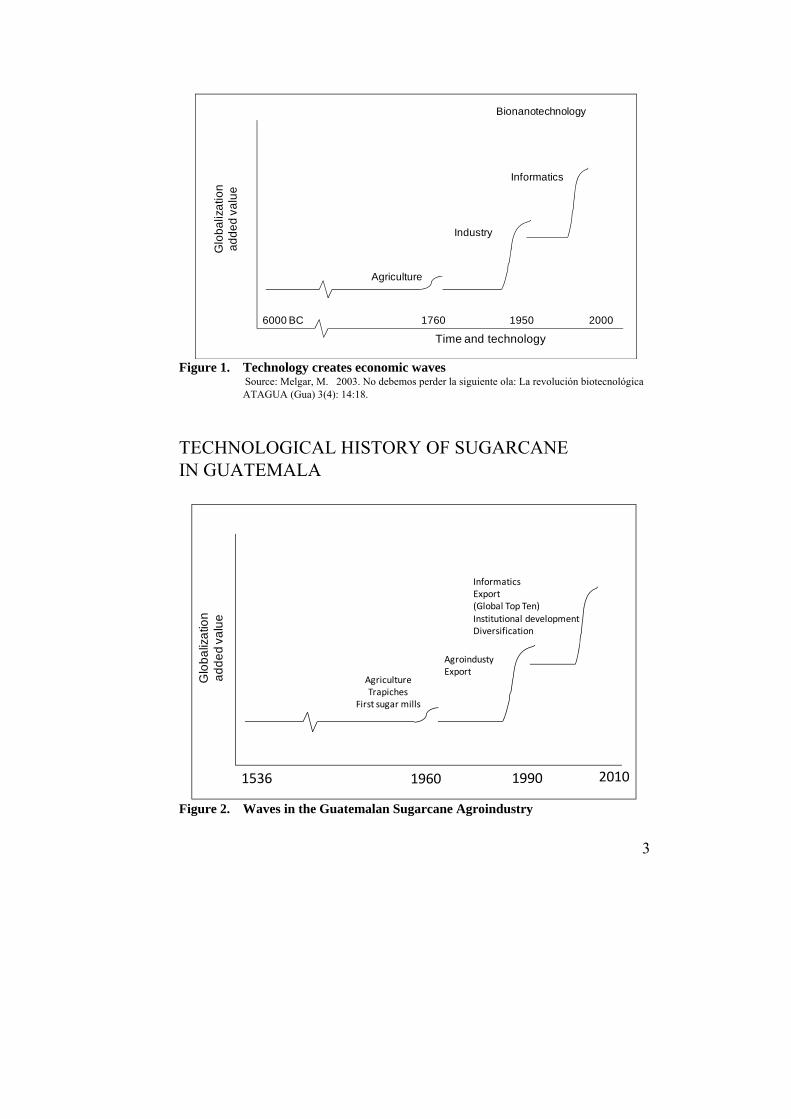
INTRODUCTION Technological development is the process of systematic organization of scientific and technological knowledge for the production of goods and services. Technology is essential knowledge, but it is a knowledge specifically organized for production. Technological development causes transformations in productive processes. According to Enriquez, 2001 “”. The success of a country, sector, organization, business or an individual, depends upon their ability to understand and apply technological changes. Alvin Tofler in his book The Third Wave, 1982 summarizes the technological history of humanity through, the impact of three waves that have triggered three revolutions. The first: the agricultural revolution; the second: the industrial revolution; and the third: the information technology revolution. Each of those waves creating a new civilization with their own jobs, lifestyles, economic structures and political thinking. Richard Oliver, in The Coming Biotech Age, 1999 suggests that the world is entering a new era or wave, “The Bionanotechnology Revolution”, which will guide the global economy in the first decades of the 21th century. In Figure 1 we can observe the evolution of these eras through time and their impact in globalization and added value terms (gross national product (GNP) per capita and life expectancy). The duration of each wave has been shorter, due to the previous accumulation of knowledge.
Ph. D. General Director of CENGICANA. www.cengicana.org
3
Figure 1. Technology creates economic waves
Source: Melgar, M. 2003. No debemos perder la siguiente ola: La revolución biotecnológica ATAGUA (Gua) 3(4): 14:18.
TECHNOLOGICAL HISTORY OF SUGARCANE IN GUATEMALA
Figure 2. Waves in the Guatemalan Sugarcane Agroindustry
Glo
ba
liza
tion
ad
de
dva
lue
6000 BC 1760 1950 2000
Time and technology
Agriculture
Industry
Informatics
Bionanotechnology
1536 1960 1990 2010
AgricultureTrapiches
First sugar mills
AgroindustyExport
InformaticsExport(Global Top Ten)Institutional developmentDiversification
Glo
ba
liza
tion
ad
de
dva
lue
4
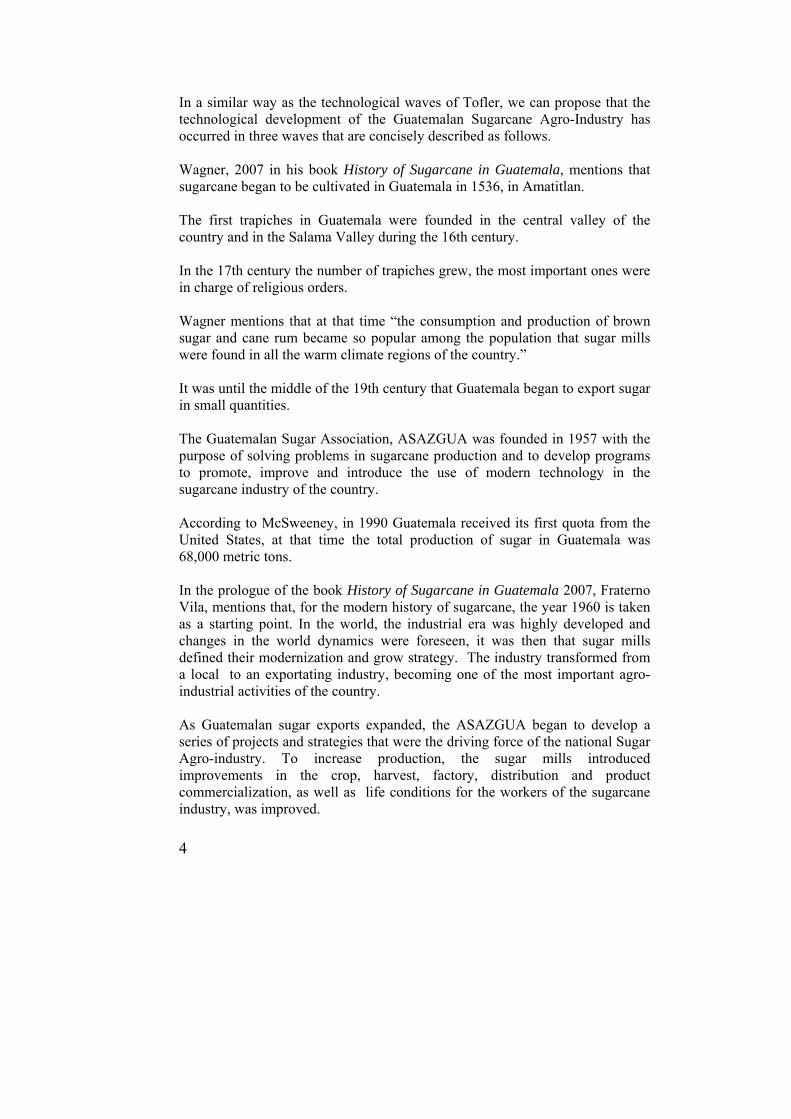
In a similar way as the technological waves of Tofler, we can propose that the technological development of the Guatemalan Sugarcane Agro-Industry has occurred in three waves that are concisely described as follows. Wagner, 2007 in his book History of Sugarcane in Guatemala, mentions that sugarcane began to be cultivated in Guatemala in 1536, in Amatitlan. The first trapiches in Guatemala were founded in the central valley of the country and in the Salama Valley during the 16th century. In the 17th century the number of trapiches grew, the most important ones were in charge of religious orders. Wagner mentions that at that time “the consumption and production of brown sugar and cane rum became so popular among the population that sugar mills were found in all the warm climate regions of the country.” It was until the middle of the 19th century that Guatemala began to export sugar in small quantities. The Guatemalan Sugar Association, ASAZGUA was founded in 1957 with the purpose of solving problems in sugarcane production and to develop programs to promote, improve and introduce the use of modern technology in the sugarcane industry of the country. According to McSweeney, in 1990 Guatemala received its first quota from the United States, at that time the total production of sugar in Guatemala was 68,000 metric tons. In the prologue of the book History of Sugarcane in Guatemala 2007, Fraterno Vila, mentions that, for the modern history of sugarcane, the year 1960 is taken as a starting point. In the world, the industrial era was highly developed and changes in the world dynamics were foreseen, it was then that sugar mills defined their modernization and grow strategy. The industry transformed from a local to an exportating industry, becoming one of the most important agro-industrial activities of the country. As Guatemalan sugar exports expanded, the ASAZGUA began to develop a series of projects and strategies that were the driving force of the national Sugar Agro-industry. To increase production, the sugar mills introduced improvements in the crop, harvest, factory, distribution and product commercialization, as well as life conditions for the workers of the sugarcane industry, was improved.

5
In 1971, the Guatemalan Society of Sugarcane Technologists, ATAGUA was founded with the purpose of promoting the exchange of experiences and technology and to spread technical knowledge to promote the development of the Sugarcane Agro-industry. This favored technology transfer with other sugarcane technical associations of Central and Latin America, through congresses and symposiums. In the decade of 1970, various sugar mills began to hire Guatemalan professionals and sugarcane technicians and foreign consultants mainly from Cuba to improve the efficiency in the industrial operation and to design expansion and modernization projects for some sugar mills. The education of sugarcane technicians in universities began in 1975, making it possible for new professionals to take important positions in the sugar mills. That is how the transformation of the Guatemalan Sugarcane Agro-industry began, which kept progressively evolving in the crop, the harvest and the transportation. ASAZGUA created the Department of Agricultural Experimentation in 1974; and in 1978 Pantaleon Sugar Mill began to develop research projects. Afterwards, Santa Ana, Concepcion and La Union Sugar Mills, did it as well. The ASAZGUA created: The Sugar Foundation, FUNDAZUCAR 1990, whose mission is “To become the model for promoting social development, replicable for other sectors of the country”; The Guatemalan Sugarcane Research and Training Center, CENGICANA in 1992, whose mission is: "We are the organization of the Sugar Industry responsible for generating, adapting and transferring quality technology for profitable and sustainable development"; EXPOGRANEL in 1994, whose mission is “To be the shipment terminal that facilitates the competitiveness of The Guatemalan sugarcane industry worldwide through the effective and reliable management of exportating sugar”; and in 1994, it created the Environmental Management Department. Since 1990 the Sugarcane Agro-industry reached a position worldwide, and Guatemala is situated among the tenth most important countries in export volume, according to the International Sugar Organization (ISO); and it is
6
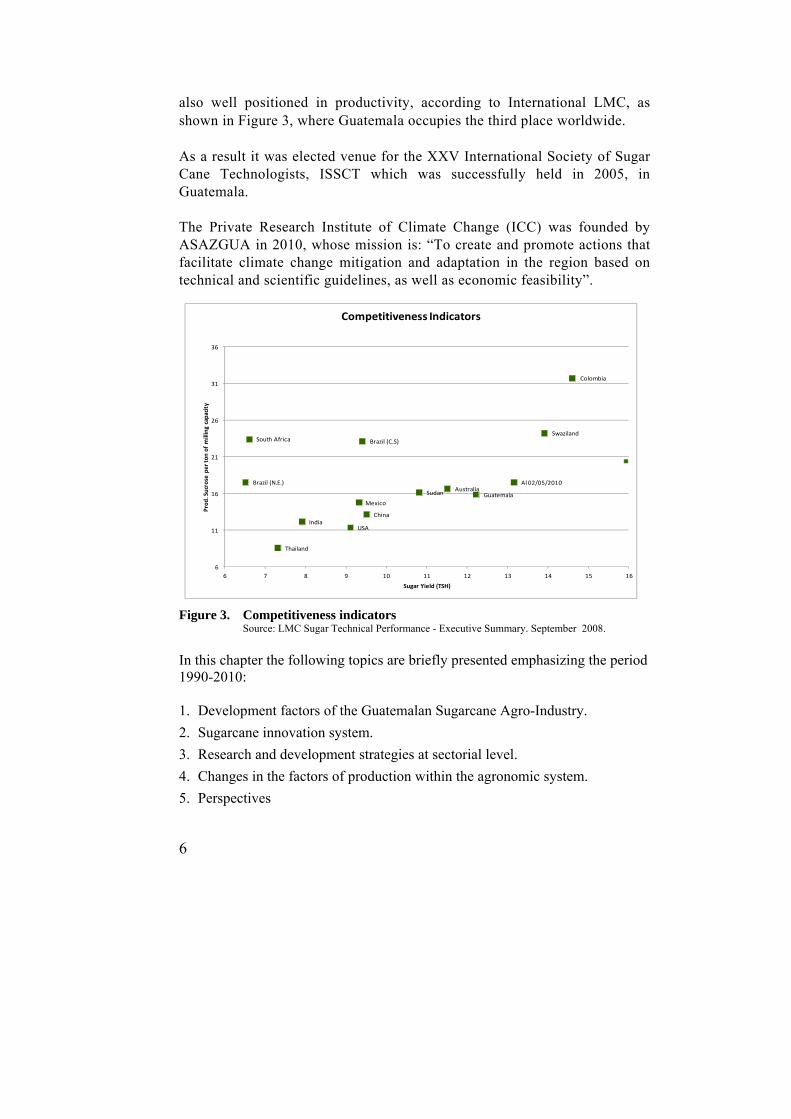
also well positioned in productivity, according to International LMC, as shown in Figure 3, where Guatemala occupies the third place worldwide. As a result it was elected venue for the XXV International Society of Sugar Cane Technologists, ISSCT which was successfully held in 2005, in Guatemala. The Private Research Institute of Climate Change (ICC) was founded by ASAZGUA in 2010, whose mission is: “To create and promote actions that facilitate climate change mitigation and adaptation in the region based on technical and scientific guidelines, as well as economic feasibility”.
Figure 3. Competitiveness indicators
Source: LMC Sugar Technical Performance - Executive Summary. September 2008.
In this chapter the following topics are briefly presented emphasizing the period 1990-2010: 1. Development factors of the Guatemalan Sugarcane Agro-Industry.
2. Sugarcane innovation system.
3. Research and development strategies at sectorial level.
4. Changes in the factors of production within the agronomic system.
5. Perspectives
Australia
Brazil (C.S)
Brazil (N.E.)
China
Colombia
Guatemala
India
Mexico
South Africa
Sudan
Swaziland
Thailand
USA
Al 02/05/2010
6
11
16
21
26
31
36
6 7 8 9 10 11 12 13 14 15 16
Prod. Sucrose per ton of milling capacity
Sugar Yield (TSH)
Competitiveness Indicators
7
DEVELOPMENT FACTORS The Guatemalan Sugarcane Agro-industry has been growing permanently since 1960, as far as to position Guatemala as follows: Fifth place as sugarcane export country worldwide, second in Latin America
and third in productivity (sugar metric tons/ha) worldwide (Figure 3). Sugar is the second agricultural product in Guatemala, generating foreign
currency incomes, becoming a very important contribution to the national economy (Chart 4).
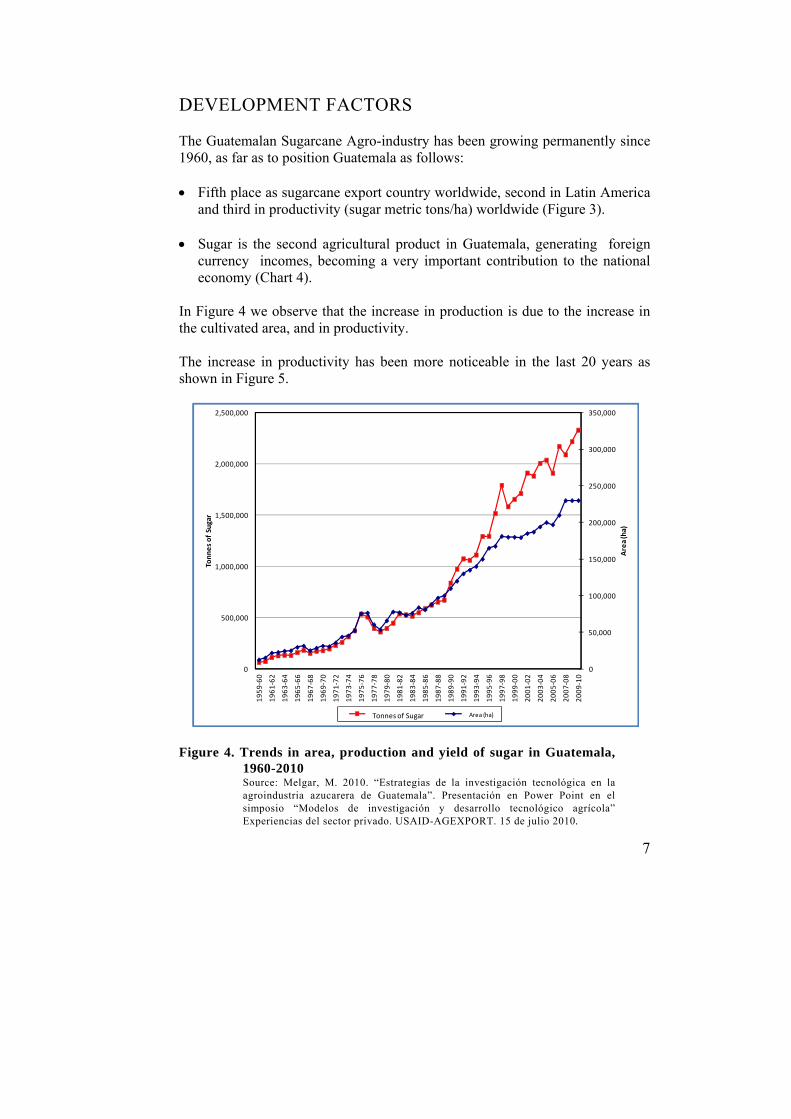
In Figure 4 we observe that the increase in production is due to the increase in the cultivated area, and in productivity. The increase in productivity has been more noticeable in the last 20 years as shown in Figure 5.
Figure 4. Trends in area, production and yield of sugar in Guatemala,
1960-2010 Source: Melgar, M. 2010. “Estrategias de la investigación tecnológica en la agroindustria azucarera de Guatemala”. Presentación en Power Point en el simposio “Modelos de investigación y desarrollo tecnológico agrícola” Experiencias del sector privado. USAID-AGEXPORT. 15 de julio 2010.
0
50,000
100,000
150,000
200,000
250,000
300,000
350,000
0
500,000
1,000,000
1,500,000
2,000,000
2,500,000
1959‐60
1961‐62
1963‐64
1965‐66
1967‐68
1969‐70
1971‐72
1973‐74
1975‐76
1977‐78
1979‐80
1981‐82
1983‐84
1985‐86
1987‐88
1989‐90
1991‐92
1993‐94
1995‐96
1997‐98
1999‐00
2001‐02
2003‐04
2005‐06
2007‐08
2009‐10
Area(ha)
Tonnesof Sugar
Toneladas de Azúcar Área (ha)Tonnesof Sugar Area (ha)
8
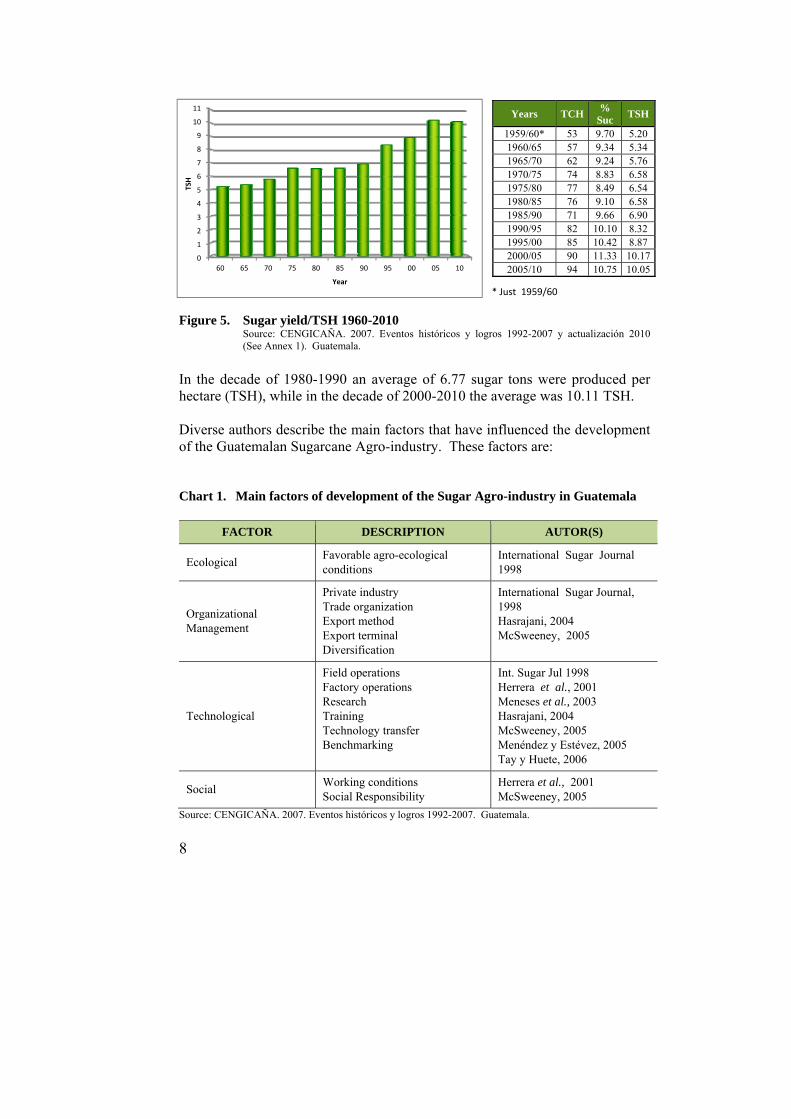
Figure 5. Sugar yield/TSH 1960-2010 Source: CENGICAÑA. 2007. Eventos históricos y logros 1992-2007 y actualización 2010 (See Annex 1). Guatemala.
In the decade of 1980-1990 an average of 6.77 sugar tons were produced per hectare (TSH), while in the decade of 2000-2010 the average was 10.11 TSH. Diverse authors describe the main factors that have influenced the development of the Guatemalan Sugarcane Agro-industry. These factors are: Chart 1. Main factors of development of the Sugar Agro-industry in Guatemala
FACTOR DESCRIPTION AUTOR(S)
Ecological Favorable agro-ecological conditions
International Sugar Journal 1998
Organizational Management
Private industry Trade organization Export method Export terminal Diversification
International Sugar Journal, 1998 Hasrajani, 2004 McSweeney, 2005
Technological
Field operations Factory operations Research Training Technology transfer Benchmarking
Int. Sugar Jul 1998 Herrera et al., 2001 Meneses et al., 2003 Hasrajani, 2004 McSweeney, 2005 Menéndez y Estévez, 2005 Tay y Huete, 2006
Social Working conditions Social Responsibility
Herrera et al., 2001 McSweeney, 2005
Source: CENGICAÑA. 2007. Eventos históricos y logros 1992-2007. Guatemala.
Years TCH %
Suc TSH
1959/60* 53 9.70 5.20 1960/65 57 9.34 5.34 1965/70 62 9.24 5.76 1970/75 74 8.83 6.58 1975/80 77 8.49 6.54 1980/85 76 9.10 6.58 1985/90 71 9.66 6.90 1990/95 82 10.10 8.32 1995/00 85 10.42 8.87 2000/05 90 11.33 10.17 2005/10 94 10.75 10.05
* Just 1959/60
0
1
2
3
4
5
6
7
8
9
10
11
60 65 70 75 80 85 90 95 00 05 10
TSH
Year

9
Market: Sugar, cogeneration, ethanol. SYSTEMATIC
LEVEL
INNOVATION
RESEARCH DEVELOPMENT
AND TECHNOLOGY
TRANSFER
EDUCATIONALSYSTEM
SUGARMILLS Canegrowers, Research departments
CENGICANA Sugarcane Research Centers form other countries
(Mainly United States, Colombia and Brazil)
ATAGUA consultants, and
sugarcane technologists
association from other
Suppliers
INTECAP Universities: USAC, URL, UVG, UG, ZAMORANO, EARTH ENCA, Technological centers
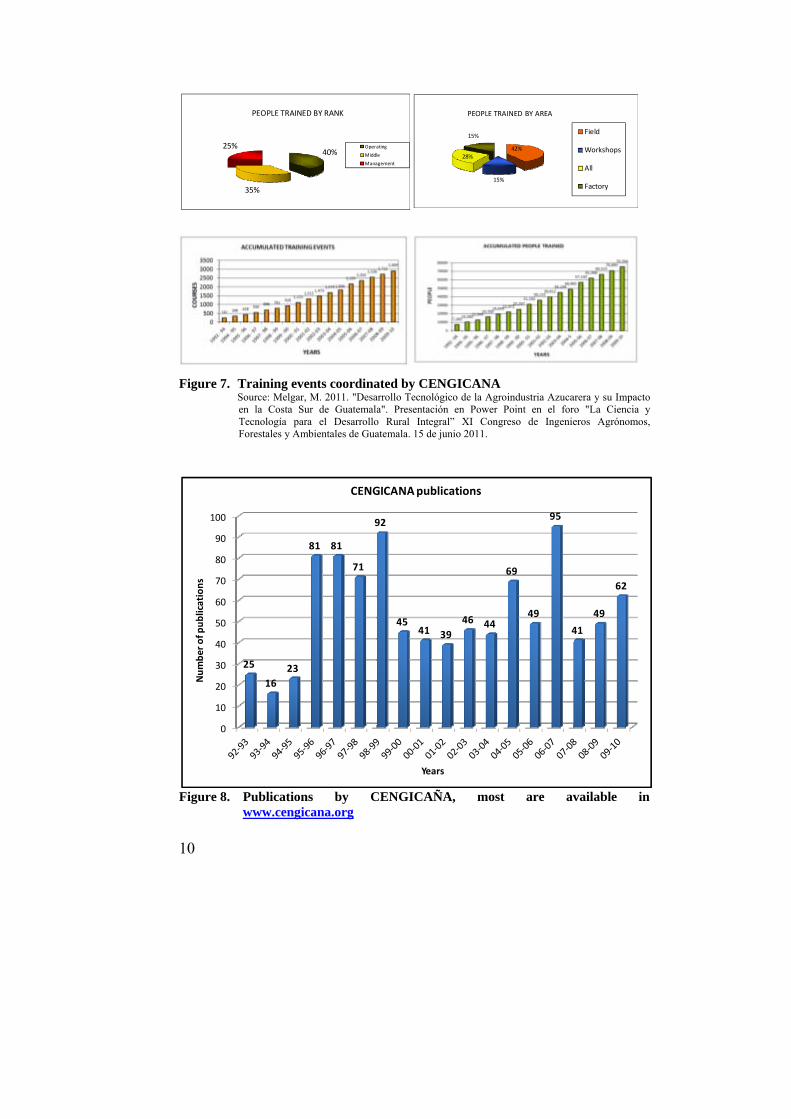
The mentioned authors agree that the technological component has played a very important role in the development of the Guatemalan Sugarcane Agro-industry. SUGARCANE INNOVATION SYSTEM IN GUATEMALA According to Tosi, 2010, the innovative achievement of a country, region or sector cannot be evaluated focusing only on the individual success of the organizations. On the contrary, innovation is a process that results from the interaction of diverse organizations. In Figure 6 we present the main enterprises or organizations that participate in the innovation system of sugarcane in Guatemala. Flow of knowledge Flow of production Figure 6. Innovation system of sugarcane in Guatemala Other activities that have been developed by the innovation system, are: trainings, publications and congresses, as shown in Figures 7, 8 and 9.
10
42%
15%
28%
15%
PEOPLE TRAINED BY AREA
Field
Workshops
All
Factory
Figure 7. Training events coordinated by CENGICANA
Source: Melgar, M. 2011. "Desarrollo Tecnológico de la Agroindustria Azucarera y su Impacto en la Costa Sur de Guatemala". Presentación en Power Point en el foro "La Ciencia y Tecnología para el Desarrollo Rural Integral” XI Congreso de Ingenieros Agrónomos, Forestales y Ambientales de Guatemala. 15 de junio 2011.
Figure 8. Publications by CENGICAÑA, most are available in
www.cengicana.org
40%
35%
25%
PEOPLE TRAINED BY RANK
Operating
Middle
Management
0
10
20
30
40
50
60
70
80
90
100
25
16
23
81 81
71
92
4541 39
46 44
69
49
95
41
49
62
Number of p
ublications
Years
CENGICANA publications

11
AGREEMENTS
NATIONAL
INTECAP
Universities:USAC, URL, UVG, GALILEO
Government:CONCYT, ENCA, ICTAMAGA
Associations:Chambers, AGG, ATAGUACIAG
INTERNATIONAL
Argentina, AustraliaBarbados, Brazil, Central America,Colombia, Cuba, Ecuador, España, UnitedStates, France, Mauritius, Mexico, Thailand, Venezuela
Asociaciones:ISSCT, ICSB,STAB, ASSCTTECNICAÑA
SUGAR
MILLS
CENGICANA
Projects:
Research
Training
Technology transfer
Committees
Technical events
Benchmarking
Congresses
Publications
Library
Pantaleón‐Concepción
Palo Gordo
La Unión
Madre Tierra
Tululá
San Diego‐Trinidad
Santa Teresa
La Sonrisa
Santa Ana
Guadalupe
Magdalena
Figure 9. Sugarcane congresses organized in Guatemala by ATAGUA, supported by ASAZGUA and CENGICAÑA
Figure 10 summarizes the technology network actors of the technology management system that make possible the formation of “the Technology Stock” of the Guatemalan Sugarcane Agroindustry.
TECHNOLOGY MANAGEMENT SYSTEM NETWORK TECHNOLOGY
Figure 10. Technology management system actors Source: Melgar, M. 2011. “Estrategias de la investigación tecnológica en la agroindustria azucarera de Guatemala”. Presentación en Power Point en el seminario-taller "Situación actual y perspectivas de la investigación agropecuaria, forestal e hidrobiológica en Guatemala”. 02 de junio 2011.
1973 1975 1982 1983 1984 1985 1986 1988 1990 1992 1994 1995 1997 1998 2000 2001 2002 2005 2008 2011
World
Latin America
Central America
National
12
RESEARCH AND DEVELOPMENT POLICIES AT SECTORIAL LEVEL
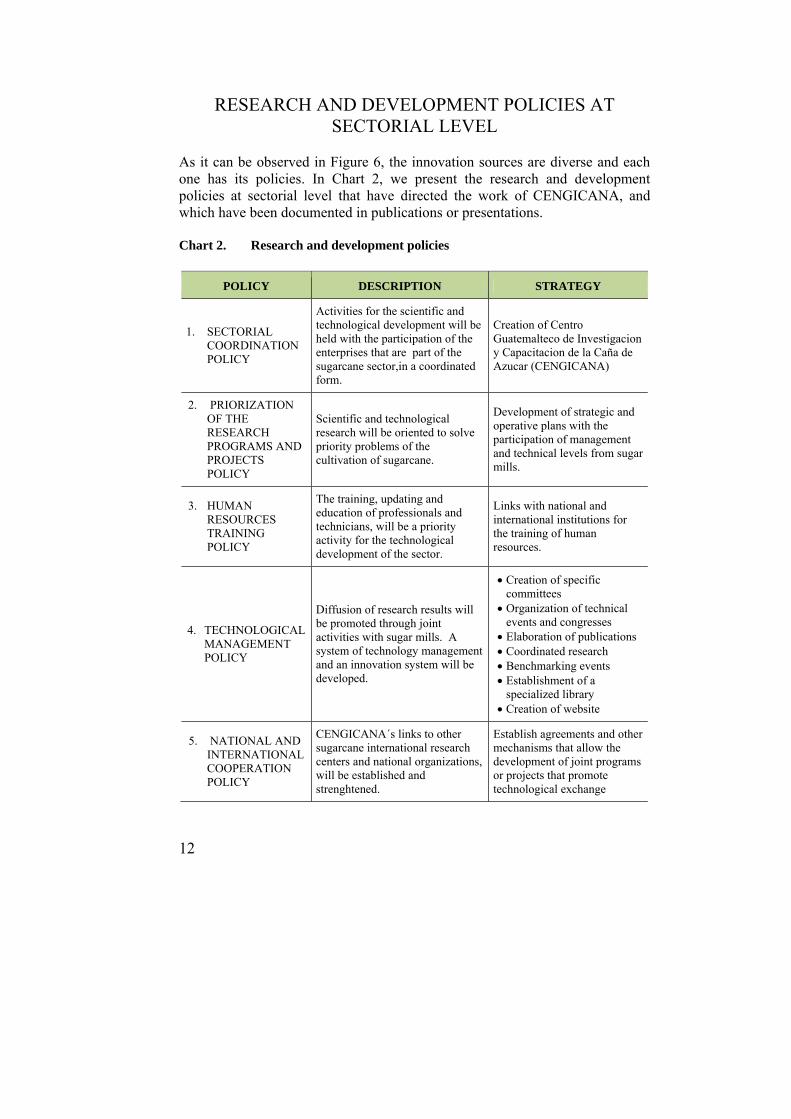
As it can be observed in Figure 6, the innovation sources are diverse and each one has its policies. In Chart 2, we present the research and development policies at sectorial level that have directed the work of CENGICANA, and which have been documented in publications or presentations. Chart 2. Research and development policies
POLICY DESCRIPTION STRATEGY
1. SECTORIAL COORDINATION POLICY
Activities for the scientific and technological development will be held with the participation of the enterprises that are part of the sugarcane sector,in a coordinated form.
Creation of Centro Guatemalteco de Investigacion y Capacitacion de la Caña de Azucar (CENGICANA)
2. PRIORIZATION OF THE RESEARCH PROGRAMS AND PROJECTS POLICY
Scientific and technological research will be oriented to solve priority problems of the cultivation of sugarcane.
Development of strategic and operative plans with the participation of management and technical levels from sugar mills.
3. HUMAN RESOURCES TRAINING POLICY
The training, updating and education of professionals and technicians, will be a priority activity for the technological development of the sector.
Links with national and international institutions for the training of human resources.
4. TECHNOLOGICAL MANAGEMENT POLICY
Diffusion of research results will be promoted through joint activities with sugar mills. A system of technology management and an innovation system will be developed.
Creation of specific committees
Organization of technical events and congresses
Elaboration of publications Coordinated research Benchmarking events Establishment of a
specialized library Creation of website
5. NATIONAL AND INTERNATIONAL COOPERATION POLICY
CENGICANA´s links to other sugarcane international research centers and national organizations, will be established and strenghtened.
Establish agreements and other mechanisms that allow the development of joint programs or projects that promote technological exchange
13
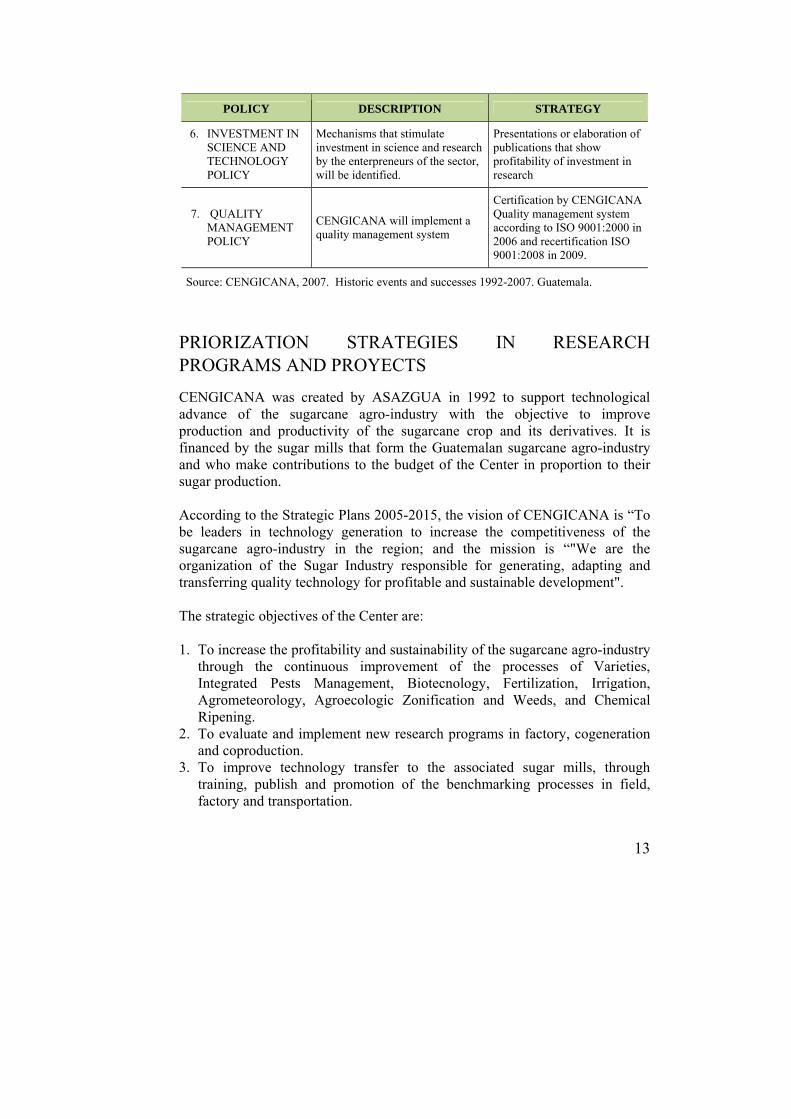
POLICY DESCRIPTION STRATEGY
6. INVESTMENT IN SCIENCE AND TECHNOLOGY POLICY
Mechanisms that stimulate investment in science and research by the enterpreneurs of the sector, will be identified.
Presentations or elaboration of publications that show profitability of investment in research
7. QUALITY MANAGEMENT POLICY
CENGICANA will implement a quality management system
Certification by CENGICANA Quality management system according to ISO 9001:2000 in 2006 and recertification ISO 9001:2008 in 2009.
Source: CENGICANA, 2007. Historic events and successes 1992-2007. Guatemala.
PRIORIZATION STRATEGIES IN RESEARCH PROGRAMS AND PROYECTS
CENGICANA was created by ASAZGUA in 1992 to support technological advance of the sugarcane agro-industry with the objective to improve production and productivity of the sugarcane crop and its derivatives. It is financed by the sugar mills that form the Guatemalan sugarcane agro-industry and who make contributions to the budget of the Center in proportion to their sugar production. According to the Strategic Plans 2005-2015, the vision of CENGICANA is “To be leaders in technology generation to increase the competitiveness of the sugarcane agro-industry in the region; and the mission is “"We are the organization of the Sugar Industry responsible for generating, adapting and transferring quality technology for profitable and sustainable development". The strategic objectives of the Center are: 1. To increase the profitability and sustainability of the sugarcane agro-industry
through the continuous improvement of the processes of Varieties, Integrated Pests Management, Biotecnology, Fertilization, Irrigation, Agrometeorology, Agroecologic Zonification and Weeds, and Chemical Ripening.
2. To evaluate and implement new research programs in factory, cogeneration and coproduction.
3. To improve technology transfer to the associated sugar mills, through training, publish and promotion of the benchmarking processes in field, factory and transportation.
14
4. To ensure the satisfaction of the associates with technologies to improve the profitability and sustainability and to maintain the Quality Management System certified according to ISO 9001:2008.
5. To develop a continuous program of education, training and updating of the technical personnel of CENGICANA and the Sugarcane Agro-industry.
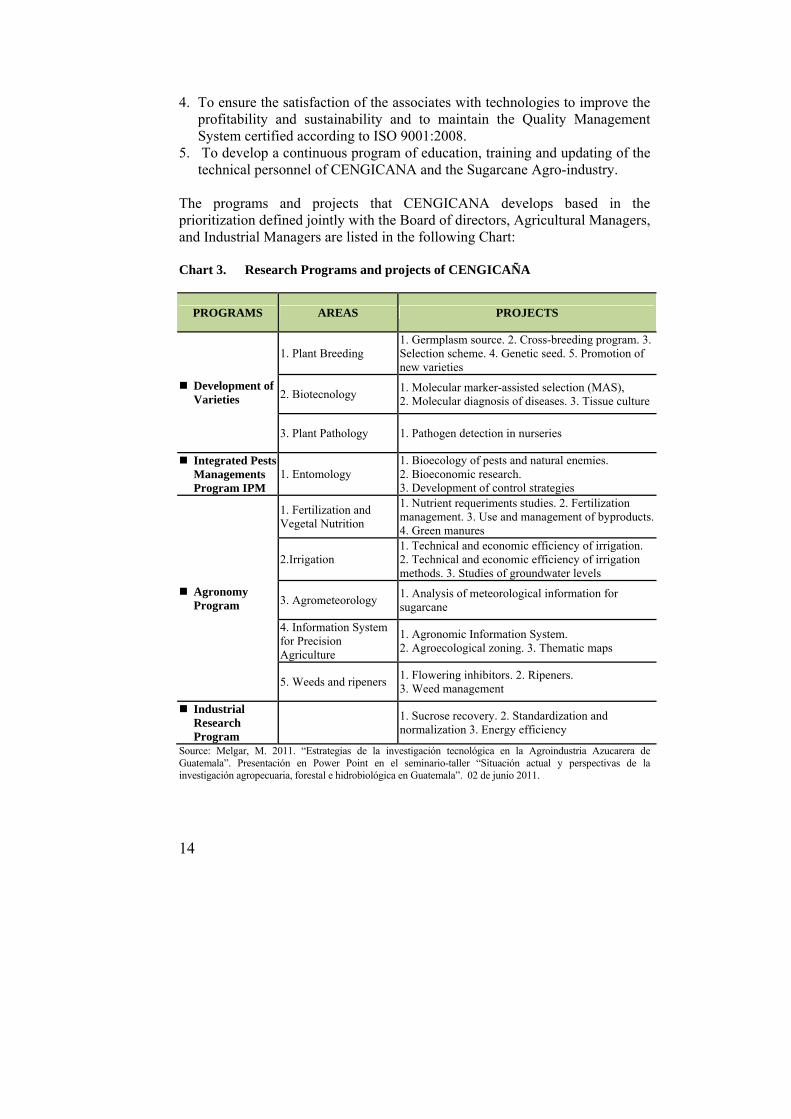
The programs and projects that CENGICANA develops based in the prioritization defined jointly with the Board of directors, Agricultural Managers, and Industrial Managers are listed in the following Chart: Chart 3. Research Programs and projects of CENGICAÑA
PROGRAMS AREAS PROJECTS
Development of Varieties
1. Plant Breeding 1. Germplasm source. 2. Cross-breeding program. 3. Selection scheme. 4. Genetic seed. 5. Promotion of new varieties
2. Biotecnology 1. Molecular marker-assisted selection (MAS), 2. Molecular diagnosis of diseases. 3. Tissue culture
3. Plant Pathology 1. Pathogen detection in nurseries
Integrated Pests Managements Program IPM
1. Entomology 1. Bioecology of pests and natural enemies. 2. Bioeconomic research. 3. Development of control strategies
Agronomy Program
1. Fertilization and Vegetal Nutrition
1. Nutrient requeriments studies. 2. Fertilization management. 3. Use and management of byproducts.4. Green manures
2.Irrigation 1. Technical and economic efficiency of irrigation. 2. Technical and economic efficiency of irrigation methods. 3. Studies of groundwater levels
3. Agrometeorology 1. Analysis of meteorological information for sugarcane
4. Information System for Precision Agriculture
1. Agronomic Information System. 2. Agroecological zoning. 3. Thematic maps
5. Weeds and ripeners 1. Flowering inhibitors. 2. Ripeners. 3. Weed management
Industrial Research Program
1. Sucrose recovery. 2. Standardization and normalization 3. Energy efficiency
Source: Melgar, M. 2011. “Estrategias de la investigación tecnológica en la Agroindustria Azucarera de Guatemala”. Presentación en Power Point en el seminario-taller “Situación actual y perspectivas de la investigación agropecuaria, forestal e hidrobiológica en Guatemala”. 02 de junio 2011.
15
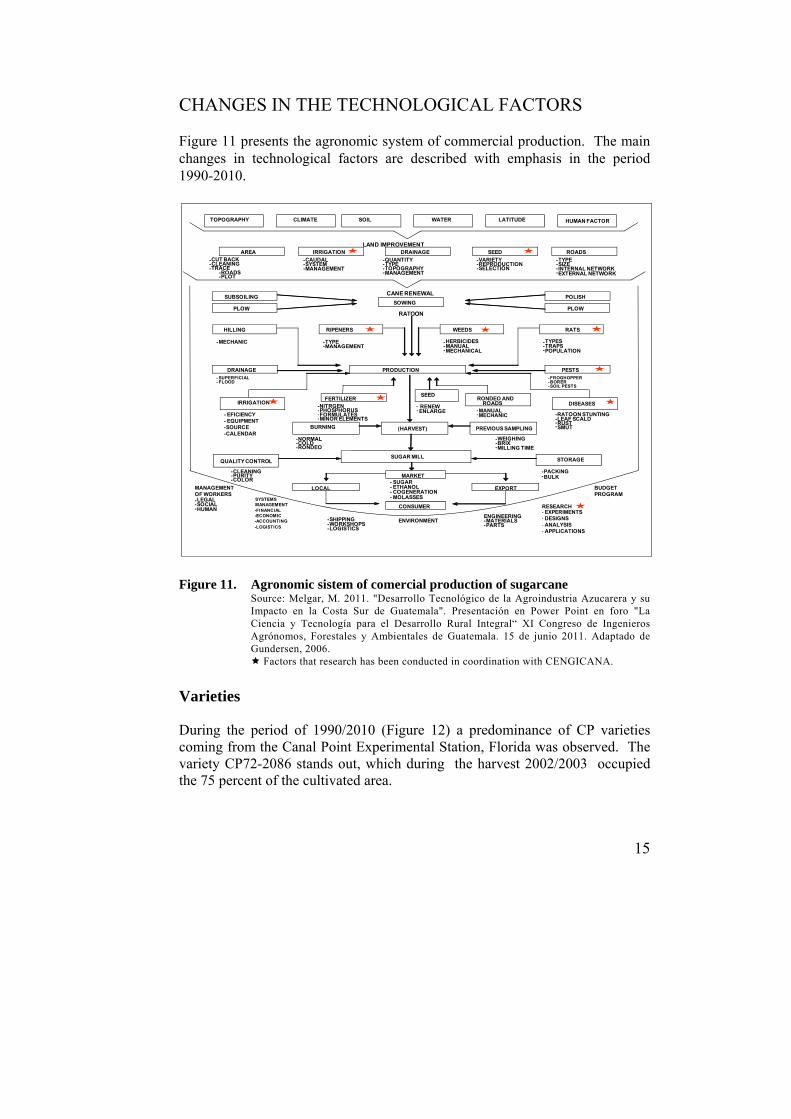
CHANGES IN THE TECHNOLOGICAL FACTORS Figure 11 presents the agronomic system of commercial production. The main changes in technological factors are described with emphasis in the period 1990-2010.
Figure 11. Agronomic sistem of comercial production of sugarcane
Source: Melgar, M. 2011. "Desarrollo Tecnológico de la Agroindustria Azucarera y su Impacto en la Costa Sur de Guatemala". Presentación en Power Point en foro "La Ciencia y Tecnología para el Desarrollo Rural Integral“ XI Congreso de Ingenieros Agrónomos, Forestales y Ambientales de Guatemala. 15 de junio 2011. Adaptado de Gundersen, 2006. Factors that research has been conducted in coordination with CENGICANA.
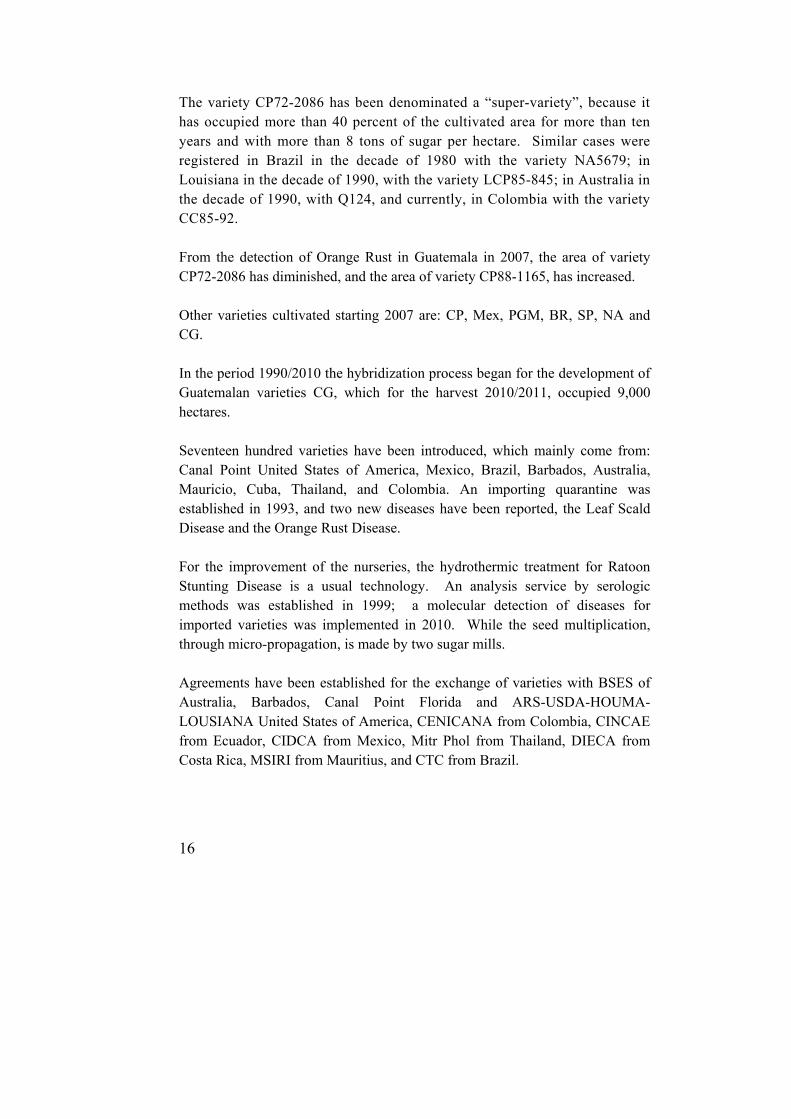
Varieties During the period of 1990/2010 (Figure 12) a predominance of CP varieties coming from the Canal Point Experimental Station, Florida was observed. The variety CP72-2086 stands out, which during the harvest 2002/2003 occupied the 75 percent of the cultivated area.
- SUGAR- ETHANOL- COGENERATION- MOLASSES
-CLEANING-PURITY-COLOR
- RENEW- ENLARGE -MANUAL
-MECHANIC
RATOON
CANE RENEWAL
-PACKING-BULK
SUGAR MILL STORAGE
- SUPERFICIAL- FLOOD
-FROGHOPPER-BORER-SOIL PESTS
-TYPE-SIZE-INTERNAL NETWORK-EXTERNAL NETWORK
-VARIETY-REPRODUCTION-SELECTION
-CAUDAL-SYSTEM-MANAGEMENT
-QUANTITY-TYPE-TOPOGRAPHY-MANAGEMENT
-CUT BACK-CLEANING-TRACE
-ROADS-PLOT
LAND IMPROVEMENT
BUDGET PROGRAM
- EXPERIMENTS- DESIGNS- ANALYSIS- APPLICATIONS
ENGINEERING-MATERIALS-PARTS
-SHIPPING-WORKSHOPS-LOGÍSTICS
SYSTEMS MANAGEMENT-FINANCIAL-ECONOMIC-ACCOUNTING-LOGISTICS
MANAGEMENT OF WORKERS-LEGAL-SOCIAL-HUMAN
ENVIRONMENT
TOPOGRAPHY CLIMATE WATERSOIL LATITUDE HUMAN FACTOR
DRAINAGE ROADSAREA IRRIGATION SEED
SUBSOILINGSOWING
PLOW PLOW
POLISH
PESTSDRAINAGE PRODUCTION
-SMUT-RUST
-PHOSPHORUS-FORMULATES-MINOR ELEMENTS
- EFICIENCY- EQUIPMENT-SOURCE-CALENDAR
FERTILIZERSEED
RONDEO ANDROADS DISEASESIRRIGATION
RIPENERSHILLING WEEDS RATS
-MECHANIC -TYPE-MANAGEMENT
-HERBICIDES-MANUAL-MECHANICAL
-TYPES-TRAPS-POPULATION
-WEIGHING-BRIX-MILLING TIME
-NORMAL-COLD-RONDEO
PREVIOUS SAMPLING(HARVEST)BURNING
QUALITY CONTROL
EXPORT
CONSUMER
MARKET
LOCAL
-LEAF SCALD
RESEARCH
-NITRGEN
-RATOON STUNTING
16
The variety CP72-2086 has been denominated a “super-variety”, because it has occupied more than 40 percent of the cultivated area for more than ten years and with more than 8 tons of sugar per hectare. Similar cases were registered in Brazil in the decade of 1980 with the variety NA5679; in Louisiana in the decade of 1990, with the variety LCP85-845; in Australia in the decade of 1990, with Q124, and currently, in Colombia with the variety CC85-92. From the detection of Orange Rust in Guatemala in 2007, the area of variety CP72-2086 has diminished, and the area of variety CP88-1165, has increased. Other varieties cultivated starting 2007 are: CP, Mex, PGM, BR, SP, NA and CG. In the period 1990/2010 the hybridization process began for the development of Guatemalan varieties CG, which for the harvest 2010/2011, occupied 9,000 hectares. Seventeen hundred varieties have been introduced, which mainly come from: Canal Point United States of America, Mexico, Brazil, Barbados, Australia, Mauricio, Cuba, Thailand, and Colombia. An importing quarantine was established in 1993, and two new diseases have been reported, the Leaf Scald Disease and the Orange Rust Disease. For the improvement of the nurseries, the hydrothermic treatment for Ratoon Stunting Disease is a usual technology. An analysis service by serologic methods was established in 1999; a molecular detection of diseases for imported varieties was implemented in 2010. While the seed multiplication, through micro-propagation, is made by two sugar mills. Agreements have been established for the exchange of varieties with BSES of Australia, Barbados, Canal Point Florida and ARS-USDA-HOUMA-LOUSIANA United States of America, CENICANA from Colombia, CINCAE from Ecuador, CIDCA from Mexico, Mitr Phol from Thailand, DIECA from Costa Rica, MSIRI from Mauritius, and CTC from Brazil.
17
Figura 12. Percentage of commercial cultivated area by variety of sugarcane in
Guatemala, from 1980 to 2011 Source: CENGICAÑA. 2010. Memoria. Presentación de resultados de investigación. Zafra 2009-2010.
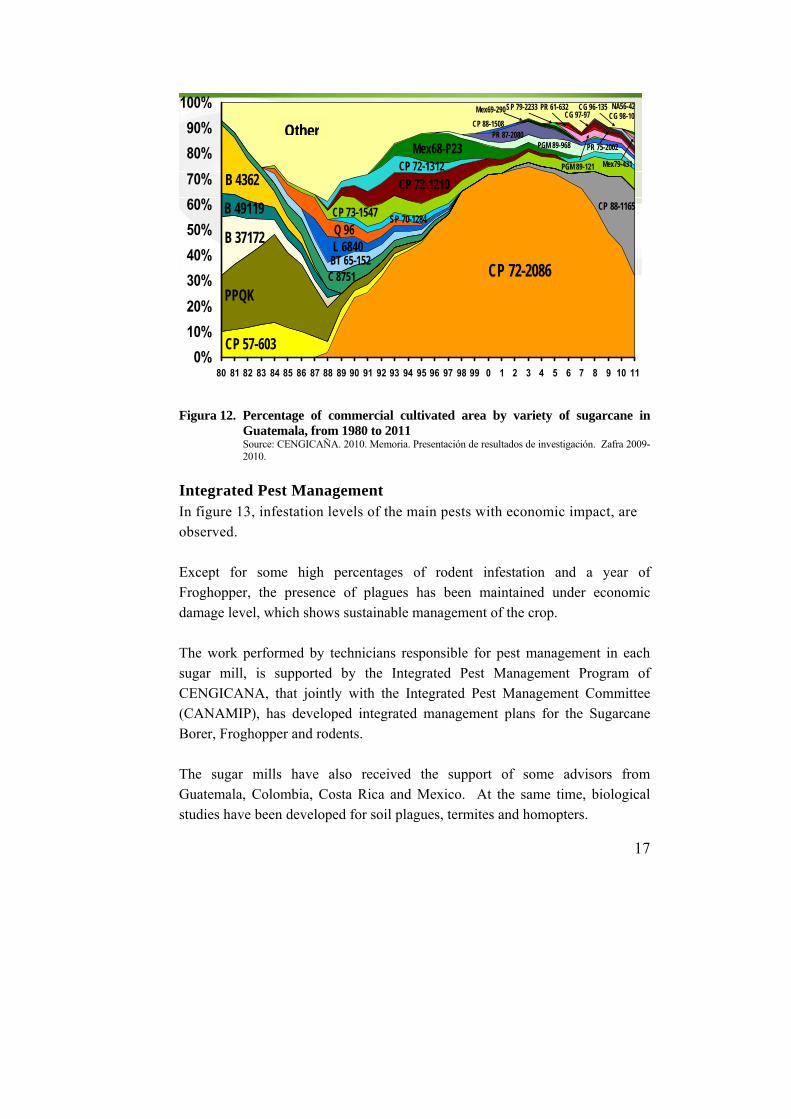
Integrated Pest Management In figure 13, infestation levels of the main pests with economic impact, are observed. Except for some high percentages of rodent infestation and a year of Froghopper, the presence of plagues has been maintained under economic damage level, which shows sustainable management of the crop. The work performed by technicians responsible for pest management in each sugar mill, is supported by the Integrated Pest Management Program of CENGICANA, that jointly with the Integrated Pest Management Committee (CANAMIP), has developed integrated management plans for the Sugarcane Borer, Froghopper and rodents. The sugar mills have also received the support of some advisors from Guatemala, Colombia, Costa Rica and Mexico. At the same time, biological studies have been developed for soil plagues, termites and homopters.
CP 72-2086
CP 88-1165
CP 57-603
PPQK
B 37172
B 49119
B 4362
C 8751BT 65-152L 6840Q 96
SP 70-1284CP 73-1547
CP 72-1210CP 72-1312
Mex68-P23 PGM 89-968PR 87-2080
CP 88-1508
Mex69-290SP 79-2233
PGM 89-121
PR 61-632
PR 75-2002
CG 97-97CG 96-135
Mex79-431
CG 98-10NA56-42
Others
0%
10%
20%
30%
40%
50%
60%
70%
80%
90%
100%
80 81 82 83 84 85 86 87 88 89 90 91 92 93 94 95 96 97 98 99 0 1 2 3 4 5 6 7 8 9 10 11
Other
18
0
2
4
6
8
00‐01 01‐02 02‐03 03‐04 04‐05 05‐06 06‐07 07‐08 08‐09 09‐10
0.71 1.030.85 1.14 1.5
1 1.211.82
1.10.66
2.59 2.63 2.682.15
3.04
2.141.93 2.4
1.6
0.92
6.656.41
5.09
4.075.02
3.663.26
6.1
1.72
3.46
% Infestation Field Rats
Alto Medio BajoHigh Medium Low
Figura 13. Evolution of different sugarcane pests 2000-2010
Source: CENGICAÑA 2011. Situación actual y proyección de la producción de azúcar Zafra 2010/2011. Presentación en Power Point a Junta Directiva de ASAZGUA. 22 de marzo 2011.
Fertilization Since 1993 the studies “Semi-detailed Study of Soils of the Guatemalan Sugarcane Zone” and “Soil Management Groups” have been made- A systematic scientific-technologic research job was also developed, which made possible to determine strategies for the optimization of nitrogen fertilizer and economic recommendations for the use and management of phosphorus fertilizer. The fertilizers are applied, by soil management groups, according to the requirements, soil analysis, and potential performance. Recommendations for nitrogen and phosphorus have been specified, as observed in Figure 14. During this period techniques were developed for the efficient utilization of filter mud and vinasse, management of green fertilizers and differential response for promissory varieties.
0
0.5
1
1.5
2
2.5
00‐01 ´01‐02 `02‐03 '03‐04 ´04‐05 ´05‐06 ´06‐07 ´07‐08 08‐09 ´09‐10
% of i.i
% Infestation Borer
0.00
0.50
1.00
1.50
2.00
2.50
3.00
3.50
4.00
4.50
5.00
00‐01 01‐02 02‐03 03‐04 04‐05 05‐06 06‐07 07‐08 08‐09 09‐10
% of i.i
% Infestation Froghopper

19
Recommendation of nitrogen doses (kg N / ha) for sugarcane cultivation in soils derived from volcanic ash in Guatemala
Category of Organic
matter (%)
Plant cane (kg N/ha)
Ratoon
1/Rel N:TC Minimum dose Maximum dose
Kg N/ha
Low (< 3.0)
80 1.14 100 150
Medium (3.0 – 5.0)
70 1.0 90 130
High (> 5.0)
60 0.9 80 120
1/Rel N:TC= Relationship kg of N per ton of cane expected
Phosphorus recommendations bases on P soil, cultivation season and soil type
Category of P Plant cane Ratoon
Andisols Other soils Andisols Other soils
Low (< 10 ppm)
80 60 40 25
Medium (10-30 ppm)
60 40 0 0
High (>30 ppm)
0 0 0 0
Figura 14. Nitrogen and Phosphorus recommendations.
Source: Adapted from Pérez, O.; Ufer, C.; Azañón, V. and Solares, E. 2010. Strategies for the optimal use of nitrogen fertilizers in the sugarcane crops in Guatemala. In: Proc. Int. Soc. Sugar Cane Technol. Veracruz, Mexico. Source: Adapted from Pérez, O.; Hernández, F. 2002. Comportamiento y manejo del fósforo en la fertilización de caña de azúcar en suelos de origen volcánico. En: Memoria de XIV Congreso de Técnicos Azucareros de Centro América ATACA. Guatemala. pp. 161-168.
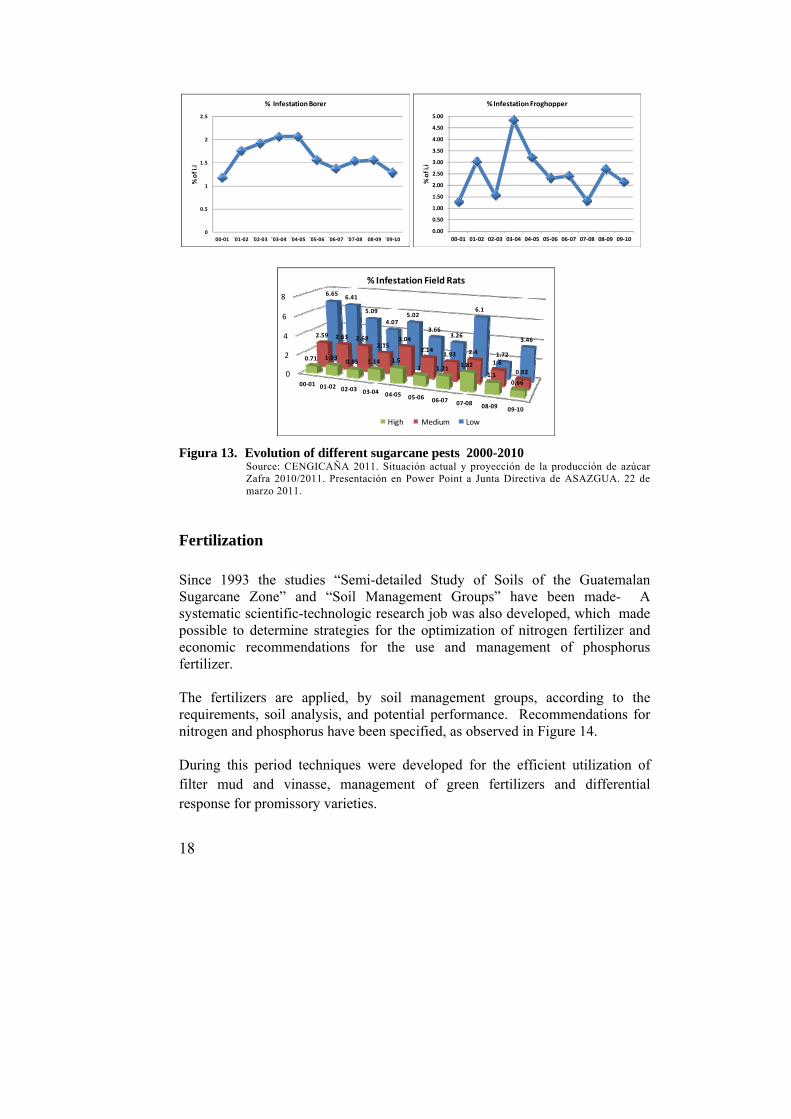
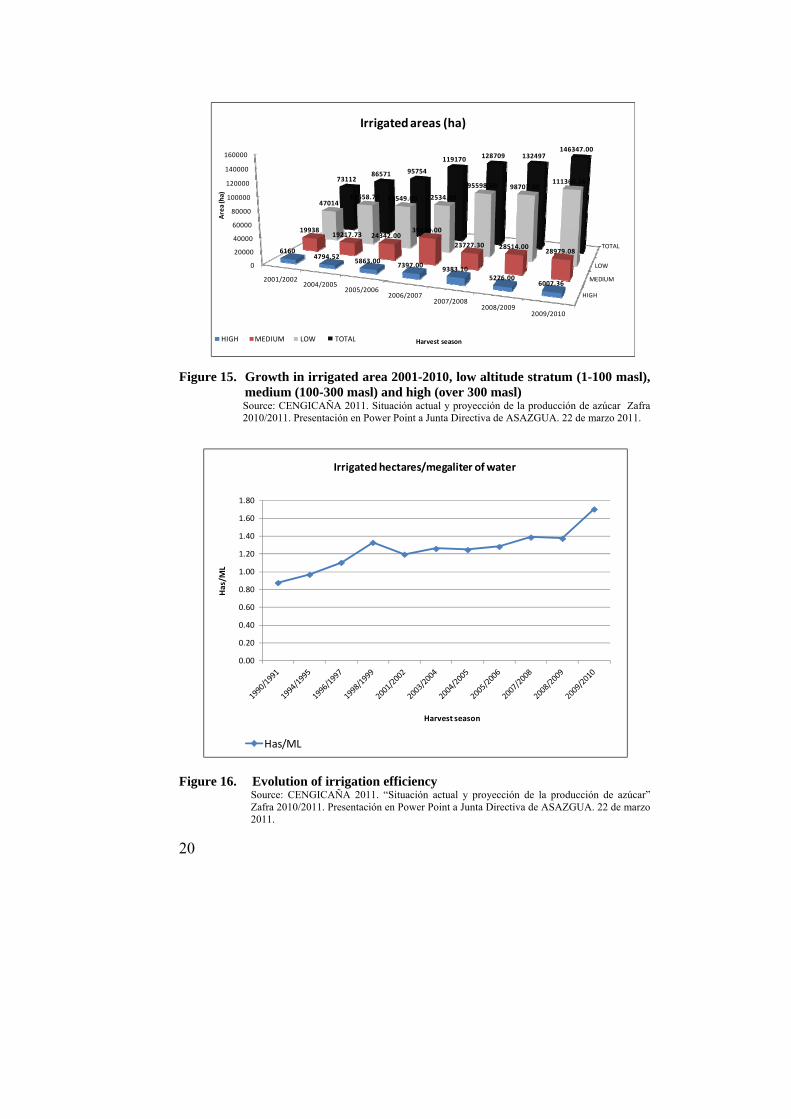
Irrigation The area under irrigation in the Guatemalan sugarcane zone has increased, as observed in Figure 15, otherwise, the compliance with the technical and economic recommendations for the application of irrigation has increased the efficiency in water utilization, as observed in Figure 16. Progress has been made also with the application of other technologies that increase production, such as: use of hydric balance, precut irrigation programming, water quality and capillary water contribution analysis, and management of sandy veins. The broadening of the areas with mechanized irrigation systems has been reported, such as fixed swivel and mobile swivel and frontal displacement, and a greater number of aspersion systems.
20
0
20000
40000
60000
80000
100000
120000
140000
160000
2001/20022004/2005
2005/20062006/2007
2007/20082008/2009
2009/2010
61604794.52
5863.007397.00
9383.105276.00
6007.36
1993819217.73 24342.00
39239.00
23727.30 28514.0028979.08
4701462558.75 65549.00 72534.00
95598.60 98707.00111360.5673112
86571 95754
119170 128709 132497146347.00
Area(ha)
Harvest season
Irrigatedareas (ha)
ALTO MEDIO BAJO TOTALHIGH MEDIUM LOW TOTAL
‐TOTAL
‐LOW
‐MEDIUM
‐HIGH
Figure 15. Growth in irrigated area 2001-2010, low altitude stratum (1-100 masl), medium (100-300 masl) and high (over 300 masl) Source: CENGICAÑA 2011. Situación actual y proyección de la producción de azúcar Zafra 2010/2011. Presentación en Power Point a Junta Directiva de ASAZGUA. 22 de marzo 2011.
Figure 16. Evolution of irrigation efficiency
Source: CENGICAÑA 2011. “Situación actual y proyección de la producción de azúcar” Zafra 2010/2011. Presentación en Power Point a Junta Directiva de ASAZGUA. 22 de marzo 2011.
0.00
0.20
0.40
0.60
0.80
1.00
1.20
1.40
1.60
1.80
Has/M
L
Harvest season
Irrigatedhectares/megaliter of water
Has/ML

21
Ripeners The application of technology for the utilization of chemical ripening products to increase yields has been extended from 2,900 hectares in harvest season 1989/1990, to more than 140,000 in harvest season 2009/2010 as observed in Figure 17. Over time, factors affecting the response to ripeners such as: water quality, soil moisture, and potential yield varieties have been evaluated.
Figure 17. Area applied with ripeners
Source: CENGICAÑA 2011. Situación actual y proyección de la producción de azúcar Zafra 2010/2011. Presentación en Power Point a Junta Directiva de ASAZGUA. 22 de marzo 2011.
Weeds The Manual for the Identification and Management of Main Sugarcane Weeds and the Herbicide Technical Catalogue used in the Guatemalan Sugarcane Agro-industry, were made, in order to generate information about weed control. Agrometereology The automatic meteorological network in the Guatemalan sugarcane zone, has been established, in order to obtain basic data available, with 16 stations that provide information about the main meteorological variables, which can be accessed through CENGICANA webpage www.cengicana.org.
100 300 700 2,90411,281
12,50014,000
18,50020,00022,500
24,033
39,705
59,600
73,861
88,12192,963
97,80698,944
100,081108,757
113,778 118,799
127,740141,160
75
25075
50075
75075
100075
125075
150075
86-87
87-88
88-89
89-90
90-91
91-92
92-93
93-94
94-95
95-96
96-97
97-98
98-99
99-00
00-01
01-02
02-03
03-04
04-05
05-06
06-07
07-08
08-09
09-10
Are
a(h
a)
ap
pli
ed
rip
en
ers
Harvest season
Area (ha) applied ripeners harvest season 1986-2009*
22
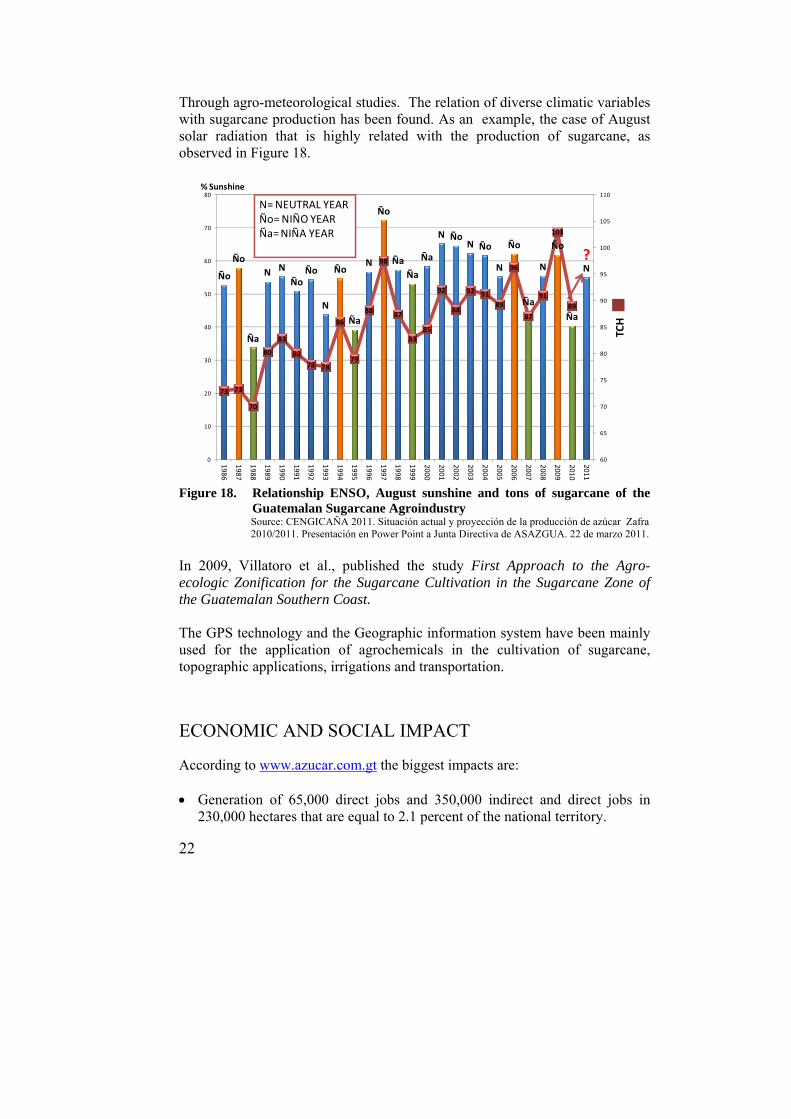
Through agro-meteorological studies. The relation of diverse climatic variables with sugarcane production has been found. As an example, the case of August solar radiation that is highly related with the production of sugarcane, as observed in Figure 18.
Figure 18. Relationship ENSO, August sunshine and tons of sugarcane of the
Guatemalan Sugarcane Agroindustry Source: CENGICAÑA 2011. Situación actual y proyección de la producción de azúcar Zafra 2010/2011. Presentación en Power Point a Junta Directiva de ASAZGUA. 22 de marzo 2011.
In 2009, Villatoro et al., published the study First Approach to the Agro-ecologic Zonification for the Sugarcane Cultivation in the Sugarcane Zone of the Guatemalan Southern Coast. The GPS technology and the Geographic information system have been mainly used for the application of agrochemicals in the cultivation of sugarcane, topographic applications, irrigations and transportation.
ECONOMIC AND SOCIAL IMPACT According to www.azucar.com.gt the biggest impacts are: Generation of 65,000 direct jobs and 350,000 indirect and direct jobs in
230,000 hectares that are equal to 2.1 percent of the national territory.
Ño
Ño
Ña
N N
ÑoÑo
N
Ño
Ña
N
Ño
Ña
Ña
Ña
N ÑoN Ño
N
Ño
Ña
N
Ño
Ña
N
73 73
70
80
83
80
78 78
86
79
88
98
87
8385
92
88
92 91
89
96
87
91
103
89
60
65
70
75
80
85
90
95
100
105
110
0
10
20
30
40
50
60
70
80
1986
1987
1988
1989
1990
1991
1992
1993
1994
1995
1996
1997
1998
1999
2000
2001
2002
2003
2004
2005
2006
2007
2008
2009
2010
2011
TCH
?
% Sunshine
N= NEUTRAL YEAR Ño= NIÑO YEARÑa= NIÑA YEAR
23
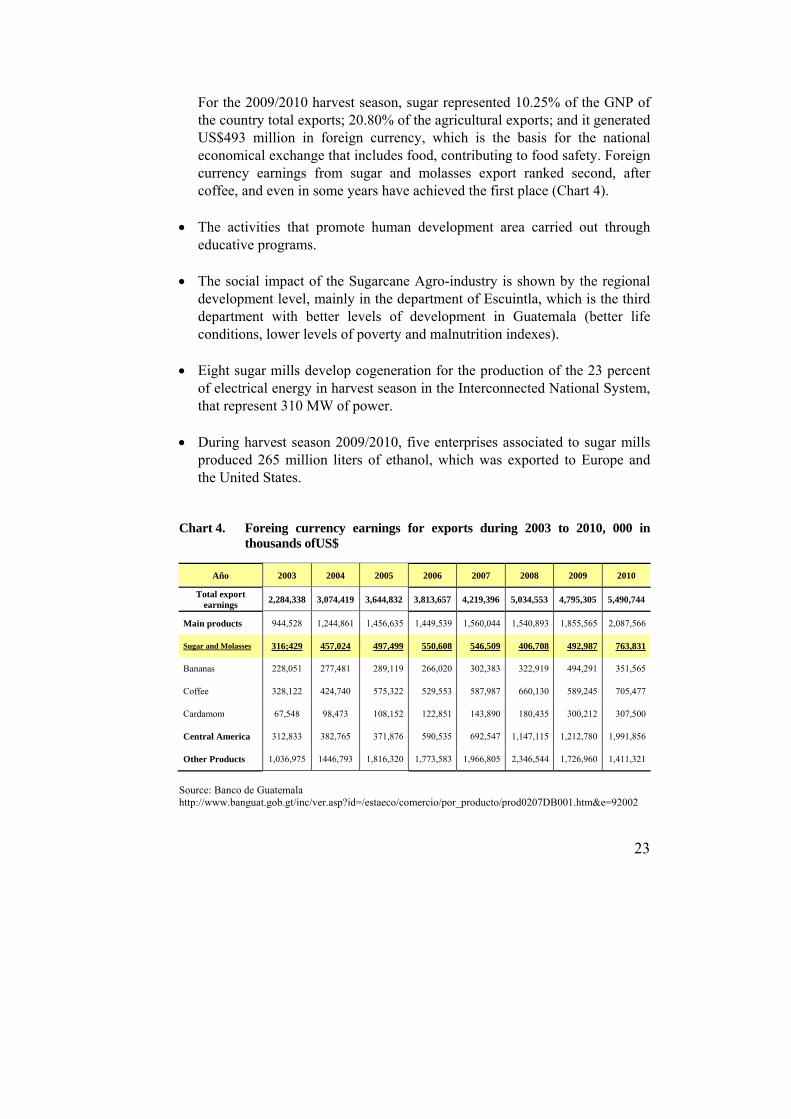
For the 2009/2010 harvest season, sugar represented 10.25% of the GNP of the country total exports; 20.80% of the agricultural exports; and it generated US$493 million in foreign currency, which is the basis for the national economical exchange that includes food, contributing to food safety. Foreign currency earnings from sugar and molasses export ranked second, after coffee, and even in some years have achieved the first place (Chart 4).
The activities that promote human development area carried out through educative programs.
The social impact of the Sugarcane Agro-industry is shown by the regional development level, mainly in the department of Escuintla, which is the third department with better levels of development in Guatemala (better life conditions, lower levels of poverty and malnutrition indexes).
Eight sugar mills develop cogeneration for the production of the 23 percent of electrical energy in harvest season in the Interconnected National System, that represent 310 MW of power.
During harvest season 2009/2010, five enterprises associated to sugar mills produced 265 million liters of ethanol, which was exported to Europe and the United States.
Chart 4. Foreing currency earnings for exports during 2003 to 2010, 000 in
thousands ofUS$
Año 2003 2004 2005 2006 2007 2008 2009 2010
Total export earnings
2,284,338 3,074,419 3,644,832 3,813,657 4,219,396 5,034,553 4,795,305 5,490,744
Main products 944,528 1,244,861 1,456,635 1,449,539 1,560,044 1,540,893 1,855,565 2,087,566
Sugar and Molasses 316;429 457,024 497,499 550,608 546,509 406,708 492,987 763,831
Bananas 228,051 277,481 289,119 266,020 302,383 322,919 494,291 351,565
Coffee 328,122 424,740 575,322 529,553 587,987 660,130 589,245 705,477
Cardamom 67,548 98,473 108,152 122,851 143,890 180,435 300,212 307,500
Central America 312,833 382,765 371,876 590,535 692,547 1,147,115 1,212,780 1,991,856
Other Products 1,036,975 1446,793 1,816,320 1,773,583 1,966,805 2,346,544 1,726,960 1,411,321
Source: Banco de Guatemala http://www.banguat.gob.gt/inc/ver.asp?id=/estaeco/comercio/por_producto/prod0207DB001.htm&e=92002
24
PERSPECTIVES
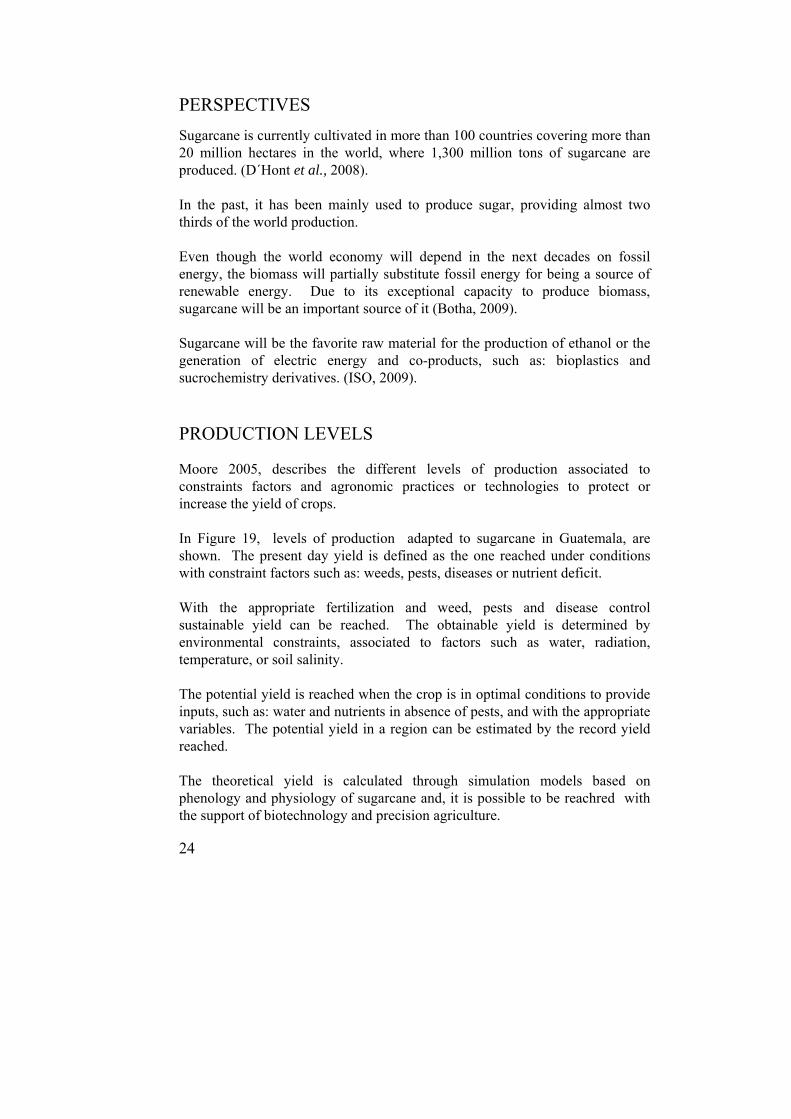
Sugarcane is currently cultivated in more than 100 countries covering more than 20 million hectares in the world, where 1,300 million tons of sugarcane are produced. (D´Hont et al., 2008). In the past, it has been mainly used to produce sugar, providing almost two thirds of the world production. Even though the world economy will depend in the next decades on fossil energy, the biomass will partially substitute fossil energy for being a source of renewable energy. Due to its exceptional capacity to produce biomass, sugarcane will be an important source of it (Botha, 2009). Sugarcane will be the favorite raw material for the production of ethanol or the generation of electric energy and co-products, such as: bioplastics and sucrochemistry derivatives. (ISO, 2009). PRODUCTION LEVELS Moore 2005, describes the different levels of production associated to constraints factors and agronomic practices or technologies to protect or increase the yield of crops. In Figure 19, levels of production adapted to sugarcane in Guatemala, are shown. The present day yield is defined as the one reached under conditions with constraint factors such as: weeds, pests, diseases or nutrient deficit. With the appropriate fertilization and weed, pests and disease control sustainable yield can be reached. The obtainable yield is determined by environmental constraints, associated to factors such as water, radiation, temperature, or soil salinity. The potential yield is reached when the crop is in optimal conditions to provide inputs, such as: water and nutrients in absence of pests, and with the appropriate variables. The potential yield in a region can be estimated by the record yield reached. The theoretical yield is calculated through simulation models based on phenology and physiology of sugarcane and, it is possible to be reachred with the support of biotechnology and precision agriculture.
25
The record yields of sugarcane, approximately reach a 65 percent of the theoretical yield (Moore, 1997) so there is a high potential to increase them.
Figure 19. Production levels, constraints production factors and agronomic practices or technologies with the potential to protect or increase the tonnage (Adapted from Moore, P. 2005). Source: Melgar, M. 2010. Tendencias de la Investigación en Caña de Azúcar a Nivel Mundial. Sugar Journal (USA). November 2010. pp. 6-18
.
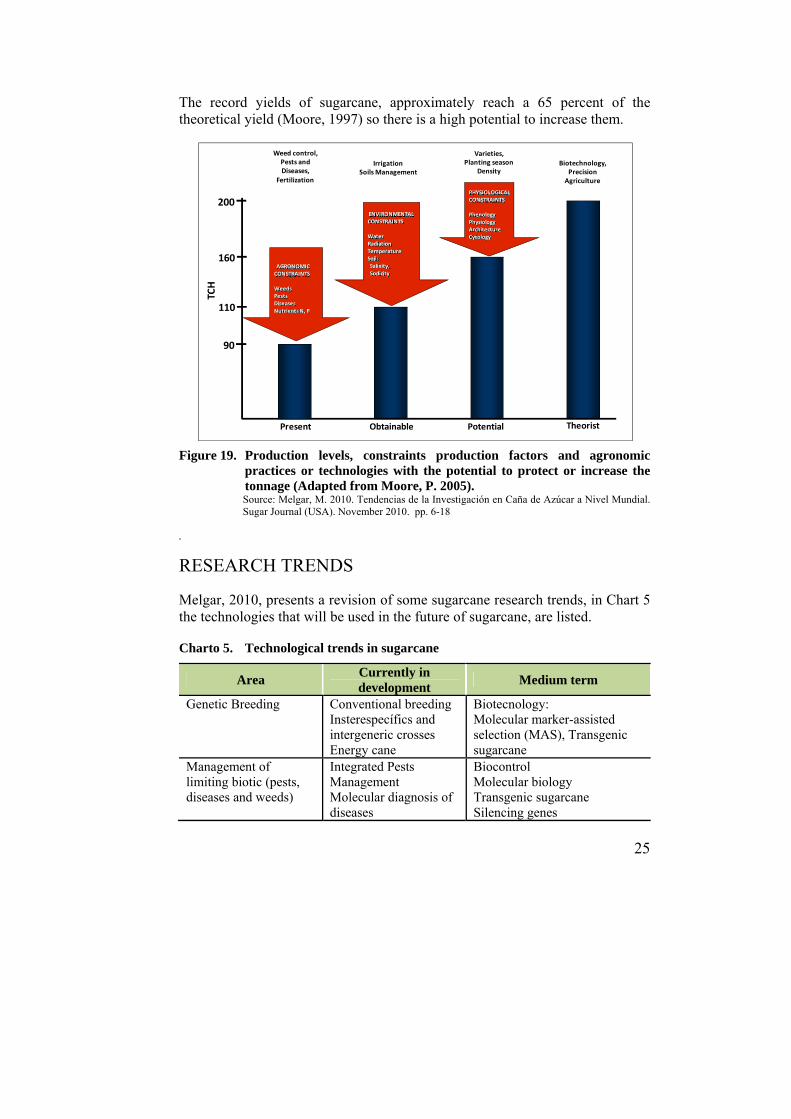
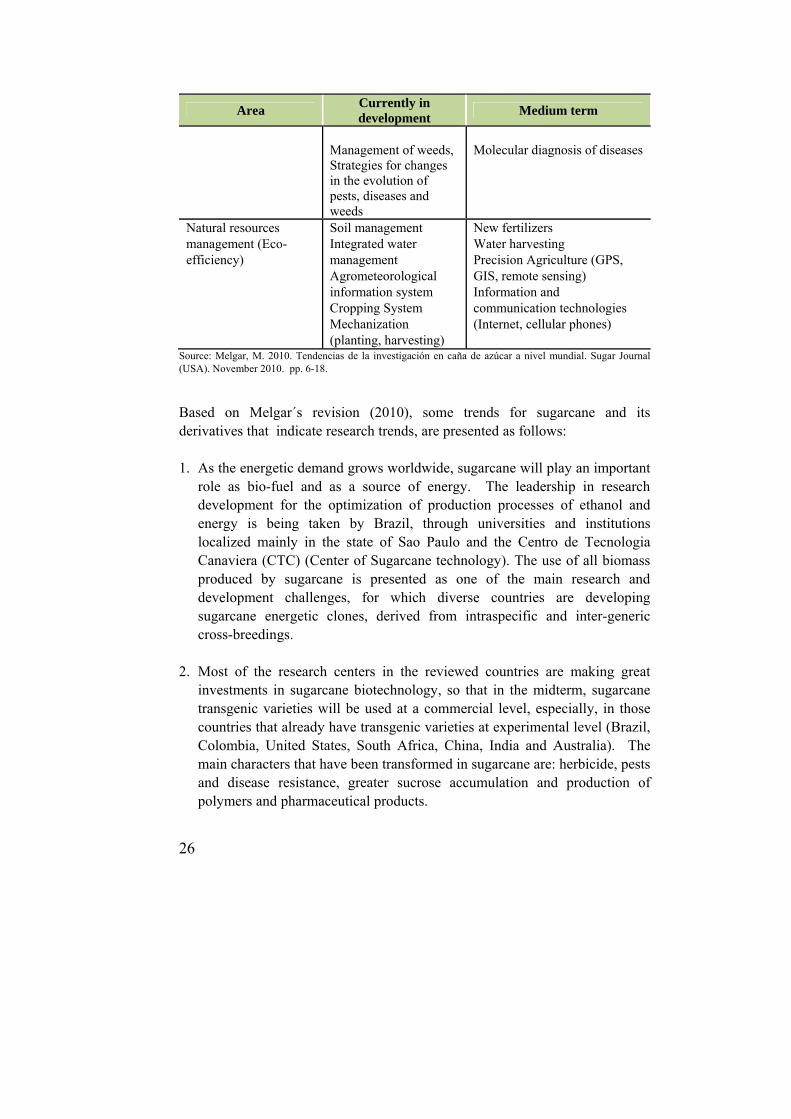
RESEARCH TRENDS Melgar, 2010, presents a revision of some sugarcane research trends, in Chart 5 the technologies that will be used in the future of sugarcane, are listed. Charto 5. Technological trends in sugarcane
Area Currently in development
Medium term
Genetic Breeding Conventional breeding Insterespecífics and intergeneric crosses Energy cane
Biotecnology: Molecular marker-assisted selection (MAS), Transgenic sugarcane
Management of limiting biotic (pests, diseases and weeds)
Integrated Pests Management Molecular diagnosis of diseases
Biocontrol Molecular biology Transgenic sugarcane Silencing genes
AGRONOMIC CONSTRAINTS
WeedsPestsDiseasesNutrientsN, P
ENVIRONMENTAL CONSTRAINTS
WaterRadiationTemperatureSoil:Salinity, Sodicity
PHYSIOLOGICAL CONSTRAINTS
PhenologyPhysiologyArchitectureCytology
Present Obtainable Potential Theorist
TCH
90
110
160
200
Weed control,Pests andDiseases,
Fertilization
IrrigationSoilsManagement
Varieties, Planting season
DensityBiotechnology,
PrecisionAgriculture
26
Area Currently in development
Medium term
Management of weeds, Strategies for changes in the evolution of pests, diseases and weeds
Molecular diagnosis of diseases
Natural resources management (Eco-efficiency)
Soil management Integrated water management Agrometeorological information system Cropping System Mechanization (planting, harvesting)
New fertilizers Water harvesting Precision Agriculture (GPS, GIS, remote sensing) Information and communication technologies (Internet, cellular phones)
Source: Melgar, M. 2010. Tendencias de la investigación en caña de azúcar a nivel mundial. Sugar Journal (USA). November 2010. pp. 6-18. Based on Melgar´s revision (2010), some trends for sugarcane and its derivatives that indicate research trends, are presented as follows: 1. As the energetic demand grows worldwide, sugarcane will play an important
role as bio-fuel and as a source of energy. The leadership in research development for the optimization of production processes of ethanol and energy is being taken by Brazil, through universities and institutions localized mainly in the state of Sao Paulo and the Centro de Tecnologia Canaviera (CTC) (Center of Sugarcane technology). The use of all biomass produced by sugarcane is presented as one of the main research and development challenges, for which diverse countries are developing sugarcane energetic clones, derived from intraspecific and inter-generic cross-breedings.
2. Most of the research centers in the reviewed countries are making great investments in sugarcane biotechnology, so that in the midterm, sugarcane transgenic varieties will be used at a commercial level, especially, in those countries that already have transgenic varieties at experimental level (Brazil, Colombia, United States, South Africa, China, India and Australia). The main characters that have been transformed in sugarcane are: herbicide, pests and disease resistance, greater sucrose accumulation and production of polymers and pharmaceutical products.
27
3. Derivative technologies from molecular biology and genetics engineering, will be used not only for the development of sugarcane varieties, but also as tools for integrated pests management, disease diagnosis, weed control and for methods associated to fertilization, such as: biologic fixation of nitrogen and soil microbiology.
4. The occurrence of droughts is a restriction factor mentioned by various countries, hence, the research in irrigation systems with efficient use of water will be indispensable, such as irrigation by dripping, technologies for the optimization of water utilization, water harvest and conservation, and management of water sources.
5. Precision agriculture for the optimal use of supplies in the search of eco-efficiency will require research in more precise diagnosis techniques, use of tools as: geographic information systems (GPS), remote sensors and the application of information technologies: cellular telephones and internet. Cenicana, Colombia has developed the model of specific agricultural model for sites. India, has promoted the use of information technologies for the transfer of technology due to this country has a large number of a small sugar growers..
6. Competition for the use of land for other crops, forestry and urban development, make economic research necessary.
7. Due to climate change and environmental concern there will be a more focused legislation on the protection of the environment (water, soil, protected areas, biodiversity, agrochemical use, industrial security, traffic and burnings) so that, the focus of development must be based on sustainability.
APPRECIATION/ACKNOLEGMENT
To Licda. Priscila Lopez de Alvarado for her valuable contribution to the integration of this chapter and the diagramming of this book.
28
BIBLIOGRAPHY 1. Botha, F.C. (2009). Energy Yield and Cost in a Sugarcane Biomass
System. En: Proc. Aust. Soc. Sugar Cane Technol., Vol. 31:1–10. 2. CENGICAÑA. 2007. Eventos históricos y logros 1992-2007. Guatemala.
85 p 3. CENGICAÑA. 2010. Logros 2006-2010. Presentación en Power Point a Junta
Directiva de CENGICAÑA. 03 de mayo 2010. 4. CENGICAÑA. 2011. Situación actual y proyección de la producción de
azúcar Zafra 2010/2011. Presentación en Power Point a Junta Directiva de ASAZGUA. 22 de marzo 2011.
5. D’Hont, A., et al (2008). Sugarcane: A Major Source of Sweetness,
Alcohol, and Bio-energy. Springer. 2008. Genomics of tropical crop plants. Springer. p. 483-513.
6. Enriquez, Juan. 2001. As the Future Catchs You. Crow Business New
York. USA. 7. Hasrajani, N. 2004. La industria azucarera en Guatemala: Una Visión
Global. ISJ Vol CVI N1267 jul p.385-389 8. Herrera, J.; Orive, J.; Boesche, A. 2001. Guatemala Sugar industry , INT.
SUGAR JNL., VOL. 103, NO. 1235 p.484-485 9. International Sugar Journal. 1998. Guatemala continúa la trayectoria de
éxitos. ISJ Vol100 No 1190 February. p46 10. ISO. International Sugar Organization. 2009. Sugar Year Book 2009.
Documento en línea: http://www.isosugar.org/PDF%20files/SUGAR%20YEAR%20BOOK%20-%20sample.pdf
11. ISO. Organización Mundial del Azúcar. 2009. Potencial de mercado para
bioproductos derivados de la remolacha y de la caña de azúcar. 12. McSweeney, J.F.; 2005. Guatemala From Zero to major exporter 1960-
2004. Proc ISSCT Vol25. pp.465-470
29
13. Melgar, M. 2003. No debemos perder la siguiente ola: La revolución biotecnológica. ATAGUA (Gua) 3(4): 14:18
14. Melgar, M. 2010. Estrategias de la investigación tecnológica en la
agroindustria azucarera de Guatemala. Presentación en Power Point, en simposio “Modelos de Investigación y Desarrollo Tecnológico Agrícola” Experiencias Del Sector Privado. USAID-AGEXPORT. 15 de julio 2010.
15. Melgar, M. 2010. Tendencias de la investigación en caña de azúcar a nivel
mundial. Sugar Journal (USA). November 2010. pp. 6-18. 16. Melgar, M. 2011. Estrategias de la investigación tecnológica en la
agroindustria azucarera de Guatemala. Presentación en Power Point en el seminario-taller “Situación actual y perspectivas de la investigación agropecuaria, forestal e hidrobiológica en Guatemala”. 02 de junio 2011.
17. Melgar, M. 2011. Desarrollo Tecnológico de la Agroindustria Azucarera y
su Impacto en la Costa Sur de Guatemala. Presentación en Power Point en foro "La ciencia y tecnología para el Desarrollo Rural Integral” XI Congreso de Ingenieros Agrónomos, Forestales y Ambientales de Guatemala. 15 de junio 2011.
18. Menéndez, M.; Estévez, M.; 2005 Reporte de inteligencia competitiva,
DCE, Ministerio de Economía de El Salvador. Artículo electrónico. Http://www.elsalvadorcompetitivo.gob.sv/Reportes%20IC/Reporte%20de%20Inteligencia%20Competitiva%20_azucar.pdf
19. Meneses, A.; Melgar, M.; Cano, W. 2003. Desarrollo de la agroindustria
azucarera en Guatemala. SJ October Vol.62, No5. pp.18-19 20. Moore, P. 2005. Integration of sucrose accumulation processes across
hierarchical scales: towards developing an understanding of the gene-to-crop-continuum. Field Crops Research 92 119:135.
21. Moore, P.H.; Botha, F.C.; Furbank, R.T.; Grof, C.R.L. 1997 Potential for
overcoming physio-biochemical limits to sucrose accumulation. in Intensive sugarcane production: Meeting the challenges beyond 2000, eds Keating B.A, Wilson J.R.(CAB International, Wallingford, UK), pp. 141﹣156.
22. Oliver, Richard W. 1999. The Coming Biotech Age. McGraw Hill. USA. 23. OROZCO, H.; Buc, R. 2010. Censo de Variedades de Caña de Azúcar en
Guatemala a la Zafra 2010-2011. In: Memoria. Presentación de resultados de investigación. Zafra 2009-2010. Guatemala, CENGICAÑA. pp. 21-30
30
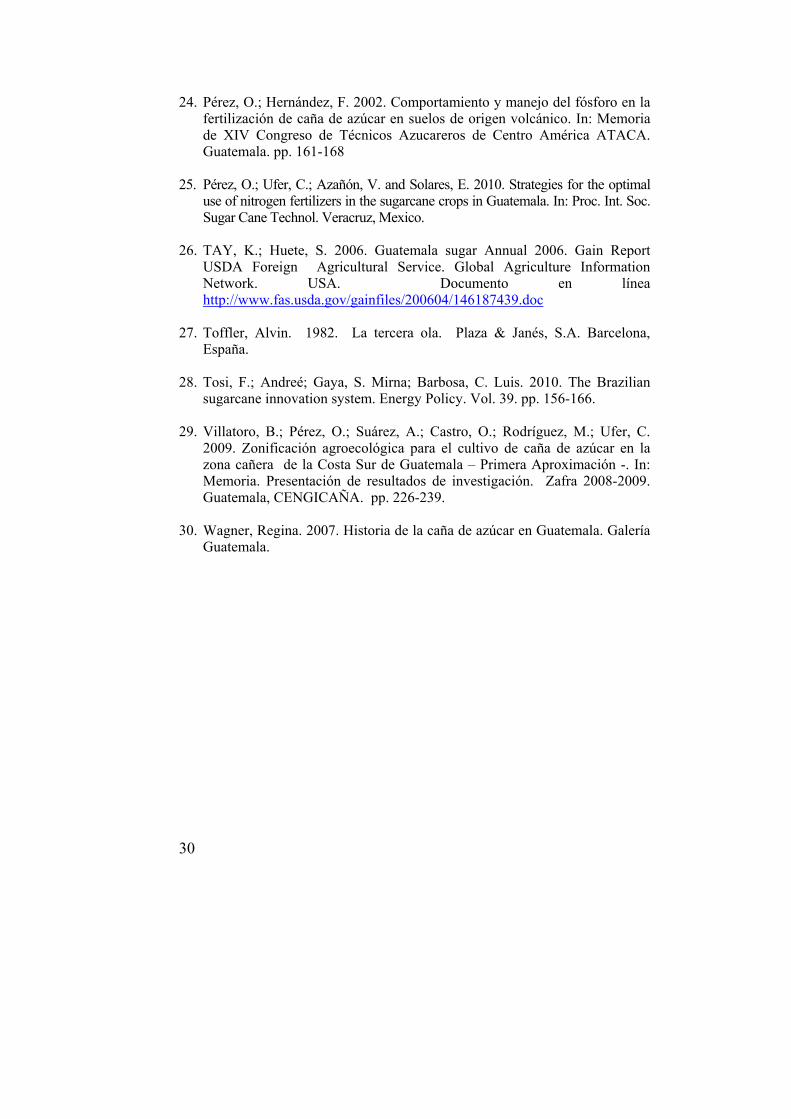
24. Pérez, O.; Hernández, F. 2002. Comportamiento y manejo del fósforo en la fertilización de caña de azúcar en suelos de origen volcánico. In: Memoria de XIV Congreso de Técnicos Azucareros de Centro América ATACA. Guatemala. pp. 161-168
25. Pérez, O.; Ufer, C.; Azañón, V. and Solares, E. 2010. Strategies for the optimal
use of nitrogen fertilizers in the sugarcane crops in Guatemala. In: Proc. Int. Soc. Sugar Cane Technol. Veracruz, Mexico.
26. TAY, K.; Huete, S. 2006. Guatemala sugar Annual 2006. Gain Report
USDA Foreign Agricultural Service. Global Agriculture Information Network. USA. Documento en línea http://www.fas.usda.gov/gainfiles/200604/146187439.doc
27. Toffler, Alvin. 1982. La tercera ola. Plaza & Janés, S.A. Barcelona,
España. 28. Tosi, F.; Andreé; Gaya, S. Mirna; Barbosa, C. Luis. 2010. The Brazilian
sugarcane innovation system. Energy Policy. Vol. 39. pp. 156-166. 29. Villatoro, B.; Pérez, O.; Suárez, A.; Castro, O.; Rodríguez, M.; Ufer, C.
2009. Zonificación agroecológica para el cultivo de caña de azúcar en la zona cañera de la Costa Sur de Guatemala – Primera Aproximación -. In: Memoria. Presentación de resultados de investigación. Zafra 2008-2009. Guatemala, CENGICAÑA. pp. 226-239.
30. Wagner, Regina. 2007. Historia de la caña de azúcar en Guatemala. Galería
Guatemala.
31
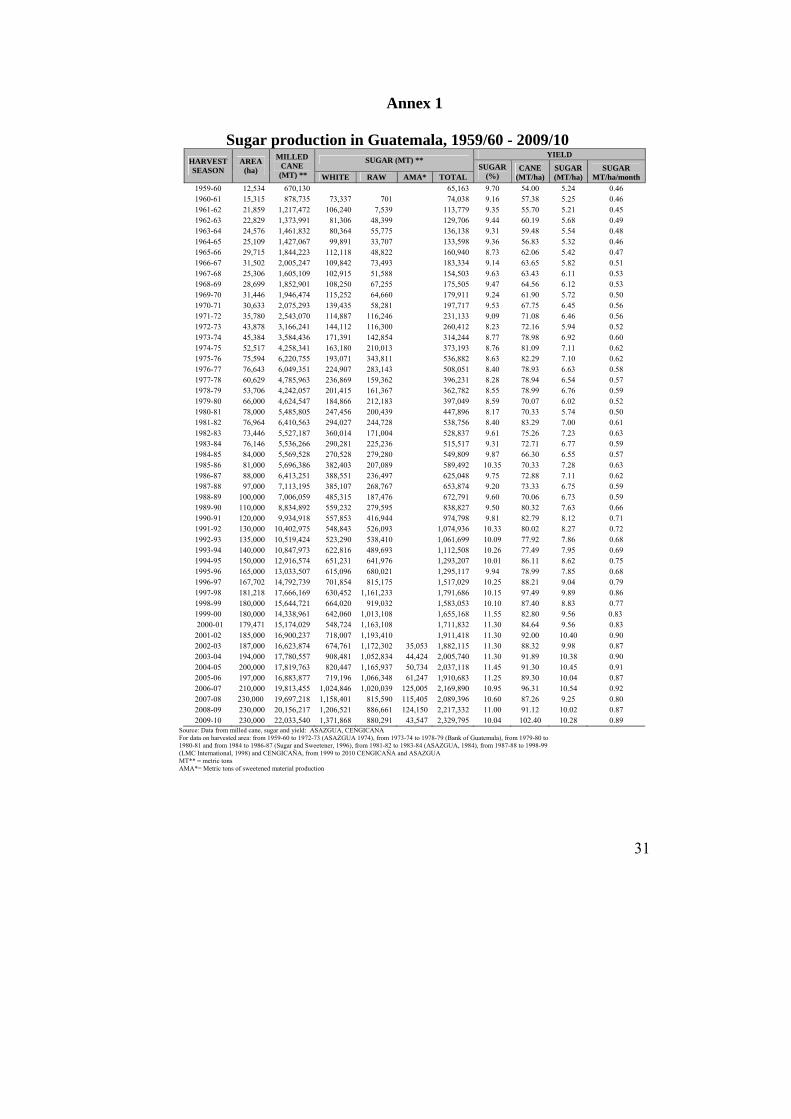
Annex 1 Sugar production in Guatemala, 1959/60 - 2009/10
HARVEST SEASON
AREA (ha)
MILLED CANE
(MT) **
SUGAR (MT) ** YIELD
SUGAR (%)
CANE (MT/ha)
SUGAR (MT/ha)
SUGAR MT/ha/month WHITE RAW AMA* TOTAL
1959-60 12,534 670,130 65,163 9.70 54.00 5.24 0.46 1960-61 15,315 878,735 73,337 701 74,038 9.16 57.38 5.25 0.46 1961-62 21,859 1,217,472 106,240 7,539 113,779 9.35 55.70 5.21 0.45 1962-63 22,829 1,373,991 81,306 48,399 129,706 9.44 60.19 5.68 0.49 1963-64 24,576 1,461,832 80,364 55,775 136,138 9.31 59.48 5.54 0.48 1964-65 25,109 1,427,067 99,891 33,707 133,598 9.36 56.83 5.32 0.46 1965-66 29,715 1,844,223 112,118 48,822 160,940 8.73 62.06 5.42 0.47 1966-67 31,502 2,005,247 109,842 73,493 183,334 9.14 63.65 5.82 0.51 1967-68 25,306 1,605,109 102,915 51,588 154,503 9.63 63.43 6.11 0.53 1968-69 28,699 1,852,901 108,250 67,255 175,505 9.47 64.56 6.12 0.53 1969-70 31,446 1,946,474 115,252 64,660 179,911 9.24 61.90 5.72 0.50 1970-71 30,633 2,075,293 139,435 58,281 197,717 9.53 67.75 6.45 0.56 1971-72 35,780 2,543,070 114,887 116,246 231,133 9.09 71.08 6.46 0.56 1972-73 43,878 3,166,241 144,112 116,300 260,412 8.23 72.16 5.94 0.52 1973-74 45,384 3,584,436 171,391 142,854 314,244 8.77 78.98 6.92 0.60 1974-75 52,517 4,258,341 163,180 210,013 373,193 8.76 81.09 7.11 0.62 1975-76 75,594 6,220,755 193,071 343,811 536,882 8.63 82.29 7.10 0.62 1976-77 76,643 6,049,351 224,907 283,143 508,051 8.40 78.93 6.63 0.58 1977-78 60,629 4,785,963 236,869 159,362 396,231 8.28 78.94 6.54 0.57 1978-79 53,706 4,242,057 201,415 161,367 362,782 8.55 78.99 6.76 0.59 1979-80 66,000 4,624,547 184,866 212,183 397,049 8.59 70.07 6.02 0.52 1980-81 78,000 5,485,805 247,456 200,439 447,896 8.17 70.33 5.74 0.50 1981-82 76,964 6,410,563 294,027 244,728 538,756 8.40 83.29 7.00 0.61 1982-83 73,446 5,527,187 360,014 171,004 528,837 9.61 75.26 7.23 0.63 1983-84 76,146 5,536,266 290,281 225,236 515,517 9.31 72.71 6.77 0.59 1984-85 84,000 5,569,528 270,528 279,280 549,809 9.87 66.30 6.55 0.57 1985-86 81,000 5,696,386 382,403 207,089 589,492 10.35 70.33 7.28 0.63 1986-87 88,000 6,413,251 388,551 236,497 625,048 9.75 72.88 7.11 0.62 1987-88 97,000 7,113,195 385,107 268,767 653,874 9.20 73.33 6.75 0.59 1988-89 100,000 7,006,059 485,315 187,476 672,791 9.60 70.06 6.73 0.59 1989-90 110,000 8,834,892 559,232 279,595 838,827 9.50 80.32 7.63 0.66 1990-91 120,000 9,934,918 557,853 416,944 974,798 9.81 82.79 8.12 0.71 1991-92 130,000 10,402,975 548,843 526,093 1,074,936 10.33 80.02 8.27 0.72 1992-93 135,000 10,519,424 523,290 538,410 1,061,699 10.09 77.92 7.86 0.68 1993-94 140,000 10,847,973 622,816 489,693 1,112,508 10.26 77.49 7.95 0.69 1994-95 150,000 12,916,574 651,231 641,976 1,293,207 10.01 86.11 8.62 0.75 1995-96 165,000 13,033,507 615,096 680,021 1,295,117 9.94 78.99 7.85 0.68 1996-97 167,702 14,792,739 701,854 815,175 1,517,029 10.25 88.21 9.04 0.79 1997-98 181,218 17,666,169 630,452 1,161,233 1,791,686 10.15 97.49 9.89 0.86 1998-99 180,000 15,644,721 664,020 919,032 1,583,053 10.10 87.40 8.83 0.77 1999-00 180,000 14,338,961 642,060 1,013,108 1,655,168 11.55 82.80 9.56 0.83
2000-01 179,471 15,174,029 548,724 1,163,108 1,711,832 11.30 84.64 9.56 0.83 2001-02 185,000 16,900,237 718,007 1,193,410 1,911,418 11.30 92.00 10.40 0.90 2002-03 187,000 16,623,874 674,761 1,172,302 35,053 1,882,115 11.30 88.32 9.98 0.87 2003-04 194,000 17,780,557 908,481 1,052,834 44,424 2,005,740 11.30 91.89 10.38 0.90 2004-05 200,000 17,819,763 820,447 1,165,937 50,734 2,037,118 11.45 91.30 10.45 0.91 2005-06 197,000 16,883,877 719,196 1,066,348 61,247 1,910,683 11.25 89.30 10.04 0.87 2006-07 210,000 19,813,455 1,024,846 1,020,039 125,005 2,169,890 10.95 96.31 10.54 0.92 2007-08 230,000 19,697,218 1,158,401 815,590 115,405 2,089,396 10.60 87.26 9.25 0.80 2008-09 230,000 20,156,217 1,206,521 886,661 124,150 2,217,332 11.00 91.12 10.02 0.87 2009-10 230,000 22,033,540 1,371,868 880,291 43,547 2,329,795 10.04 102.40 10.28 0.89
Source: Data from milled cane, sugar and yield: ASAZGUA, CENGICANA For data on harvested area: from 1959-60 to 1972-73 (ASAZGUA 1974), from 1973-74 to 1978-79 (Bank of Guatemala), from 1979-80 to 1980-81 and from 1984 to 1986-87 (Sugar and Sweetener, 1996), from 1981-82 to 1983-84 (ASAZGUA, 1984), from 1987-88 to 1998-99 (LMC International, 1998) and CENGICAÑA, from 1999 to 2010 CENGICAÑA and ASAZGUA MT** = metric tons AMA*= Metric tons of sweetened material production

32
33
II. CHARACTERIZATION OF SUGARCANE GROWING AREAS
34
CHARACTERIZATION OF SUGARCANE GROWING AREAS
Braulio Villatoro and Ovidio Pérez
INTRODUCTION Sugar industry of Guatemala is composed of 13 sugar mills which are distributed geographically as follows:
Ten of the sugar mills are located on the Pacific coastal plain, Southern Coast of Guatemala, occupying almost the totality of sugarcane growing area (99 %). These sugar mills are: Tululá, Palo Gordo, Madre Tierra, La Unión, Pantaleon, Concepcion, Magdalena, Santa Ana, Trinidad, and El Pilar. The other sugar mills are located in relatively small areas, at different parts of the country. At the Villa Canales Municipality, Guatemala District, is located Santa Teresa Mill, and in the Santa Rosa District is La Sonrisa. The Chabil Utzaj Mill is being established at the Northern of the country, in Alta Verapaz District.
GEOGRAPHIC LOCATION OF SUGARCANE GROWING AREAS The sugarcane growing areas in the Southern Coast of Guatemala, are located between 91°50’00” - 90°10’00” West Longitude and 14°33’00” - 13°50’00” North Latitude. Geopolitically, these areas are located in the Retalhuleu, Suchitepéquez, Escuintla and Santa Rosa Districts. At the moment, the sugarcane growing areas are expanding towards the Jutiapa District. A general geographical distribution is presented in Figure 1.
Braulio Villatoro is Agr. Eng., Specialist in Information Systems for Precision Agriculture; Ovidio Pérez
is Agr. Eng., M.Sc. Agronomy Program Leader, CENGICAÑA. www.cengicana.org

35
Figure 1. Geographical distribution of sugarcane growing areas in the Southern
Coast of Guatemala The sugarcane growing areas are located in the river basin of the following rivers: Ocosito, Samalá, Sis-Icán, Nahualate, Madre Vieja, Coyolate, Acomé, Achiguate, María Linda, Paso Hondo, Los Esclavos, and La Paz; which have their origin in the highlands and flow into the Pacific Ocean.
WEATHER CONDITION The sugarcane growing areas of Guatemala are divided in four strata, based on altitudinal position and expressed as meters above sea level (MASL). Altitudinal position of these areas are associated to climatic and soil conditions, due to physiographic characteristics corresponding to a natural landscape from the base of the mountains to the coastal plain, with slopes of 7 to 25 percent. The areas are undulated hills that easily descend to the plain level of the Pacific Coast (CENGICAÑA, 1996). The high stratum is located above 300 MASL; Medium stratum is from 100 to 300 MASL; Low stratum, from 40 to 100 MASL, and Littoral stratum corresponding from 0 to 40 MASL. Localization of these strata is presented in Figure 2. Climatic conditions are summarized in Table 1.
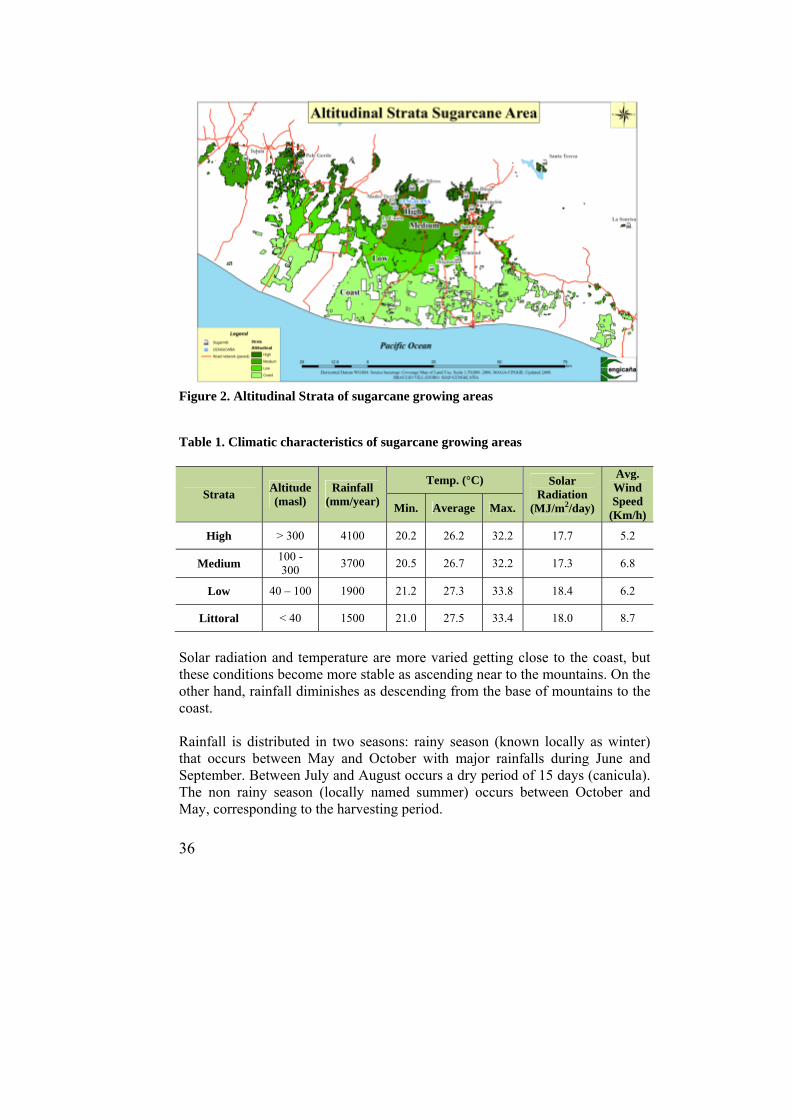
36
Figure 2. Altitudinal Strata of sugarcane growing areas
Table 1. Climatic characteristics of sugarcane growing areas
Strata Altitude (masl)
Rainfall (mm/year)
Temp. (°C) Solar Radiation
(MJ/m2/day)
Avg. Wind Speed
(Km/h) Min. Average Max.
High > 300 4100 20.2 26.2 32.2 17.7 5.2
Medium 100 - 300
3700 20.5 26.7 32.2 17.3 6.8
Low 40 – 100 1900 21.2 27.3 33.8 18.4 6.2
Littoral < 40 1500 21.0 27.5 33.4 18.0 8.7
Solar radiation and temperature are more varied getting close to the coast, but these conditions become more stable as ascending near to the mountains. On the other hand, rainfall diminishes as descending from the base of mountains to the coast. Rainfall is distributed in two seasons: rainy season (known locally as winter) that occurs between May and October with major rainfalls during June and September. Between July and August occurs a dry period of 15 days (canicula). The non rainy season (locally named summer) occurs between October and May, corresponding to the harvesting period.
37
SOILS
Parent material
Parent material on which soils of sugarcane growing areas are developed are
mainly formed by volcanic ash, lapilli, pumice and pyroclastics, which exist due
to high volcanic activity occurred in different geological time, mainly the
Quaternary Period (CENGICAÑA, 1996).
Soil mineralogy and granulometrical characteristics vary from one place to the
other, depending on geographical position, especially in relation to the distance
from the volcanic crater. Allophane is the predominant material in soils at high
and medium strata, meanwhile, in low stratum Haloisite and 2:1 clay are
predominant, probably Esmectite in the lowlands along the Western and Eastern
parts of the region.
Soil classification at the sugarcane region
In 1993 and 1994, a semi detailed soil survey was carried out (1:50,000) in the
sugarcane growing zone. For this, the Soil taxonomy System was used,
considering Family level (Soil survey Staff, 1992).
At the region, the following were identified: 6 soil Orders, 9 Suborders, 13
Great Groups, 25 Subgroups and 37 Families. By its extension: Mollisols,
Andisols, Entisols, Inceptisols, Alfisols and Vertisols, in order of importance,
respectively.
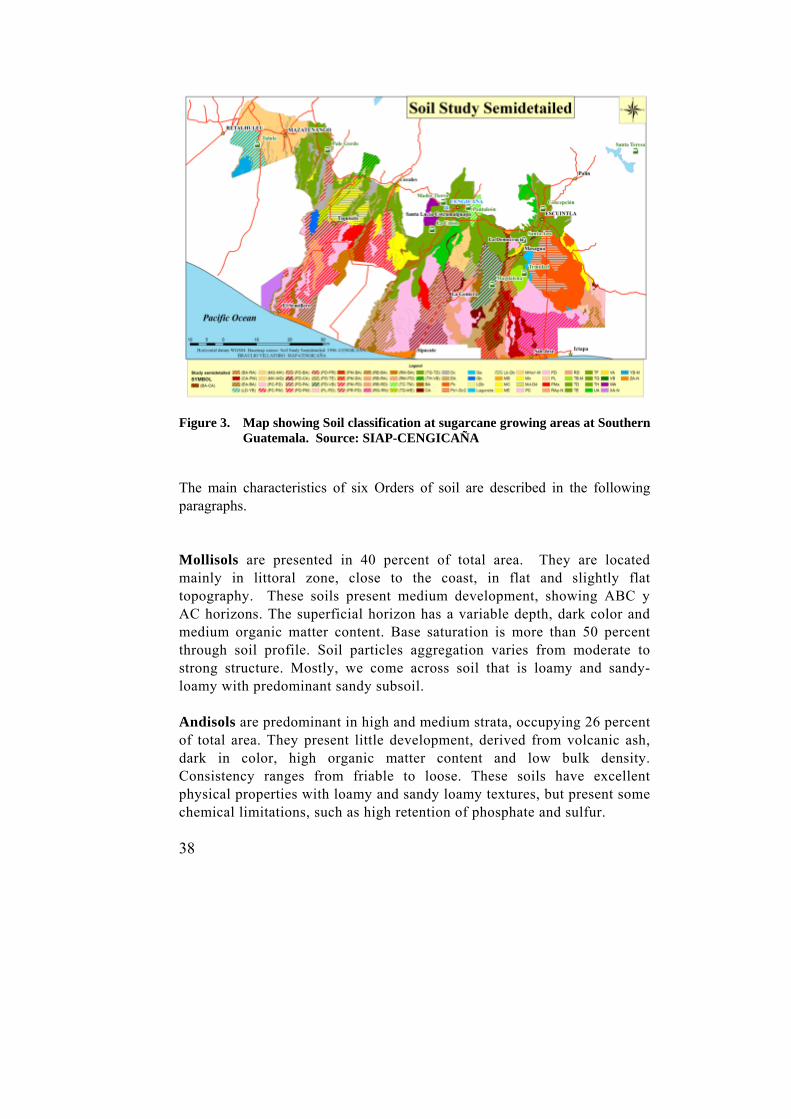
Order localization in the region is observed in Figure 3. The position of each
Order is corresponding to the natural landscape, depending on slope and
topography characteristics due to fluvio-volcanic material deposition and its
distribution downward leaching from the mountains. Thus, it is observed that
Andisols (recent formed soils) are located at high and medium strata in the
region with greater rainfall than in the lowlands and littoral areas where
Mollisols are predominant.
38
Figure 3. Map showing Soil classification at sugarcane growing areas at Southern
Guatemala. Source: SIAP-CENGICAÑA The main characteristics of six Orders of soil are described in the following paragraphs. Mollisols are presented in 40 percent of total area. They are located mainly in littoral zone, close to the coast, in flat and slightly flat topography. These soils present medium development, showing ABC y AC horizons. The superficial horizon has a variable depth, dark color and medium organic matter content. Base saturation is more than 50 percent through soil profile. Soil particles aggregation varies from moderate to strong structure. Mostly, we come across soil that is loamy and sandy-loamy with predominant sandy subsoil. Andisols are predominant in high and medium strata, occupying 26 percent of total area. They present little development, derived from volcanic ash, dark in color, high organic matter content and low bulk density. Consistency ranges from friable to loose. These soils have excellent physical properties with loamy and sandy loamy textures, but present some chemical limitations, such as high retention of phosphate and sulfur.

39
Entisols are the less evolved soils in the region, with just AC horizons. They constitute 16 percent of the total area. They are found in valleys and alluvial fans in narrow strips, located in medium and lowlands that extend to the coast plains. They have little or no development and little or no evidence of genetic horizons development. Mostly, these soils present a good permeability due to gross sandy texture. Subsoil tends to be sandy so, during the summer, water deficit is frequently a limiting factor. Inceptisols are located on medium and lower strata, composing 11 percent of the total area. They are mainly developed on clay material mixed with volcanic ash and rock fragments. These soils have a medium development presenting saturation of exchange capacity (< 50 %). They have well developed structure and medium or fine texture on clay subsoil.
Alfisols are suited on medium and low strata of the antique fans, presenting undulated and slightly undulated topography. An important characteristic is an argillic B horizon due to clay leaching down to the subsoil. Usually these soils present clay texture with massive and compact structure.
Vertisols occupy a minimum extension of total area (0.5 %). Soils are well developed with ABC horizons. They present high clay content, such as Montmorillonite, and therefore tend to crack during dry season, and swell in rainy season.
Soil Management Groups The grouping of soil management was based on information from Semi-detailed Study of Soils of the Sugarcane Growing Zone of Guatemala (CENGICAÑA, 1996), adapted from the original grouping. The soils were classified in accordance to the Manual de Conservación del Suelo y del Agua del Colegio de Post-graduados, de la Secretaría de Agricultura y Recursos Hídricos de México (Adapted for the sugarcane crop in Guatemala) and the corresponding taxonomic family (CENGICAÑA, 2002).

40
Factors employed to define Soil Classes were divided into two groups: limiting factors and auxiliary factors. Limiting factors – by range of variation and importance- define specific classes, whereas auxiliary factors do not necessarily define a class, but describe special handling conditions. The most important limiting factors found were: climatic conditions, susceptibility to erosion, topography and soil; auxiliary factors were soil texture, permeability and soil reaction (pH), (CENGICAÑA, 2002). The analysis of both limiting and auxiliary factors results on 13 soil groups, corresponding to 4 soil classes (agrological classes). Each class was identified with its corresponding limiting factor(s) using conventional nomenclature, while auxiliary factor(s) are described in parentheses. The main characteristics of each of the Soil Management Groups are presented in Table 2, and their geographical localization is shown in Figure 4. Table 2. Main characteristics of the soil management groups of the sugarcane
area of Guatemala (CENGICAÑA, 2002)
Soil Group
Soil Class /limiting factors
Characteristics
S01 I Deep Mollisols with high fertility.
S02 II/E Deep and well drained Andisols, showing slight erosion
S03 II/S1 (PR) Gross texture, moderately deep and permeable
(Dry Mollisols).
S04 II/S1 (PL) Moderately deep Inceptisols, with clay texture and
low permeability
S05 II/T1 E (PL) Clay Inceptisols, slightly slanted
Susceptible to erosion, low permeability
S06 II/T1 S1 E Moderately deep Andisols, slightly slanted to
Undulated, susceptible to erosion.
S07 II/T1 S1 E (TF) (PL)Clay soils that crack in the dry season, slightly slanted
susceptible to erosion and very slowly permeable (Vertic integrated soils).
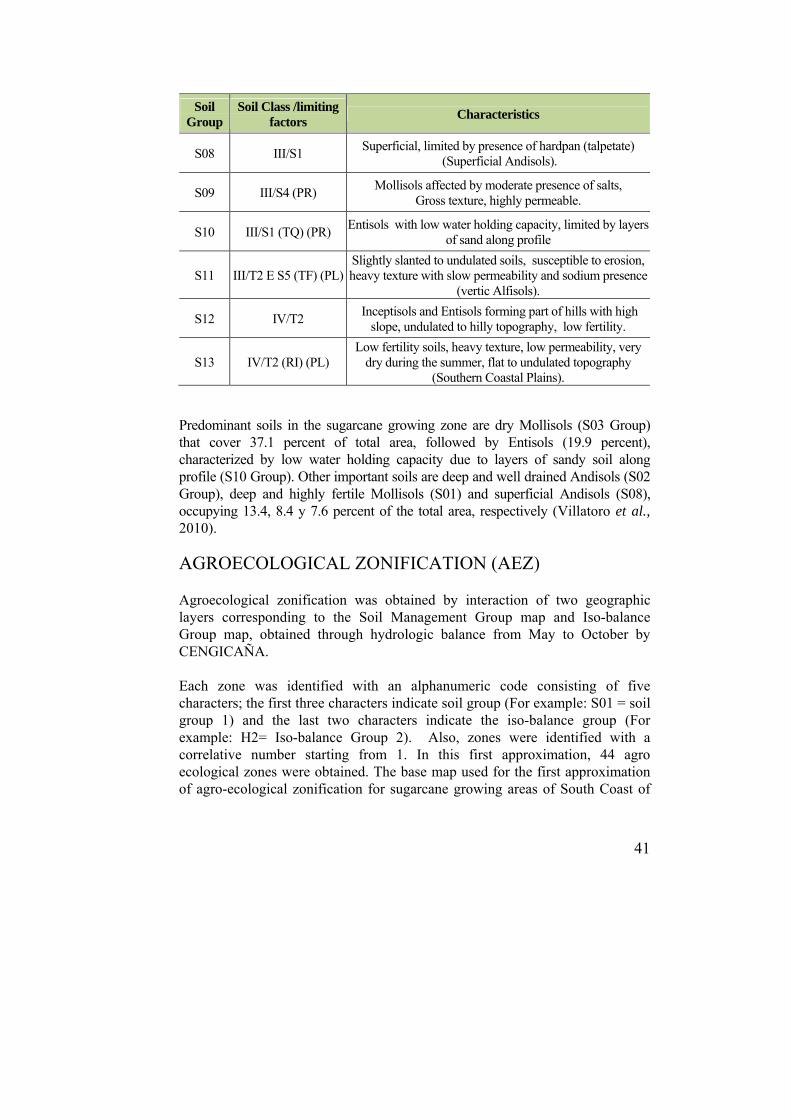
41
Soil Group
Soil Class /limiting factors
Characteristics
S08 III/S1 Superficial, limited by presence of hardpan (talpetate)
(Superficial Andisols).
S09 III/S4 (PR) Mollisols affected by moderate presence of salts,
Gross texture, highly permeable.
S10 III/S1 (TQ) (PR) Entisols with low water holding capacity, limited by layers
of sand along profile
S11 III/T2 E S5 (TF) (PL)Slightly slanted to undulated soils, susceptible to erosion, heavy texture with slow permeability and sodium presence
(vertic Alfisols).
S12 IV/T2 Inceptisols and Entisols forming part of hills with high
slope, undulated to hilly topography, low fertility.
S13 IV/T2 (RI) (PL) Low fertility soils, heavy texture, low permeability, very
dry during the summer, flat to undulated topography (Southern Coastal Plains).
Predominant soils in the sugarcane growing zone are dry Mollisols (S03 Group) that cover 37.1 percent of total area, followed by Entisols (19.9 percent), characterized by low water holding capacity due to layers of sandy soil along profile (S10 Group). Other important soils are deep and well drained Andisols (S02 Group), deep and highly fertile Mollisols (S01) and superficial Andisols (S08), occupying 13.4, 8.4 y 7.6 percent of the total area, respectively (Villatoro et al., 2010).
AGROECOLOGICAL ZONIFICATION (AEZ) Agroecological zonification was obtained by interaction of two geographic layers corresponding to the Soil Management Group map and Iso-balance Group map, obtained through hydrologic balance from May to October by CENGICAÑA. Each zone was identified with an alphanumeric code consisting of five characters; the first three characters indicate soil group (For example: S01 = soil group 1) and the last two characters indicate the iso-balance group (For example: H2= Iso-balance Group 2). Also, zones were identified with a correlative number starting from 1. In this first approximation, 44 agro ecological zones were obtained. The base map used for the first approximation of agro-ecological zonification for sugarcane growing areas of South Coast of
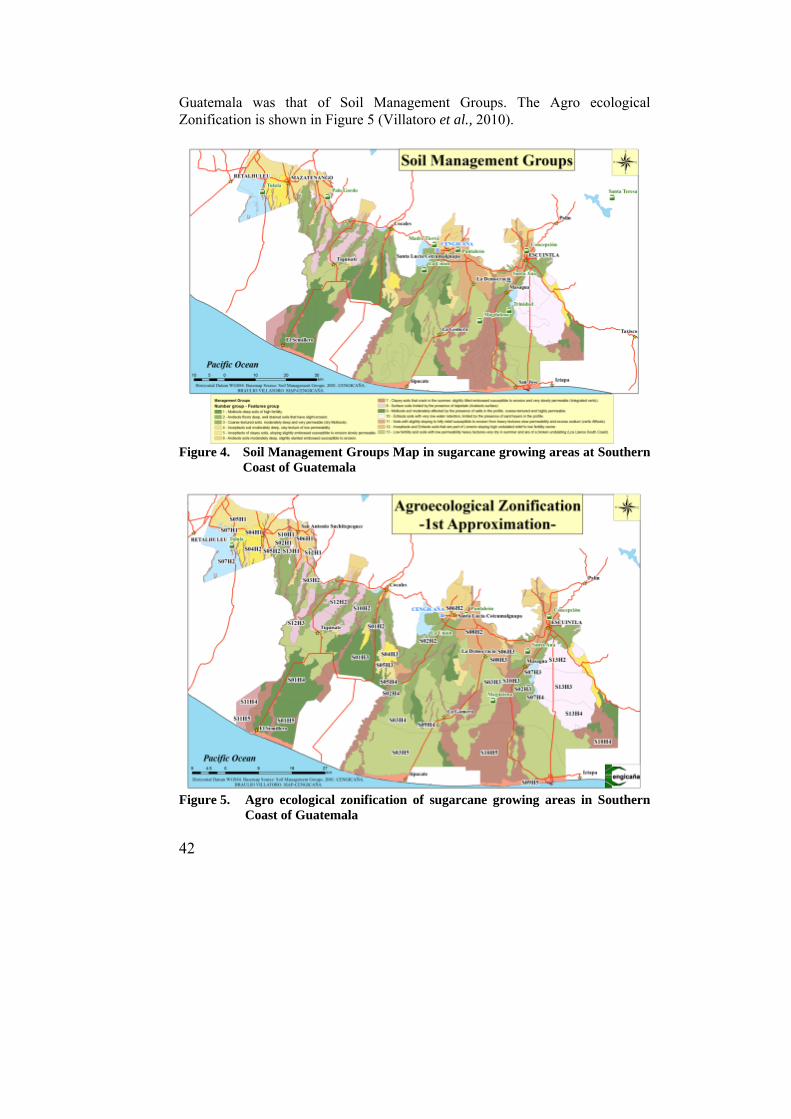
42
Guatemala was that of Soil Management Groups. The Agro ecological Zonification is shown in Figure 5 (Villatoro et al., 2010).
Figure 4. Soil Management Groups Map in sugarcane growing areas at Southern
Coast of Guatemala
Figure 5. Agro ecological zonification of sugarcane growing areas in Southern
Coast of Guatemala
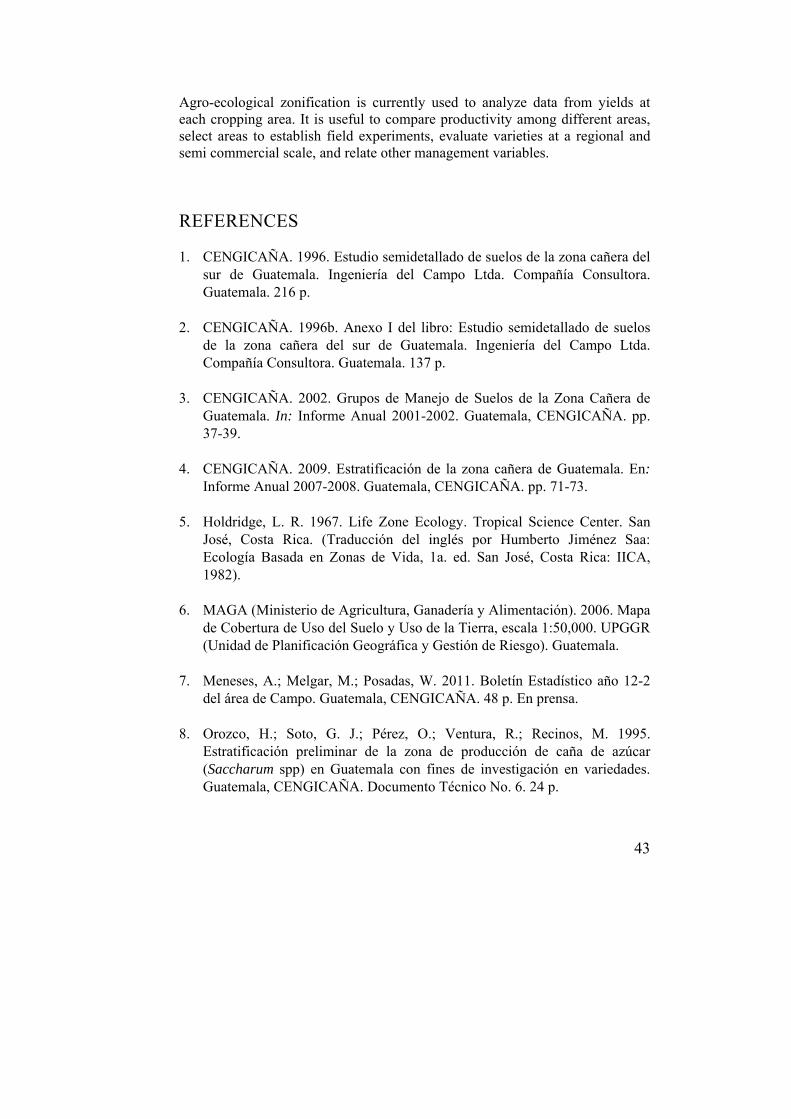
43
Agro-ecological zonification is currently used to analyze data from yields at each cropping area. It is useful to compare productivity among different areas, select areas to establish field experiments, evaluate varieties at a regional and semi commercial scale, and relate other management variables.
REFERENCES
1. CENGICAÑA. 1996. Estudio semidetallado de suelos de la zona cañera del sur de Guatemala. Ingeniería del Campo Ltda. Compañía Consultora. Guatemala. 216 p.
2. CENGICAÑA. 1996b. Anexo I del libro: Estudio semidetallado de suelos
de la zona cañera del sur de Guatemala. Ingeniería del Campo Ltda. Compañía Consultora. Guatemala. 137 p.
3. CENGICAÑA. 2002. Grupos de Manejo de Suelos de la Zona Cañera de
Guatemala. In: Informe Anual 2001-2002. Guatemala, CENGICAÑA. pp. 37-39.
4. CENGICAÑA. 2009. Estratificación de la zona cañera de Guatemala. En:
Informe Anual 2007-2008. Guatemala, CENGICAÑA. pp. 71-73. 5. Holdridge, L. R. 1967. Life Zone Ecology. Tropical Science Center. San
José, Costa Rica. (Traducción del inglés por Humberto Jiménez Saa: Ecología Basada en Zonas de Vida, 1a. ed. San José, Costa Rica: IICA, 1982).
6. MAGA (Ministerio de Agricultura, Ganadería y Alimentación). 2006. Mapa
de Cobertura de Uso del Suelo y Uso de la Tierra, escala 1:50,000. UPGGR (Unidad de Planificación Geográfica y Gestión de Riesgo). Guatemala.
7. Meneses, A.; Melgar, M.; Posadas, W. 2011. Boletín Estadístico año 12-2
del área de Campo. Guatemala, CENGICAÑA. 48 p. En prensa. 8. Orozco, H.; Soto, G. J.; Pérez, O.; Ventura, R.; Recinos, M. 1995.
Estratificación preliminar de la zona de producción de caña de azúcar (Saccharum spp) en Guatemala con fines de investigación en variedades. Guatemala, CENGICAÑA. Documento Técnico No. 6. 24 p.

44
9. Soil Survey Staff. 1992. Keys to soil taxonomy 5th Ed. Virginia. United States. Pocahontas Press.
10. Villatoro, B.; Pérez, O.; Suárez, A.; Castro, O.; Rodríguez, M.; Ufer, C.
2010. Zonificación Agroecológica para el Cultivo de Caña de Azúcar en la Zona Cañera de la Costa Sur de Guatemala –Primera Aproximación–. In: Memoria. Presentación de resultados de investigación. Zafra 2009-2010. Guatemala, CENGICAÑA. pp. 325-331.

45
III. SUGARCANE BREEDING AND SELECTION
46
SUGARCANE BREEDING AND SELECTION
Héctor Orozco, José Luis Quemé, Werner Ovalle and Fredy Rosales Longo
INTRODUCTION The objectives of breeding and selection in plants are the modification of traits and at the same time, to take advantage of the natural genetic variation. The final aim is to obtain new varieties that suit human needs in specific circumstances. The focus of CENGICAÑA's sugarcane breeding and selection program is to obtain new high yielding varieties through breeding and selection in order to progressively, increase sugar yield in the sugarcane growing areas of Guatemala. The new varieties besides high sugar yield, must adapt to the different environments and soil conditions in the production area, with genetic resistance to the main diseases, as well as adequate agronomic characteristics for their proper management.
The sugarcane breeding and selection program of CENGICAÑA was established with a general strategy that includes three main components: a) genetic variability, generation through germplasm acquisition and management, and by crossing selected parents, b) assessment and selection from crosses progenies and introduced varieties from abroad, and c) releasing of new varieties (Orozco, 2005). This chapter describes the above components. The general strategy involves four main breeding objectives: a) sugar yield increase per unit/area b) disease resistance, c) adaptability, and d) ratooning ability. These breeding objectives are lined up with the varietal prototype that growers are requiring for the Guatemalan sugarcane industry.
At CENGICAÑA, genetic variability is generated through conventional breeding, establishing, mostly, bi-parental crosses using selected parents. New parents are incorporated each subsequent crossing campaign. The new parents are selected from elite varieties introduced from other sugarcane breeding programs in the world. The introduced varieties are obtained through specific agreements based on exchanging CG elite varieties and foreign varieties. The selection program is based on an outline that guides the development of specific varieties for specific altitudinal zones or varieties with specific early or late maturity pattern. The selection program is based on five stages of selection,
Héctor Orozco is Agr. Eng., M.Sc., Leader of CENGICAÑA’s Sugarcane Breeding and Selection Program; José Luis Quemé is Agr. Eng., Ph.D., Plant breeder; Werner Ovalle is Agr. Eng., M.Sc., Plant pathology and Fredy Rosales Longo is Agr. Eng, M.Sc., Plant breeder, CENGICAÑA. www.cengicana.org

47
which begin with an original population of near 180,000 stools in the stage I, and finishes up with three to five promising varieties in stage V. The stage V or semi-commercial field trial of CENGICAÑA´s program is the validation stage, and based on the evaluation results in this stage, varieties for commercial use are released. The variety releasing procedure consists in a Technical Report about the performance of the variety in the stage V in terms of sugar yield, disease resistance, agronomic characteristics and adaptability after three crops:
plantcane, first and second ratoon. Due to the CENGICAÑA’s varieties program has released several varieties and because some of them are in commercial scale, a new activity, which is called New Varieties Development, has been initiated. In this project breeders and growers from the mills, design the mill variety composition, based mainly on the concept of specific adaptability of commercial varieties and the availability of the new ones. A second part of the project involves the discussion of information about the varieties performance in accordance to the planned variety composition. The information is shared and discussed for each mill; additionally this information is also shared among all mills in a Variety Forum every two years.
GERMPLASM In sugarcane breeding, the germplasm collection constitutes the biological basis for the creation of new cultivars. The collections serve as sources of genetic variability, which exploitation and utilization allow obtaining new and more productive cultivars, with high sugar content, suitable agronomic characteristics, and resistance to main pests and diseases. Typically, collections include basic germplasm (Saccharum's species and related genera) and Saccharum spp. hybrids. The basic germplasm collection is in the sugarcane world collection, which is replicated in two locations of the world: one is in India and the other one is in the United States of America. The world collection is formed mostly of basic germplasm, such is the case of the world collection in Miami, Florida, with 1,394 accessions coming from the following species of sugarcane and related grasses: Saccharum officinarum (397), S. barberi (58), S. sinense (42), S. robustum (85), S. spontaneum (348), Saccharum spp. (229), commercial hybrids (193), Erianthus (23), Narenga (1) and Miscanthus (18) (Ming et al., 2006).

48
Sugarcane breeding programs throughout the world have their own collections that have been used for the development of these cultivars. In general, the use of basic germplasm in these collections has been low. The total number of accessions or cultivars is reported as follows: Australia (4,220), Brazil (3,736); The United States of America (5,020); Barbados (2,567); Cuba (3,386); India (3,979); and Fiji (6,000) accessions (INICA, 2003). In addition to genetic material, the conformation of a germplasm collection involves quarantine measures on the introduced plants control, in order to avoid the introduction or dissemination of quarantine interest plagues. General concepts of sugarcane cytogenetics Sugarcane belongs to the Saccharum genus, which at the same time is member of the Andropogonae tribe, and this one is part of the Poaceae family. In this genus there are six species: S. spontaneum, S. robustum, S. officinarum, S. barbieri, S. sinense y S. edule. It is believed, though, that the last three species have an interspecific or intergeneric background (D’Hont et al., 1998). On the other hand, the molecular evidence is not enough to maintain the “species” status for S. barberi y S. sinense (Ming et al., 2006). The modern sugarcane (Saccharum spp. Hybrids) is a genetically complex crop. That is the reason why, its breeding in the traditional way (inbreeding and hybridization) is problematic. Modern sugarcane cultivars (Saccharum spp. Hybrids) have taken the place of traditional cultivars of S. officinarum and some clones of S. spontaneum (Grivet et al., 2004). Molecular Cytogenetics The sugarcane species are characterized by their small and numerous chromosomes (35 to more than 200) (Ming et al., 2006). Several studies about molecular cytogenetics (D’Hont et al., 1998; Grivet et al., 2004; Edmé et al., 2005; Babu, 2006; Piperidis et al., 2010) and about gene mapping (Da Silva et al., 1993; al Janabi et al., 1993; Grivet et al., 1994) have established the approximate size of the genome of S. spontaneum, which is between 3.05 and 5.31 pg (picograms, 1pg=987 Mbp). The genome size of S. officinarum is between 6.32 and 6.66 pg. Some commercial sugarcane cultivars (Saccharum spp hybrids) from Canal Point show genomes sizes which oscillate between 6.30 and 7.5 pg (Edmé et al., 2005). Modern sugarcane cultivars show from 70% to 80% of chromosomes derived from S. officinarum, whereas 10% to 20% comes from S. spontaneum; and a very few chromosomes are product of the specific genetic recombination of those two species (Ming et al, 2006; Le Cunff et al., 2008).
49
What is the basic chromosomes number in Sugarcane? In plants, there are species that have more than one set of chromosomes on its haploid form (n). In polyploids “X” is used for designating the number of monoploid set of chromosomes. “X” is used to indicate the monoploid set of the haploid or gametic chromosome number (n). Therefore, the haploid number (n) and the chromosome monoploid (x) number of one basic diploid species are the same (Allard, 1980). For sugarcane, Sreenivasan et al., (1987) have revised the different proposals for the basic chromosome number for a set of them (1x), these proposals are summarized as follows: X=5, 6, 8, 10, 12. In S. officinarum, it has been determined that the total of chromosomes is 2n = 10x = 80. Clones with a greater number of chromosomes, are regarded atypical or hybrids (Sreenivasan et al., 1987). For S. officinarum with the main cytotypes 2n = 60-80, the most likely basic chromosomes number is x = 10 (D’Hont et al., 1998; Butterfield et al., 2001; Ming et al., 2006). S. spontaneum shows a wide range on its chromosomes number, 2n = 36 to 2n = 128, with five main cytotypes: 2n = 64, 80, 96, 112 and 128. Through the use of immunofluorescence, D’Hont et al., (1998), in 18s-25s rDNA and 5S rDNA genes, have determined their physical location in the chromosomes of the different cytotypes of S. spontaneum. With this information it was found that the total number of chromosomes is proportional to the number of sites of the rDNA physically mapped. From this study, consequently, it was derived that the basic number for a set of chromosomes for S. spontaneum is x = 8. The S. officinarum x S. spontaneum hybrids Modern sugarcane cultivars (Saccharum spp. hybrids) are derived from interspecific crossings between S. officinarum (2n=8x=80) a domesticated high sugar producing species, which is also called “noble cane” with S. spontaneum a wild relative (2n=5x=40 to n=16x=128) (Sreenivasan et al., 1987; Butterfield et al., 2001; Ming et al., 2006; Le Cunff et al., 2008). The interspecific hybrids, especially those that involve S. officinarum as female parent and S. spontaneum as the male parent, have a triploid (AAB) number of chromosomes, which are related to their parents, for example, a cross between S. officinarum (2n=10x=80) and S. spontaneum (2n=8x=112), results in hybrids containing 2n=136 chromosomes (40+40 from S. officinarum plus 56 from S. spontaneum; that is 2n+n) (Sreenivasan et al., 1987). These hybrids are characterized by its low sugar content, slim stalks, high fiber content, high
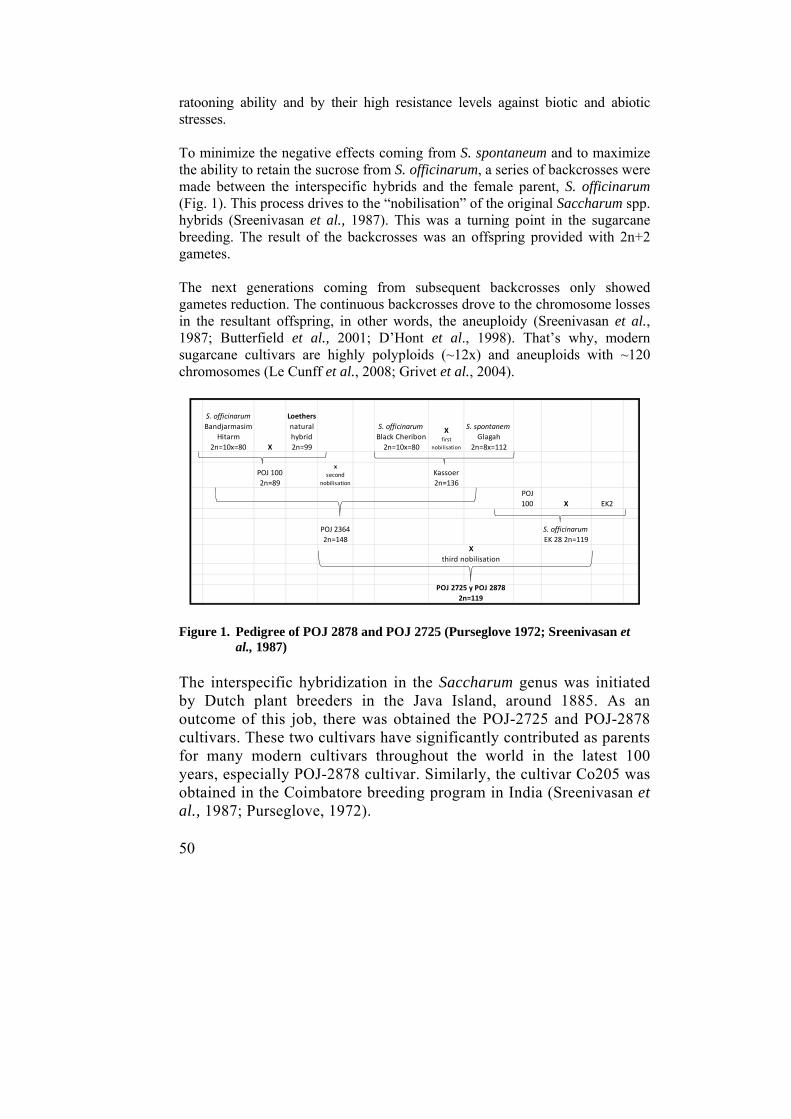
50
ratooning ability and by their high resistance levels against biotic and abiotic stresses. To minimize the negative effects coming from S. spontaneum and to maximize the ability to retain the sucrose from S. officinarum, a series of backcrosses were made between the interspecific hybrids and the female parent, S. officinarum (Fig. 1). This process drives to the “nobilisation” of the original Saccharum spp. hybrids (Sreenivasan et al., 1987). This was a turning point in the sugarcane breeding. The result of the backcrosses was an offspring provided with 2n+2 gametes. The next generations coming from subsequent backcrosses only showed gametes reduction. The continuous backcrosses drove to the chromosome losses in the resultant offspring, in other words, the aneuploidy (Sreenivasan et al., 1987; Butterfield et al., 2001; D’Hont et al., 1998). That’s why, modern sugarcane cultivars are highly polyploids (~12x) and aneuploids with ~120 chromosomes (Le Cunff et al., 2008; Grivet et al., 2004).
Figure 1. Pedigree of POJ 2878 and POJ 2725 (Purseglove 1972; Sreenivasan et
al., 1987) The interspecific hybridization in the Saccharum genus was initiated by Dutch plant breeders in the Java Island, around 1885. As an outcome of this job, there was obtained the POJ-2725 and POJ-2878 cultivars. These two cultivars have significantly contributed as parents for many modern cultivars throughout the world in the latest 100 years, especially POJ-2878 cultivar. Similarly, the cultivar Co205 was obtained in the Coimbatore breeding program in India (Sreenivasan et al., 1987; Purseglove, 1972).
S. officinarum
Bandjarmasim
Hitarm
2n=10x=80 X
Loethers
natural
hybrid
2n=99
S. officinarum
Black Cheribon
2n=10x=80
X first
nobilisation
S. spontanem
Glagah
2n=8x=112
POJ 100
2n=89
x
second
nobilisation
Kassoer
2n=136
POJ
100 X EK2
POJ 2364
2n=148
S. officinarum
EK 28 2n=119X
third nobilisation
POJ 2725 y POJ 2878
2n=119
51
Variety Introductions and quarantine CENGICAÑA's sugarcane breeding and selection program, as well as other sugarcane breeding programs throughout the world (MSIRI 2006 and BSES 2007) is emphasizing in the introduction of new varieties from breeding
programs from other countries. These varieties are elite and they are obtained through special variety exchange agreements. The elite varieties in this context are those that performs better than the Standard varieties in each program The objectives of these introductions in CENGICAÑA´s sugarcane breeding and selection program were established since the beginning of the program (Orozco et al., 2004 y 2008) as follows: a) widening the genetic base by using the foreign varieties as parents in the crossing scheme and b) testing the introduced varieties in the selection program for potential commercial use. Since 1992 CENGICAÑA has introduced 1300 elite varieties from 12 breeding programs. The contribution of these introductions is significant, if it is considered that in the future, there will be more restrictions for germplasm exchange among the different sugarcane breeding programs. The introduced varieties are treated in a local quarantine system. The aim of CENGICAÑA´s quarantine is to reduce the risk of introducing sugarcane crop pathogens, which are not found in the country or new strains of pathogens already present in the country. The quarantine system consists of two stages: closed quarantine and open quarantine. The closed quarantine is located in Guatemala City, in a greenhouse made of aluminium and glass, which has anti-aphid-mesh-protected windows and internal split rooms for the isolation of the introduced plants according to their origin. The introduced seed stalks are cut in one eye setts and four of these are planted in 25Lt pots, containing a substrate composed of soil, sand and, organic matter. Irrigation and fertilization are applied to obtain normal plant development. The plants are evaluated every two months in order to detect infections for smut (Ustilago scitaminea H Syd & P. Syd), Leaf scald (Xanthomonas albilineans), Sugarcane mosaic virus (SCMV), Sugarcane yellow leaf virus (SCYLV), and others (Ovalle, 1997). When symptoms of any disease are found in a pot, the pot is isolated and the plants are dried and
52
burned. After a period of about eight to twelve months, the disease-free varieties are cut and moved into the open quarantine. The objective of the open quarantine is to allow the disease-free introduced varieties grow in field conditions in an area located 300 Km away from the commercial sugarcane fields. The field planting gives the chance to observe infections that were not detected in the closed quarantine. The open quarantine takes 12 months, with two crop cycles of six months each and with evaluations at the end of each cycle. Symptomatic varieties infected with the above mentioned diseases are eliminated from the field by pulling them out of the soil and letting them dry for burning. Disease-free varieties that successfully undergo quarantine period are prepared to be sent to Guatemala's sugarcane growing area in the southern pacific so they can be incorporated in the stage II of selection in the CENGICAÑA's breeding and selection program. Germplasm collection CENGICAÑA's Variety Program counts with a germplasm collection called the National Collection, which consists of 2,040 accessions or cultivars, most of them Saccharum spp. hybrids. The accessions or cultivars were generated by different breeding programs throughout the world, such as: United States (initials CP and L), Barbados (B), Puerto Rico (PR), Mexico (MEX), Brazil (RB and SP), Colombia (CC), Ecuador (ECU), Cuba (C, Ha My and others), India (Co), Australia (Q), Thailand (MPT), Mauritius (M), Guatemala (CG) and others. The collection was established according to: a) preserve, expand, and use the variability for breeding purposes, b) identify suitable cultivars for commercial exploitation, and c) hold a genetic seed-cane source to initiate the increase of any cultivar of specific interest.
The National Collection is established at the CENGICAÑA’s Sugarcane Field Station Camantulul (300masl). The area is in a safe place, with suitable soil characteristics, which allows proper management in irrigation, fertilization, pest control, weed and others. The collection is renewed every 3 or 4 years, and the previous plantation is left at least for one year, while the new plantation is established successfully.

53
The National Collection's genetic variability is increased by through the incorporation of elite national germplasm: (CG, CENGICAÑA-Guatemala) and elite foreign germplasm (different acronyms), introducing in average 60 accessions per year. The national accessions are those that have been evaluated in the stage IV on multiple environment field trials. The international accessions, after quarantine process, are evaluated in an early selection stage (stage II) in two locations, both representatives of the sugarcane area of Guatemala then they are finally introduced to the collection. These evaluations, in some extent, allow identifying the level of adaptation of each of the accessions. Those varieties that have outstanding performance in stage IV are usually used as parents. Originally, CENGICAÑA's Sugarcane Breeding and Selection Program characterized the agricultural and industrial features of the National Collection such as juice quality and morphological features. This defined groups of valuable cultivars with potential to be used in hybrid generation based on their origin (Soto and Orozco, 1998; CENGICAÑA, 1999). Subsequently, some varieties have been characterized as they were being evaluated in advanced stages of selection, considering the variables: cane yield in ton/ha (TCH), apparent sucrose content, expressed in percentage (Pol%-cane), adaptability, agronomic characteristics, and reaction to mayor diseases. A group of varieties of the National Collection was characterized through molecular markers using microsatellite DNA sequences or simple sequence repeats (SSRs). According to the genetic similarity, homogeneous groups of cultivars were formed. This classification helps to optimize the planning of the combinations in the crossing process (Quemé et al., 2005).
CROSSING AND TRUE SEED PRODUCTION Due to the dependence on introduced cultivars for commercial cultivation, as well as susceptibility to local diseases, import of new cultivars is upheld. However, the varieties import has some drawbacks: a) the cultivars are developed in different conditions to those in which they will be commercially grown, limiting their adaptability and raising disease susceptibility as well; b) the sugarcane breeding programs around the world are limiting the free access to new cultivars, due to the policies on “Varieties Obtaining rights”. This situation supported, in part, the creation of the CENGICAÑA’s Sugarcane Breeding and Selection Program, in order to obtain local cultivars with high sugar yield per hectare, adequate
54
agronomical features, good adaptability, resistance to the main diseases in the surroundings where they are cultivated, and others. The Sugarcane Breeding and Selection Program begins with an appropriate hybridization system (CENICAÑA, 2004; Miller, 1994; South African Sugar Association, SF). Any plant breeding program has two main components: a) creation of genetic variability (usually through crosses), and b) discrimination within this variability (selection). The elements that make sustainable genetic improvement of sugarcane are: a) the release of new improved cultivars and b) the continuous improvement of the populations that are used as parents. The improvement of populations can be achieved through the use of elite clones as a result of the selection program, introduction of new foreign clones and elimination of the unproductive parents (Cox et al., 2000). Hybridization in sugarcane is based on the crossing of populations among them, through the technique “plant to plant” (P to P), from which F1 true seed (sexual seed) is obtained. When the sexual seed is sowed, it produces plants that are subjected to the selection process (Márquez, 1988). Since the importance of hybridization in creating variability in the breeding program, crosses strategy of CENGICAÑA’s Breeding and Selection Program is described below. Source of Parents As a result of the characterization of the national collection, the working collection has been formed, which is composed by 418 cultivars which have the potential for making crosses. This collection constitutes the main source of parents, complemented by the national collection.
The working collection is located at the Sugarcane Field Station Camantulul (middle stratum, 300masl) and at the “Los Tarros” sugarcane experimental station at “La Union” sugar mill (high stratum, 760 masl). The reasons for establishing a replication of the work collection at the high stratum are: 1) in this area, higher frequencies of varieties with flower are obtained in a natural way (Table 1), which facilitates the increase in the number of combination through the crossing process, 2) higher frequencies of the flowering synchronization, which allows crossings within parents that flowers at the same time but in different locations. Table 1. Flowering incidence (%) in cultivars of work collection in two
altitudinal strata

55
Harvest season
High stratum 760 masl
Middle stratum 300 masl
Difference
2007-08 91 68 23
2008-09 83 36 47
2009-10 67 26 41
Parents Selection for crosses The selection of top-quality parents is essential for the crosses success. The value of the parents can be defined by their combination ability to produce good progenies and their performance per se in terms of sugar concentration, adaptability, agronomic features, disease and pest resistance, and other attributes. CENGICAÑA's Variety Program has a well-established crossing schedule that includes different groups of cultivars, according to the following criteria: a)varieties with adequate agronomic characteristics and a good sugar content, b)varieties identified as contrasting through molecular markers, c)CG advanced cultivars and high-quality introduced cultivars, d) cultivars that were cultivated and/or varieties are successfully cultivated in Guatemala, e)successful cultivars as parents in other breeding programs, f) cultivars classified by its natural maturation, and others. The criterion to take into account a parent in a cross is based on: a) the sugar content, b) tons of cane per hectare (TCH), c) disease resistance, and d) others. In the last two years, a lot of importance has been given to the resistance to Orange rust (Puccinia kuehnii) and Brown rust (Puccinia melanocephala). For example, using the criteria from Table 2, the CG97-97 cultivar was coded as NSRN, MSRM, P2, T1, meaning that the cultivar does not have symptoms of Orange rust, it is moderately susceptible to Brown rust (15.1-20.0% incidence), the Pol%-cane is similar or greater to the control cultivar (CP72-2086) and tonnage is equal or greater than 20 percent compared to the control cultivar. This means that a potential parent with a record equal or better than the commercial control for traits of interest, is selected. Parents that have shown the ability to produce good offspring in previous crosses are also selected. Ranges of the "value in relation to control” (Table 2) were defined according to Viveros et al., 2009. Table 2 Criteria for selecting parents for crosses

56
Value relative to CP72-2086
(%)
Pol % cane
TCH Degrees of resistance or susceptibility
Orange rust Brown rust Resistance to
both rusts
>=120 P1 T1 Different
codifications Different
codifications RR*
100-119 P2 T2 Different
codifications Different
codifications RR*
90-99 P3 T3 Different
codifications Different
codifications RR*
* RR is assigned to cultivars with resistance to both rusts
A study conducted in 2008 (unpublished) showed that using females with no incidence of orange rust increases the probabilities of having an orange rust resistant progeny (Table 3). This suggests that it is necessary both parents show resistance (or absence of symptoms) or at least the female must not to show the symptoms to orange rust. Table 3. Progeny response from parents with different percentages of incidence
of Orange rust
Crosses
Incidence Orange rust (%) *
Progeny with Orange rust
(%) ** Female Male
CP73-1547 x CP89-1288 0 0 0
CP73-1547 x B74418 0 0 0
CP73-1547 x L82-41 0 0 0
CP92-1401 x V71-51 0 8 0
CP72-2086 x L79-321 10 0 25
SP79-2233 x CP72-2086 15 10 42
CP72-2086 (control) 35 *Incidence rate (from 0% to 50%) in the leaf No. 7. **Percent of bunches with presence of Orange rust. Crossing techniques and procedures Location and season for crosses: Crossings take place in two crossing houses,
one located at the Sugarcane Field Station Camantulul and the second one
located at the Los Tarros sugarcane field station at La Union sugar mill. Average relative humidity and temperature is 83% and 27° C, at Camantulul
57
and 81% and 25º C at “Los Tarros”, respectively. These conditions are considered appropriate to maintain the pollen viability. The crossing season is defined by the natural flowering, which usually occurs in November and December. Monitoring of flowering and sex definition for parents The judgment of the natural flowering is performed every two days, with the purpose of assessing how many flowers are available for crossings. The sex of the parents is determined by magnifier-glass, classifying as male (♂) the parent that presents purplish to brownish plump anthers exuding pollen from both lobes; and as a female (♀) the one presenting shriveled, small, pale yellow colored and with scarce pollen. The sexuality of the parents is corroborated by examining the iodine stained pollen under the microscope (0 to 20% of tinged pollen is considered female and over 30% it is regarded as male). In special cases, where both parents are classified as males, and there is interest to make a cross between them, masculine sterility is induced using alcohol at a 70% of concentration, as described by Soeprijanto and Sukarso (1989). Stems Management: at the beginning of the anthesis, stems of selected parents, are cut at their base, they are also labeled and put in filled-water buckets; stems are carefully transported to the crossing house. Inside the crossing house, a new cut is made at the base of the stems and each stem is then placed in a one-liter capacity plastic or glass bottle. In order to extend stem life, and, consequently, flowers life; it is necessary that the bottles contain water as well two more solutions: a) sulfurous acid (H2SO3), and b) fixed acids (H2SO4, HNO3 and H3PO4). The H2SO3 Sulfurous acid is obtained by mixing of sulfur dioxide gas (SO3) and water. These solutions preserve stems and provides nutrients. During the crossing phase, both solutions are applied according to a weekly schedule as follows: Monday (sulfurous A. and fixed A.), Wednesday (sulfurous A.), and Friday (sulfurous A. and fixed A.). Another technique used to prolong the life of the flowers are marcotting, they are made in the bottom of the stems of 4-6 weeks before anthesis, then the stems with the marcotting are taken to the crossing house and placed in buckets with water or in combination with preservatives solutions. Management and crossing type: To perform crosses, the stems are placed in isolated conditions inside of the crossing house (cubicles or lanterns), the male parent flowers are placed above of the female flowers; in the morning, male stems are slightly shake in order to improve the release of pollen. Regarding the type of crossing, most of the crosses made in CENGICAÑA, have been bi-parental also called two-parent (a female cultivar for a male cultivar), and a
58
fewer number of crosses have been poly-crosses (a female cultivar by two or more males cultivars). In a minimal proportion, open-pollinated crosses have been obtained, which are females located in the collections which are pollinated by one or more males outdoors. For any type of crosses, the pollination period occurs approximately in the first 14 days, then comes the period of seed maturation (10-15 days). At the crossing house, sometimes males are removed after 14 days, since for those days they have already completed the pollinator function. Ripeness, harvesting and drying of the true seed: after completing pollination, female pollinated stems, enter into the sexual seed maturation phase. Approximately 20 days after the start of crossing, the female flowers are covered with white tulle bags (1 mm mesh), keeping stems inside the solution of the crosses. Female flowers can be harvested 25 to 30 days after the beginning of cross, cutting the peduncle of each panicle. Depending on the breeder’s criterion sometimes males are harvested, mainly when females and males are in an intermediate point of their sexual classification (e.g. between 20% and 30% of tinged pollen). For the drying process, panicles inside the tulle bags are placed at 35° C in a forced air chamber for 24 hours. The seed drying process is the result of a two consecutive year study that determined that such treatment does not affect the seed germination (unpublished). Cleaning and storage of the true seed: true fuzzy seed (fuzz) can be manually cleaned by rubbing it against a carpet or mechanically using a defuzz machine. Clean seed is identified and stored in plastic bags with a desiccant in a -12°C chamber. Finally, seed is germinated in a greenhouse and the resulting seedlings are transplanted to the field, two or three months after germination to start the selection program. Currently, more than 550 crosses are being established each year with an average production of 160,000 seedlings.
SELECTION PROGRAM The selection procedures vary among the different sugarcane breeding programs throughout the world. These selection procedures depend mainly on plant age, and the number of harvests or ratoons (Ming et al. 2006). In Guatemala, the sugarcane varieties commercially used, reach the harvest age around 12 months old with an average number of five harvests. The selection criteria applied in the Sugarcane Breeding and Selection Program of CENGICAÑA, regarding the above mentioned aspects, are addressed to the definition of the genetic prototype which is established jointly with the sugarcane growers. This prototype must be according to the harvest duration in Guatemala, which begins in November and ends in April. Due to this
59
situation, sugarcane growers ask for varieties whose natural ripening is according to this harvest period. Consequently, CENGICAÑA, develop two different groups of cultivars: “flowering” varieties and “non-flowering” varieties. The flowering varieties should have early ripening, whereas the “non-flowering” materials should ripe at the end of the harvesting period. Early stages of selection Selection Stage I. According to its genetic composition this is the largest stage. In this stage the genetic material is surveyed until a whole plant with several stems or stalks develops from each true seed. True seeds are the result of the crossing process. Therefore, these individuals are considered as genetically recombinants.
The recombinant individuals are the basis for the entire variability which is found in the selection stage I and they are selected throughout all the selection process. These individuals are acclimatized into a greenhouse and then planted in the definite field. The stage I, is carried out under the responsibility of the professional and
technical personnel at CENGICAÑA's Sugarcane Field Station Camantulul, with the aim of preserving this genetic variability in optimal field conditions. The main principle of stage I, is: “each single plant has the potential to become a superior variety with a high performance”. Stage I, is carried out during two growing cycles at the same trial: plantcane and first ratoon. Final selection is performed during the harvest of the first ratoon, where tillered plants are selected. During the first growing cycle, at the location where selection is carried out, the plants grown from true seeds do not express their entire performance potential. Due to the large number of individuals as a result of the different crossings, the observation levels in this Stage is limited to general aspects such as vigor in terms of number of stalks per plant, height and stalk diameter as well as overall good health. In Stage I names of all the selected individuals are assigned. These names include: the letters “CG” from CENGICAÑA Guatemala followed by the number of the crossing experiment and by a correlative number for each selection, according to the specific field book records. This name will identify the genetic material in the next selection stages until its eventual releasing. With the assigned name the corresponding genealogy is also established. In different breeding agreements, with other breeding programs, the names can vary; nevertheless in general, the structure is preserved.

60
In Stage I, the number of surveyed genetic materials is usually more than 160,000. Two groups are recognized during the selection: “flowering” and “non-flowering” genotypes, according to the flowering habit. The flowering habit is an indicative of the genotype’s chronological adaptation: those genotypes that have the flowering habit are adapted to the first harvest months, that is, from November to January. On the other hand, those materials with low flowering rate are fitted for latest harvest months, that is, March and April. In between, there are also some materials that fit for the harvest in January and February, as they have an intermediate flowering rate. No experimental design is applied in the Stage I trials. The CENGICAÑA's Sugarcane Breeding and Selection Program, with the objective of optimizing the selection process, has established, as a part of Stage I, two trials of “families evaluation”, where the offspring of each cross constitutes one family. The evaluation is done in a randomized complete block design with two replications. A sample of each cross (family) is planted in two rows of 10 meters long each. The family evaluation trials are settled out in two locations, one in the Medium Stratum (at 300 meters above the sea level) at the
Sugarcane Field Station Camantulul. Other trial is located in the Low/coastal
stratum (less than 10 meters above the sea level) at Sub Experimental Station located in “El Retazo” farm property of the “Magdalena” mill. These trials allow the identification of superior crosses (families), which will be the basis for the later clonally individual selection in the Stage I. Selection stage II. The selected tillered plants in Stage I provide the propagation plant material for the next trial in the clonally selection process: the selection Stage II. In this stage, each selected clone is planted in a row of five
meters long. The selection stage II, with much less genetic materials than the Stage I, can also be regarded though, as a big trial, which can comprises between 1,000 and 5,000 genotypes.
Around 25 percent of these materials correspond to genotypes predominantly “non flowering”, and the rest of them are predominantly “flowering” genotypes. In this stage, a more detailed characterization process
of the genetic materials is initiated, in order to perform a more accurate selection. However, given the size of the trials and the amount of genetic materials, the observations for selection are reduced to: plant general appearance, disease presence, and refractometry (Brix) (Quemé et al., 2010).

61
In this stage the disease description is made in a more detailed manner with special attention to the next diseases: Leaf Scald (Xanthomonas
albilineans); smut (Ustilago scitaminea H Syd & P. Syd); brown rust (Puccinia melanocephala); Orange rust (Puccinia kuehnii); Sugarcane yellow leaf virus (SCYLV); and the Sugarcane mosaic virus (SCMV) (Ovalle, 1997). Stage II is carried out at two representative altitudinal strata: Mid stratum at 300 meters above the sea level and low and coastal stratum, between 5 and 30 meters above the sea level. Guatemala’s low/coastal strata represents the major sugarcane growing area, with lower flowering rate and higher yield potential due to its good soil fertility (Pérez, 2002; Suárez et al., 2007). The medium stratum presents clayey shallow soils (Pérez, 2002; Suárez et al., 2007), with higher annual precipitation and lower solar irradiation, which correlates with higher flowering rates (Quemé et al., 2009; Orozco et al., 2010; Castro et al.,
2010), which also is related to lower yields.
Each trial in the stage II is organized in two kinds of experiments: flowering and non-flowering genotypes. The designation of flowering or
non-flowering is established at Stage I of selection. The flowering to non-flowering genotype ratio is usually 3:1 due to the naturally higher occurrence of the flowering genotype at the medium stratum where the Stage I is carried out. The inverse relation is found in the coastal stratum, where the non-flowering genotypes use to be more frequent. The trials in the Stage II cultivars are evaluated and selected only in its first growing cycle; no ratoons are surveyed. The trials are established in the two already depicted strata; therefore, there are four different trials.
The selection in two different strata offers better estimation to the adaptation of the different genotypes; consequently, it is expected to use more efficiently the potential for the different genotypes that are released in each stratum. En this selection stage no experimental design is used. The selection is made according to criteria settled jointly by the breeders and sugarcane growers.
62
Selection stage III: The genetic materials selected in the stage II, are used as plant propagation source to establish the selection stage III. The stage III is organized in two trials, one for each already depicted altitudinal stratum, with “flowering” and “non-flowering” experiments, for a total of four different trials. Each experiment is composed by two replications at each altitudinal
stratum. The experimental unit is constituted by five rows of five meters long each; where only one genotype is located. The composition of the trials in the stage III is differentially done for each altitudinal stratum. In Between of 100 and 150 genotypes are selected for each
stratum in each flowering and non-flowering trials. It has been observed that less than 10% of the selected genotypes in stage II are the same genotypes selected in both strata; the rest of materials (the most) are differential selections for each stratum; thus showing the high genotype × environment interaction levels. Superior genotypes are selected according to their best performance regarding cane yield in tons of cane per hectare (TCH); sugar concentration expressed as Pol%-cane, and sugar yield in tons of sugar per hectare (TSH). TCH is estimated based on the measurement of sugarcane yield components: a) population of milling stalks, b) stalk height, stalk diameter, and c) weight in
Kilograms from a sample of five stalks. TSH is estimated from the interaction of TCH and the sugar concentration (Pol% cane), this last variable is determined in the agronomic laboratory at CENGICAÑA. The disease evaluation is performed and those genetic materials that do not meet the selection standards are discarded. The sugarcane diseases surveyed are mainly the same that are evaluated in the stage II. Additionally, other diseases of relative importance are assessed; among them are: Pokkah boeng (Fusarium moniliforme Sheldon), purple spot (Dimeriella sacchari), and others (Ovalle, 1997). The trials belonging to Stage III are evaluated during two growing seasons: plantcane and first ratoon. The information of plantcane is used to perform the first selection. The information in the first ratoon of the previous CG series is used to make the second selection. With these two groups of selections, the “Stage III increase” is established; therefore, genotypes from two different
63
series are part of the “Stage III increase”. The selected experimental units in the Stage III are used as propagation plant material to make the “Stage III increase”. Usually 30 to 50 genotypes comprise the “Stage III increase”. This increase plots provides enough propagation plant material to settle the Stage IV, also called “Field Regional Trials”. The final selection to assemble the Stage IV is achieved when the information from both growing seasons of the Stage III and the information from “Stage III increase” are combined. Late stages of selection and validation Late selection stage and validation stage (Stages IV and V, respectively) are initiated immediately after the early Stages (I, II and III) are completed. Thus, the objective of late selection stages and validation is to assess the superior fraction of stage III under the different environmental and soil conditions of the sugarcane growing area of Guatemala. The ultimate goal is to identify those cultivars that perform better than the local standard varieties; this is achieved by two stages known as Field Regional Trials or stage IV and Semi-commercial Trials or stage V. Field Regional Trials (FRT): This FRT or stage IV are the first extended field evaluation, in which grouped varieties in uniform experimental trials are exposed to a wide diversity of environments in terms of rainfall patterns, temperature, radiation, soils, and crop management. These trials are jointly conducted by CENGICAÑA's breeders and mills staff responsible for sugarcane variety research and development. RFT are made up of varieties that performed better than the standard varieties CP72-2086 and CP88-1165 in terms of sugar yield, disease resistance and agronomic characteristics in the Stage III in plantcane and in first ratoon for each particular experimental Station (Figure 2). According to this approach the RFT for high and mid strata are made up from varieties selected in stage III located in the mid stratum experimental station, while the varieties for RFT in low and coastal strata are the ones selected in the low experimental station (Figure 2). On the average, each FRT is made up of 20-30 varieties distributed in a randomized complete block experimental design with four replications, where each experimental unit is composed by five 1.5 m apart and 10 m long rows. The seedcane used to establish different FRT is produced in the Stage III increase, which is located at two locations: the mid experiment station at El Bálsamo farm belonging to Pantaleón mill and the Coastal experiment station at El Retazo farm belonging to Magdalena mill. Stage III increase as well as Stage IV, are controlled by breeders and mill researchers in charge of the stations.

64
The seedcane from “Stage III increase” is distributed to the mills, being the mechanism for new varieties delivery to the growers officially recognized by the CENGICAÑA's sugarcane breeding and selection program. RFT are established according to the maturity pattern of the varieties and also based in the conditions of the four different altitudinal strata already defined. There is a specific group of early or flowering varieties for testing in the high and mid strata and a second group of varieties for the low and coastal strata. The same approach is applied for late maturity or non-flowering varieties thus resulting in four different RFT. Each of the four RFT´s is tested at different locations in every altitudinal stratum, with the objective of identifying those cultivars that perform well at a specific location (specific adaptability) or in the contrary, with good adaptation to several locations (general adaptability).
Figure 2. Selection Program for four altitudinal strata in the sugarcane growing
area of Guatemala. CENGICAÑA 2011 RFT's are carried out during three crop cycles: plantcane, first ratoon and second ratoon. In this stage, some criteria for selection are: emergency in plantcane, canopy density at 90-120 days after planting and disease resistance. At the plant maturity phase, evaluations include the phenotypic value, which is an index that involves: stalk population, stalk height, stalk diameter and quality of stalks. Flowering and pith incidence are evaluated a week before harvest. At
Mid Zone Experiment Station Camantulul Farm CENGICAÑA
Mid Stratum Experiment Station El Balsamo Farm Pantaleon Mill
Coastal Stratum Experiment Station El Retazo Farm Magdalena Mill
High stratum Farms
Mid stratum Farms
Low stratum Farms
Coastal stratum Farms
Stage I Stage II and Stage III
Field Regional Trials – FRT Semicommercial Trials - SCT
Mid Strata Experiment Station Camantulul Farm CENGICAÑA
65
the harvest moment other variable are measured: cane yield, sugar yield, and the sucrose content is estimated. Right after harvest, re-growth is evaluated. Yielding data obtained from the field trials are analysed according to each location and through locations to determine the general or specific cultivar adaptability. This value is specific for each altitudinal stratum or for a group of altitudinal strata. Evaluation data is presented and discussed with the Variety Release Committee (VRC) to determine which varieties will be selected for the next Stage of Selection: Stage V. The VRC has a representative of each mill who is in charge for the variety development. FRT or Stage IV has recently been modified to improve its performance Orozco, et al., 2007). The improvements are: a) increase the number of varieties tested per field trial, b) evaluation of flowering and non-flowering clones, separately, and c) utilization of sites regression (SREG) as a statistical tool to determine clone adaptability (Quemé et al., 2006). Semi-commercial trials (SCT) or stage V of selection: The SCT is the validation phase of all the previous selection stages and is carried out under the commercial management of the growers. The SCT allow making selections for commercial use. The first SCT was established in the harvest season 2003-2004 and its main features as a field trial are: the randomized complete block design and the large experimental unit size with four replications.
The varieties in the SCT are those selected from FRT. The selection in FRT is based on statistical analyses for each particular maturity and altitudinal groups (Figure 2). The SCT are managed at field by the VRC staff with the CENGICAÑA´s breeders support. The SCT on the average, are made up of three to five promising varieties plus the standard varieties CP72-2086 and CP88-1165. The seedcane required for the SCT's is produced by the corresponding “Stage FRT increase” (in a similar approach to the “Stage III increase”) which is managed by the members of the Variety Release Committee and located at their own farms and guided and supported by the CENGICAÑA’s breeding program.
The seedcane for SCT is produced at the same time the FRT is in first and second ratoon. The amount of seedcane that needs to be available should
be enough to plant the projected SCT. A key factor for the production of high quality cane seed for SCT is to set the date in which the SCT will be planted.

66
The information collected from a SCT is similar to the one obtained from the RFT with two differences: a) the sugar yield data is obtained from the cane yield of a whole plot or experimental unit (i.e. approximately one hectare); b) data from SCT is analysed jointly by breeders and the Variety Release
Committee for the decision making process. Thus, based on SCT data, it is possible to determine which varieties can be released for commercial use. Another important aspect of SCT is the measurement of fibre in tonnes per
hectare per each clone, which is based on cane yield and fibre percentage. Released Varieties CENGICAÑA'S Sugarcane Breeding and Selection program released the first sugarcane varieties in 2006 (Orozco et al., 2006): PR75-2002 and CG96-59. The selection criteria at that time were: a) higher sugar yield than the standard variety CP72-2086 observed in the SCT (plantcane, first and second ratoon), b) resistance to major diseases and c) adequate agronomic characteristics for commercial management. Currently, the variety PR75-2002 is being used at the four altitudinal strata in a total of 3,147 hectares, as a late maturation variety. Using the same criteria, the second group of released SCT varieties were CG96-01, CG96-78, CG96-135, CG97-97, and CG97-100 (Orozco et al., 2008); all of them of late maturation, except the CG96-01 variety. CG96-135 is currently being grown in 2,627 hectares in the four altitudinal strata. The varieties released in 2011 were evaluated in the third SCT in both maturation patterns (early and late) in plantcane, first and second ratoon. From the early ones group CG98-46, PR87-2015, and LM2002 were released; whereas from the late varieties group CG98-10, RB73-2577, SP71-6180, and SP79-1287 were released. From these released varieties, CG98-10 is the one that is mostly commercially cultivated, with 2,302 hectares in the four altitudinal strata of production. PGM89-968, CP88-1508, NA56-42, and Mex69-290 varieties were not released in a formal process by the CENGICAÑA’s breeding and selection program; however they are commercially used with 4,054, 1,826, and 1,072 hectares, respectively (Orozco y Buc, 2010). Genotype-environment interaction Multiple-environment yield trials (MET) are a series of experiments in which a set of genotypes (G) are evaluated in multiple environments (E),
67
considering these environments as a combination of sites and years. These trials are important because the presence of genotype x environment interaction (GE) complicates the selection and/or recommendation of cultivars, otherwise if the GE interaction did not exist, a single environment would be enough for the cultivars evaluation. Thus, the understanding of the GE interaction observed in MET is very useful in breeding programs, since it allows the identification of high-yielding cultivars with broad or specific adaptation (Annicchiarico, 1997; Gauch, 1992; Smith et al., 2001; Queme et al., 2010; Yan and Hunt, 2002). The GE interaction special interest for breeding programs is the one that creates a change in ranking of the cultivars from one environment to another
(crossover-interaction), so that, the best cultivar in one particular environment might not be the best in another environment (Kang, 2002;
Crossa and Cornelius, 2002). Several statistical methodologies have been developed for the analysis of GE interaction, being one of them GGE Bi-plot. Breeders and agronomists have recently used this methodology for the analysis of data from multi-environment yield trials (Quemé et al., 2010). GGE bi-plot analysis: The GGE represents the main effect of genotype plus the genotype by environment interaction (G+GE). The G and GE interaction are two sources of variation of the sites regression model (SREG). GGE bi-plot coming from the SREG model is based on principal components analysis (PCA), and a graph formed with the scores of the genotypes and the environments of the first principal component (PC1 scores) against their respective scores for the second principal component (PC2 scores). GGE Bi-plot displays the two sources of variation G and GE, and provides an adequate graphical tool for cultivar evaluation (yield and stability), mega-environment analysis (“which-won-where”), test-environment evaluation (discriminating among genotypes and the representativeness of the mega-environments), and others (Burgueño et al., 2009; Crossa et al., 2002; Ding et al., 2009; Quemé et al., 2010; Yan et al., 2007). The GGE bi-plot from the SREG model can be constructed according to the manual and SAS program available at the web page of CIMMYT in Biometrics and Statistic Unit (BSU) or at http://www.cimmyt.org/english/wps/biometrics/ (Burgueño et al., 2009). CENGICAÑA's Sugarcane Breeding and Selection Program has used this analysis to evaluate the performance of cane in sugarcane cultivars, through sites and crops cycles, in order to identify cultivars of high performance with wide and specific adaptation. For example, the study reported by Quemé et al. (2010) included 14 sugarcane cultivars evaluated in nine different environments at Guatemala's sugarcane production area. The nine environments refer to sites
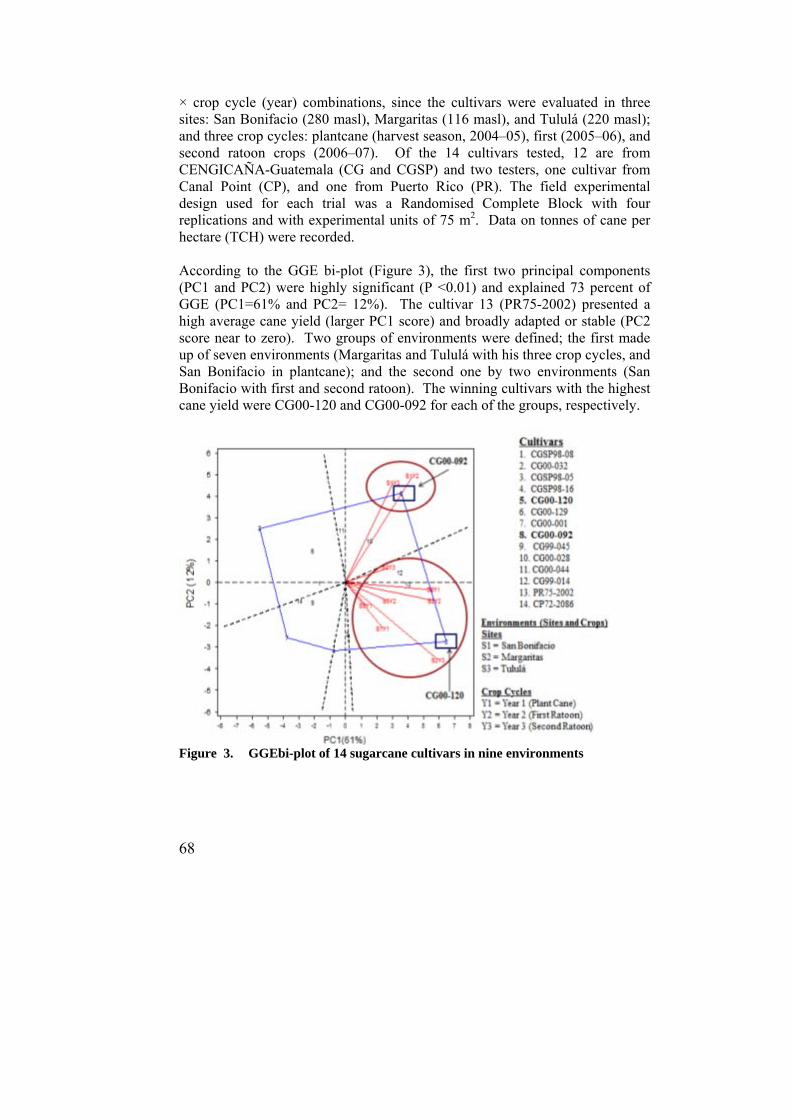
68
× crop cycle (year) combinations, since the cultivars were evaluated in three sites: San Bonifacio (280 masl), Margaritas (116 masl), and Tululá (220 masl); and three crop cycles: plantcane (harvest season, 2004–05), first (2005–06), and second ratoon crops (2006–07). Of the 14 cultivars tested, 12 are from CENGICAÑA-Guatemala (CG and CGSP) and two testers, one cultivar from Canal Point (CP), and one from Puerto Rico (PR). The field experimental design used for each trial was a Randomised Complete Block with four replications and with experimental units of 75 m2. Data on tonnes of cane per hectare (TCH) were recorded. According to the GGE bi-plot (Figure 3), the first two principal components (PC1 and PC2) were highly significant (P <0.01) and explained 73 percent of GGE (PC1=61% and PC2= 12%). The cultivar 13 (PR75-2002) presented a high average cane yield (larger PC1 score) and broadly adapted or stable (PC2 score near to zero). Two groups of environments were defined; the first made up of seven environments (Margaritas and Tululá with his three crop cycles, and San Bonifacio in plantcane); and the second one by two environments (San Bonifacio with first and second ratoon). The winning cultivars with the highest cane yield were CG00-120 and CG00-092 for each of the groups, respectively.
Figure 3. GGEbi-plot of 14 sugarcane cultivars in nine environments
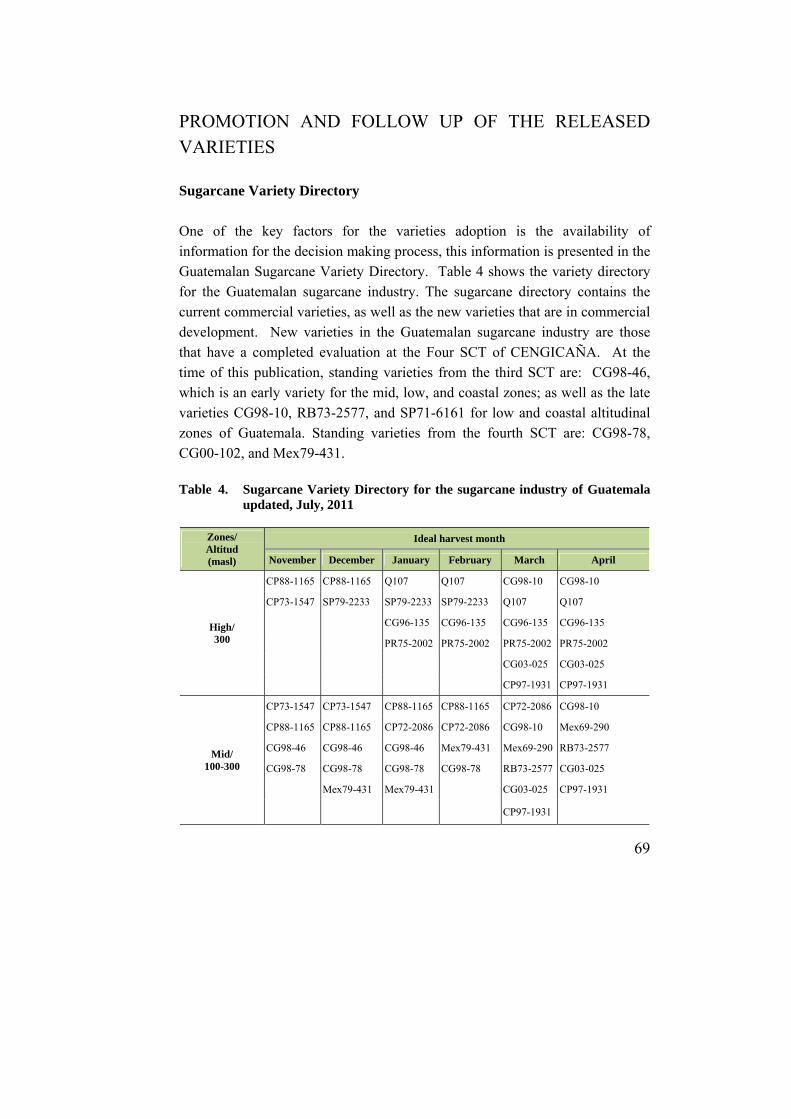
69
PROMOTION AND FOLLOW UP OF THE RELEASED VARIETIES Sugarcane Variety Directory One of the key factors for the varieties adoption is the availability of information for the decision making process, this information is presented in the Guatemalan Sugarcane Variety Directory. Table 4 shows the variety directory for the Guatemalan sugarcane industry. The sugarcane directory contains the current commercial varieties, as well as the new varieties that are in commercial development. New varieties in the Guatemalan sugarcane industry are those that have a completed evaluation at the Four SCT of CENGICAÑA. At the time of this publication, standing varieties from the third SCT are: CG98-46, which is an early variety for the mid, low, and coastal zones; as well as the late varieties CG98-10, RB73-2577, and SP71-6161 for low and coastal altitudinal zones of Guatemala. Standing varieties from the fourth SCT are: CG98-78, CG00-102, and Mex79-431. Table 4. Sugarcane Variety Directory for the sugarcane industry of Guatemala
updated, July, 2011
Zones/ Altitud (masl)
Ideal harvest month
November December January February March April
High/ 300
CP88-1165 CP88-1165 Q107 Q107 CG98-10 CG98-10
CP73-1547 SP79-2233 SP79-2233 SP79-2233 Q107 Q107
CG96-135 CG96-135 CG96-135 CG96-135
PR75-2002 PR75-2002 PR75-2002 PR75-2002
CG03-025 CG03-025
CP97-1931 CP97-1931
Mid/ 100-300
CP73-1547 CP73-1547 CP88-1165 CP88-1165 CP72-2086 CG98-10
CP88-1165 CP88-1165 CP72-2086 CP72-2086 CG98-10 Mex69-290
CG98-46 CG98-46 CG98-46 Mex79-431 Mex69-290 RB73-2577
CG98-78 CG98-78 CG98-78 CG98-78 RB73-2577 CG03-025
Mex79-431 Mex79-431 CG03-025 CP97-1931
CP97-1931
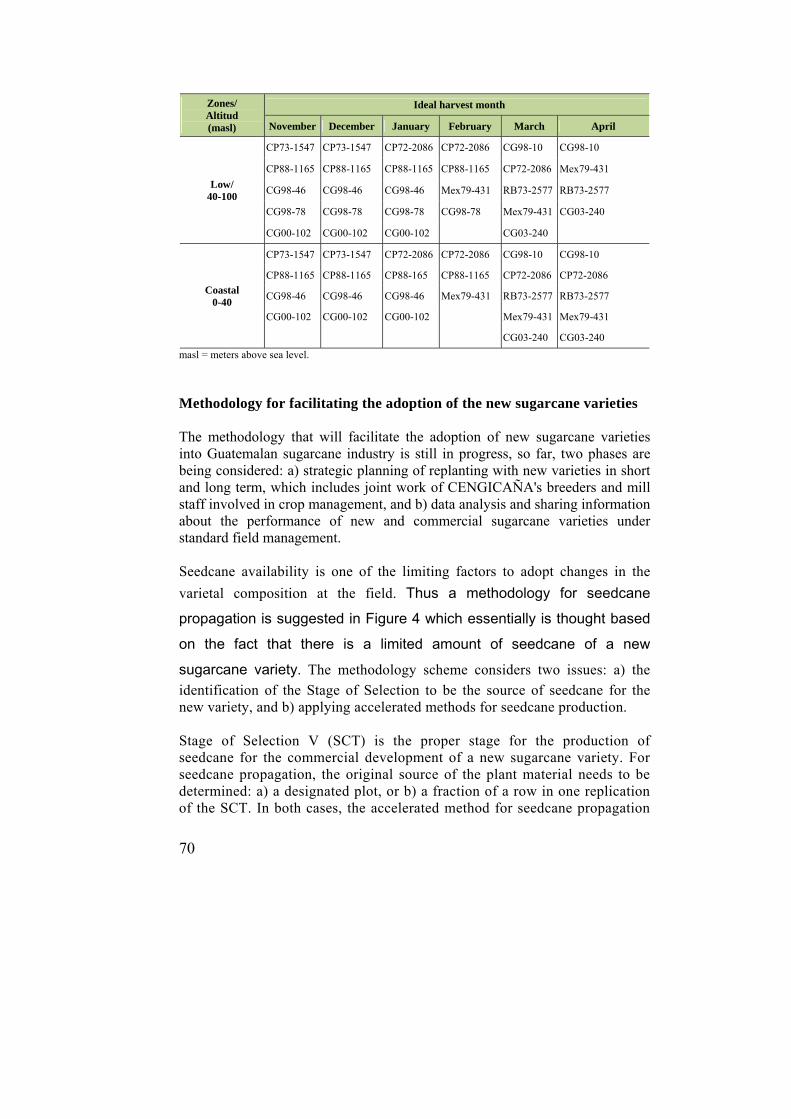
70
Zones/ Altitud (masl)
Ideal harvest month
November December January February March April
Low/ 40-100
CP73-1547 CP73-1547 CP72-2086 CP72-2086 CG98-10 CG98-10
CP88-1165 CP88-1165 CP88-1165 CP88-1165 CP72-2086 Mex79-431
CG98-46 CG98-46 CG98-46 Mex79-431 RB73-2577 RB73-2577
CG98-78 CG98-78 CG98-78 CG98-78 Mex79-431 CG03-240
CG00-102 CG00-102 CG00-102 CG03-240
Coastal 0-40
CP73-1547 CP73-1547 CP72-2086 CP72-2086 CG98-10 CG98-10
CP88-1165 CP88-1165 CP88-165 CP88-1165 CP72-2086 CP72-2086
CG98-46 CG98-46 CG98-46 Mex79-431 RB73-2577 RB73-2577
CG00-102 CG00-102 CG00-102 Mex79-431 Mex79-431
CG03-240 CG03-240
masl = meters above sea level.
Methodology for facilitating the adoption of the new sugarcane varieties The methodology that will facilitate the adoption of new sugarcane varieties into Guatemalan sugarcane industry is still in progress, so far, two phases are being considered: a) strategic planning of replanting with new varieties in short and long term, which includes joint work of CENGICAÑA's breeders and mill staff involved in crop management, and b) data analysis and sharing information about the performance of new and commercial sugarcane varieties under standard field management. Seedcane availability is one of the limiting factors to adopt changes in the
varietal composition at the field. Thus a methodology for seedcane propagation is suggested in Figure 4 which essentially is thought based on the fact that there is a limited amount of seedcane of a new sugarcane variety. The methodology scheme considers two issues: a) the
identification of the Stage of Selection to be the source of seedcane for the new variety, and b) applying accelerated methods for seedcane production. Stage of Selection V (SCT) is the proper stage for the production of seedcane for the commercial development of a new sugarcane variety. For seedcane propagation, the original source of the plant material needs to be determined: a) a designated plot, or b) a fraction of a row in one replication of the SCT. In both cases, the accelerated method for seedcane propagation
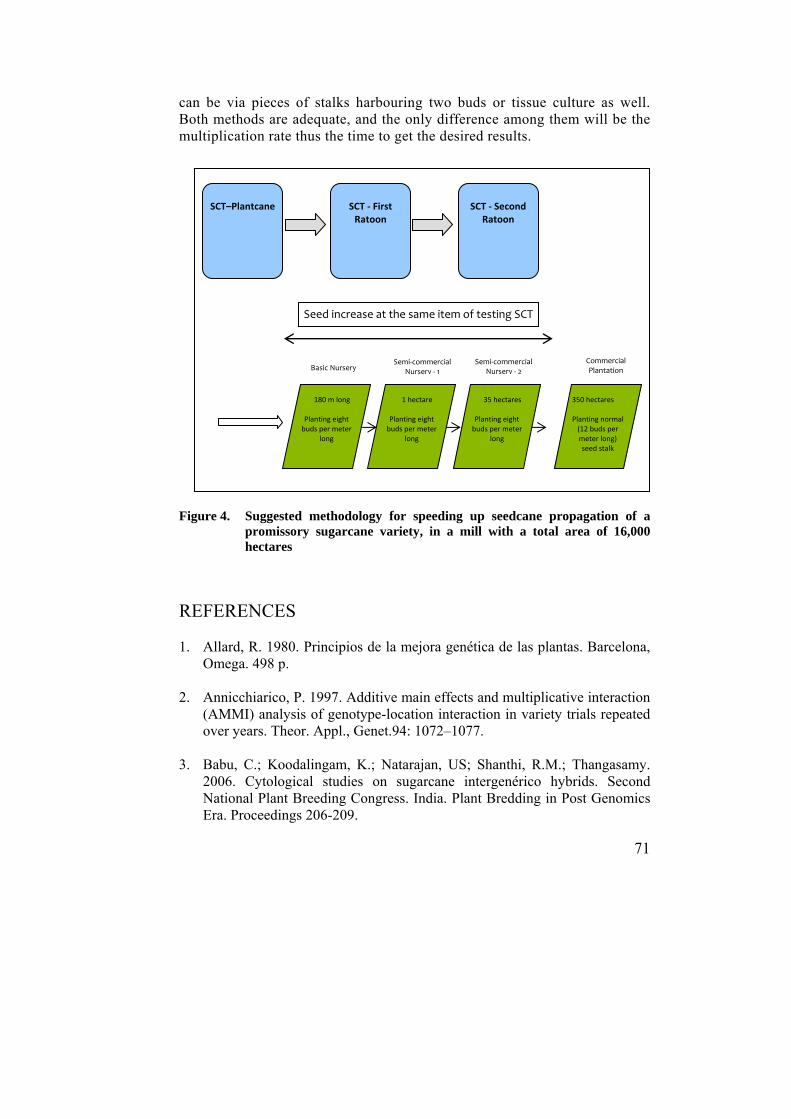
71
can be via pieces of stalks harbouring two buds or tissue culture as well. Both methods are adequate, and the only difference among them will be the multiplication rate thus the time to get the desired results. Figure 4. Suggested methodology for speeding up seedcane propagation of a
promissory sugarcane variety, in a mill with a total area of 16,000 hectares
REFERENCES 1. Allard, R. 1980. Principios de la mejora genética de las plantas. Barcelona,
Omega. 498 p. 2. Annicchiarico, P. 1997. Additive main effects and multiplicative interaction
(AMMI) analysis of genotype-location interaction in variety trials repeated over years. Theor. Appl., Genet.94: 1072–1077.
3. Babu, C.; Koodalingam, K.; Natarajan, US; Shanthi, R.M.; Thangasamy.
2006. Cytological studies on sugarcane intergenérico hybrids. Second National Plant Breeding Congress. India. Plant Bredding in Post Genomics Era. Proceedings 206-209.
180 m long Planting eight buds per meter
long
SCT–Plantcane SCT ‐ First Ratoon
SCT ‐ Second Ratoon
1 hectare
Planting eight buds per meter
long
35 hectares Planting eight buds per meter
long
350 hectares Planting normal (12 buds per meter long) seed stalk
Seed increase at the same item of testing SCT
Basic Nursery Semi‐commercial
Nursery ‐ 1 Semi‐commercial
Nursery ‐ 2
Commercial Plantation
72
4. BSES. 2007. Importing smut resistant varieties. Australia 10-11 p.
5. Burgueño, J.; Crossa, J.; Vargas, M. SAS programs for graphing ge and gge bi-plots. Biometrics and Statistics Unit. CIMMYT. México. 16 Mar. 2009. http://www.cimmyt.org/english/wps/biometrics/
6. Butterfield, M.K.; D´Hont, A. 2001. The sugarcane genome: A synthesis
of current understanding, and lessons for breeding and biotechnology. Proc S Afr Sug Technol Ass 75: 1-5.
7. Castro, O. 2010. La variabilidad de la radiación solar en la superficie
terrestre y sus efectos en la producción de caña de azúcar en Guatemala. In: Memoria. Presentación de Resultados de investigación. Zafra 2009-2010. Guatemala, CENGICAÑA. pp. 281-287.
8. CENGICAÑA. 1999. Área de Fitomejoramiento. Resultados 1998-
1999. In: Memoria. Presentación de resultados de investigación. Zafra 1998-1999. Guatemala, CENGICAÑA. pp. 6-26.
9. CENICAÑA. 2004. Política de manejo de las variedades obtenidas por
CENICAÑA. Carta Trimestral (Cali Colombia) 26(4):28-31. 10. Cox M.; Hogarth, M.; Smith, G. 2000. Cane breeding and improvement.
In Hogarth, D. M. and Allsop, P. G. ed. Manual of Canegrowing, Brisbane, 91-108.
11. Crossa, J.; Cornelius, P.L. 2002. Linear-bilinear model for the analysis
of genotype environment interaction. In: Kang, M.S. ed. Quantitative Genetics, Genomics and Plant Breeding. CABI Publishing. pp. 305–321.
12. Crossa, J.; Cornelius, P.L.; Yan, W. 2002. Bi-plot of linear-bilinear
models for studying crossover genotype x environment interaction. Crop Sci., 42: 619–633.
13. D’Hont A.; Ison, D.; Alix, K. ; Roux, C. ; Glaszmann, J.C. 1998.
Determination of basic chromosome numbers in the genus Saccharum by physical mapping of ribosomal RNA genes. Genome, 41: 221-225.
14. Da Silva, J.; Sorrells, M.; Burnquist, W.; Tanksley, D.; 1993. RFLP
linkeage map and genome analysis of Saccharum spontaneum. Genome. 36: 782-791.

73
15. Ding, M.; Tier, B.; Yan, W. Application of GGE bi-plot analysis to evaluate Genotype (G), Environment (E) and GxE interaction on P. radiata: a case study. 05 Jul. 2009. http://www.cdesign.com.au/proceedings_afgc2007/papers%20(pdf)/thurs%20ding.pdf
16. Edmé, S.; Cmostock, J.C.; Millar, J.D.; Tai, P.Y. 2005. Determination of
DNA content and genome size in sugarcane. Journal American Society Sugar Cane Technologists 25:1-16.
17. Gauch, H.G. 1992. Statistical Analysis of Regional Yield Trials: AMMI
Analysis of Factorial Designs. Amsterdam, Elsevier. 18. Grivet, L.; D’Hont, A.; Dufour, P.; Hamon, P.; Roques, D. ; Glaszmann,
J.C. 1994. Comparative genome mapping of sugar cane with other species within the Andropogonae tribe. Heredity 73: 500-508.
19. Grivet, L.; Daniels, C.; Glaszmann J.C.; D’Hont, A. 2004. review of recent
molecular genetics evidence for sugarcane evolution and domestication. Ethnobotany Research & Applications 2: 9-17.
20. INICA. 2003. Programa de fitomejoramiento. Impacto en la producción
azucarera cubana. Editores: H.J. Suárez, J. Gómez y S. Segrera. Cuba. 21. Kang, M.S. 2002. Genotype-environment interaction: progress and
prospects. In: Kang, M.S. ed. Quantitative Genetics, Genomics and Plant Breeding. CABI Publishing, 221–243.
22. Le Cunff, L.; Garsmeur, O.; Raboin, L.M.; Pauquet, J.; Telismar, H.;
Aselvi, A.; Grivet, L.; Philippe R.; Begum, D.; Deu, M.; Costst, L.; Wing, R.; Glaszmann, J.C.; D’Hont, A. 2008. Diploid/Poliploid sintenic shuttle mapping and haplotype-specific chromosome walking toward a rust resistance Gene (Bru 1) in highly polyploidy sugarcane (2n~ 12x ~115). Genetics 180: 649-660.
23. León, F.; Rodriguez, J.; Azurdia, C.; Amador, D.; Quemé, J.; Melgar, M.
2001. Use RAPD markers to detect genetic variability among 39 sugarcane varieties. Proc. Int. Sugar Cane Technol. 24:634-636.
24. Márquez, S. F. 1988. Genotecnia Vegetal. AGT Editor, S. A. México D. F. 25. Mauritius Sugar Industry Research Institute MSIRI. 2006. Sugarcane
Breeding and Physiology. ANNUAL REPORT 2006. Mauricio 2006. Pag. 7.
74
26. Miller, J. D. 1994. The philosophy of the Canal Point breeding program: Major issues in the establishment of new breeding programs. Sugar Journal 5(57) 13-15.
27. Ming, R.; Moore, P.; H., Wu, K. K.; D’Hont, A.; Glaszmann, J. C.; Tew, T.
L.; Mirkov, T. E.; da Silva, J.; Jifon, J.; Rai, M.; Schnell, R. J.; Brumbley, S. M.; Lakshmanan, P.; Comstock, J. C.; Paterson, A. H. 2006. Sugarcane improvement through breeding and biotechnology. Plant Breeding Reviews 27:15-118.
28. Orozco, H. 2005. How is the sugarcane variety development program facing
its challenge. En: XXV International Society of Sugarcane Technologists Congress. Pre-Congress Tour Papers. Guatemala, CENGICAÑA. 12 p.
29. Orozco, H.; Quemé, J.; Ovalle, W.; Castro, O.; Catalán, M.; Linares, E. 2006.
Primera Prueba semicomercial de variedades promisorias de caña de azúcar tres cortes. In Memoria. Presentación resultados de investigación. Zafra 2005-2006. Guatemala, CENGICAÑA. pp. 8-25.
30. Orozco, H.; Ovalle, W.; Juárez, J. 2004. Germoplasma de caña de azúcar
introducido al programa de variedades de CENGICAÑA de 1992 al año 2004. Guatemala, CENGICAÑA. 48 p.
31. Orozco, H.; Buc, R. 2010. Censo de variedades de caña de azúcar en Guatemala zafra 2010-11. In Memoria. Presentación de resultados de investigación. Zafra 2009-10. Guatemala, CENGICAÑA. pp. 21-30.
32. Orozco, H.; Quemé, J.; Ovalle, W.; Maldonado, A. 2007. Mejoras en el
programa de variedades de CENGICAÑA. In Memoria. Presentación de resultados de investigación. Zafra 2006-07. Guatemala, CENGICAÑA. pp. 55-62.
33. Orozco, H., Quemé, J.; Ovalle, W.; Maldonado A.; De Cano, W. 2008.
Reporte de Progreso del programa de variedades de CENGICAÑA. Guatemala, CENGICAÑA. 46p.
34. Orozco, H.; Quemé, J.; Ovalle, W.; Castro, O.; Catalán, M.; De Cano, W. 2008.
Segunda Prueba semicomerciales de variedades promisorias de caña de azúcar en plantía, primera y segunda soca. In: Memoria. Presentación de resultados de investigación. Zafra 2007-2008. Guatemala, CENGICAÑA. pp. 18-28.
75
35. Orozco, H; Castro O.; Buc R.; Quemé J.; Castro, O.; Ralda, G.; López A.; Acán J.; Solares, E.; Balañá P.; Natareno, E.; Rosales, R.; Rosales, E. 2010. Comportamiento de la floración de la caña de azúcar (Saccharum spp.) y su efecto en la productividad de azúcar en la zona media de Guatemala. In: Memoria. Presentación de resultados de investigación. Zafra 2009-2010. Guatemala, CENGICAÑA. pp. 66-76.
36. Ovalle, W. 1997. Manual de identificación de enfermedades de la caña de
azúcar. Guatemala, CENGICAÑA. 83 p. 37. Pérez, O. 2002. Grupos de manejo de suelos de la zona cañera de Guatemala.
En: Informe anual 2001-2002. Guatemala, CENGICAÑA. pp. 37-39. 38. Piperidis, N.; Chen, J.; Deng, H.; Wang, L.; Jackson P.; Piperidis, G. 2099.
GISH characterization of Erianthus arundinaceus chromosomes in three generations of sugarcane in intergenérico hybrids. Genome 53:331-336.
39. Purseglove, J. 1972. Sugarcane. In Tropical Crops Monocotyledons.
Longman Group. P 214-256. 40. Quemé, J.; Orozco, H.; Ovalle, W.; Linares, E. 2001. Planificación de
cruzamientos y producción de semilla sexual en la zafra 2000-2001. In: Memoria. Presentación de resultados de investigación. Zafra 2000-2001. Guatemala, CENGICAÑA. pp. 21-28.
41. Quemé, J.; Molina, L.; Melgar, M. 2005 Analysis of genetic similarity among 48 sugarcane varieties using microsatellite DNA sequences. Proc. Int. Soc. Sugar Cane Technol. 25:592-596.
42. Quemé, J.; Orozco, H.; Melgar, M. 2006. Análisis gráfico de la respuesta de
variedades de caña de azúcar (Saccharum spp) a través de ambientes. In Memoria. Presentación de resultados de investigación. Zafra 2005-2006. Guatemala, CENGICAÑA. pp. 91-94.
43. Quemé, J.; Orozco, H.; Ovalle, W.; Catalán, M. 2010. Selección de
variedades de caña de azúcar CG 08 en el Estado II de selección. In: Memoria. Presentación de resultados de investigación. Zafra 2009-2010. Guatemala, CENGICAÑA. pp. 92-100.
44. Satpute, S.; Suprassana, Patade, V.; Kulkarni, U.; Vapat, V. 2009.
Molecular diversity in sugarcane (Saccharum officinarum L.) clones as revealed by different molecular marker. SABRAO Journal of Breeding and Genetics 41(1):41-52.

76
45. Singh, R. K.; Mizar, S. K.; Singh, S. P.; Mishra, N.; Sharma. M. L. 2010. Evaluation of mircrosatellite markers for genetic diversity analysis among sugarcane species and commercial hybrids. Australian Journal of Crop Science. 4(2):116-125.
46. Smith, A.; Cullis, B.; Thompson, R. 2001. Analyzing variety by
environment data using multiplicative mixed models and adjustments for spatial field trend. Biometrics 57, 1138-1147.
47. Soeprijanto; Sukarso, G. 1989. Emasculation of sugarcane (Saccharum spp)
tassels using alcohol inmersión. Proc. Int. Soc. Sugar Cane Technol. 860-864. 48. Soto, G.; Orozco, H. 1998. Resultados sobre el desarrollo de variedades
apropiadas para la Agroindustria Azucarera Guatemalteca. Noviembre de 1997 a julio de 1998. In: Memoria. Presentación de resultados de investigación. Zafra 1997-98. Guatemala, CENGICAÑA. pp. 8-12.
49. South African Sugar Association, (SF). Experiment Station. Plant Breeding
Crossing & Selection Programmes. South Africa. 12 p. 50. Sreenivasan, T.V.; Ahloowalia, B.S.; Heinz, D. 1987. Cytogenetics. In
Sugarcane improvement through breeding. Ed. Heinz. Elsevier Science. p 211-253.
51. Suárez, A., Meneses, A., Melgar, M. 2007. Evolución de la producción y
productividad de la agroindustria azucarera y mapas generales de la zona cañera de la costa sur de la república de Guatemala. Guatemala, CENGICAÑA. 20 p.
52. Viveros, C.; Cassalett, C.; Amaya, A.; Victoria, J. 2009. A tool for
Programming crosses for sugarcane improvement in CENICAÑA. ISSCT 9th. Sugarcane Breeding and Germplasm Workshop.
53. Yan, W.; Hunt, L.A. 2002. Bi-plot analysis of multi-environment trial data.
En: Kang. M.S. ed. Quantitative Genetics, Genomics and Plant Breeding. CABI Publishing, 289–303.
54. Yan, W.; Cornelius, P. L.; Crossa, J.; Hunt, L. A. 2001. Two types of GGE
bi-plots for analyzing multi-environment trial data. Crop Sci., 41: 656–663 55. Yan, W.; Kang, M. S.; Ma, B.; Woods, S.; Cornelius, P. L. 2007. GGE bi-plot
vs. AMMI analysis of genotype-by-environment data. Crop Sci., 47: 643–655.
77
IV. BIOTECHNOLOGY APPLIED TO SUGARCANE CROP
78
BIOTECHNOLOGY APPLIED TO SUGARCANE CROP
Luis Molina and Mario Melgar*
INTRODUCTION There are many definitions of biotechnology but, according to the Convention for Biological Diversity, it is “Any technological application that uses biological systems and live organisms or its derivatives to create or modify products or processes for specific uses” (ONU,1992). According to this definition, alcoholic fermentation is a biotechnology, since it uses the microscopic fungus Saccharomyces cerevisiae for the elaboration of the product: wine, beer or bread. Also lactic fermentation which uses bacteria of the gender Lactobacillus, for the production of yogurt and the acetic fermentation produced by bacteria of the gender Acetobacter in the production of vinegar, the biological pest control with Metarhizium anisopliae, Cotesia flavipes, or Beauveria bassiana, the use of microorganisms to accelerate the decomposition of residues. Therefore, bioremediation, meat fermentations and other specific fermentations are also considered as biotechnologies. Although, alcoholic fermentation and biological pest control are biotechnologies used by Guatemala’s sugarcane Agro-industry, these are described and analyzed in different chapters of this book. In this section we will treat only those technologies included in the denominated modern biotechnology, and which fall into 3 groups:
Tissue or cell culture Molecular markers Genetic engineering
Modern biotechnology has applications in diverse sectors of the production of goods and services like medicine, industry, environment, energy and agriculture, among others. This chapter will focus on the applications in agriculture; and more specifically in the cultivation of sugarcane, first, reviewing the historical background and worldwide development, and then, describing applications that are performed in Guatemala. * Luis Molina is Agr. Eng, M.Sc., Biotecnologist, andy Mario Melgar is Agr. Eng, Ph.D., General Director of CENGICAÑA. www.cengicana.org
79
BACKGROUND OF BIOTECHNOLOGICAL DEVELOPMENT IN SUGARCANE Tissue or cell culture The vision, the purpose establishment, and the potential of the isolated cell and tissue culture, were attributed to the German botanist Gottlieb Haberlandt in the year 1902; however, he failed to demonstrate his ideas with his experiments (Krikorian and Berquam, 1969). The basis of the technique resides on the concept of cellular totipotency, that is, the cell capacity to divide and form a complete plant. Philip Rodney White, in the Unided States, Roger Gautheret and Pierre Nobecourt, in France, during the 1930s decade, were the first ones to achieve the growth of plant tissue culture, for indefinite periods of time, (Vasil, 2008). The continuous growth and the division of cells, which do not differentiate in any specific organ or tissue, form cellular mass called, callus. Heinz and Mee (1969) were the first to regenerate plants from callus in sugarcane. The callus was induced in parenchyma tissue of apical shoots, leaves and inflorescences, using a mineral basic medium, to which they added coconut water (10%) and 2,4-D. Regeneration was obtained when callus tissue was transferred to a medium without 2,4-D. From various explants, considering an explant as any part of the plant, sugarcane plants can be regenerated directly or indirectly. Indirectly involves the initial formation of callus and further regeneration of plants. Direct regeneration from young leaf segments and indirect regeneration from germinated seed callus, coming from leaf primordia, and apical meristems, has been reported. Gill et al., (2006) reported the direct regeneration of shoots from young leaf segments (1.0-1.5 cm) of varieties CoJ64, CoJ63 and CoJ86. Explants were inoculated in a medium based in Murashige and Skoog (1962) salts. The highest frequency of shoot regeneration occurred in a medium supplemented with naphtalenacetic acid (5.0 mg L¯¹) and kinetin (0.5 mg L¯¹) in variety CoJ83. Sugarcane plant regeneration can occur due to organogenesis, as the case cited in the previous paragraph, or by somatic embryogenesis. Ho and Vasil (1983) induced the formation of embryogenic callus from young leaf segments of sugarcane cultivated in Murashige and Skoog (MS) medium with 0.5 – 3.0 mg
80
L¯¹ of 2,4-D, coconut water (5%), and 3-8% of sucrose. In this experiment, they observed the formation of embryoids (somatic embryos) when callus was transferred to a medium with low 2,4-D content (0.25 – 0.5 mg L¯¹) . The embryogenic callus was formed by divisions in mesophyll cells, mainly located in the abaxial half of the leaf and also from cells from the vascular parenchyma. Embryoids were developed by internal division of individual cells rich in cytoplasm, located on the periphery of embryogenic callus and showed the typical organization of grasses embryos. Ahloowalia and Maretzki (1983) also reported regeneration of plants by somatic embryogenesis working with the IJ76-316 clone, and induction of callus formation from leaf primordia, and apical meristems. Among the factors influencing the response to tissue culture in sugarcane, genotype, light, and growth regulators had been analyzed. Garcia et al. (2007) evaluated the in vitro morphogenesis patterns in sugarcane, determined by light and the type of growth regulator. On the other hand, Gallo-Meagher et al. (2000) evaluated the effect of thidiazuron in the regeneration of shoots from embryogenic callus. Shiromani et al. (2010) evaluated the response to callus formation and plant regeneration in 16 different Australian sugarcane cultivars, using leaf discs as explant. The cultivars Q117, Q135, Q157, Q158, Q185, Q186, Q208 and Q209 showed a high proportion of yellow and compact embryogenic callus, approximately 30-40 g per disc of initial tissue after six weeks. The capacity of plant regeneration was affected by several factors: genotype, 2,4-D concentration in the stage of callus formation and light intensity. In some cases tissue culture has been used to generate genetic variability by inducing mutations that occur as consequence of mistakes in the DNA replication, due to the process of accelerated multiplication under in vitro conditions. This is known as somaclonal variation. Somaclonal Variation, associated to tissue culture, has not been an important factor in sugarcane. Lourens and Martin (1987), Burner and Grisham (1995) and Irvine et al. (1991), cited by Lakshmanan et al. (2005), showed that variations in sugarcane induced by tissue culture were frequently temporal, since most of the variations reverted to the original phenotype in the first reboot. Nevertheless, there are reports of stable somaclonal variants. Oropeza et al. (1995) reported obtaining two somaclonal variants AT626 and BT627, which showed up to be resistant to sugarcane mosaic virus (SCMV) for 7 years in field trials. These materials were obtained by somatic embryogenesis from the PR62-
81
258 cultivar, increasing the number of subcultures on MS medium supplemented with 3mg/l of 2,4-D. Tawar et al. (2008) reported a new variety released in India, Co94012, derived from somaclonal variation in variety CoC 671, as well as the variety VSI 434 with high precocity, which could not be reliably differentiated by analysis with RAPDs. Therefore they concluded that plants of somaclones VSI 434 and Co 94012 produced in vitro, showed high genetic fidelity among them, and that from 333 loci analyzed by RAPDs only some weak bands were polymorphic, with a rate lower than 0.33 percent of polymorphisms that could be preexistent or attributed to punctual mutations. Other application for tissue culture in sugarcane is the recovery of disease-free plants. Leu, 1978 obtained healthy plants through apical meristem culture and callus re differentiation from plants that showed symptoms of mosaic virus, ratoon stunting disease and leaf yellows. Parmessur et al. (2002) reported regeneration of healthy plants free of yellow leaf virus (SCYV) and yellowing phytoplasm (SCYP), using foliar discs as explants for calli formation. Other area in which sugarcane tissue culture has application is in germplasm conservation. Taylor and Duckic (1993) developed a methodology for establishment and storage of more than 200 clones of Saccharum spp hybrids. Using apical buds as explants and a culture medium supplemented with 6-benzylmaminopurine (BAP) and 6-furfurylaminopurine (kinetin), they regenerated multiple shoots, which were transferred to a medium with low mineral content medium with no growth regulators. After 12 months at 18°C, plants were transferred to a new medium and then turn back to storage. No genetic integrity alterations were observed in clones based on phenotypic characteristics. Tissue culture is essential to develop genetic transformation in plants, since no transformation is not performed on a whole plant, due to this would result in chimerism, but in tissues or cultured cells, from which plants are regenerated. Lakshmanan (2006) concluded that, since Hawaiian researchers pioneers in sugarcane tissue culture reported the first successful plant regeneration, in vitro and micro propagation, regeneration techniques have advanced rapidly and are now being used in a commercial level for massive propagation of new cultivars in many countries harboring sugarcane industry. Examples include reports from Meyer et al. (2010) with Novacane® system in Southafrica, and Mordocco et al. (2009) with SmartSett® system in Australia.
82
Molecular markers As an example, consider two DNA fragments which were marked A and B, which are located one next to the other: AB. Fragment A contains no valuable information, but we know how to locate it on a sample of individuals; on the other hand, fragment B contains a gene (allele), which is of great interest, but it is unknown which individuals contain this fragment. To figure this out, it could be proposed to find the fragment A in the population, because if A is present, so is B, and viceversa. What we are doing is using A as a marker to find B. This is a simplified way of understand markers performance, in this case, molecular markers. A methodology used to identify markers that are interrelated, is the analysis of linkage disequilibrium. The relationships found among markers can generate genetic maps, also known as linkage maps Roughan et al. (1971) first reported the use of molecular markers in sugarcane. Analyzing the variation of β-amylase isoenzyme on Saccharum officinarum, Saccharum spontaneum and the F1 progeny originated by its cross-breeding, they were able to differentiate the genotypes of each of the two species, as well as the hybrid progeny, and the resulting from self-fecundation; although no correlation was found among markers and starch content in the stem of the plant. Nowadays, DNA markers are the most frequently used. These can be obtained by restriction of fragments or by amplification of fragments, through Polymerase Chain Reaction (PCR). Al Janabi et al. (1993) published the first genetic map of Saccharum for clone “SES 208” of Saccharum spontaneum. Markers were generated using Randomly Amplifyied Polymorphic DNA (RAPDs), in a progeny from the cross-breeding of "SES 208" and a double haploid plant coming from the same variety. Of all the analyzed markers, 176 were simplex and polymorphic, forming 41 linkage groups. Segregation analysis showed that "SES 208" behaves as an autopolyploid, it means, without preferential pairing at meiosis. The increasing availability of molecular markers has led to the development of many sugarcane genetic maps, Da Silva et al (1993), using RFLP markers (Restriction Fragment Length Polymorphism, Hoarau et al., (2001) using AFLP (Amplified Fragment Length Polymorphism), Aitken et al. (2005) using AFLP and SSR (Simple Sequence Repeats). These Mapping Studies have also allowed the identification of QTL (Quantitalive Trait Loci) markers, possibly associated to characteristics of agronomical and industrial
83
interest. However, its use has not yet been reported as part of a breeding program. In sugarcane, molecular markers had been frequently used to study and comprehend its genomic structure. D'Hont et al. (1998) determined that S. officinarum has a basic chromosome number of x=10, by using in situ hybridization of two ribosomal RNA gene families; , which means that these plants are octoploid. They also demonstrated that S. spontaneum has a chromosome number of x=8 and that the ploidy in this species varies between 5 and 16. The polyploid nature of sugarcane causes in most cases that each feature considered should be analyzed as polygenic, so that markers identified as associated to the phenotype will explain only a small fraction of the observed variation (QTLs). This situation has limited the use of molecular markers as a tool in breeding to perform assisted selection. Wu et al. (1992) described a methodology to identify markers that could be associated to a characteristic of monogenic nature. For this, a cross-breeding must be done assuming that the characteristic –disease resistance for example-, is shown only on one of the parents, because of the presence of only one dominant allele, and the rest are recessive. Due to this situation, gamete production would be made in proportions ½ Aaaa and ½ aaaa. On the other parent –phenotypically susceptible- it can be assumed that the dominant allele is not present. Thus, its formation of gametes would be aaaa as a whole. We would expect that the offspring of this cross-breeding be a population that shows half of individuals phenotypically resistant and half phenotypically susceptible, if indeed the feature is controlled by the dominant allele. Another argument that is included in this methodology establishes the cross-breeding of two individuals from the same phenotype – resistant, for example-, or its equivalent, a self-fertilization. As in the previous case, it is assumed that the characteristic is controlled by the presence of only one allele dominant, and the rest of them are recessive. If this assumption is correct, progeny would be expected to show ¾ of resistant population and ¼ of susceptible population. So far, only one monogenic marker associated to a specific phenotype developed by Le Cunff (2008) has been reported, this is a PCR based marker, that is associated with the resistant allele of the disease known as brown rust, caused by the fungus Puccinia melanocephala.
84
The genotype of varieties, also knowns as: fingerprinting is another application of molecular marker that has shown benefits in sugarcane. The generation of markers based on PCR, has facilitated the identification of polymorphic markers, with which it is possible to generate genetic patterns for each variety of interest. This has enhanced the process of quality control in the production and vegetative seed propagation. The analysis of molecular patterns also allows the establishment of the similarity degree among varieties; permitting visualization of genetic diversity levels that are available in the collections and breeding programs. That information becomes a tool for hybridization planning. The applications of molecular markers in sugarcane cultivars had demonstrated to be useful in particular situations, as mentioned above. However, there is still a gap that has not been covered, because not enough markers have been generated to allow the analysis of the complete genome and the consequent exploitation of this information. The development of computing has facilitated advances in structural and functional genomics. In sugarcane, the array technology is already being used to identify markers (Heller-Uszynska, et al., 2010). It has also demonstrated to be a powerful tool for the identification of genes associated with processes or specific characteristics. Carson, et al. (2002) showed that it is possible to identify genes, using a strategy that combines subtractive hybridization and cDNA macroarrays. Genetic engineering In the breeding process, the most common way to generate genetic variability is through cross-breeding. However, there are limitations that restrict the cross-breedings, since they could only be made among individuals of the same species and, in some cases, between individuals of different species or genus. When performing a sexual cross-breeding, the resulting progeny will possess half the chromosomes of the male parent and the other half from the female. Recombinant DNA technology, allows inserting one or a few genes of an individual, in the genome of another individuals, without species, genus, or even kingdom restriction. This is possible because the molecule of genetic material that regulates the structure and function of an organism is the same in all of them. This technology has made possible, among other things, the expression in bacteria, plants, and animals, of proteins with pharmaceutical or industrial purposes, as well as the transformation of plants with characteristics such as tolerance to herbicides and insect and virus resistance.
85
Sugarcane has successfully been transformed by various techniques, such as microprojectile bombardment, electroporation and Agrobacterium. Several characteristics have been introduced including herbicide resistance, virus resistance, insect resistance and enzymatic regulation of sucrose. The new features that had been recently introduced in this crop include, collagen production and bioplastics (Lakshmanan et al., 2005). According to Butterfield et al. (2002), the development of new sugarcane varieties (Saccharum spp. hybrids) is a long and unpredictable process. Genetic transformation offers the potential to introduce some new desirable characteristics in existing varieties, and the achievement of stable expression of those transgenes. Lakshmanan et al. (2005) mentioned that, besides of being an important nutritional and energetic crop, there are other reasons that make sugarcane, a candidate for engineered breeding. In the first place, genetic improvement of elite sugarcane clones by conventional breeding is difficult due to its complex polyploid-aneuploid genome, low fertility, and the long period required (12-15 years) to generate new cultivars. Backcrosses designed to recover elite genotypes with desirable agronomic characteristics require long periods of time, as well. Within this context, genetic engineering is a useful tool to introduce valuable commercial characteristics in elite germplasm. In second place, there are transformation systems available in sugarcane useful in practice, and the useful transgenic lines can be maintained indefinitely by vegetative propagation. Chen et al. (1987) were the first to report genetic transformation in sugarcane, introducing a marker gene that confers resistance to the antibiotic kanamycin. Transformation was performed in protoplasts isolated from commercial hybrid F164, using polyethylene-glycol induced incorporation and using the vector plasmid pABD1 isolated from E. coli strain JA221. Calli formed from transformed protoplasts maintained the expression of resistance to kanamycin in a medium with a concentration of 80μg mL¯¹ of antibiotic. The DNA in the transformed tissue hybridized with the gene probe APH(3`)II (aminoglycoside-phosphotransferase). The efficiency of the transformation process was 8 protoplasts in 107. Bower and Birch (1992) were the first transforming sugarcane plants by tungsten microprojectile bombardment, concluding that this method is more effective than others reported. Rathus and Birch (1992) improved transformation efficiency using electroporation, to introduce the coding gene of the enzyme neomycinphosphotransferase (NPTII) in sugarcane protoplasts isolated from
86
cultivars Q63 and Q96 (one callus transformed for each 102-104 treated protoplasts). The integration and expression of NPTII gene, that confers resistance to kanamycin antibiotic, were confirmed by Southern analysis and enzymatic assays. The Southern analysis revealed a complex pattern of integration with rearrangements and multiple copies. It has also demonstrated the gene co-transformation of β-glucuronidase (GUS) in the same construct or in separate constructs. Many of the calli that contained intact copies of β-glucuronidase gene did not show detectable expression. However, one line of calli regenerated after electroporation with a plasmid containing both NPTII and GUS genes, showed a stable expression of both marker genes. Arencibia et al. (1992) developed a method of plant transformation and regeneration based in the electroporation of meristematic tissue of cultivars POJ 2878 and Ja60-5. Transformation was performed with plasmids pBI-221.1 and pGSCGN-2 that conferred GUS and NPTII activity to transformed cells. Transformed plants were analyzed with histochemical, fluorometric, PCR and Southern blot methods. With the transformation of the intact meristematic tissue, regeneration of plants was facilitated, which was usually a major obstacle in the transformation of protoplasts. However, , the chimeras obtantion is a regular problem that could be avoided transforming embryogenic tissue, due to the meristematic tissue is composed of many heterogeneous cell layers. Arencibia et al. (1995) described an efficient procedure for genetic transformation of commercial varieties POJ2878 and Ja 60-5, based on the electroporation of a plasmid that confers GUS activity within a group of isolated cells from embriogenic calli. Between 6 and 8 weeks after electroporation, plants regenerated from Ja 60-5 were evaluated and confirmed as transgenic, using histochemical glucuronidase and Southern hybridization analysis. Arencibia et al. (1998) reported the first successful recovery of transgenic morphologically normal sugarcane plants using a callus co-cultivation with Agrobacterium tumefaciens. The transformation frequencies (total of transgenic plants/number of cell clusters) were between 9.4 x 10⁻³ and 1.15 x 10⁻². In their experiments they found that strain LBA4404 (pTOK233) and EHA101 (pMTCA31G) were successful for sugarcane transformation with marker genes. They found 3 crucial factors to increase the competence of the cells in the transference process of T-DNA: (1) the use of young regenerable calli as target explants; (2) Induction or increase of the virulence system of A. tumefaciens with the sugarcane cell culture, and (3) the pre-induction of organogenesis or somatic embryogenesis.
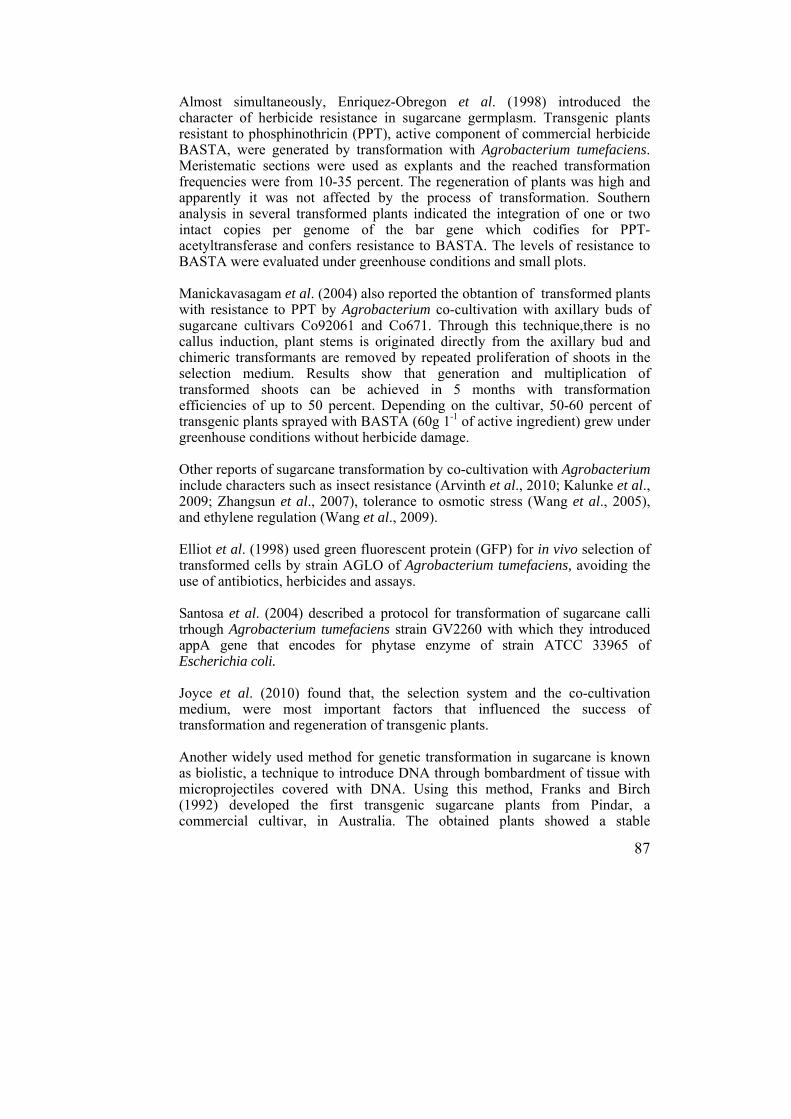
87
Almost simultaneously, Enriquez-Obregon et al. (1998) introduced the character of herbicide resistance in sugarcane germplasm. Transgenic plants resistant to phosphinothricin (PPT), active component of commercial herbicide BASTA, were generated by transformation with Agrobacterium tumefaciens. Meristematic sections were used as explants and the reached transformation frequencies were from 10-35 percent. The regeneration of plants was high and apparently it was not affected by the process of transformation. Southern analysis in several transformed plants indicated the integration of one or two intact copies per genome of the bar gene which codifies for PPT-acetyltransferase and confers resistance to BASTA. The levels of resistance to BASTA were evaluated under greenhouse conditions and small plots. Manickavasagam et al. (2004) also reported the obtantion of transformed plants with resistance to PPT by Agrobacterium co-cultivation with axillary buds of sugarcane cultivars Co92061 and Co671. Through this technique,there is no callus induction, plant stems is originated directly from the axillary bud and chimeric transformants are removed by repeated proliferation of shoots in the selection medium. Results show that generation and multiplication of transformed shoots can be achieved in 5 months with transformation efficiencies of up to 50 percent. Depending on the cultivar, 50-60 percent of transgenic plants sprayed with BASTA (60g 1-1 of active ingredient) grew under greenhouse conditions without herbicide damage. Other reports of sugarcane transformation by co-cultivation with Agrobacterium include characters such as insect resistance (Arvinth et al., 2010; Kalunke et al., 2009; Zhangsun et al., 2007), tolerance to osmotic stress (Wang et al., 2005), and ethylene regulation (Wang et al., 2009). Elliot et al. (1998) used green fluorescent protein (GFP) for in vivo selection of transformed cells by strain AGLO of Agrobacterium tumefaciens, avoiding the use of antibiotics, herbicides and assays. Santosa et al. (2004) described a protocol for transformation of sugarcane calli trhough Agrobacterium tumefaciens strain GV2260 with which they introduced appA gene that encodes for phytase enzyme of strain ATCC 33965 of Escherichia coli. Joyce et al. (2010) found that, the selection system and the co-cultivation medium, were most important factors that influenced the success of transformation and regeneration of transgenic plants. Another widely used method for genetic transformation in sugarcane is known as biolistic, a technique to introduce DNA through bombardment of tissue with microprojectiles covered with DNA. Using this method, Franks and Birch (1992) developed the first transgenic sugarcane plants from Pindar, a commercial cultivar, in Australia. The obtained plants showed a stable
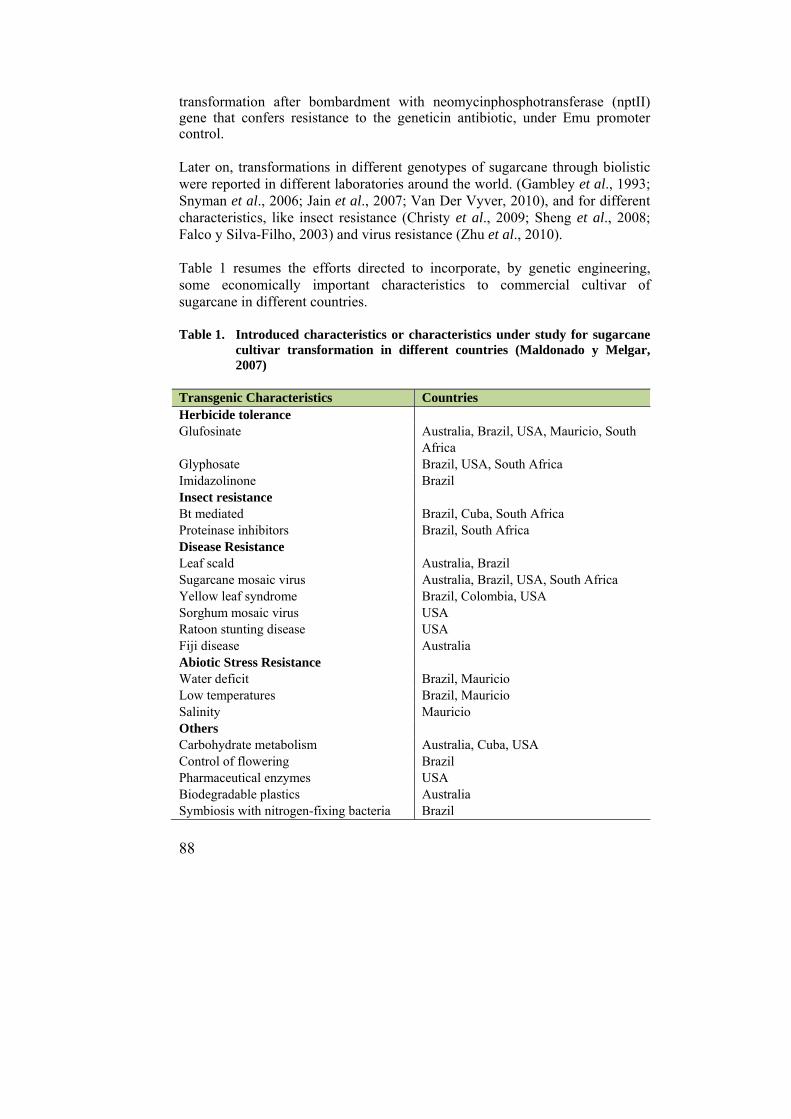
88
transformation after bombardment with neomycinphosphotransferase (nptII) gene that confers resistance to the geneticin antibiotic, under Emu promoter control. Later on, transformations in different genotypes of sugarcane through biolistic were reported in different laboratories around the world. (Gambley et al., 1993; Snyman et al., 2006; Jain et al., 2007; Van Der Vyver, 2010), and for different characteristics, like insect resistance (Christy et al., 2009; Sheng et al., 2008; Falco y Silva-Filho, 2003) and virus resistance (Zhu et al., 2010). Table 1 resumes the efforts directed to incorporate, by genetic engineering, some economically important characteristics to commercial cultivar of sugarcane in different countries. Table 1. Introduced characteristics or characteristics under study for sugarcane
cultivar transformation in different countries (Maldonado y Melgar, 2007)
Transgenic Characteristics Countries Herbicide tolerance Glufosinate Australia, Brazil, USA, Mauricio, South
Africa Glyphosate Brazil, USA, South Africa Imidazolinone Brazil Insect resistance Bt mediated Brazil, Cuba, South Africa Proteinase inhibitors Brazil, South Africa Disease Resistance Leaf scald Australia, Brazil Sugarcane mosaic virus Australia, Brazil, USA, South Africa Yellow leaf syndrome Brazil, Colombia, USA Sorghum mosaic virus USA Ratoon stunting disease USA Fiji disease Australia Abiotic Stress Resistance Water deficit Brazil, Mauricio Low temperatures Brazil, Mauricio Salinity Mauricio Others Carbohydrate metabolism Australia, Cuba, USA Control of flowering Brazil Pharmaceutical enzymes USA Biodegradable plastics Australia Symbiosis with nitrogen-fixing bacteria Brazil

89
International Consortium of sugarcane biotechnology The International Consortium of Sugarcane Biotechnology (ICSB) is a group currently integrated by 19 institutions from 14 countries (Table 2) that, according to Moore (2005), provide economic resources to share technologies and information, invest in their own biotechnology institutional infrastructure building, and fund collaborative research projects to make contributions to the basic understanding of the molecular biology of sugarcane. Moore (2005) gives a detailed account of the events that led to the formation of the ICSB. In 1988, during an International Society of Sugarcane Technologists (ISSCT) workshop, held in conjunction with physiology and breeding sections, Paul Moore and James Irvine arranged a meeting between the Hawaii Sugar Planters Association (HSPA) directors, the United States and Brazil's Centro de Tecnologia Canavieira (CTC);.with the objective to finance an investigation proposed by Steven Tanksley and Mark Sorrel at Cornell University (United States of America), with the purpose of evaluating the feasibility of using DNA markers to map the sugarcane genome. The agreement between HSPA/CTC included the participation of one researcher from each institution, working at a laboratory at Cornell and to facilitate the transference of the acquired technology back to their respective industries The promising results obtained in this project, with the participation of K. K. Wu from HSPA and William Burnquist from CTC, motivated Irvine to organize the first International Workshop on Sugarcane Genome Analysis held in March 1991 at Beltsville, Maryland, USA. During this event, five additional institutions joined the first two institutions and formalized a collaboration agreement to expand research efforts, gain a better understanding of the sugarcane genomics and apply this knowledge to the improvement of the crop (Moore, 2005). The second workshop was held in Albany, California, USA in 1992, when three additional research centers joined the previous seven. A new letter of understanding was obtained, including the new members and naming this growing organization as international consortium of sugarcane biotechnology (Moore 2005). Table 3 shows the achievements and impact of projects and investigations financed by ICSB. CENGICAÑA is part of the ICSB since 1999, and utilizes the generated knowledge for the diagnosis of sugarcane diseases using DNA markers and specific immunological reactions, which has strengthed seed production,
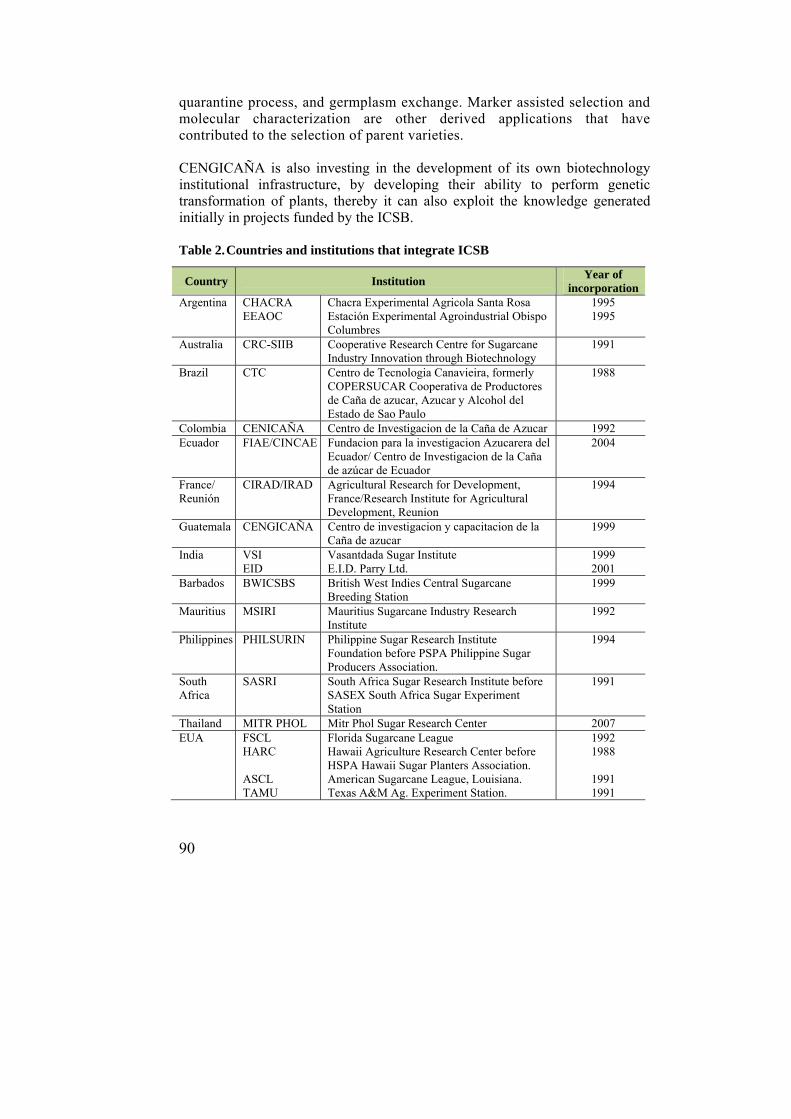
90
quarantine process, and germplasm exchange. Marker assisted selection and molecular characterization are other derived applications that have contributed to the selection of parent varieties. CENGICAÑA is also investing in the development of its own biotechnology institutional infrastructure, by developing their ability to perform genetic transformation of plants, thereby it can also exploit the knowledge generated initially in projects funded by the ICSB. Table 2. Countries and institutions that integrate ICSB
Country Institution Year of
incorporation Argentina CHACRA
EEAOC Chacra Experimental Agricola Santa Rosa Estación Experimental Agroindustrial Obispo Columbres
1995 1995
Australia CRC-SIIB Cooperative Research Centre for Sugarcane Industry Innovation through Biotechnology
1991
Brazil CTC Centro de Tecnologia Canavieira, formerly COPERSUCAR Cooperativa de Productores de Caña de azucar, Azucar y Alcohol del Estado de Sao Paulo
1988
Colombia CENICAÑA Centro de Investigacion de la Caña de Azucar 1992 Ecuador FIAE/CINCAE Fundacion para la investigacion Azucarera del
Ecuador/ Centro de Investigacion de la Caña de azúcar de Ecuador
2004
France/ Reunión
CIRAD/IRAD Agricultural Research for Development, France/Research Institute for Agricultural Development, Reunion
1994
Guatemala CENGICAÑA Centro de investigacion y capacitacion de la Caña de azucar
1999
India VSI EID
Vasantdada Sugar Institute E.I.D. Parry Ltd.
1999 2001
Barbados BWICSBS British West Indies Central Sugarcane Breeding Station
1999
Mauritius MSIRI Mauritius Sugarcane Industry Research Institute
1992
Philippines PHILSURIN Philippine Sugar Research Institute Foundation before PSPA Philippine Sugar Producers Association.
1994
South Africa
SASRI South Africa Sugar Research Institute before SASEX South Africa Sugar Experiment Station
1991
Thailand MITR PHOL Mitr Phol Sugar Research Center 2007 EUA FSCL
HARC ASCL TAMU
Florida Sugarcane League Hawaii Agriculture Research Center before HSPA Hawaii Sugar Planters Association. American Sugarcane League, Louisiana. Texas A&M Ag. Experiment Station.
1992 1988
1991 1991
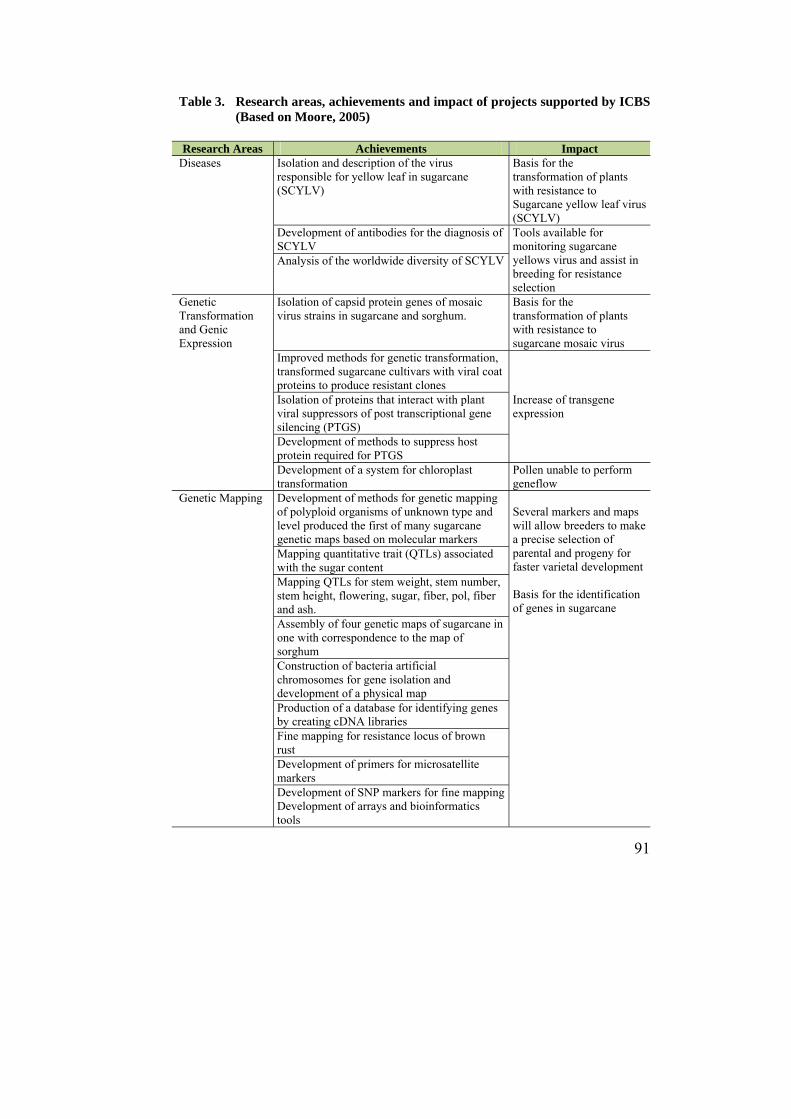
91
Table 3. Research areas, achievements and impact of projects supported by ICBS (Based on Moore, 2005)
Research Areas Achievements Impact
Diseases Isolation and description of the virus responsible for yellow leaf in sugarcane (SCYLV)
Basis for the transformation of plants with resistance to Sugarcane yellow leaf virus (SCYLV)
Development of antibodies for the diagnosis of SCYLV
Tools available for monitoring sugarcane yellows virus and assist in breeding for resistance selection
Analysis of the worldwide diversity of SCYLV
Genetic Transformation and Genic Expression
Isolation of capsid protein genes of mosaic virus strains in sugarcane and sorghum.
Basis for the transformation of plants with resistance to sugarcane mosaic virus
Improved methods for genetic transformation, transformed sugarcane cultivars with viral coat proteins to produce resistant clones
Increase of transgene expression
Isolation of proteins that interact with plant viral suppressors of post transcriptional gene silencing (PTGS) Development of methods to suppress host protein required for PTGS Development of a system for chloroplast transformation
Pollen unable to perform geneflow
Genetic Mapping Development of methods for genetic mapping of polyploid organisms of unknown type and level produced the first of many sugarcane genetic maps based on molecular markers
Several markers and maps will allow breeders to make a precise selection of parental and progeny for faster varietal development Basis for the identification of genes in sugarcane
Mapping quantitative trait (QTLs) associated with the sugar content Mapping QTLs for stem weight, stem number, stem height, flowering, sugar, fiber, pol, fiber and ash. Assembly of four genetic maps of sugarcane in one with correspondence to the map of sorghum Construction of bacteria artificial chromosomes for gene isolation and development of a physical map Production of a database for identifying genes by creating cDNA libraries Fine mapping for resistance locus of brown rust Development of primers for microsatellite markers Development of SNP markers for fine mappingDevelopment of arrays and bioinformatics tools
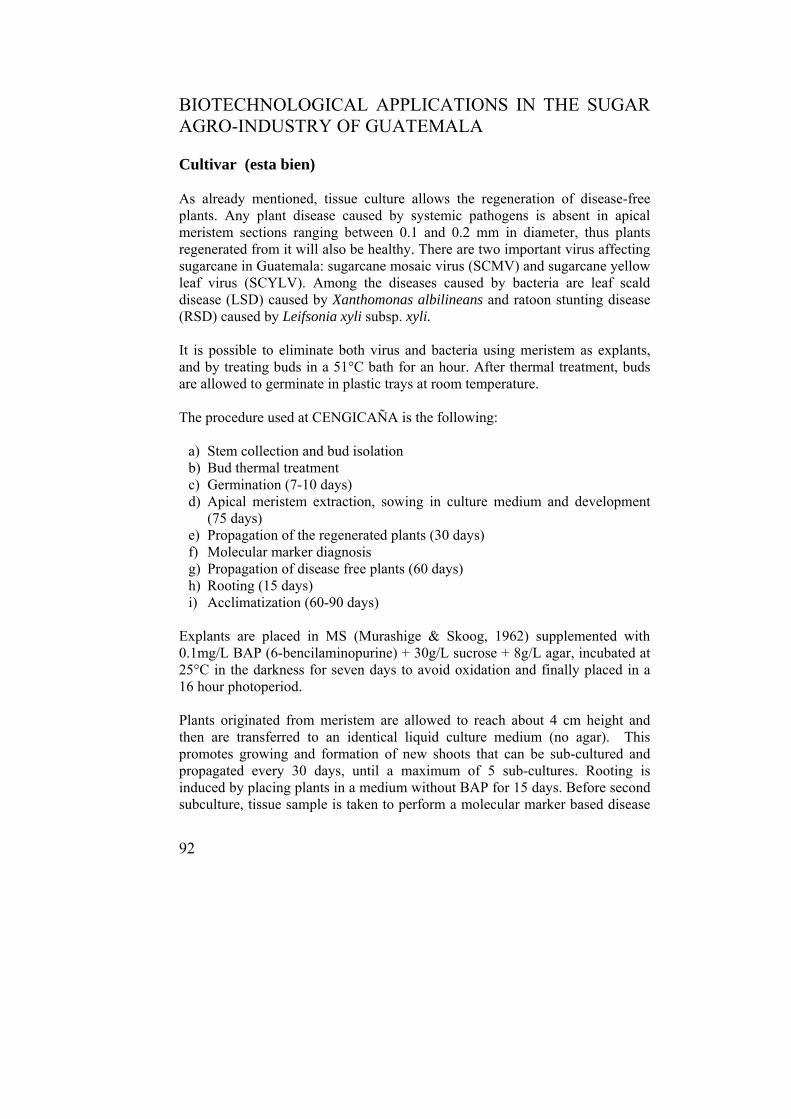
92
BIOTECHNOLOGICAL APPLICATIONS IN THE SUGAR AGRO-INDUSTRY OF GUATEMALA Cultivar (esta bien) As already mentioned, tissue culture allows the regeneration of disease-free plants. Any plant disease caused by systemic pathogens is absent in apical meristem sections ranging between 0.1 and 0.2 mm in diameter, thus plants regenerated from it will also be healthy. There are two important virus affecting sugarcane in Guatemala: sugarcane mosaic virus (SCMV) and sugarcane yellow leaf virus (SCYLV). Among the diseases caused by bacteria are leaf scald disease (LSD) caused by Xanthomonas albilineans and ratoon stunting disease (RSD) caused by Leifsonia xyli subsp. xyli. It is possible to eliminate both virus and bacteria using meristem as explants, and by treating buds in a 51°C bath for an hour. After thermal treatment, buds are allowed to germinate in plastic trays at room temperature. The procedure used at CENGICAÑA is the following:
a) Stem collection and bud isolation b) Bud thermal treatment c) Germination (7-10 days) d) Apical meristem extraction, sowing in culture medium and development
(75 days) e) Propagation of the regenerated plants (30 days) f) Molecular marker diagnosis g) Propagation of disease free plants (60 days) h) Rooting (15 days) i) Acclimatization (60-90 days)
Explants are placed in MS (Murashige & Skoog, 1962) supplemented with 0.1mg/L BAP (6-bencilaminopurine) + 30g/L sucrose + 8g/L agar, incubated at 25°C in the darkness for seven days to avoid oxidation and finally placed in a 16 hour photoperiod. Plants originated from meristem are allowed to reach about 4 cm height and then are transferred to an identical liquid culture medium (no agar). This promotes growing and formation of new shoots that can be sub-cultured and propagated every 30 days, until a maximum of 5 sub-cultures. Rooting is induced by placing plants in a medium without BAP for 15 days. Before second subculture, tissue sample is taken to perform a molecular marker based disease
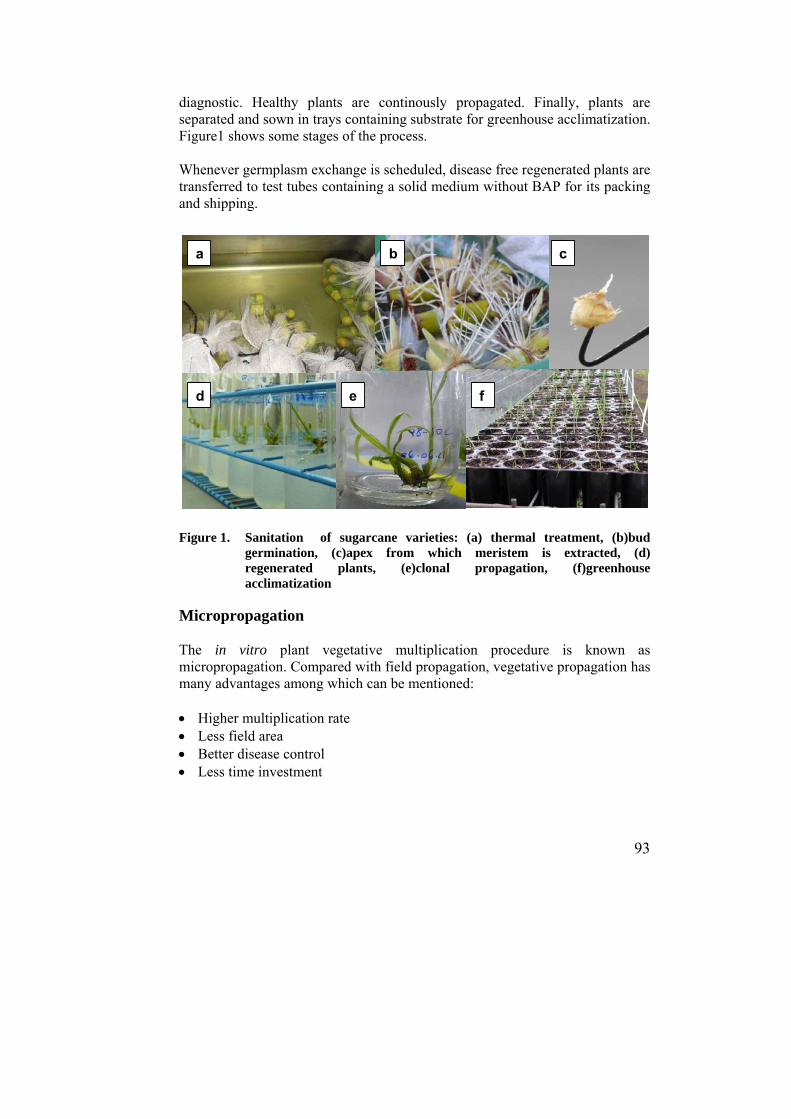
93
a b c
d e f
a b c
d e f
diagnostic. Healthy plants are continously propagated. Finally, plants are separated and sown in trays containing substrate for greenhouse acclimatization. Figure1 shows some stages of the process. Whenever germplasm exchange is scheduled, disease free regenerated plants are transferred to test tubes containing a solid medium without BAP for its packing and shipping. Figure 1. Sanitation of sugarcane varieties: (a) thermal treatment, (b)bud
germination, (c)apex from which meristem is extracted, (d) regenerated plants, (e)clonal propagation, (f)greenhouse acclimatization
Micropropagation The in vitro plant vegetative multiplication procedure is known as micropropagation. Compared with field propagation, vegetative propagation has many advantages among which can be mentioned: Higher multiplication rate Less field area Better disease control Less time investment
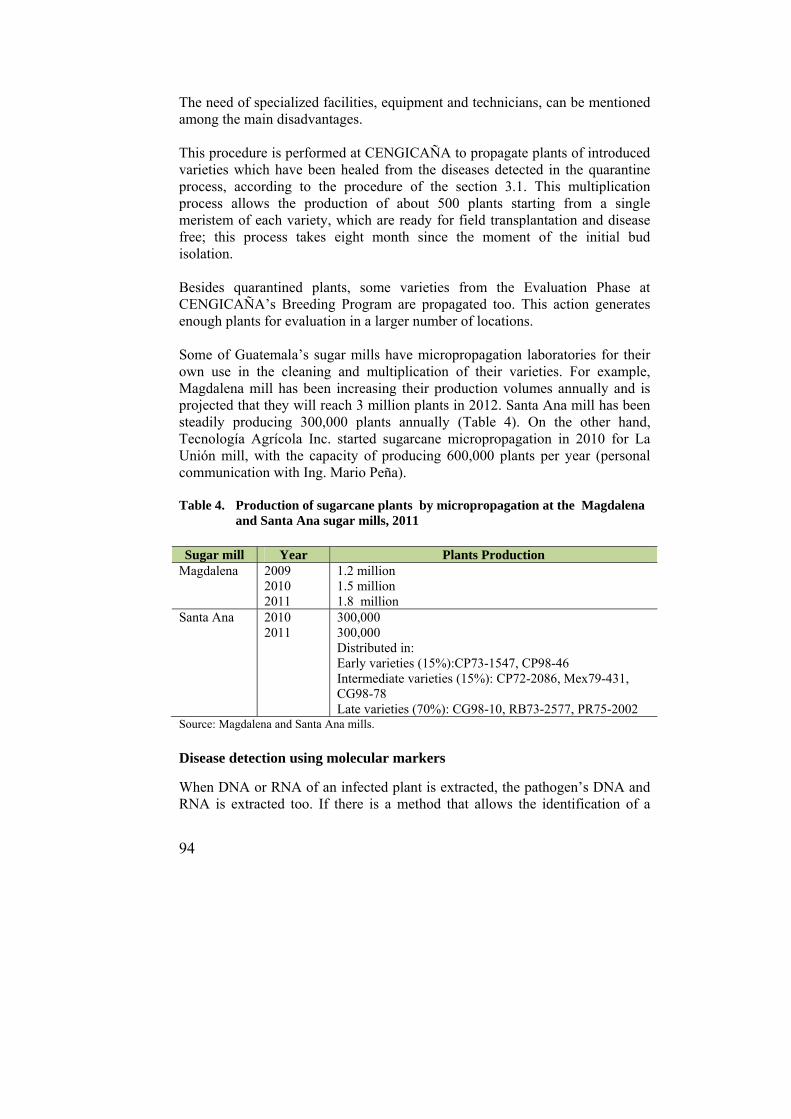
94
The need of specialized facilities, equipment and technicians, can be mentioned among the main disadvantages. This procedure is performed at CENGICAÑA to propagate plants of introduced varieties which have been healed from the diseases detected in the quarantine process, according to the procedure of the section 3.1. This multiplication process allows the production of about 500 plants starting from a single meristem of each variety, which are ready for field transplantation and disease free; this process takes eight month since the moment of the initial bud isolation. Besides quarantined plants, some varieties from the Evaluation Phase at CENGICAÑA’s Breeding Program are propagated too. This action generates enough plants for evaluation in a larger number of locations. Some of Guatemala’s sugar mills have micropropagation laboratories for their own use in the cleaning and multiplication of their varieties. For example, Magdalena mill has been increasing their production volumes annually and is projected that they will reach 3 million plants in 2012. Santa Ana mill has been steadily producing 300,000 plants annually (Table 4). On the other hand, Tecnología Agrícola Inc. started sugarcane micropropagation in 2010 for La Unión mill, with the capacity of producing 600,000 plants per year (personal communication with Ing. Mario Peña). Table 4. Production of sugarcane plants by micropropagation at the Magdalena
and Santa Ana sugar mills, 2011
Sugar mill Year Plants Production Magdalena 2009
2010 2011
1.2 million 1.5 million 1.8 million
Santa Ana 2010 2011
300,000 300,000 Distributed in: Early varieties (15%):CP73-1547, CP98-46 Intermediate varieties (15%): CP72-2086, Mex79-431, CG98-78 Late varieties (70%): CG98-10, RB73-2577, PR75-2002
Source: Magdalena and Santa Ana mills.
Disease detection using molecular markers
When DNA or RNA of an infected plant is extracted, the pathogen’s DNA and RNA is extracted too. If there is a method that allows the identification of a

95
1000bp
1500bp
-M + CG00-0
33C
G96-01
CG00
-044
CG00
-092
CG98-78
CG98-62
CG98-
46
CG02-
007
CG01-17
1250bp
1000bp
1500bp
-M + CG00-0
33C
G96-01
CG00
-044
CG00
-092
CG98-78
CG98-62
CG98-
46
CG02-
007
CG01-17
1250bp
nucleic acid fragment from the pathogen, the pathogen presence in the sample can be diagnosed. This reasoning is the base of nucleic analisys for disease detection using molecular markers. CENGICAÑA uses this technology for the diagnostic of the following diseases: Ratoon stunt disease (RSD) Leaf scald disease (LSD) Sugarcane yellow leaf phytoplasma (SCYLP) Sugarcane mosaic virus (SCMV) Simultaneous detection of RSD and LSD is based on the Davis, Rott and Astua-monge report (1998); SCYLP is detected according to Parmessur et al. (2002) and SCMV is detected according to Smith & Van de Velde (1994). Disease diagnostics is performed as part of the variety sanitation before micropropagation so the absence of important pathogens is confirmed. In general, the procedure involves DNA or RNA extraction, a pathogen’s specific fragment amplification using polymerase chain reaction (PCR), separation of fragments, using agarose gelelectrophoresis and the visualization of the fragments using etidium bromide and UV light (Figure 2).
Figure 2. Agarose gel showing the results of a diagnostic procedure for SCYP.
Lane 1= molecular weight ladder, lane 2= negative control, lane 3= positive control, lanes 4-12= evaluated varieties. CENGICAÑA 2011
The use of molecular markers for disease diagnosis has the advantage of being more sensitive than the immunological counterpart. DNA analysis represents a non-destructive assay.
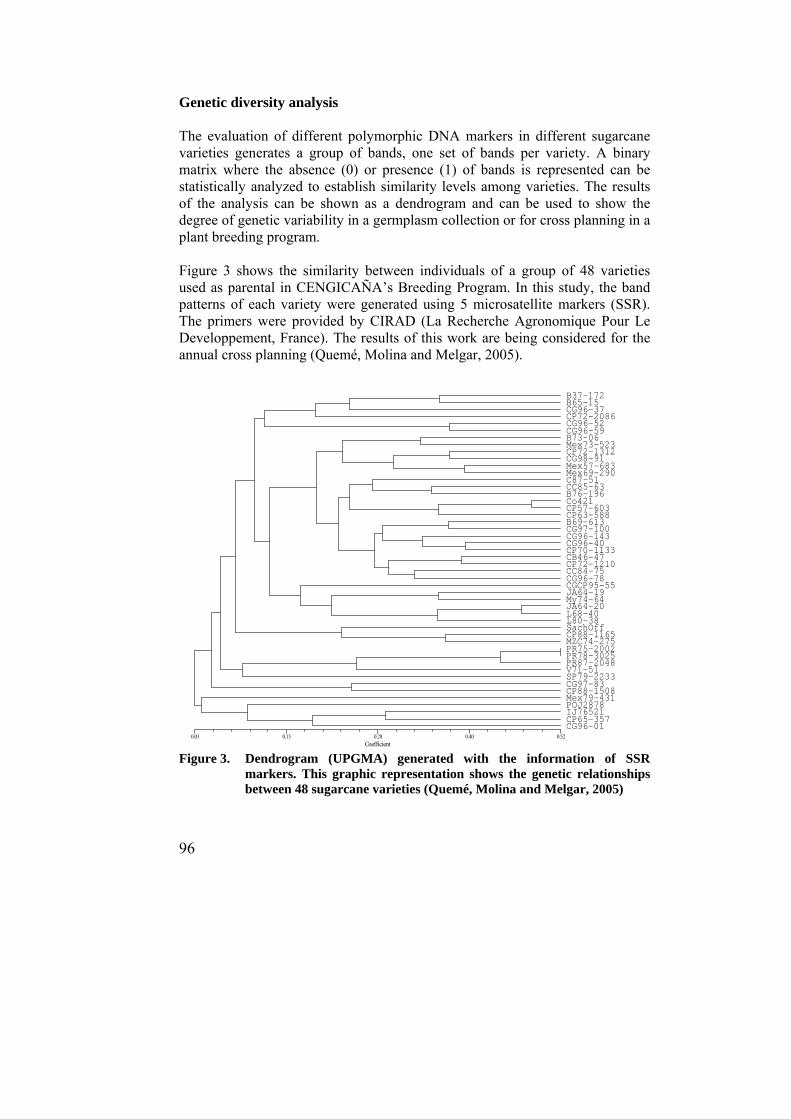
96
Coefficient0.03 0.15 0.28 0.40 0.52
MW
B37-172 B65-15 CG96-37 CP72-2086 CG96-52 CG96-59 B73-06 Mex73-523 CP72-1312 CG98-91 Mex57-683 Mex69-290 C87-51 CC85-63 B76-196 Co421 CP57-603 CP63-588 B69-613 CG97-100 CG96-143 CG96-40 CP70-1133 CB46-47 CP72-1210 CC84-75 CG96-78 CGCP95-55 JA64-19 My74-64 JA64-20 L68-40 L80-38 SachOff CP88-1165 MZC74-275 PR75-2002 PR78-3025 PR87-2048 V71-51 SP79-2233 CG97-83 CP88-1508 Mex79-431 POJ2878 IJ76521 CP65-357 CG96-01
Genetic diversity analysis The evaluation of different polymorphic DNA markers in different sugarcane varieties generates a group of bands, one set of bands per variety. A binary matrix where the absence (0) or presence (1) of bands is represented can be statistically analyzed to establish similarity levels among varieties. The results of the analysis can be shown as a dendrogram and can be used to show the degree of genetic variability in a germplasm collection or for cross planning in a plant breeding program. Figure 3 shows the similarity between individuals of a group of 48 varieties used as parental in CENGICAÑA’s Breeding Program. In this study, the band patterns of each variety were generated using 5 microsatellite markers (SSR). The primers were provided by CIRAD (La Recherche Agronomique Pour Le Developpement, France). The results of this work are being considered for the annual cross planning (Quemé, Molina and Melgar, 2005). Figure 3. Dendrogram (UPGMA) generated with the information of SSR
markers. This graphic representation shows the genetic relationships between 48 sugarcane varieties (Quemé, Molina and Melgar, 2005)

97
Maldonado et al. (2009) characterized the genetic diversity of 26 strains of the fungus Metarhizium anisopliae Metchnikoff using SSR and RAPD markers. This fungus is used as biological control of sugarcane pests and other crops. This study detected 8 local strains which remain viable three months after the application to the soil. Figure 4. Dendrogram generated with SSR and RAPD markers showing genetic
similarity between 26 strains of the fungus M. anisopliae Metchnikoff (Maldonado et al., 2009)
Marker assisted selection Despite great efforts to identify genetic markers associated to important traits and to generate genetic maps, sugarcane’s complex genome remains as the major barrier for the use of marker assisted selection (MAS). To date, only two markers have been identified as tightly related to a monogenic characteristic: rust resistance (Le Cunff, 2008). The research conducted to identify these markers, was funded partially by the International Consortium of Sugarcane Biotechnology (ICSB) . These markers have been given to CENGICAÑA by CIRAD and they will be used for assisted selection markers . The use of other molecular marker in assisted selection, has not been reported to be used in sugarcane MAS, even when there has been shown the association of several markers to QTL’s.
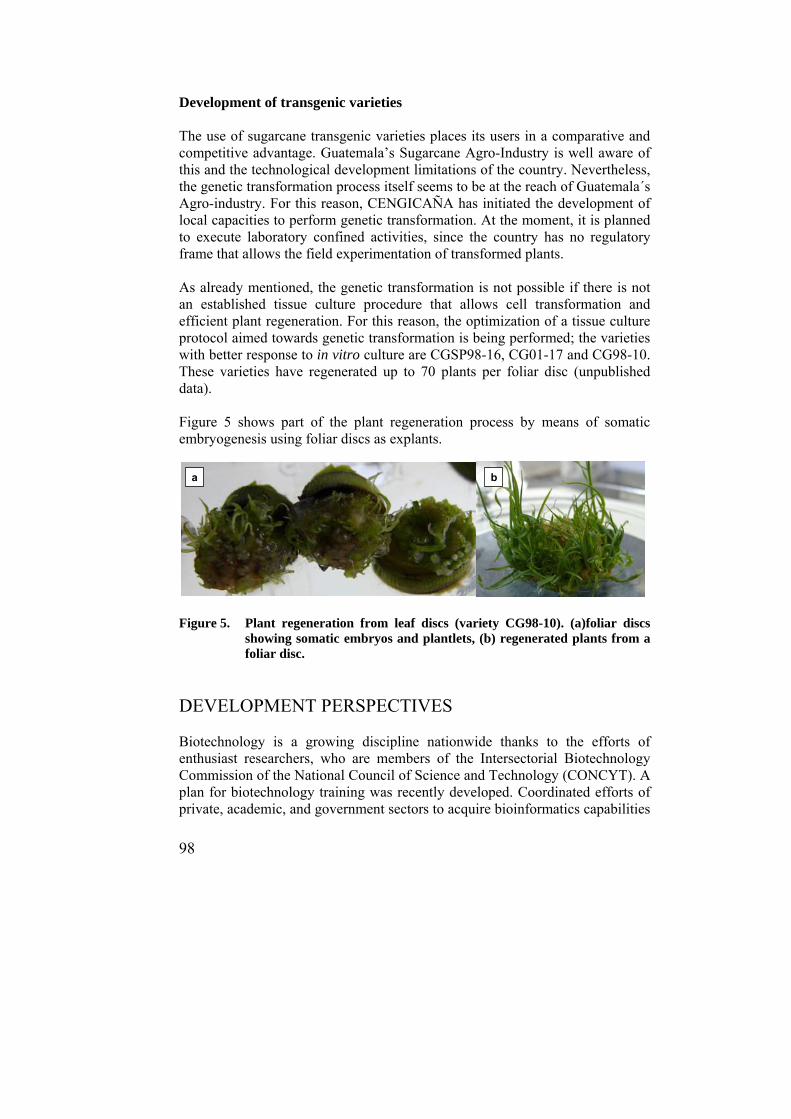
98
a ba b
Development of transgenic varieties The use of sugarcane transgenic varieties places its users in a comparative and competitive advantage. Guatemala’s Sugarcane Agro-Industry is well aware of this and the technological development limitations of the country. Nevertheless, the genetic transformation process itself seems to be at the reach of Guatemala´s Agro-industry. For this reason, CENGICAÑA has initiated the development of local capacities to perform genetic transformation. At the moment, it is planned to execute laboratory confined activities, since the country has no regulatory frame that allows the field experimentation of transformed plants. As already mentioned, the genetic transformation is not possible if there is not an established tissue culture procedure that allows cell transformation and efficient plant regeneration. For this reason, the optimization of a tissue culture protocol aimed towards genetic transformation is being performed; the varieties with better response to in vitro culture are CGSP98-16, CG01-17 and CG98-10. These varieties have regenerated up to 70 plants per foliar disc (unpublished data). Figure 5 shows part of the plant regeneration process by means of somatic embryogenesis using foliar discs as explants. Figure 5. Plant regeneration from leaf discs (variety CG98-10). (a)foliar discs
showing somatic embryos and plantlets, (b) regenerated plants from a foliar disc.
DEVELOPMENT PERSPECTIVES Biotechnology is a growing discipline nationwide thanks to the efforts of enthusiast researchers, who are members of the Intersectorial Biotechnology Commission of the National Council of Science and Technology (CONCYT). A plan for biotechnology training was recently developed. Coordinated efforts of private, academic, and government sectors to acquire bioinformatics capabilities
99
have been conducted. All the above, will permit to take advantage of technological development. CENGICAÑA’s Breeding Program has been progressively reinforced by the biotechnological applications. It is expected that the genotyping, sanitaation, varieties propagation, marker assisted selection, and genetic transformation activities will work optimally together along with the rest of the plant breeding program in the short term. It is also expected to use molecular markers to assess pathogen diversity and the identification of genes of interest. Additionally, Biotechnology Area can also continue its involvement in the Integrated Pest Management Program, by means of genetic diversity as performed in 2009 by Maldonado and collaborators in the analysis of Metarhizium anisopliae. In a global manner, a growing demand of activities involving the Biotecnology Area is expected, as a direct consequence of the favorable and informative results obtained to date.
BIBLIOGRAPHY 1. Ahloowalia, B.; Maretzki, A. 1983. Plant regeneration via somatic
embryogenesis in sugarcane. Plant Cell Reports , 2:21-25. 2. Aitken, K.; Jackson, P.; McIntyre, C. 2005. A combination of AFLP and
SSR markers provides extensive map coverage and identification of homo(eo)logous groups in a sugarcane cultivar. Theoretical and Applied Genetics , 110:789-801.
3. Al-Janabi, S.; Honeycutt, R.; McClelland, M.; Sobral, B. 1993. A genetic
linkage map of Saccharum spontaneum L. 'SES 208'. Genetics , 134:1249-1260.
4. Bower, R.; Birch, R. 1992. Transgenic sugarcane plants via
microprojectile bombardment. The Plant Journal , 2(3):409-416. 5. Carson, D.; Huckett, B.; Botha, F. 2002. Sugarcane ESTs differentially
expressed in immature and maturing internodal tissue. Plant Sci , 162:289-300.
6. Maldonado, A.; Melgar, M. 2007. Avances mundiales en transgénesis de
caña de azúcar. In: Memoria. Presentación de resultados de investigación Zafra 2006-2007. Guatemala, CENGICAÑA. pp. 92-100.
100
7. Da Silva, J.; Sorrells, M.; Burnquist, W.; Tanksley, S. 1993. RFLP linkage map and genome analysis of Saccharum spontaneum. Genome , 36:782-791.
8. D'Hont, A. ; Ison, D. ; Alix, K. ; Roux, C. ; Glaszmann, J.C. 1998.
Determination of basic chromosome numbers in the genus Saccharum by physical mapping or ribosomal RNA genes. Genome Res. , 41:221-225.
9. Gallo-Meagher, M.; English, R.; Abouzid, A. 2000. Thidiazuron
stimulates shoot regeneration of sugarcane embryogenic callus. In Vitro Cell Dev Biol Plant , 36:37-40.
10. García, R.; Cidade, D.; Castellar, A.; Lips, A.; Magioli, C.; Callado, C.;
otros. 2007. In vitro morphogenesis patterns from shoot apices of sugarcane are determined by light and type of growth regulator. Plant Cell Tiss Organ Cult , 90:181-190.
11. Gill, R.; Malhotra, P.; Gosal, S. 2006. Direct plant regeneration from
cultured young leaf segments of sugarcane. Plant Cell Tissue and Organ Culture , 84:227-231.
12. Heinz, D.; Mee, J. 1969. Plant differentiation from callus tissue of
Saccharum species. Crop Sci. , 9:346-348. 13. Heller-Uszynska, K.; Uszynski, G.; Huttner, E.; Evers, M.; Carlig, J.;
Caig, V.; y otros. 2010. Diversity Arrays Technology effectively reveals DNA polymorphism in a large and complex genome of sugarcane. Mol Breeding, Publicado en línea.
14. Ho, W.J.; Vasil, I. 1983. Somatic embryogenesis in sugarcane (Saccharum
officinarum L.) I. The morphology and physiology of callus formation and the ontogeny of somatic embryos. Protoplasma , 118:169-180.
15. Hoarau, J. ; Offman, B. ; D'Hont, A. ; Risterucci, A. ; Roques, D. ;
Glaszmann, J., y otros. 2001. Genetic dissection of a modern cultivar (Saccharum spp.). I. Genome mapping with AFLP. Theoretical and Applied Genetics , 103:84-97.
16. Krikorian, A.; Berquam, D. 1969. Plant cell and tissue culture: the role of
Haberlandt. Bot. Rev. , 35:59-88.

101
17. Lakshmanan, P. 2006. Somatic embryogenesis in sugarcane -an addendum to the invited review 'Sugarcane Biotechnology: The Challenges and Oportunities'. In Vitro Cell Dev. Biol. Plant , 42:201.205.
18. Lakshmanan, P.; Geijskes, R.; Aitken, K.; Grof, C.; Bonnett, G.; Smith, G.
2005. Sugarcane Biotechnology: The challenges and opportunities. In vitro Cell. Dev. Biol. Plant. , 41:345-363.
19. Le Cunff, L.; Garsmeur, O. ; Raboin, L. ; Pauquet, J. ; Telismart, H.; Selvi,
A. ; y otros. 2008. Diploid/Polyploid Syntenic Shuttle Mapping and Haplotype-Specific Chromosome Walking Toward a Rust Resistance Gene (Bru1) in Highly Polyploid Sugarcane (2n=12x=115). Genetics , 180:649-660.
20. Leu, L. 1978. Apical meristem culture and redifferentiation of callus masses
to free sugarcane systemic diseases. Plant Protection Bulletin , 20:77-82. 21. Maldonado, A.; Ovalle, W.; Márquez, J.M.; Quemé, J.L. 2009.
Caracterización de cepas del hongo Metarhizium anisopliae Metchnikoff y determinación de su presencia en el suelo a través de marcadores moleculares. Informe final proyecto FODECYT 066-2006. CONCYT, Guatemala.
22. Meyer, G.; Banasiak, M.; Keeping, N.; Pillay, N.; Parfitt, R.; Snyman, S.
2010. Novacane as a tool for rapid propagation of material for the SASRI plant breeding programme. Sugar Cane International , 28(6):246-248.
23. Moore, P. 2005. A personal view on coordinating international progress in
sugarcane improvement and linking biotechnology to application. International Sugar Journal Vol. 107: 27-31.
24. Mordocco, A.; Brumbley, J.; Lakshmanan, P. 2009. Development of a
temporary immersion system (RITA) for mass production of sugarcane (Saccharum spp. interspecific hybrids). In Vitro Cell. Dev. Biol. Plant , 45:450-457.
25. Murashige, T.; Skoog, F. 1962. A revised medium for rapid growth and
bioassays with tobacco tissue cultures. Physiol Plant , 15:473-497. 26. ONU. 1992. Convenio sobre la diversidad biológica. Recuperado el 21 de
junio de 2011, de http://www.cbd.int/doc/legal/cbd-es.pdf
102
27. Oropeza, M.; Guevara, P.; De García, E.; Ramírez, J. 1995. Identification of somaclonal variants of sugarcane (Saccharum spp.) resistant to sugarcane mosaic virus via RAPD markers. Plant Molecular Biology Reporter , 13(2):182-191.
28. Parmessur, Y.; Aljanabi, S.; Saumtally, S.; Dookum-Saumtally, A. 2002.
Sugarcane yellow leaf virus and sugarcane yellows phytoplasma: elimination by tissue culture. Plant Pathology , 51:561-566.
29. Quemé, J.; Molina, L.; Melgar, M. 2005. Analysis of genetic similarity
among 48 sugarcane varieties using microsatellite DNA sequences. Proc. Int. Soc. Sugar Cane Technol., Vol. 25:592-596.
30. Roughan, P.; Waldron, J.; Glasziou, K. 1971. Starch inheritance in
Saccharum. Enzyme polymorphism for B-amylase in interspecific and intergeneric hybrids. Proceedings of the International Society of Sugar Cane Technologists , 14:257-265.
31. Shiromani, W.; Basnayake, V.; Moyle, R.; Birch, R. 2010. Embryogenic
callus proliferation and regeneration conditions for genetic transformation of diverse sugarcane cultivars. Plant Cell Rep , Publicado en línea.
32. Tawar, P.; Sawant, R.; Dalvi, S.; Nikam, A.; Kawar, P.; Devarumath, R.
2008. An assessment of somaclonal variation in micropropagated plants of sugarcane by RAPD markers. Sugar Tech , 10(2):124-127.
33. Taylor, P.; Dukic, S. 1993. Development of an in vitro culture technique
for conservation of Saccharum spp. hybrid germplasm. Plant Cell Tissue and Organ Culture , 34:217-222.
34. Vasil, I. 2008. A history of plant biotechnology: from the Cell Theory of
Schleiden and Schwann to biotec crops. Plant Cell Rep. , 27:1423-1440. 35. Wu, K.; Burnquist, W.; Sorrells, M.; Tew, T.; Moore, P.; Tanksley, S.
1992. The detection and estimation of linkage in polyploids using single-dose restriction fragments. Theoretical and Applied Genetics , 83:294-300.
103
V. CROP ESTABLISHMENT WORK
104
SOIL PREPARATION FOR SUGARCANE PLANTING
Joel García, Braulio Villatoro, Fernando Díaz y Gil Sandoval*
INTRODUCTION Soil preparation is the combination of mechanized tasks that provides to sugarcane seed (vegetative reproduction) the right conditions to stimulate good “germination” (emerging) and vigorous canopy and root mass growth. For good “germination”, sugarcane seed requires an adequate relationship among soil, air, water and temperature. The optimal development of the leaf mass will result in better use of solar radiation and a high rate stalk production; also, a suitable root development will provide nutrients, water, oxygen and foliage support to the crop during its exploitation years until its total renovation. The benefits obtained with the proper soil preparation are: stools destruction and removal of residues and weeds from previous crops, favoring the chemical and biological activity, facilitating gas exchange required by the soil´s flora and fauna; soil pest control by burying Froghopper eggs or by exposing larvae of white grubs and wireworms, also improves water infiltration and subsurface drainage; soil preparation contributes to brake compacted layers favoring the roots penetration and its subsequent development (Campollo, 1999). Despite the importance of soil preparation for planting, care should be taken for not over doing it because this can result in damaging and in an inadequate preparation as well. Soil moisture content is very important in order to set the best time to perform further preparation. The agricultural soil management under ideal humidity reduces compaction, tractor’s tensile strength, the tractor’s and implements wear and tear, fuel consumption and operating costs, resulting all this in a better agronomic work.
* Agr. Eng. Joel García Manager Head of Land Preparation at Pantaleon Sugar Mill, www.pantaleon.com;
Agr. Eng. Braulio Villatoro, Specialist in Information Systems for Precision Agriculture CENGICAÑA, www.cengicana.org; Agr. Eng. Fernando Diaz Head, Department of Agricultural Engineering San Diego S.A.Sugar Mill, www.sandiego.com.gt and Agr. Eng. Gil Sandoval Head of the Adaptation and Soil Preparation La Unión Sugar Mill, www.launion.com.gt
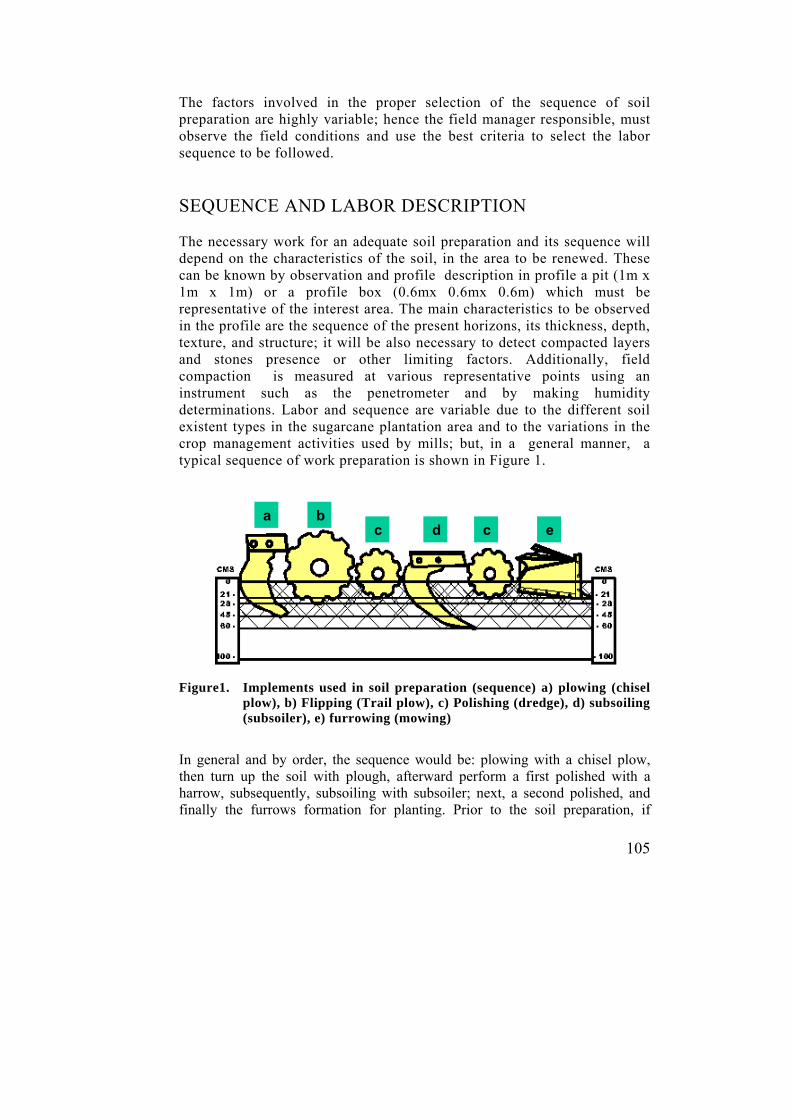
105
The factors involved in the proper selection of the sequence of soil preparation are highly variable; hence the field manager responsible, must observe the field conditions and use the best criteria to select the labor sequence to be followed.
SEQUENCE AND LABOR DESCRIPTION The necessary work for an adequate soil preparation and its sequence will depend on the characteristics of the soil, in the area to be renewed. These can be known by observation and profile description in profile a pit (1m x 1m x 1m) or a profile box (0.6mx 0.6mx 0.6m) which must be representative of the interest area. The main characteristics to be observed in the profile are the sequence of the present horizons, its thickness, depth, texture, and structure; it will be also necessary to detect compacted layers and stones presence or other limiting factors. Additionally, field compaction is measured at various representative points using an instrument such as the penetrometer and by making humidity determinations. Labor and sequence are variable due to the different soil existent types in the sugarcane plantation area and to the variations in the crop management activities used by mills; but, in a general manner, a typical sequence of work preparation is shown in Figure 1.
Figure1. Implements used in soil preparation (sequence) a) plowing (chisel
plow), b) Flipping (Trail plow), c) Polishing (dredge), d) subsoiling (subsoiler), e) furrowing (mowing)
In general and by order, the sequence would be: plowing with a chisel plow, then turn up the soil with plough, afterward perform a first polished with a harrow, subsequently, subsoiling with subsoiler; next, a second polished, and finally the furrows formation for planting. Prior to the soil preparation, if
ecdcba
106
location and distance from the mill make it economically viable, industrial filter cake residues (“cachaza”) can be applied. This compound is hauled by trucks and deposited in piles distributed throughout the planting lot area, leaving a uniform layer on the surface. This is accomplished using a rimmed tractor with 150 to 175 HP pulling a bulldozer. It is recommended to do this application before 72 hours, in order to prevent the material compaction and fermentation and the subsequent generation of gases and bad smells. The function of each work in the field and the specific function of implement are listed below: Plowing This activity is performed in compacted soil layers with resistance values higher than 200 psi. It is made by inserting parabolic pieces of equipment on the soil, spaced 0.45 m between each other, not exceeding 0.45 m in depth for loam soils, for clays, 0.30 m is advised. The chisel plow consist of parabolic bodies held in a tool bar, which is pulled by a rimmed tractor with 320 HP for five piece equipment and 215 HP for three piece equipment. Operating speed goes from 4.5 to 5.5 km per hour. The result of this activity is a substrate on which sugar cane plants will develop properly. The chisel plowing labor is vertical, and its main characteristic is to propitiate to loosen the soil, deeper than the common plow or disc plows trail, without turning or mixing the layers of the soil profile, which allows the maintainance of the internal structure of the soil. The chisel plow labor is done parallel to the furrows, and could need a second step performed in a 45 ° orientation. This is usually performed after subsoiling. The labor is usually done in a transverse direction at 90 ° to the given direction of the furrow (Daza Rodriguez, 1995). The quality of this work is measured by the degree of fracturing of the compact layer, which in turn, is closely related to soil texture and moisture content, and the implement used as well; also depends on the speed and direction of the operation. The plough cuts, lifts, and removes the topsoil, burying the stubble and crop residues, aerating the soil by increasing its porosity and allowing a benefitial weeds, diseases, and pests control. The depth depends on the equipment. In the case of soil pests, some observed results have shown a control up to 70 per cent if it is waiting eight days between the soil turning out and the following labor (Campollo, 1999). Among the advantages of the chisel plow are the next: a) removes compacted layers and imperfections caused by successive passage of disks to the same depth, b) replaces the use of subsoiler, in soils with compaction at depths below of 0.45 m, c) in some cases can replace a plow labor step, d) leaves noridges or dead furrows during the operation and maintains the internal soil structure.
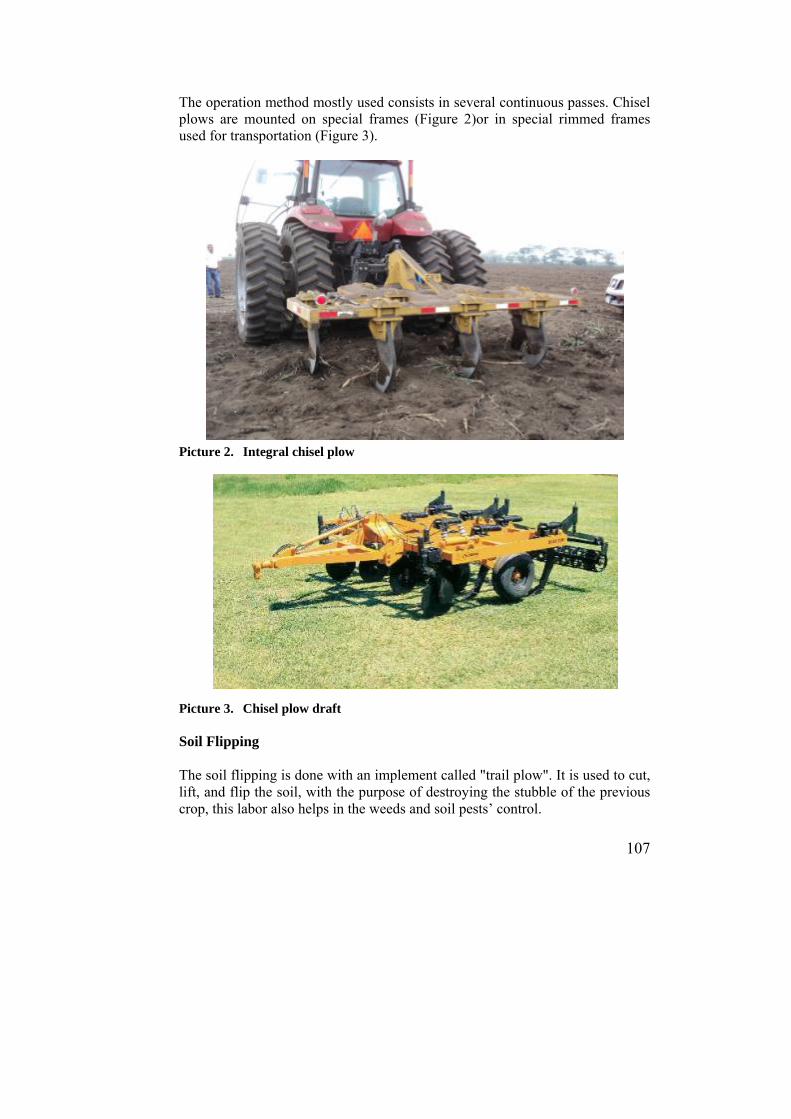
107
The operation method mostly used consists in several continuous passes. Chisel plows are mounted on special frames (Figure 2)or in special rimmed frames used for transportation (Figure 3).
Picture 2. Integral chisel plow
Picture 3. Chisel plow draft Soil Flipping The soil flipping is done with an implement called "trail plow". It is used to cut, lift, and flip the soil, with the purpose of destroying the stubble of the previous crop, this labor also helps in the weeds and soil pests’ control.
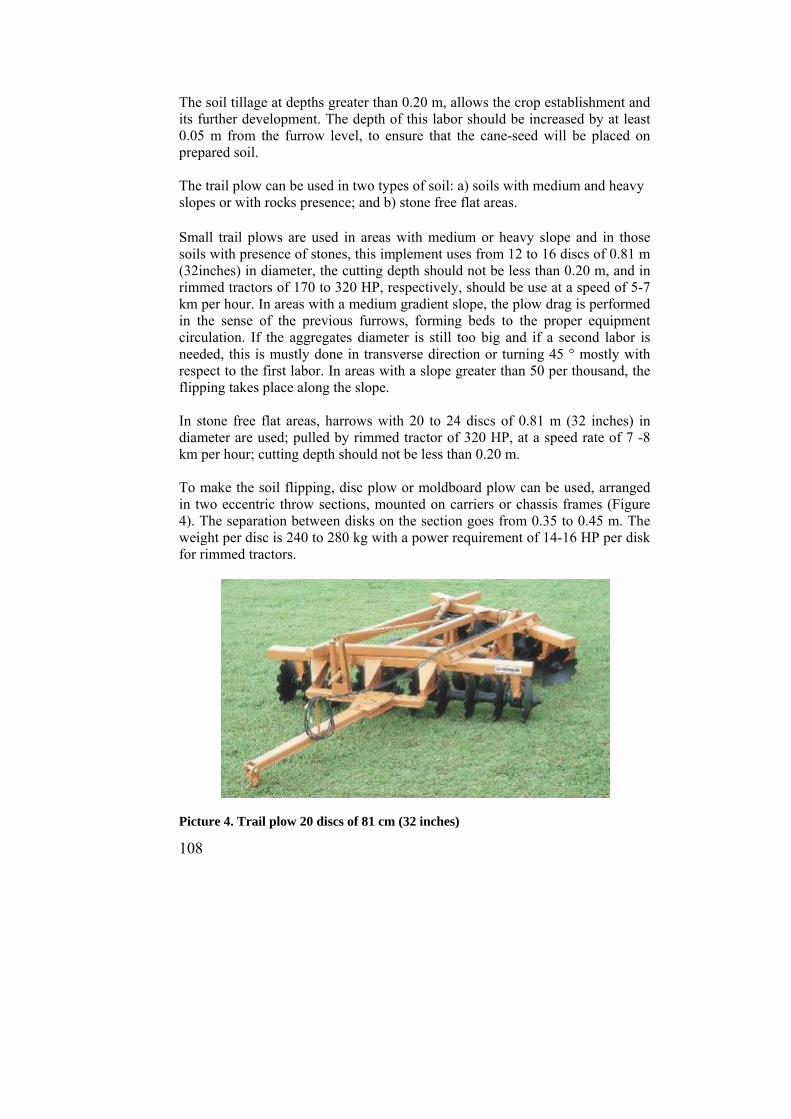
108
The soil tillage at depths greater than 0.20 m, allows the crop establishment and its further development. The depth of this labor should be increased by at least 0.05 m from the furrow level, to ensure that the cane-seed will be placed on prepared soil. The trail plow can be used in two types of soil: a) soils with medium and heavy slopes or with rocks presence; and b) stone free flat areas. Small trail plows are used in areas with medium or heavy slope and in those soils with presence of stones, this implement uses from 12 to 16 discs of 0.81 m (32inches) in diameter, the cutting depth should not be less than 0.20 m, and in rimmed tractors of 170 to 320 HP, respectively, should be use at a speed of 5-7 km per hour. In areas with a medium gradient slope, the plow drag is performed in the sense of the previous furrows, forming beds to the proper equipment circulation. If the aggregates diameter is still too big and if a second labor is needed, this is mustly done in transverse direction or turning 45 ° mostly with respect to the first labor. In areas with a slope greater than 50 per thousand, the flipping takes place along the slope. In stone free flat areas, harrows with 20 to 24 discs of 0.81 m (32 inches) in diameter are used; pulled by rimmed tractor of 320 HP, at a speed rate of 7 -8 km per hour; cutting depth should not be less than 0.20 m. To make the soil flipping, disc plow or moldboard plow can be used, arranged in two eccentric throw sections, mounted on carriers or chassis frames (Figure 4). The separation between disks on the section goes from 0.35 to 0.45 m. The weight per disc is 240 to 280 kg with a power requirement of 14-16 HP per disk for rimmed tractors.
Picture 4. Trail plow 20 discs of 81 cm (32 inches)
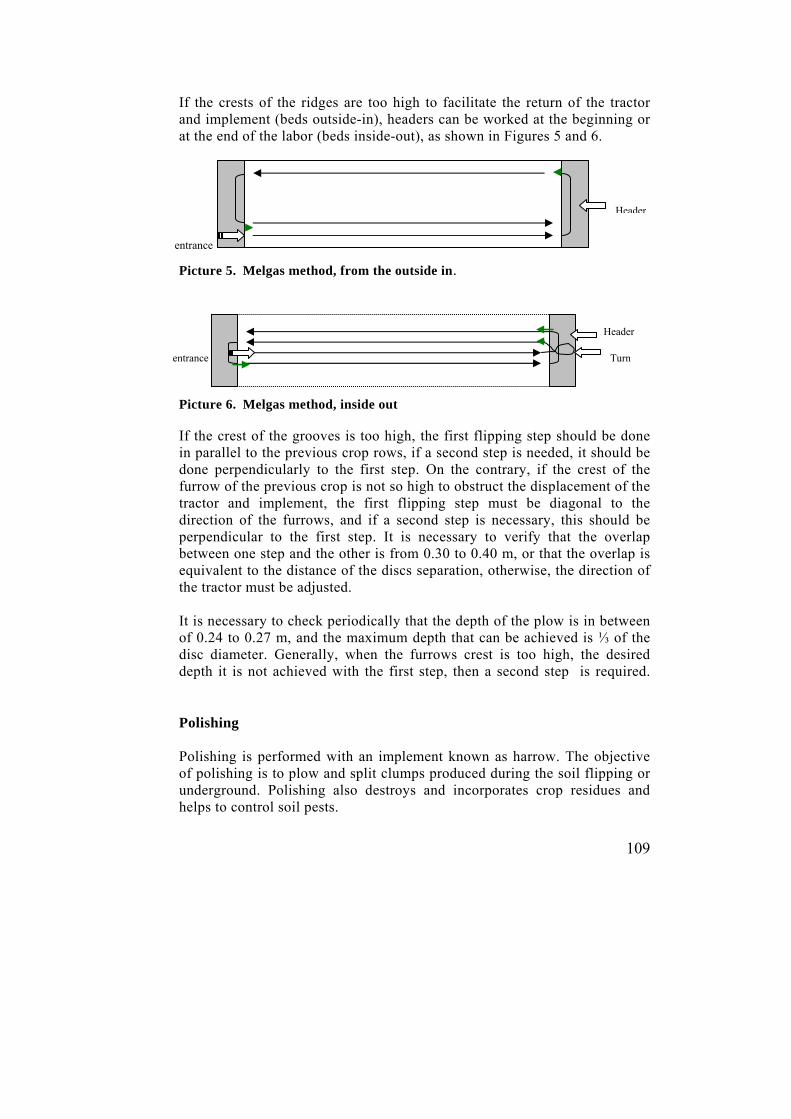
109
If the crests of the ridges are too high to facilitate the return of the tractor and implement (beds outside-in), headers can be worked at the beginning or at the end of the labor (beds inside-out), as shown in Figures 5 and 6.
Picture 5. Melgas method, from the outside in.
Picture 6. Melgas method, inside out If the crest of the grooves is too high, the first flipping step should be done in parallel to the previous crop rows, if a second step is needed, it should be done perpendicularly to the first step. On the contrary, if the crest of the furrow of the previous crop is not so high to obstruct the displacement of the tractor and implement, the first flipping step must be diagonal to the direction of the furrows, and if a second step is necessary, this should be perpendicular to the first step. It is necessary to verify that the overlap between one step and the other is from 0.30 to 0.40 m, or that the overlap is equivalent to the distance of the discs separation, otherwise, the direction of the tractor must be adjusted. It is necessary to check periodically that the depth of the plow is in between of 0.24 to 0.27 m, and the maximum depth that can be achieved is ⅓ of the disc diameter. Generally, when the furrows crest is too high, the desired depth it is not achieved with the first step, then a second step is required. Polishing Polishing is performed with an implement known as harrow. The objective of polishing is to plow and split clumps produced during the soil flipping or underground. Polishing also destroys and incorporates crop residues and helps to control soil pests.
Turn
Header
entrance
Header
entrance
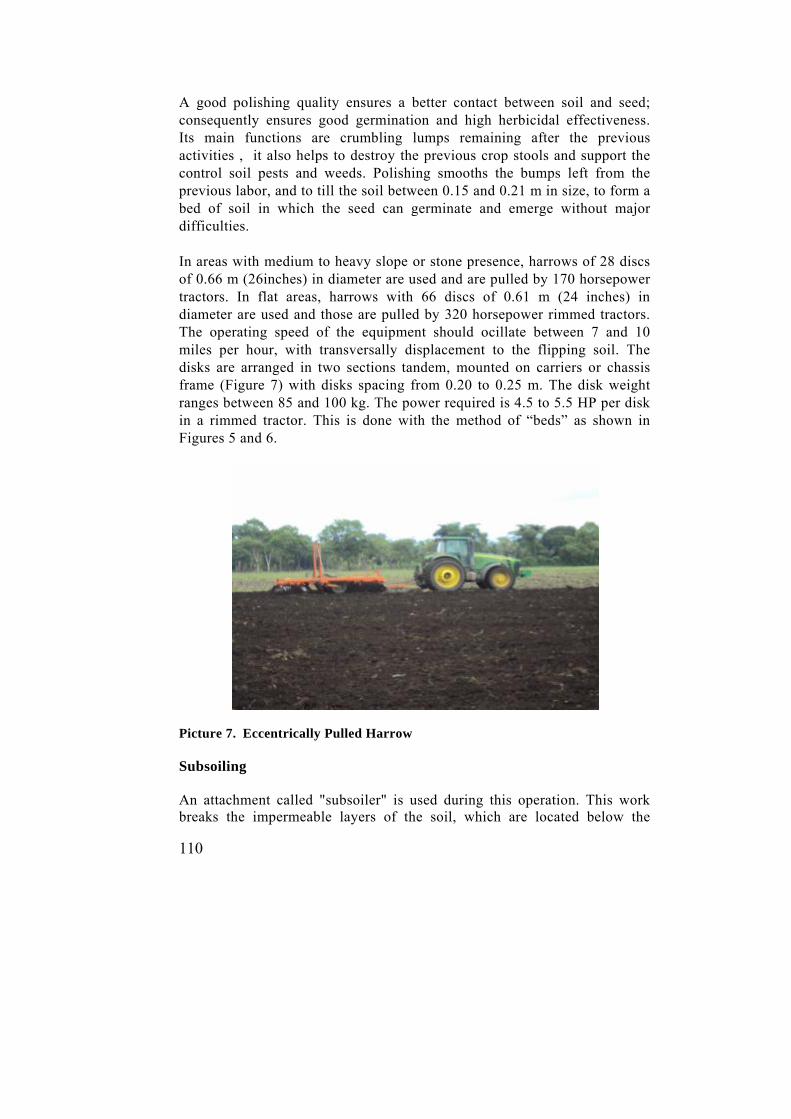
110
A good polishing quality ensures a better contact between soil and seed; consequently ensures good germination and high herbicidal effectiveness. Its main functions are crumbling lumps remaining after the previous activities , it also helps to destroy the previous crop stools and support the control soil pests and weeds. Polishing smooths the bumps left from the previous labor, and to till the soil between 0.15 and 0.21 m in size, to form a bed of soil in which the seed can germinate and emerge without major difficulties. In areas with medium to heavy slope or stone presence, harrows of 28 discs of 0.66 m (26inches) in diameter are used and are pulled by 170 horsepower tractors. In flat areas, harrows with 66 discs of 0.61 m (24 inches) in diameter are used and those are pulled by 320 horsepower rimmed tractors. The operating speed of the equipment should ocillate between 7 and 10 miles per hour, with transversally displacement to the flipping soil. The disks are arranged in two sections tandem, mounted on carriers or chassis frame (Figure 7) with disks spacing from 0.20 to 0.25 m. The disk weight ranges between 85 and 100 kg. The power required is 4.5 to 5.5 HP per disk in a rimmed tractor. This is done with the method of “beds” as shown in Figures 5 and 6.
Picture 7. Eccentrically Pulled Harrow Subsoiling An attachment called "subsoiler" is used during this operation. This work breaks the impermeable layers of the soil, which are located below the
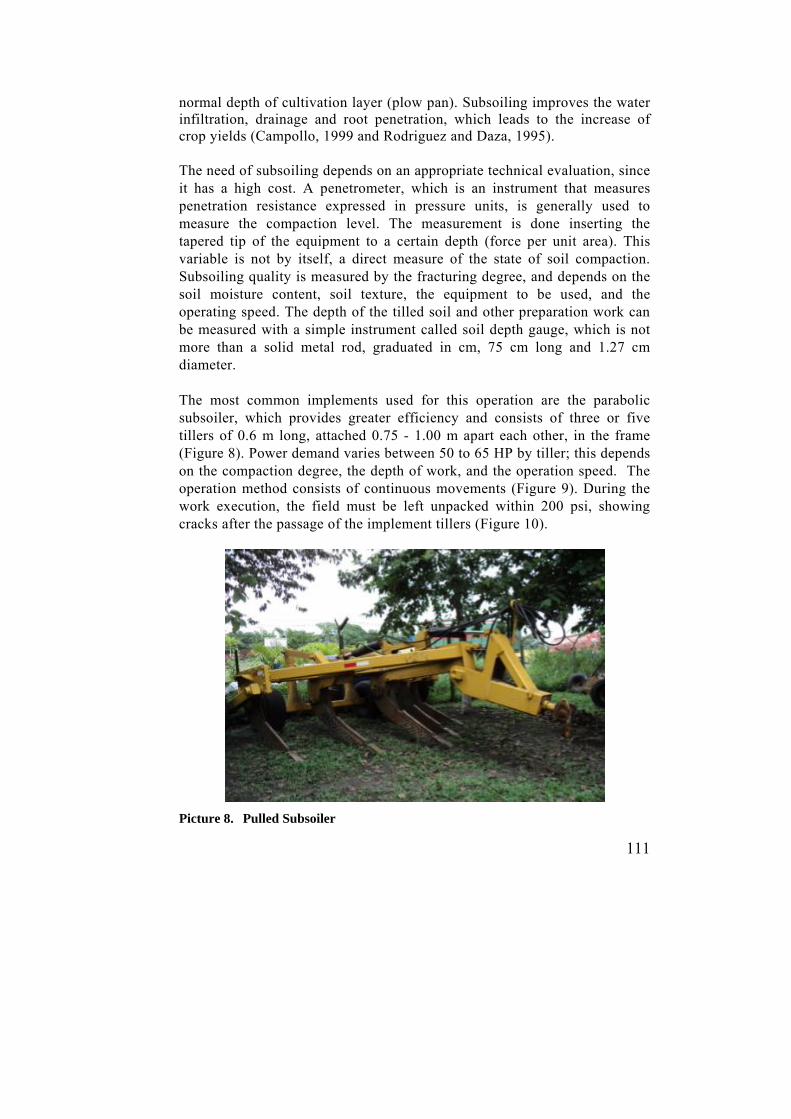
111
normal depth of cultivation layer (plow pan). Subsoiling improves the water infiltration, drainage and root penetration, which leads to the increase of crop yields (Campollo, 1999 and Rodriguez and Daza, 1995). The need of subsoiling depends on an appropriate technical evaluation, since it has a high cost. A penetrometer, which is an instrument that measures penetration resistance expressed in pressure units, is generally used to measure the compaction level. The measurement is done inserting the tapered tip of the equipment to a certain depth (force per unit area). This variable is not by itself, a direct measure of the state of soil compaction. Subsoiling quality is measured by the fracturing degree, and depends on the soil moisture content, soil texture, the equipment to be used, and the operating speed. The depth of the tilled soil and other preparation work can be measured with a simple instrument called soil depth gauge, which is not more than a solid metal rod, graduated in cm, 75 cm long and 1.27 cm diameter. The most common implements used for this operation are the parabolic subsoiler, which provides greater efficiency and consists of three or five tillers of 0.6 m long, attached 0.75 - 1.00 m apart each other, in the frame (Figure 8). Power demand varies between 50 to 65 HP by tiller; this depends on the compaction degree, the depth of work, and the operation speed. The operation method consists of continuous movements (Figure 9). During the work execution, the field must be left unpacked within 200 psi, showing cracks after the passage of the implement tillers (Figure 10).
Picture 8. Pulled Subsoiler

112
In Picture 9. Suboiling Method in continues movements
Figure 10. Soil breaking during the work Furrowing This labor is done with the “ridger” or “furrower” implement. It builds parallel furrows, distributed along straight or curved rows previously designed and established by the agricultural design process. The furrows are made from 1.50 m to 1.75 m apart from each other; their depth is 0.15 0.25 m in conventional tillage, and 0.25 - 0.35 m for crops planted under high moisture conditions. The purpose of this labor is to prepare a bed of soil in which the seed can settle and emerge properly, and also to allow crop development. In addition to ridge,
Distance between breakage 0.75 m.
Distance between breakage 0.75 m.
CROOK
BREAKS

113
granular fertilizers based on phosphorus and / or potassium may be applied, insecticide for soil pest control can be done as well, adapting special equipment to the structure (Figure 11). This work can be ended with furrowers with two, three or four bodies mounted on an integral tool bar. The power required depends on the size of the equipment, depth of work and operation speed. The operation speed in the field can be 6 to 10 km per hour under normal conditions.
Picture 11. Furrower of three bodies with equipment to apply fertilizer and
insecticide Furrower Calibration For the “furrower” calibration, the next steps must be accomplished: • Place the tractor with the implement on a flat ground. • Check that the distance between the furrower bodies is the required for the
field to be worked. • Adjust the equipment longitudinally, with the third tractor’s fitting point, in
order to regulate the angle of incidence of the furrow forming bodies. • Adjust the implement transversely using the lifting arms until the tips of
each furrower body touch the flat ground at once. • Check that furrow depth for conventional tillage is between 0.15 to 0.25 m
and 0.25 - 0.35 m when planting under high moisture conditions.
114
• Adjust the position of the markers in the furrower to make the distance between overlapping rows would be the same between one passing and the other (variation less than 5 percent).
• Currently the global positioning system (GPS), allows performing the furrowing operation without the use of markers. These systems work with correction mechanisms through RTK antenna, providing a better equidistance and parallelism among the rows.
BIBLIOGRAPHY 1. Campollo, P. S. 1999. Fundamentos de mecanización agrícola para caña de
azúcar. Ingenio Pantaleon. Guatemala. 43 p. 2. Storino, M.; Peche, A.; Hiroaki, S. A. 2010. Aspectos operacionais do
preparo de solo. In: Cana-de-açucar. Ed. Dinardo-Mirandda LL., Vasconcelos AN., Landell MG. Campinas. 1ª. Ed. – 1ª. Reimpresao. Sao Paulo, Brasil. pp. 547-572.
3. Rodríguez, C. A.; Daza, O. H. 1995. Preparación de Suelos. En: El cultivo
de la caña en la zona azucarera de Colombia. Cassalett, C.; Torres, J.; Isaacs, C. (eds.). Cali, Colombia. pp. 109-114.
4. Faveri, J. H.; Juárez, A. 1992. Manual de mecanización del campo cañero.
Grupo de Países Latinoamericanos y del Caribe Exportadores de Azúcar (GEPLACEA). México. 40 p.
115
NURSERIES AND COMMERCIAL PLANTING
Werner Ovalle, José Luis Quemé, Héctor Orozco and Ovidio Pérez
NURSERIES Sugarcane Nurseries Establishment In the sugarcane profitable plantations establishment, one of the important issues is the nurseries planning, in order to obtain high quality asexual seed. This seed should gather several characteristics: genetic, physiological, sanitary, and physical quality. Also several factors that are related with the establishment of sugarcane nurseries should be taken into account. Location, size and nursery planting planning: The nursery should be located in a strategic place to reduce transportation costs to the other nursery areas or commercial fields. The size of the nursery depends on the final commercial planting area. If it is considered that, semi-commercial and commercial nurseries will be in production, then two increments cycles will occur, starting in the “basic nursery”. Usually, the rate of stalk-seed multiplication in sugarcane is 1:10, then, the area of basic nursery must be the thousandth part of the final commercial area, that is, if someone wants to plant 1,000 hectares of commercial sugarcane, then the basic nursery should be 1 hectare, the semi commercial nursery 10 hectares, and finally, the commercial nursery 100 hectares. Nurseries planting dates will depend on the date on which the planting of the commercial field will take place. It is necessary to take into account that the proper age of the seed is seven months for most varieties. An example might be: if someone wants to make commercial planting on January 15, 2014, then the commercial planting of commercial nursery would be June 15, 2013; the semi commercial nursery planting on November 15, 2012 and the basic nursery on April 15, 2012. That means that the planning of the commercial planting must be made two years in advance. It is important also to consider the reduction of time between cutting the seed, and nursery establishment and commercial planting.
Werner Ovalle is Agr. Eng, M.Sc., Plant Pathology; José Luis Quemé is Agr. Eng, Ph.D., Plant breeder; Héctor Orozco is Agr. Eng, M.Sc., Sugarcane Breeding and Selection Program leader; Ovidio Pérez is Agr. Eng, M.Sc., Agronomy Program Leader at CENGICAÑA. www.cengicana.org

116
Area management before planting of nurseries: To sugarcane nurseries planting, the location of areas whose potential yield is better than the average of the farm and ideally with irrigation availability is recommended. (South African Sugar Association, 1999). It is convenient to divide the area into three parts: one third dedicated to the first ratoon nursery, other third to plant nursery, and the last third for resting, and waiting for the next nursery planting. Proper handling of previous plantings avoids the presence of crop residues or stools, which can turn in undesirable plant mixtures within the desired variety and also could be infected with pathogens. For avoiding this, the burning of residues of the previous crop is recommended. Subsequently, the stools of previous cultivar should be killed, using an herbicide, 35 to 40 days after harvest. The recommended dose and product are 4 to 5 liters per hectare of glyphosate (Montepeque, 2007). Rotations with leguminous plants for their incorporation as green manure, were evaluated in areas designated for nurseries, and the results are promising, in the third of the nursery waiting area. Rotations with green manure, further of providing nitrogen, it improves structure and preserve the soil. Rotations also are able to break the soil, pests and diseases cycles, and restore biodiversity. Rotation is advised either with Crotalaria juncea or Cannavalia ensiformis. These two leguminous plant species are well adapted to the soil and climate where sugar cane is grown in the south coast of Guatemala. It has been estimated that C. juncea can produce up to 35 metric tons of fresh biomass per hectare in relatively poor soils with a total contribution of 235 kg of nitrogen per hectare. Under favorable weather conditions and high fertility soils C. juncea can produce up to 50 tons of fresh biomass, with a total contribution of more than 300 kg N / ha (Perez et al., 2008, Balañá et al., 2010). Soil preparation for planting of legumes matches with common labors used to grow sugar cane. One to two weeks after of herbicide application to kill the old stools, plowing is performed, which depending on the soil; consists of one or two passings of Breaking plow and after, one or two passings of Leveling plow (leveling). This ensures a good bed for seed germination of legumes. Planting of rotation plant is made immediately after leveling, sowing in furrows with spacing of 0.5 to 0.6 meters between rows for both legumes. For C. juncea plant one or two seeds per hole is recommended, with a distance of 0.10 m between holes, whereas for C. ensiformis sowing one or two seeds per hole every 0.2 meters, is suggested. With these distances, the average amount of seed used is about 15-20 kg / ha in the case of Crotalaria and 100-150 kg / ha for Cannavalia.
117
Depending on the altitude stratum and the planting date, the maximum accumulation of biomass occur between 60 and 75 days after planting in the lower stratum, and this in most cases, corresponds to the onset of flowering. In the higher stratum, where growth is slower, this can be extended to 120 days. The biomass is incorporated mechanically, through two passings of plow that allow a good incorporation of the material to a depth of 0.15 m to 0.20 m. The furrowing and sugarcane planting must be made in the first two weeks after green manure incorporation, in order to take advantage of the availability of nitrogen from mineralization of green manure. Hot water treatment of the seed: For the systemic bacteria pathogen control, as the causal agent of the ratoon stunting disease (Leifsonia xyli subsp. xyli) and leaf scald (Xanthomonas albilineans), hot water treatment is important. It has been demonstrated the production increasing of sugar per area by removing those pathogens. For L. xyli, the average differences in production of healthy and infected nine varieties were 7.88 percent, 16.47 percent and 21.38 percent, in cultivated cane, first ratoon and second ratoon, respectively, which a represented up to 26.9 tons of cane per hectare on average in the second ratoon (Ovalle and García, 2006). For X. albilineans, the differences in sugar production between healthy and disease plants were 8.69 percent and 2.48 percent for two varieties with different susceptibility levels to the disease (Ovalle, 2002). Due to these differences in the resistance of L. xyli and X. albilineans to the heat, it has been experimentally determined the better treatment for each of these pathogens (CENGICAÑA, 2001; Egan and Sturgess, 1980). For L. xyli, any of the following two treatments to the seed is recommended: a) Dip inmersion in hot water at 51oC for 10 minutes, followed by resting out of water for 8 to 12 hours and finally, inmersion in hot water at 51oC through one hour, b) Hot water treatment at 52oC for 30 minutes. In both cases, seedpieces (setts) with one or two buds should be used. It has been shown that either described treatments can decrease the amount of cells of L. xyli to undetectable levels using the serological test "dot blot immunoassay". In the case of the second depicted treatment, 52oC for 30 minutes, further losses of the buds germination can occur (seven percent more losses on average in three studied varieties) (Ovalle et al., 2001). If records show the seed rotting due to soil fungal infection or termites infestations, it is desirable that after hot water treatment, the cutting surfaces are protected by fungicide application (Captan+ carboxin) 25 grams per gallon, and insecticide (Fipronil) 8 cc per gallon during two minutes (Azañón et al., 2005). It is important to emphasize that immersion in fungicide and insecticide is recommended only if there have been problems in previous plantings in the used fields.
118
Most varieties evaluated by CENGICAÑA have shown increases in sugarcane production when treated thermally, compared with L. xyli infected plant material. Therefore, hydrothermal treatment to control the ratoon stunting disease is recommended in any of the varieties to be used commercially. For X. albilineans control, immersion of one or two bud setts in a constant water flow, at room temperature for 48 hours is recommended. It can be made in a tank with a controlled water flow to allow the continuous overflow water renewal, and thus prevent the fermentation. After that, the seed-pieces are dipped in water at 50°C for three hours. Steindl, cited by Egan and Sturgess (1980) showed that such treatment can completely eliminate the infection by the leaf scald. Taking the necessary precautions to prevent reinfection by X. albilineans, in subsequent cycles, treatments can be made at 52oC for 30 minutes (the same short treatment used to L. xyli control). Since some sugarcane cultivars are resistant to infection by X. albilineans, it is not necessary to subject them to specific hydrothermal treatment for that bacteria. Care must be taken to avoid reinfection by systemic pathogens: Fungi, bacteria, or viruses are Systemic pathogens found in at least one infection stage, located into the plant vascular system and / or within their tissues. Due to this factor, an important way of systemic disease dissemination in sugar cane is through the use of infected seed pieces. As it was mentioned, it is possible to obtain systemic pathogen free seed pieces, which drives to healthy plants in the nursery; reinfection of these nurseries should be avoided to maintain good quality seed. Both for the ratoon stunting disease and for leaf scald, the causing bacteria, can be transported through the tools, for that reason, the next recommendations must be taken into account: 1) Use of specific tools, equipment, and clothes for each work in the nurseries. 2) Avoid the use of machinery in nursery areas, after having been used in commercial fields. 3) Make machetes disinfection by dipping them for 30 seconds, in a 5 percent Iodine solution (Victoria et al., 1985), or by washing them with detergent, and burning them with ethanol at 95 percent of purity. (Ovalle and Nelson, 2005). In tasks carried out in the nursery (tilling or seed cutting), such disinfections should be done as often as possible. It has been found that this kind of care eliminate the possibility of reinfection in seed-pieces free from L. xyli infection (Victoria et al., 1985; Ovalle and Nelson, 2005). 4)In the leaf scald case, if stools with disease symptoms are observed in the nurseries, they should be eliminated by applying the Glyphosate (Roundup 35.6 s.l.) at a dose which can be in between of 250 and 500 ml in 20 liters of water as follows: cover the hand with a chlorinated latex glove and with a sock, then introduce covered hand in the Glyphosate solution to soak the sock. Rub the scald infected leaf stool until the top, with careful, to cover the top as far as
119
the tip leaves. Immediately, bend the tip of the stool to be left as marked. The effect is observed from 8 to 10 days after treatment, and it has the advantage of avoiding the damage to surrounding stools and mechanical dissemination of the bacterium too (Mayén, 2007; Sáenz, 2007). The described procedure can also be used to remove stools of unwanted clones (remnants or mixtures into the row) and Johnson grass plants (Sorghum halepense) or itchgrass plants (Rottboellia cochinchinensis) growing within the nurseries into the sugarcane rows. All the described care to achieve nurseries free from systemic diseases caused by L. xyli and X. albilineans is useless, if the commercial field management does not also includes certain precautions to reduce reinfection; that is: the disinfection of the cutting tools, which can be made as recommended for nurseries, as often as possible (at least every time the change of labors from one plot to another is made) and although, initially, this activity seems to represent decreases in efficiency of cutting the benefits will be more. Nurseries sampling for detection of pathogens which cause ratoon stunting disease and leaf scald disease Age of Plant: To detect the ratoon stunting disease bacterium, the best results are obtained from sampling seven months of age plants. For leaf scald bacterium, sampling can be made from four months of age, but for practical reasons, it is better to use the same stalks sampled to ratoon stunting disease, at seven months of age. Sample size: Regardless of the size area of the nursery, the sample for laboratory analysis must be 50 stalks. The stalks should be obtained randomly, covering the entire area of the nursery, without regard, if stalks are primary, secondary, tertiary or "suckers" and, therefore, regardless its diameter size. Useful portion of the stalks: For detection of the bacterium that causes the ratoon stunting disease (L. xyli) it is required the sampling of the basal portion of the stalk (the lower third). Therefore, the stalks are cut off at ground level and 50 pieces must be sent to the lab, with four or five internodes from the base, all in the same position (the bases on the same side). To detect the bacterium that causes leaf scald (X. albilineans) is required the upper portion of the stalk (upper third). Therefore, the stalks are cut out in half and 50 pieces from the upper half of the stalks, without tips are sent to the laboratory, all in the same position (the tips to the same side).
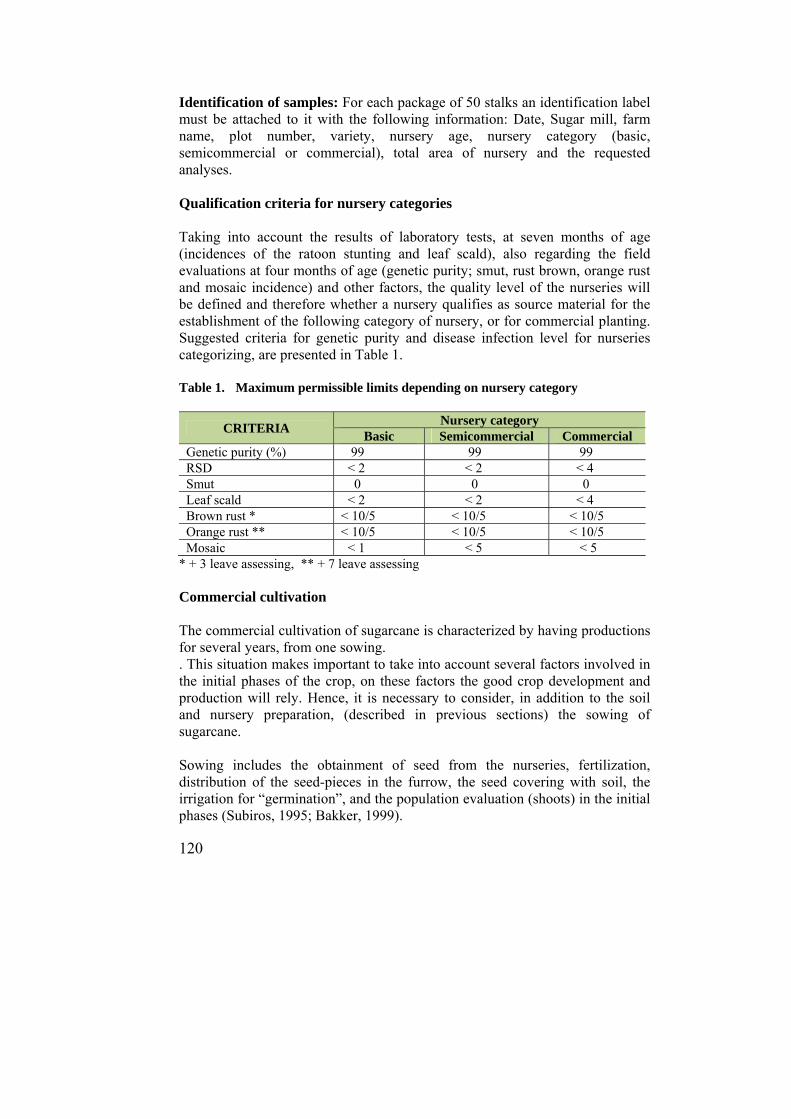
120
Identification of samples: For each package of 50 stalks an identification label must be attached to it with the following information: Date, Sugar mill, farm name, plot number, variety, nursery age, nursery category (basic, semicommercial or commercial), total area of nursery and the requested analyses. Qualification criteria for nursery categories Taking into account the results of laboratory tests, at seven months of age (incidences of the ratoon stunting and leaf scald), also regarding the field evaluations at four months of age (genetic purity; smut, rust brown, orange rust and mosaic incidence) and other factors, the quality level of the nurseries will be defined and therefore whether a nursery qualifies as source material for the establishment of the following category of nursery, or for commercial planting. Suggested criteria for genetic purity and disease infection level for nurseries categorizing, are presented in Table 1. Table 1. Maximum permissible limits depending on nursery category
CRITERIA Nursery category
Basic Semicommercial Commercial Genetic purity (%) 99 99 99 RSD < 2 < 2 < 4 Smut 0 0 0 Leaf scald < 2 < 2 < 4 Brown rust * < 10/5 < 10/5 < 10/5 Orange rust ** < 10/5 < 10/5 < 10/5 Mosaic < 1 < 5 < 5
* + 3 leave assessing, ** + 7 leave assessing
Commercial cultivation The commercial cultivation of sugarcane is characterized by having productions for several years, from one sowing. . This situation makes important to take into account several factors involved in the initial phases of the crop, on these factors the good crop development and production will rely. Hence, it is necessary to consider, in addition to the soil and nursery preparation, (described in previous sections) the sowing of sugarcane. Sowing includes the obtainment of seed from the nurseries, fertilization, distribution of the seed-pieces in the furrow, the seed covering with soil, the irrigation for “germination”, and the population evaluation (shoots) in the initial phases (Subiros, 1995; Bakker, 1999).
121
Varieties and sowing date For choosing the varieties to be planted, the "Sugarcane Variety Directory" (described in the Sugarcane Breeding and Selection chapter) should be consulted. This directory was developed by the Sugarcane breeding and selection program of CENGICAÑA and the Variety Release Committee of the Sugar Agro-industry of Guatemala. This directory includes the current commercial varieties and new varieties that are in commercial development. It is a matrix, whose first row are the planting/harvest months (from November to April) and the altitudinal strata appear in the first column; therefore the varieties are located in the month and stratum where the sugar production and other interesting features are optimized. Seed quality Seed should have different characteristics, such as the genetic quality (varietal purity), health (free from pests and diseases), physic (stalk vigor without mechanical damage, mixtures and others) and physiological state (Tarenti, 2004). For physiological quality, the seed age, the good condition of buds and the good germination, should be considered, also the time between cutting and planting, and others issues should be regarded. These elements must be evaluated throughout the entire process of the nurseries production, which are finally evaluated to define whether they have the necessary conditions for the seed using or not. Densities and planting systems Single furrow method: : it is the most used in Guatemala. There must be prepared packages of seed of 30 pieces with approximately 0.60 m of length and preferably with 3-4 buds per piece. The distance between rows can be from 1.5 m to 1.75 m, depending on topography, field production potential, altitude, variety and other factors such as the type of harvest (manual or mechanized) and the availability of suitable machinery for each case. Planting is done manually and the cuttings can be distributed in different ways, being one of them the "double overlapping chain", which is achieved by placing approximately 15 viable buds per lineal meter when the seed have good quality, ensuring thus a good population density in the furrows. The spacing to distribute a package of 30 cuttings in the furrow (“estaquillado” in Spanish) depends on the variety and quality of the seed, usually are 9 m. According to Orozco et al., 2000, in assessments conducted by CENGICAÑA it has been found that “estaquillado” of 12 m shows results similar to those of 9 m. Planting depth ranges from 0.20 m to 0.35 m. In traditional planting (with irrigation), seed-pieces should be covered with approximately 0.05 m of soil, while without irrigation planting, coverage must be from 0.10 m to 0.15 m.

122
Double furrow method: This method is also known as "Australian furrow” or "Pineapple type”. The distance between simple furrows of each pair can be from 0.40 m to 0.70 m, and the distance among the pairs of furrows can befrom 1.40 m to 1.80 m. With this type of modifications, the density of stalks per hectare is increased, therefore the adjustments in fertilizer levels, “ripener” doses and others, should be considered. Fertilization and irrigation for germination The phosphorus fertilizer must be applied at the same time of the furrows opening and the amount to be applied depends on the soil type and the phosphorus content determined in a previous soil analysis. The lamina irrigation depends on soil texture, making the first irrigation of germination between the moment of covering of the seed-pieces and 24 hours after planting, applying a lamina of 30 mm. The second irrigation germination is between 8 and 10 days after the first germination irrigation, applying a lamina of 40 mm. In the “Pineapple type” system drip irrigation can be used, placing the distribution hoses at the center of the two each pair of furrows. Evaluation of the population and the replanting The evaluation of the plant population has the aim to determine the success of the planting and for making decisions in case of replanting. From 30 to 40 days after planting, a counting of the plant population (shoots per linear meter) must be performed, and a population of 10 shoots per meter is considered suitable, assuming near of 70 percent of germination. Where spaces of more than 0.75 m along the furrow without shoots are found, replanting must be done only on those empty spaces.
BIBLIOGRAPHY 1. Azañón, V.; Portocarrero, E.; Solares, E.; Guevara, L.; Ovalle, W. 2005.
Efecto de tres calidades de semilla en la producción de dos variedades de caña de azúcar. In: Memoria. Presentación de resultados de investigación. Zafra 2004-2005. Guatemala, CENGICAÑA. pp. 54-58.
2. Balañá, P.; Pérez, O.; Alfaro, M. A.; Fernández, M. V. 2010. Crotalaria
juncea, Canavalia ensiformis and Mucuna sp. As Possible Nitrogen Sources for Fertilisation in Sugarcane Commercial Nurseries. Proc. Int. Soc. Sugar Cane Technol., Vol. 27.
123
3. Bakker, H. 1999. Sugar cane cultivation and management. Kluwer academic/Plenum Publishers. New York.
4. BSES. Sugarcane for the future. Ratoon Stunting Disease. 5. http://www.bses.org.au/InfoSheets/IS05053.pdf. Consulta del 23-07-07.
9:25 a.m. 6. Egan, B.T.; Sturgess, O. W. 1980. Commercial control of leaf scald disease
by thermotherapy and a clean seed programme. Proc. Int. Soc. Sugar Cane Technol., 26:1602-1606.
7. Mayén, Mario. 2007. Comunicación personal. Febrero 2007. 8. Montepeque, Romeo. 2007. Comunicación personal. Febrero 2007. 9. Orozco, H.; Ceballos, L.; Azañón V. 2000. Aumento de la distancia de
estaquillado. Una opción viable para la reducción de la cantidad de semilla agámica por unidad de área. In: Memoria Presentación de resultados de investigación. Zafra 1999-2000. Guatemala, CENGICAÑA. pp. 31-37.
10. Ovalle, W.; López, E.; Cojtín, J.; Azañón, V.; González, A.; Oliva, E. 2002.
Efecto de cuatro enfermedades en la producción de la caña de azúcar en la zona sur de Guatemala. In: MEMORIA. 14 Congreso de la Asociación de Técnicos Azucareros de Centroamérica. pp. 93-99.
11. Ovalle, E.; García, S. 2006. Efecto de la enfermedad del Raquitismo de las socas (Leifsonia xyli subs. xyli) en el rendimiento de caña de nueve variedades. Segunda soca. In: Memoria. Presentación de resultados de investigación. Zafra 2005-2006. Guatemala, CENGICAÑA. pp. 95-99.
12. Ovalle, W.; López, E.; Oliva, E. 2001. Evaluación de cinco tratamientos
hidrotérmicos para el control de Raquitismo de las socas. In: Memoria. Presentación de resultados de investigación. Zafra 2000-2001. Guatemala, CENGICAÑA. pp. 63-65.
13. Ovalle, W.; Nelson, A. 2005. Efecto de la enfermedad del Raquitismo de las
socas (Leifsonia xyli subs. xyli) en la producción de nueve variedades. In: Memoria. Presentación de resultados de investigación. Zafra 2004-2005. Guatemala, CENGICAÑA. pp. 49-53.
124
14. Pérez, O.; Hernández, F.; López, A.; Balañá, P.; Solares, E. y Maldonado A. 2008. El uso de abonos verdes como alternativa para mejorar la productividad y sostenibilidad del cultivo de la caña de azúcar. Sugar Journal, Vol. 70, No. 9. 14-21 p.
15. Sáenz, Oswaldo. 2007. Comunicación personal. 16. Soto, G.; Orozco, H.; Ovalle, W. 1997. Multiplicación y certificación de
semilla asexual de caña de azúcar (Saccharum spp) para la Agroindustria Azucarera Guatemalteca. Guatemala, CENGICAÑA. Documento Técnico No. 12. 37 p.
17. Subiros Ruiz, F. 1995. El cultivo de la caña de azúcar. San José C. R. Ed.
UNED reimpresión 2000. 448 p. 18. South African Sugar Association. Experimental Station. 1999. Seedcane.
Good quality seedcane. Information Sheet. 3 p. 19. Tarenti, O. 2004. Calidad de semilla, lo que implica y como evaluarla.
Consultado 17 de Agosto de 2011. http://www.inta.gov.ar/sanluis/info/documentos/Semillas/Cal_semillas.htm
20. Victoria, J. I.; Guzmán, M. L.; Ochoa, O. 1985. Chemicals used to
disinfect tools in order to limit the spread of ratoon disease of sugarcane. CENICAÑA. Colombia. Documento Técnico No. 69. 8 p.
125
VI. WEED CONTROL AND MANAGEMENT
126
WEED CONTROL AND MANAGEMENT
Gerardo Espinoza
INTRODUCTION
Weed control and management development has had several phases. First, the intensive use of herbicides, followed by mechanical work sequence integration and herbicide use as a second line of defense. Second, herbicide molecules rotation, dose reduction and application of less polluting molecules; and finally, weeds control through the use of precision agriculture, green manures, and herbicide-tolerant varieties. The critical period of weed interference in sugarcane production occurs in the first 120 days, after cutting or planting. Therefore, in the sugar industry pre-emergence and post-emergence herbicides applications are the basis for weed control, combined with mechanical control that help, in some way, to control weeds. Among the most important weeds in the zone are: Cyperus rotundus, Rottboellia cochinchinensis; weeds from Convulvulaceae family (Ipomoea and Merremia), and Sorghum halapense, Cynodon dactylon, among others. These weeds cause several complications in crop management, which can be summarized in production loss and overspending. It is important to know the strategies for herbicide selection, which must be founded on technical criteria related with environmental variables, edapho-climatic issues, cultural practices, and also, physical and chemical properties of selected herbicide. The aim of this chapter is to describe the management and rational recommendations of weed management to the Guatemalan sugarcane industries.
MAJOR WEEDS OF GUATEMALA’S SUGARCANE REGION The major weeds of Guatemala’s sugarcane regions are listed in order of importance in Table 1. “Coco-grass” (Cyperus rotundus), is the most
Agr. Eng., M.Sc., Specialist in Weeds and Ripeners at CENGICAÑA www.cengicana.org
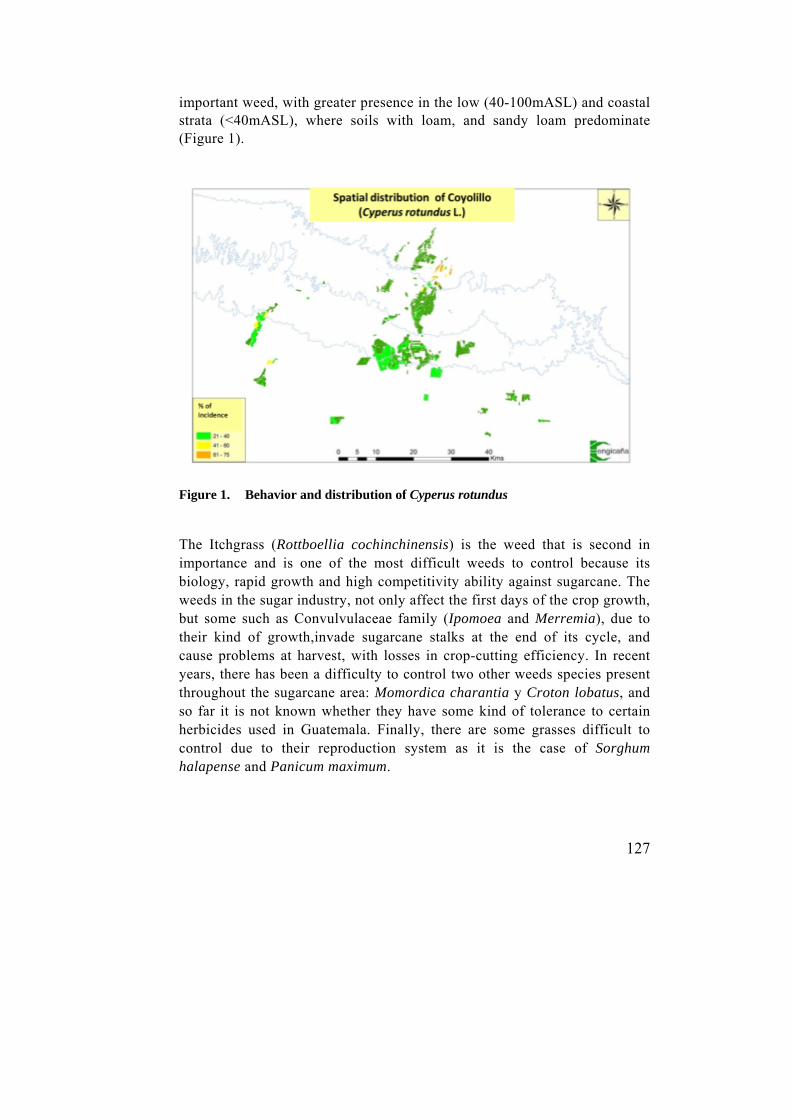
127
important weed, with greater presence in the low (40-100mASL) and coastal strata (<40mASL), where soils with loam, and sandy loam predominate (Figure 1).
Figure 1. Behavior and distribution of Cyperus rotundus The Itchgrass (Rottboellia cochinchinensis) is the weed that is second in importance and is one of the most difficult weeds to control because its biology, rapid growth and high competitivity ability against sugarcane. The weeds in the sugar industry, not only affect the first days of the crop growth, but some such as Convulvulaceae family (Ipomoea and Merremia), due to their kind of growth,invade sugarcane stalks at the end of its cycle, and cause problems at harvest, with losses in crop-cutting efficiency. In recent years, there has been a difficulty to control two other weeds species present throughout the sugarcane area: Momordica charantia y Croton lobatus, and so far it is not known whether they have some kind of tolerance to certain herbicides used in Guatemala. Finally, there are some grasses difficult to control due to their reproduction system as it is the case of Sorghum halapense and Panicum maximum.
128
Table 1. Guatemala’ sugar industry major weeds in order of importance
No. Weed Scientific Name Cyperaceae
1 Coco-grass, Purple Nut Sedge Cyperus rotundus Gramineae 2 Itchgrass Rottboellia cochinchinensis 3 Red Sprangletop Leptocloa filiformis 4 Johnson grass, Johnson, Sorghum Sorghum halapense 5 Guinea grass, Buffalo grass Panicum maximum 6 Bermuda grass Cynodon dactylon Broadleaf 7 Snakevine, Wood roses Merremia quinquefolia 8 Picotee morning glory, Japanese
morning glory Ipomoea nil
9 Littlebell, Aiea morning glory Ipomoea triloba 10 Bittermelon, Bittergourd or Bitter
squash Momordica charantia
11 Lobed croton Croton lobatus 12 Desert horse purslane Trianthema portulacastrum 13 Verdolaga, Pigweed, Little
hogweed Portulaca oleraceae
14 Big Caltrop Kallstroemia maxima
Crop interference with growing weeds In Agriculture, the term “interference” refers to the sum of pressures on a particular crop, as a result of weed presence in the common environment, including competition and allelopathy concepts. Weeds have the ability to compete for limiting environmental resources (mainly water, light and nutrients), by releasing allelopathic substances, harbor pests and diseases, and especially affecting the crop yields, by reducing the number of plantation cuts (harvests). The degree of interference depends on other factors of competition, duration, and time of occurrence, modified by soil and climatic factors and by management factors. It is important to mention that the crop itself has the ability to limit weed growth, primarily through shading. According to Meirelles et al., (2009), there are three critical periods for the weed interference: a) Period before weed interference (PBI), b) Total period of interference (TPI) c) Critical period of weed interference (CPWI).
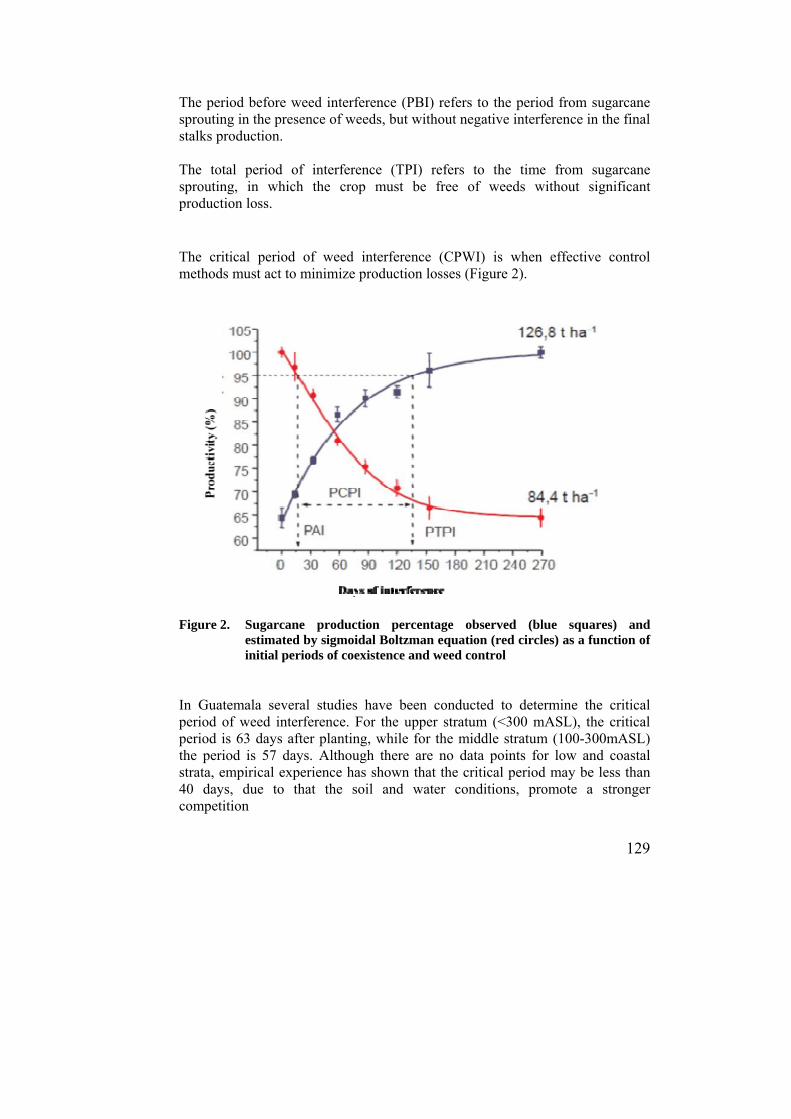
129
The period before weed interference (PBI) refers to the period from sugarcane sprouting in the presence of weeds, but without negative interference in the final stalks production. The total period of interference (TPI) refers to the time from sugarcane sprouting, in which the crop must be free of weeds without significant production loss. The critical period of weed interference (CPWI) is when effective control methods must act to minimize production losses (Figure 2). Figure 2. Sugarcane production percentage observed (blue squares) and
estimated by sigmoidal Boltzman equation (red circles) as a function of initial periods of coexistence and weed control
In Guatemala several studies have been conducted to determine the critical period of weed interference. For the upper stratum (<300 mASL), the critical period is 63 days after planting, while for the middle stratum (100-300mASL) the period is 57 days. Although there are no data points for low and coastal strata, empirical experience has shown that the critical period may be less than 40 days, due to that the soil and water conditions, promote a stronger competition

130
Weed control methods In Guatemala, two methods are used for sugarcane weed control: a) mechanical control and b) chemical control. Mechanical control: Refers to the use of different implements as part of the mechanical work carried out in the crop. Among those mechanical works is the “step tiller” which aims to level the ridge between rows in plant-cane. This work is done at 40 or 50 days after planting, controlling weeds for about 15 days, depending on infestation conditions. Optionally, a second step tiller can be made between 55 and 65 days after achieving integrated management with chemical control. In ratoons, cultural work will be 45 days after cutting, i.e. after pre-emergence herbicide application. A second mechanical control can be performed 60 days after harvest. Chemical control: Involves herbicide application. This method is of ample and easy use in sugarcane crop and with successful control results. The combination of the two indicated methods is used to achieve longer periods of control. Herbicide application can be done in three ways: a) mechanized, b) manual, and c) aerial. -Mechanized application: It is commonly used in Guatemala; involves pre-emergence and post-emergence herbicide application through sprayers mounted to 120HP tractors. These sprayers are composed of a reservoir tank for mixing, and a boom with 25 nozzles depending on its type, distributed in a band of 12m width. This type of application is generally for flat areas, in order to be more efficient. When making post-emergence applications in further developed cane (up to 1.5m) “High Crop” tractors are used. -Manual application: This is practiced where it is not possible to control weeds mechanically, because of sugarcane development (closed) or in areas of irregular topography. It is also performed to control weeds in specific areas or small areas infested in the lot. For this type of herbicide application knapsacks with constant pressure are used, which are more efficient than the traditional ones. This practice is more expensive than the mechanized practice, that’s why, it should be evaluated whether use it or not, in areas which really deserve it. -Aerial application: It is only used for pre-emergent herbicide application in flat areas, located away from other crops, due to damages that it may cause.
131
FACTORS AFFECTING HERBICIDE EFFICIENCY Environmental factors Solar radiation. There are herbicides that have high evaporation losses, causing decreased effectiveness in weeds control. These losses are given by photo-decomposition of the herbicide molecule due to sunlight (ultraviolet radiation). Herbicide degradation is induced when they are applied to dry soil surface, without irrigation or rainfall. So, when pre-emergent herbicide is applied, it is recommended its incorporation into the soil to ensure product efficiency and residual effect. This operation can be performed with irrigation or rainwater. Precipitation (humidity). The rain interferes with the action of herbicides, depending on when it occurs. The occurrence of rainfall before herbicide application increases the water content in the soil and in the top plants hydrates the waxes of the leaf surface, thus increasing the plant’s susceptibility to herbicides and improving the control degree. The influence of rainfall on herbicide-uptake through leaves, also depends on the characteristic of each product, as some are absorbed quickly, and others slowly. Herbicides formulated in oil are less affected by rain than those ones that are based on water formulation. The time required for the absorption of post-emergence herbicides in plants is of great importance. This varies according to the herbicide, but generally, is about 30 minutes. Plants exposed to prolonged stress moisture, may have thicker cuticle, more pubescence, and consequently, herbicide leaf-uptake and translocation will be less, due to lower metabolic activity. Herbicide must be applied when topsoil moisture is suitable to favor herbicide molecule-binding with the soil’s solid phase, reducing the risk of losses to the atmosphere. In pre-emergent herbicide applications, soil moisture is important, due to product dispersion through the soil, reaching, seed or weed’s roots. Temperature. Air temperature influences in many ways herbicide action, they can modify physical properties such as solubility, vapor pressure and alter plant’s physiological processes. Generally, within the physiological limits of each plant, herbicide absorption by the leaves increases with temperature. High temperature increases the leaf cuticle and affects plant’s metabolic activity, also promotes the volatilization of herbicide molecules. In general, high temperature on the ground surface is a factor that enhances the loss by herbicide volatilization. There are some practices that reduce the negative impact of adverse environmental conditions, these include:
132
1.-Do not apply, when relative humidity is less than 60 percent, when temperature is higher than 35°C, and when wind speed is greater than 10km/hour. 2.-Do not apply herbicides when plants are under stress. 3.-Apply formulations less sensitive to environmental conditions. 4.-Apply at initial morning hours, late afternoon or evening. 5.-Use, if possible, large drops during pulverization. Edaphic factors Sorption. It refers to the organic molecule retention by the soil, without distinction of specific processes of adsorption, absorption, precipitation and hydrophobic partition (Oliveira et al., 2003). These specific sorption processes, can act concurrently in herbicide molecule retention. Thus, sorption of these molecules is much more complex than ions that serve as plant nutrients (Oliveira et al., 2003). Herbicide sorption involves hydrophobic interactions, physical and chemical processes in the compound that passes from the soil solution to the external and internal colloid surface. In some situations, sorbed molecules can convert in unavailable forms, called residues. Organic matter is the main residue site formation. Residue formation is an important mechanism of herbicide dissipation. While the formation of these compounds may compromise herbicide efficacy, especially residual herbicide applied to the soil, the amount of herbicide sorbed depends on the physical-chemical soil characteristics, the formulation, the applied product dose, and the climatic conditions. Plant factors Herbicides can penetrate through aerial structures (leaves, stems, flowers, and fruits) and through underground organs (roots, rhizomes, stolons, tubers, etcetera), younger structures and also seeds. Leaves. They are the weed’s main organs involved in the penetration of postemergence applied herbicides. In foliar surfaces with low epicuticular wax content, drops of applied herbicide cover large areas. In leaves with high epicuticular wax content, the leaf surface covered by herbicide, decreases. Leaves present various levels of trichomes and gland development, which may vary with the species. Leaves can intercept applied drops, preventing them to reach the epidermal surface. Although, it is stated that small absorption can occur through trichomes.
133
Cuticle and stomata. This is the main route of herbicide absorption in postemergence application. Therefore, the use of selected surfactants in the mixtures, contribute to the mixture’s surface tension breakup that is applied in the leaf, causing a better spread of the product and allowing stomata sorbs more product making an important role in the herbicides penetration. The maximum mixture’s surface tension needed to penetrate stomata is 30 dynes/cm2. The cuticle over the guard cells appears to be thinner and more permeable (less epicuticular wax), being a less rigid barrier to herbicide penetration. All weed species have stomata on both adaxial and abaxial surfaces, although most of these stomata are located on the abaxial surface of the leaf. The exact penetration mechanism is not yet known for all products, but it is admitted that the nonpolar and polar compounds follow the lipophilic and hydrophilic route, respectively.
WEED CONTROL AND MANAGEMENT Ratoon. The first weed control in ratoon is performed 3-12 days after cutting (dac), according to weeds area incidence or coverage and soil moisture. The second control should be effective around 30 to 35 dac, after verifying the soil moisture and when the maximum coverage threshold is reached (15 percent). In areas without irrigation, or low soil moisture, high solubility products should be used. The herbicide mixture and dose will be made in terms of incidence and type of weed, and the highest control days will be seek (120 days). Plant cane. In plant-cane, weed control starts 8 or 10 days after planting (dap) with a pre-emergence herbicide application after a second irrigation. Coverage, mixture, and dosage should be previously determined. The second herbicide application (post-emergence) is performed after fertilization work. It is important to define the maximum threshold and the weed development to calculate mixture and dose that will be applied. There are intermediate mechanical tasks that help achieve longer control thus, is important to note that in areas with high infestation, weeds must be uprooted and/or patching (directed applications) in the lot. In plant-cane and ratoon-cane, trials have been made in the sugarcane region with diverse soil types with the presence of “Purple Nut Sedge and “Red Sprangletop”. In these trials herbicides of the Imidazoline group (Plateau 70 WG; Arsenal 24 SL and Mayoral 350 SL) have been applied; these products have shown 64-89 percent weed control, achieving between 48-75 control days (Figure 3). Also postemergence control with Sulfonylureas herbicides (Sempra 75 WG) mixed with low 2-4D Amine dose (0.41/ha), have shown satisfactory
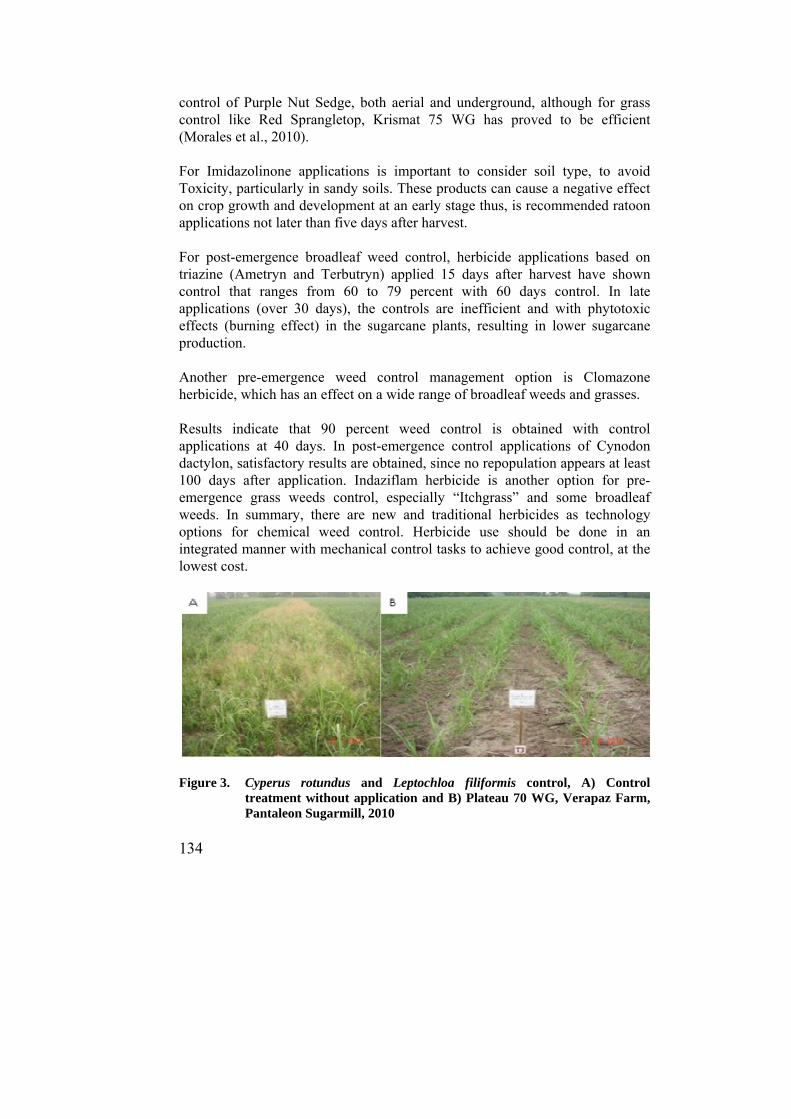
134
control of Purple Nut Sedge, both aerial and underground, although for grass control like Red Sprangletop, Krismat 75 WG has proved to be efficient (Morales et al., 2010). For Imidazolinone applications is important to consider soil type, to avoid Toxicity, particularly in sandy soils. These products can cause a negative effect on crop growth and development at an early stage thus, is recommended ratoon applications not later than five days after harvest. For post-emergence broadleaf weed control, herbicide applications based on triazine (Ametryn and Terbutryn) applied 15 days after harvest have shown control that ranges from 60 to 79 percent with 60 days control. In late applications (over 30 days), the controls are inefficient and with phytotoxic effects (burning effect) in the sugarcane plants, resulting in lower sugarcane production. Another pre-emergence weed control management option is Clomazone herbicide, which has an effect on a wide range of broadleaf weeds and grasses. Results indicate that 90 percent weed control is obtained with control applications at 40 days. In post-emergence control applications of Cynodon dactylon, satisfactory results are obtained, since no repopulation appears at least 100 days after application. Indaziflam herbicide is another option for pre-emergence grass weeds control, especially “Itchgrass” and some broadleaf weeds. In summary, there are new and traditional herbicides as technology options for chemical weed control. Herbicide use should be done in an integrated manner with mechanical control tasks to achieve good control, at the lowest cost.
Figure 3. Cyperus rotundus and Leptochloa filiformis control, A) Control
treatment without application and B) Plateau 70 WG, Verapaz Farm, Pantaleon Sugarmill, 2010
135
Herbicides used in sugarcane cultivation There are about 70 commercial products from 17 chemical families used as herbicides in Guatemala’ Sugar Agro-Industry, which information is detailed in the herbicide catalog harvest 08-09, with links to online dynamic presentations. http://www.cengicana.org/Portal/Biblioteca/PublicacionesCENGICAÑA/Manuales/CatalogoHerbicidasZafra08-09.pdf). The description of the most relevant herbicide management aspects are listed below. 1. Aryloxyphenoxypropionate: Fluazifop-p-butil. This is a post-emergence systemic herbicide used in grasses in doses of 1 to 2 L/ha. It is recommended to apply before tillering when weeds are young (5-8 leaves) and before flowering. Some species under control are: Echinochloa spp.; Setaria spp.; Cynodon dactylon; Digitaria sanguinalis; Paspalum dilatatum and Sorghum halapense. 2. Phosphonic acid: Glufosinate-ammonium. This is a post-emergence non-selective herbicide. Under water stress conditions decreases its effectiveness on broadleaf weeds. The recommended dose is in between of 1.5 and 2.5 L/ha. In high relative humidity conditions the product efficiency increases. When applied with ammonium sulphate (adjuvant) this one increases the product absorption and is highly soluble, with poor absorption into the soil. Some species under control are: Echinochloa colonum; Setaria spp.; Cynodon dactylon; Digitaria sanguinalis; Sorghum halapense; Portulaca oleraceae and Amaranthus spinosus. 3. Benzoic Acid: Dicamba. Post-emergence contact herbicide in relation to the weeds. The recommended doses range from 1 to 1.5 L/ha. It is an herbicide used on broadleaf weeds and sedge, it is recommended to mix it with water at pH less than 7. Some species under control are: Amaranthus spinosus; Bidens pilosa; Croton lobatus; Cyperus rotundus; Euphorbia heterophylla; Ipomoea nil; Kallstroemia maxima; Oxalis neaei and Richardia scabra. 4. Bipyridilium:Paraquat. These are post-emergence contact herbicides. The recommended dose ranges from 1.5 to 3L/ha. It is a herbicide used on broadleaf weeds and sedge. It is recommended to mix it in water with pH less than 7. This herbicide has a solubility (also called Log Kow) of4. It is a non-selective herbicide; therefore it has a wide weed control spectrum. 5. Cyclohexanone: Cletodium or Cletodim. This is a systemic post-emergence herbicide recommended for target applications and during summer.

136
It is used in grasses in doses from 0.12 to 0.18 kg i.a/ha. It is a herbicide that leaches rapidly and it is recommended to be applied with adjuvants, such as oils. Tank mixtures with sodium bentazone salts, must not be prepared. Some species under control are: Digitaria sanguinalis; Echinochloa spp.; Cynodon dactylon and Sorghum halapense. 6. Chloroacetamide: Acetoclor. This is a pre-emergent systemic herbicide, with relation to weeds, with poor mobility within the plant. The recommended dose is 1.4 to 1.8 kilograms of i.a/ha. This is a herbicide used in grasses and some broadleaf weeds with waxy appearance. Some species under control are; Sonchus oleraceus; Polygonum aviculare; Raphanus sativus; Digitaria sanguinalis; Croton lobatus; Echinochloa colonum; Portulaca oleraceae; Richardia scabra; Leptochloa filiformis y Rottboellia cochinchinensis (Leonardo, 1998). 7. Diphenyl ether: Oxyfluorfen. It is a post-emergence contact herbicide and for some pre-emergence weed species. Doses range from 0.5 to 2 L/ha, depending on soil type. This herbicide has a log Kow = 4.47; it is inmobilized in clay soils with high organic matter content, which affects weed control. Some of the species under control are: In post-emergence: Bidens pilosa; Ipomoea nil; Kallstroemia maxima; Panicum maximum and Portulaca oleraceae. In pre-emergence: Croton lobatus; Echinochloa colonum; Euphorbia hirta and Leptochloa filiformis. 8. Dinitroaniline: Pendimethalin: These are pre-emergence contact herbicides recommended in dose that ranges from 0.6 to 1.2 kilograms i.a. /ha. These are used on broadleaf weeds and grasses. The product is almost insoluble in water and therefore must be added in the mixture after surfactant application. It is slightly soluble with a low Kow of 5.18. Some species under control are: Digitaria sanguinalis; Echinochloa colonum; Eleusine indica; Ixophorus unisetus; Leptochloa filiformis and Rottboellia cochinchinensis. 9. Phenoxycarboxylic acid: 2, 4-D. It is a post-emergence herbicide with a recommended dose of 0.8 to 1.3 liters of i.a/ha. The application should be directed to the weeds and when the plant is in a young stage and greater physiological activity. The mixture should be done with water at pH below 7. It is a moderately soluble product with a log Kow of 2.81. Some species under control are: Amaranthus viridis; Bidens pilosa; Commelina diffusa; Croton lobatus; Cyperus flavus; Cyperus rotundus; Euphorbia hirta; Ipomoea triloba and Kallstroemia maxima. 10. Phosphonic acid: Glyphosate. These are postemergence contact herbicides in relation to weed, recommended dose is between of 0.5 and 0.8
137
kilograms of i.a/ha. It is a herbicide recommended for perennial weed directed or previous cane emergence application. The water for mixtures should have a pH of between 4 and 6. Cane phytotoxicity causes leaf chlorosis and young leaves yellowing. It is highly soluble with a log Kow of -1.6 (Alister and Kogan, 2005). Some species under control are: Brachiaria mutica; Commelina diffusa; Cynodon dactylon; Cyperus flavus; Cyperus odoratus; Cyperus rotundus; Echinochloa colonum; Panicum maximum; Sorghum halapense and Tirantia erecta. 11. Imidazoline: Imazapyr and Imazapic. These are non-selective herbicides applied to pre-emergence weeds in doses of 0.5 to 1 L/ha. They can be applied to post-emergence weed and cane, but in a targeted manner. The product has a residual effect, which is activated in humid conditions and is soluble with a log Kow of 1.30-0.16. Some species under control are: Croton lobatus; Cynodon dactylon; Digitaria sanguinalis; Echinochloa colonum; Euphorbia heterophylla; Ipomoea nil; Leptochloa filiformis and Melampodium divaricatum. 12. Isoxazole: Isoxaflutole. This is a herbicide applied in pre-emergence of the weed and cane, in doses of 100 to 400g/ha. It can be applied to posemergence weed and cane, but in a targeted manner. A phytotoxicity symptom is a cane leaf chlorosis. This herbicide is highly mobile in the plant. It has log Kow=2.50 (DKN) and 2.32 (IFT). It is recommended water pH less than 7. Some species under control are: Amaranthus spinosus; Amaranthus viridis; Digitaria sanguinalis; Echinochloa colonum; Eleusine indica and Portulaca oleracea. 13. Sulfonylureas: Trifloxysulfuron, Halosulfuron-methyl, Ethoxysulfuron, and Metsulfuron Methyl. These are herbicides applied to the weeds post-emergence weeds. The Krismat (Trifloxysulfuron) and Sempra (Halosulfuron-methyl) recommended dose are 160 to 180g/ha and 100 to 150 g/ha, respectively. They can be applied to the post-emergence weeds and cane. It is highly mobile in the plant. It has a log Kow=1.40 (Trifloxysulfuron). Some species under control are: Cyperus flavus, Cyperus odoratus and Cyperus rotundus. Krismat controls in pre-emergence and post-emergence: Amaranthus spp.; Digitaria sanguinalis; Euphorbia spp.; and Rottboellia cochinchinensis. 14. Triazine: Ametryn, Atrazine, Hexazinone, Metribuzin, Terbutryn. These are herbicides frequently used for pre-emergence weeds, with combination of several triazines to increase the weed control spectrum.
138
Metryn used doses are 1 to 1.8 kg i.a/ha. Atrazine 1 to 1.5 kg i.a/ha. Hexazinone and Metribuzin 0.5 kg i.a/ha. Soluble products, Atrazine with a log Kow of 2.34 and Hexazinone with 1.17. Some species under Atrazine and Metribuzin control are: Amaranthus spinosus; Anagallis arvensis; Bidens pilosa; Croton lobatus; Euphorbia hirta; Ipomoea nil; Kallstroemia maxima and Melampodium divaricatum. Terbutryn, Ametryn and Hexazinone control in pre-emergence and post-emergence control: Bidens pilosa; Digitaria sanguinalis; Echinochloa colonum; Ixophorus unisetus; Panicum fasciculatum; Rottboellia cochinchinensis; Leptochloa filiformis; Melanthera nicea; Cyperus flavus; Cyperus odoratus; Oxalis neaei; Portulaca oleracea and Sida rhombifolia. 15. Substituted urea: Diuron. These are contact herbicides that can be applied in pos-emergence in relation to weeds, and in some cases, they can be applied in pre-emergence. Recommended doses ranges from 1.5 to 2.5 kg i.a/ha. These are herbicides used on broadleaf weeds and some grasses. Moderately soluble product with a log Kow of 2.77. Some species under control are: In pre-emergence: Croton lobatus; Echinochloa colonum; Euphorbia hirta and Leptochloa filiformis. In post-emergence: Bidens pilosa; Ipomoea nil; Kallstroemia maxima; Panicum maximum and Portulaca oleracea. Herbicide phytotoxicity on promising sugarcane varieties Figure 4 shows sugarcane’s susceptibility and tolerance stages to applied herbicides according to their phenological stages. Stage 1 comprises from planting to 20 days, during which sugarcane regrowth shows greater cuticle thickness. At this stage, herbicide does not reach inner leaves, so the plant becomes tolerant to herbicides and weeds (Christoffoleti and Lopez, 2009). In ratoon cane, this phase is faster, thus, more residual herbicides can be considered for application. Stage 2 comprises from 20 to 50 days after planting, when there are two to three leaves; likewise there is root loss from the seed or wand, this stage is susceptible to herbicide application. In ratoon cane there is higher number of roots, thus the crop tolerates more soluble herbicide applications. Stage 3 is in between 50 and 90 days after sowing, when there are true roots. At this stage, there is severe weed competition with the crop, affecting plant tillering and making it susceptible to post-emergence herbicide application. Stage 4 or commonly called: crop closing, occurs after 120 days after planting. At this stage, the stalks are developed and defined, and they will not be affected by herbicide application.

139
Figure 4. Tolerance and susceptibility instars to sugarcane’s herbicide
application (Bezuidenhout, 2003). Adapted by Espinoza and Morales, 2010
Table 2. Tolerance or susceptibility of new or recently introduced varieties to
pre-emergence (15 days after planting dap) and post-emergence (50 dap) herbicide application
Variety of sugarcane
Herbicide tolerance Susceptibility to the herbicide Preemergence Posemergency Preemergence Posemergency
CP73-1312 Terbutryne CP72-2086 Terbutryne CG99-048 Diuron and
Terbutryne Ametryne
CG98-10 Terbutryne and Diuron
Ametryne
CP88-1165 Terbutryne and Diuron
RB87-2015 Terbutryne Terbutryne RB84-5210 Diuron RB73-2577 Terbutryne and
Diuron
CG96-78 Terbutryne, Diuron
CG98-78 Diuron CG96-135 Terbutryne SP79-1287 Terbutryne,
Diuron Terbutryne
Mex82-114 Terbutryne Terbutryne and Diuron
Diuron
140
BIBLIOGRAPHY 1. Alister, C.; Kogan, M. 2005. ERI Environmental risk index. A simple
proposal to select agrochemicals for agricultural use. Crop Protection., v. 25, n. 3, p. 202-211.
2. Bezuidenhout, N.; O'Learya, J.; Singelsa, G.; Bajicb V. 2003. A process-
based model to simulate changes in tiller density and light interception of sugarcane crops. Agricultural Systems Volume 76, Issue 2, P. 589-599.
3. Christoffoleti, P.; López, R. 2009. Comportamento dos herbicidas, aplicados ao solo na cultura da cana-de-açúcar. 1era Edición, CP 2, Piracicaba, SP. 72 p.
4. Espinoza, J. G. 2009. Acumulación de sacarosa y función de glifosato como
madurante en caña de azúcar. Guatemala: CENGICAÑA. 7 p. 5. Espinoza, J. G. 2010. Evaluaciones de herbicidas en la agroindustria cañera
de Guatemala. Presentaciones de resultados 2008-2009-2010 Comité de malezas y madurantes. CENGICAÑA. Presentación Power Point 15 diapositivas.
6. Meirelles, G.; Alves, P. L. C. A.; Nepomuceno, M.P. 2009. Determinação
dos períodos de convivência da cana-soca com plantas daninhas. Planta Daninha, Viçosa-MG, V. 27, n. 1, p. 67-73,
7. Leonardo, A. 1998. Manual para la identificación y manejo de las
principales malezas en la caña de azúcar en Guatemala. Guatemala, CENGICAÑA. 131 P.
8. Morales, J.; Pérez, V.; Garita, I. 2010. Evaluación de la eficiencia de
Sempra 75 WG (Halosulfuron metil) + 2,4-D, en el control de coyolillo (Cyperus spp).Informe Técnico, Ingenio Pantaleon-Duwest. 2010. 5 p.
9. Oliveira, P.; Silva, A.; Vargas, L.; Ferreira, F. 2003. Manejo de plantas
daninhas na cultura da caña de açúcar. Vicosa, MG. 150 p. 10. Ufer, C.; Mejía, M. 2010. Mapeo de la distribución de malezas en la zona
cañera del ingenio Pantaleon. Informe de resultados, Departamento de Agronomía. 15 p.
141
VII. CROP NUTRITION AND FERTILIZATION
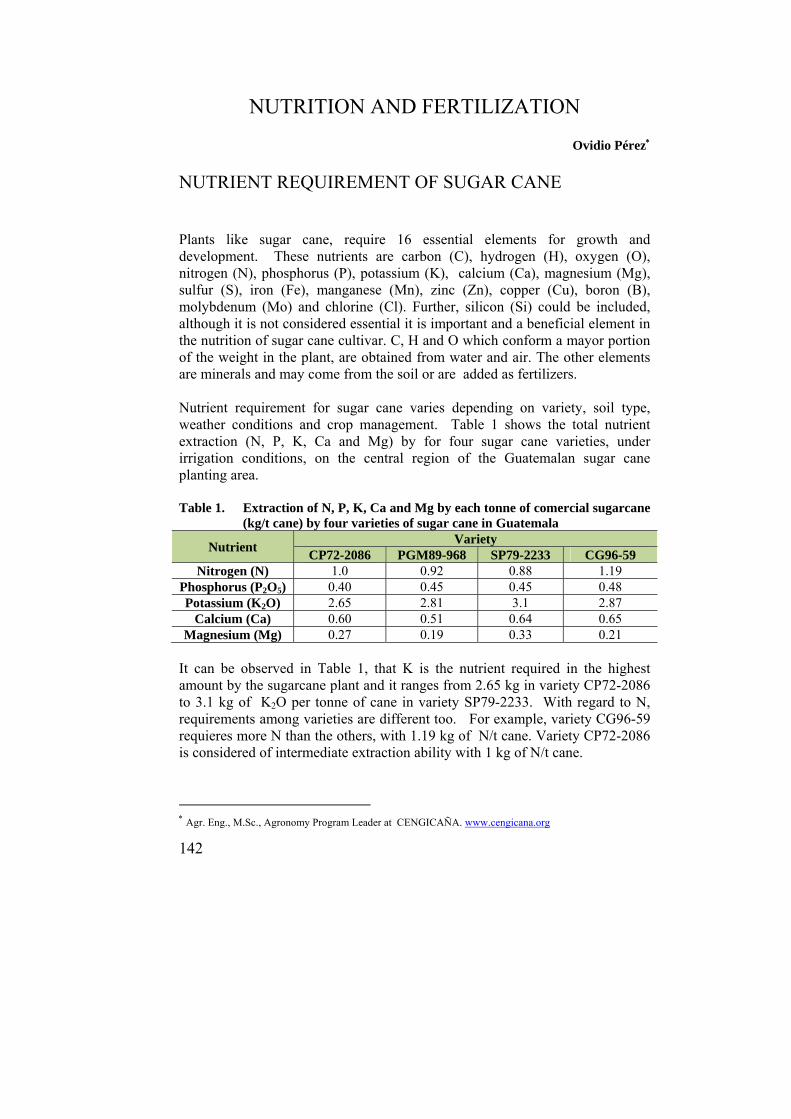
142
NUTRITION AND FERTILIZATION
Ovidio Pérez NUTRIENT REQUIREMENT OF SUGAR CANE Plants like sugar cane, require 16 essential elements for growth and development. These nutrients are carbon (C), hydrogen (H), oxygen (O), nitrogen (N), phosphorus (P), potassium (K), calcium (Ca), magnesium (Mg), sulfur (S), iron (Fe), manganese (Mn), zinc (Zn), copper (Cu), boron (B), molybdenum (Mo) and chlorine (Cl). Further, silicon (Si) could be included, although it is not considered essential it is important and a beneficial element in the nutrition of sugar cane cultivar. C, H and O which conform a mayor portion of the weight in the plant, are obtained from water and air. The other elements are minerals and may come from the soil or are added as fertilizers. Nutrient requirement for sugar cane varies depending on variety, soil type, weather conditions and crop management. Table 1 shows the total nutrient extraction (N, P, K, Ca and Mg) by for four sugar cane varieties, under irrigation conditions, on the central region of the Guatemalan sugar cane planting area. Table 1. Extraction of N, P, K, Ca and Mg by each tonne of comercial sugarcane
(kg/t cane) by four varieties of sugar cane in Guatemala
Nutrient Variety
CP72-2086 PGM89-968 SP79-2233 CG96-59 Nitrogen (N) 1.0 0.92 0.88 1.19
Phosphorus (P2O5) 0.40 0.45 0.45 0.48 Potassium (K2O) 2.65 2.81 3.1 2.87
Calcium (Ca) 0.60 0.51 0.64 0.65 Magnesium (Mg) 0.27 0.19 0.33 0.21
It can be observed in Table 1, that K is the nutrient required in the highest amount by the sugarcane plant and it ranges from 2.65 kg in variety CP72-2086 to 3.1 kg of K2O per tonne of cane in variety SP79-2233. With regard to N, requirements among varieties are different too. For example, variety CG96-59 requieres more N than the others, with 1.19 kg of N/t cane. Variety CP72-2086 is considered of intermediate extraction ability with 1 kg of N/t cane.
Agr. Eng., M.Sc., Agronomy Program Leader at CENGICAÑA. www.cengicana.org

143
Varieties such as SP79-2233 and PGM89-968 have smaller requirements with lower extraction values such as 0.88 and 0.92 kg of N/t of commercial cane. The lower requirements of N for these two varieties could be associated to the presence of efficient nitrogen fixing bacteria as reported in a study on biological fixation of nitrogen where isotopic 15N techniques were used (Pérez et al., 2005). Nitrogen Nitrogen is an essential component of aminoacids, nucleic acids, chlorophyll and other pigments and it also takes part in all enzymatic processes. Nitrogen is absorbed by the plant roots in the form of ammonium (NH4
+) and nitrate (NO3-)
ions (Mengel and Kirkby, 2000). Lack of nitrogen is manifested in poor development of the whole plant, poor stunting ability, thin, raquitic stalks and pale yellowish green tone of the leaves (Figure 1). Symptms appear first on older leaves due to the mobility of this element in the plant.
Figure 1. Sugar cane variety CP73-1547 on a Mollisol soil with residual humidity, in
the coast area. a) without N application it presents general deficiency symptoms. b) with 130 kg of N/ha applied as urea. Finca Santa Elena, San Diego Sugar Mill.
Forms of N in the soil: Soil N can be found mainly in organic forms (more than 95%, in general), bound to C in humus of in plant cells (dead of alive), microorganisms and small animals (Allison, 1973); only a very small amount is found in mineral forms. The organic forms on soil N are not available for plants and they should be transformed into mineral forms (NH4
+ y NO3-) through the soil
microorganisms, so they can be used by the plant roots. This is how mineralization of organic N, coming from organic matter (OM) is an important source of available N for the plants. Mineralization rate of the soil organic N is
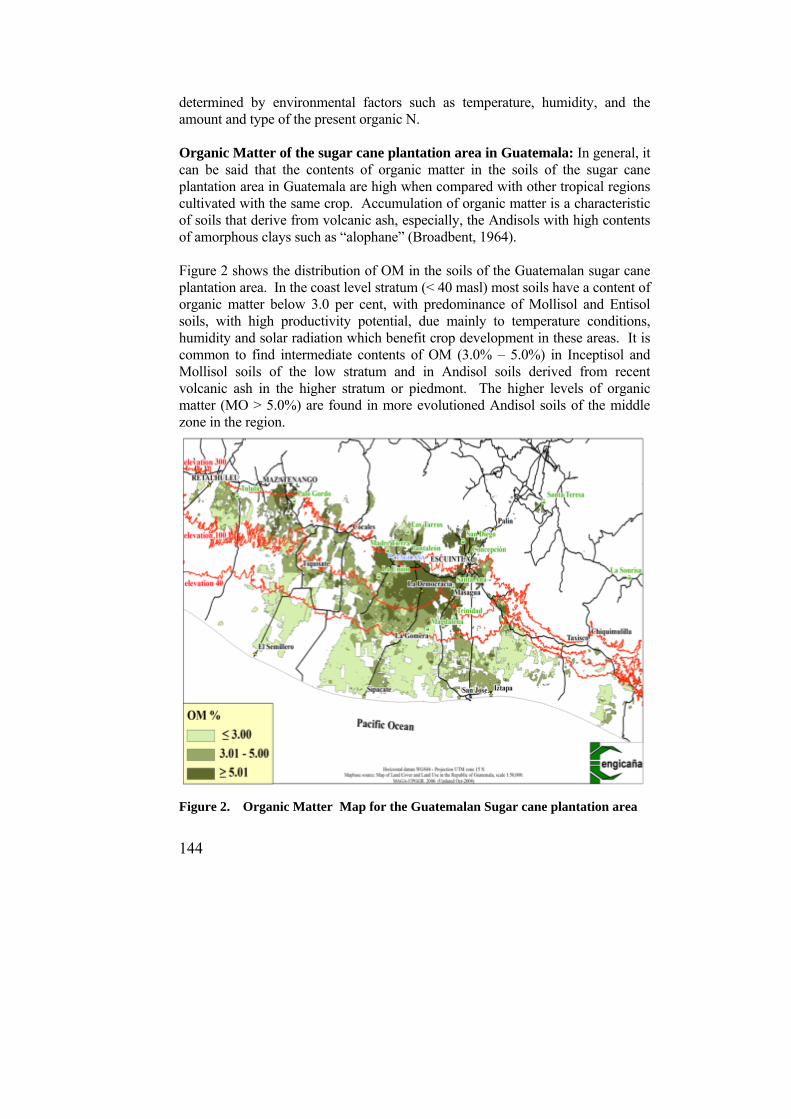
144
determined by environmental factors such as temperature, humidity, and the amount and type of the present organic N. Organic Matter of the sugar cane plantation area in Guatemala: In general, it can be said that the contents of organic matter in the soils of the sugar cane plantation area in Guatemala are high when compared with other tropical regions cultivated with the same crop. Accumulation of organic matter is a characteristic of soils that derive from volcanic ash, especially, the Andisols with high contents of amorphous clays such as “alophane” (Broadbent, 1964). Figure 2 shows the distribution of OM in the soils of the Guatemalan sugar cane plantation area. In the coast level stratum (< 40 masl) most soils have a content of organic matter below 3.0 per cent, with predominance of Mollisol and Entisol soils, with high productivity potential, due mainly to temperature conditions, humidity and solar radiation which benefit crop development in these areas. It is common to find intermediate contents of OM (3.0% – 5.0%) in Inceptisol and Mollisol soils of the low stratum and in Andisol soils derived from recent volcanic ash in the higher stratum or piedmont. The higher levels of organic matter (MO > 5.0%) are found in more evolutioned Andisol soils of the middle zone in the region.
Figure 2. Organic Matter Map for the Guatemalan Sugar cane plantation area

145
Crop response to nitrogen application: sugar cane crop response to nitrogen application shows a high correlation with organic matter in the soils of the Guatemalan sugar cane plantation area. Figure 3 shows the ratio of organic matter with the response of the crop in terms of the percentage increases in cane yield. In the inserted table, the probabilities of response to N are included. Figure 3 shows that in 94% of cases when the organic matter content of the soil was low (OM < 3.0%) increments over 20 per cent TCH were obtained, whereas for all soils with higher contents (OM > 5.0%) the increments were below 11 per cent. In soils with medium levels of organic matter (3.0 – 5.0 %) responses were variable, but in most cases they were lower tan 20 per cent.
Figure 3. Ratio between soil organic matter and percent increase in tonnage due
to N application It was determined also that N doses are increased with ratoon crop, especially for those soils with low contents of organic matter. Figure 4 shows the evolution of the response of variety CP72-2086 to the application of different levels of N in four consecutive years, the optimum economic dose is also shown (OEDN). The Soil was Mollisol with low content of organic matter (1.8 %). In plant crop stage (1995), the application of 50 kg of N/ha was sufficient enough to achieve high yields of cane, similar to those obtained with the higher doses of N and showing a very significant difference with the non fertilized
0
5
10
15
20
25
30
35
40
45
50
0 1 2 3 4 5 6 7 8 9 10 11 12
TC
H in
crea
se (
%)
Soil organic matter (%)
Low Medium High*
Response probabilities to N
OM (%) TCH increase (%)
< 11 11 – 20 > 20
< 3 0 6 94 3 – 5 31 47 21 > 5 100 0 0
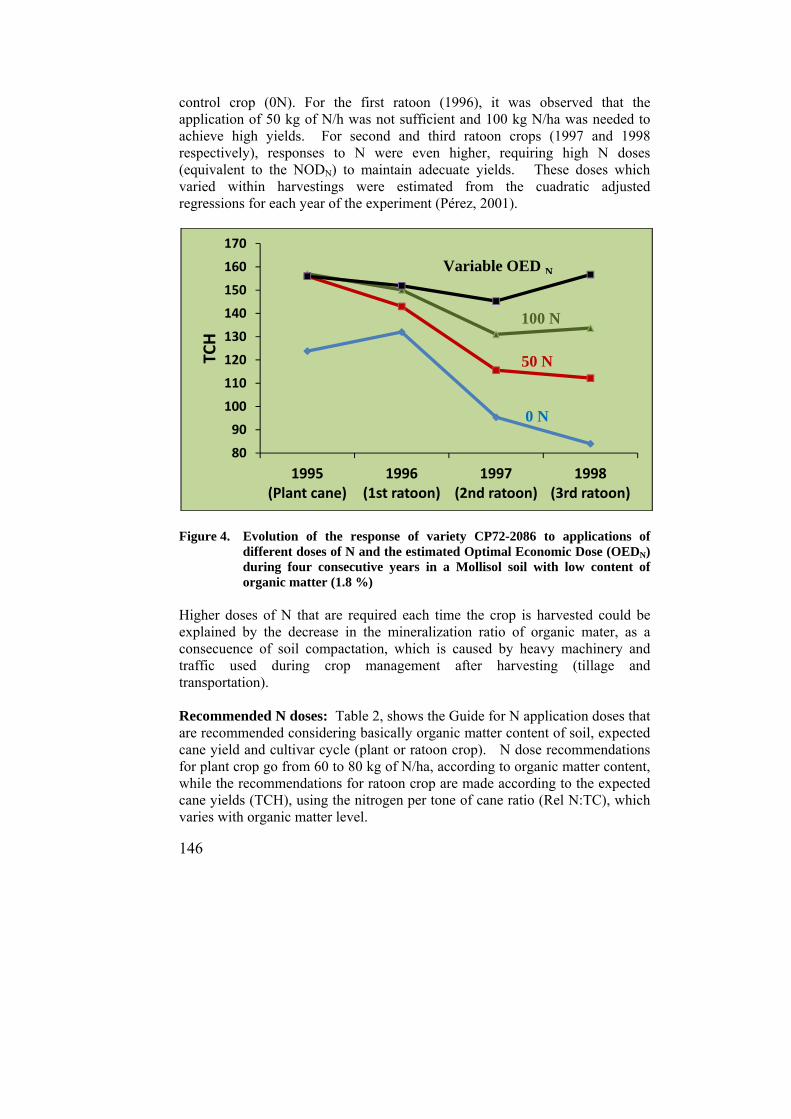
146
control crop (0N). For the first ratoon (1996), it was observed that the application of 50 kg of N/h was not sufficient and 100 kg N/ha was needed to achieve high yields. For second and third ratoon crops (1997 and 1998 respectively), responses to N were even higher, requiring high N doses (equivalent to the NODN) to maintain adecuate yields. These doses which varied within harvestings were estimated from the cuadratic adjusted regressions for each year of the experiment (Pérez, 2001).
Figure 4. Evolution of the response of variety CP72-2086 to applications of
different doses of N and the estimated Optimal Economic Dose (OEDN) during four consecutive years in a Mollisol soil with low content of organic matter (1.8 %)
Higher doses of N that are required each time the crop is harvested could be explained by the decrease in the mineralization ratio of organic mater, as a consecuence of soil compactation, which is caused by heavy machinery and traffic used during crop management after harvesting (tillage and transportation). Recommended N doses: Table 2, shows the Guide for N application doses that are recommended considering basically organic matter content of soil, expected cane yield and cultivar cycle (plant or ratoon crop). N dose recommendations for plant crop go from 60 to 80 kg of N/ha, according to organic matter content, while the recommendations for ratoon crop are made according to the expected cane yields (TCH), using the nitrogen per tone of cane ratio (Rel N:TC), which varies with organic matter level.
80
90
100
110
120
130
140
150
160
170
1995 (Plant cane)
1996 (1st ratoon)
1997 (2nd ratoon)
1998 (3rd ratoon)
TCH
Variable OED N
50 N
0 N
100 N
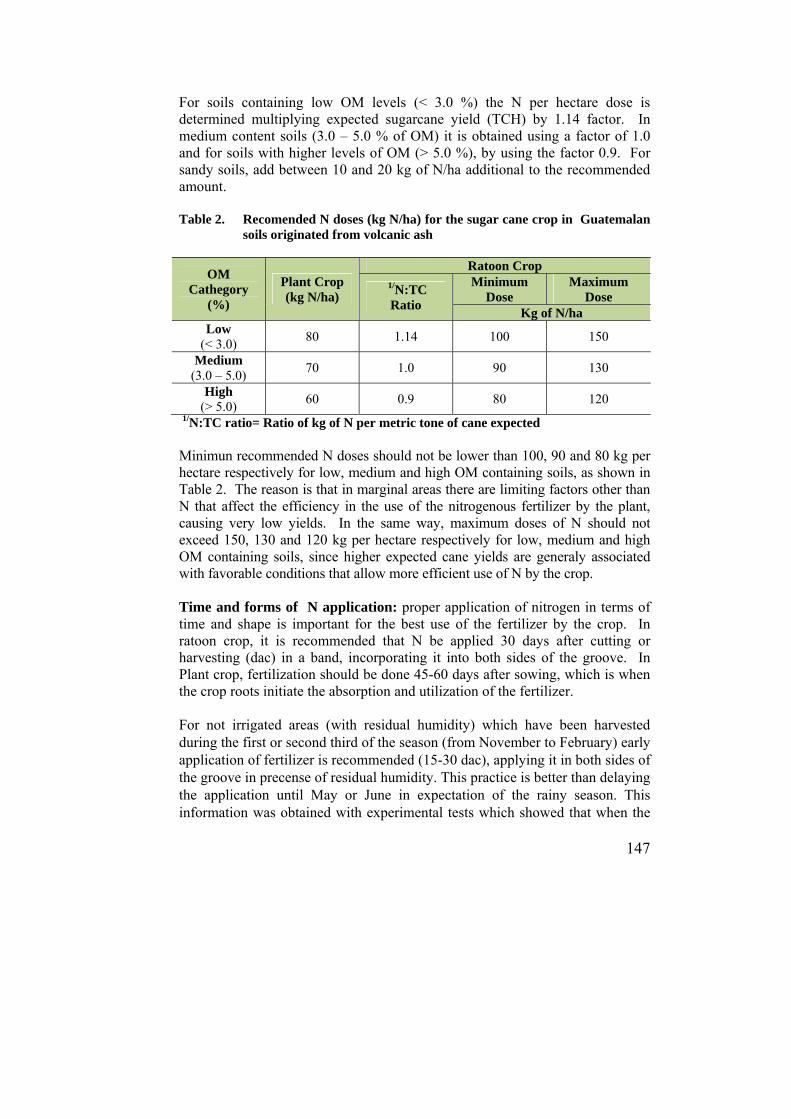
147
For soils containing low OM levels (< 3.0 %) the N per hectare dose is determined multiplying expected sugarcane yield (TCH) by 1.14 factor. In medium content soils (3.0 – 5.0 % of OM) it is obtained using a factor of 1.0 and for soils with higher levels of OM (> 5.0 %), by using the factor 0.9. For sandy soils, add between 10 and 20 kg of N/ha additional to the recommended amount. Table 2. Recomended N doses (kg N/ha) for the sugar cane crop in Guatemalan
soils originated from volcanic ash
OM Cathegory
(%)
Plant Crop (kg N/ha)
Ratoon Crop
1/N:TC Ratio
Minimum Dose
Maximum Dose
Kg of N/ha Low
(< 3.0) 80 1.14 100 150
Medium (3.0 – 5.0)
70 1.0 90 130
High (> 5.0)
60 0.9 80 120
1/N:TC ratio= Ratio of kg of N per metric tone of cane expected Minimun recommended N doses should not be lower than 100, 90 and 80 kg per hectare respectively for low, medium and high OM containing soils, as shown in Table 2. The reason is that in marginal areas there are limiting factors other than N that affect the efficiency in the use of the nitrogenous fertilizer by the plant, causing very low yields. In the same way, maximum doses of N should not exceed 150, 130 and 120 kg per hectare respectively for low, medium and high OM containing soils, since higher expected cane yields are generaly associated with favorable conditions that allow more efficient use of N by the crop. Time and forms of N application: proper application of nitrogen in terms of time and shape is important for the best use of the fertilizer by the crop. In ratoon crop, it is recommended that N be applied 30 days after cutting or harvesting (dac) in a band, incorporating it into both sides of the groove. In Plant crop, fertilization should be done 45-60 days after sowing, which is when the crop roots initiate the absorption and utilization of the fertilizer. For not irrigated areas (with residual humidity) which have been harvested during the first or second third of the season (from November to February) early application of fertilizer is recommended (15-30 dac), applying it in both sides of the groove in precense of residual humidity. This practice is better than delaying the application until May or June in expectation of the rainy season. This information was obtained with experimental tests which showed that when the
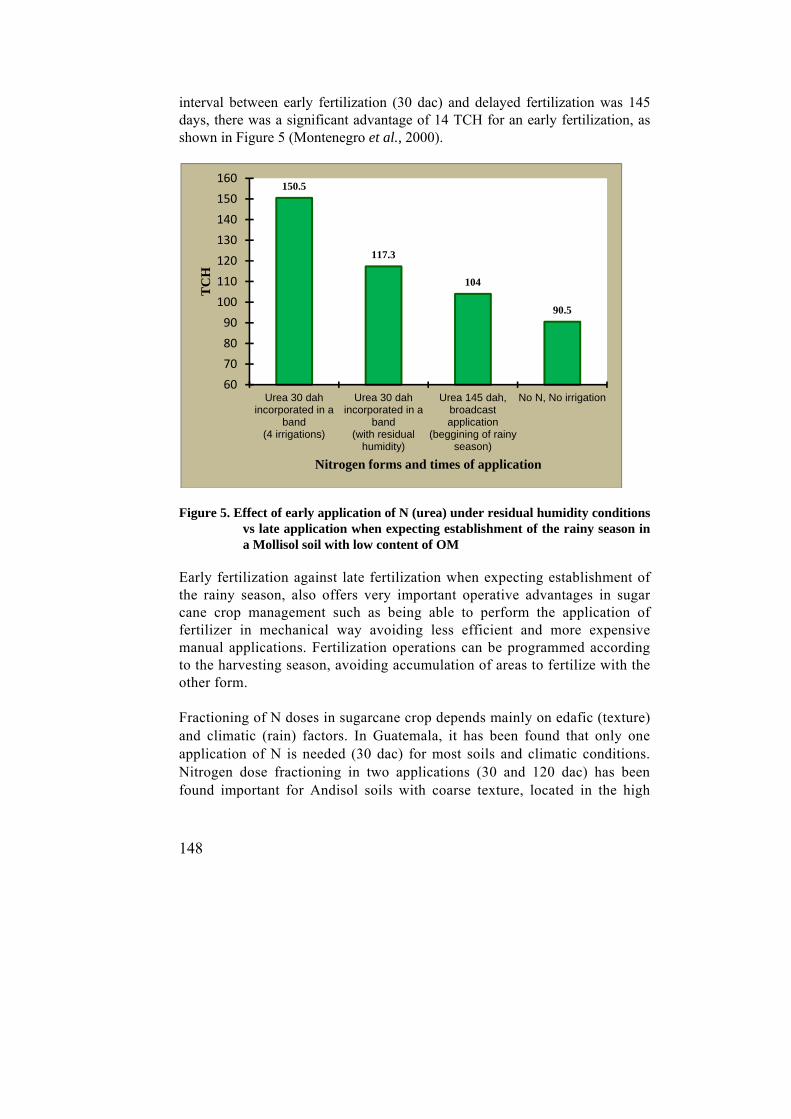
148
interval between early fertilization (30 dac) and delayed fertilization was 145 days, there was a significant advantage of 14 TCH for an early fertilization, as shown in Figure 5 (Montenegro et al., 2000).
Figure 5. Effect of early application of N (urea) under residual humidity conditions
vs late application when expecting establishment of the rainy season in a Mollisol soil with low content of OM
Early fertilization against late fertilization when expecting establishment of the rainy season, also offers very important operative advantages in sugar cane crop management such as being able to perform the application of fertilizer in mechanical way avoiding less efficient and more expensive manual applications. Fertilization operations can be programmed according to the harvesting season, avoiding accumulation of areas to fertilize with the other form. Fractioning of N doses in sugarcane crop depends mainly on edafic (texture) and climatic (rain) factors. In Guatemala, it has been found that only one application of N is needed (30 dac) for most soils and climatic conditions. Nitrogen dose fractioning in two applications (30 and 120 dac) has been found important for Andisol soils with coarse texture, located in the high
150.5
117.3
104
90.5
60
70
80
90
100
110
120
130
140
150
160
Urea 30 dahincorporated in a
band(4 irrigations)
Urea 30 dahincorporated in a
band(with residual
humidity)
Urea 145 dah, broadcast application
(beggining of rainy season)
No N, No irrigation
TC
H
Nitrogen forms and times of application
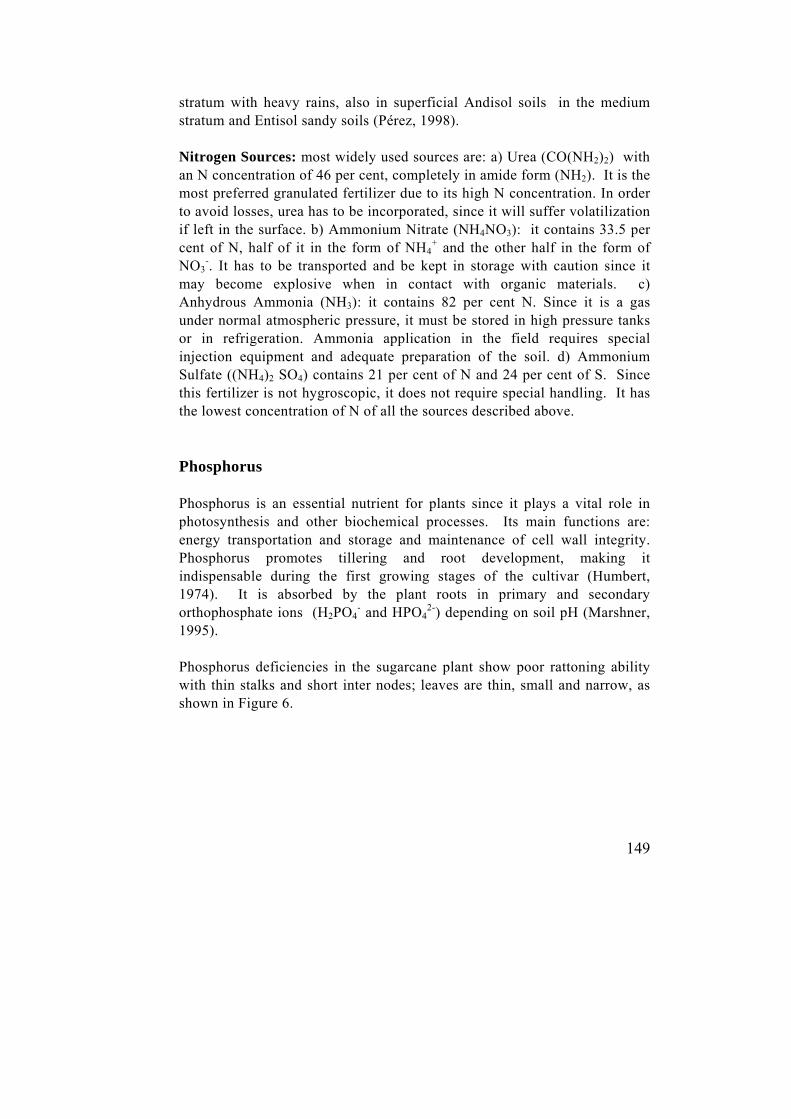
149
stratum with heavy rains, also in superficial Andisol soils in the medium stratum and Entisol sandy soils (Pérez, 1998). Nitrogen Sources: most widely used sources are: a) Urea (CO(NH2)2) with an N concentration of 46 per cent, completely in amide form (NH2). It is the most preferred granulated fertilizer due to its high N concentration. In order to avoid losses, urea has to be incorporated, since it will suffer volatilization if left in the surface. b) Ammonium Nitrate (NH4NO3): it contains 33.5 per cent of N, half of it in the form of NH4
+ and the other half in the form of NO3
-. It has to be transported and be kept in storage with caution since it may become explosive when in contact with organic materials. c) Anhydrous Ammonia (NH3): it contains 82 per cent N. Since it is a gas under normal atmospheric pressure, it must be stored in high pressure tanks or in refrigeration. Ammonia application in the field requires special injection equipment and adequate preparation of the soil. d) Ammonium Sulfate ((NH4)2 SO4) contains 21 per cent of N and 24 per cent of S. Since this fertilizer is not hygroscopic, it does not require special handling. It has the lowest concentration of N of all the sources described above. Phosphorus Phosphorus is an essential nutrient for plants since it plays a vital role in photosynthesis and other biochemical processes. Its main functions are: energy transportation and storage and maintenance of cell wall integrity. Phosphorus promotes tillering and root development, making it indispensable during the first growing stages of the cultivar (Humbert, 1974). It is absorbed by the plant roots in primary and secondary orthophosphate ions (H2PO4
- and HPO42-) depending on soil pH (Marshner,
1995). Phosphorus deficiencies in the sugarcane plant show poor rattoning ability with thin stalks and short inter nodes; leaves are thin, small and narrow, as shown in Figure 6.
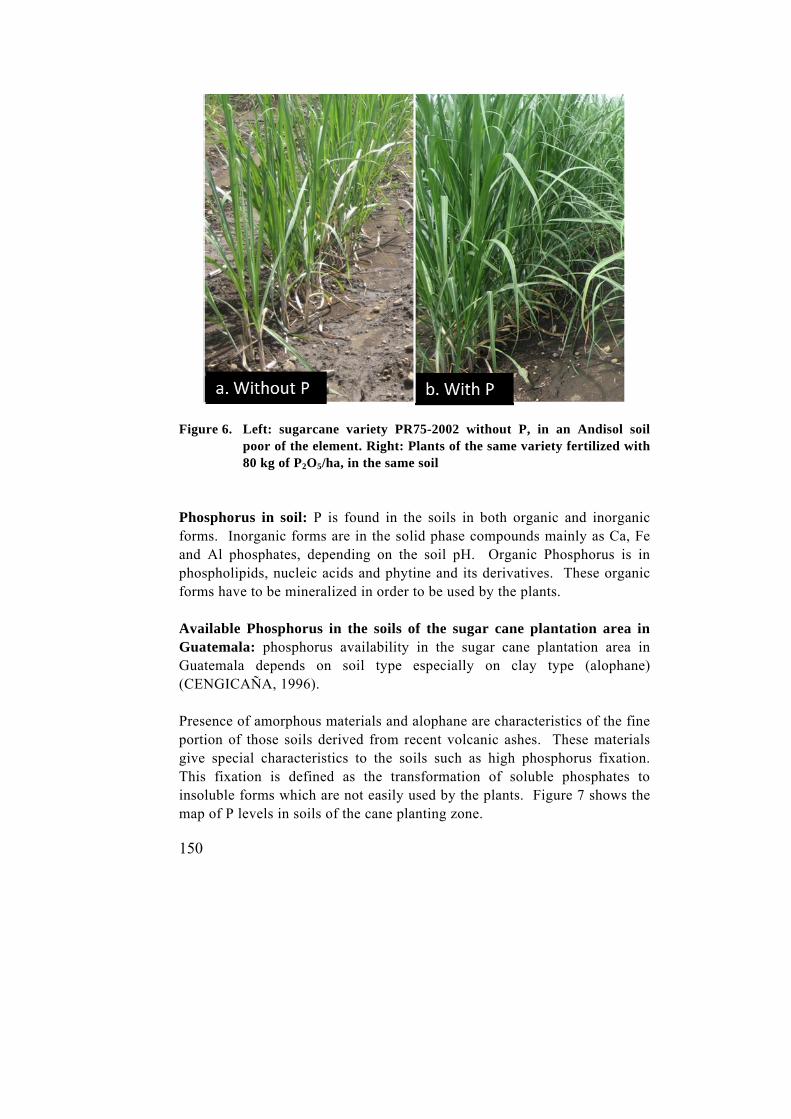
150
Figure 6. Left: sugarcane variety PR75-2002 without P, in an Andisol soil
poor of the element. Right: Plants of the same variety fertilized with 80 kg of P2O5/ha, in the same soil
Phosphorus in soil: P is found in the soils in both organic and inorganic forms. Inorganic forms are in the solid phase compounds mainly as Ca, Fe and Al phosphates, depending on the soil pH. Organic Phosphorus is in phospholipids, nucleic acids and phytine and its derivatives. These organic forms have to be mineralized in order to be used by the plants. Available Phosphorus in the soils of the sugar cane plantation area in Guatemala: phosphorus availability in the sugar cane plantation area in Guatemala depends on soil type especially on clay type (alophane) (CENGICAÑA, 1996). Presence of amorphous materials and alophane are characteristics of the fine portion of those soils derived from recent volcanic ashes. These materials give special characteristics to the soils such as high phosphorus fixation. This fixation is defined as the transformation of soluble phosphates to insoluble forms which are not easily used by the plants. Figure 7 shows the map of P levels in soils of the cane planting zone.
151
Figure 7. Availability of Phosphorus in the Guatemalan Sugar cane plantation
area In the higher and medium strata there are soils with high retention of P and in consequence with low levels of the available forms of the nutrient. These regions are dominated by Andisol soils with high amounts of alophane. Moving to the lower zones towards the Pacific Ocean, the levels of alophane decrease and high contents of P are found on the predominant Mollisol and Entisol soils. Measuring soil pH in a sodium fluoride solution is a good indicator of alophane and amorphous material presence. Figure 8 shows the relationship determined between sodium fluoride (NaF) pH and available P in Andisol soils and other soils in the region. It can be noticed that the Andisol soil pH values determined in NaF are close or above 10 showing a big difference when compared to the lower values obtained for the other types of soil. It is also observed that Andisol soils are associated to low levels of available P (< 5 ppm).

152
Figure 8. Relation between pH in NaF and soil available P (Mehlich 1) in Andisols soils and other types of soil of the sugar cane area in Guatemala
Crop response to phosphorus applications: sugar cane response to phosphorus application in the Guatemalan cane planting zone are related to the original contents of P in the soils extracted with the Mehlich 1 solution, as shown on Figure 9. It can be observed that relative yields (RY) that are equal or below 90 per cent of maximum yield are associated to original soil contents of P below 10 ppm, indicating that the higher probabilities to get a response to phosphorus applications are below that level (Pérez et al., 2003).
0
10
20
30
40
50
60
70
7 8 9 10 11 12
Ava
ilab
le P
(p
pm
)
pH (NaF)
Andisols other soils
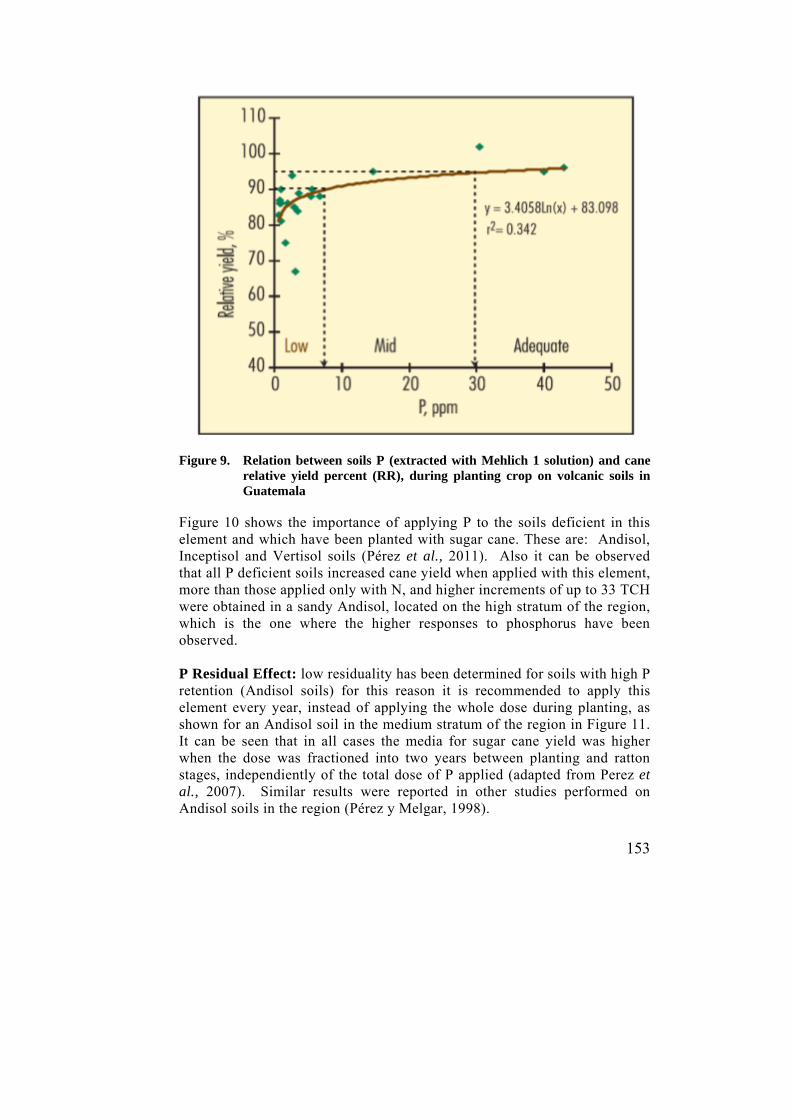
153
Figure 9. Relation between soils P (extracted with Mehlich 1 solution) and cane relative yield percent (RR), during planting crop on volcanic soils in Guatemala
Figure 10 shows the importance of applying P to the soils deficient in this element and which have been planted with sugar cane. These are: Andisol, Inceptisol and Vertisol soils (Pérez et al., 2011). Also it can be observed that all P deficient soils increased cane yield when applied with this element, more than those applied only with N, and higher increments of up to 33 TCH were obtained in a sandy Andisol, located on the high stratum of the region, which is the one where the higher responses to phosphorus have been observed. P Residual Effect: low residuality has been determined for soils with high P retention (Andisol soils) for this reason it is recommended to apply this element every year, instead of applying the whole dose during planting, as shown for an Andisol soil in the medium stratum of the region in Figure 11. It can be seen that in all cases the media for sugar cane yield was higher when the dose was fractioned into two years between planting and ratton stages, independiently of the total dose of P applied (adapted from Perez et al., 2007). Similar results were reported in other studies performed on Andisol soils in the region (Pérez y Melgar, 1998).
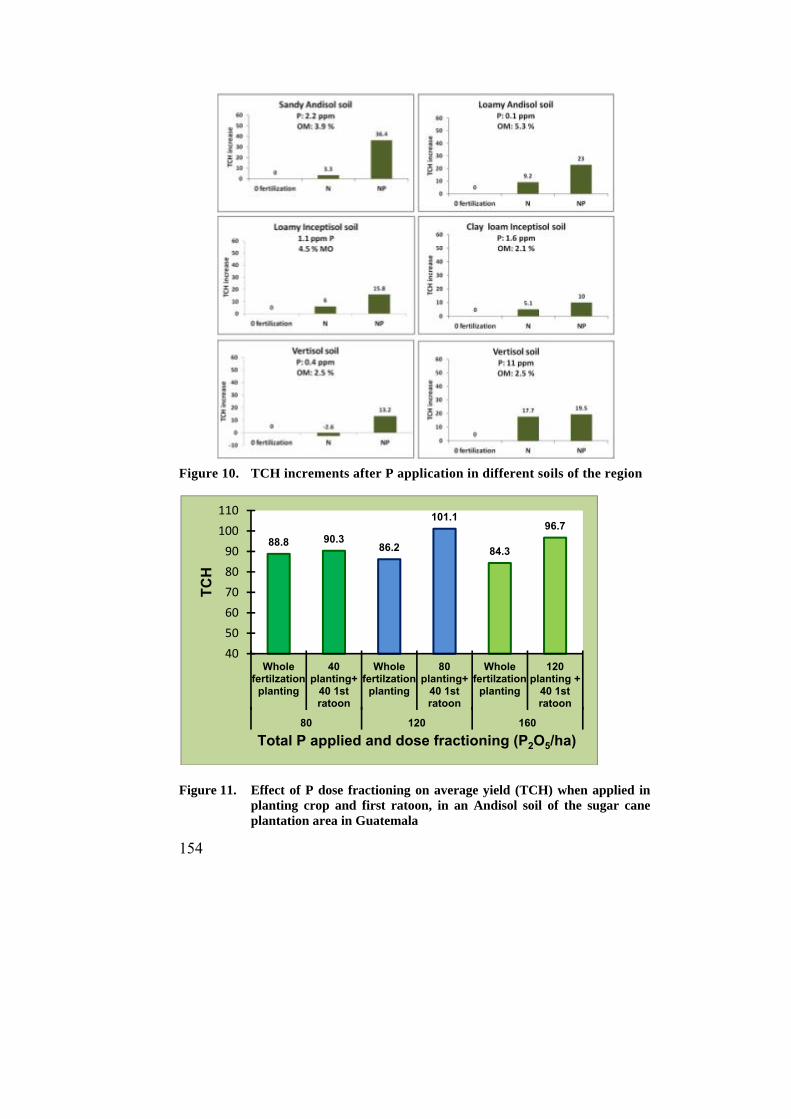
154
Figure 10. TCH increments after P application in different soils of the region
Figure 11. Effect of P dose fractioning on average yield (TCH) when applied in planting crop and first ratoon, in an Andisol soil of the sugar cane plantation area in Guatemala
88.8 90.386.2
101.1
84.3
96.7
40
50
60
70
80
90
100
110
Whole fertilzation
planting
40 planting+
40 1st ratoon
Whole fertilzation
planting
80 planting+
40 1st ratoon
Whole fertilzation
planting
120 planting +
40 1st ratoon
80 120 160
TC
H
Total P applied and dose fractioning (P2O5/ha)
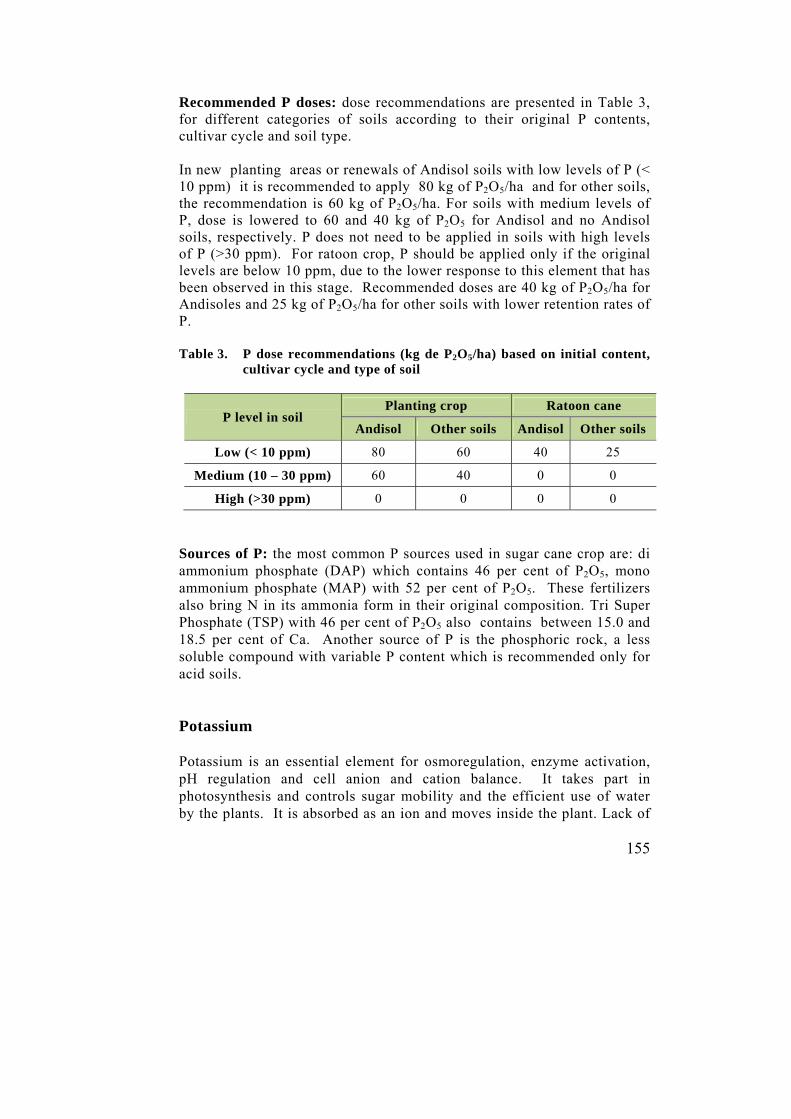
155
Recommended P doses: dose recommendations are presented in Table 3, for different categories of soils according to their original P contents, cultivar cycle and soil type. In new planting areas or renewals of Andisol soils with low levels of P (< 10 ppm) it is recommended to apply 80 kg of P2O5/ha and for other soils, the recommendation is 60 kg of P2O5/ha. For soils with medium levels of P, dose is lowered to 60 and 40 kg of P2O5 for Andisol and no Andisol soils, respectively. P does not need to be applied in soils with high levels of P (>30 ppm). For ratoon crop, P should be applied only if the original levels are below 10 ppm, due to the lower response to this element that has been observed in this stage. Recommended doses are 40 kg of P2O5/ha for Andisoles and 25 kg of P2O5/ha for other soils with lower retention rates of P. Table 3. P dose recommendations (kg de P2O5/ha) based on initial content,
cultivar cycle and type of soil
P level in soil Planting crop Ratoon cane
Andisol Other soils Andisol Other soils
Low (< 10 ppm) 80 60 40 25
Medium (10 – 30 ppm) 60 40 0 0
High (>30 ppm) 0 0 0 0
Sources of P: the most common P sources used in sugar cane crop are: di ammonium phosphate (DAP) which contains 46 per cent of P2O5, mono ammonium phosphate (MAP) with 52 per cent of P2O5. These fertilizers also bring N in its ammonia form in their original composition. Tri Super Phosphate (TSP) with 46 per cent of P2O5 also contains between 15.0 and 18.5 per cent of Ca. Another source of P is the phosphoric rock, a less soluble compound with variable P content which is recommended only for acid soils. Potassium Potassium is an essential element for osmoregulation, enzyme activation, pH regulation and cell anion and cation balance. It takes part in photosynthesis and controls sugar mobility and the efficient use of water by the plants. It is absorbed as an ion and moves inside the plant. Lack of

156
potassium is noticed first in the old leaves of the plant with spots and chlorosys in the edges which ends up in the death of the affected leaves. Long term deficiency of potassium may affect mersitem development indicated by spindle distortion and a “bunched top” or “fan” appearance. (Anderson and Bowen, 1994). In the other hand, an excess in potassium increases the content of ash in cane juice affecting sugar crystallization during processing. Potassium in Soil: potassium in soil can be found in different forms and with different availability levels. The most available fractions are those exchangeable forms that are in solution; these are extracted for lab analysis in order to measure K availability in the soil. The soils that are originated from volcanic ashes have good storage of K, however, the combination of some factors such as rain frequency and intensity and light texture promote lixiviation of available forms of K. Potassium in soils of the sugar cane plantation area in Guatemala: in the sugarcane plantation area of Guatemala it is common to find low levels of exchangeable K (< 100 ppm), in the Andisol soils of the high stratum (piedmont) which are characterized by a high precipitation (>3500 mm/year) and by light texture soils. Low to adequate levels of exchangeable K have been detected in soils of the medium stratum with predominance of medium texture Andisol and Inceptisol soils, in contrast with higher levels of K in soils which are found in the low and seashore stratum with high fertility Mollisol soils. Crop response to K application: different studies performed in the region have shown that the response obtained by the plant correspond to the levels of exchangeable K in soils. In Andisol soils with low content of this element (below 100 ppm) the application of potassium has produced significative increments in cane yield and sugar concentration. No response to K application was detected in Mollisols with sandy loam texture with contents of K higher than 200 ppm. In the other hand, a positive interaction between K and N was observed. Figure 12 shows this interaction, for a K deficient soil (86 ppm). It is observed that with no amnendment for potassium (0 K), nitrogen effect was null. But for the applied crop with 120 kg de K2O/ha a positive lineal effect of N was obtained (Figure 12 a). For a soil with 203 ppm of K, response to N was similar with or without K (Figure 12 b), indicating that this element was not a limitant for the production (Pérez y Melgar, 2000).
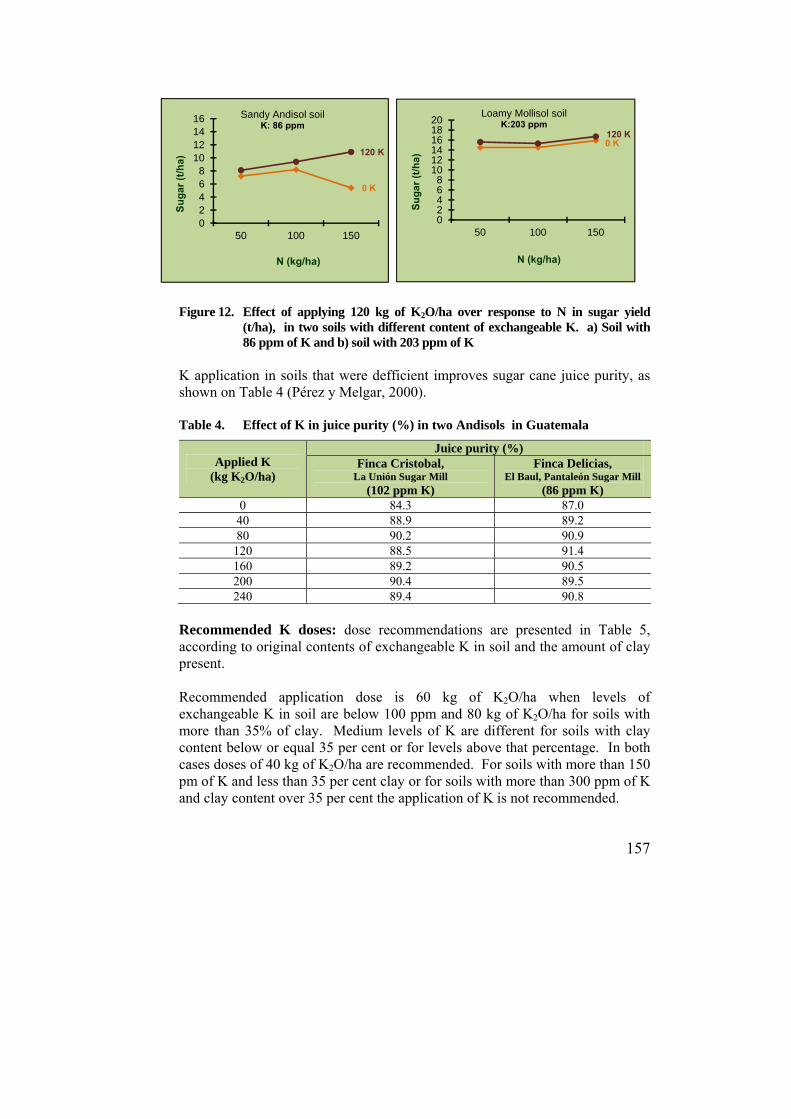
157
Figure 12. Effect of applying 120 kg of K2O/ha over response to N in sugar yield (t/ha), in two soils with different content of exchangeable K. a) Soil with 86 ppm of K and b) soil with 203 ppm of K
K application in soils that were defficient improves sugar cane juice purity, as shown on Table 4 (Pérez y Melgar, 2000). Table 4. Effect of K in juice purity (%) in two Andisols in Guatemala
Applied K (kg K2O/ha)
Juice purity (%) Finca Cristobal,
La Unión Sugar Mill (102 ppm K)
Finca Delicias, El Baul, Pantaleón Sugar Mill
(86 ppm K) 0 84.3 87.0 40 88.9 89.2 80 90.2 90.9
120 88.5 91.4 160 89.2 90.5 200 90.4 89.5 240 89.4 90.8
Recommended K doses: dose recommendations are presented in Table 5, according to original contents of exchangeable K in soil and the amount of clay present. Recommended application dose is 60 kg of K2O/ha when levels of exchangeable K in soil are below 100 ppm and 80 kg of K2O/ha for soils with more than 35% of clay. Medium levels of K are different for soils with clay content below or equal 35 per cent or for levels above that percentage. In both cases doses of 40 kg of K2O/ha are recommended. For soils with more than 150 pm of K and less than 35 per cent clay or for soils with more than 300 ppm of K and clay content over 35 per cent the application of K is not recommended.
0 K
120 K
02468
10121416
50 100 150
Su
gar
(t/
ha)
N (kg/ha)
Sandy Andisol soilK: 86 ppm
0 K120 K
02468
101214161820
50 100 150
Su
gar
(t/
ha)
N (kg/ha)
Loamy Mollisol soilK:203 ppm
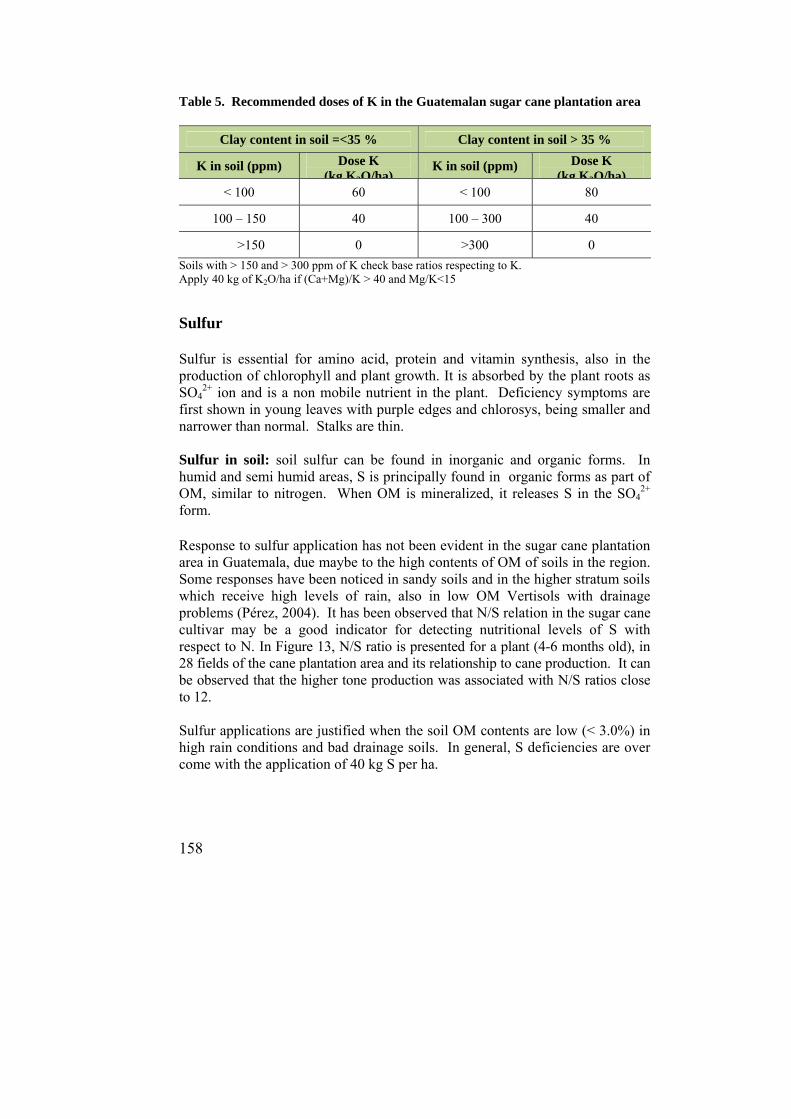
158
Table 5. Recommended doses of K in the Guatemalan sugar cane plantation area
Clay content in soil =<35 % Clay content in soil > 35 %
K in soil (ppm) Dose K (kg K2O/ha)
K in soil (ppm) Dose K (kg K2O/ha)
< 100 60 < 100 80
100 – 150 40 100 – 300 40
>150 0 >300 0
Soils with > 150 and > 300 ppm of K check base ratios respecting to K. Apply 40 kg of K2O/ha if (Ca+Mg)/K > 40 and Mg/K<15
Sulfur Sulfur is essential for amino acid, protein and vitamin synthesis, also in the production of chlorophyll and plant growth. It is absorbed by the plant roots as SO4
2+ ion and is a non mobile nutrient in the plant. Deficiency symptoms are first shown in young leaves with purple edges and chlorosys, being smaller and narrower than normal. Stalks are thin. Sulfur in soil: soil sulfur can be found in inorganic and organic forms. In humid and semi humid areas, S is principally found in organic forms as part of OM, similar to nitrogen. When OM is mineralized, it releases S in the SO4
2+ form. Response to sulfur application has not been evident in the sugar cane plantation area in Guatemala, due maybe to the high contents of OM of soils in the region. Some responses have been noticed in sandy soils and in the higher stratum soils which receive high levels of rain, also in low OM Vertisols with drainage problems (Pérez, 2004). It has been observed that N/S relation in the sugar cane cultivar may be a good indicator for detecting nutritional levels of S with respect to N. In Figure 13, N/S ratio is presented for a plant (4-6 months old), in 28 fields of the cane plantation area and its relationship to cane production. It can be observed that the higher tone production was associated with N/S ratios close to 12. Sulfur applications are justified when the soil OM contents are low (< 3.0%) in high rain conditions and bad drainage soils. In general, S deficiencies are over come with the application of 40 kg S per ha.

159
Figure 13. N/S Ratio in sugar cane plant and its relation with yield (TCH) on 28 fields of La Unión sugar cane mill, sampling between 4 and 6 months
Sulfur sources: the most common sources are ammonium sulfate (24 % S and 21 % N) and calcium sulphate (18.6 % S). Ammonium sulfate is a high solubility fertilizer, easily available which also has a significant amount of N. Calcium sulfate or gypsum is an economical source of S, which also contains Ca in variable proportion. A cheaper option is elemental sulfur (90.0 – 100% S), however it has slower reactivity since it needs to be oxidized to SO4
2+ by soil microorganism and may suffer losses by lixiviation. Calcium Calcium is an essential element which forms part of Ca pectates, a very important constituent of cell walls. Calcium takes place in electrostatic equilibrium in the cell and is an activator of numerous enzymes in the plant such as amylases, phospholypases, kinases and ATP-ases and it plays a very important rol in N metabolism. Calcium is a relatively inmobile nutrient within the plant. Calcium deficiencies produce thin stalks and poor radicular growth. Also, old leaves have spots and present local chlorosys with similar symptoms to rust and which may die prematurely (Anderson and Bowen, 1994). When Ca deficiency is acute, leaves are necrotic and distorted.
50
100
150
200
11 12 13 14 15 16
TC
H
Rel N/S in leaves
160
Calcium in soil: In the Guatemalan sugar cane plantation area, soils are characterized for having adequate levels of exchangeable Ca, except for those in the higher stratum and some middle areas with medium to low levels due, among other factors, to the high precipitation in the region and to the presence of sandy soils (Villatoro et al., 2009). Soils Ca levels lower than 4.0 meq/100 g are considered low. However, one has to consider Ca saturation in soil and the relationship among bases. Some responses to lime application have been detected only in soils with pH below 5.5, in Vertisoils and some Andisoils in the higher stratum. The most common sources of Ca are gypsum (18-22%) and different types of lime such as Ca carbonate, important to acid soils. Simple super phosphate (20%) and triple super phosphate (15 %) are Ca containing fertilizers. Magnesium Magnesium is a constituent of chlorophyll, in consequence, is involved in CO2 assimilation and protein synthesis. It is important for the P mobility in the plant and participates in the respiration processes. Mg is absorbed by the roots in its Mg2+ form and is a mobile nutrient. Mg deficiencies may cause intravein chlorosis, turning old leaves from orange to yellow, and may migrate to young leaves under severe deficiency contidions. Sprouts are weak and cane growth is retarded. Magnesium in the soil: low levels of Mg in the soil (< 1.0 meq/100g) are found mainly in the higher stratum (over 300 mosl) where precipitation is high and there is abundance of sandy soils. Adequate to high levels of Mg are found in the other strata (Villatoro et al., 2009). Deficient soils would contain lower than 1.0 meq/100 g and application of 30-40 kg of Mg/ha is recommended. In soils with higher contents, Mg saturation has to be checked along with soil bases. For poor Mg soils (0.4 meq/100g) located in the higher stratum of the sugar cane plantation area the application of 30 kg of Mg/ha has resulted in the increment of up to 8 TCH. (Pérez et al., 2011).
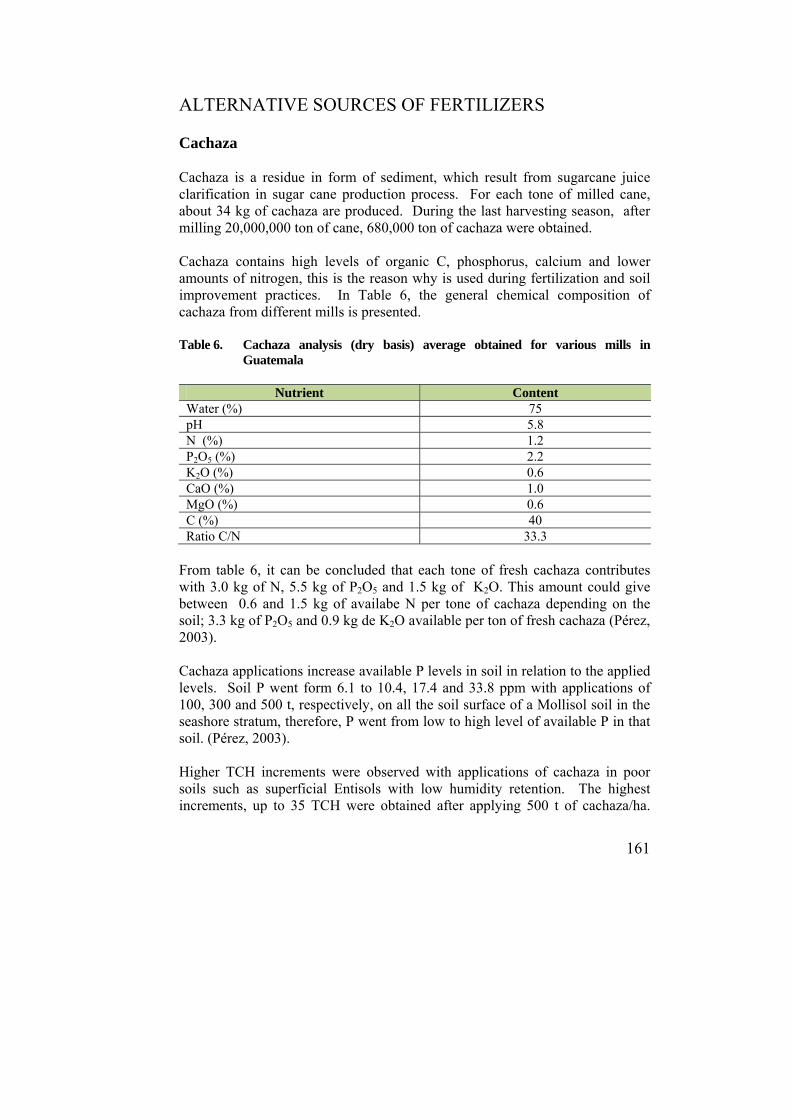
161
ALTERNATIVE SOURCES OF FERTILIZERS Cachaza Cachaza is a residue in form of sediment, which result from sugarcane juice clarification in sugar cane production process. For each tone of milled cane, about 34 kg of cachaza are produced. During the last harvesting season, after milling 20,000,000 ton of cane, 680,000 ton of cachaza were obtained. Cachaza contains high levels of organic C, phosphorus, calcium and lower amounts of nitrogen, this is the reason why is used during fertilization and soil improvement practices. In Table 6, the general chemical composition of cachaza from different mills is presented. Table 6. Cachaza analysis (dry basis) average obtained for various mills in
Guatemala
Nutrient Content Water (%) 75 pH 5.8 N (%) 1.2 P2O5 (%) 2.2 K2O (%) 0.6 CaO (%) 1.0 MgO (%) 0.6 C (%) 40 Ratio C/N 33.3
From table 6, it can be concluded that each tone of fresh cachaza contributes with 3.0 kg of N, 5.5 kg of P2O5 and 1.5 kg of K2O. This amount could give between 0.6 and 1.5 kg of availabe N per tone of cachaza depending on the soil; 3.3 kg of P2O5 and 0.9 kg de K2O available per ton of fresh cachaza (Pérez, 2003). Cachaza applications increase available P levels in soil in relation to the applied levels. Soil P went form 6.1 to 10.4, 17.4 and 33.8 ppm with applications of 100, 300 and 500 t, respectively, on all the soil surface of a Mollisol soil in the seashore stratum, therefore, P went from low to high level of available P in that soil. (Pérez, 2003). Higher TCH increments were observed with applications of cachaza in poor soils such as superficial Entisols with low humidity retention. The highest increments, up to 35 TCH were obtained after applying 500 t of cachaza/ha.
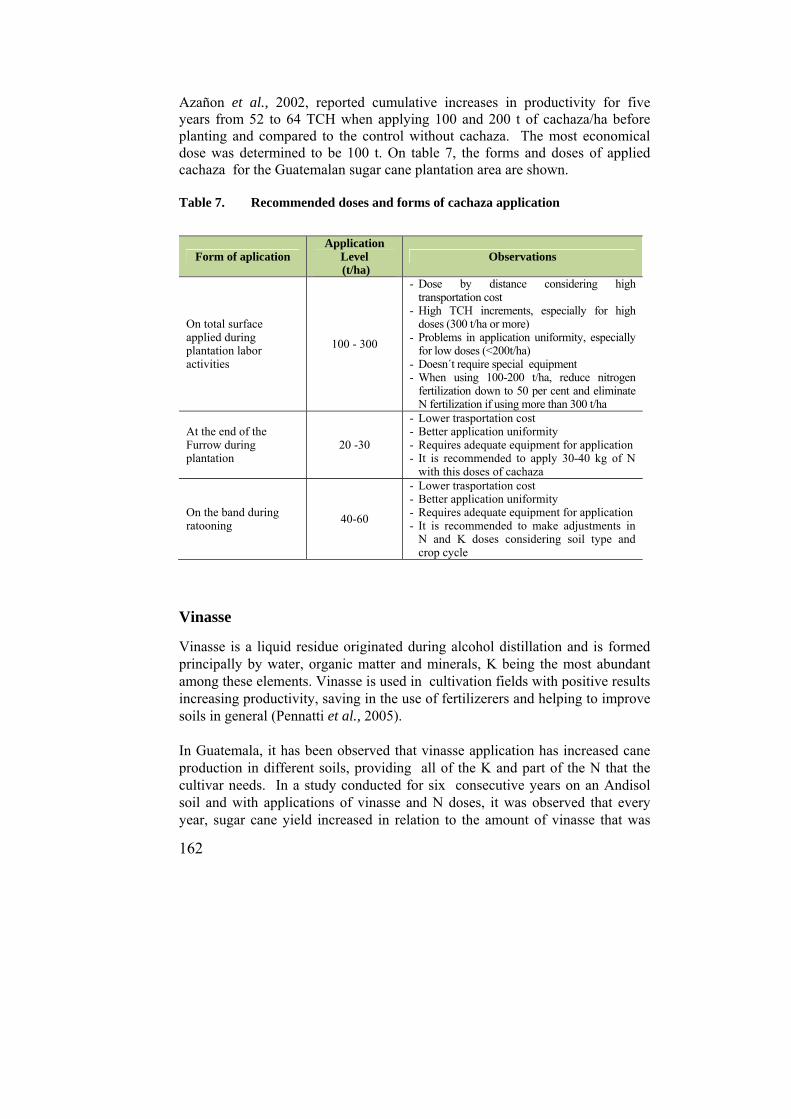
162
Azañon et al., 2002, reported cumulative increases in productivity for five years from 52 to 64 TCH when applying 100 and 200 t of cachaza/ha before planting and compared to the control without cachaza. The most economical dose was determined to be 100 t. On table 7, the forms and doses of applied cachaza for the Guatemalan sugar cane plantation area are shown. Table 7. Recommended doses and forms of cachaza application
Form of aplication Application
Level (t/ha)
Observations
On total surface applied during plantation labor activities
100 - 300
- Dose by distance considering high transportation cost
- High TCH increments, especially for high doses (300 t/ha or more)
- Problems in application uniformity, especially for low doses (<200t/ha)
- Doesn´t require special equipment - When using 100-200 t/ha, reduce nitrogen
fertilization down to 50 per cent and eliminate N fertilization if using more than 300 t/ha
At the end of the Furrow during plantation
20 -30
- Lower trasportation cost- Better application uniformity - Requires adequate equipment for application - It is recommended to apply 30-40 kg of N
with this doses of cachaza
On the band during ratooning
40-60
- Lower trasportation cost- Better application uniformity - Requires adequate equipment for application - It is recommended to make adjustments in
N and K doses considering soil type and crop cycle
Vinasse
Vinasse is a liquid residue originated during alcohol distillation and is formed principally by water, organic matter and minerals, K being the most abundant among these elements. Vinasse is used in cultivation fields with positive results increasing productivity, saving in the use of fertilizerers and helping to improve soils in general (Pennatti et al., 2005). In Guatemala, it has been observed that vinasse application has increased cane production in different soils, providing all of the K and part of the N that the cultivar needs. In a study conducted for six consecutive years on an Andisol soil and with applications of vinasse and N doses, it was observed that every year, sugar cane yield increased in relation to the amount of vinasse that was
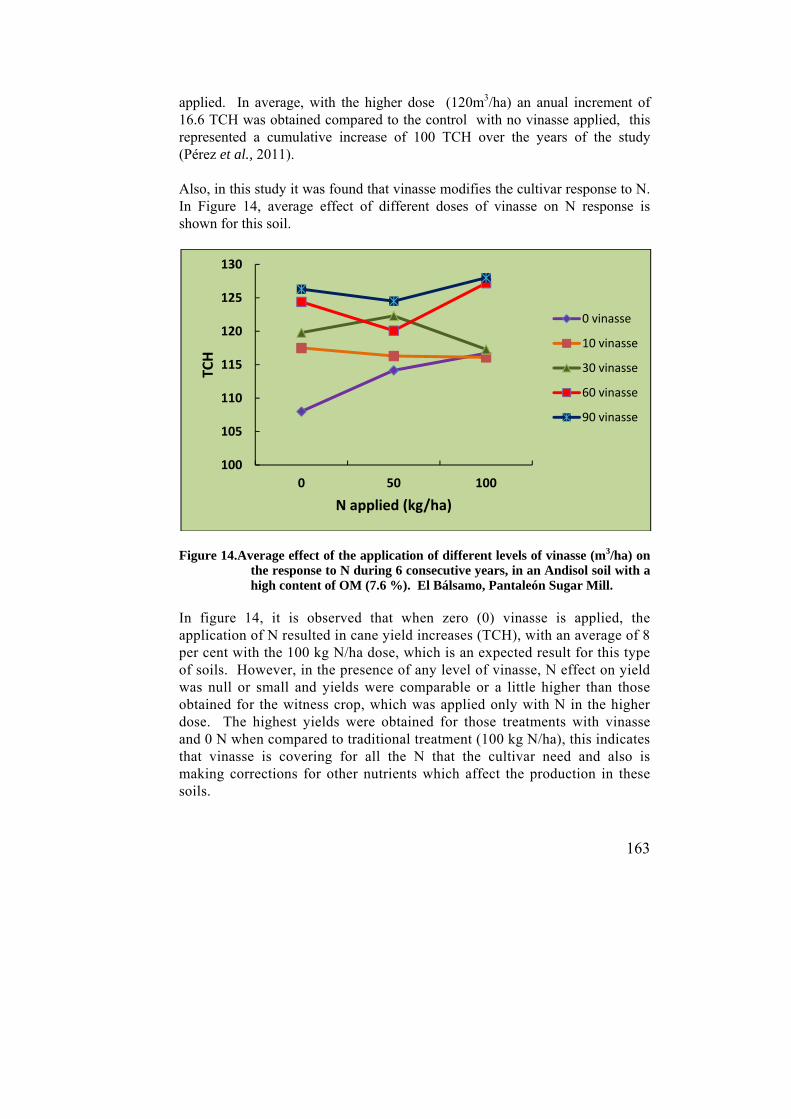
163
applied. In average, with the higher dose (120m3/ha) an anual increment of 16.6 TCH was obtained compared to the control with no vinasse applied, this represented a cumulative increase of 100 TCH over the years of the study (Pérez et al., 2011). Also, in this study it was found that vinasse modifies the cultivar response to N. In Figure 14, average effect of different doses of vinasse on N response is shown for this soil.
Figure 14.Average effect of the application of different levels of vinasse (m3/ha) on
the response to N during 6 consecutive years, in an Andisol soil with a high content of OM (7.6 %). El Bálsamo, Pantaleón Sugar Mill.
In figure 14, it is observed that when zero (0) vinasse is applied, the application of N resulted in cane yield increases (TCH), with an average of 8 per cent with the 100 kg N/ha dose, which is an expected result for this type of soils. However, in the presence of any level of vinasse, N effect on yield was null or small and yields were comparable or a little higher than those obtained for the witness crop, which was applied only with N in the higher dose. The highest yields were obtained for those treatments with vinasse and 0 N when compared to traditional treatment (100 kg N/ha), this indicates that vinasse is covering for all the N that the cultivar need and also is making corrections for other nutrients which affect the production in these soils.
100
105
110
115
120
125
130
0 50 100
TCH
N applied (kg/ha)
0 vinasse
10 vinasse
30 vinasse
60 vinasse
90 vinasse

164
The use of high doses of vinasse (> 60 m3/ha) is attractive due to the production increments and the potential reduction of N doses; however, it is important to consider that the continuous application of high levels of vinasse may cause the significant increment of exchangeable K in soils, as shown in Figure 15. It is observed that annual application of 120 m3 of vinasse/ha, for six consecutive years increased 25 times the original K concentration on soil surface (0-25 cm) going from 70 up to 1,750 ppm at the end of the study. On the other hand, it can be observed, for those treatments with the higher doses of vinasse, that K concentration has migrated to lower stratum (but no lower than 75 cm in depth). Increments of exchangeable K in soil produce disbalances in soil bases due to the fact that Ca and Mg contents do not change, while K saturation is increased (Pérez et al., 2011). In consecuence, it is important to have control on the applied doses of vinasse in commercial fields and to monitor the evolution of K in soil. In Brazil, it has been reported that with high concentrations of applied vinasse, cane maturation is retarded, pol %cane is reduced and the contents of K and ashes are increased in sugarcane juice, which may result in problems during sugar production process in the mill ( Silva et al., 1976; Orlando Filho et al., 1995).
Figure 15. Effect of application of different doses of vinasse for 6 consecutive years on exchangeable K in the profile of an Andisol deep soil. El Bálsamo. Pantaleón Sugar Mill. (Pérez et al., 2011)
0
25
50
75
100
125
150
175
200
2250 200 400 600 800 1000 1200 1400 1600 1800
Dep
th
(cm
)
K (ppm)
0 30 60 90 120 Vin (m3/ha)
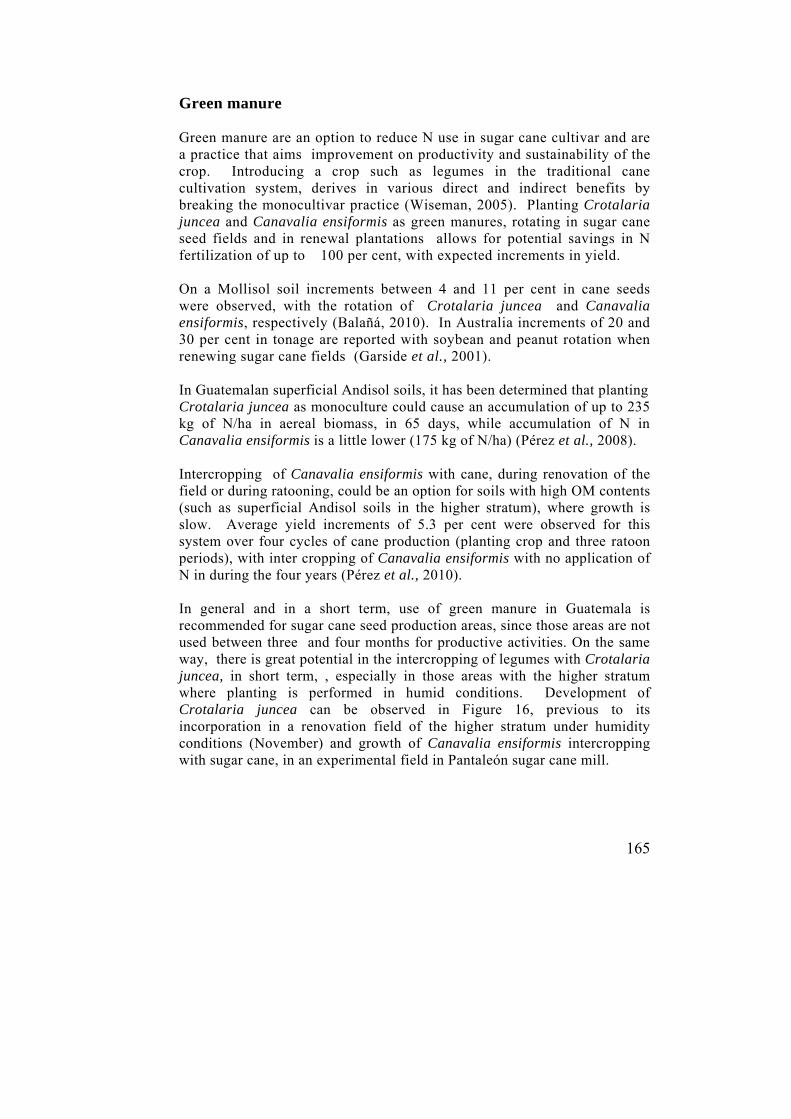
165
Green manure Green manure are an option to reduce N use in sugar cane cultivar and are a practice that aims improvement on productivity and sustainability of the crop. Introducing a crop such as legumes in the traditional cane cultivation system, derives in various direct and indirect benefits by breaking the monocultivar practice (Wiseman, 2005). Planting Crotalaria juncea and Canavalia ensiformis as green manures, rotating in sugar cane seed fields and in renewal plantations allows for potential savings in N fertilization of up to 100 per cent, with expected increments in yield. On a Mollisol soil increments between 4 and 11 per cent in cane seeds were observed, with the rotation of Crotalaria juncea and Canavalia ensiformis, respectively (Balañá, 2010). In Australia increments of 20 and 30 per cent in tonage are reported with soybean and peanut rotation when renewing sugar cane fields (Garside et al., 2001). In Guatemalan superficial Andisol soils, it has been determined that planting Crotalaria juncea as monoculture could cause an accumulation of up to 235 kg of N/ha in aereal biomass, in 65 days, while accumulation of N in Canavalia ensiformis is a little lower (175 kg of N/ha) (Pérez et al., 2008). Intercropping of Canavalia ensiformis with cane, during renovation of the field or during ratooning, could be an option for soils with high OM contents (such as superficial Andisol soils in the higher stratum), where growth is slow. Average yield increments of 5.3 per cent were observed for this system over four cycles of cane production (planting crop and three ratoon periods), with inter cropping of Canavalia ensiformis with no application of N in during the four years (Pérez et al., 2010). In general and in a short term, use of green manure in Guatemala is recommended for sugar cane seed production areas, since those areas are not used between three and four months for productive activities. On the same way, there is great potential in the intercropping of legumes with Crotalaria juncea, in short term, , especially in those areas with the higher stratum where planting is performed in humid conditions. Development of Crotalaria juncea can be observed in Figure 16, previous to its incorporation in a renovation field of the higher stratum under humidity conditions (November) and growth of Canavalia ensiformis intercropping with sugar cane, in an experimental field in Pantaleón sugar cane mill.
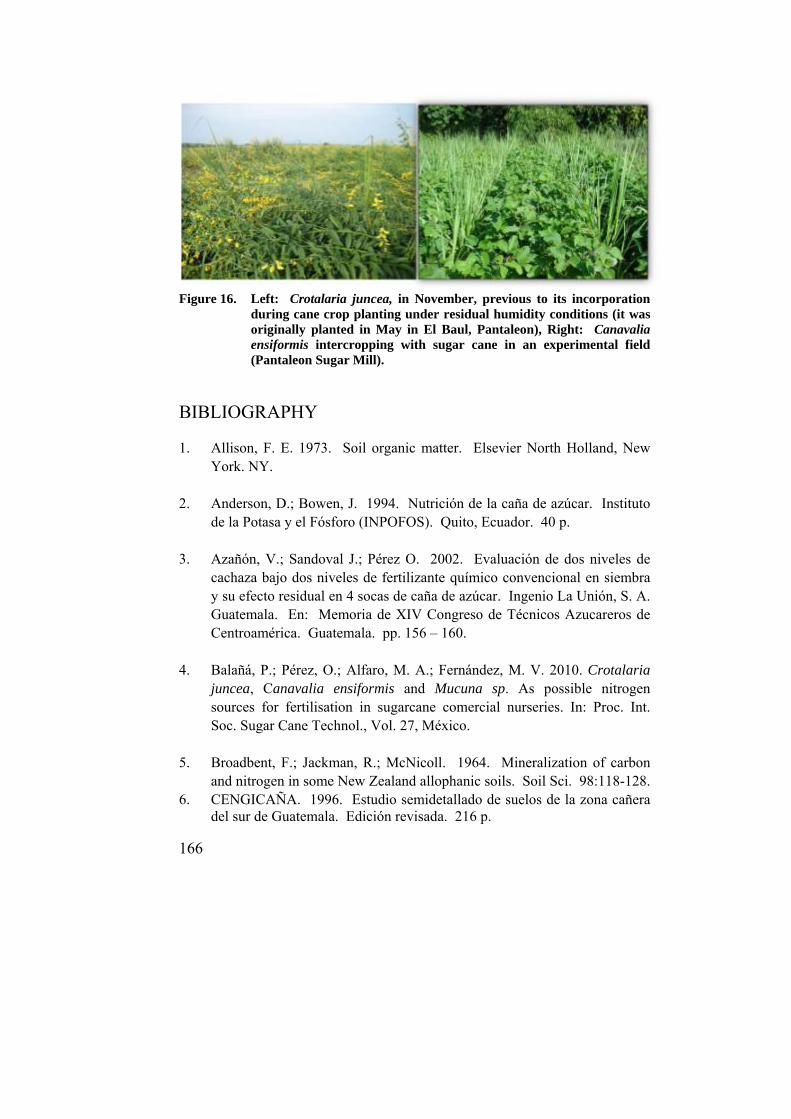
166
Figure 16. Left: Crotalaria juncea, in November, previous to its incorporation
during cane crop planting under residual humidity conditions (it was originally planted in May in El Baul, Pantaleon), Right: Canavalia ensiformis intercropping with sugar cane in an experimental field (Pantaleon Sugar Mill).
BIBLIOGRAPHY 1. Allison, F. E. 1973. Soil organic matter. Elsevier North Holland, New
York. NY. 2. Anderson, D.; Bowen, J. 1994. Nutrición de la caña de azúcar. Instituto
de la Potasa y el Fósforo (INPOFOS). Quito, Ecuador. 40 p. 3. Azañón, V.; Sandoval J.; Pérez O. 2002. Evaluación de dos niveles de
cachaza bajo dos niveles de fertilizante químico convencional en siembra y su efecto residual en 4 socas de caña de azúcar. Ingenio La Unión, S. A. Guatemala. En: Memoria de XIV Congreso de Técnicos Azucareros de Centroamérica. Guatemala. pp. 156 – 160.
4. Balañá, P.; Pérez, O.; Alfaro, M. A.; Fernández, M. V. 2010. Crotalaria
juncea, Canavalia ensiformis and Mucuna sp. As possible nitrogen sources for fertilisation in sugarcane comercial nurseries. In: Proc. Int. Soc. Sugar Cane Technol., Vol. 27, México.
5. Broadbent, F.; Jackman, R.; McNicoll. 1964. Mineralization of carbon
and nitrogen in some New Zealand allophanic soils. Soil Sci. 98:118-128. 6. CENGICAÑA. 1996. Estudio semidetallado de suelos de la zona cañera
del sur de Guatemala. Edición revisada. 216 p.
167
7. Garside, A.L.; Bell, M.J.; Bethelsen, J.E.; Halpin. 2001. Species and Management of fallow legumes in sugarcane farming system. In: Australian Society of Agronomy. http://www.regional.org.au/au/asa/2001/2/a/garside2.htm
8. Humbert, R. 1974. El cultivo de la caña de azúcar. Compañía Editorial
Continental. Mexico. 697 p. 9. Marshner, H. 1995. Mineral nutrition of higher plants. Second Edition.
San Diego CA, USA. 889 p. 10. Mengel, K.; Kirkby, E. 2000. Principios de nutrición vegetal.
International Potash Institute. Worblaufen_BERN, Switzerland. 665 p. 11. Montenegro, O.; Chan, M.; Montepeque, R; Juárez, D.; Pérez O. 2000.
Épocas y formas de aplicación de N bajo diferentes épocas de iniciación de riego. En: Memoria. Presentación de resultados de investigación. Zafra 1999-2000. Guatemala, CENGICAÑA. pp. 133
12. Pennati, C.; De Araujo, J.; Donzelli, J.; De Souza, S.; Forti, J.; Ribeiro, R.
2005. Vinasse: A liquid fertilizer. Proc. Int. Soc. Sugar Cane Technol. 25 (1): 403 – 411.
13. Orlando Filho, J.; Bittencourt, V.C.; Alves, M.C. 1995. Aplicaçao de
vinhaça em solo arenoso do Brasil e poluiçao do lençol freático com nitrogênio. IN: Congreso Nacional da Sociedade de Tecnicos Açucareiros e Alcooleiros do Brasil. Vol. 13, n°. 6. Rio de Janeiro, Annais, p14-17.
14. Pérez, O.; Ovalle, W.; Urquiaga, S. 2005. Update on biological nitrogen
fixation research on sugar cane in Guatemala. Sugar Cane International the Journal of Cane Agriculture. 23:19:22.
15. Pérez, O.; Ufer, C.; Azañon, V. and Solares, E. 2010. Strategies for the
optimal use of nitrogen fertilisers in the sugarcane crop in Guatemala. In: Proc. XXVII Int. Soc. Sugar Cane Technol. México.
16. Pérez, O.; Hernández, F.; López, A.; Balañá, P.; Solares, E.; Maldonado,
A. 2008. The use of green manures as an alternative to improve and sustainability of the sugarcane crop. Sugar Journal. Vol. 70. No. 9. pp. 14-21.
168
17. Pérez, O.; López, A.; Hernández F.; Chajil E. 2007. Efecto del fraccionamiento del fertilizante fosforado en el cultivo de caña de azúcar en suelos andisoles. 2007. En: Memoria. Presentación de resultados de investigación. Zafra 2006-2007. Guatemala, CENGICAÑA. pp. 143-147.
18. Pérez O.; Hernández, F.; Acan, J.; López A.; Ralda G. 2011. Potencial
de la vinaza en la reducción de las dosis de nitrógeno en el cultivo de caña de azúcar y su efecto en la acumulación de potasio y otros nutrientes en el perfil del suelo. En: Memoria de Presentación de Resultados de Investigación Zafra 2010-2011. Guatemala, CENGICAÑA. pp. 191-199.
19. Pérez, O.; Hernández, F.; Sandoval, F.; Azañón, V.; Ralda, G.; Fillipi, J.
2004. Efecto de las aplicaciones de azufre, nitrógeno y potasio en caña de azúcar en suelos de la región cañera de Guatemala. En: Memoria Presentación resultados de investigación. Zafra 2003-2004. Guatemala, CENGICAÑA. pp. 149-157.
20. Pérez, O.; Hernández, F.; Azañón, V.; García, C.; Ramírez, C.; Cifuentes,
V.; Solares E.; Acan, J.; Natareno E. 2011. Nutrientes limitantes en el cultivo de caña de azúcar en suelos de baja productividad de la zona cañera de Guatemala. En: Memoria. Presentación de resultados de investigación. Zafra 2010-2011. Guatemala, CENGICAÑA. pp. 181-190.
21. Pérez, O. 2003. Uso y manejo agronómico de cachaza en Guatemala.
En: Revista de la Asociación de Técnicos Azucareros de Guatemala, ATAGUA, Edición Septiembre.
22. Pérez, O. 2001. Fertilización nitrogenada en caña de azúcar. Síntesis de
resultados de investigación de la zona cañera de Guatemala. En: Memoria de X Congreso Nacional de la Caña de Azúcar. ATAGUA. Guatemala. pp. 98-104.
23. Pérez, O.; Cruz, W.; Hernández, F. 1998. Épocas de aplicación y
fraccionamiento de nitrógeno en suelo liviano. En: Memoria. Presentación de resultados de investigación. Zafra 1997-1998. Guatemala, CENGICAÑA. 107 p.
24. Pérez, O.; Melgar, M.; LAZCANO-FERRAT. 2003. Phosphorus
Fertilization and Phosphorus- Extraction Method Calibration for Sugarcane Soils. Better Crops International. Vol. 17, No. 2. pp. 26-29.
169
25. Pérez, O.; Melgar. M. 1998. Sugar Cane Response to Nitrogen Phosphorus and Potassium Application in Andisol Soils. Better Crops International. Vol. 12, No. 2. pp. 20-24.
26. Pérez, O.; Melgar, M. 2000. Sugar cane Response to Potassium
Fertilization on Andisol, Entisol and Mollisol soils of Guatemala. Better Crops International. Vol. 14 (2): pp. 20-22.
27. Silva, G. M. de A.; Pozzi de Castro, O. L. J.; Magro, J. A. 1976.
Comportamento agroindustrial da cana-de-açucar em solo irrigado e nâo irrigado com vinhaça. In: Seminario Copersucar da Industria AÇucareira, 4., Anais…Aguas de Lindóia. pp. 107 – 122.
28. Villatoro, B.; Pérez, O.; Suárez, A.; de Cano, W.; del Cid, J. 2009.
Segunda aproximación de mapas temáticos de fertilidad y texturas: Herramienta de apoyo para la Agroindustria Azucarera Guatemalteca. En: Memoria. Presentación de resultados de investigación. Zafra 2008-2009. Guatemala, CENGICAÑA. pp. 240 – 248.
29. Wiseman J. 2005. Green Manuring. Sugar Journal. Vol: 67, No. 12. pp.
14-21.

170
171
VIII. IRRIGATION OF SUGARCANE CROP
172
IRRIGATION OF SUGARCANE CROP
Otto Castro
INTRODUCTION Irrigation is a very important activity in the Guatemalan sugarcane plantation area. It takes place along with the harvesting during the dry season (from the middle of November to mid May). Irrigation activities are increased as one gets closer to seashore were water deficiencies are bigger. By 2000 there was a burst in the irrigation practices in the area under administration by the mills, growing from 61 per cent up to 80 per cent by the 2009/2010 harvesting season. The objectives of the irrigation practices are: assure initial crop population and increase of stalk weight. The activities are programmed post harvest, during plantation or before harvesting, depending on the crop need and phenological stage. Nowadays, to select the appropriate irrigation system, the following parameters are considered: efficiency in the use of water, investment savings and irrigation system management. These allow to reach optimal use of water from different sources such as: rivers, wells, deep wells, artisan wells and wastewater from industrial sources. In this chapter, first the evolution of irrigation practices is described, then the classification of irrigation systems in use and the influence of these activities in increasing productivity (in tones of sugarcane per hectare, TCH). Also, there is information on irrigation planning and decision making from a technical point of view, and important recommendations on the use of technical tools used to ease irrigation activities in the field.
EVOLUTION OF IRRIGATION PRACTICES IN GUATEMALAN SUGARCANE PLANTING ZONE During the 1990´s the predominant irrigation systems were by gravity, by flooding, canyon spraying; then by 1998, new technologies came to hand. Different approaches to irrigate among furrow (all or every other furrow); uses of water pumping systems, gravity conduction or canyon spray were employed.
Agr. Eng., M.Sc., Specialist in Irrigation at CENGICAÑA. www.cengicana.org
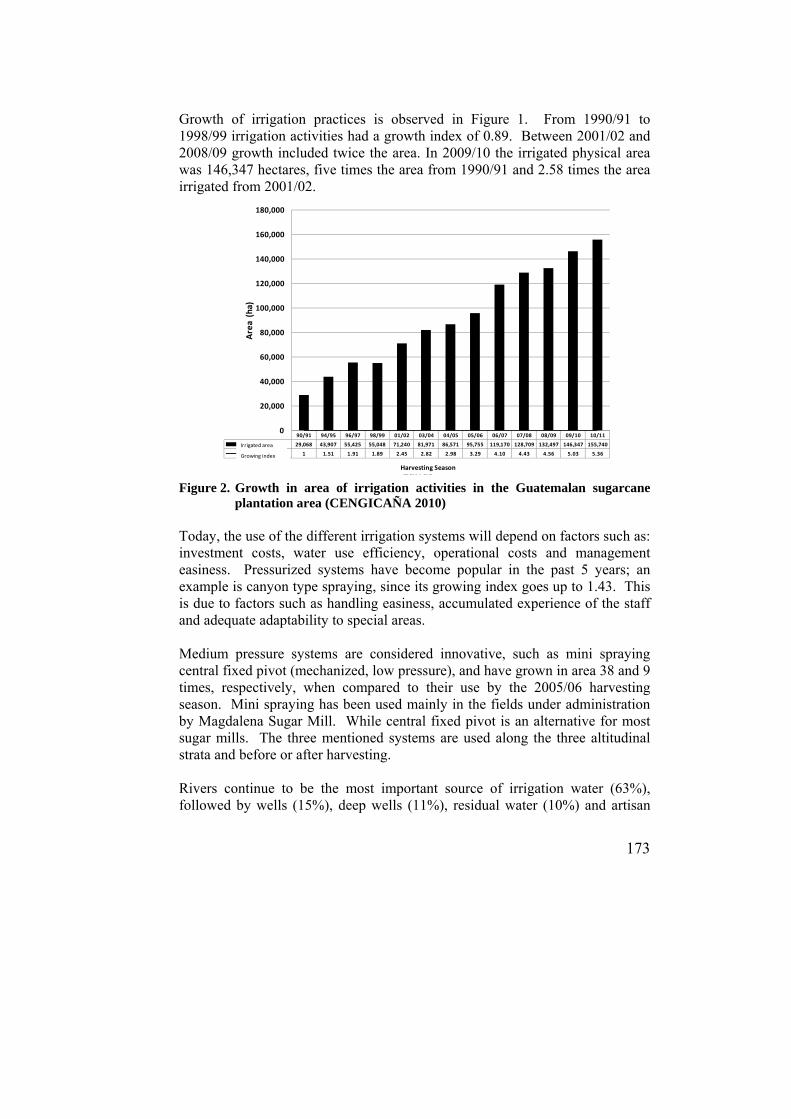
173
Growth of irrigation practices is observed in Figure 1. From 1990/91 to 1998/99 irrigation activities had a growth index of 0.89. Between 2001/02 and 2008/09 growth included twice the area. In 2009/10 the irrigated physical area was 146,347 hectares, five times the area from 1990/91 and 2.58 times the area irrigated from 2001/02.
Figure 2. Growth in area of irrigation activities in the Guatemalan sugarcane
plantation area (CENGICAÑA 2010) Today, the use of the different irrigation systems will depend on factors such as: investment costs, water use efficiency, operational costs and management easiness. Pressurized systems have become popular in the past 5 years; an example is canyon type spraying, since its growing index goes up to 1.43. This is due to factors such as handling easiness, accumulated experience of the staff and adequate adaptability to special areas. Medium pressure systems are considered innovative, such as mini spraying central fixed pivot (mechanized, low pressure), and have grown in area 38 and 9 times, respectively, when compared to their use by the 2005/06 harvesting season. Mini spraying has been used mainly in the fields under administration by Magdalena Sugar Mill. While central fixed pivot is an alternative for most sugar mills. The three mentioned systems are used along the three altitudinal strata and before or after harvesting. Rivers continue to be the most important source of irrigation water (63%), followed by wells (15%), deep wells (11%), residual water (10%) and artisan
Zafras
90/91 94/95 96/97 98/99 01/02 03/04 04/05 05/06 06/07 07/08 08/09 09/10 10/11
Hectáreas regadas 29,068 43,907 55,425 55,048 71,240 81,971 86,571 95,755 119,170 128,709 132,497 146,347 155,740
Índice de crecimento 1 1.51 1.91 1.89 2.45 2.82 2.98 3.29 4.10 4.43 4.56 5.03 5.36
0
20,000
40,000
60,000
80,000
100,000
120,000
140,000
160,000
180,000
Area(ha)
Harvesting Season
Irrigated area
Growing index
174
made wells (1%). It Is important to mention that the use of deep wells has grown 5 times during the last harvesting season if compared to season 2003/04.
CLASSIFICATION OF IRRIGATION SYSTEMS IN GUATEMALAN SUGARCANE PLANTING ZONE The Agro Industry Irrigation Committee analyzed and validated in 2005 the following classification for the sugarcane plantation area: Irrigation systems by groove These are different because of the way water is extracted from the source: a) furrows with water extracted by gravity and b) furrows with water extracted using fossil energy. For both, water transportation and distribution on the plot can be done by any of the following modalities: 1. Continuous furrows, without piping in the water transportation or
distribution 2. Alternated furrows, withoutpiping in the water transportation or
distribution 3. Continuous furrows with mobile PVC piping and use of impulses 4. Continuous furrows using polyethylene sleeves during water distribution,
it is a fixed system 5. Alternated furrows with mobile PVC piping and use of impulses 6. Alternated furrows using polyethylene sleeves during water
transportation and distribution, it is a fixed system that uses gates Pressurized irrigation systems: Stationary sprinkler systems: They are fixed during irrigation, are differentiated by the energy type and operation pressure of sprinklers, according to Tarjuelo, 1995, these are classified as: 1. High pressure spray gun type, powered by gravity. This system uses
the height differential energy, it has fixed pipe in drive and distributes water to the plot through hydrants. It uses mobile pipe sprinkler distribution of high pressure (40-50 PSI). Two sprinklers operate in each hydrant. The water distribution efficiency should be between 75 and 80 percent in the plot.
2. High pressure spray gun with fossil energy type. This is a mobile
system in all its components, works with a pump, conduction and
175
distribution piping with high pressure sprinklers (40-50 PSI). The number of operating sprinklers varies from two to eight. Water distribution efficiency by plot should be between 75 and 80 percent.
3. Medium pressure spray and fossil energy. Used variants: Mobile
system in all its components and the mobile system only in the water distribution part. It works with motor pump which sprinklers are medium pressure (30-40 PSI). Amount of sprinklers per side varies from 25 to 30. This is a system designed to work mainly with eight sides. It is known as mini spraying in the industry (when compared to the high pressure spray gun).
Sprinkler systems with continuous displacement:, and are classified as:
1. Pivots (circular displacement) fixed and mobile
Fixed pivot (not transportable system): this system has a fixed irrigation branch where it receives water and electric energy, and a mobile branch which moves in circular manner, rotating over the first. It is formed by emission carrying piping, mounted on approximately 11 automotive towers. Pluviometric results are different for each tower. Branch mobility could be hydraulic, too. Water distribution efficiency by These systems irrigate the crop while moving, they differ in the way of displacement, and the sprinklers are characterized by operating at low pressure (<20 psi) and are classified as:
- Moving branches known as mechanized systemsplot should be between 85 and 90 percent.
Mobile pivot (transportable system): it is transported by tractor in different positions depending on the agronomical design. It can work in a fixed position, irrigating just as fixed pivot system, but with a smaller amount of towers, usually four. Water distribution efficiency by plot should be between 80 and 85 percent. 2. Frontal Advance (parallel displacement): Water distribution efficiency by plot should be between 85 and 90 percent. One wing frontal advance, not pivot: this system moves in parallel, at the same time it applies water, it is formed by a side branch or wing, and in one side it gets the water from a channel with the use of a pump. It may vary between 200 and 600 m in length. Pluviometry is uniform along the branch. When it finishes its trip along the plot, it returns in the same plot.
176
One wing frontal advance, pivot: the difference between this system and the one described above is that it makes a 180º turn at the end of the plot, allowing it to apply water in a different plot. Two winged frontal advance: it moves in parallel form while applying water, it is formed by two side branches or wings, one, to each side of the water supply line. It can be 200 to 500 meters in length. Pluviometry is uniform along the branch. At the end of its trip, it returns over the same plot. Giant Sprinkler: Travelling gun: the gun is mounted over a vehicle that moves guided by a cable and is fed by a flexible hose tied to a hydrant. It uses high pressure gun type sprinklers (> 50 PSI). Water distribution efficiency in the plot, should be between 75 and 80 per cent. Drip irrigation systems: the characteristic of these systems is that water distribution is by drips, which only wet the area with the highest concentration of sugarcane roots. Irrigation water should be of high quality. The system is very efficient in water distribution, closer 95 per cent.
IRRIGATION EFFECT ON SUGARCANE AND SUCROSE YIELD INCREASE Sugarcane crop is managed under very different conditions among the sugarcane plantation area in Guatemala; different types of soil have different capacities to store and/or provide water, the climate can cause different signs of hydric deficiency, depending on the altitudinal stratum. Besides, sugarcane can generate different responses to irrigation, depending on the time of the year, when it was planted. Research work (including experimental research, validation fields and observations) performed since 1994 in different parts of the sugarcane plantation area; indicate that crop response to water application depends on the following factors: altitudinal stratum, cane phenology, period in the harvesting season, soil water retention capacity and management of the irrigation systems. Figure 2, includes a qualitative analysis of the best results obtained in terms of crop response to irrigation.
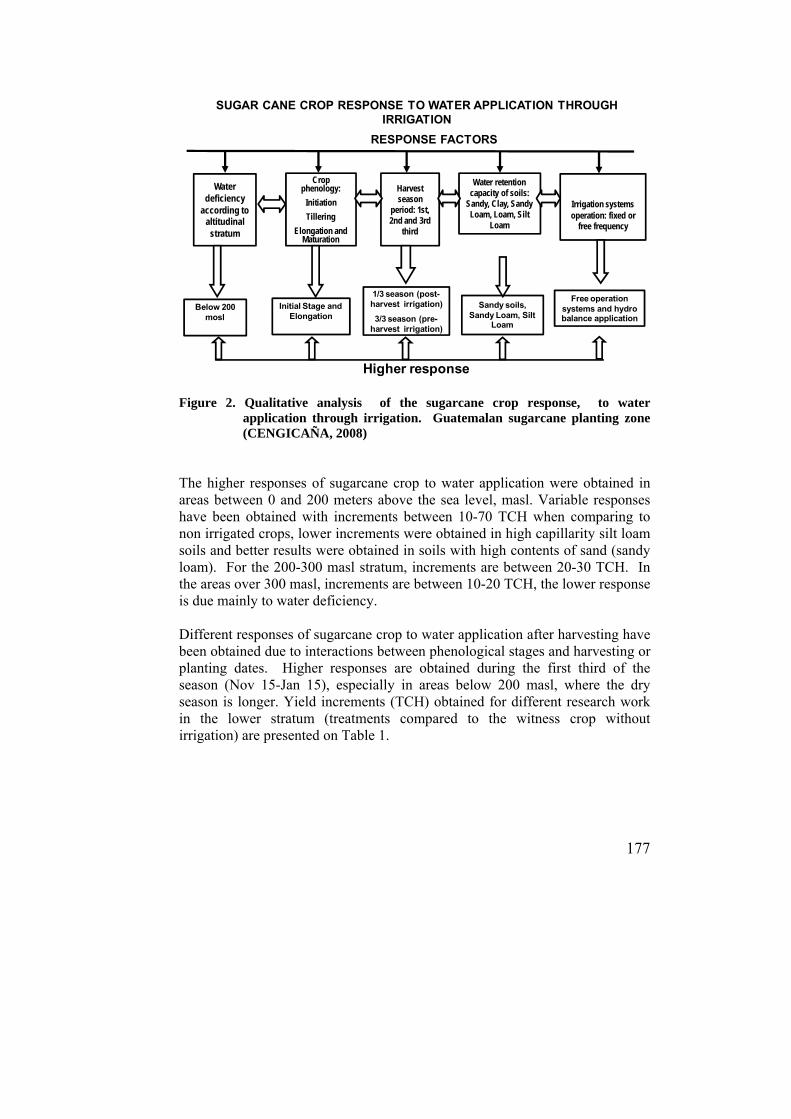
177
Figure 2. Qualitative analysis of the sugarcane crop response, to water
application through irrigation. Guatemalan sugarcane planting zone (CENGICAÑA, 2008)
The higher responses of sugarcane crop to water application were obtained in areas between 0 and 200 meters above the sea level, masl. Variable responses have been obtained with increments between 10-70 TCH when comparing to non irrigated crops, lower increments were obtained in high capillarity silt loam soils and better results were obtained in soils with high contents of sand (sandy loam). For the 200-300 masl stratum, increments are between 20-30 TCH. In the areas over 300 masl, increments are between 10-20 TCH, the lower response is due mainly to water deficiency. Different responses of sugarcane crop to water application after harvesting have been obtained due to interactions between phenological stages and harvesting or planting dates. Higher responses are obtained during the first third of the season (Nov 15-Jan 15), especially in areas below 200 masl, where the dry season is longer. Yield increments (TCH) obtained for different research work in the lower stratum (treatments compared to the witness crop without irrigation) are presented on Table 1.
Water deficiency
according to altitudinal
stratum
Crop phenology:
Initiation
Tillering
Elongation and Maturation
Harvest season
period: 1st, 2nd and 3rd
third
Water retention capacity of soils:
Sandy, Clay, Sandy Loam, Loam, Silt
Loam
Irrigation systems operation: fixed or
free frequency
RESPONSE FACTORS
Higher response
Below 200 mosl
Initial Stage and Elongation
1/3 season (post-harvest irrigation)
3/3 season (pre-harvest irrigation)
Sandy soils, Sandy Loam, Silt
Loam
Free operation systems and hydro balance application
SUGAR CANE CROP RESPONSE TO WATER APPLICATION THROUGH IRRIGATION

178
Table 1. Yield increment (TCH) due to after harvesting irrigation, for soils with main texture types in Guatemalan cane planting zone (CENGICAÑA, 2006)
Texture Predominant sandy Loam Silt Loam
LARA2 30 40 50 60 70 80 TCH Increment (according to non irrigated witness crop)
60 51 43 34 26 17
Mm of required net water3 270 240 200 240 140 160 Note1: Results are given for harvesting or planting performed during the first third of the harvesting season, in the low stratum (<100 masl) Note2: LARA=Readily available film of water, at 60 cm of soil depth, given in mm Note3: For harvest performed during the first third of the season, the industry average is 360 mm using gun type sprinkling aspersion,: 6 applications of water, frequency of 20 days during 3 hours, 60 mm of net water film per irrigation
When evaluating susceptibility of sugarcane crop to water deficiency, the following stages are considered: initiation or preparation (45 days), rapid growth period or elongation (about six months). These stages are more sensitive to water deficiency so they must be prioritized during irrigation planning for each one of the harvesting periods. The main objective of applying water after harvesting (post harvesting irrigation), during the initiation stage is to assure optimum crop population, also optimize fertilization and weed control practices. When harvesting or planting is performed during the first third of the harvesting season, there is a critical period for irrigation during elongation of the plant which comes between April and May. Water deficiency effects are more evident after hot phases of the “ENSO” phenomenon, known as Niño. This phenomenon causes a delay in the beginning of the rainy season, moving it to the beginning of June in the low and seashore strata; when this occurs, yield reductions have been observed between 10 and 20 TCH under the absence of water application and rain delay. When harvesting or planting during the second third of the harvesting season (between January and March) the critical period is at the end of elongation stage, especially if the rainy season ends by mid October, in which case, pre harvesting irrigations should be performed by the second half of October and November. These irrigations are necessary up to 30 days before harvesting, mainly in areas predominant in clay and sand, while in those soils with adequate water retention such as silt loam or silty clay loam, last irrigation can be performed 45 days before harvesting. Tillering stage is less sensitive, so irrigation frequency may be spaced. The objective of irrigation before harvesting is to assure the increment in weight of sugarcane stalks at the end of the elongation stage, which takes place at the end of the harvesting season. Important outcomes were obtained in
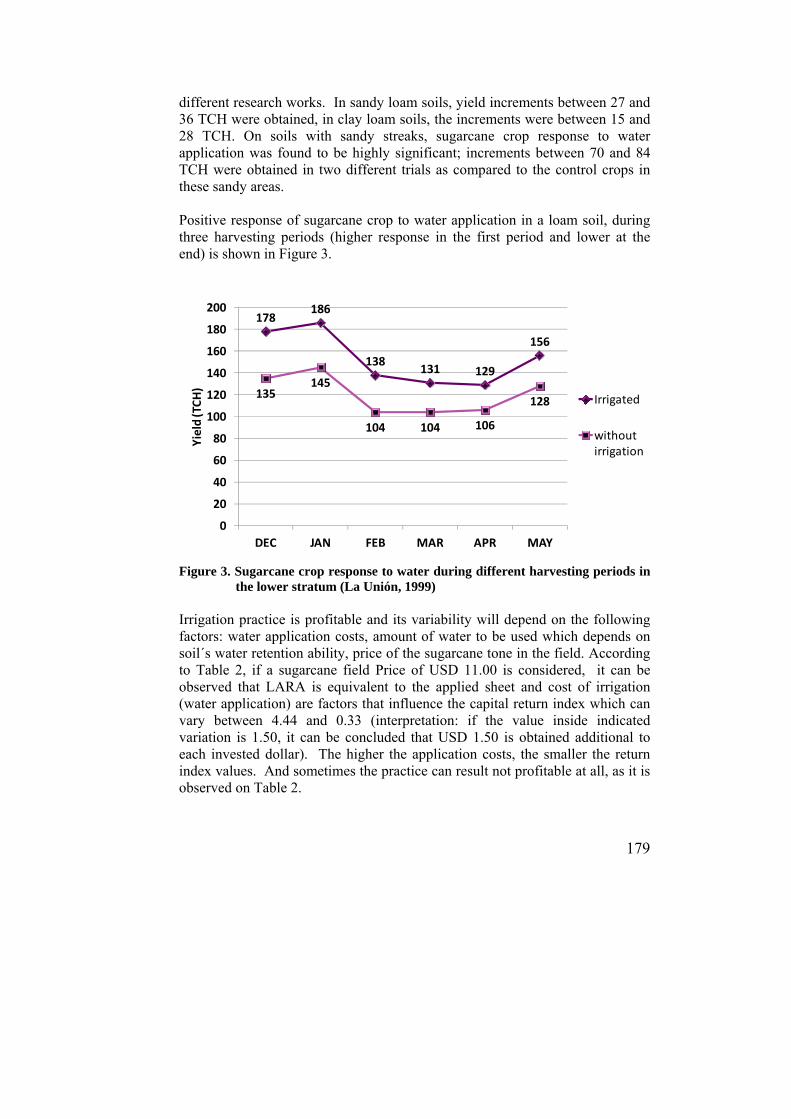
179
different research works. In sandy loam soils, yield increments between 27 and 36 TCH were obtained, in clay loam soils, the increments were between 15 and 28 TCH. On soils with sandy streaks, sugarcane crop response to water application was found to be highly significant; increments between 70 and 84 TCH were obtained in two different trials as compared to the control crops in these sandy areas. Positive response of sugarcane crop to water application in a loam soil, during three harvesting periods (higher response in the first period and lower at the end) is shown in Figure 3.
Figure 3. Sugarcane crop response to water during different harvesting periods in the lower stratum (La Unión, 1999)
Irrigation practice is profitable and its variability will depend on the following factors: water application costs, amount of water to be used which depends on soil´s water retention ability, price of the sugarcane tone in the field. According to Table 2, if a sugarcane field Price of USD 11.00 is considered, it can be observed that LARA is equivalent to the applied sheet and cost of irrigation (water application) are factors that influence the capital return index which can vary between 4.44 and 0.33 (interpretation: if the value inside indicated variation is 1.50, it can be concluded that USD 1.50 is obtained additional to each invested dollar). The higher the application costs, the smaller the return index values. And sometimes the practice can result not profitable at all, as it is observed on Table 2.
178186
138131 129
156
135145
104 104 106
128
0
20
40
60
80
100
120
140
160
180
200
DEC JAN FEB MAR APR MAY
Yield (TCH)
Irrigated
withoutirrigation
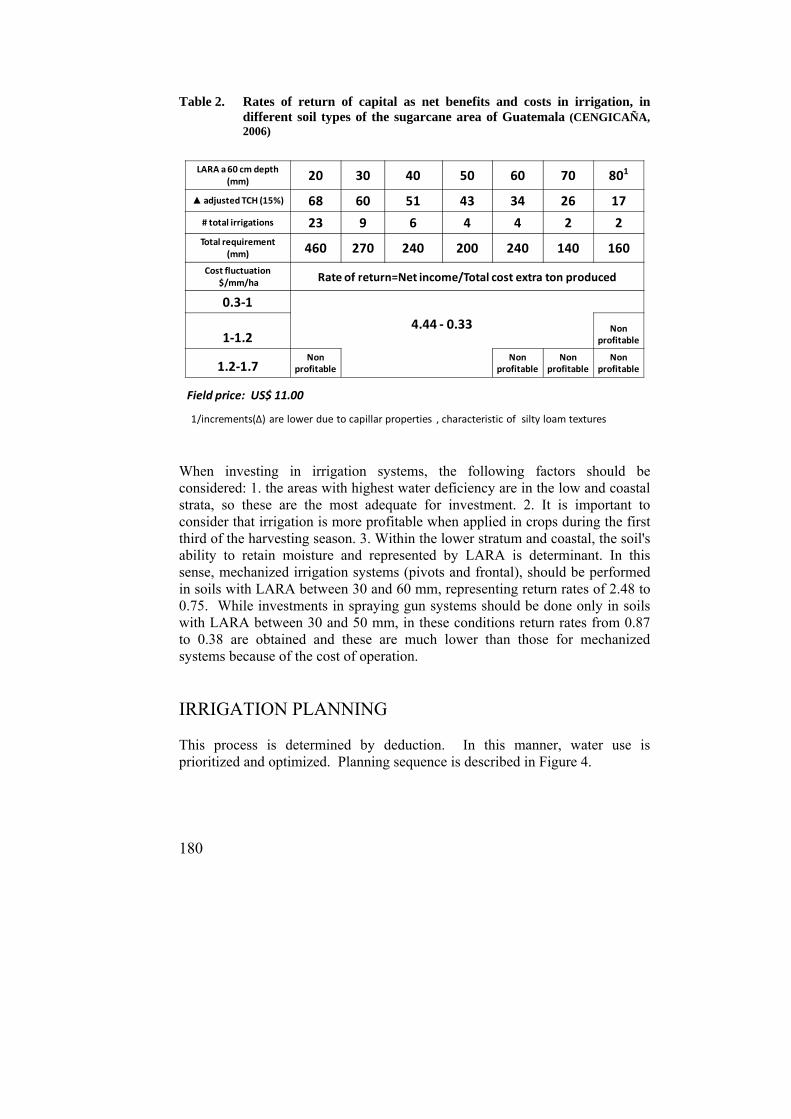
180
Table 2. Rates of return of capital as net benefits and costs in irrigation, in different soil types of the sugarcane area of Guatemala (CENGICAÑA, 2006)
When investing in irrigation systems, the following factors should be considered: 1. the areas with highest water deficiency are in the low and coastal strata, so these are the most adequate for investment. 2. It is important to consider that irrigation is more profitable when applied in crops during the first third of the harvesting season. 3. Within the lower stratum and coastal, the soil's ability to retain moisture and represented by LARA is determinant. In this sense, mechanized irrigation systems (pivots and frontal), should be performed in soils with LARA between 30 and 60 mm, representing return rates of 2.48 to 0.75. While investments in spraying gun systems should be done only in soils with LARA between 30 and 50 mm, in these conditions return rates from 0.87 to 0.38 are obtained and these are much lower than those for mechanized systems because of the cost of operation.
IRRIGATION PLANNING This process is determined by deduction. In this manner, water use is prioritized and optimized. Planning sequence is described in Figure 4.
LARA a 60 cm depth (mm) 20 30 40 50 60 70 801
▲ adjusted TCH (15%) 68 60 51 43 34 26 17
# total irrigations 23 9 6 4 4 2 2Total requirement
(mm) 460 270 240 200 240 140 160
Cost fluctuation$/mm/ha Rate of return=Net income/Total cost extra ton produced
0.3‐1
1‐1.24.44 ‐ 0.33 Non
profitable
1.2‐1.7Non
profitableNon
profitableNon
profitableNon
profitable
Field price: US$ 11.00
1/increments(∆) are lower due to capillar properties , characteristic of silty loam textures
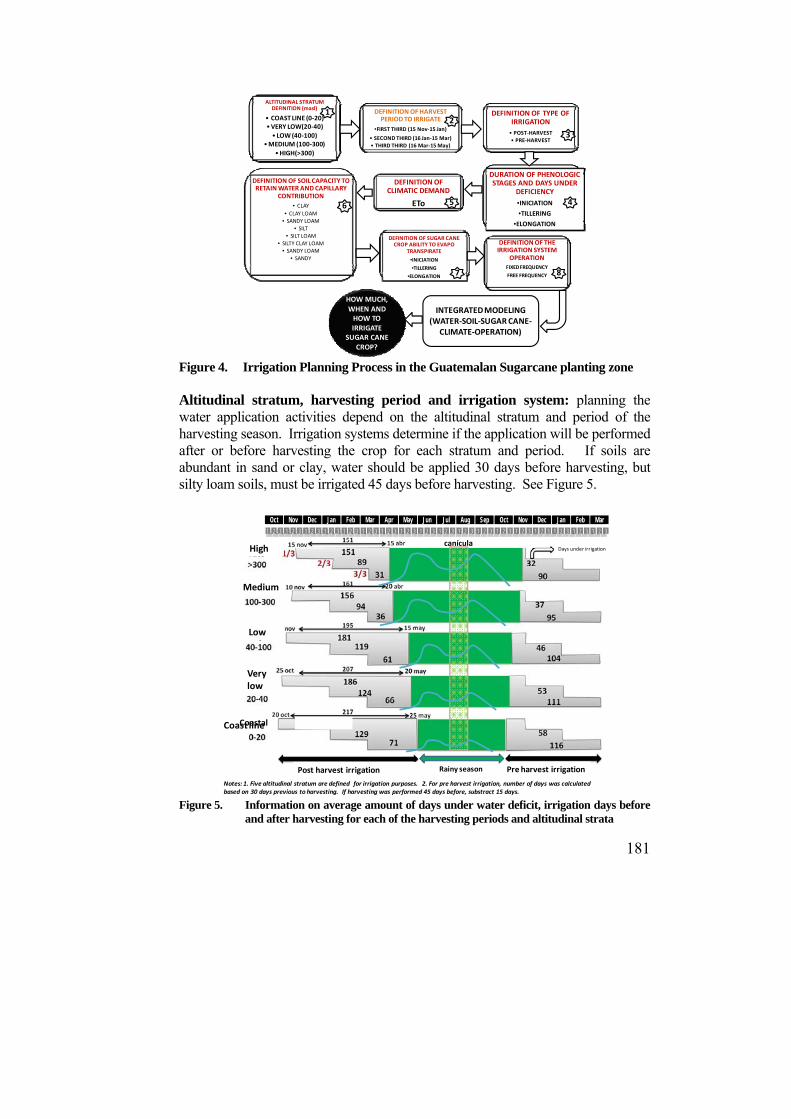
181
Figure 4. Irrigation Planning Process in the Guatemalan Sugarcane planting zone
Altitudinal stratum, harvesting period and irrigation system: planning the water application activities depend on the altitudinal stratum and period of the harvesting season. Irrigation systems determine if the application will be performed after or before harvesting the crop for each stratum and period. If soils are abundant in sand or clay, water should be applied 30 days before harvesting, but silty loam soils, must be irrigated 45 days before harvesting. See Figure 5.
Figure 5. Information on average amount of days under water deficit, irrigation days before
and after harvesting for each of the harvesting periods and altitudinal strata
ALTITUDINAL STRATUM DEFINITION (masl)
• COAST LINE (0‐20)•VERY LOW(20‐40)
• LOW (40‐100)•MEDIUM (100‐300)
•HIGH(>300)
DEFINITION OF HARVEST PERIOD TO IRRIGATE
•FIRST THIRD (15 Nov‐15 Jan)
• SECOND THIRD (16 Jan‐15 Mar)• THIRD THIRD (16 Mar‐15 May)
DEFINITION OF THE IRRIGATION SYSTEM
OPERATION
FIXED FREQUENCY
FREE FREQUENCY
DEFINITION OF SOIL CAPACITY TO RETAIN WATER AND CAPILLARY
CONTRIBUTION
• CLAY
• CLAY LOAM• SANDY LOAM
• SILT• SILT LOAM
• SILTY CLAY LOAM• SANDY LOAM
• SANDY
DEFINITION OF CLIMATIC DEMAND
ETo
DEFINITION OF TYPE OF IRRIGATION
• POST‐HARVEST• PRE‐HARVEST
HOW MUCH, WHEN AND HOW TO IRRIGATE
SUGAR CANE CROP?
DEFINITION OF SUGAR CANE CROP ABILITY TO EVAPO
TRANSPIRATE
•INICIATION
•TILLERING
•ELONGATION
DURATION OF PHENOLOGIC STAGES AND DAYS UNDER
DEFICIENCY
•INICIATION
•TILLERING
•ELONGATION
12
3
456
7 8
INTEGRATED MODELING (WATER‐SOIL‐SUGAR CANE‐
CLIMATE‐OPERATION)
Período de lluvia
canícula
Rainy season
Notes: 1. Five altitudinal stratum are defined for irrigation purposes. 2. For pre harvest irrigation, number of days was calculatedbased on 30 days previous to harvesting. If harvesting was performed 45 days before, substract 15 days.
Medium
Low
Verylow
Coast line
Post harvest irrigation Pre harvest irrigation
Days under irrigationHigh
Oct Nov Dec Jan Feb Mar Apr May Jun Jul Aug Sep Oct Nov Dec Jan Feb Mar
1 2 3 1 2 3 1 2 3 1 2 3 1 2 3 1 2 3 1 2 3 1 2 3 1 2 3 1 2 3 1 2 3 1 2 3 1 2 3 1 2 3 1 2 3 1 2 3 1 2 3 1 2 3
Coastal
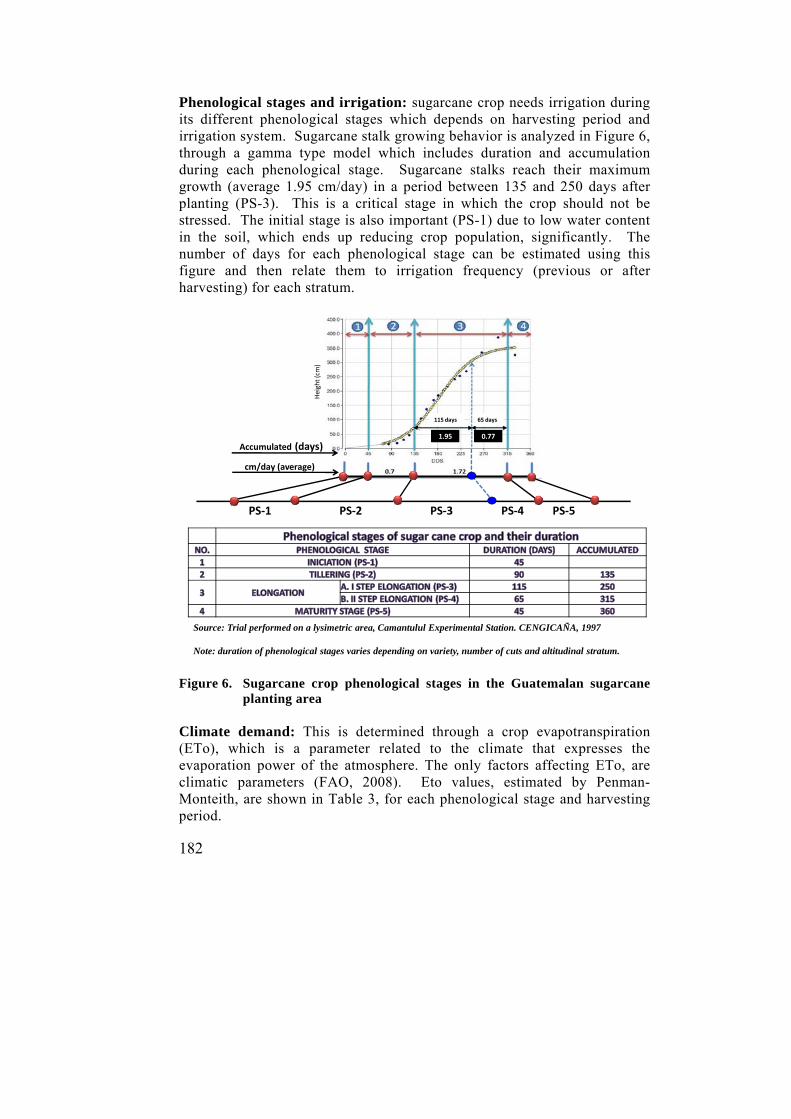
182
Phenological stages and irrigation: sugarcane crop needs irrigation during its different phenological stages which depends on harvesting period and irrigation system. Sugarcane stalk growing behavior is analyzed in Figure 6, through a gamma type model which includes duration and accumulation during each phenological stage. Sugarcane stalks reach their maximum growth (average 1.95 cm/day) in a period between 135 and 250 days after planting (PS-3). This is a critical stage in which the crop should not be stressed. The initial stage is also important (PS-1) due to low water content in the soil, which ends up reducing crop population, significantly. The number of days for each phenological stage can be estimated using this figure and then relate them to irrigation frequency (previous or after harvesting) for each stratum.
Figure 6. Sugarcane crop phenological stages in the Guatemalan sugarcane
planting area
Climate demand: This is determined through a crop evapotranspiration (ETo), which is a parameter related to the climate that expresses the evaporation power of the atmosphere. The only factors affecting ETo, are climatic parameters (FAO, 2008). Eto values, estimated by Penman-Monteith, are shown in Table 3, for each phenological stage and harvesting period.
cm/day (average)
Accumulated (days)1.95 0.77
PS‐1 PS‐2 PS‐3 PS‐4 PS‐5
Source: Trial performed on a lysimetric area, Camantulul Experimental Station. CENGICAÑA, 1997
Note: duration of phenological stages varies depending on variety, number of cuts and altitudinal stratum.
65 days115 days
Height(cm)
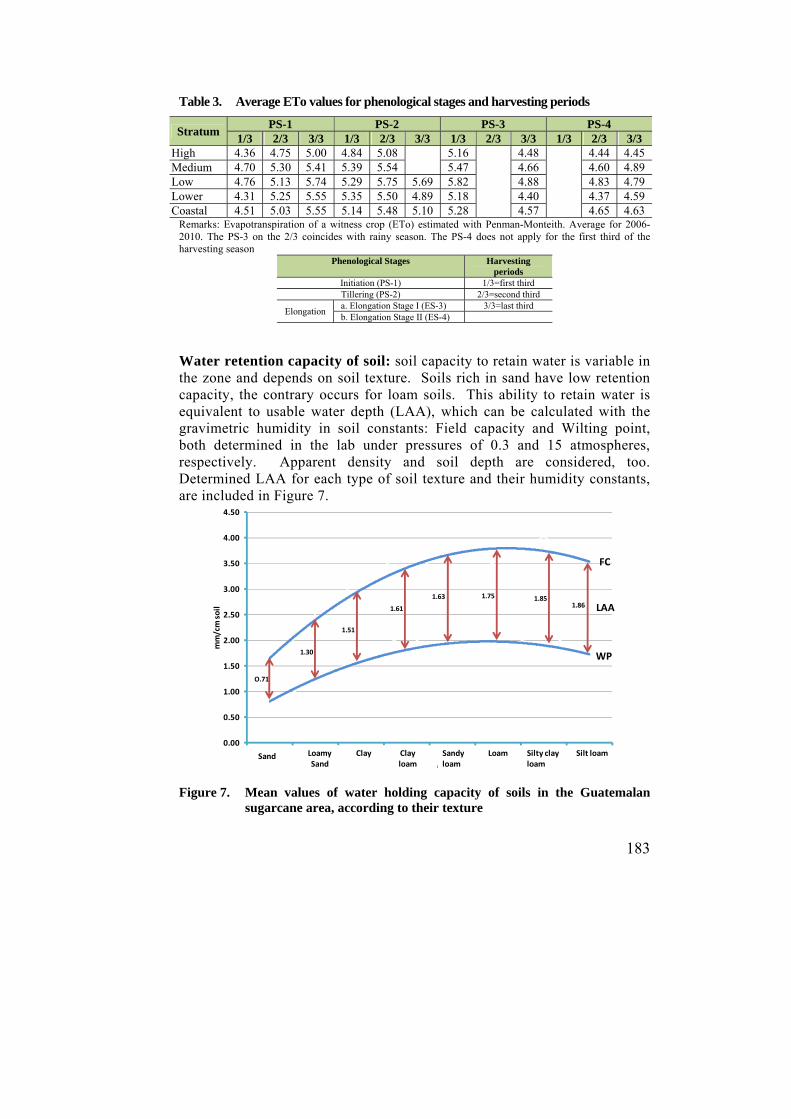
183
Table 3. Average ETo values for phenological stages and harvesting periods
Stratum PS-1 PS-2 PS-3 PS-4
1/3 2/3 3/3 1/3 2/3 3/3 1/3 2/3 3/3 1/3 2/3 3/3 High 4.36 4.75 5.00 4.84 5.08 5.16 4.48 4.44 4.45 Medium 4.70 5.30 5.41 5.39 5.54 5.47 4.66 4.60 4.89 Low 4.76 5.13 5.74 5.29 5.75 5.69 5.82 4.88 4.83 4.79 Lower 4.31 5.25 5.55 5.35 5.50 4.89 5.18 4.40 4.37 4.59 Coastal 4.51 5.03 5.55 5.14 5.48 5.10 5.28 4.57 4.65 4.63
Remarks: Evapotranspiration of a witness crop (ETo) estimated with Penman-Monteith. Average for 2006-2010. The PS-3 on the 2/3 coincides with rainy season. The PS-4 does not apply for the first third of the harvesting season
Phenological Stages Harvesting periods
Initiation (PS-1) 1/3=first third Tillering (PS-2) 2/3=second third
Elongation a. Elongation Stage I (ES-3) 3/3=last third b. Elongation Stage II (ES-4)
Water retention capacity of soil: soil capacity to retain water is variable in the zone and depends on soil texture. Soils rich in sand have low retention capacity, the contrary occurs for loam soils. This ability to retain water is equivalent to usable water depth (LAA), which can be calculated with the gravimetric humidity in soil constants: Field capacity and Wilting point, both determined in the lab under pressures of 0.3 and 15 atmospheres, respectively. Apparent density and soil depth are considered, too. Determined LAA for each type of soil texture and their humidity constants, are included in Figure 7.
Figure 7. Mean values of water holding capacity of soils in the Guatemalan
sugarcane area, according to their texture
0.00
0.50
1.00
1.50
2.00
2.50
3.00
3.50
4.00
4.50
Arena Arena Franca
Arcilloso Franco Arcilloso
Franco Arenoso
Franco Franco Arcillo Limoso
Franco Limoso
mm/cm soil
LoamySand
Clay Sandy loam
Loam Silty clayloam
Silt loam
FC
WP
O.71
1.51
1.61
1.63 1.75 1.851.86
1.30
LAA
Sand Clayloam
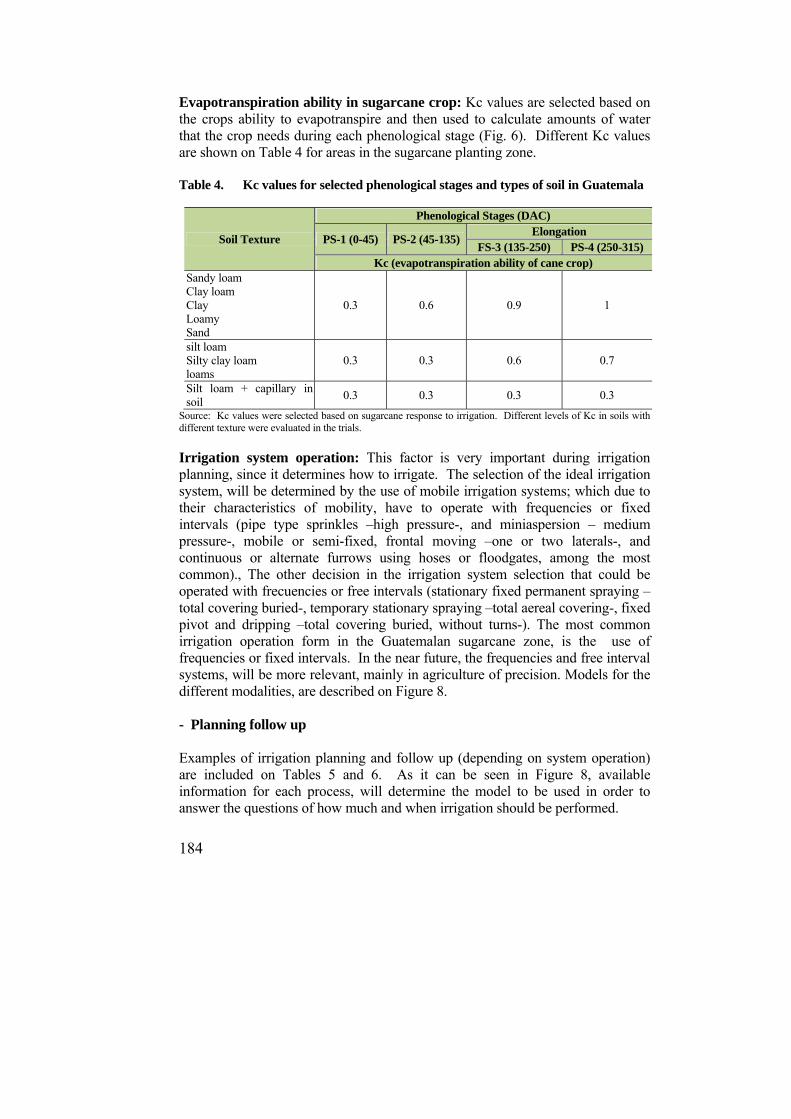
184
Evapotranspiration ability in sugarcane crop: Kc values are selected based on the crops ability to evapotranspire and then used to calculate amounts of water that the crop needs during each phenological stage (Fig. 6). Different Kc values are shown on Table 4 for areas in the sugarcane planting zone. Table 4. Kc values for selected phenological stages and types of soil in Guatemala
Soil Texture
Phenological Stages (DAC)
PS-1 (0-45) PS-2 (45-135) Elongation
FS-3 (135-250) PS-4 (250-315) Kc (evapotranspiration ability of cane crop)
Sandy loam Clay loam Clay Loamy Sand
0.3 0.6 0.9 1
silt loam Silty clay loam loams
0.3 0.3 0.6 0.7
Silt loam + capillary in soil
0.3 0.3 0.3 0.3
Source: Kc values were selected based on sugarcane response to irrigation. Different levels of Kc in soils with different texture were evaluated in the trials. Irrigation system operation: This factor is very important during irrigation planning, since it determines how to irrigate. The selection of the ideal irrigation system, will be determined by the use of mobile irrigation systems; which due to their characteristics of mobility, have to operate with frequencies or fixed intervals (pipe type sprinkles –high pressure-, and miniaspersion – medium pressure-, mobile or semi-fixed, frontal moving –one or two laterals-, and continuous or alternate furrows using hoses or floodgates, among the most common)., The other decision in the irrigation system selection that could be operated with frecuencies or free intervals (stationary fixed permanent spraying –total covering buried-, temporary stationary spraying –total aereal covering-, fixed pivot and dripping –total covering buried, without turns-). The most common irrigation operation form in the Guatemalan sugarcane zone, is the use of frequencies or fixed intervals. In the near future, the frequencies and free interval systems, will be more relevant, mainly in agriculture of precision. Models for the different modalities, are described on Figure 8. - Planning follow up Examples of irrigation planning and follow up (depending on system operation) are included on Tables 5 and 6. As it can be seen in Figure 8, available information for each process, will determine the model to be used in order to answer the questions of how much and when irrigation should be performed.

185
Sample calculation for the use of a fixed frequency system: required information is described on Table 5.
Figure 8. Models to determine How Much and When should water be applied,
depending on the operation of the irrigation system Table 5. Basic information required for the calculation example of a fixed
frequency irrigation system
Planning process Information Irrigation period based on altitudinal stratum
Coastal, Oct 20-May 25 (Figure 5)
Harvesting season period First third: Nov 15 (191 days under defficiency) (Figure 5)
Irrigation Type Post harvest irrigation (Figure 5) Phenological stage duration and days under defficiency
Iniciation: 45, tillering 90 y elongation Stage I: 56 (Figure 6)
Climatic demand (mm) Iniciation: 4.5, tillering:5, Elongation Stage I: 5.5 (Table 3)
Soil ability to retain water (mm/cm) Sandy loam: 1.63, no capillarity (Figure 7) Evapotranspiration ability of sugarcane crop (Kc non dimensional)
Iniciation: 0.3, tillering: 0.6 and elongation: 0.9 (Table 4)
Irrigation system operation Fixed frequency, spray gun system
Based on the information provided in Table 5, it is established that analysis frequency should be performed as indicated on Table 6.
FIXED FREQUENCY FREE FREQUENCY
Non dynamic water balance with fixedparameters for: soil, cane and climate for
each phenological stage
Dynamicwater balance with weatherparameters in real time and soil and cane
parameters fixed in each phenological stage
MODELS
Howmuch water/20 cm deep?LARA= LAA *DPM (1) » where:
LARA, readily available water depth in mm. LAA, available water depth in mm, defined in 6.
DPM, allowed defficiency to manage= 0.6 (non dimensional). Residual water in soil 0.4
Depth (cms)= 20 (PS‐1), 40(PS‐2) and 60 (PS‐3 and 4)
¿Howmuch water to apply?LARA= LAA *DPM (2) » where:
Different frommodel (1)
DPM= 0.2 a 0.3. Residual water in soil between 0.7 and 0.8
Depth(cm)= 20 (PS‐1), 40(PS‐2) y 60 (PS‐3 and 4)
¿When to apply water?
When to apply water?
IRRIGATION INTERVAL (IR)
LARAfd = readily available water depth at the end of the day
LARAid= readily available water depth at thebegining of the day
P = Precipitation, R = Irrigation,
ETo = Reference Crop Evapotranspiration (FAO),
Kc= constant on the ability of cane crop to evapotranspiration (non dimensional value),
ETc = Maximum Evapotranspiration (daily waterdemand for the crop)
IR (cm)=LARA
ETo * Kc(3)
(4)
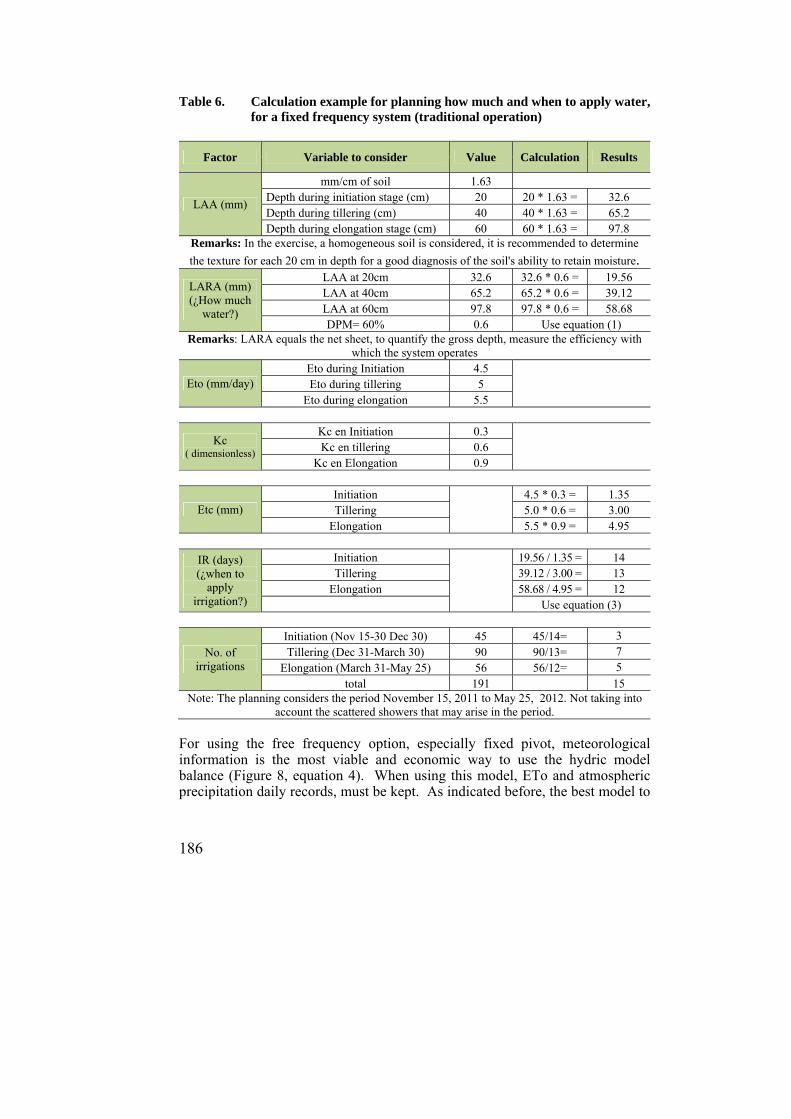
186
Table 6. Calculation example for planning how much and when to apply water, for a fixed frequency system (traditional operation)
Factor Variable to consider Value Calculation Results
LAA (mm)
mm/cm of soil 1.63 Depth during initiation stage (cm) 20 20 * 1.63 = 32.6 Depth during tillering (cm) 40 40 * 1.63 = 65.2 Depth during elongation stage (cm) 60 60 * 1.63 = 97.8
Remarks: In the exercise, a homogeneous soil is considered, it is recommended to determine
the texture for each 20 cm in depth for a good diagnosis of the soil's ability to retain moisture.
LARA (mm) (¿How much
water?)
LAA at 20cm 32.6 32.6 * 0.6 = 19.56 LAA at 40cm 65.2 65.2 * 0.6 = 39.12 LAA at 60cm 97.8 97.8 * 0.6 = 58.68 DPM= 60% 0.6 Use equation (1)
Remarks: LARA equals the net sheet, to quantify the gross depth, measure the efficiency with which the system operates
Eto (mm/day) Eto during Initiation 4.5
Eto during tillering 5
Eto during elongation 5.5
Kc ( dimensionless)
Kc en Initiation 0.3
Kc en tillering 0.6
Kc en Elongation 0.9
Etc (mm) Initiation
4.5 * 0.3 = 1.35 Tillering 5.0 * 0.6 = 3.00
Elongation 5.5 * 0.9 = 4.95
IR (days) (¿when to
apply irrigation?)
Initiation
19.56 / 1.35 = 14 Tillering 39.12 / 3.00 = 13
Elongation 58.68 / 4.95 = 12 Use equation (3)
No. of irrigations
Initiation (Nov 15-30 Dec 30) 45 45/14= 3 Tillering (Dec 31-March 30) 90 90/13= 7
Elongation (March 31-May 25) 56 56/12= 5 total 191 15
Note: The planning considers the period November 15, 2011 to May 25, 2012. Not taking into account the scattered showers that may arise in the period.
For using the free frequency option, especially fixed pivot, meteorological information is the most viable and economic way to use the hydric model balance (Figure 8, equation 4). When using this model, ETo and atmospheric precipitation daily records, must be kept. As indicated before, the best model to
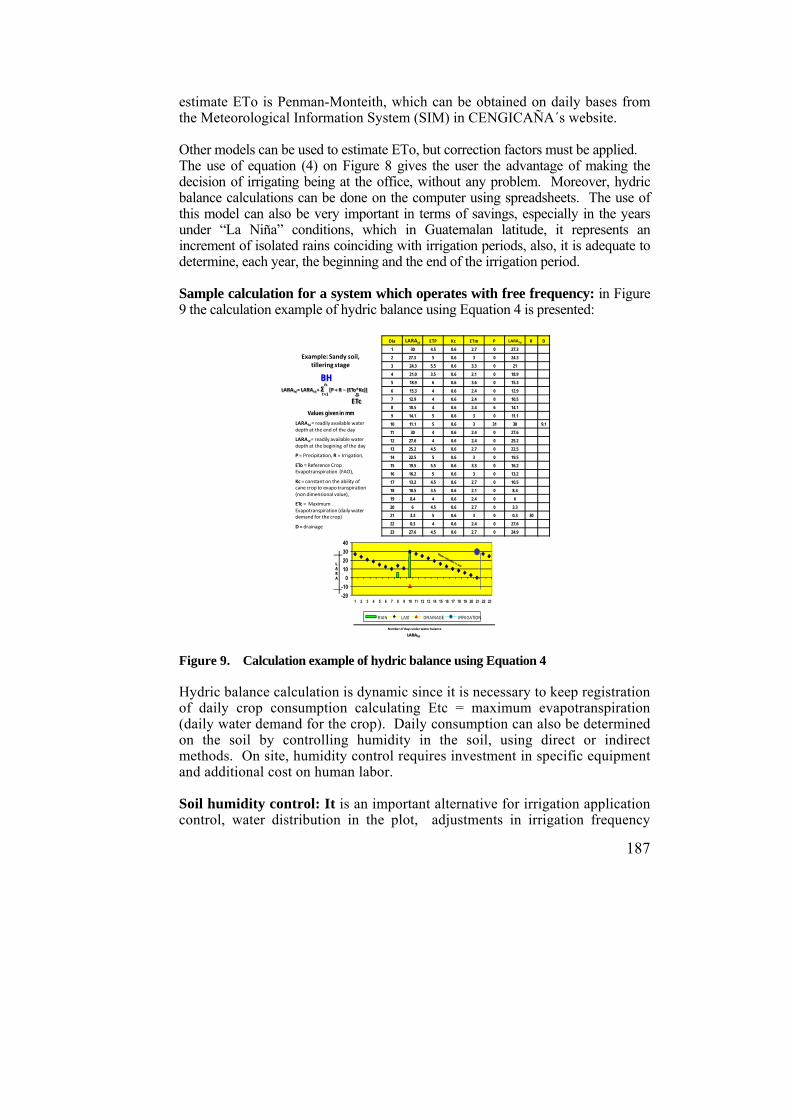
187
estimate ETo is Penman-Monteith, which can be obtained on daily bases from the Meteorological Information System (SIM) in CENGICAÑA´s website. Other models can be used to estimate ETo, but correction factors must be applied. The use of equation (4) on Figure 8 gives the user the advantage of making the decision of irrigating being at the office, without any problem. Moreover, hydric balance calculations can be done on the computer using spreadsheets. The use of this model can also be very important in terms of savings, especially in the years under “La Niña” conditions, which in Guatemalan latitude, it represents an increment of isolated rains coinciding with irrigation periods, also, it is adequate to determine, each year, the beginning and the end of the irrigation period. Sample calculation for a system which operates with free frequency: in Figure 9 the calculation example of hydric balance using Equation 4 is presented:
Figure 9. Calculation example of hydric balance using Equation 4 Hydric balance calculation is dynamic since it is necessary to keep registration of daily crop consumption calculating Etc = maximum evapotranspiration (daily water demand for the crop). Daily consumption can also be determined on the soil by controlling humidity in the soil, using direct or indirect methods. On site, humidity control requires investment in specific equipment and additional cost on human labor. Soil humidity control: It is an important alternative for irrigation application control, water distribution in the plot, adjustments in irrigation frequency
Día LARAid ETP Kc ETm P LARAfd R D
1 30 4.5 0.6 2.7 0 27.3
2 27.3 5 0.6 3 0 24.3
3 24.3 5.5 0.6 3.3 0 21
4 21.0 3.5 0.6 2.1 0 18.9
5 18.9 6 0.6 3.6 0 15.3
6 15.3 4 0.6 2.4 0 12.9
7 12.9 4 0.6 2.4 0 10.5
8 10.5 4 0.6 2.4 6 14.1
9 14.1 5 0.6 3 0 11.1
10 11.1 5 0.6 3 31 30 9.1
11 30 4 0.6 2.4 0 27.6
12 27.6 4 0.6 2.4 0 25.2
13 25.2 4.5 0.6 2.7 0 22.5
14 22.5 5 0.6 3 0 19.5
15 19.5 5.5 0.6 3.3 0 16.2
16 16.2 5 0.6 3 0 13.2
17 13.2 4.5 0.6 2.7 0 10.5
18 10.5 3.5 0.6 2.1 0 8.4
19 8.4 4 0.6 2.4 0 6
20 6 4.5 0.6 2.7 0 3.3
21 3.3 5 0.6 3 0 0.3 30
22 0.3 4 0.6 2.4 0 27.6
23 27.6 4.5 0.6 2.7 0 24.9
BHLARAfd= LARAid + Σ
n[P + R – (ETo*Kc)]
t=1
ETc
Values given in mm
Example: Sandy soil, tillering stage
LARAfd= readily available waterdepth at the end of the day
LARAid= readily available waterdepth at the begining of the day
P = Precipitation, R = Irrigation,
ETo = Reference CropEvapotranspiration (FAO),
Kc = constant on the ability of cane crop to evapo transpiration(non dimensional value),
ETc = MaximumEvapotranspiration (daily waterdemand for the crop)
D = drainage
-20
-10
0
10
20
30
40
1 2 3 4 5 6 7 8 9 10 11 12 13 14 15 16 17 18 19 20 21 22 23
RAIN LASf DRAINAGE IRRIGATION
Number of days underwater balance
LARA
LARAfd

188
during tillering and elongation stages (especially for those systems operating under fixed frequencies). This option also allows the performance of the hydric balance for free frequency systems. Soil water can be measured using direct or indirect methods. Gravimetric-volumetric and determination by touch are direct methods. Determination by touch is the oldest and simplest method, it may be efficient when perfomed with experience. This method consists on examining the soil in an ocular form or by touch in the soil sampling from the rooting zone extracted with a drill. Israelsen technique, 1965 is used to determine humidity by touch. The gravimetric-volumetric method is the most accurate method, but it has the disadvantage that requires too much time, is more expensive, and destructive when sampling in the same point, constantly. Direct method is used to calíbrate indirect procedures and is very important for basic research. Figure 10 shows soil water relation and equations (5) and (6) are used to determine gravimetric and/or volumetric humidity values. Indirect methods measure soil water with instruments such as: tensiometer and granular matrix sensors (GMS), which measure matrix potential, also, the neutron probe is used, this equipment uses radioactive sources. New instruments which are based on electromagnetism are available today, for example TDR (time domain reflectometry), and FDR (frequency domain reflectometry).
Figure 10. The mass-volume relation and gravimetric-volumetric determination
of soil moisture (used in calibration of indirect methods)
Air(a)
Water (W)
Soil (s)
Masa (M) Volumen (V)
Ma~ 0
Mw
Ms
Va
Vw
Vs
Vp
Mt Vt
GRAVIMETRIC MOISTURE
Hg =Water mass (Mw)
Soil mass (Ms)
Hg = PSH - PSS
PSS
PSH = moist soil weight
PSS = dry soil weight
VOLUMETRIC MOISTURE
Hv =Water Volume (Vw)
Total Volume (Vt)
Hv = Hg x Da
(5)
(6)
´
´
189
-Technical criteria to be considered when using indirect methods: Site selection: this step is very important since the spot must represent the area where the irrigation system is located. The amount of representative sites will depend on the homogeneity of the area, needing more sites for less homogeneous areas. For those soils with much heterogeneous areas, the decision will depend on the agricultural practices and irrigation system. Precision agriculture would need many sites. All decisions depend on How much and When will water be applied. Humidity interval: It is defined by the selection of the way of operating the irrigation system. For example, if irrigation systems are used which operate with dynamic water balance, as an example, the fixed central pivot. Under these circumstances, the moisture range among saturation will be quantified to 30 percent of consumption, the range between FC and WP.The calibration in this case could be done in the humidity range among saturation at 40% of water consumption, which evaluates the lowering of the moisture in this range. If indirect methods are used as a mean of controlling soil moisture for fixed frequency systems, the calibration range should be among 70 percent saturation of soil consumption. For experimental trials, used method should be calibrated between saturation and wilting point. Indirect method: this should be chosen based on the range under study. Every distributor provide specific recommendations for using and calibrating the instruments. For example, for calibrating the FDR probe, enviroscan type, it is necessary to make readings for the sensor frequency under dry air, under water, and in the soil, in order to calculate normalized or universal frequency. - Measurement Units and Conversions Length units
Basis 1 meter (m) 1m=0.001 kilmeters= 100 centimeters= 1000 millimeters= 39.37 inches = 3.28 pies= 1.094 yards
Area units
Basis 1 hectere (ha) 1 ha=10,000 m2=2.471 acres= 1.429
Pressure units The atmosphere (atm) is equivalent to 76 cm of mercury. As the specific weight of mercury is 13.5951 g/cm3 follows: 1 atm=13.5951 g/cm3 * 76= 1,033 g/cm2=1.03333 kg/cm2
1 atm=1.013 bar
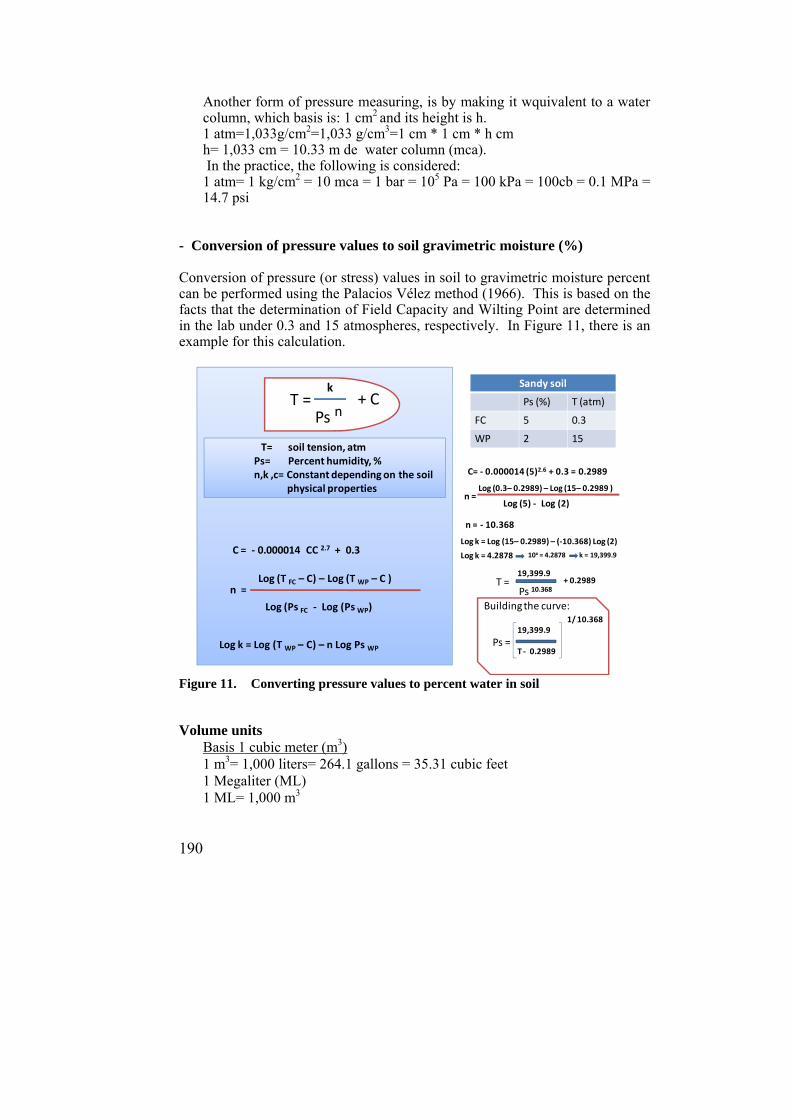
190
Another form of pressure measuring, is by making it wquivalent to a water column, which basis is: 1 cm2 and its height is h. 1 atm=1,033g/cm2=1,033 g/cm3=1 cm * 1 cm * h cm h= 1,033 cm = 10.33 m de water column (mca). In the practice, the following is considered: 1 atm= 1 kg/cm2 = 10 mca = 1 bar = 105 Pa = 100 kPa = 100cb = 0.1 MPa = 14.7 psi
- Conversion of pressure values to soil gravimetric moisture (%) Conversion of pressure (or stress) values in soil to gravimetric moisture percent can be performed using the Palacios Vélez method (1966). This is based on the facts that the determination of Field Capacity and Wilting Point are determined in the lab under 0.3 and 15 atmospheres, respectively. In Figure 11, there is an example for this calculation.
Figure 11. Converting pressure values to percent water in soil Volume units
Basis 1 cubic meter (m3) 1 m3= 1,000 liters= 264.1 gallons = 35.31 cubic feet 1 Megaliter (ML) 1 ML= 1,000 m3
T= soil tension, atmPs= Percent humidity, %n,k ,c= Constant depending on the soil
physical properties
C = ‐ 0.000014 CC 2.7 + 0.3
n =
Log (Ps FC ‐ Log (Ps WP)
Log (T FC – C) – Log (T WP – C )
Log (0.3– 0.2989) – Log (15– 0.2989 )
Log (5) ‐ Log (2)
Log k = Log (T WP – C) – n Log Ps WP
Log k = Log (15– 0.2989) – (‐10.368) Log (2)
Log k = 4.2878 10x = 4.2878
19,399.9+ 0.2989
k = 19,399.9
Sandy soil
Ps (%) T (atm)
FC 5 0.3
WP 2 15
C= ‐ 0.000014 (5)2.6 + 0.3 = 0.2989
n =
n = ‐ 10.368
T = Ps 10.368
Ps = 19,399.9
T ‐ 0.2989
1/ 10.368
Buildingthe curve:
Ps n
k+ CT =
191
Flow units Basis 1 cubic meter /second (m3/s) 1 m3/s= 1,000 liters/second= 6 x 10⁴ liters/ minute= 36 x 105 liters/hour=864 x 105 literss/day 1 m3/s=60 m3/min=36 x 102 m3/h= 864x 102 m3/day 1 m3/s=264.17 gallons/second= 15,850.32 gallos per minute
Sheet units
Basis 1 millimeter (mm) 1 mm= 1 liter/m2= 10,000 liters/hectare= 10 m3/hectare 1 mm/day= 0.116 liters per second/day= 1.83 gallons per minute/day= 10 m3/hectare/day
BIBLIOGRAPHY 1. Barragán, F., Javier. 1998. Evaluación de los regadíos y mejora de su
eficiencia. Departamento de Ingeniería Agroforestal. Universidad de Lleida, España.
2. Bos, M.G. 1990. On irrigation efficiencies. Publication 19. Fourth edition.
International Institute for Land Reclamation and Improvement/ILRI, P.O. Box 45,6700 AA Wageningen, The Netherlands.
3. CENGICAÑA. 2010. Presentación en PowerPoint. Análisis de la zafra
2009/10. 4. CENGICAÑA. 2011. Base de datos estaciones meteorológicas
automatizadas. Base electrónica. 5. Castro, O.; Pinzón, J.; Montúfar, J. 2004. Abatimiento del aporte capilar en
el período de verano, caso finca “Laguna Blanca”. Corporación San Diego-Trinidad. In: Memoria. Presentación de resultados de investigación. Zafra 2003-2004. Guatemala, CENGICAÑA. pp.168-162.
6. Castro, O.; Pinzón, J.; Montúfar, J. 2004. La respuesta de la caña de azúcar
al riego, resultados de plantía temporada de riego 2002-2003. In: Memoria. Presentación de resultados de investigación. Zafra 2003-2004. Guatemala, CENGICAÑA. pp. 173-179.
7. Castro, O. 2005. El balance hídrico (herramienta para la planificación del
riego en caña de azúcar). In: Memoria. Presentación de resultados de investigación. Zafra 2005-2006. Guatemala, CENGICAÑA. pp. 134-141.
192
8. Castro, O.; Esquit, V. 2006. Recomendaciones para la optimización del uso
del agua, el balance hídrico en pivotes fijos, con un ejemplo de su utilización en la finca “Monte Alegre”, La Unión. In: Memoria. Presentación de resultados de investigación. Zafra 2004 – 2005. Guatemala, CENGICAÑA. pp. 230-237.
9. Castro, O.; Veliz, E.; Osorio, R.; Esquit, V.; López, H.; Toledo, E.;
Pocasangre, R.; López, F.; Rosales, E. 2006. Recomendaciones técnicas y económicas para la aplicación del riego en la caña de azúcar. In: Memoria. Presentación de resultados de investigación. Zafra 2005-2006. Guatemala, CENGICAÑA. pp. 238-244.
10. Muñoz, E.; Castro, O. 1999. Análisis cronológico y espacial de la respuesta
de la caña al riego en la zona cañera guatemalteca. In: Memoria. Presentación de resultados de investigación. Zafra 1998-1999. Guatemala, CENGICAÑA. pp. 153-159.
11. Castro, O.; Suárez, A.; Villatoro, B.; Rosales, C. 2007. Estrategias técnicas
de riego para el manejo de vetas arenosas. Una aproximación de agricultura de precisión para la zona cañera guatemalteca. In: Memoria. Presentación de resultados de investigación. Zafra 2006–2007. Guatemala, CENGICAÑA. pp. 188-197.
12. Castro, O.; Rosales, C. 2007. Recomendaciones técnicas y económicas para
la aplicación del riego en ambientes con aporte capilar, en la zona cañera guatemalteca. In: Memoria. Presentación de resultados de investigación. Zafra 2006 – 2007. Guatemala, CENGICAÑA. pp. 179-187.
13. Castro, O. 2008. Recomendaciones técnicas y económicas para la
programación del riego en la zona cañera guatemalteca. VII Congreso de Técnicos Azucareros de Latinoamérica y el Caribe. Presentación en Power Point.
14. CENGICAÑA. 2009. Base de datos de información de análisis físico de
muestras de suelos ingresados al laboratorio de suelos desde 1994. Archivo electrónico.
15. CENGICAÑA. 2009. Base de datos de variables meteorológicas de 2005 a
la fecha. Área de Agrometeorología. Archivo electrónico. 16. CENICAÑA. Torres, J; Cruz, R.; Villegas, F. 1996. Avances técnicos para
la programación y manejo del riego en caña de azúcar. Colombia. 53p.

193
17. CIMMYT. 1988. La formulación de recomendaciones a partir de datos
agronómicos. Un manual metodológico de evaluación económica. Edición completamente revisada. México D.F. México. CIMMYT.
18. García, I.; Jimenez, J.; Muriel, J.; Perea, F.; Vanderlinden, K. 2005.
Evaluación de sondas de capacitancia para el seguimiento de la humedad de un suelo arcilloso bajo distintas condiciones y tipo de manejo. Estudios de la zona no saturada del suelo Vol. VII. Andalucía, España.
19. FAO. 2008. Evapotranspiración de un cultivo de referencia. Folleto serie
Riego y drenaje Número 56. Archivo electrónico. 71 p. 20. INSIVUMEH. Base de datos históricas de lluvia de las estaciones
meteorológicas “San José” y “Camantulul”. Base electrónica. 21. La UNIÓN. 1999. Base de datos estación fenológica, finca Tehuantepec.
Archivo electrónico.
22. Sentek. 2001. Calibration of Sentek Pty Ltd. Soil Moisture Sensor sentek. Stepney, Australia.
23. Tarjuelo Martín, José. 1995. El riego por aspersión y su tecnología.
Ediciones Mundi – prensa. España. pp. 81-135.

194
195
IX. INTEGRATED PEST MANAGEMENT
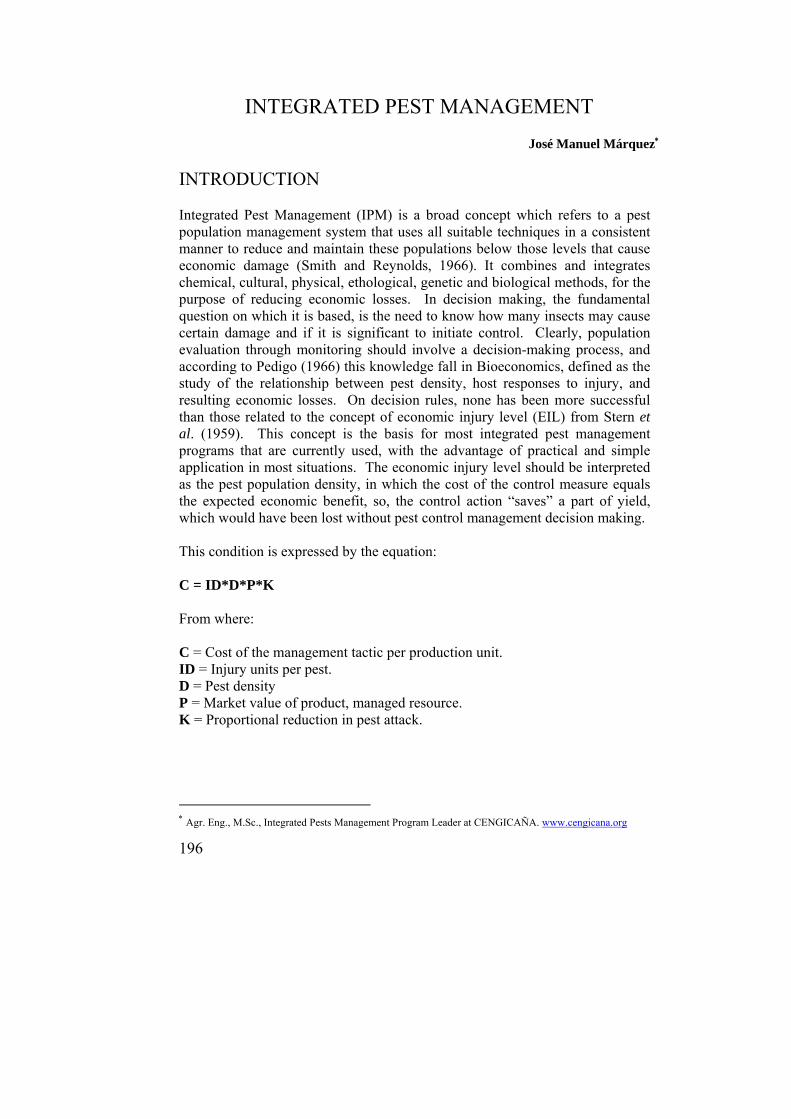
196
INTEGRATED PEST MANAGEMENT
José Manuel Márquez
INTRODUCTION Integrated Pest Management (IPM) is a broad concept which refers to a pest population management system that uses all suitable techniques in a consistent manner to reduce and maintain these populations below those levels that cause economic damage (Smith and Reynolds, 1966). It combines and integrates chemical, cultural, physical, ethological, genetic and biological methods, for the purpose of reducing economic losses. In decision making, the fundamental question on which it is based, is the need to know how many insects may cause certain damage and if it is significant to initiate control. Clearly, population evaluation through monitoring should involve a decision-making process, and according to Pedigo (1966) this knowledge fall in Bioeconomics, defined as the study of the relationship between pest density, host responses to injury, and resulting economic losses. On decision rules, none has been more successful than those related to the concept of economic injury level (EIL) from Stern et al. (1959). This concept is the basis for most integrated pest management programs that are currently used, with the advantage of practical and simple application in most situations. The economic injury level should be interpreted as the pest population density, in which the cost of the control measure equals the expected economic benefit, so, the control action “saves” a part of yield, which would have been lost without pest control management decision making. This condition is expressed by the equation: C = ID*D*P*K From where: C = Cost of the management tactic per production unit. ID = Injury units per pest. D = Pest density P = Market value of product, managed resource. K = Proportional reduction in pest attack.
Agr. Eng., M.Sc., Integrated Pests Management Program Leader at CENGICAÑA. www.cengicana.org

197
Saved or protected yield has a monetary value, which is estimated using biological and economic parameters that are represented by (ID, D, P, and K). It should equal the value spent on the control action (C), in other words, EIL is the pest population density where the value of saved yield covers the cost of control. The injury unit (ID) is the loss of sugar (pounds, kilograms or tones) per hectare, associated with a unit of pest density or damage. To determine ID, experiments are designed in order to provide insight and quantify the relationship between pest density and its effect on yield reduction in sugarcane weight or sugar recovery. The IPM-CENGICAÑA program in collaboration with the IPM committee (CAÑAMIP) generated values of postharvest losses and injury levels for the major pests, which are represented in Table 1. These values are relative and variable, according to local conditions and management values of each sugarmill. Table 1. Loss factor and injury level estimated for the main pests in Guatemala.
CENGICAÑA-CAÑAMIP
Pest Loss Factor Injury Level Economic Threshold
Sugarcane Froghopper
8.21 TCH/1adult/cane 5.83 kg Sugar/t/1adult/cane
1465 kg Sugar/ha/1 adult/cane
0.05-0.10 nymphs and adults/stem
White Grub 0.62 TCH/larvae/m2
70.9 kg Sugar/ha/1 larvae/m2
10 larvae/m2
Field Rat 0.5 TCH/1% infestation. 2.19 kg Sugar/t/1% infestation
65 kg s/ha/1% infestation
6% damaged cane
Sugarcane Borer
0.36 kg Sugar/t/1% infestation
32.4 kg Sugar/ha/1% infestation
7% infestation
Brown Burrowing Bug 0.053 TCH/insect/m2
6.09 kg Sugar/ha/insect/m2
100 insects/m2
Subterranean Termites
0.45 TCH (CP72-1312) 0.22 TCH (CP72-2086)
23.3-47.7 kg Sugar/ha/ 1% infestation
10% damaged cane in harvest
INTEGRATED STEMBORER MANAGEMENT IN SUGARCANE Borers from Diatraea genus Species of Diatraea genus (Lepidoptera:Pyralidae) have greater economic importance and geographic distribution in Guatemala. Diatraea nr. crambidoides (Grote) has a relative abundance of 73 percent in the lower and coastal stratum, compared with 27 percent of D.saccharalis (Fabricius). Other

198
species such as Xubida dentilineatella (Lepidoptera: Crambidae), Phassus phalerus Druce (Lepidoptera: Hepialidae) and others yet undetermined, occurring at altitudes above 300 meters in the temperate and humid sugarcane region. The biology of Diatraea indicated that both species deposit their eggs in clusters (Figure 1) and require between 5 to 6 days to hatch (Figure 2). The larval development period is significantly different, since in D.saccharalis is 21 to 23 days, while in D.nr.crambidoides extends from 33 to 43 days. That’s why the average life cycle is estimated between 41 and 57 days respectively. D.saccharalis larvae have dorsal mesothoracic tubercle transversely elongated and rounded at the front; while D.nr.crambidoides has the dorsal mesothoracic tubercle in an elongated B-shape form, with an anterior midline incision (Figure 3). The pupal period requires 8 to 10 days; afterwards adults emerge (Figure 4). The adult stage averages 3 to 8 days. Rarely, adults are seen in the field, since they are nocturnal and short range flying, attracted by artificial lights at night.
Figure 1. Oviposition of Diatraea nr.
crambidoides
Figure 2. Borer larvae emergence from egg cluster
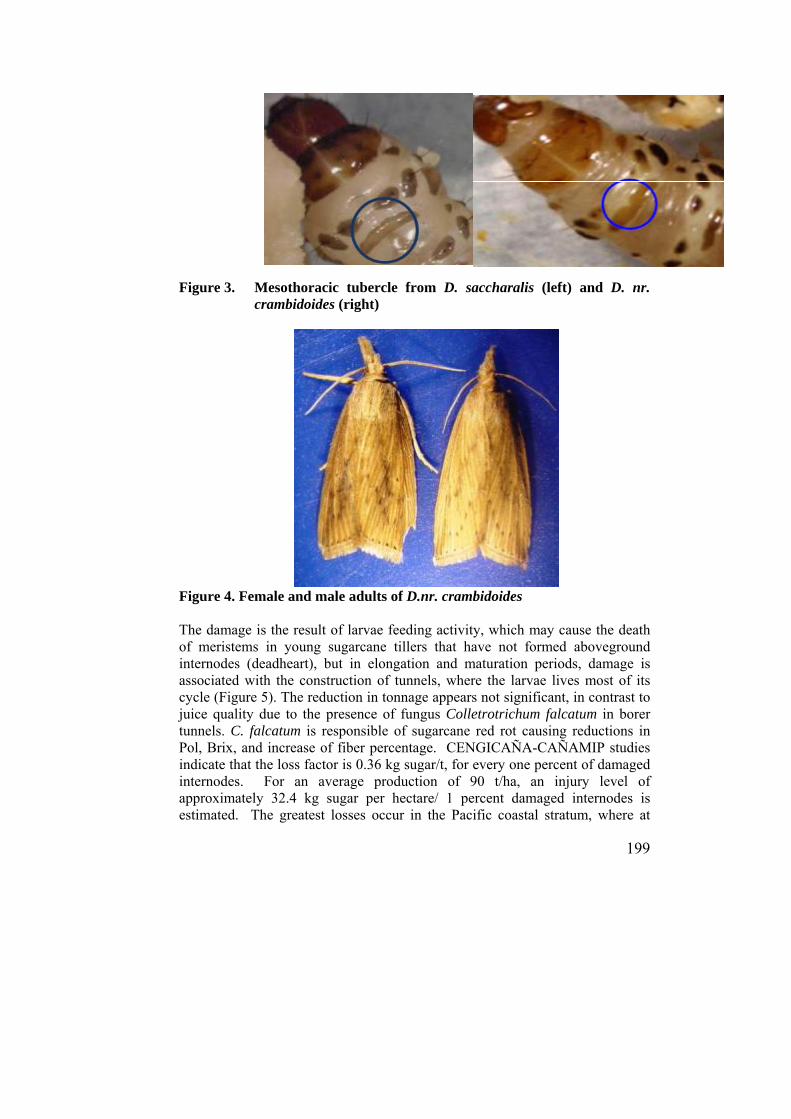
199
Figure 3. Mesothoracic tubercle from D. saccharalis (left) and D. nr.
crambidoides (right)
Figure 4. Female and male adults of D.nr. crambidoides The damage is the result of larvae feeding activity, which may cause the death of meristems in young sugarcane tillers that have not formed aboveground internodes (deadheart), but in elongation and maturation periods, damage is associated with the construction of tunnels, where the larvae lives most of its cycle (Figure 5). The reduction in tonnage appears not significant, in contrast to juice quality due to the presence of fungus Colletrotrichum falcatum in borer tunnels. C. falcatum is responsible of sugarcane red rot causing reductions in Pol, Brix, and increase of fiber percentage. CENGICAÑA-CAÑAMIP studies indicate that the loss factor is 0.36 kg sugar/t, for every one percent of damaged internodes. For an average production of 90 t/ha, an injury level of approximately 32.4 kg sugar per hectare/ 1 percent damaged internodes is estimated. The greatest losses occur in the Pacific coastal stratum, where at
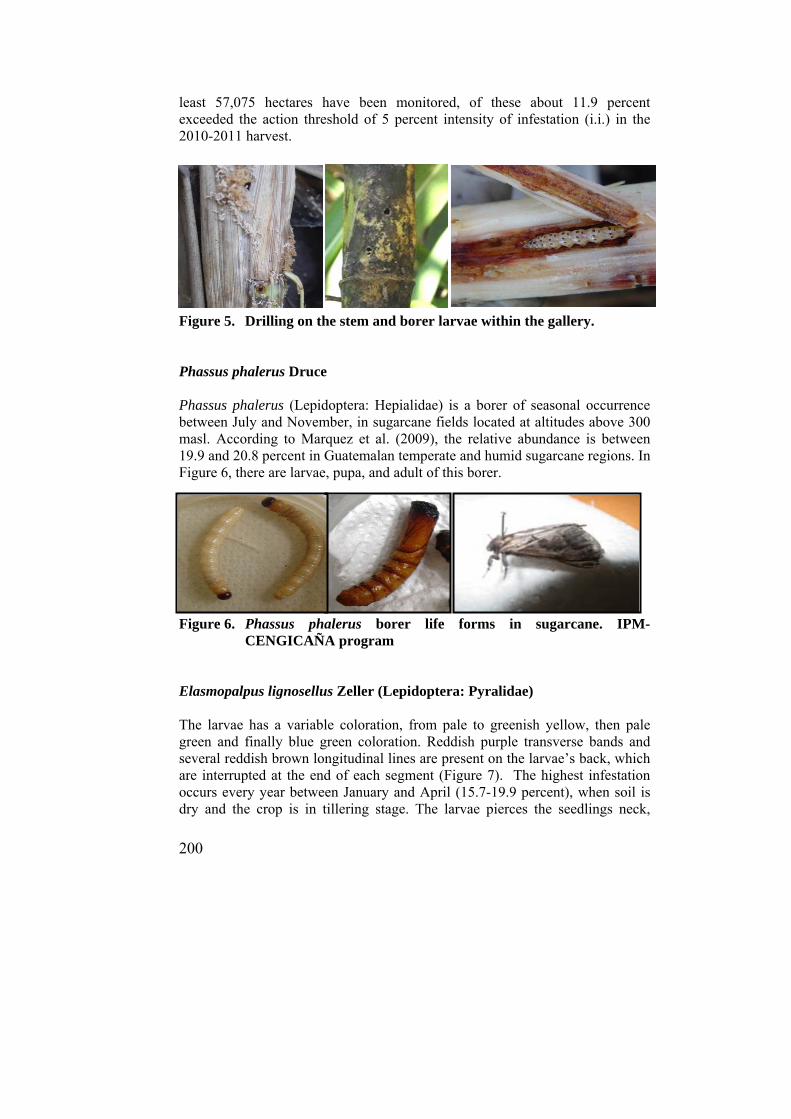
200
least 57,075 hectares have been monitored, of these about 11.9 percent exceeded the action threshold of 5 percent intensity of infestation (i.i.) in the 2010-2011 harvest. Figure 5. Drilling on the stem and borer larvae within the gallery. Phassus phalerus Druce Phassus phalerus (Lepidoptera: Hepialidae) is a borer of seasonal occurrence between July and November, in sugarcane fields located at altitudes above 300 masl. According to Marquez et al. (2009), the relative abundance is between 19.9 and 20.8 percent in Guatemalan temperate and humid sugarcane regions. In Figure 6, there are larvae, pupa, and adult of this borer. Figure 6. Phassus phalerus borer life forms in sugarcane. IPM-
CENGICAÑA program Elasmopalpus lignosellus Zeller (Lepidoptera: Pyralidae) The larvae has a variable coloration, from pale to greenish yellow, then pale green and finally blue green coloration. Reddish purple transverse bands and several reddish brown longitudinal lines are present on the larvae’s back, which are interrupted at the end of each segment (Figure 7). The highest infestation occurs every year between January and April (15.7-19.9 percent), when soil is dry and the crop is in tillering stage. The larvae pierces the seedlings neck,

201
penetrates and builds a gallery where it feeds, causing drying of the central bud (deadheart). E. lignosellus larvae disappears when rain is established or due to irrigation period. Is not considered a specie of economic importance.
Figure 7. Elasmopalpus lignosellus larvae Control strategies Tillering: Based on the measured damage value at harvest, ranges are established to program a basic sequence of control. Low ranges between 0.001 and 2 intensity of infestation (i.i) requires at least two releases of Trichogramma exiguum (Hymenoptera: Trichogrammatidae), an egg parasitoid, at the rate of 40 square inches per acre. Ranges of 2.01 to 4.00 require the same release rate of Trichogramma (Figure 8) and “deadheart” thinning to extract larvae, between 60 and 90 days after harvest. Between 4.01 and 6 percent, requires three Trichogramma releases, deadheart thinning and consider the application of commercial biopesticides, like Bacillus thuringiensis, Nuclear Polyhedrosis Virus (NPV), Cytoplasmic Polyhedrosis Virus (CPV). Damage greater than 6 percent requires the capture of adults with light traps, 20 days after harvest; four release program of Trichogramma; dead heart thinning, when sampling indicates larval density greater than 1300 larvae/ha; as well as the possibility of three biopesticide applications. Weed control in and out of the plantation is necessary to get rid of alternate hosts. Elongation: Control actions are reduced due to the difficulty to enter the fields, but according to prioritization obtained with damage and larval density sampling, it will be necessary to implement an alternative program of Cotesia flavipes (Hymenoptera: Braconidae) and Paratheresia claripalpis (Diptera: Tachinidae) releases. This action must be supported by parasitism sampling, which is obtained by collecting borer larvae 15 and 30 days after release (Figure 9 and 10).

202
Maturation: Infestation is growing at this stage, associated with the dry season establishment and high crop development, however, control actions taken in previous stages should show an effective reduction. In cases of high infestation, aerial biopesticide application or Tebufenozide can be made. It is recommended to harvest in blocks, ensure a flush cut sugarcane and remove the buds, as they become alternate host for the next crop cycle. Figure 8. Trichogramma exiguum wasp on borer oviposition (left) and
detail of parasitized borer eggs
Figure 9. Paratheresia claripalpis adult (left) and borer larvae parasitism
Figure 10. Cotesia flavipes adult (a), release cups (b), and cocoons resulting from parasitization
(a (b) (c)
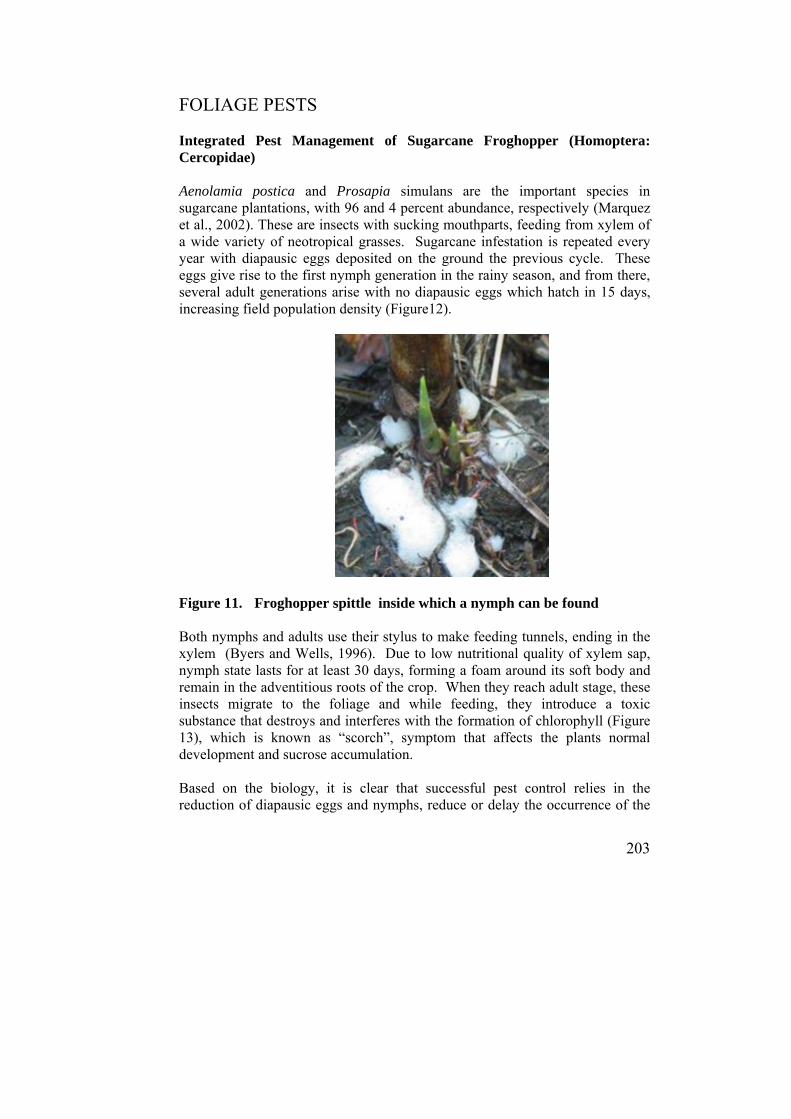
203
FOLIAGE PESTS Integrated Pest Management of Sugarcane Froghopper (Homoptera: Cercopidae) Aenolamia postica and Prosapia simulans are the important species in sugarcane plantations, with 96 and 4 percent abundance, respectively (Marquez et al., 2002). These are insects with sucking mouthparts, feeding from xylem of a wide variety of neotropical grasses. Sugarcane infestation is repeated every year with diapausic eggs deposited on the ground the previous cycle. These eggs give rise to the first nymph generation in the rainy season, and from there, several adult generations arise with no diapausic eggs which hatch in 15 days, increasing field population density (Figure12).
Figure 11. Froghopper spittle inside which a nymph can be found Both nymphs and adults use their stylus to make feeding tunnels, ending in the xylem (Byers and Wells, 1996). Due to low nutritional quality of xylem sap, nymph state lasts for at least 30 days, forming a foam around its soft body and remain in the adventitious roots of the crop. When they reach adult stage, these insects migrate to the foliage and while feeding, they introduce a toxic substance that destroys and interferes with the formation of chlorophyll (Figure 13), which is known as “scorch”, symptom that affects the plants normal development and sucrose accumulation. Based on the biology, it is clear that successful pest control relies in the reduction of diapausic eggs and nymphs, reduce or delay the occurrence of the
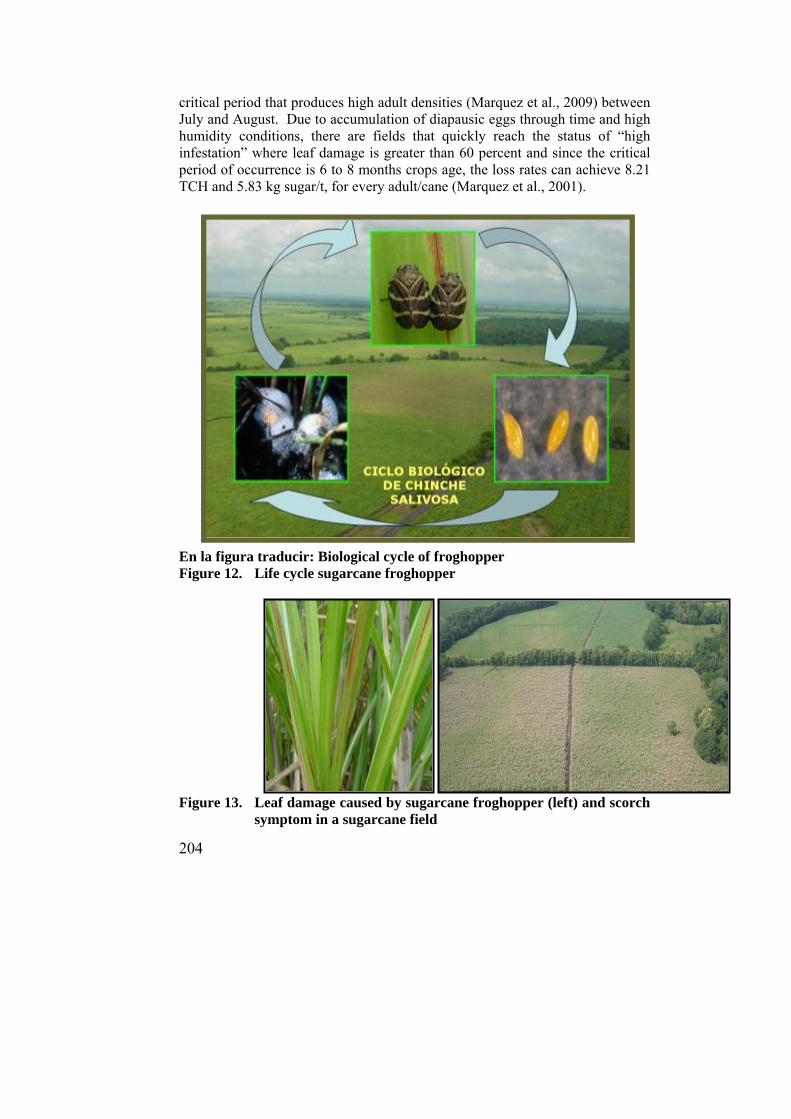
204
critical period that produces high adult densities (Marquez et al., 2009) between July and August. Due to accumulation of diapausic eggs through time and high humidity conditions, there are fields that quickly reach the status of “high infestation” where leaf damage is greater than 60 percent and since the critical period of occurrence is 6 to 8 months crops age, the loss rates can achieve 8.21 TCH and 5.83 kg sugar/t, for every adult/cane (Marquez et al., 2001). En la figura traducir: Biological cycle of froghopper Figure 12. Life cycle sugarcane froghopper
Figure 13. Leaf damage caused by sugarcane froghopper (left) and scorch
symptom in a sugarcane field
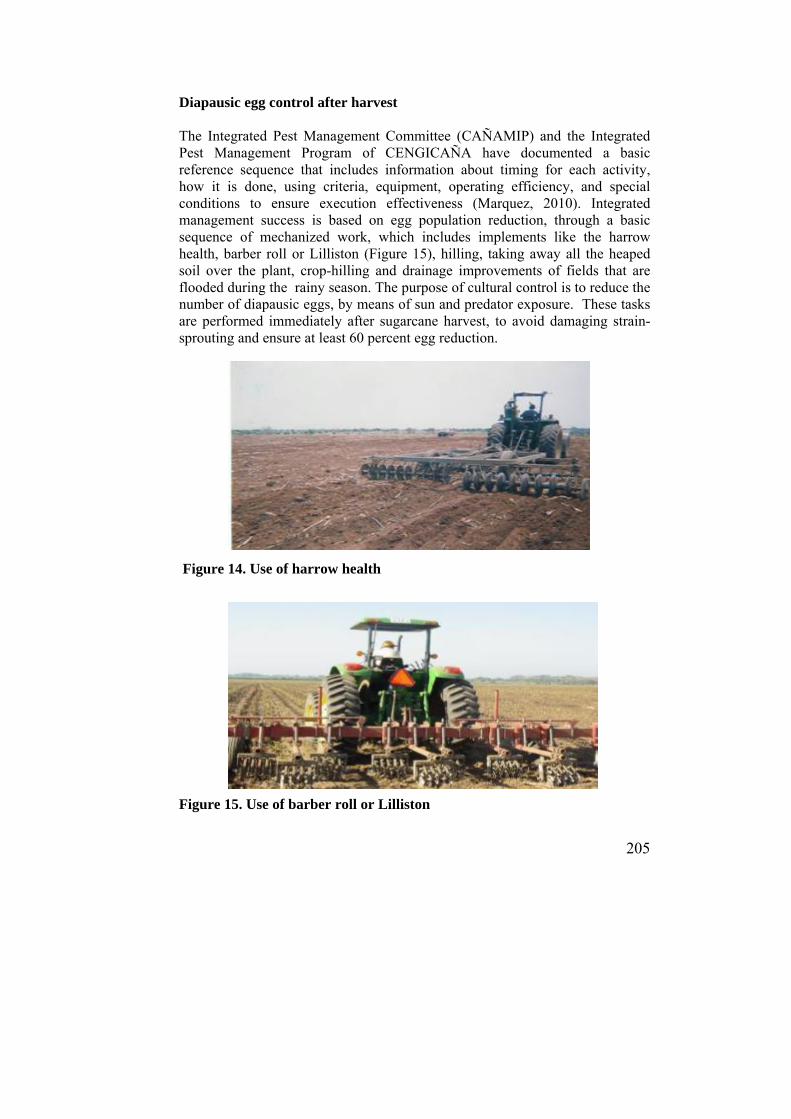
205
Diapausic egg control after harvest The Integrated Pest Management Committee (CAÑAMIP) and the Integrated Pest Management Program of CENGICAÑA have documented a basic reference sequence that includes information about timing for each activity, how it is done, using criteria, equipment, operating efficiency, and special conditions to ensure execution effectiveness (Marquez, 2010). Integrated management success is based on egg population reduction, through a basic sequence of mechanized work, which includes implements like the harrow health, barber roll or Lilliston (Figure 15), hilling, taking away all the heaped soil over the plant, crop-hilling and drainage improvements of fields that are flooded during the rainy season. The purpose of cultural control is to reduce the number of diapausic eggs, by means of sun and predator exposure. These tasks are performed immediately after sugarcane harvest, to avoid damaging strain-sprouting and ensure at least 60 percent egg reduction.
Figure 14. Use of harrow health Figure 15. Use of barber roll or Lilliston
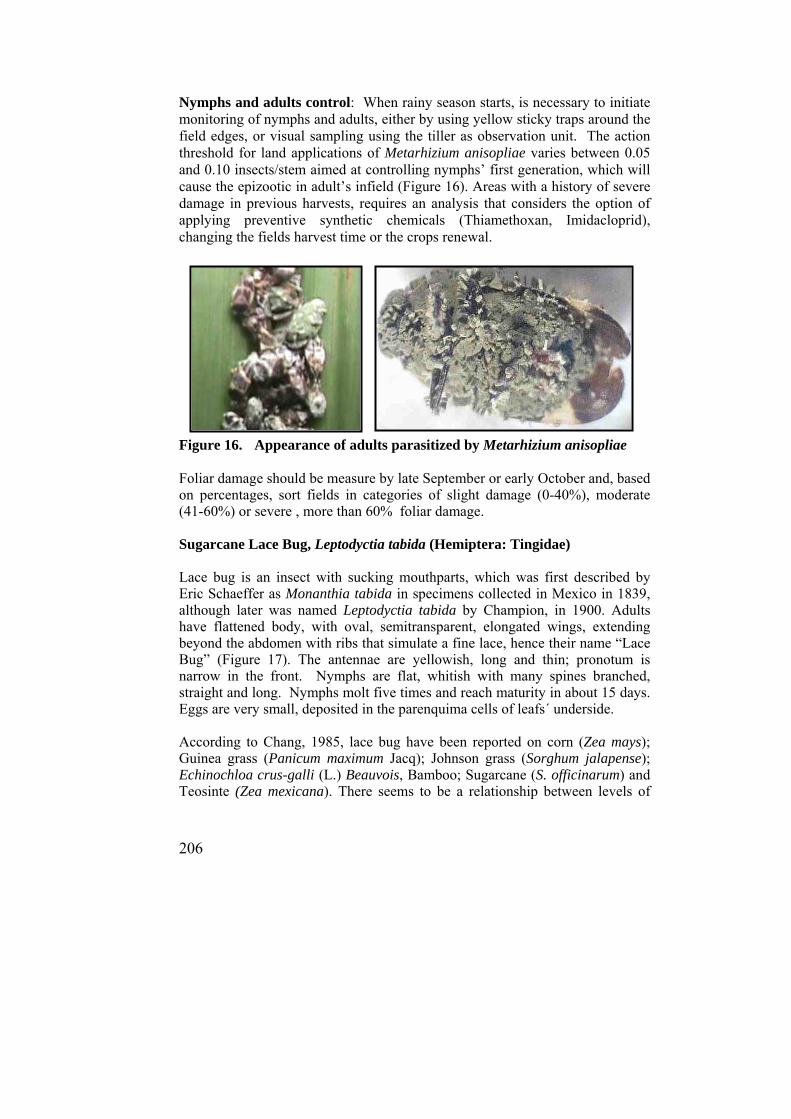
206
Nymphs and adults control: When rainy season starts, is necessary to initiate monitoring of nymphs and adults, either by using yellow sticky traps around the field edges, or visual sampling using the tiller as observation unit. The action threshold for land applications of Metarhizium anisopliae varies between 0.05 and 0.10 insects/stem aimed at controlling nymphs’ first generation, which will cause the epizootic in adult’s infield (Figure 16). Areas with a history of severe damage in previous harvests, requires an analysis that considers the option of applying preventive synthetic chemicals (Thiamethoxan, Imidacloprid), changing the fields harvest time or the crops renewal.
Figure 16. Appearance of adults parasitized by Metarhizium anisopliae Foliar damage should be measure by late September or early October and, based on percentages, sort fields in categories of slight damage (0-40%), moderate (41-60%) or severe , more than 60% foliar damage. Sugarcane Lace Bug, Leptodyctia tabida (Hemiptera: Tingidae) Lace bug is an insect with sucking mouthparts, which was first described by Eric Schaeffer as Monanthia tabida in specimens collected in Mexico in 1839, although later was named Leptodyctia tabida by Champion, in 1900. Adults have flattened body, with oval, semitransparent, elongated wings, extending beyond the abdomen with ribs that simulate a fine lace, hence their name “Lace Bug” (Figure 17). The antennae are yellowish, long and thin; pronotum is narrow in the front. Nymphs are flat, whitish with many spines branched, straight and long. Nymphs molt five times and reach maturity in about 15 days. Eggs are very small, deposited in the parenquima cells of leafs´ underside. According to Chang, 1985, lace bug have been reported on corn (Zea mays); Guinea grass (Panicum maximum Jacq); Johnson grass (Sorghum jalapense); Echinochloa crus-galli (L.) Beauvois, Bamboo; Sugarcane (S. officinarum) and Teosinte (Zea mexicana). There seems to be a relationship between levels of

207
stress in plantations caused both by excessive moisture and drought, which favor the emergence of the pest and its eventual dispersal. The presence of lace bugs in Guatemala (Figure 18) has been increasingly evident infield, as reported in the Harvest Analysis 2007-2008, where at least 19,670 hectares had some degree of incidence. Heavy rains during July-September period influence the reduction of lace bug infestation, because it drops nymph colonies to the floor. For now, rain is a beneficial factor in sugarcane fields and thereby reduces the risks of adverse effects in development. Infestation preference was determined on variety CP88-1165, which is widely distributed in the sugarcane region. Figura 17. Detail of lace bug adult and colony formation in sugarcane
Figure 18. Appearance of sugarcane fields with lace bug infestation West Indian Canefly or “Coludo”; Saccharosydne saccharivora (Homoptera:Delphacidae) This is an insect with sucking mouthparts known as West Indian Canefly, or Green Leaf-Hopper. It has been important in regions of the Caribbean and

208
Jamaica, although its distribution occurs from southern United States through the Caribbean to Venezuela. The adult male (Figure 19) has transparent, well-developed wings, while females and nymphs have white waxy filaments, attached to the abdomen (Figure 20), from where derives its Spanish name “Coludo”. Direct damage is a general weakening of the plant, but indirect effects results from the rapid colony development, where both nymphs and adults, produce large amounts of honeydew that falls on the lower leaves. This secretion serves as a substrate for sooty mould development (Capnodium sp.), which covers the leaves with a thick black crust that consists of sooty mould spores. This layer blocks gas exchange through leaves, affecting severely transpiration, photosynthesis and, consequently limits plant growth (Giraldo-Vanegas et al., 2005). Systemic insecticide control is recommended in sugarcane plantations less than three months old, especially in seedcane condition, plus a nitrogen fertilizer to speed recovery.
Figure 19. Sugarcane Leafhopper adult Figure 20. Sugarcane Leafhopper nymph colony (left) and presence of
sooty mould in lower leaves (right)
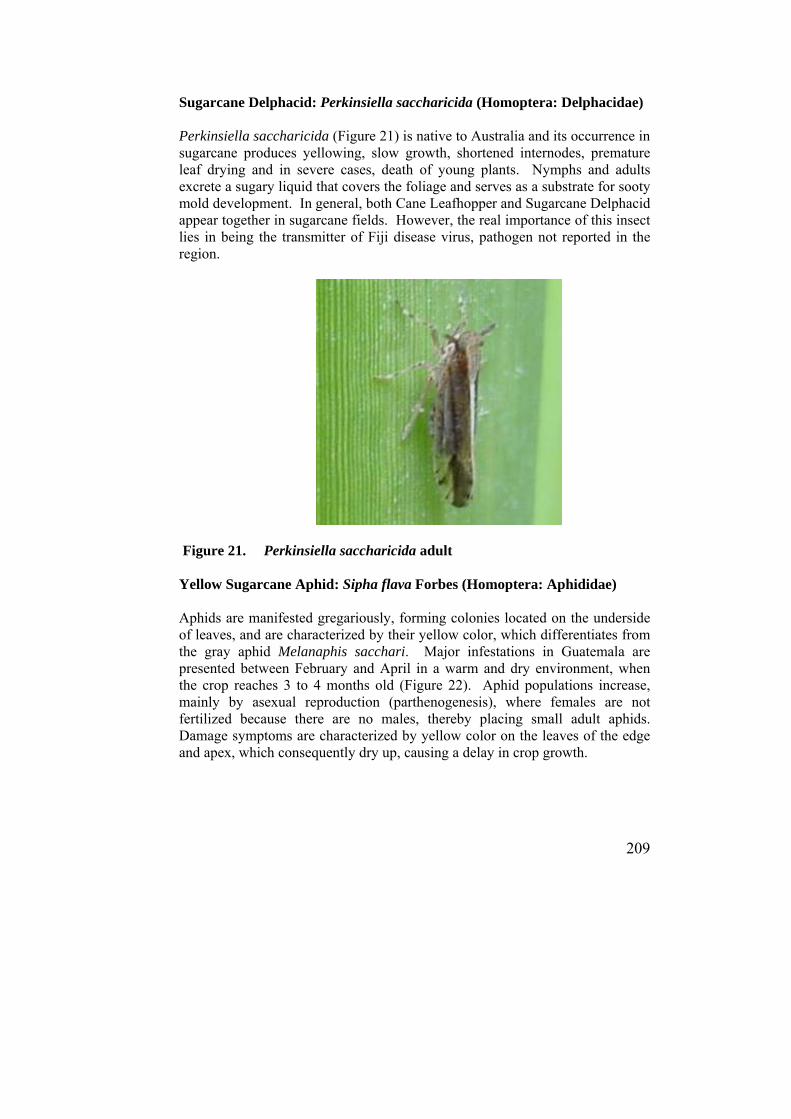
209
Sugarcane Delphacid: Perkinsiella saccharicida (Homoptera: Delphacidae) Perkinsiella saccharicida (Figure 21) is native to Australia and its occurrence in sugarcane produces yellowing, slow growth, shortened internodes, premature leaf drying and in severe cases, death of young plants. Nymphs and adults excrete a sugary liquid that covers the foliage and serves as a substrate for sooty mold development. In general, both Cane Leafhopper and Sugarcane Delphacid appear together in sugarcane fields. However, the real importance of this insect lies in being the transmitter of Fiji disease virus, pathogen not reported in the region.
Figure 21. Perkinsiella saccharicida adult Yellow Sugarcane Aphid: Sipha flava Forbes (Homoptera: Aphididae) Aphids are manifested gregariously, forming colonies located on the underside of leaves, and are characterized by their yellow color, which differentiates from the gray aphid Melanaphis sacchari. Major infestations in Guatemala are presented between February and April in a warm and dry environment, when the crop reaches 3 to 4 months old (Figure 22). Aphid populations increase, mainly by asexual reproduction (parthenogenesis), where females are not fertilized because there are no males, thereby placing small adult aphids. Damage symptoms are characterized by yellow color on the leaves of the edge and apex, which consequently dry up, causing a delay in crop growth.
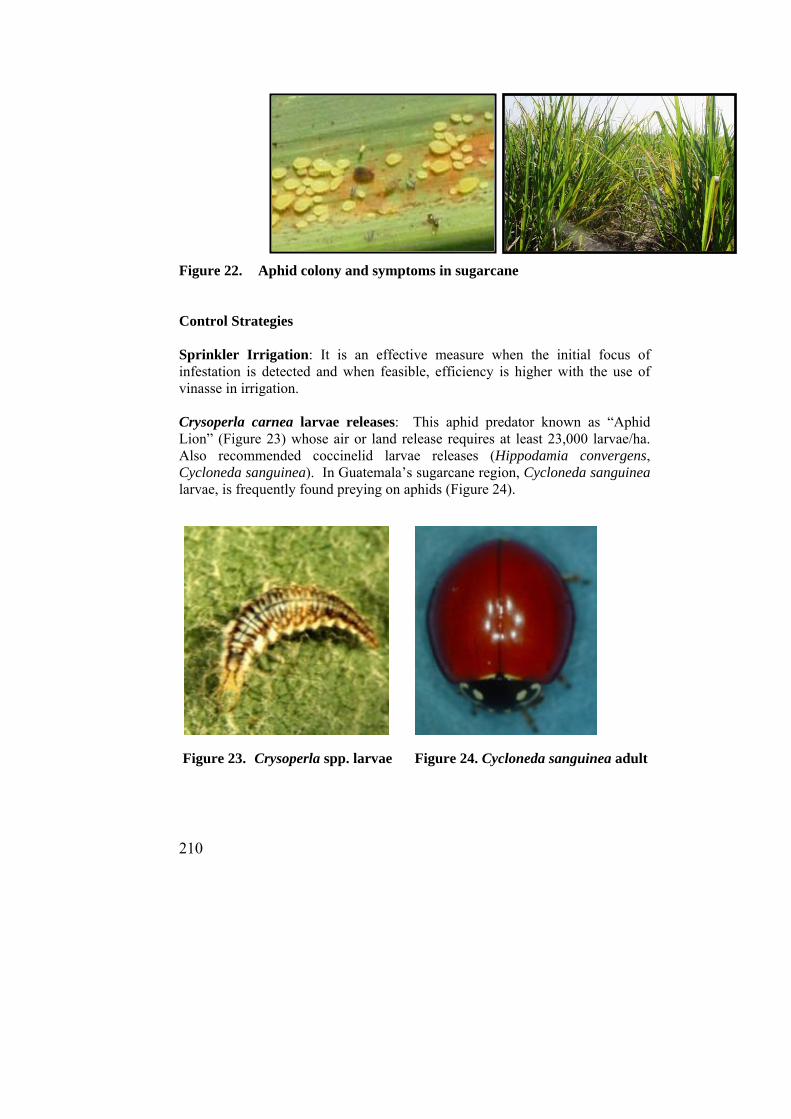
210
Figure 22. Aphid colony and symptoms in sugarcane Control Strategies Sprinkler Irrigation: It is an effective measure when the initial focus of infestation is detected and when feasible, efficiency is higher with the use of vinasse in irrigation. Crysoperla carnea larvae releases: This aphid predator known as “Aphid Lion” (Figure 23) whose air or land release requires at least 23,000 larvae/ha. Also recommended coccinelid larvae releases (Hippodamia convergens, Cycloneda sanguinea). In Guatemala’s sugarcane region, Cycloneda sanguinea larvae, is frequently found preying on aphids (Figure 24).
Figure 23. Crysoperla spp. larvae Figure 24. Cycloneda sanguinea adult

211
RODENTS Integrated rat management; Sigmodon hispidus (Rodentia:Crecetidae) Sigmodon hispidus (Figure 25) is the predominant rat species in Guatemala´s sugarcane tropical region, with 93 percent of abundance, compared with other genus occurrence, such as: Peromyscus, Heteromys, Liomys and Oryzomys. Distribution is associated with large grassland areas, riverbanks, vacant areas and crops such as corn, rice, sorghum, and sugarcane. Sygmodon hispidus population increases due to the high reproductive capacity, expressed by female’s continuous polyestrous cycles, bicornuate uterus and rapid sexual maturity, 40 to 60 days old. The average gestation period is very short and requires only 27 days for a litter that can be from 5 to 12 offspring. Longevity is 3 to 5 years, but under cane’s natural condition, life expectancy is about 6 months. Figure 25. Sygmodon hispidus, the most abundant species in Guatemalan
sugarcane For Guatemala, the largest rat population and damage increases is recorded in the Pacific Ocean´s seashore stratum, where approximately 10, 949 monitored hectares indicate levels above the five percent threshold of damaged crop stalks, for 2010-2011 harvest. Damage is caused by rodents feeding activity and the need to wear down the incisors, biting stems, which eventually lead to lodging and further plant deterioration. Studies by IPM-CENGICAÑA claim that the stem’s weight reduction is more significant than the juice quality, and the loss factor is 0.5 TCH for every percent of damaged stems at pre-harvest time (Marquez, 2002; Estrada et al., 1996). Harvest as population reduction factor: Sugarcane harvest affects rat population by destroying its habitat and reducing their primary food source, which forces a dispersion process of survivors to the surrounding areas. Machinery for lifting and transporting sugarcane is the main factor of mortality and dispersal in high infestation areas, and it is the right time to start a healing process within and outside the fields, for the purpose of reducing the shelter and
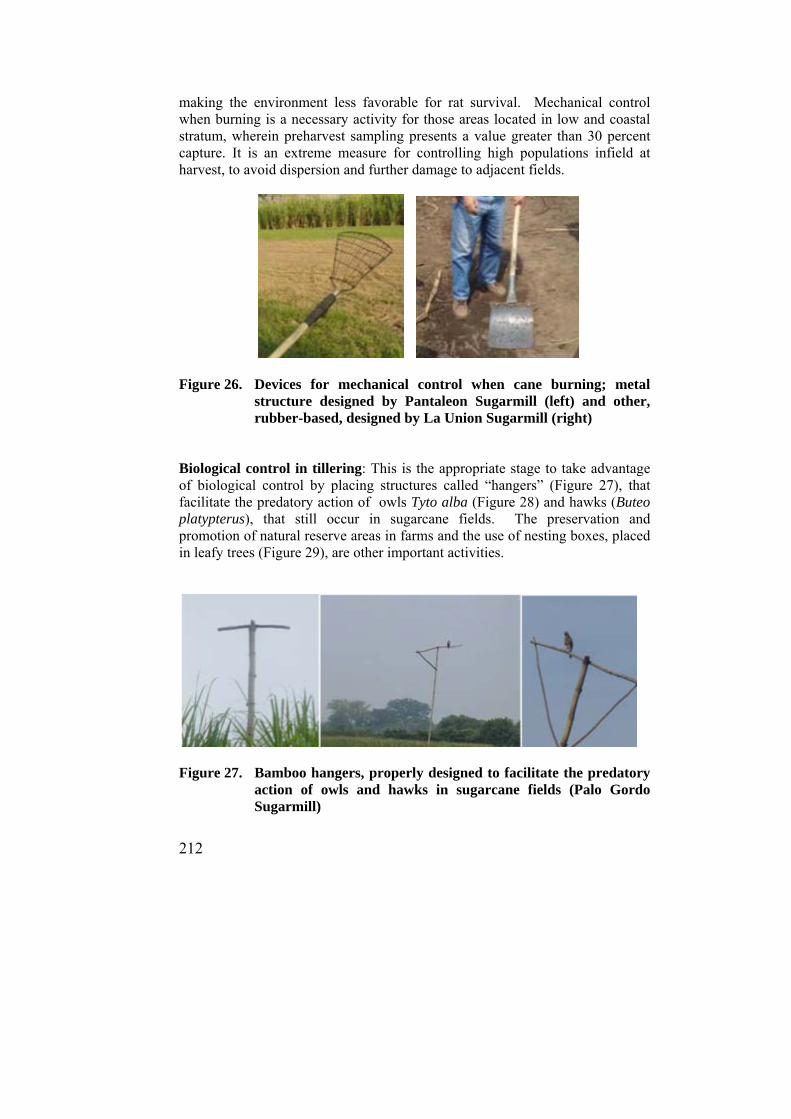
212
making the environment less favorable for rat survival. Mechanical control when burning is a necessary activity for those areas located in low and coastal stratum, wherein preharvest sampling presents a value greater than 30 percent capture. It is an extreme measure for controlling high populations infield at harvest, to avoid dispersion and further damage to adjacent fields.
Figure 26. Devices for mechanical control when cane burning; metal
structure designed by Pantaleon Sugarmill (left) and other, rubber-based, designed by La Union Sugarmill (right)
Biological control in tillering: This is the appropriate stage to take advantage of biological control by placing structures called “hangers” (Figure 27), that facilitate the predatory action of owls Tyto alba (Figure 28) and hawks (Buteo platypterus), that still occur in sugarcane fields. The preservation and promotion of natural reserve areas in farms and the use of nesting boxes, placed in leafy trees (Figure 29), are other important activities.
Figure 27. Bamboo hangers, properly designed to facilitate the predatory
action of owls and hawks in sugarcane fields (Palo Gordo Sugarmill)
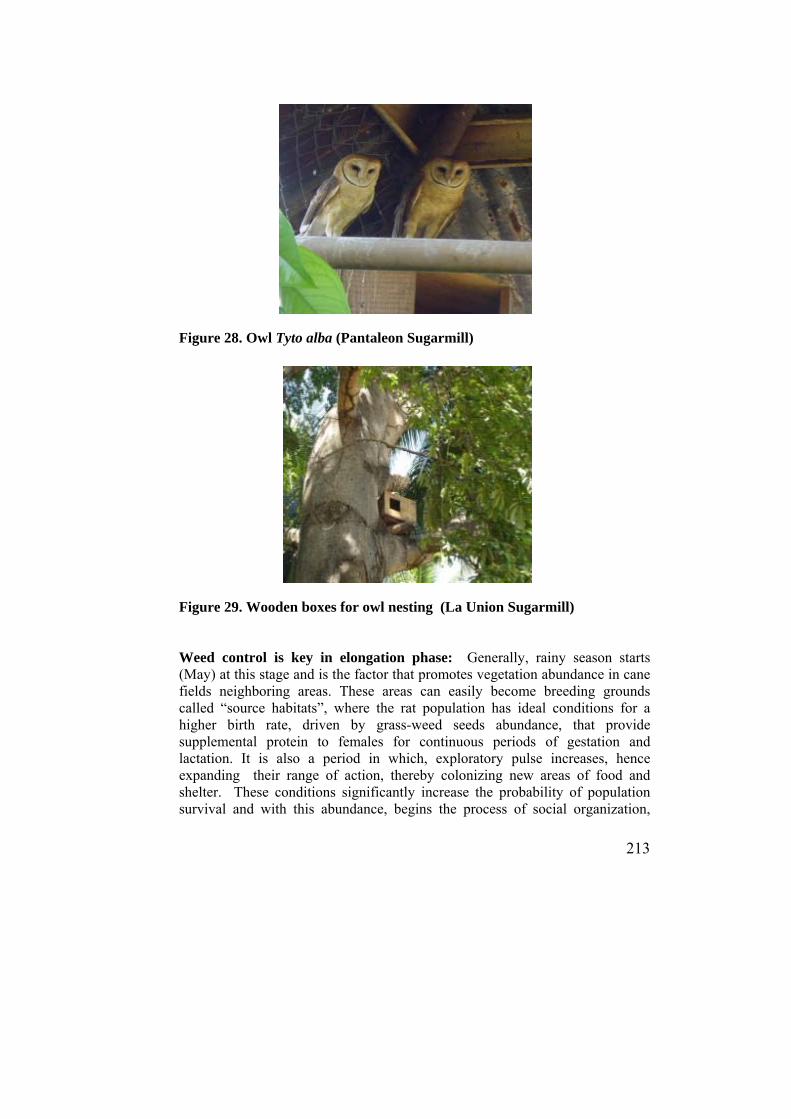
213
Figure 28. Owl Tyto alba (Pantaleon Sugarmill) Figure 29. Wooden boxes for owl nesting (La Union Sugarmill) Weed control is key in elongation phase: Generally, rainy season starts (May) at this stage and is the factor that promotes vegetation abundance in cane fields neighboring areas. These areas can easily become breeding grounds called “source habitats”, where the rat population has ideal conditions for a higher birth rate, driven by grass-weed seeds abundance, that provide supplemental protein to females for continuous periods of gestation and lactation. It is also a period in which, exploratory pulse increases, hence expanding their range of action, thereby colonizing new areas of food and shelter. These conditions significantly increase the probability of population survival and with this abundance, begins the process of social organization,
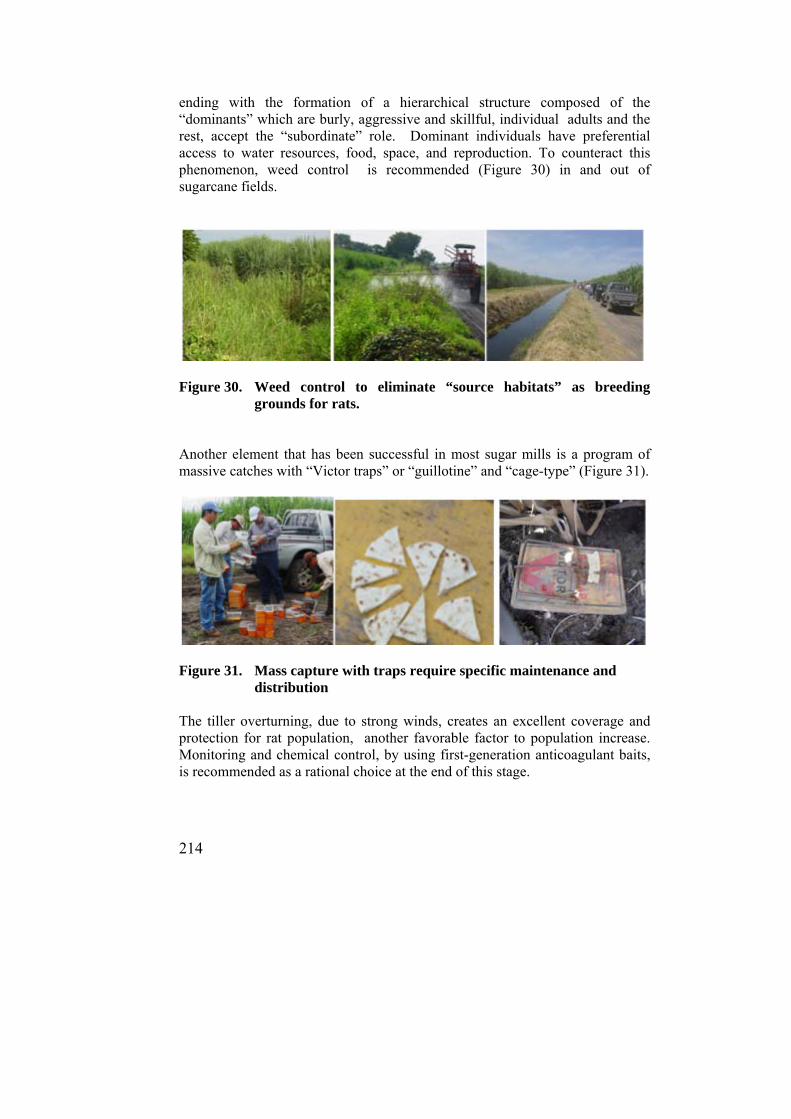
214
ending with the formation of a hierarchical structure composed of the “dominants” which are burly, aggressive and skillful, individual adults and the rest, accept the “subordinate” role. Dominant individuals have preferential access to water resources, food, space, and reproduction. To counteract this phenomenon, weed control is recommended (Figure 30) in and out of sugarcane fields.
Figure 30. Weed control to eliminate “source habitats” as breeding
grounds for rats. Another element that has been successful in most sugar mills is a program of massive catches with “Victor traps” or “guillotine” and “cage-type” (Figure 31).
Figure 31. Mass capture with traps require specific maintenance and
distribution The tiller overturning, due to strong winds, creates an excellent coverage and protection for rat population, another favorable factor to population increase. Monitoring and chemical control, by using first-generation anticoagulant baits, is recommended as a rational choice at the end of this stage.
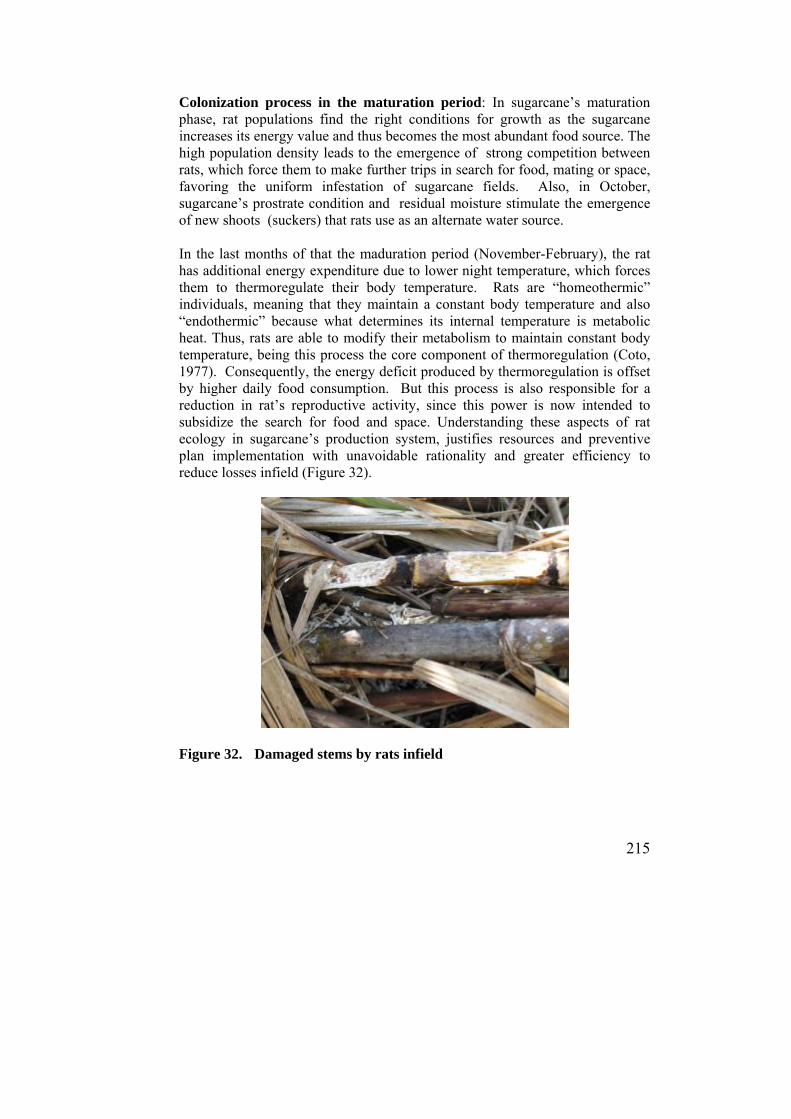
215
Colonization process in the maturation period: In sugarcane’s maturation phase, rat populations find the right conditions for growth as the sugarcane increases its energy value and thus becomes the most abundant food source. The high population density leads to the emergence of strong competition between rats, which force them to make further trips in search for food, mating or space, favoring the uniform infestation of sugarcane fields. Also, in October, sugarcane’s prostrate condition and residual moisture stimulate the emergence of new shoots (suckers) that rats use as an alternate water source. In the last months of that the maduration period (November-February), the rat has additional energy expenditure due to lower night temperature, which forces them to thermoregulate their body temperature. Rats are “homeothermic” individuals, meaning that they maintain a constant body temperature and also “endothermic” because what determines its internal temperature is metabolic heat. Thus, rats are able to modify their metabolism to maintain constant body temperature, being this process the core component of thermoregulation (Coto, 1977). Consequently, the energy deficit produced by thermoregulation is offset by higher daily food consumption. But this process is also responsible for a reduction in rat’s reproductive activity, since this power is now intended to subsidize the search for food and space. Understanding these aspects of rat ecology in sugarcane’s production system, justifies resources and preventive plan implementation with unavoidable rationality and greater efficiency to reduce losses infield (Figure 32).
Figure 32. Damaged stems by rats infield
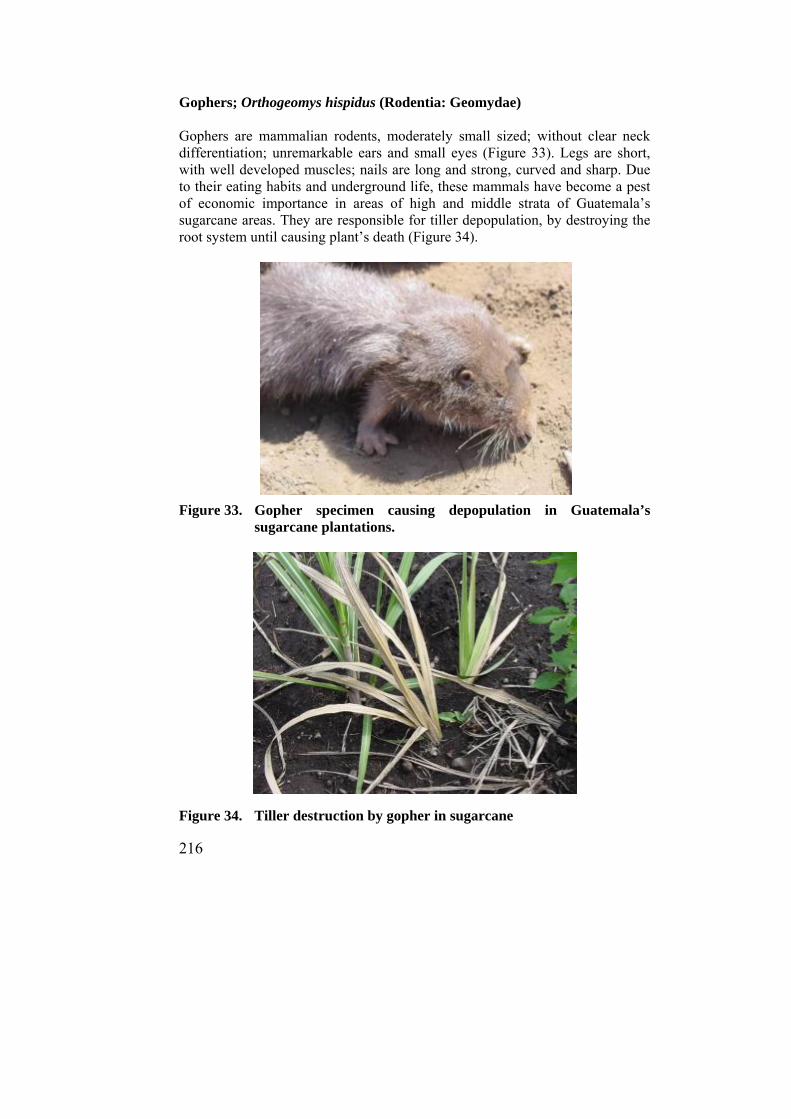
216
Gophers; Orthogeomys hispidus (Rodentia: Geomydae) Gophers are mammalian rodents, moderately small sized; without clear neck differentiation; unremarkable ears and small eyes (Figure 33). Legs are short, with well developed muscles; nails are long and strong, curved and sharp. Due to their eating habits and underground life, these mammals have become a pest of economic importance in areas of high and middle strata of Guatemala’s sugarcane areas. They are responsible for tiller depopulation, by destroying the root system until causing plant’s death (Figure 34).
Figure 33. Gopher specimen causing depopulation in Guatemala’s sugarcane plantations.
Figure 34. Tiller destruction by gopher in sugarcane
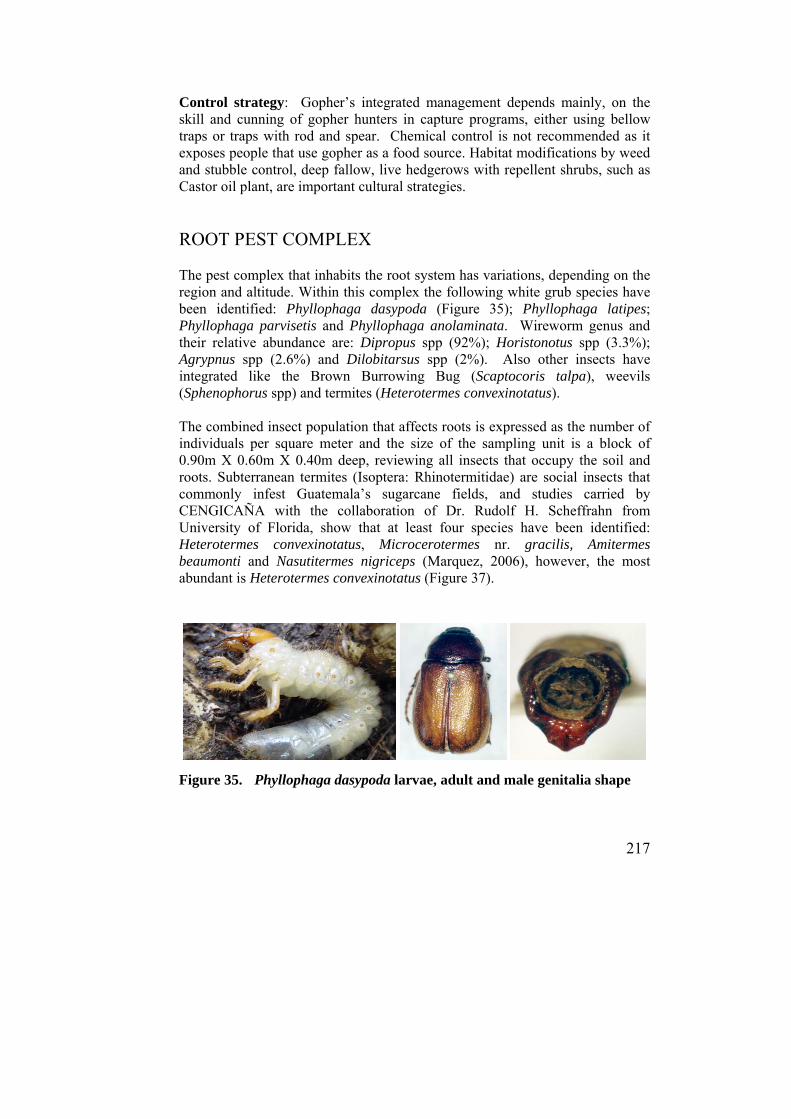
217
Control strategy: Gopher’s integrated management depends mainly, on the skill and cunning of gopher hunters in capture programs, either using bellow traps or traps with rod and spear. Chemical control is not recommended as it exposes people that use gopher as a food source. Habitat modifications by weed and stubble control, deep fallow, live hedgerows with repellent shrubs, such as Castor oil plant, are important cultural strategies.
ROOT PEST COMPLEX The pest complex that inhabits the root system has variations, depending on the region and altitude. Within this complex the following white grub species have been identified: Phyllophaga dasypoda (Figure 35); Phyllophaga latipes; Phyllophaga parvisetis and Phyllophaga anolaminata. Wireworm genus and their relative abundance are: Dipropus spp (92%); Horistonotus spp (3.3%); Agrypnus spp (2.6%) and Dilobitarsus spp (2%). Also other insects have integrated like the Brown Burrowing Bug (Scaptocoris talpa), weevils (Sphenophorus spp) and termites (Heterotermes convexinotatus). The combined insect population that affects roots is expressed as the number of individuals per square meter and the size of the sampling unit is a block of 0.90m X 0.60m X 0.40m deep, reviewing all insects that occupy the soil and roots. Subterranean termites (Isoptera: Rhinotermitidae) are social insects that commonly infest Guatemala’s sugarcane fields, and studies carried by CENGICAÑA with the collaboration of Dr. Rudolf H. Scheffrahn from University of Florida, show that at least four species have been identified: Heterotermes convexinotatus, Microcerotermes nr. gracilis, Amitermes beaumonti and Nasutitermes nigriceps (Marquez, 2006), however, the most abundant is Heterotermes convexinotatus (Figure 37). Figure 35. Phyllophaga dasypoda larvae, adult and male genitalia shape

218
Figure 36. Wireworm larvae and Brown Burrowing Bug nymph in
Guatemala’s sugarcane. Figure 37. Soldier, colony and sugarcane stalk damage by Heterotermes
convexinotatus Control strategy: Sampling before soil turning and planting is the basis for decision making either for cultural or chemical control. Good soil preparation with deep plowing and the dredge use with long fallow at least for 15 days have shown high efficiency, to reduce by 73 percent white grub larvae population, and 40 percent of wireworm (Marquez, 2001). The largest possible debris-crumbling of previous crop roots infested with Wireworm larvae, Termites or Bidentate Scarabs (Euetheola bidentata) is necessary to increase mortality and reduce reinfestation. The use of light traps (Figure 38), night tours with tractor lights or personnel with flashlights during April-June period is effective for massive capture of white grub adult. Another strategy is to plant “Flamboyan” (Caesalpinia pulchemina) and “Caulote” or “Guacimo” (Guazuma ulmifolia) due to the attraction exerted on adults, and then spray them with an insecticide solution. Chemical control in ratoon cane is recommended when grub populations exceed the action threshold of 10 larvae/m2 and applications must be made between June and July. Currently biological control is promoted and experiments are carried on with strains of Metarhizium anisopliae, Beauveria bassiana and entomophatogenic nematodes of Heterorhabditis genus.

219
Native parasitoids of the genus Ptilodexia (Diptera: Tachinidae) have been observed in white grub host, as shown in Figure 39. The use of entomopathogenic nematode Heterrorhabditis spp. in a 60 million/ha dose, is a suitable biological option in endemic areas.
Cambiar título en la figura 38: Light traps Figure 38. Different types of light traps to capture white grub adults Figure 39. Ptilodexia parasitoid larvae affecting white grub larvae
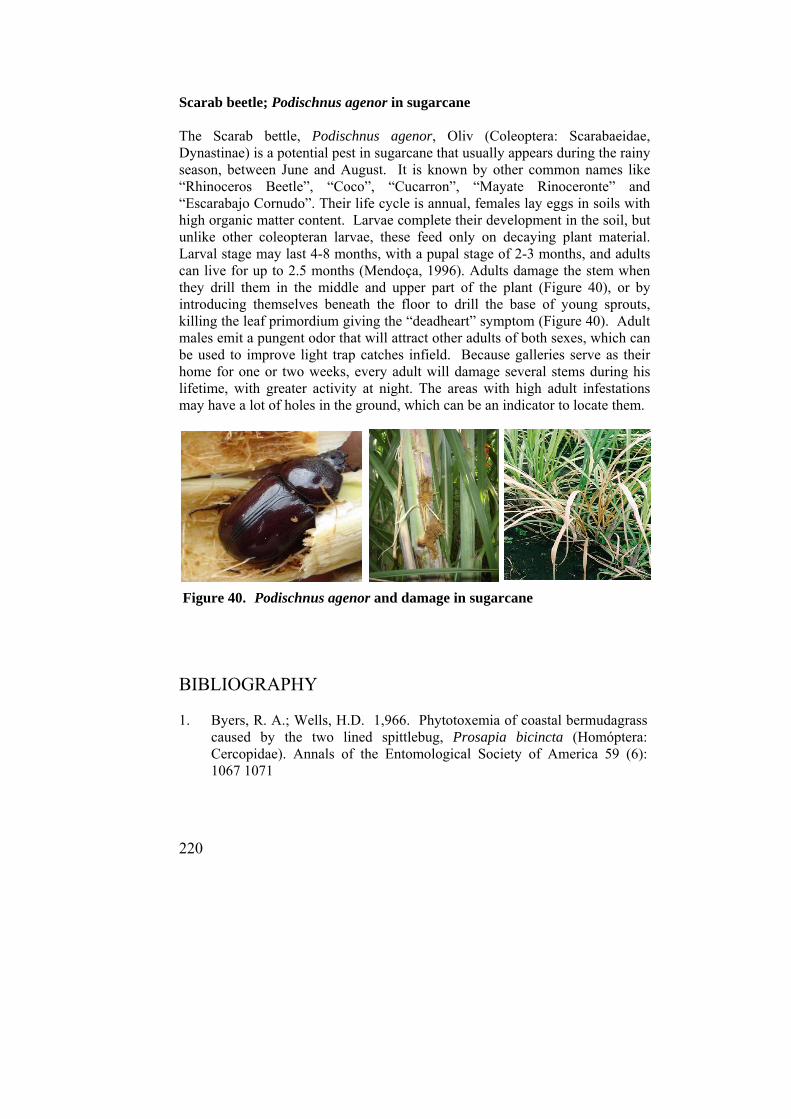
220
Scarab beetle; Podischnus agenor in sugarcane The Scarab bettle, Podischnus agenor, Oliv (Coleoptera: Scarabaeidae, Dynastinae) is a potential pest in sugarcane that usually appears during the rainy season, between June and August. It is known by other common names like “Rhinoceros Beetle”, “Coco”, “Cucarron”, “Mayate Rinoceronte” and “Escarabajo Cornudo”. Their life cycle is annual, females lay eggs in soils with high organic matter content. Larvae complete their development in the soil, but unlike other coleopteran larvae, these feed only on decaying plant material. Larval stage may last 4-8 months, with a pupal stage of 2-3 months, and adults can live for up to 2.5 months (Mendoça, 1996). Adults damage the stem when they drill them in the middle and upper part of the plant (Figure 40), or by introducing themselves beneath the floor to drill the base of young sprouts, killing the leaf primordium giving the “deadheart” symptom (Figure 40). Adult males emit a pungent odor that will attract other adults of both sexes, which can be used to improve light trap catches infield. Because galleries serve as their home for one or two weeks, every adult will damage several stems during his lifetime, with greater activity at night. The areas with high adult infestations may have a lot of holes in the ground, which can be an indicator to locate them.
Figure 40. Podischnus agenor and damage in sugarcane
BIBLIOGRAPHY 1. Byers, R. A.; Wells, H.D. 1,966. Phytotoxemia of coastal bermudagrass
caused by the two lined spittlebug, Prosapia bicincta (Homóptera: Cercopidae). Annals of the Entomological Society of America 59 (6): 1067 1071
221
2. CAÑAMIP (Comité de Manejo Integrado de Plagas de la Caña de Azúcar, GT). 2004. Boletín No.7; Importancia del control de ninfas de Chinche salivosa (Aeneolamia postica) en gramíneas. Guatemala, CENGICAÑA, Julio de 2004. 4 p.
3. Chang, V. C. S. 1985. The sugarcane lace bug: a new insect pest in
Hawaii. Annual Conference Report, Hawaiian Sugar Technology 44: A27-A29.
4. Coto, H. 1977. Biología y control de Ratas sinantrópicas. Editorial
Abierta, Buenos Aires, Argentina. 187 p. 5. Estrada, J.; Salazar, R.; Carrillo, E. 1996. Estimación de pérdidas
causadas por la rata cañera en caña de azúcar variedad CP72-2086. In: Memoria I Simposio Nacional de Plagas de la Caña de Azúcar. Guatemala, CENGICAÑA. pp. 64-67.
6. Fewkes, D. W. 1,969. The biology of sugarcane froghoppers. In: J.R.
Williams, J.R. Metcalfe, R.W. Montgomery y R. Mathes (Eds.). Pests of Sugar Cane, pp. 283-307. Elsevier Publishing Company, Amsterdam.
7. Giraldo-Vanegas, H.; Nass, H; Hernández, E.; Amaya, F.; A. Vargas P.;
Amírez, M., Ramírez, F.; Ramón, M.; Lindarte, J.O. 2005. Incidencia del Saltahojas verde de la caña Saccharosydne saccharivora (Westwood), en siete cultivares de caña de azúcar en el Valle San Antonio-Ureña, Táchira, Venezuela. Agronomía Trop. 55(4): 553-567
8. Márquez, M.; Hidalgo H.; Asencio J. 2001. Estudios de las pérdidas
causadas por Chinche salivosa (Aeneolamia postica) en tres etapas fenológicas de la caña de azúcar. In: Memoria. Presentación de Resultados de Investigación. Zafra 2000/2001. Guatemala, CENGICAÑA. pp. 69-76.
9. Márquez J. M.; Hidalgo, H.; Echeverría L. 2001. Efecto del daño del
ronrón (Podischnus agenor) en caña plantía. In: Memoria. Presentación de resultados de investigación. Zafra 2000/2001. Guatemala, CENGICAÑA. pp. 82-85.
10. Márquez, M. 2001. Efecto de la mecanización sobre la población de
plagas de la raíz en caña de azúcar y su estimación con diferentes tamaños de unidad de muestreo. In: Memoria X Congreso Nacional de la Caña de Azúcar y II Simposio Nacional de Plagas. Guatemala, ATAGUA. pp. 15-20.

222
11. Márquez, J. M.; Peck, D.; Barrios, C. O.; Hidalgo, H. 2002. Identificación de especies de Chinche salivosa (Homóptera: Cercopidae) asociadas al cultivo de caña de azúcar en Guatemala. In: Memoria. Presentación de resultados de investigación. Zafra 2001-2002. Guatemala, CENGICAÑA. pp. 54-59.
12. Márquez J. M. 2002. Metodología del muestreo de daño y pérdidas
ocasionadas por rata en caña de azúcar. In: Memoria. Presentación de resultados de investigación. Zafra 2001-2002. Guatemala, CENGICAÑA. pp. 69-75.
13. Márquez, M.; Barrios, C.; Hidalgo, H. 2002. Identificación de especies de
Gallina ciega del género Phyllophaga en tres sitios de la zona cañera de Guatemala. In: Memoria. Presentación de resultados de investigación. Zafra 2001-2002. Guatemala, CENGICAÑA. pp. 47-53
14. Márquez, M.; Ralda, G. 2005. Efecto de Gallina ciega (Phyllophaga
spp.) y Gusano alambre (Dipropus spp.) sobre el rendimiento de caña de azúcar en Guatemala. In: Memoria. Presentación de resultados de investigación. Zafra 2004-2005. Guatemala, CENGICAÑA. pp. 67-72.
15. Márquez, J. M.; López, E. 2006. Nivel de daño económico para las
plagas de importancia en caña de azúcar y su estimación con base en un programa diseñado por CENGICAÑA. In: Memoria. Presentación de resultados de investigación. Zafra 2005-2006. Guatemala, CENGICAÑA. pp. 194-200.
16. Márquez, J. 2006. Biología básica e identificación de termitas
subterráneas que afectan el cultivo de caña de azúcar, en varias fincas de Guatemala, Zafra 2005/2006. In: Memoria. Presentación de resultados de investigación. Zafra 2005-2006. Guatemala, CENGICAÑA. pp. 146- 154.
17. Márquez, J.; Valle, F. 2006. Caracteres taxonómicos de los géneros de
elatéridos de mayor ocurrencia en caña de azúcar. In: Memoria. Presentación de resultados de investigación. Zafra 2005-2006. Guatemala, CENGICAÑA. pp. 155-164.
18. Márquez, J. M. 2007. Chinche de encaje (Leptodyctia tabida: Hemíptera:
Tingidae) una plaga de daño potencial en caña de azúcar. In: Memoria. Presentación de resultados de investigación. Zafra 2006-2007. Guatemala, CENGICAÑA. pp. 131-136.
223
19. Márquez, M.; Rivas, B.; Aguirre, S.; Torres, E.; López, A. 2009. Estudio de la distribución y abundancia de los Barrenadores del tallo en finca Concepción, ingenio Pantaleon, S.A. In: Memoria. Presentación de resultados de investigación. Zafra 2008-2009. Guatemala, CENGICAÑA. pp. 134-148.
20. Márquez, M.; Ortiz, A.; Motta, V. H.; Lemus, J. M.; Torres, E.; Aguirre,
S. 2009. Evaluación de la eficiencia de planes de manejo integrado de Chinche salivosa: efecto de nuevos productos en el control de la población de ninfas y adultos de Chinche salivosa (Aeneolamia postica). Finca La Libertad, ingenio Palo Gordo, y finca Carrizal, ingenio La Unión. In: Memoria. Presentación de resultados de investigación. Zafra 2008-2009. Guatemala, CENGICAÑA. pp. 116-126.
21. Márquez, M. 2010. Secuencia de labores en el manejo integrado de la
Chinche salivosa (Aeneolamia postica) en Guatemala. In: Memoria. Presentación de resultados de investigación. Zafra 2009-2010. Guatemala, CENGICAÑA. pp. 166-173
22. Mendonca. A. F. 1996. Pragas da cana-de-acucar. Maceió, Brasil.
Insetos & Cia. 239 p. 23. Pedigo, L. P. 1996. Entomology and Pest Management. Second Edition.
1996. Prentice-Hall Pub., Englewood Cliffs, NJ. 679 p. 24. Smith, R. F.; Reynolds, H. T. 1966. Principles, definitions and scope of
integrated pest control. Proc. FAO Symp. Integrated Control. 1:1 1-17. 25. Stern, V. M.; Smith, R. F.; Van den Bosch , R.; Hagen, K. S. 1959. The
integrated control concept. Hilgardia 29:81-101.

224

225
X. DISEASES IN SUGARCANE CROP
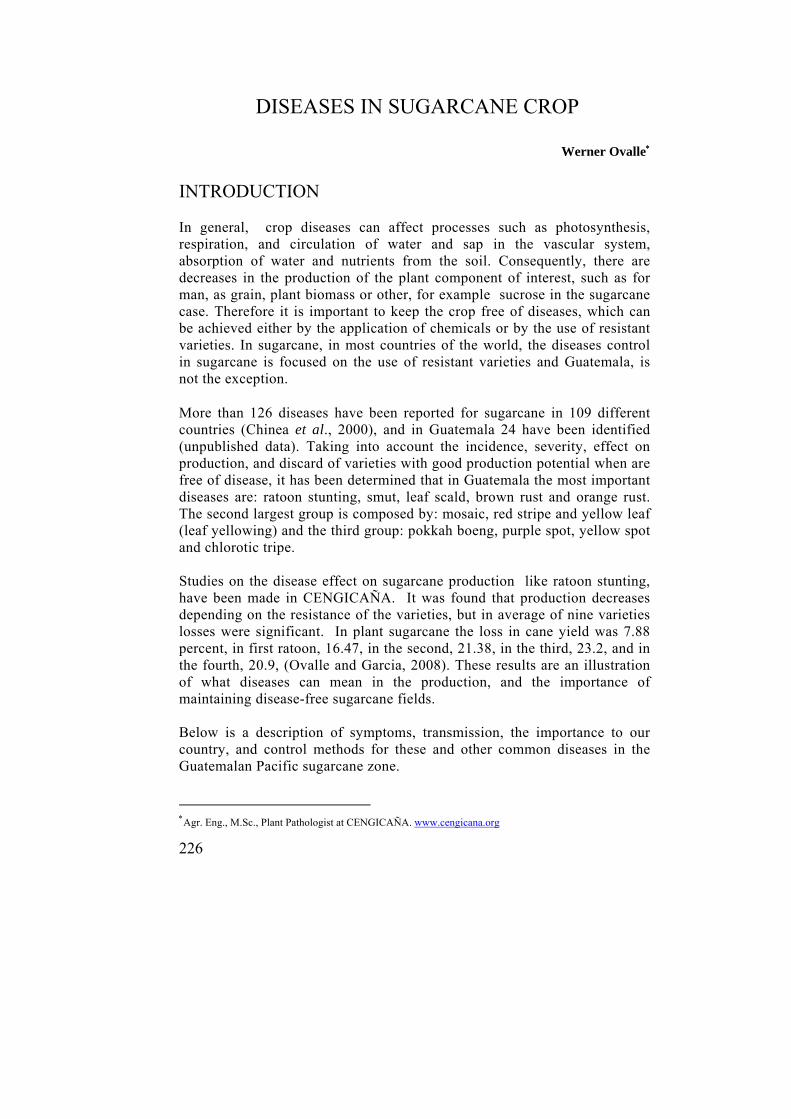
226
DISEASES IN SUGARCANE CROP
Werner Ovalle
INTRODUCTION In general, crop diseases can affect processes such as photosynthesis, respiration, and circulation of water and sap in the vascular system, absorption of water and nutrients from the soil. Consequently, there are decreases in the production of the plant component of interest, such as for man, as grain, plant biomass or other, for example sucrose in the sugarcane case. Therefore it is important to keep the crop free of diseases, which can be achieved either by the application of chemicals or by the use of resistant varieties. In sugarcane, in most countries of the world, the diseases control in sugarcane is focused on the use of resistant varieties and Guatemala, is not the exception. More than 126 diseases have been reported for sugarcane in 109 different countries (Chinea et al., 2000), and in Guatemala 24 have been identified (unpublished data). Taking into account the incidence, severity, effect on production, and discard of varieties with good production potential when are free of disease, it has been determined that in Guatemala the most important diseases are: ratoon stunting, smut, leaf scald, brown rust and orange rust. The second largest group is composed by: mosaic, red stripe and yellow leaf (leaf yellowing) and the third group: pokkah boeng, purple spot, yellow spot and chlorotic tripe. Studies on the disease effect on sugarcane production like ratoon stunting, have been made in CENGICAÑA. It was found that production decreases depending on the resistance of the varieties, but in average of nine varieties losses were significant. In plant sugarcane the loss in cane yield was 7.88 percent, in first ratoon, 16.47, in the second, 21.38, in the third, 23.2, and in the fourth, 20.9, (Ovalle and Garcia, 2008). These results are an illustration of what diseases can mean in the production, and the importance of maintaining disease-free sugarcane fields. Below is a description of symptoms, transmission, the importance to our country, and control methods for these and other common diseases in the Guatemalan Pacific sugarcane zone.
Agr. Eng., M.Sc., Plant Pathologist at CENGICAÑA. www.cengicana.org

227
FUNGAL DISEASES Smut Causal agent: Sporisorium scitamineum (Syd.) M. Piepenbring = Ustilago
scitaminea H. Syd & P. Syd. Symptoms: The main symptom of smut disease is a whip-like structure that develops at the apex of infected stalks (Figure 1). The structure is formed by a center with corky appearance, which is initially covered by millions of spores (chlamydospores), which together present a black color. That is why the common name of the disease, because it looks like coal dust (smut) (Martin et al., 1961). The whip-like structure is covered by a thin silver-gray membrane, which while breaking, releases spores (Ramallo and Ramallo Vázquez, 2004). After the release of spores the structure can remain as a corked appendage. The structure has no ramifications, and depending of the variety it is variable in thickness and the length varies from a few centimeters to over a meter (Chinea et al., 2000). It can also be straight or curved. Before the whip emergence, the infected stems may show abnormalities and can be thinner, flattened rather than cylindrical and the leaves of the infected plant are reduced in size and width, taking a position in which the insertion angle of the stem is reduced (more upright than normal) (Ovalle, 1997; Vázquez de Ramallo and Ramallo, 2004). In susceptible varieties, infections of the stalk pieces used as seed can produce dozens or even hundreds of thin stalks that produce stools with “grassy” appearance and eventually develop whips in their tops. Secondary infections can cause the development of small lateral whips type "lalas or side shoots" (called lalas to anticipated growth of lateral buds) on stems with normal development (Martin et al., 1961). Transmission and spread: The transmission and spread of the disease occurs when wind or rain release the spores and carry them to the neighbor plants or neighboring fields (Chinea et al., 2000). The spores germinate and infect the buds, the infection can remain dormant until the next cycle when the pieces of stalks are used as seed in other fields, or produce the appearance of side whips in the same cycle (Ovalle, 1997) where infection occurred. Importance: Smut disease is considered one of the most important diseases in sugarcane, because of this potential to cause losses of production, which has impacted various sugarcane producing countries. In Guatemala severe losses
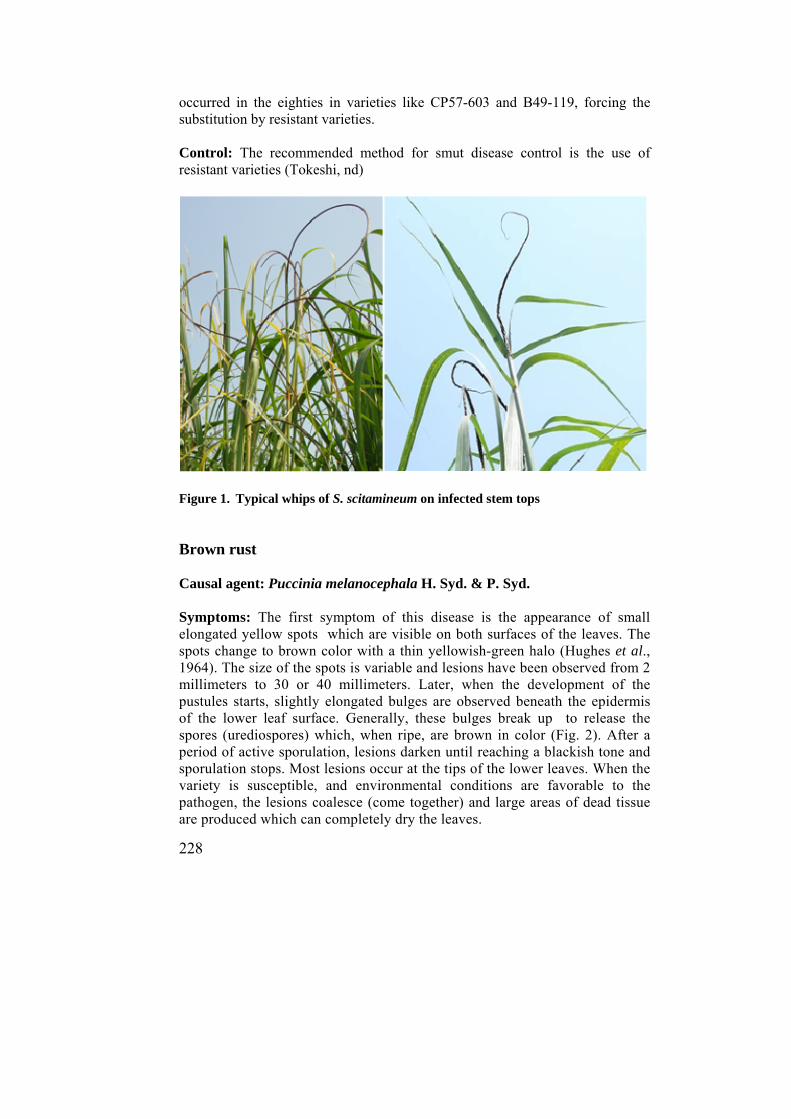
228
occurred in the eighties in varieties like CP57-603 and B49-119, forcing the substitution by resistant varieties. Control: The recommended method for smut disease control is the use of resistant varieties (Tokeshi, nd)
Figure 1. Typical whips of S. scitamineum on infected stem tops Brown rust Causal agent: Puccinia melanocephala H. Syd. & P. Syd. Symptoms: The first symptom of this disease is the appearance of small elongated yellow spots which are visible on both surfaces of the leaves. The spots change to brown color with a thin yellowish-green halo (Hughes et al., 1964). The size of the spots is variable and lesions have been observed from 2 millimeters to 30 or 40 millimeters. Later, when the development of the pustules starts, slightly elongated bulges are observed beneath the epidermis of the lower leaf surface. Generally, these bulges break up to release the spores (urediospores) which, when ripe, are brown in color (Fig. 2). After a period of active sporulation, lesions darken until reaching a blackish tone and sporulation stops. Most lesions occur at the tips of the lower leaves. When the variety is susceptible, and environmental conditions are favorable to the pathogen, the lesions coalesce (come together) and large areas of dead tissue are produced which can completely dry the leaves.
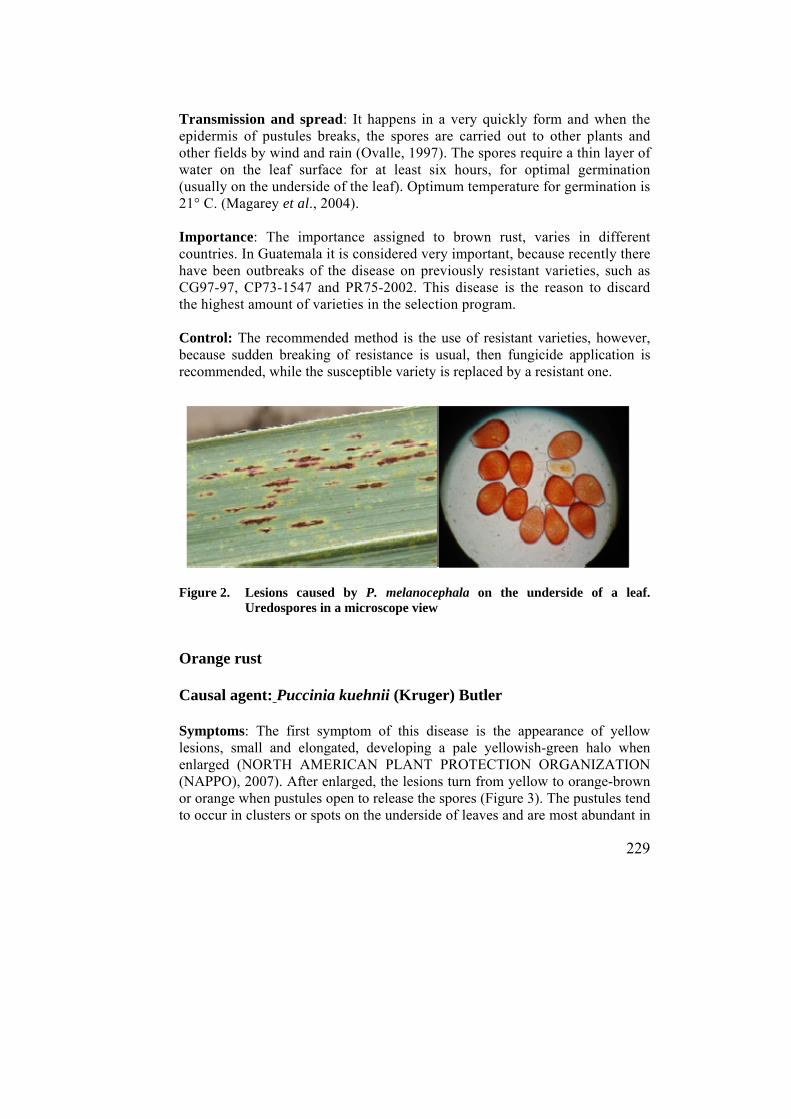
229
Transmission and spread: It happens in a very quickly form and when the epidermis of pustules breaks, the spores are carried out to other plants and other fields by wind and rain (Ovalle, 1997). The spores require a thin layer of water on the leaf surface for at least six hours, for optimal germination (usually on the underside of the leaf). Optimum temperature for germination is 21° C. (Magarey et al., 2004). Importance: The importance assigned to brown rust, varies in different countries. In Guatemala it is considered very important, because recently there have been outbreaks of the disease on previously resistant varieties, such as CG97-97, CP73-1547 and PR75-2002. This disease is the reason to discard the highest amount of varieties in the selection program. Control: The recommended method is the use of resistant varieties, however, because sudden breaking of resistance is usual, then fungicide application is recommended, while the susceptible variety is replaced by a resistant one.
Figure 2. Lesions caused by P. melanocephala on the underside of a leaf. Uredospores in a microscope view
Orange rust Causal agent: Puccinia kuehnii (Kruger) Butler Symptoms: The first symptom of this disease is the appearance of yellow lesions, small and elongated, developing a pale yellowish-green halo when enlarged (NORTH AMERICAN PLANT PROTECTION ORGANIZATION (NAPPO), 2007). After enlarged, the lesions turn from yellow to orange-brown or orange when pustules open to release the spores (Figure 3). The pustules tend to occur in clusters or spots on the underside of leaves and are most abundant in

230
the apical zone. One characteristic which distinguish orange rust from brown rust, is its tendency to produce additional infections in the middle and basal areas of the leaves in pustule patches. Another difference is the size and shape of the lesions, which are larger and more elongated in brown rust that can be distinguished only by the experience of repeated observations. The color of the lesions does not allow differentiation, in old lesions. Adequate differentiation is achieved only by observing the spores under the microscope. The behavior of infections is different in both rusts, since forfor brown rust infection occurs in young states of the plant (up to 5 or 6 months) and after the, symptoms of the disease disappear. In orange rust, lesions have been observed with active and abundant sporulation until maturity of the plant and even on necrotic tissue and during dry seasons. Transmission and spread: The transmission and spread, occurs when the epidermis of the pustules breaks and spores are carried out to other plants and other fields by wind and rain. The spores require Relative Humidity values above 98 percent and the optimal temperature for germination is 21°C. (Magarey et al., 2004). Importance: In Guatemala, the disease is considered of high importance, since its arrival to the country caused major changes in varieties composition. The most important variety CP72-2086 decreased from 66 percent to 30 percent in three years; and the variety CP88-1165 increased from 5 percent to 35 percent in that period, with consequent expenses for these changes. In addition, the disease caused discarding of many varieties in different stages of CENGICAÑA´s selection program. Control: The recommended method is the use of resistant varieties, however, in countries like Australia and the United States, application of fungicides is recommended while the susceptible variety is replaced by a resistant one.
Figure 3. Lesions caused by P. kuehnii on the underside of a leaf. Uredospores
in a microscope view

231
Pokkah boeng: Causal agent: Gibberella moniliformis (Sheldon) Wineland Fusarium moniliforme Sheld. Snyd et Hans Symptoms: Initially symptoms of the disease are manifested in the stalk apex, subsequently it can be seen on lower positioned leaves, when the stalk continues growing. Symptoms ranging from discoloration (chlorosis) of unopened leaves , which are whitish or yellowish (Figure 4), until the death of the apical meristem (this is not common). Other symptoms of intermediate intensity are deformations of unopened leaves, wrinkled or entangled, therefore the opening and expansion is difficult. In other cases, a whitish or yellowish discoloration in the basal part of the young leaves is seen, and red stripes are projected that can be confused with those caused by red stripe disease (Pseudomonas rubrilineans). During periods of high relative humidity, the base of the apical leaves may show areas of necrotic tissue, redish-brown in color and when, the sporulation occurs (Ovalle, 1997) (Figure 4). Sometimes, the infection causes malformations of the stalks, which vary in intensity and the stalks can show superficial or deep horizontal cracks. When the variety is susceptible, the disease can cause death of the apical meristem and side shoot development (lalas). Transmission and spread: The transmission of the disease takes place mainly by the transfer of spores by wind (Martin et al., 1961). Importance: Despite the above symptoms, the disease rarely causes effects on production. It is common, in the varieties growing in Guatemala, sometimes with alarming symptoms that then disappear, with minimal or no effect on the production. The disease is more severe when the weather conditions are very hot and dry, and after a rainy period that cause high environmental humidity ((Martin et al. 1961). Control: The recommended control method is the use of resistant varieties.
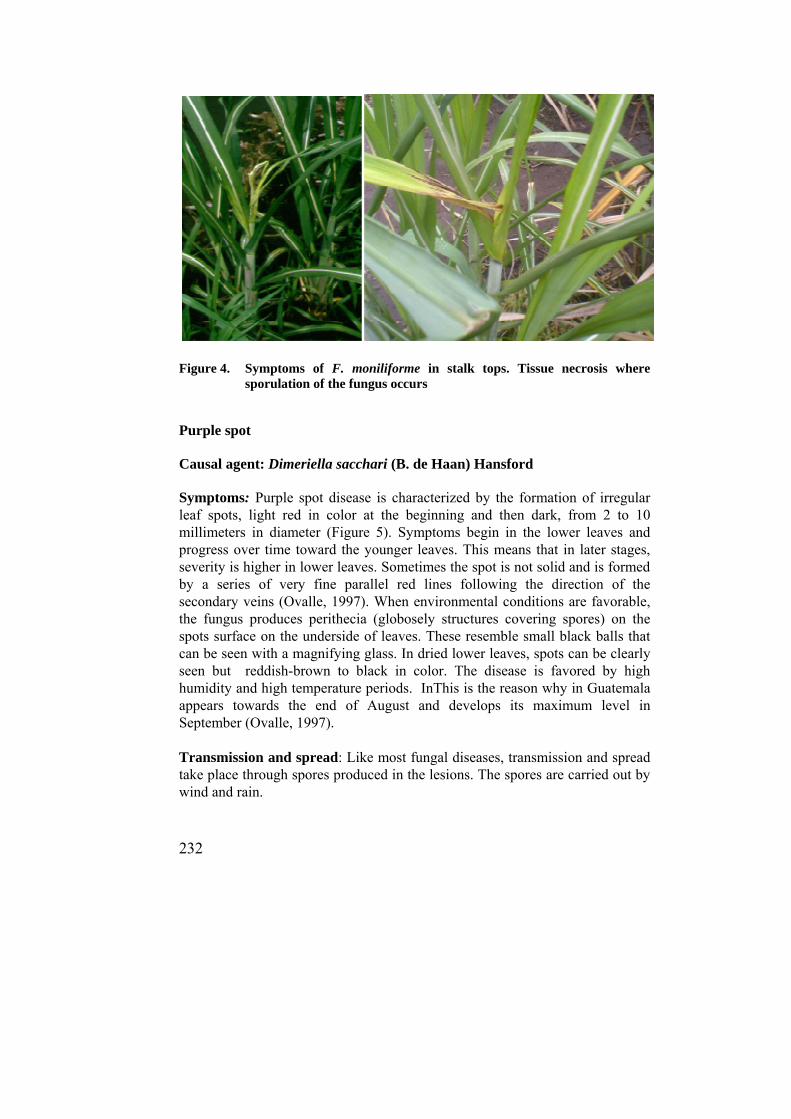
232
Figure 4. Symptoms of F. moniliforme in stalk tops. Tissue necrosis where
sporulation of the fungus occurs Purple spot Causal agent: Dimeriella sacchari (B. de Haan) Hansford Symptoms: Purple spot disease is characterized by the formation of irregular leaf spots, light red in color at the beginning and then dark, from 2 to 10 millimeters in diameter (Figure 5). Symptoms begin in the lower leaves and progress over time toward the younger leaves. This means that in later stages, severity is higher in lower leaves. Sometimes the spot is not solid and is formed by a series of very fine parallel red lines following the direction of the secondary veins (Ovalle, 1997). When environmental conditions are favorable, the fungus produces perithecia (globosely structures covering spores) on the spots surface on the underside of leaves. These resemble small black balls that can be seen with a magnifying glass. In dried lower leaves, spots can be clearly seen but reddish-brown to black in color. The disease is favored by high humidity and high temperature periods. InThis is the reason why in Guatemala appears towards the end of August and develops its maximum level in September (Ovalle, 1997). Transmission and spread: Like most fungal diseases, transmission and spread take place through spores produced in the lesions. The spores are carried out by wind and rain.
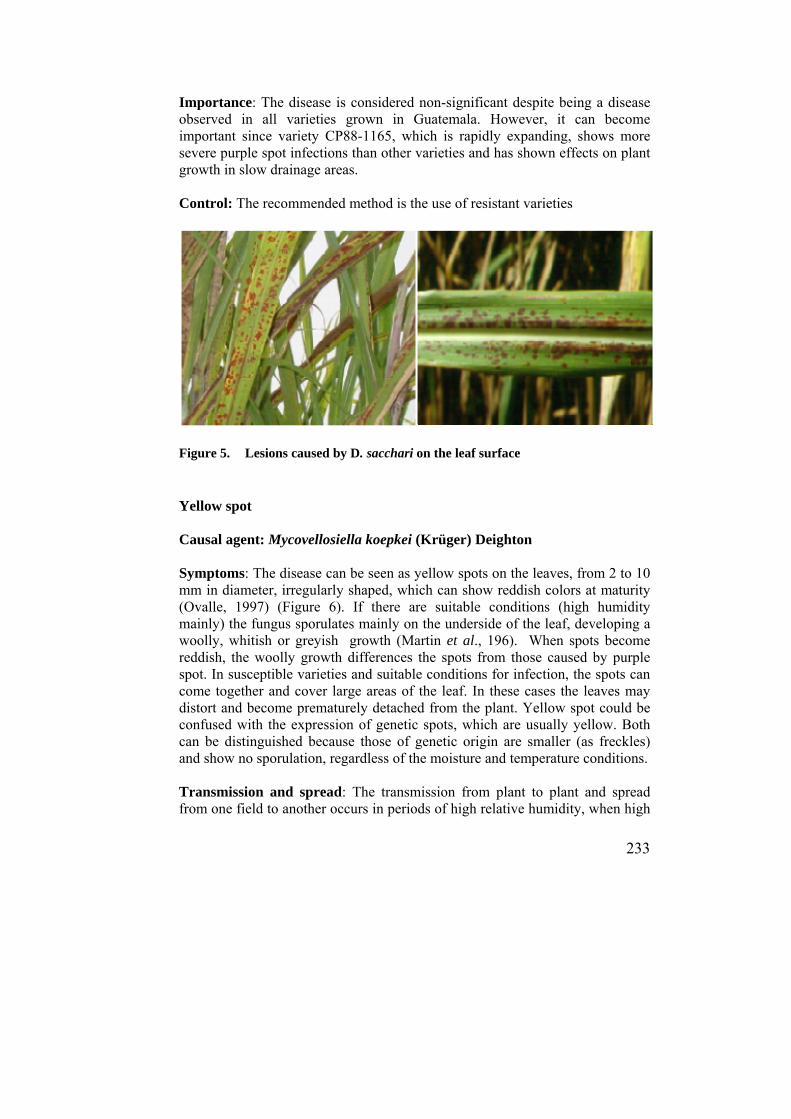
233
Importance: The disease is considered non-significant despite being a disease observed in all varieties grown in Guatemala. However, it can become important since variety CP88-1165, which is rapidly expanding, shows more severe purple spot infections than other varieties and has shown effects on plant growth in slow drainage areas. Control: The recommended method is the use of resistant varieties
Figure 5. Lesions caused by D. sacchari on the leaf surface Yellow spot Causal agent: Mycovellosiella koepkei (Krüger) Deighton Symptoms: The disease can be seen as yellow spots on the leaves, from 2 to 10 mm in diameter, irregularly shaped, which can show reddish colors at maturity (Ovalle, 1997) (Figure 6). If there are suitable conditions (high humidity mainly) the fungus sporulates mainly on the underside of the leaf, developing a woolly, whitish or greyish growth (Martin et al., 196). When spots become reddish, the woolly growth differences the spots from those caused by purple spot. In susceptible varieties and suitable conditions for infection, the spots can come together and cover large areas of the leaf. In these cases the leaves may distort and become prematurely detached from the plant. Yellow spot could be confused with the expression of genetic spots, which are usually yellow. Both can be distinguished because those of genetic origin are smaller (as freckles) and show no sporulation, regardless of the moisture and temperature conditions. Transmission and spread: The transmission from plant to plant and spread from one field to another occurs in periods of high relative humidity, when high

234
sporulation occurs and spores are splashed by rain and carried out by wind (Martin et al ., 1961). Importance: The disease is considered of minor importance in Guatemala, as in the currently used varieties, it appears in advanced stages of plant development. Control: The recommended method is the use of resistant varieties (Ramallo and Ramallo Vázquez, 2004). Figure 6. M. koepkei lesions on the leaf surface Rot of basal stem, sheath and root Causal agents: Marasmius sacchari Wakker y M. stenospilus Montagne Symptoms: The distinctive symptom of this disease is the mycelium development in the basal leaf sheaths and in basal portion of the stalk (Tokeshi, sf, Hughes et al., 1964). Mycelial growth is noticed more easily by separating, the sheaths of lower leaves from the stalks which exposed show a whitish growth on both surfaces. It seems that sheaths are glued or attached to the stalk; this is due to mycelial growth between the two surfaces. If humidity and temperature conditions are high, development of reproduction structure occurs, which is characterized by an umbrella-shaped structure, white in color with a yellow to light-brown center, from 2 to 4 cm in diameter, with long bases of 2-7 cm (estipites) (Tokeshi, nd), (Figure 7). Usually the reproduction structure grows very close to or on the soil surface (Hughes et al., 1964). These structures produce and release large amounts of spores from the underside. In severe
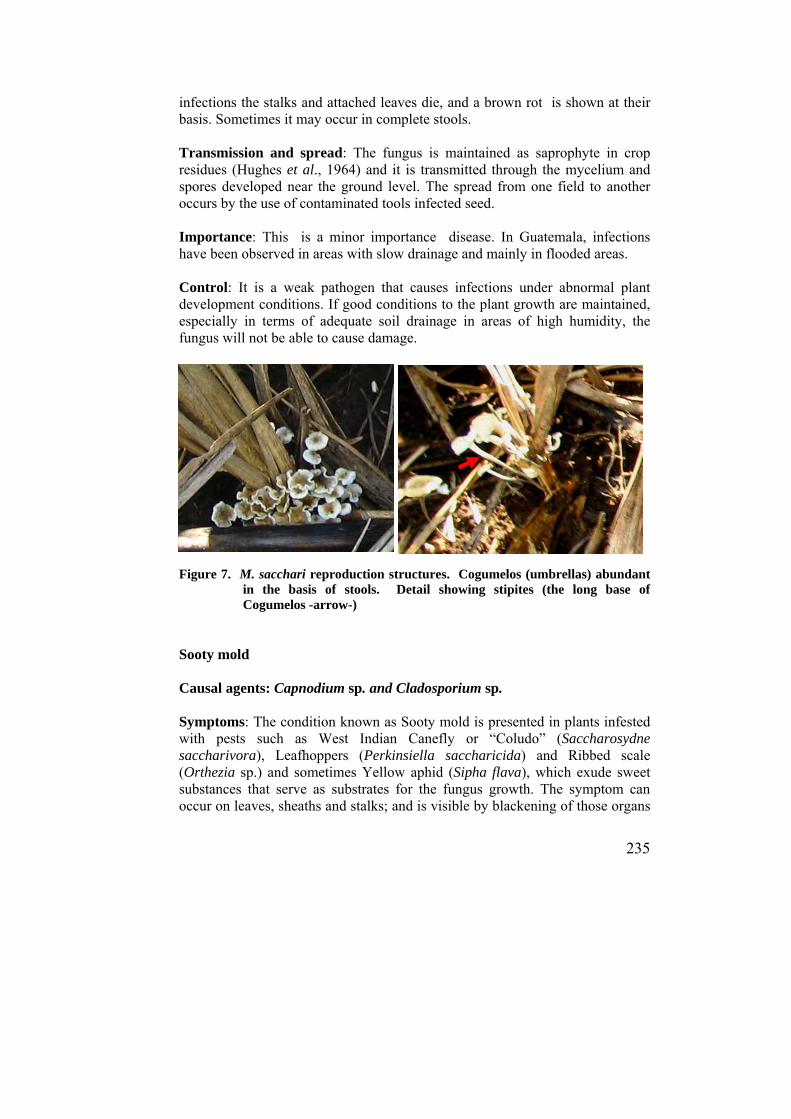
235
infections the stalks and attached leaves die, and a brown rot is shown at their basis. Sometimes it may occur in complete stools. Transmission and spread: The fungus is maintained as saprophyte in crop residues (Hughes et al., 1964) and it is transmitted through the mycelium and spores developed near the ground level. The spread from one field to another occurs by the use of contaminated tools infected seed. Importance: This is a minor importance disease. In Guatemala, infections have been observed in areas with slow drainage and mainly in flooded areas. Control: It is a weak pathogen that causes infections under abnormal plant development conditions. If good conditions to the plant growth are maintained, especially in terms of adequate soil drainage in areas of high humidity, the fungus will not be able to cause damage. Figure 7. M. sacchari reproduction structures. Cogumelos (umbrellas) abundant
in the basis of stools. Detail showing stipites (the long base of Cogumelos -arrow-)
Sooty mold Causal agents: Capnodium sp. and Cladosporium sp. Symptoms: The condition known as Sooty mold is presented in plants infested with pests such as West Indian Canefly or “Coludo” (Saccharosydne saccharivora), Leafhoppers (Perkinsiella saccharicida) and Ribbed scale (Orthezia sp.) and sometimes Yellow aphid (Sipha flava), which exude sweet substances that serve as substrates for the fungus growth. The symptom can occur on leaves, sheaths and stalks; and is visible by blackening of those organs
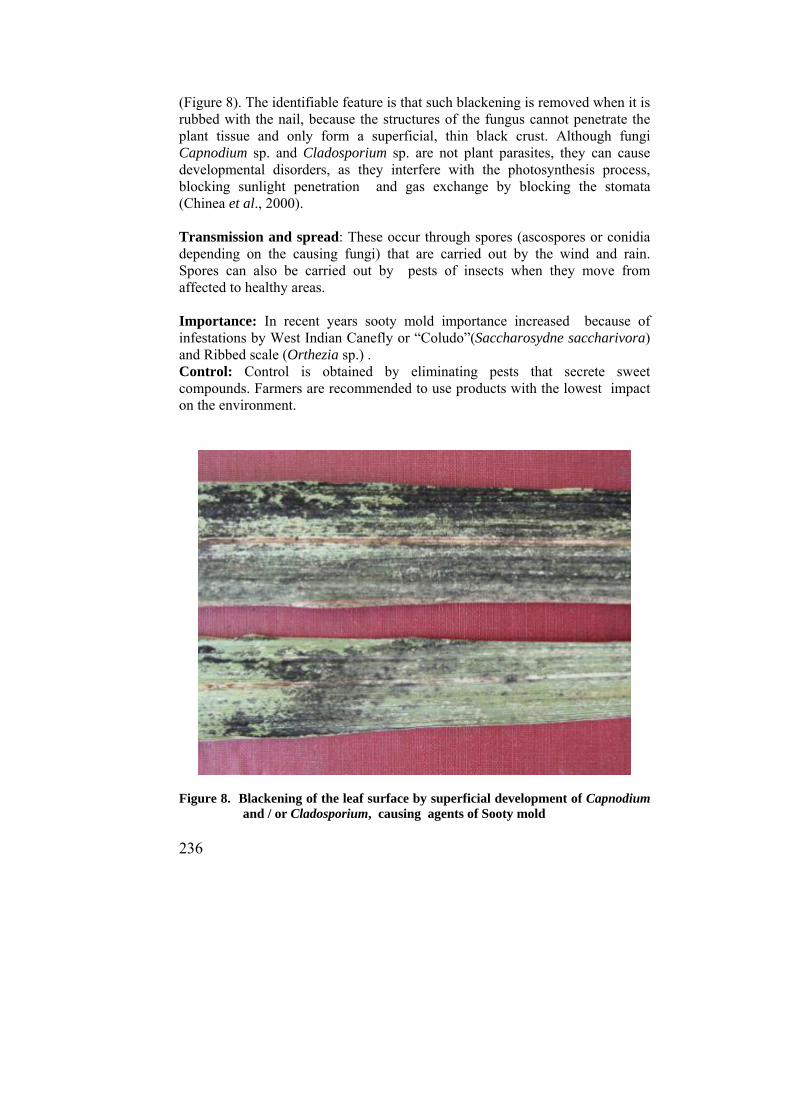
236
(Figure 8). The identifiable feature is that such blackening is removed when it is rubbed with the nail, because the structures of the fungus cannot penetrate the plant tissue and only form a superficial, thin black crust. Although fungi Capnodium sp. and Cladosporium sp. are not plant parasites, they can cause developmental disorders, as they interfere with the photosynthesis process, blocking sunlight penetration and gas exchange by blocking the stomata (Chinea et al., 2000). Transmission and spread: These occur through spores (ascospores or conidia depending on the causing fungi) that are carried out by the wind and rain. Spores can also be carried out by pests of insects when they move from affected to healthy areas. Importance: In recent years sooty mold importance increased because of infestations by West Indian Canefly or “Coludo”(Saccharosydne saccharivora) and Ribbed scale (Orthezia sp.) . Control: Control is obtained by eliminating pests that secrete sweet compounds. Farmers are recommended to use products with the lowest impact on the environment.
Figure 8. Blackening of the leaf surface by superficial development of Capnodium
and / or Cladosporium, causing agents of Sooty mold
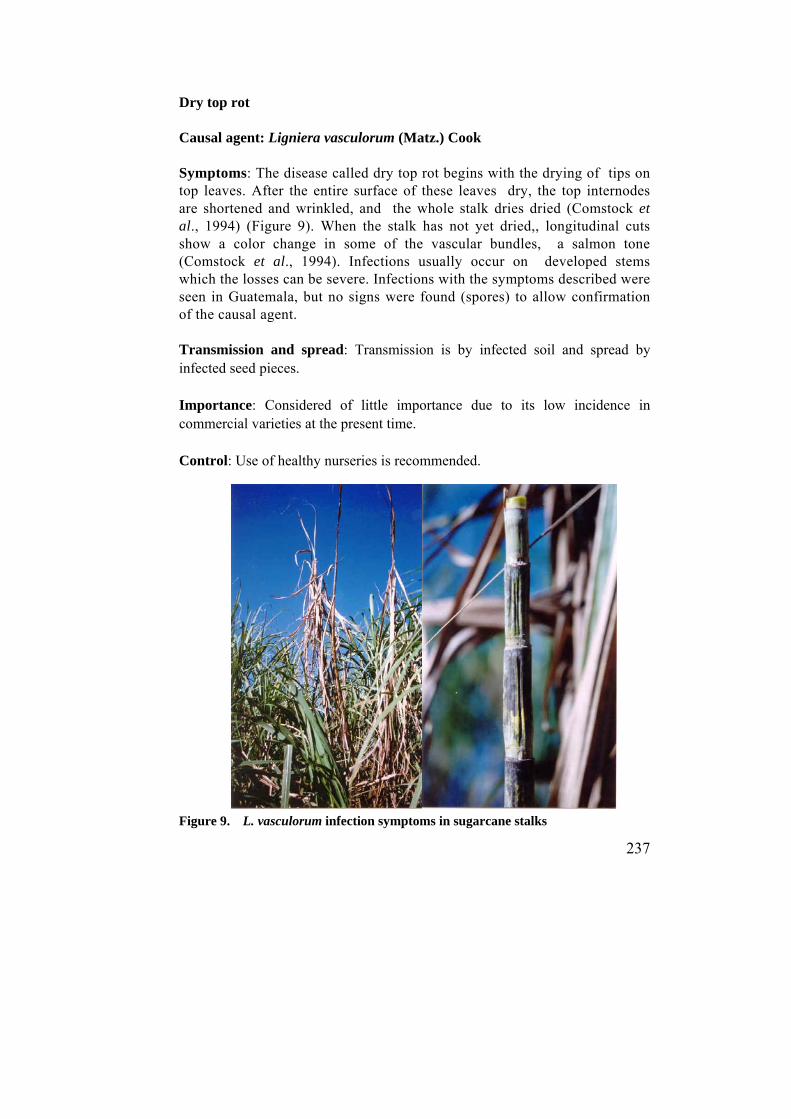
237
Dry top rot Causal agent: Ligniera vasculorum (Matz.) Cook Symptoms: The disease called dry top rot begins with the drying of tips on top leaves. After the entire surface of these leaves dry, the top internodes are shortened and wrinkled, and the whole stalk dries dried (Comstock et al., 1994) (Figure 9). When the stalk has not yet dried,, longitudinal cuts show a color change in some of the vascular bundles, a salmon tone (Comstock et al., 1994). Infections usually occur on developed stems which the losses can be severe. Infections with the symptoms described were seen in Guatemala, but no signs were found (spores) to allow confirmation of the causal agent. Transmission and spread: Transmission is by infected soil and spread by infected seed pieces. Importance: Considered of little importance due to its low incidence in commercial varieties at the present time. Control: Use of healthy nurseries is recommended. Figure 9. L. vasculorum infection symptoms in sugarcane stalks
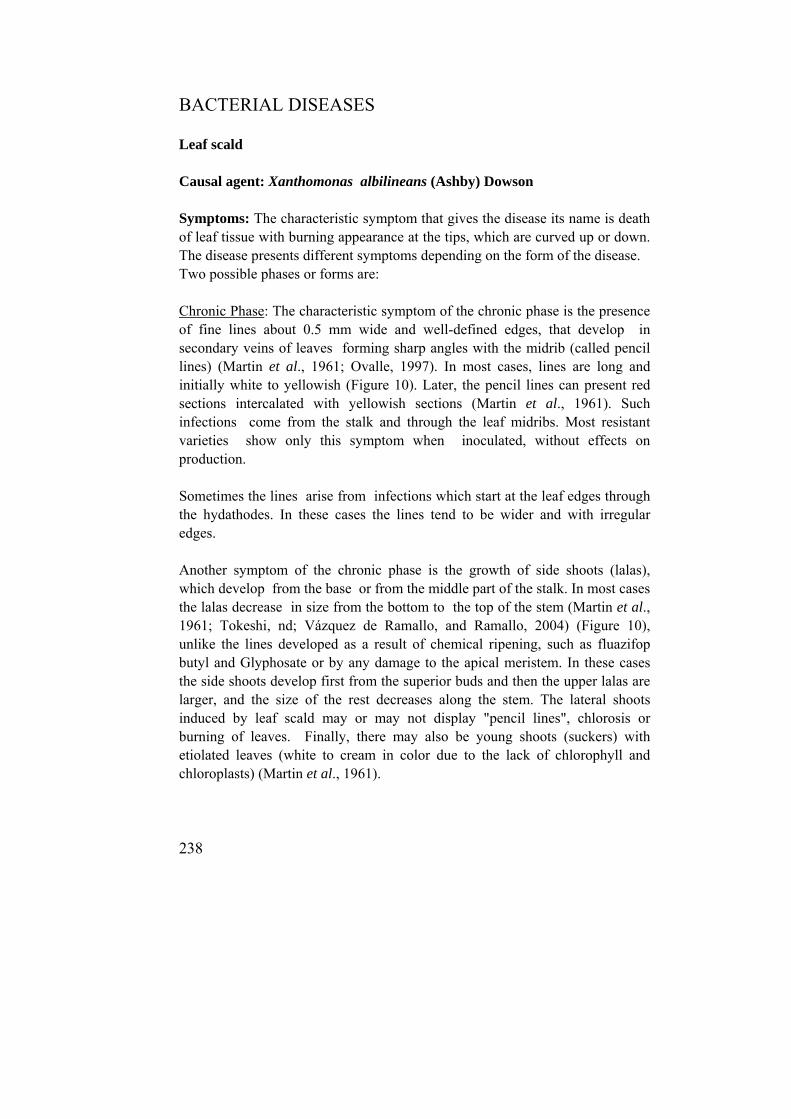
238
BACTERIAL DISEASES Leaf scald Causal agent: Xanthomonas albilineans (Ashby) Dowson Symptoms: The characteristic symptom that gives the disease its name is death of leaf tissue with burning appearance at the tips, which are curved up or down. The disease presents different symptoms depending on the form of the disease. Two possible phases or forms are: Chronic Phase: The characteristic symptom of the chronic phase is the presence of fine lines about 0.5 mm wide and well-defined edges, that develop in secondary veins of leaves forming sharp angles with the midrib (called pencil lines) (Martin et al., 1961; Ovalle, 1997). In most cases, lines are long and initially white to yellowish (Figure 10). Later, the pencil lines can present red sections intercalated with yellowish sections (Martin et al., 1961). Such infections come from the stalk and through the leaf midribs. Most resistant varieties show only this symptom when inoculated, without effects on production. Sometimes the lines arise from infections which start at the leaf edges through the hydathodes. In these cases the lines tend to be wider and with irregular edges. Another symptom of the chronic phase is the growth of side shoots (lalas), which develop from the base or from the middle part of the stalk. In most cases the lalas decrease in size from the bottom to the top of the stem (Martin et al., 1961; Tokeshi, nd; Vázquez de Ramallo, and Ramallo, 2004) (Figure 10), unlike the lines developed as a result of chemical ripening, such as fluazifop butyl and Glyphosate or by any damage to the apical meristem. In these cases the side shoots develop first from the superior buds and then the upper lalas are larger, and the size of the rest decreases along the stem. The lateral shoots induced by leaf scald may or may not display "pencil lines", chlorosis or burning of leaves. Finally, there may also be young shoots (suckers) with etiolated leaves (white to cream in color due to the lack of chlorophyll and chloroplasts) (Martin et al., 1961).
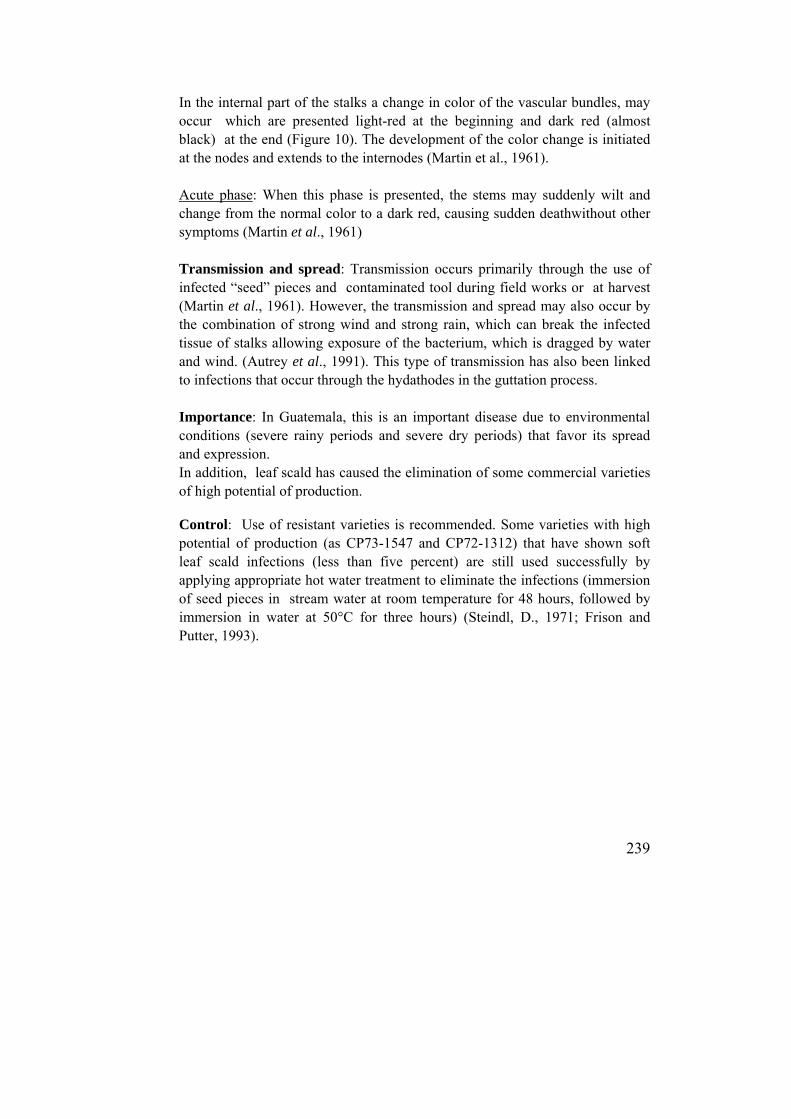
239
In the internal part of the stalks a change in color of the vascular bundles, may occur which are presented light-red at the beginning and dark red (almost black) at the end (Figure 10). The development of the color change is initiated at the nodes and extends to the internodes (Martin et al., 1961). Acute phase: When this phase is presented, the stems may suddenly wilt and change from the normal color to a dark red, causing sudden deathwithout other symptoms (Martin et al., 1961) Transmission and spread: Transmission occurs primarily through the use of infected “seed” pieces and contaminated tool during field works or at harvest (Martin et al., 1961). However, the transmission and spread may also occur by the combination of strong wind and strong rain, which can break the infected tissue of stalks allowing exposure of the bacterium, which is dragged by water and wind. (Autrey et al., 1991). This type of transmission has also been linked to infections that occur through the hydathodes in the guttation process. Importance: In Guatemala, this is an important disease due to environmental conditions (severe rainy periods and severe dry periods) that favor its spread and expression. In addition, leaf scald has caused the elimination of some commercial varieties of high potential of production. Control: Use of resistant varieties is recommended. Some varieties with high potential of production (as CP73-1547 and CP72-1312) that have shown soft leaf scald infections (less than five percent) are still used successfully by applying appropriate hot water treatment to eliminate the infections (immersion of seed pieces in stream water at room temperature for 48 hours, followed by immersion in water at 50°C for three hours) (Steindl, D., 1971; Frison and Putter, 1993).
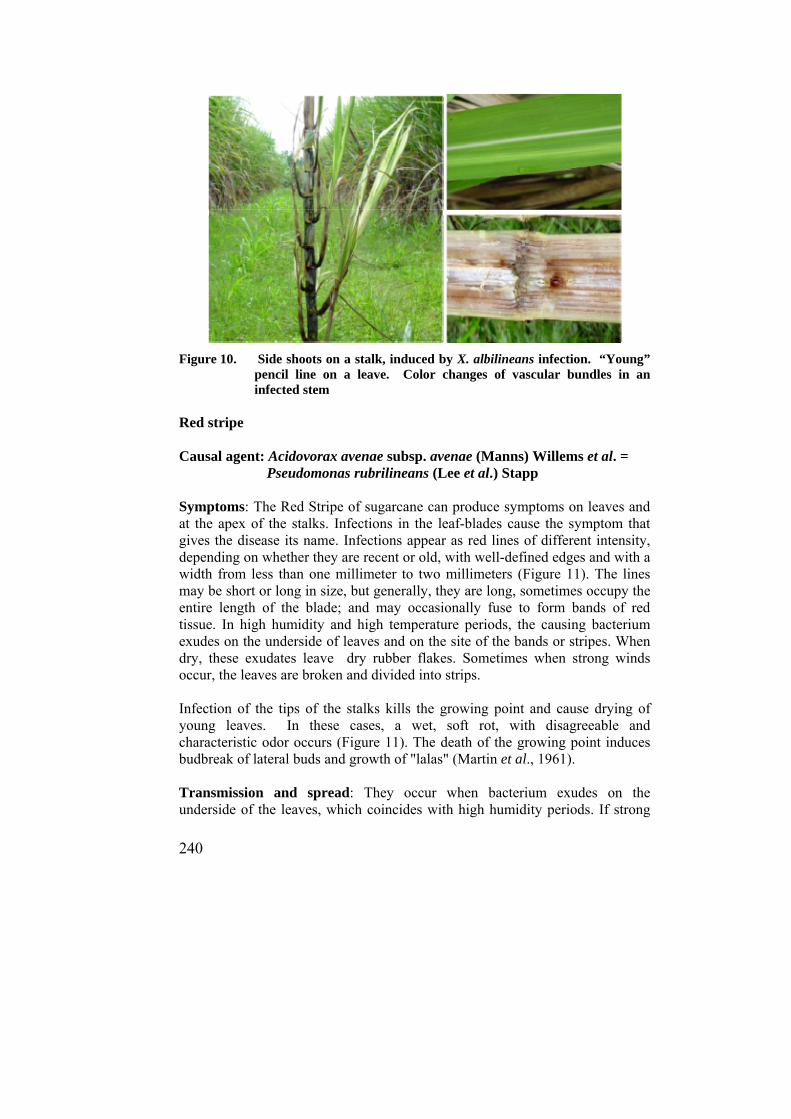
240
Figure 10. Side shoots on a stalk, induced by X. albilineans infection. “Young” pencil line on a leave. Color changes of vascular bundles in an infected stem
Red stripe Causal agent: Acidovorax avenae subsp. avenae (Manns) Willems et al. = Pseudomonas rubrilineans (Lee et al.) Stapp Symptoms: The Red Stripe of sugarcane can produce symptoms on leaves and at the apex of the stalks. Infections in the leaf-blades cause the symptom that gives the disease its name. Infections appear as red lines of different intensity, depending on whether they are recent or old, with well-defined edges and with a width from less than one millimeter to two millimeters (Figure 11). The lines may be short or long in size, but generally, they are long, sometimes occupy the entire length of the blade; and may occasionally fuse to form bands of red tissue. In high humidity and high temperature periods, the causing bacterium exudes on the underside of leaves and on the site of the bands or stripes. When dry, these exudates leave dry rubber flakes. Sometimes when strong winds occur, the leaves are broken and divided into strips. Infection of the tips of the stalks kills the growing point and cause drying of young leaves. In these cases, a wet, soft rot, with disagreeable and characteristic odor occurs (Figure 11). The death of the growing point induces budbreak of lateral buds and growth of "lalas" (Martin et al., 1961). Transmission and spread: They occur when bacterium exudes on the underside of the leaves, which coincides with high humidity periods. If strong

241
rains and winds occur, the bacterium is spread by splashing and drag, and penetrates through leave wounds (Martin et al., 1961). The bacterium does not circulate through the vascular bundles of stalks; and therefore it does not spread through the seed. Importance: Currently, the red stripe is of relative importance in Guatemala, because among the major varieties only CP72-2086 is severely attacked during the growing phase in low slow drainage and ponding areas. Control: The recommended method is the use of resistant varieties. It has been observed that some varieties show susceptibility and resistance in young states from 7 or 8 months of age, lost stem infection recovery, issuing new stems.
Figure 11. Symptom of red stripe on a leaf and on the growing point of a stalk Ratoon Stunting Disease Causal agent: Leifsonia xyli subsp. xyli (Davis et al.) Evtushenko Symptoms: This is one of the most difficult diseases to diagnose with certainty in the field, because its symptoms are vague and can be confused with those produced by other abiotic agents (CENICAÑA, 1995). When plants are infected, there occurs a progressive reduction in sugarcane production through the harvests; this effect gave the name to the disease. Such reduction is due to the obstructions of xylem vessels caused by the bacterium, resulting in lower growth (shortening of internodes and decrease of diameter –notice in Figure 12, ten healthy stalks and ten infected stalks–). Besides, diseased stools may produce fewer stems (CENICAÑA, 1995; Ovalle and Garcia, 2008). In some varieties, there are reddish small lines (1-2 mm), at the base of the internodes in longitudinal sections of diseased stalks (CENICAÑA, 1995) (Figure 12).

242
Transmission and spread: It mainly occurs through infected seed pieces and infected cutting tools and tillage. Importance: It is considered one of the most important diseases worldwide. It has been found infecting all varieties growing in Guatemala, and it has been demonstrated that it causes significant effect on production. (Bailey and Bechet, 1995; Ovalle and Garcia, 2008). Control: Hot water treatment of seed pieces is the most used control method. In Guatemala, five hydrothermal treatments were evaluated (Ovalle et al., 2001), and the best results were found by dipping seed pieces in hot water at 51oC for 10 minutes, followed by reposing at room temperature for 12 hours, and finally immersion in hot water at 51°C for one hour. However, good results were also obtained by direct immersion of the seed pieces in water at 52oC for 30 minutes, which is a simple treatment. Besides the use of healthy seed, control of ratoon stunting, should include cleaning of the cutting and field work tools. This is done with chemicals and good results have been achieved with Vanodine 1% (Victoria, et al., 1985; CENICAÑA, 1995).
Figure 12. L. xyli infection effect on stems. Reddish lines at the basis of an
infected node
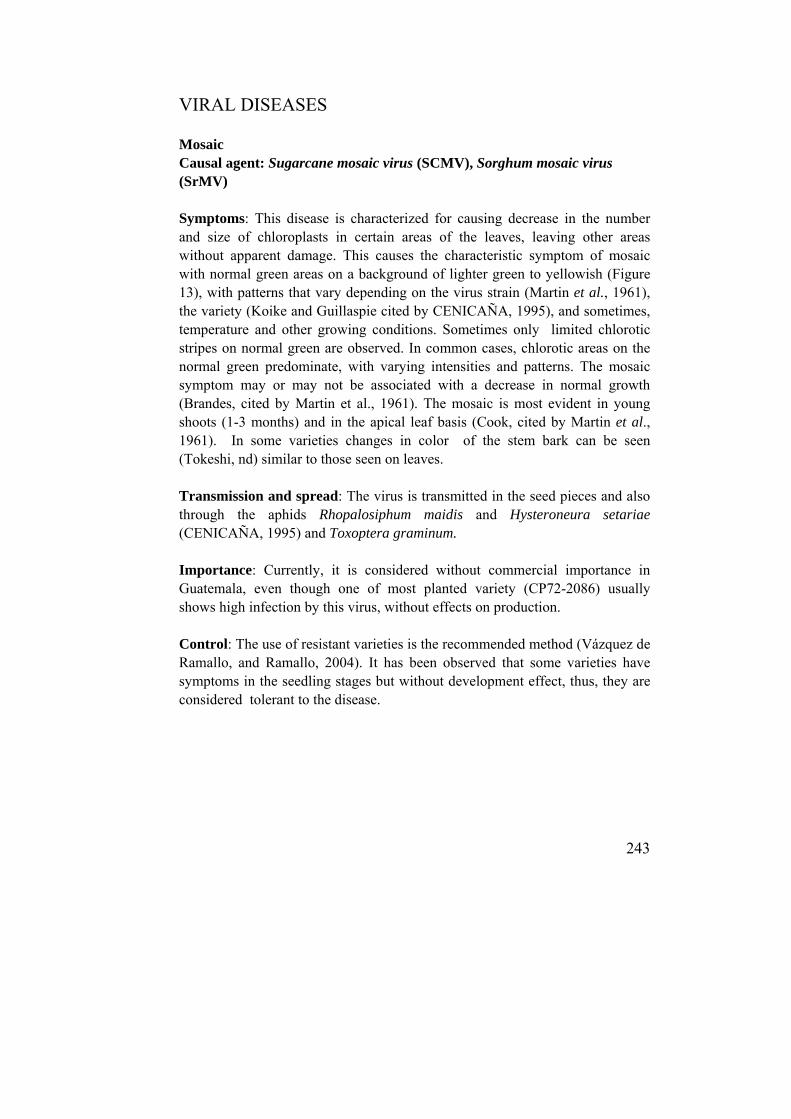
243
VIRAL DISEASES Mosaic Causal agent: Sugarcane mosaic virus (SCMV), Sorghum mosaic virus (SrMV) Symptoms: This disease is characterized for causing decrease in the number and size of chloroplasts in certain areas of the leaves, leaving other areas without apparent damage. This causes the characteristic symptom of mosaic with normal green areas on a background of lighter green to yellowish (Figure 13), with patterns that vary depending on the virus strain (Martin et al., 1961), the variety (Koike and Guillaspie cited by CENICAÑA, 1995), and sometimes, temperature and other growing conditions. Sometimes only limited chlorotic stripes on normal green are observed. In common cases, chlorotic areas on the normal green predominate, with varying intensities and patterns. The mosaic symptom may or may not be associated with a decrease in normal growth (Brandes, cited by Martin et al., 1961). The mosaic is most evident in young shoots (1-3 months) and in the apical leaf basis (Cook, cited by Martin et al., 1961). In some varieties changes in color of the stem bark can be seen (Tokeshi, nd) similar to those seen on leaves. Transmission and spread: The virus is transmitted in the seed pieces and also through the aphids Rhopalosiphum maidis and Hysteroneura setariae (CENICAÑA, 1995) and Toxoptera graminum. Importance: Currently, it is considered without commercial importance in Guatemala, even though one of most planted variety (CP72-2086) usually shows high infection by this virus, without effects on production. Control: The use of resistant varieties is the recommended method (Vázquez de Ramallo, and Ramallo, 2004). It has been observed that some varieties have symptoms in the seedling stages but without development effect, thus, they are considered tolerant to the disease.
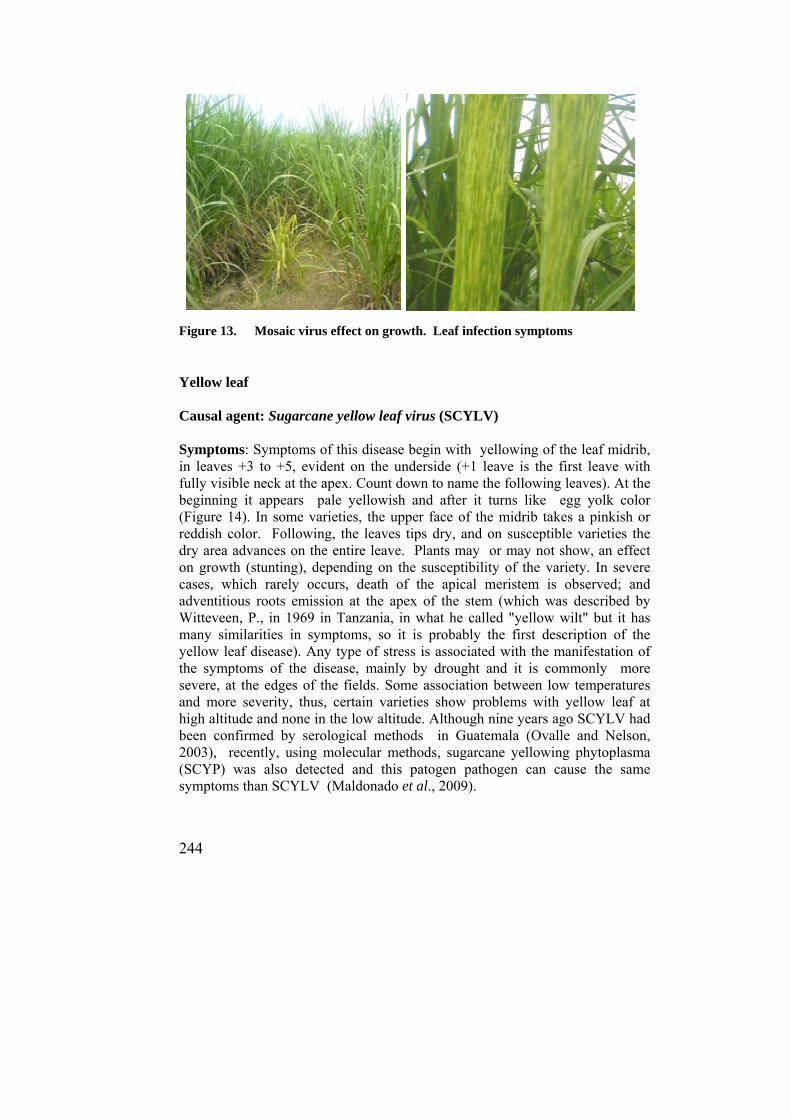
244
Figure 13. Mosaic virus effect on growth. Leaf infection symptoms Yellow leaf Causal agent: Sugarcane yellow leaf virus (SCYLV) Symptoms: Symptoms of this disease begin with yellowing of the leaf midrib, in leaves +3 to +5, evident on the underside (+1 leave is the first leave with fully visible neck at the apex. Count down to name the following leaves). At the beginning it appears pale yellowish and after it turns like egg yolk color (Figure 14). In some varieties, the upper face of the midrib takes a pinkish or reddish color. Following, the leaves tips dry, and on susceptible varieties the dry area advances on the entire leave. Plants may or may not show, an effect on growth (stunting), depending on the susceptibility of the variety. In severe cases, which rarely occurs, death of the apical meristem is observed; and adventitious roots emission at the apex of the stem (which was described by Witteveen, P., in 1969 in Tanzania, in what he called "yellow wilt" but it has many similarities in symptoms, so it is probably the first description of the yellow leaf disease). Any type of stress is associated with the manifestation of the symptoms of the disease, mainly by drought and it is commonly more severe, at the edges of the fields. Some association between low temperatures and more severity, thus, certain varieties show problems with yellow leaf at high altitude and none in the low altitude. Although nine years ago SCYLV had been confirmed by serological methods in Guatemala (Ovalle and Nelson, 2003), recently, using molecular methods, sugarcane yellowing phytoplasma (SCYP) was also detected and this patogen pathogen can cause the same symptoms than SCYLV (Maldonado et al., 2009).
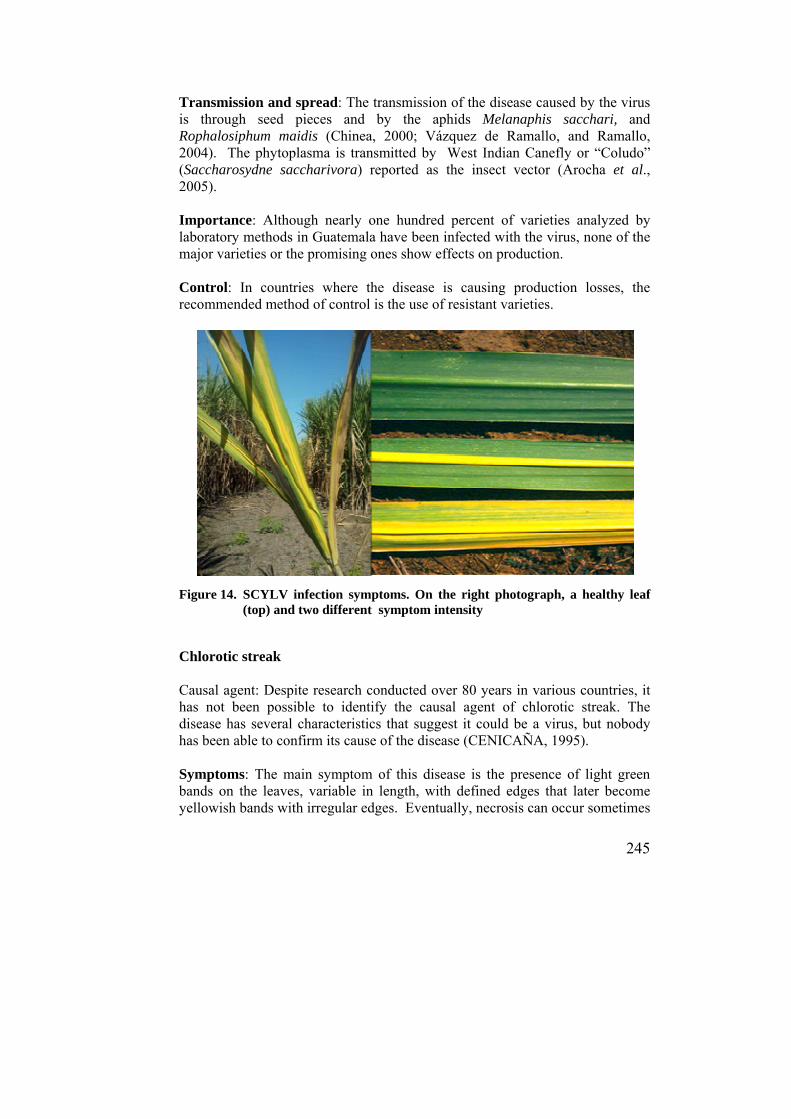
245
Transmission and spread: The transmission of the disease caused by the virus is through seed pieces and by the aphids Melanaphis sacchari, and Rophalosiphum maidis (Chinea, 2000; Vázquez de Ramallo, and Ramallo, 2004). The phytoplasma is transmitted by West Indian Canefly or “Coludo” (Saccharosydne saccharivora) reported as the insect vector (Arocha et al., 2005). Importance: Although nearly one hundred percent of varieties analyzed by laboratory methods in Guatemala have been infected with the virus, none of the major varieties or the promising ones show effects on production. Control: In countries where the disease is causing production losses, the recommended method of control is the use of resistant varieties.
Figure 14. SCYLV infection symptoms. On the right photograph, a healthy leaf (top) and two different symptom intensity
Chlorotic streak Causal agent: Despite research conducted over 80 years in various countries, it has not been possible to identify the causal agent of chlorotic streak. The disease has several characteristics that suggest it could be a virus, but nobody has been able to confirm its cause of the disease (CENICAÑA, 1995). Symptoms: The main symptom of this disease is the presence of light green bands on the leaves, variable in length, with defined edges that later become yellowish bands with irregular edges. Eventually, necrosis can occur sometimes
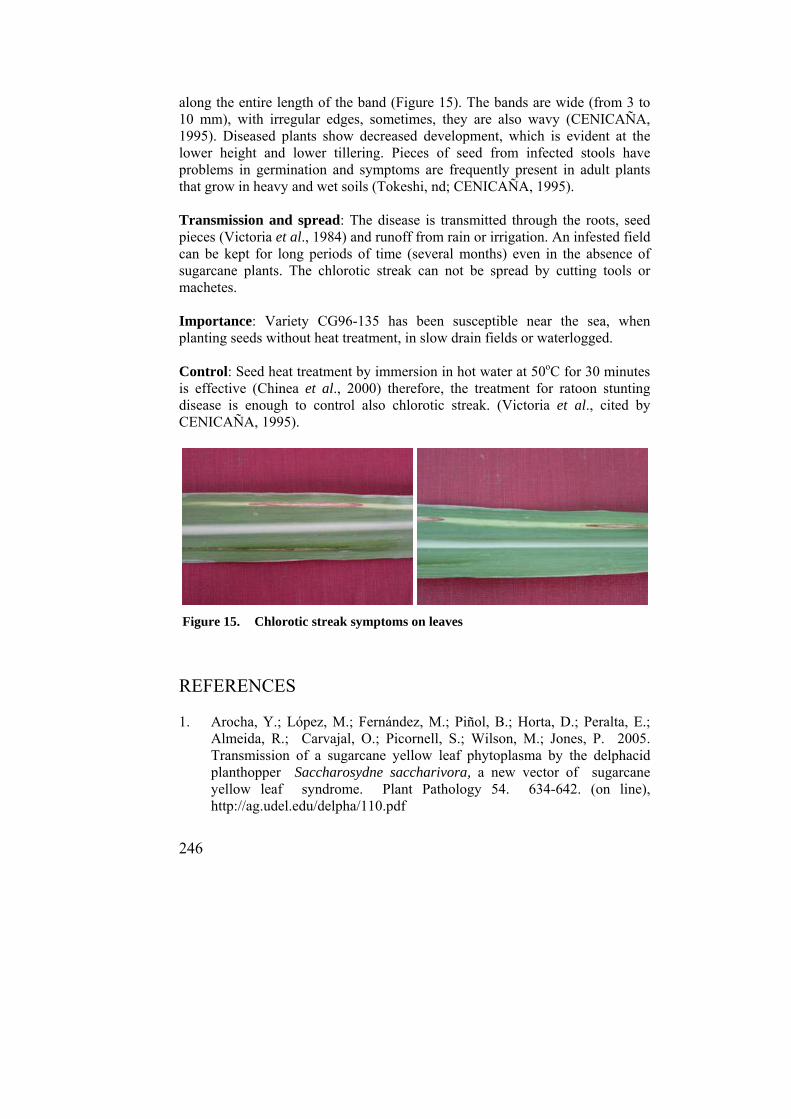
246
along the entire length of the band (Figure 15). The bands are wide (from 3 to 10 mm), with irregular edges, sometimes, they are also wavy (CENICAÑA, 1995). Diseased plants show decreased development, which is evident at the lower height and lower tillering. Pieces of seed from infected stools have problems in germination and symptoms are frequently present in adult plants that grow in heavy and wet soils (Tokeshi, nd; CENICAÑA, 1995). Transmission and spread: The disease is transmitted through the roots, seed pieces (Victoria et al., 1984) and runoff from rain or irrigation. An infested field can be kept for long periods of time (several months) even in the absence of sugarcane plants. The chlorotic streak can not be spread by cutting tools or machetes. Importance: Variety CG96-135 has been susceptible near the sea, when planting seeds without heat treatment, in slow drain fields or waterlogged. Control: Seed heat treatment by immersion in hot water at 50oC for 30 minutes is effective (Chinea et al., 2000) therefore, the treatment for ratoon stunting disease is enough to control also chlorotic streak. (Victoria et al., cited by CENICAÑA, 1995). Figure 15. Chlorotic streak symptoms on leaves
REFERENCES 1. Arocha, Y.; López, M.; Fernández, M.; Piñol, B.; Horta, D.; Peralta, E.;
Almeida, R.; Carvajal, O.; Picornell, S.; Wilson, M.; Jones, P. 2005. Transmission of a sugarcane yellow leaf phytoplasma by the delphacid planthopper Saccharosydne saccharivora, a new vector of sugarcane yellow leaf syndrome. Plant Pathology 54. 634-642. (on line), http://ag.udel.edu/delpha/110.pdf
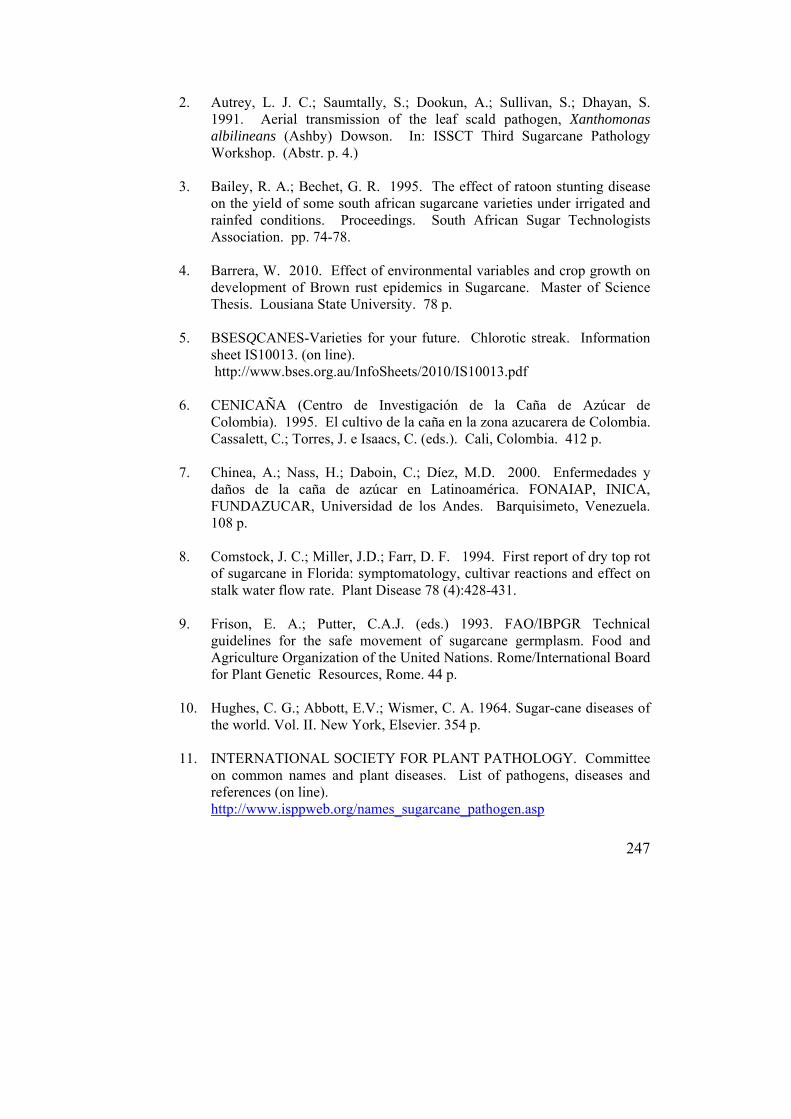
247
2. Autrey, L. J. C.; Saumtally, S.; Dookun, A.; Sullivan, S.; Dhayan, S. 1991. Aerial transmission of the leaf scald pathogen, Xanthomonas albilineans (Ashby) Dowson. In: ISSCT Third Sugarcane Pathology Workshop. (Abstr. p. 4.)
3. Bailey, R. A.; Bechet, G. R. 1995. The effect of ratoon stunting disease
on the yield of some south african sugarcane varieties under irrigated and rainfed conditions. Proceedings. South African Sugar Technologists Association. pp. 74-78.
4. Barrera, W. 2010. Effect of environmental variables and crop growth on
development of Brown rust epidemics in Sugarcane. Master of Science Thesis. Lousiana State University. 78 p.
5. BSESQCANES-Varieties for your future. Chlorotic streak. Information
sheet IS10013. (on line). http://www.bses.org.au/InfoSheets/2010/IS10013.pdf
6. CENICAÑA (Centro de Investigación de la Caña de Azúcar de
Colombia). 1995. El cultivo de la caña en la zona azucarera de Colombia. Cassalett, C.; Torres, J. e Isaacs, C. (eds.). Cali, Colombia. 412 p.
7. Chinea, A.; Nass, H.; Daboin, C.; Díez, M.D. 2000. Enfermedades y
daños de la caña de azúcar en Latinoamérica. FONAIAP, INICA, FUNDAZUCAR, Universidad de los Andes. Barquisimeto, Venezuela. 108 p.
8. Comstock, J. C.; Miller, J.D.; Farr, D. F. 1994. First report of dry top rot
of sugarcane in Florida: symptomatology, cultivar reactions and effect on stalk water flow rate. Plant Disease 78 (4):428-431.
9. Frison, E. A.; Putter, C.A.J. (eds.) 1993. FAO/IBPGR Technical
guidelines for the safe movement of sugarcane germplasm. Food and Agriculture Organization of the United Nations. Rome/International Board for Plant Genetic Resources, Rome. 44 p.
10. Hughes, C. G.; Abbott, E.V.; Wismer, C. A. 1964. Sugar-cane diseases of the world. Vol. II. New York, Elsevier. 354 p.
11. INTERNATIONAL SOCIETY FOR PLANT PATHOLOGY. Committee
on common names and plant diseases. List of pathogens, diseases and references (on line). http://www.isppweb.org/names_sugarcane_pathogen.asp

248
12. Maldonado, A. P.; Ovalle, W.; García, S. 2009. Metodología para la detección molecular de enfermedades en caña de azúcar. Centro Guatemalteco de Investigación y Capacitación de la Caña de Azúcar. CENGICAÑA. pp. 106-115. .
13. Martin J. P.; Abbott, E. V.; Hughes, C. G. 1961. Sugar-cane diseases of
the world. Vol. I. New York, Elsevier. 542 p. 14. Magarey, R. C.; Neilsen, W. A.; Magnani, A. J. 2004. Environmental
requirements for spore germination in three sugarcane leaf pathogens. Proc. Aust. Soc. Sugar Cane Technol. Vol. 26.
15. NORTH AMERICAN PLANT PROTECTION ORGANIZATION
(NAPPO). 2007. Detections of Orange Rust of Sugarcane, Puccinia kuehnii, in Palm Beach County, Florida – United States. (on line). http://www.pestalert.org/oprDetail.cfm?oprID=270
16. Ovalle Sáenz, W. R. 1997. Manual para identificación de enfermedades
de la caña de azúcar. Guatemala, CENGICAÑA. 83 p. 17. Ovalle, W.; López, E.; Oliva, E. 2001. Evaluación de cinco tratamientos
hidrotérmicos para el control de Raquitismo de las socas. In: Memoria. Presentación de resultados de investigación. Zafra 2000-2001. Guatemala, CENGICAÑA. pp. 63-65.
18. Ovalle, W.; Nelson, A. 2003. Detección de patógenos con pruebas
serológicas en caña de azúcar. In: Memoria. Presentación de resultados de investigación. Zafra 2002-2003. Guatemala, CENGICAÑA. pp. 67-69
19. Ovalle, W.; García, S. 2008. Efecto de la enfermedad del Raquitismo de
las socas (Leifsonia xyli subs. xyli) en el rendimiento de caña de nueve variedades en cinco cortes. 2004-2008. In: Memoria. Presentación de resultados de investigación. Zafra 2007-2008. Guatemala, CENGICAÑA. pp. 89-93.
20. Steindl, D.R.L. 1971. The elimination of leaf scald from infected planting material. Proc. Int. Soc. Cane Technol. 14:925-929.
21. Tokeshi, H. s.f. Doenças da cana-de-açúcar. Programa Nacional de
Melhoramento da cana-de-açúcar. Instituto do Açúcar e do Álcool. Piracicaba, São Paulo. 70 p.

249
22. Vázquez de Ramallo, N. E.; Ramallo, J. 2004. Enfermedades de la caña de azúcar en Argentina. Guía para su reconocimiento y manejo. Tucumán. Estación Experimental Agroindustrial “Obispo Colombres”. 55 p.
23. Victoria, J. I.; Ochoa, O.; Cassalett, C. 1984. Enfermedades de la Caña
de Azúcar en Colombia. Centro de Investigación de la Caña de Azúcar de Colombia. 27 p. Serie Técnica No. 2.
24. Victoria, J. L.; Guzmán, M. L.; Ochoa, B. 1985. Chemicals used to
disinfect tools in order to limit the spread of ratoon disease of sugarcane. Centro de Investigación de la Caña de azúcar de Colombia CENICAÑA. Documento Técnico No. 69. s.p.

250
251
XI. SUGARCANE RIPENING AND SUGARCANE FLOWERING AND
THEIR MANAGEMENT
252
SUGARCANE RIPENING
Gerardo Espinoza
INTRODUCTION Sugarcane cultivation shows during its development four stages: Initiation, tillering, elongation or great growing and ripening (Castro y Montúfar, 2004; Bezuidenhout, et al., 2003). The initiation stage ranges from the emergency until 45 days after planting. Tillering stage has an average duration of three months. On the other hand, elongation stage takes six months; this stage is the most important in terms of the sugarcane growth. Ripening is the last stage and its average length is 45 days. In the ripening stage the sugarcane plant decreases its growth rate and starts sucrose accumulation in the stalks. In general, the ripening process is gradual until reaching the maximum point, after which, the sucrose content in stalks starts to decline. According to Buenaventura (1986) the sucrose concentration in juices depends onseveral factors such as: the temperature variation along the entire day (15°C), the soil moisture or rainfall (30-100 mm/month) and luminosity from four to six weeks before harvest (11.5-12.5 light hours). This stage is very important since is directly related to the final product of: Sugar. In most sugarcane-producing countries, weather conditions drive the harvest season. In Guatemala, the best conditions for harvest are found from November to April. In many sugarcane-producing countries the use of artificial ripeners is common. This lies in: to deliver crop certain conditions to induce ripening; especially if needed conditions are not given naturally, such as proper soil moisture and temperature oscillation during the day (Deuber, 1998; Caputo et al., 2008; Alexander, 1973 y Legendre, 1975). In Guatemala, the sugarcane that is harvested in the very beginning of the harvest season, has low levels of sucrose since the ripening stage is just started and the stalks still retains high humidity quantities. The ripeners applications allow increase the sucrose accumulation in such initial harvest period. As it progresses the harvest period, higher sucrose accumulation values are reached, especially in February when the best sucrose accumulation is achieved due to the better weather conditions. In general terms, the ripeners application is part of a bigger harvest strategy, dedicated to increase the sugar production. The results indicate that the ripeners
Agr. Eng., M.Sc. Specialist in weeds and ripeners at CENGICAÑA. www.cengicana.org
253
application contribute to the maturing, and then improving the sucrose concentration (Villegas, 2003; Caputo et al., 2008 and Leite, 2005).
NATURAL RIPENING IN SUGARCANE The natural ripening in sugarcane starts when the stalks growth rate decreases, there is less moisture in soil and low temperatures are recorded (Almeida, et al., 2003). In Guatemala such conditions are not given at the very beginning of the harvest season, since the wet season is just ending. The sucrose content in sugarcane is the result of the balance between the total synthetized sucrose and the amount of hydrolyzed sucrose, mediated by acid and neutral invertases activity. The acid enzyme is soluble and has its main activity in the apoplast and in the the vacuole cellular level (Hatch et al., 1963). The main function of this enzyme is to hydrolyze and to transport the sucrose from the leaves to the stalks during the growing stage. The higher activity of this enzyme is during the growing period and decreases in the ripening stage, operates between pH values from 5.0 to 5.5. The neutral invertase is a soluble enzyme which works at pH 7 and is located in the cytoplasm of cells in mature tissues; consequently it is related with the sucrose accumulation into the stalks. Its higher activity is noted in the ripening stage (Hatch et al., 1963; Batta y Singh, 1986). The more advanced the ripening in the sugarcane stem, the more sucrose accumulation is reached, meanwhile the reducing sugar (glucose and fructose) decrease into the internodes (Azevedo, 1981). In the productive process, , the juice quality is defined according to the high sugar content (sucrose) and at the same time, for low reducing sugar content (Chen, 1991). Fernandes (1985); Salgado (1995), and De Stefano (1985) indicate that at the beginning of sugarcane ripening and during this process, the minimum values of the technical parameters must be, between 80 to 85 percent for juice purity; 14.4 to 15.3 for Pol% and the reducing sugars concentration must be less than one percent.
USE OF RIPENERS FOR SUGARCANE MANAGEMENT In Guatemala, before the use of the ripeners, the sugar yield was 72 Kg of sugar per cane ton (Buenaventura, et al., 1992, Buenaventura, 2000). It is important to take in account that at the time, different sugarcane cultivars were grown, the harvest season period was different (December to March). The harvest,
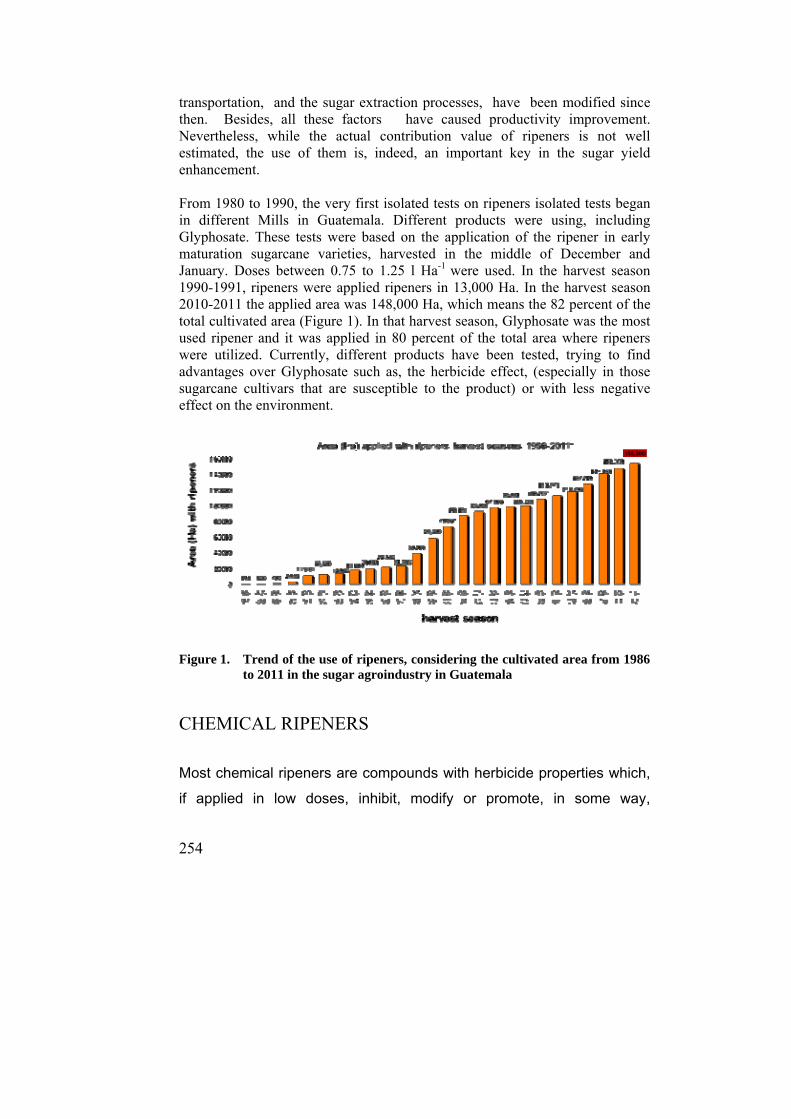
254
transportation, and the sugar extraction processes, have been modified since then. Besides, all these factors have caused productivity improvement. Nevertheless, while the actual contribution value of ripeners is not well estimated, the use of them is, indeed, an important key in the sugar yield enhancement. From 1980 to 1990, the very first isolated tests on ripeners isolated tests began in different Mills in Guatemala. Different products were using, including Glyphosate. These tests were based on the application of the ripener in early maturation sugarcane varieties, harvested in the middle of December and January. Doses between 0.75 to 1.25 l Ha-1 were used. In the harvest season 1990-1991, ripeners were applied ripeners in 13,000 Ha. In the harvest season 2010-2011 the applied area was 148,000 Ha, which means the 82 percent of the total cultivated area (Figure 1). In that harvest season, Glyphosate was the most used ripener and it was applied in 80 percent of the total area where ripeners were utilized. Currently, different products have been tested, trying to find advantages over Glyphosate such as, the herbicide effect, (especially in those sugarcane cultivars that are susceptible to the product) or with less negative effect on the environment.
Figure 1. Trend of the use of ripeners, considering the cultivated area from 1986
to 2011 in the sugar agroindustry in Guatemala
CHEMICAL RIPENERS Most chemical ripeners are compounds with herbicide properties which, if applied in low doses, inhibit, modify or promote, in some way,
255
physiological processes in the sugarcane plant (Lavanholi et al., 2002 y Almeida et al., 2003). Ripener applications have as an objective, to modify or alter the morphological and physiological conditions in the sugarcane plant. These modifications could be qualitative or quantitative, for instance: early ripening, inhibition or delaying of the vegetative development, promotion of the sugar increase into the stalks, especially in the internodes near to the plant apex. Also, ripeners allow for cutting larger stalks, diminish trash, induce early foliage drying, and they also improve harvest efficiency, and therefore, raw
material (Villegas, 2003; Lavanholi et al., 2002 y Almeida et al., 2003). Chemical ripeners modify plant development at enzymes level, which catalyze the sucrose accumulation; this promotes the higher sugar concentration into the stalks. In general, ripening is a physiological process that comes from the photosynthesis (sugar producing process) and respiration (process that releases energy through concumption of sugar). The ripeners can practically stop the vegetative development through the translocation and sugars storage, mainly sucrose, and lately, it can promote qualitative and quantitative modifications in the final production (Castro, 1999). The most utilized ripeners in Guatemala are non-selective herbicides, which contains Glyphosate molecule as an active ingredient. Also some selective herbicides applied to control grasses, have been evaluated. CENGICAÑA jointly with Guatemala’s Sugar Mills, have tested several options, , among these non-herbicide ripeners; such as those based on nutrients like Potassium and Boron; among other growth regulators (plant-hormones-like compounds) have been evaluated. At this time it is being investigated options that include blends of herbicides with fertilizer elements such as Boron (B) and Potassium (K) (Espinoza y Corado, 2011). The ripeners based in elements such as Boron, Potassium, and Phosphorous, are new options due to the physiological functions of each nutrient, which have an additive effect on the final sucrose accumulation. In the case of Boron, its function is to accelerate the transportation of the sucrose through the phloem from the leaves to stalks; through the sucrose-borate complex. Other functions of Boron are: Synthesis of the cell wall, lignification of the cell wall, part of the structure of the wall cell; also Boron participates in the carbohydrates metabolism, RNA metabolism and Indol Acetic Acid (IAA) metabolism. Also, Boron is part of the respiration process, phenolic
256
metabolism, ascorbate metabolism and is an integral part of the plasma membrane. Among those functions, two are well defined in the plant´s physiological process: synthesis of the cell wall and integral part of the plasma membrane (Cakmak & Römheld, 1997). For Potassium, the main function is to act as a catalyzer in plant metabolism and is found mainly where energy transference occurs (Taiz and Zeiger, 2006). Potassium participates in the formation and neutralization of organic acids. Besides it plays an important role in the sugars accumulation and their use into the plant through the vegetative growth (Lazcano-Ferrat, 2000 e IPNI, 2007). The role of potassium in the sugars transport is essential, since the deficiency of this element restricts sugar movement from leaves (Supply organ: source) to storage places (sinks), i.e. the stalks. In sugarcane sugar movement, from leaves to stalks, happens in a speed of 2.5 cm per minute. The lack of Phosphorous has not showed a significant effect in sugar transportation. On the other hand, Nitrogen has showed a moderate effect, while the lack of Potassium can reduce sugar transportation down to half of its original potential (Lazcano-Ferrat, 2000; IPNI, 2007). In the present, in Guatemala, as well as in other countries (USA, Brazil, Colombia, Peru, Ecuador, Australia), a higher trend in the use of ripeners based on fertilizers is bigger, using products such as: (Potassium nitrate, Potassium nitrate + Boron, Potassium carbonate, carboxylic radical compounds) and plant-hormone-like compounds such as Trinexapac Ethyl, Ethephon. Also some mixtures are being used such as, herbicides plus fertilizers (K, P, Si, B) or herbicides plus plant-hormone-like compounds (CENICAÑA, 2011; Legendre, 1975; Almeida, 2003; Leite, et al., 2008; Leite y Crusciol, 2008; Leite, et al., 2010; Crusciol, et al., 2010, Leite, 2010; Toro y Jara, 2011). Chemicals utilized as ripeners and their mechanisms of action. The chemical ripeners are divided in two groups: growth delayers and growth inhibitors. Among the growth delayers Ethephon and Trinexapac Ethyl can be found. These are growth regulators (plant-hormone-like compounds) applied in sugarcane producer countries. Amongst growth inhibitors Glyphosate, Fluazifop-buthyl and Cletodim can be found, the latest two are used in a lower rate in Guatemala. Next, some chemical characteristics and structural differences are depicted for several riperners used in Guatemala, as well as their mechanism and mode of action.
257
Glyphosate: Glyphosate is the active molecule in several herbicide brands. There are structural differences in the Glyphosate molecule based in the acid form. The molecule can contain an isopropylamine salt (IPA) displacing the OH; such is the case of “Round up”(Hartzler, 2000). The molecule Glyphosate N (phosphonomethyl) glycine is the active ingredient of “Round up”; it is related toglycine, the simplest essential aminoacid. Another case is when the salt of the molecule is replaced by the sulfonate, which contains trimethylsulfonium salt (TMS), this is the “Touchdown” case; therefore both have different molecular weight (Hartzler, 2000). Glyphosate penetrates foliage, it is transported by phloem jointly with photosynthesis products and is accumulated in meristems tip (Yamada y Castro, 2007). The most accepted hypothesis about the Glyphosate action mechanism as herbicide, states the inhibition of the enzymes chorismate mutase and the prephenic dehydrogenase, which participate in the synthesis of chorismate acid, which is, in turn, a precursor of aminoacids that are synthetized only in plants: tryptophan, tyrosine and phenylalanine (Jaworski, 1972; Zablotowicz and Reddy, 2004). On the other hand, it seems that Glyphosate reduces the acid invertase levels in treated plants, which, in turn, reduce glucose and fructose breakdown (Hatch et al., 1963). Fluazifop-butyl and Clethodim: Fluazifop-butyl is a graminicide based in 2-(4-(trifluoromethyl-2 -iloiloxipiridine)-phenoxi)-N-butyl propionate. This ripener inhibits the growth by restricting the dry parenchyma volume and promotes the sucrose accumulation in 30 days, approximately (Crusciol et al., 2010). The action mode of this herbicide is the same to Clethodim. These products are capable to inhibit lipids biosynthesis specific for grasses. These compounds act in the enzyme levels by inhibiting the carboxyltransferase action, which belongs to the enzymatic complex of the Acetyl-CoACarboxylase, which, in turn, stops the triglycerides formation, which are part of the cell membranes (Crusciol et al., 2010). Fluazifop-butyl or Clethodim is accumulated in growth zones, damaging the meristematic tissues in the stalk’s nodes and buds; this stops the growth in a lapse of 48 hours. Young tissues and meristems are the most sensible organs (Crusciol et al., 2010). These products are being applied in areas where neighbor Glyphosate-sensitive-crops are found. The dose is the same as the used for a ripener

258
product, especially when a short period between application and harvest, is required. In Guatemala, when the previously mentioned products are used, the harvest is planned between 30 to 40 days after the application, mostly because higher periods can damage the sugarcane plants. This is mainly due to that the chemical destroys the growth points, therefore the apical dominance is lost and the lateral buds sprouting start, this process inducts the glucose and fructose breakdown. Besides, a progressive necrosis occurs in the growth rings in the apical region (Crusciol et al., 2010). USE OF RIPENERS IN SUGARCANE General effect of ripeners application The final result of the ripener applications is sucrose concentration increase in juice, if it is develop within the proper period, which should be established for each ripener. Figure 2 shows the ripening curve for Glyphosate in the cultivar CP88-1508. In this figure the higher sucrose accumulation period can be observed, which is the ideal harvest interval.
Figure 2. Ripening curve in the CP88-1508 cultivar with Glyphosate application
as ripener vs. no application control. (Espinoza et al., 2011b) DAA= Days after application
Other effects driven by ripeners Early foliage drying: The visual effect of drying after the application of herbicides based ripeners, are observed within 15 days after such application
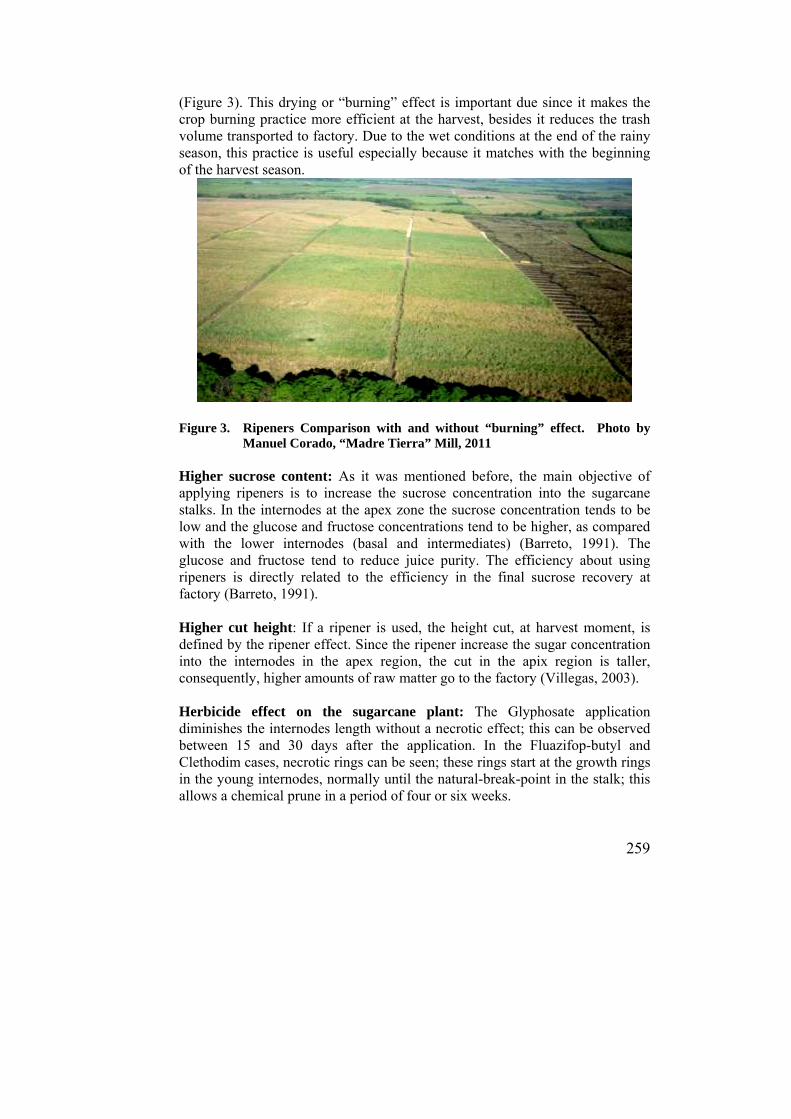
259
(Figure 3). This drying or “burning” effect is important due since it makes the crop burning practice more efficient at the harvest, besides it reduces the trash volume transported to factory. Due to the wet conditions at the end of the rainy season, this practice is useful especially because it matches with the beginning of the harvest season.
Figure 3. Ripeners Comparison with and without “burning” effect. Photo by
Manuel Corado, “Madre Tierra” Mill, 2011 Higher sucrose content: As it was mentioned before, the main objective of applying ripeners is to increase the sucrose concentration into the sugarcane stalks. In the internodes at the apex zone the sucrose concentration tends to be low and the glucose and fructose concentrations tend to be higher, as compared with the lower internodes (basal and intermediates) (Barreto, 1991). The glucose and fructose tend to reduce juice purity. The efficiency about using ripeners is directly related to the efficiency in the final sucrose recovery at factory (Barreto, 1991). Higher cut height: If a ripener is used, the height cut, at harvest moment, is defined by the ripener effect. Since the ripener increase the sugar concentration into the internodes in the apex region, the cut in the apix region is taller, consequently, higher amounts of raw matter go to the factory (Villegas, 2003). Herbicide effect on the sugarcane plant: The Glyphosate application diminishes the internodes length without a necrotic effect; this can be observed between 15 and 30 days after the application. In the Fluazifop-butyl and Clethodim cases, necrotic rings can be seen; these rings start at the growth rings in the young internodes, normally until the natural-break-point in the stalk; this allows a chemical prune in a period of four or six weeks.
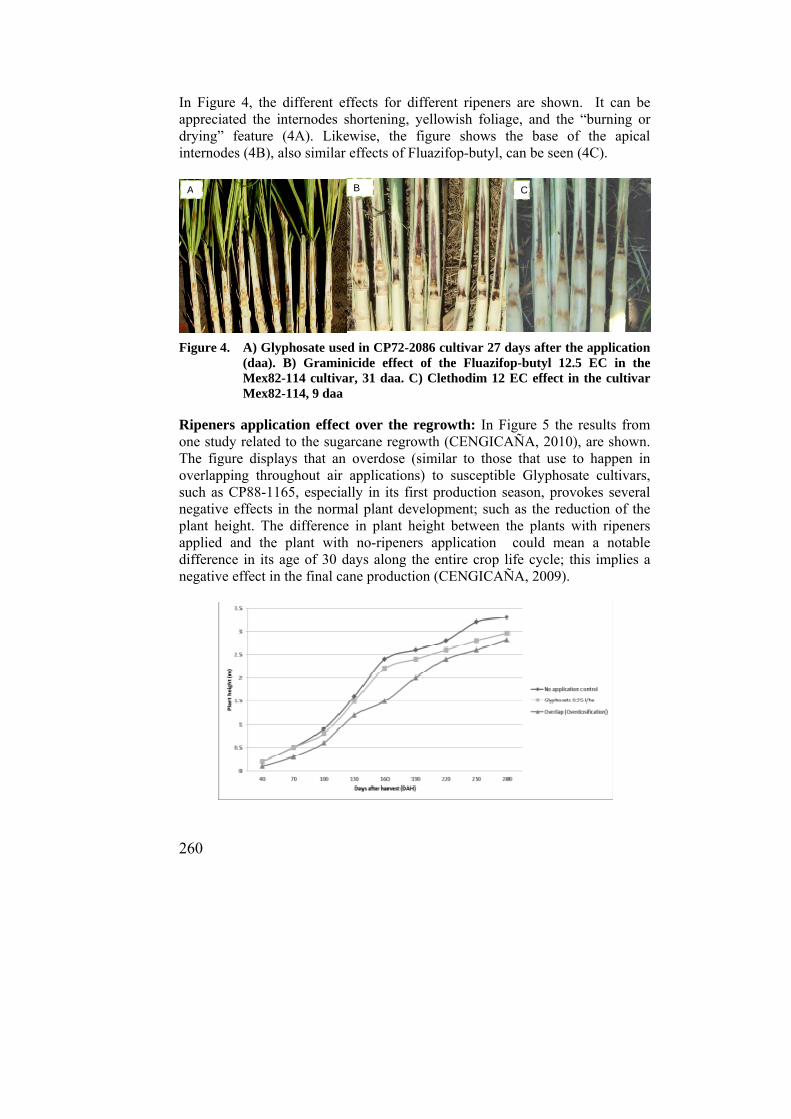
260
In Figure 4, the different effects for different ripeners are shown. It can be appreciated the internodes shortening, yellowish foliage, and the “burning or drying” feature (4A). Likewise, the figure shows the base of the apical internodes (4B), also similar effects of Fluazifop-butyl, can be seen (4C).
Figure 4. A) Glyphosate used in CP72-2086 cultivar 27 days after the application (daa). B) Graminicide effect of the Fluazifop-butyl 12.5 EC in the Mex82-114 cultivar, 31 daa. C) Clethodim 12 EC effect in the cultivar Mex82-114, 9 daa
Ripeners application effect over the regrowth: In Figure 5 the results from one study related to the sugarcane regrowth (CENGICAÑA, 2010), are shown. The figure displays that an overdose (similar to those that use to happen in overlapping throughout air applications) to susceptible Glyphosate cultivars, such as CP88-1165, especially in its first production season, provokes several negative effects in the normal plant development; such as the reduction of the plant height. The difference in plant height between the plants with ripeners applied and the plant with no-ripeners application could mean a notable difference in its age of 30 days along the entire crop life cycle; this implies a negative effect in the final cane production (CENGICAÑA, 2009).
A B C
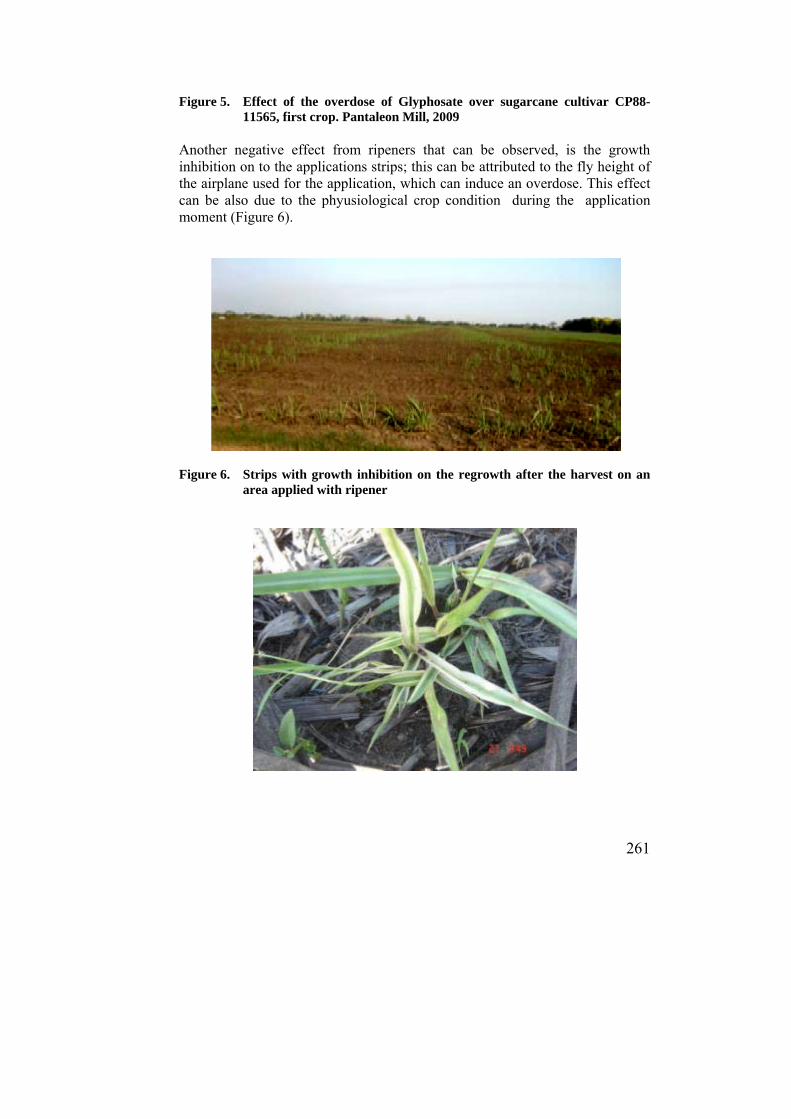
261
Figure 5. Effect of the overdose of Glyphosate over sugarcane cultivar CP88-11565, first crop. Pantaleon Mill, 2009
Another negative effect from ripeners that can be observed, is the growth inhibition on to the applications strips; this can be attributed to the fly height of the airplane used for the application, which can induce an overdose. This effect can be also due to the phyusiological crop condition during the application moment (Figure 6).
Figure 6. Strips with growth inhibition on the regrowth after the harvest on an
area applied with ripener
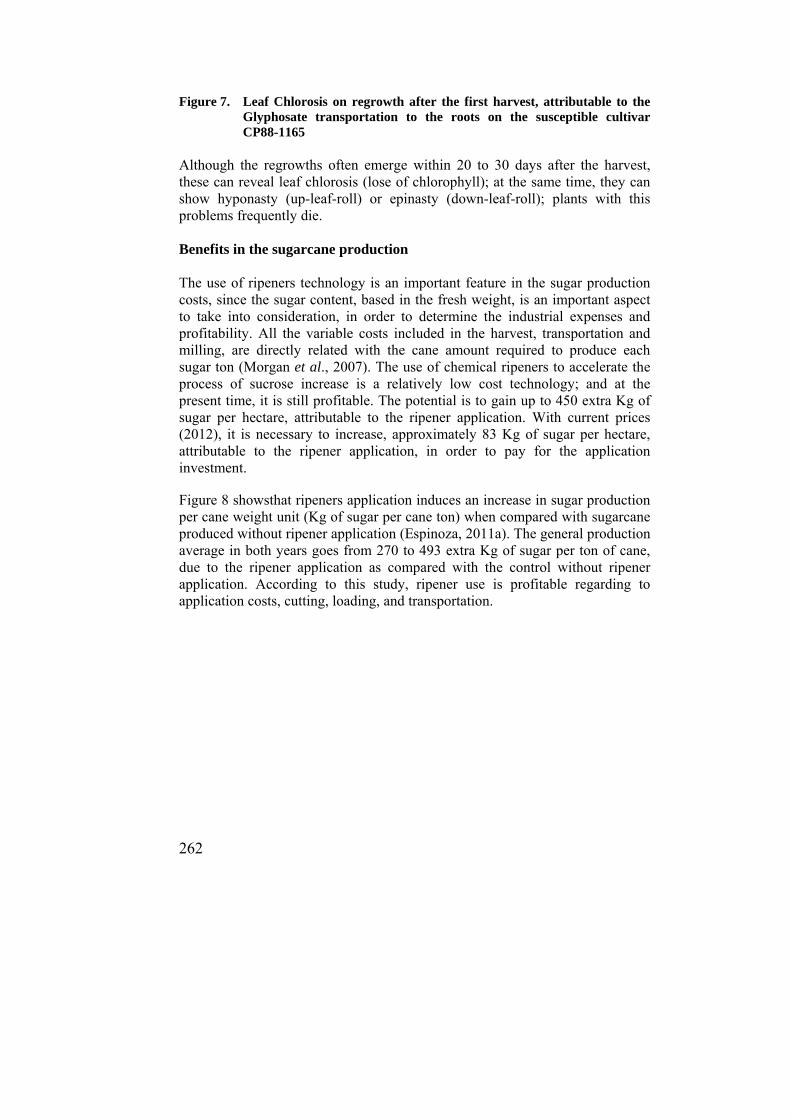
262
Figure 7. Leaf Chlorosis on regrowth after the first harvest, attributable to the Glyphosate transportation to the roots on the susceptible cultivar CP88-1165
Although the regrowths often emerge within 20 to 30 days after the harvest, these can reveal leaf chlorosis (lose of chlorophyll); at the same time, they can show hyponasty (up-leaf-roll) or epinasty (down-leaf-roll); plants with this problems frequently die. Benefits in the sugarcane production The use of ripeners technology is an important feature in the sugar production costs, since the sugar content, based in the fresh weight, is an important aspect to take into consideration, in order to determine the industrial expenses and profitability. All the variable costs included in the harvest, transportation and milling, are directly related with the cane amount required to produce each sugar ton (Morgan et al., 2007). The use of chemical ripeners to accelerate the process of sucrose increase is a relatively low cost technology; and at the present time, it is still profitable. The potential is to gain up to 450 extra Kg of sugar per hectare, attributable to the ripener application. With current prices (2012), it is necessary to increase, approximately 83 Kg of sugar per hectare, attributable to the ripener application, in order to pay for the application investment. Figure 8 showsthat ripeners application induces an increase in sugar production per cane weight unit (Kg of sugar per cane ton) when compared with sugarcane produced without ripener application (Espinoza, 2011a). The general production average in both years goes from 270 to 493 extra Kg of sugar per ton of cane, due to the ripener application as compared with the control without ripener application. According to this study, ripener use is profitable regarding to application costs, cutting, loading, and transportation.
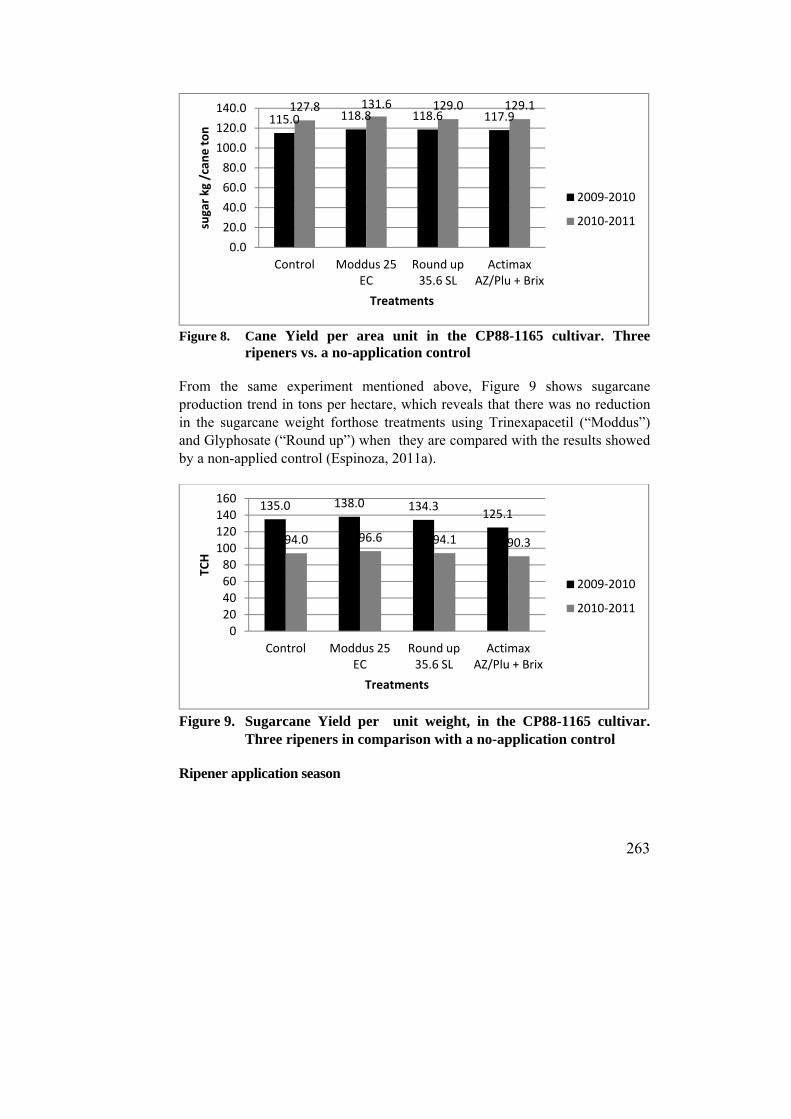
263
Figure 8. Cane Yield per area unit in the CP88-1165 cultivar. Three
ripeners vs. a no-application control From the same experiment mentioned above, Figure 9 shows sugarcane production trend in tons per hectare, which reveals that there was no reduction in the sugarcane weight forthose treatments using Trinexapacetil (“Moddus”) and Glyphosate (“Round up”) when they are compared with the results showed by a non-applied control (Espinoza, 2011a).
Figure 9. Sugarcane Yield per unit weight, in the CP88-1165 cultivar.
Three ripeners in comparison with a no-application control Ripener application season
115.0 118.8 118.6 117.9127.8 131.6 129.0 129.1
0.0
20.0
40.0
60.0
80.0
100.0
120.0
140.0
Control Moddus 25 EC
Round up 35.6 SL
Actimax AZ/Plu + Brix
sugar kg /cane ton
Treatments
2009‐2010
2010‐2011
135.0 138.0 134.3 125.1
94.0 96.6 94.1 90.3
020406080100120140160
Control Moddus 25 EC
Round up 35.6 SL
Actimax AZ/Plu + Brix
TCH
Treatments
2009‐2010
2010‐2011
264
In Guatemala, the harvest is divided into three periods (thirds): First one is from November to middle of January; the second one from January to February, and the third one from March to April. The ripener applications for the first-third start between September and October. For the second-third, the applications are done between November and December, and for the last third, the applications are made between January and February. The period between Glyphosate application and the harvest, is within 45 to 65 days, according to the harvest third. As the harvest take place, it is needed to diminish such period and also is necessary to diminish the doses, due that the natural ripening conditions are occurring progressively. It is important to have an adequate coordination betweenthe ripener application and the harvest in charge, in order to have a continuous cutting in the appropriate moment for each applied area. Selected Areas for ripener application For the selection of the ripener application areas, it is required to have a good knowledge of the conditions in these areas. The conditions for the selected areas with sugarcane, which is not for renewal use, are more extensive, in comparison with the areas that will be renewed. Among the conditions required forripener application are the following: Sugarcane cultivars with good response to the ripener. Sugarcane cultivars with high yield potential (up to 100 TCH) Plantationswithout stress for humidity, plagues, and diseases. Topography that allows for flying safety. Areas without neighboring crops sensitive to the produc (ripeners). Uniform plantations regarding to the plant height feature. Big areas; for better efficiency in the application. Areas with non-flattened sugarcane. Issues to take into consideration to the ripeners application Productivity: In Guatemala, the ripener use is planned according to the estimated productivity, type of soil, dose in each application, and the selected areas, according to the conditions mentioned above. With respect to productivity, production estimation is done in tons of sugarcane per hectare, before the application (the estimation period ranges from 50 days before the application to 1 day before). The estimation is done taking in to account stalk population, plant height and stalk diameter in five samples for every 20 hectares, besides the production history in the area is considered. Sometimes the weight of thesample is also recorded.
265
Soils: In sandy soils, the employed doses are usuallylower than the average, which is 1.4 l Ha-1. Clay soils foster natural ripening and for that reason, lower doses are utilized instead of the normal doses used at thebeginning of the harvest. The soils dedicated to the sugarcane crop in Guatemala, have variable characteristics. Mollisol, Andisol, Inceptisol and Vertisol can be found (Pérez, 2008). The Vertisol soils enable natural ripening in some sugarcane cultivars. This soil is found mainly in the area of influence of the Tululá Mill south-westof the production area in Guatemala, thus in these areas, use of ripeners is lower, especially in the third-third of the harvest season. Soil Moisture: In some sugar mills, it is suggested to limite the irrigation in field from 30 to 45 days before harvest, with the objective to facilitate sugarcane planting and transportation of sugar toward the stalks. When this recommendation is not followed, “a signal” may be received by the plant, to use sugar in order to continue with its growth: and, therefore, to decrease sugar yield in the stalks. Regarding this, higher ripener doses can be useful when high humidity conditions are present in the soil (Villegas, 2003). Commercially, the Glyphosate doses used in Guatemala can vary according to the harvest month and sugarcane cultivar. For example, in the harvest´s beginning, doses can vary between 0.8 to 1.5 l Ha-1. Also, the dose can vary regarding to the expected yield. When the ripener is applied in an area to be renewed, the ripener dose can vary within 1.25 and 1.75 l Ha-1. The average of Glyphosate applications fluctuate between 1 and 1.4 l Ha-1. For the graminicides case, the dose fluctuates between 0.5 to 0.8 l Ha-1. To get the expected results, using ripeners, the next must be taken into account: the agro-ecological traits in the production area, the kind of ripener to use, doses, and the harvest season. This last feature is important because in Guatemala the ripeners use, starts with high doses, and as the harvest progresses the ripener doses are lower than the beginning. This is in partly, due to a gradual reduction in moisture excess , which allows a better natural ripening. The sugarcane variety and number of cutting (planting or ratoon): These two features are important to define the dose. Among the used sugarcane cultivars and most susceptible to the ripeners are CP88-1165 and CP72-1312. Both varieties suffer important damages, especially in the /planting (first cut). These damages can be observed from doses of 0.8 l Ha-1, which is a low dose. It is important to point that the CP72-1312 cultivar is not grown in large areas. In ratooning, these cultivars do not present important damages, maybe, due to their higher biomass amount.

266
The varieties CP72-2086 and CP73-1547, among others, do not present negative responses to the Glyphosate treatment in the /planting in doses between 1.0 and 1.2 liters per hectare for a production of 100 and 120 of cane tons per hectare, respectively.
AIR APPLICATION GENERALITIES Aircrafts In Guatemala, the ripeners are applied by using airplanes or helicopters, the latter are the most frequently used, since they allow air application in areas with irregular topography. The airplanes are used mainly in large and uniform areas (more than 100 Ha), where they are more efficient. Equipment (Global Positioning System) receptors are used during air application, in order to get an accurate location where to apply the product; this avoids unwanted application in not targeted crops. Also a flow-meter is utilized (Flow-control), the main function of this device is to fix the download of the ripener calibrated volume, which automatically compensates the download when the airship’s speed varies. Another device is the Thermo-anemometer, used to measure the weather conditions through course of application, of such as wind speed, temperature, and relative humidity. All this information serves to change ripener application volume, and thus, avoid environmental damage. Occasionally, all these weather records are used to explain variations in the final applied ripener effect. To measure ripeners application quality, a special “Scanner” is used, jointly with the DepositScan (USDA) software, determine variables such as: Number of Droplets per square centimeter, size of the droplet (µm), and application volume. With all this information a Variation Coefficient (CV %) can be calculated related to the covered area (Figure 10). These parameters have the objective to determine the application quality. Some sugarcane mills still use the “magnifying glass” system for counting the droplets in a square centimeter, however, with this method, it is not possible to determine the droplet size, and this is a very important variable, as it will be seen forward.

267
Figure 10. Equipment used to determine application quality variables. a) Water-
sensitive Card. b) Scanner to establish quality application parameters. Other important equipment used are the application nozzles. In Guatemalan sugar agroindustry, the next nozzles are utilized: DG80-02, DG80-03, DG80-04 DG80-06, and CP11TT, for various airships. These nozzles have the attribute of diminish the drift of the applied product and manage the drop sizes, thus to reduce the drop sizes to less than150 µm, so to avoid drifting. Rules and control for air applications During the application planning, the personnel in charge must coordinate all work with the people responsible for the crop area to be applied. The personnel verify that there are no complications such as: neighboring crops susceptible to the ripener, electrical wires, trees, etc. When an obstacle is found, a strip from 300 to 500 meters must be left. In order to assure a good application, airships are gaged with anticipation, with the objective to fulfill rules and standars in a good application. The following aspects must be taken into account: a. Application strip width. For helicopters this is in between of 16 to 20 m
and for aircraft between 15 to 22 m.
b. Size uniformity, distribution and number of drops per square centimeter. For some sugarcane mills in Guatemala, the ideal number of drops per cm2, for Glyphosate as ripener, fluctuates on 15 to 30 drops/cm2. According to the type of airship, the Variation Coefficient must be less than 30%.
ba
268
c. Variation rate in the application flow volume. The water volume in the application is in the middle of 18 to 30 liters of water per hectare. The water volume defines the amount of droplets that finally reach the sugarcane canopy. To measure the droplets amount and the application quality, the monitoring equipment is employed, which is mainly composed of water-sensitive cards, which are placed, at least, in the equivalent width of three passes of the airship. This measure is merely a reference of the application quality.
d. On the other hand, to achieve a good application, certain weather conditions
should be present such as: a temperature lower than 30° C; relative humidity over 60%; and wind speed below10 km hr-1. Application with inversion must be avoided, since this condition is propitious to drift. The inversion occurs mainly from December to February. This event arises when in clear nights, soil cools quickly. The soil, in turn, cools nearest air; due this, the air becomes more dense and heavier as compared with the air in superior layers. If this event coincides with wind absence, then no thermal convection happens, also the speed of vertical mixture between two air layers diminishes, and therefore drift occurs to neighbor areas which are not targeted crops.
POST-RIPENER APPLICATION MONITORING AND HARVEST Usually, after ripener application, pre-harvest samplings are made, in order to know the ripener effect in the sugar accumulation into the stalks. This monitoring allows planning the harvest in its maximum sucrose accumulation point. Pre-harvest samplings are developed in five different points in a 20 hectare area. . In each station (sampling point) five milling potential stalks are collected in at least one linear metre or, it can be collected instead, a complete tiller. Each stalk is cut in setts of 40 to 50 cm length. In lab, the juices are analyzed to determine Brix (%), Pol%cane and the reducing sugars content. Also juice purity(%) is determined; and finally the commercial and potential yield is calculated (kg of sugar per cane ton).
REFERENCES 1. Alexander, A. 1973. Sugarcane physiology a comprehensive study of the
Saccharum source-to-sink system. Amsterdam, Holanda. 752 p.
269
2. Almeida, J. C. V.; Sanomya, R.; Leite, C.F. y Cassinelli, N.F. 2003.
Eficiência agronómica de sulfometuron-methyl como maturador na cultura da cana-de-açúcar. Revista STAB, v.21, pp. 36-37.
3. Azevedo, H. J. 1981. Fisiologia da cana-de-açúcar. Araras: Programa
Nacional de Melhoramento da Cana-de-açúca.108 p. 4. Balbín, A. M. I.; Ortega, D. E.; Valdez V. R. 1996. Cambios fisiológicos de
la caña de azúcar ante el déficit hídrico. Universidad Autónoma de Chapingo. México. 135 p.
5. Barreto, L. 1991. Efecto de varios porcentajes y tipos de “trash” en rendimiento de azúcar. International Sugar Journal, V.93. pp. 191-194.
6. Batta, S. H.; Singh, R. 1986. Sucrose metabolism in sugarcane grown under
varying climatic conditions: synthesis and storage of sucrose in relation to the activities of sucrose syntethase, sucrose-phosphate syntethase and invertase. Phytochemistry 25: 2,431-2,431.
7. Bezuidenhout, N.; O'Learya, J.; Singelsa, G.; Bajicb, V. 2003. A process-
based model to simulate changes in tiller density and light interception of sugarcane crops. Agricultural Systems. Volume 76, Issue 2, pp. 589-599.
8. Buenaventura, C.; Gómez, R.; Paz, V., Salazar, E.; Méndez, S.; Cucalón, E. 1992. Evaluación del efecto del Glifosato como madurador en cinco variedades de caña de azúcar de maduración tardía. CENGICAÑA. Documento Técnico No. 2.
9. Buenaventura, C. 2000. Evaluación de la sal monoamónica de Glifosato como madurador de la caña de azúcar, variedad Ragnar, en diferentes sitios y épocas de aplicación. Carta Informativa. Ecuador, Centro de Investigación de la Caña de Azúcar del Ecuador.2 (4): 1-7.
10. Buenaventura, C. E. 1986. Control de la maduración de la caña de azúcar En:
El Cultivo de la Caña de Azúcar. Tecnicaña. Cali, Colombia. pp. 299-307. 11. Cakmak, I.; Römheld, V. 1997. Boron deficiency-induced impairments of
celular functions in plants. In: DELL, B.; ROWN, P.H.; BELL, R.W. (eds.). Boron in soil and plants: review. Symposium, Chiang Mai, reprinted Plant and Soil, v.193, n.1-2, pp.71-83.
12. Castro, O.; Montúfar, J. 2004. Respuesta de la caña de azúcar al riego
precorte caso de la finca Churubusco. In: Memoria. Presentación de
270
resultados de investigación. Zafra 2003-2004. Guatemala, CENGICAÑA. pp. 192-198.
13. Castro, P. R. C. 1999. Maturadores químicos em cana-de açúcar.
Saccharum, v. 1, p. 12-16. 14. Caputo, M. M.; Ferreira E.G.; Almeida, M.; Stefano, S. M.2008. Resposta
de genótipos de cana-de-açúcar à aplicação de indutores de maturação. Bragantia: Revista de Ciências agronómicas, año/vol. 67, número 001 Instituto Agronômico de Campinas. pp. 15-23.
15. Chen, J. C. P. 1991.Manual de Azúcar de Caña. Editorial. Limusa. México.
1200 p. 16. CENICAÑA. 2011. Evaluación de productos maduradores. Cali. Informe
Anual 2010. pp. 91-93 17. CENGICAÑA. 2010. Madurantes. En: XV Simposio Análisis de la Zafra.
2009-2010 CD-R.
18. Crusciol, C. A. C.; Leite, G. H. P.; Almeida, M.; Ferraz , G. 2010. Uso de maturadores com ou sem misturas. Tópicos em eco fisiologia da cana-da-asucar. Botucatu. 111 p.
19. De Stefano R. P. 1985. False pol in sugarcane juice-causes and detection. Journal American. Society. SugarCane Technology. 4: 80-85.
20. Deuber, R. 1998. Maturação da cana-de-açúcar na região sudeste do brasil.
in: seminário de tecnologia agronômica, 4. Piracicaba. anais. Piracicaba: Copersucar. pp. 33-40.
21. Espinoza, J. G.; Corado, M. 2011. Evaluación de madurantes no herbicidas
en caña de azúcar, Finca Santa Isabel. Ingenio Madre Tierra. Presentación de resultados Power Point. Comité de Malezas y Madurantes CENGICAÑA.
22. Espinoza, J. G.; Corado, M.; Martínez, M.; Echeverría, C.; Pineda, J. C.
2011a. Efecto de madurantes no herbicidas en el cultivo de la caña de azúcar (Saccharum spp.) variedad CP88-1165. In: Memoria. Presentación de resultados de investigación. Zafra 2010-2011. Guatemala, CENGICAÑA. pp. 261-266.
23. Espinoza, G.; Acan, J.; Ufer, C.; Duarte, R.; Montepeque, R. 2011b.
Evaluación de trazas de Glifosato en caña de azúcar. Presentación de
271
resultados, en Power Point Comité de Malezas y Madurantes. CENGICAÑA.
24. Fernandes, A. C. 1985. Autorização da colheita da cana-de-açúcar. In:
semana de fermentação alcoolica “Jaime Rocha de Almeida”,4. Piracicaba. Anais. Piracicaba: Escola Superior de Agricultura “Luiz de Queiroz”. p.12-21.
25. Hatch, M. D.; Sacher JA y Glasziou, K. T. 1963. Sugar accumulation cycle
in sugarcane. I. Studies on enzymes of the cycle. Plant Physiology. 38: 338-343.
26. Hartzler, B. 2000. Roundup vs. Touchdown. (En línea). Iowa. Iowa State
University. Consultado 14 jun. 2007. Formato HTML. Disponible en: http://www.weeds.iastate.edu/mgmt/qtr97-1/touchdown.htm.
27. IPNI. 2007. ¿Por qué el potasio ayuda a la movilización de azúcares en la
planta? (en línea). USA. (Consultado 30 octubre, 2011). Formato HTML. Disponible en: http://www.ipni.net/ppiweb/mexnca.nsf/$webindex/707D4E47C3BDFD4A86256CF000022C2B?opendocument&navigator=home+page
28. Jaworski, E. G. 1972. Mode of action of N-phosphonomethylglycine:
inhibition of aromatic amino acid biosynthesis. Journal of Agricultural and Food Chemistry, Washington, V. 20, p. 1195-1198.
29. Lavanholi, M. das G. D. P.; Casagrande, A. A.; Oliveira, L. A. F.;
Fernandes, G. A.; Rosa R. F. 2002. Aplicação de ethephon e imazapyr em cana-de-açúcar em diferentes épocas e sua influência no florescimento, acidez do caldo e teores de açúcares nos colmos – variedade SP 70-1143. Revista STAB, V.20, pp.42-45.
30. Lazcano-Ferrat, I. 2000. El potasio. Esencial para un buen rendimiento en
caña de azúcar. Instituto de la Potasa y el Fósforo (INOFOS). Informaciones Agronómicas, 4 (6). México.
31. Leite, G. H. P,; Crusciol, C. A. C,; Almeida M.; Filho, W. G. V. 2008.
Growth regulators and technological quality of sugarcane in the middle of the cropping season. Ciência Agro técnica, Lavras, V. 32, N. 6, pp. 1,843-1,850.
32. Leite, G. H. P. 2005. Maturação induzida, alterações fisiológicas,
produtividade e qualidade tecnológica da cana-de-açúcar (Saccharum
272
officinarum L.), 141p. Dissertação (Mestrado Em Produção Vegetal) – Faculdade de Ciências Agronômicas– UNESP, Botucatu.
33. Leite G. H. P. e Crusciol C. A. C. 2008. Reguladores vegetais no
desenvolvimento e produtividade da cana-de-açúcar. Pesquisa Agropecuaria Brasileña., Brasília, v.43, n.8, pp.995-1001.
34. Legendre, B. L. 1975. Ripening of sugarcane: Effects of sunlight,
temperature, and rainfall.Crop Sciencie. 15(3):349-352. 35. Meneses, A.; Melgar, M.; Posadas, W. 2011. Boletín Estadístico. Series
Históricas de producción, exportación y consumo de azúcar en Guatemala. Guatemala, CENGICAÑA. Año 12, No. 1. 8 p.
36. Morgan, T.; Jackson, P.; McDonald, L.; Holtum, J. 2007. Chemical ripeners
increase early season sugar content in a range of sugarcane varieties. Australian Journal of Agricultural Research 58. pp. 233–24.
37. Pérez, O. 2008. Manual de clasificación de suelos para la producción de
caña de azúcar. Guatemala, CENGICAÑA. 215 p. 38. Posadas, M. 2009. Presentación de resultados de aplicación de madurantes
2008-2009. Comité de Malezas y Madurantes. CENGICAÑA. Presentación Power Point.
39. Salgado, G. S. 1995.Cómo incrementar los rendimientos de caña de azúcar en el estado de Tabasco. Campus Tabasco-ISPROTAB. H. Cárdenas, Tabasco, México. 20 p.
40. Subiros, F. 1995. El cultivo de la caña de azúcar. San José, Costa Rica,
EUNED. 441 p. 41. Taiz L.; Zeiger E. 2006. Fisiología Vegetal. 3a. Ed. 581 p. Editorial
Sinauer Associates, Sundeland, Massachussets, USA. 42. Toro, F. J.; Jara, W. 2011. Ventajas del promadur® como inductor
ambientalmente seguro de la acumulación de sacarosa y derivados. (En línea). Consultado 30 0ctubre. Disponible en http://www.fertilife.org/docu/escrito-cana-azucar-congreso-ecuador.pdf
43. Venkataramana, S. K.; Naidu, K. M. 1993. Invertase-sucrose relationship
in young and mature stems of sugarcane. Phytochemistry 32: 821-822.
273
44. Viator, B. J.; Viator, C.; Jackson, W.; Waguespack, H.; Richard, Jr. E. P. 2004. Evaluation of Potassium-based Ripeners as an Alternative to Glyphosate and the Effects of 2,4-D on Herbicidal Cane Ripening. Journal American Society Sugar Cane Technologists, Vol. 24, pp. 98.
45. Villegas, F. 2003. Maduradores de caña de azúcar. Cali, Colombia.
CENICAÑA. 66 p. 46. Yamada, T.; Castro, P. R. C. 2007. Efeitos do glifosato nas plantas:
Implicações fisiológicas e agronómicas. IPNI (International Plant Nutrition Institute), InformaçõesAgronômicas. nº 119.
47. Zablotowicz, R. M.; Reddy, K. N. 2004. Impact of glyphosate and
Bradyrhizobium japonicum symbiosis; with glyphosate-resistant transgenic soybean: a minireview. Journal of Environmental Quality, V. 33, pp. 825-831.

274
SUGARCANE FLOWERING AND THEIR MANAGMENT
Gerardo Espinoza y José Luis Quemé
INTRODUCTION The growth of angiosperm plants is divided in two stages a) vegetative and b) reproductive. The vegetative stage is related to root, stalks, and leaves development; while reproductive stage is concerning with formation of flowers, fruits, and seeds. The reproductive stage is divided as well in two stages: flowering and fructification, which are morphological and physiological distinct from each other. The vegetative growth and the fructification are determinded by the plant nutritive conditions while flowering seems to be mainly affected by hormones (Meyer et al., 1970). Flowering in sugarcane plant is produced when under specific conditions, the growth apical point stops foliar primodia formation; and it consecuently begins the production of flower primordia. This is the way the vegetative stage turns on to the reproductive stage. The change result in stopping internode stalk formation and then young stalks are expanded in their normal diameter thus growth is stopped. That is the reason why sugarcane flowering varieties concentrate more fiber in the top internodes which can result in pith development (Bakker, 1999). The corklike pith prescense is expanded from the top to the bottom and when stalks are processed, there is a higher fiber production and low sucrose yield (Larrahondo y Villegas, 2009). The flowering effect on sugarcane yield and sucrose content depends mainly on the following factors: a) flowering intensity, b) Age of crop. In this case, flowering effect is higher in young plants rather than in mature plant stage. Flowering in mature stage effect is minimum on sugarcane yield, but sugar content can increase; and c) Length of time between flowering and harvesting. In late harvesting cork content formation increases (stalk weigth decreases) the apical dominance stops and lateral bud shoots appear.
Gerardo Espinoza is Agr. Eng., M.Sc. Specialist in Weed and Ripeners, José Luis Quemé is Agr. Eng., Ph.D., Plant Breeder at CENGICANA www.cengicana.org
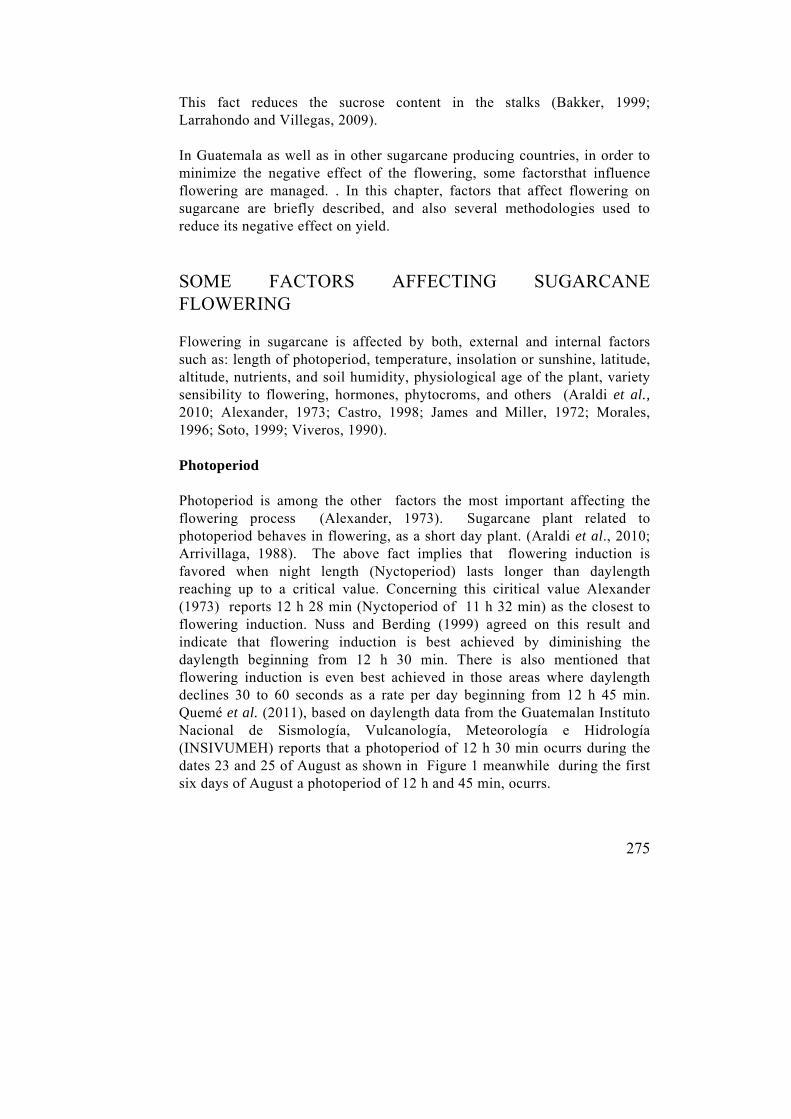
275
This fact reduces the sucrose content in the stalks (Bakker, 1999; Larrahondo and Villegas, 2009). In Guatemala as well as in other sugarcane producing countries, in order to minimize the negative effect of the flowering, some factorsthat influence flowering are managed. . In this chapter, factors that affect flowering on sugarcane are briefly described, and also several methodologies used to reduce its negative effect on yield.
SOME FACTORS AFFECTING SUGARCANE FLOWERING Flowering in sugarcane is affected by both, external and internal factors such as: length of photoperiod, temperature, insolation or sunshine, latitude, altitude, nutrients, and soil humidity, physiological age of the plant, variety sensibility to flowering, hormones, phytocroms, and others (Araldi et al., 2010; Alexander, 1973; Castro, 1998; James and Miller, 1972; Morales, 1996; Soto, 1999; Viveros, 1990). Photoperiod Photoperiod is among the other factors the most important affecting the flowering process (Alexander, 1973). Sugarcane plant related to photoperiod behaves in flowering, as a short day plant. (Araldi et al., 2010; Arrivillaga, 1988). The above fact implies that flowering induction is favored when night length (Nyctoperiod) lasts longer than daylength reaching up to a critical value. Concerning this ciritical value Alexander (1973) reports 12 h 28 min (Nyctoperiod of 11 h 32 min) as the closest to flowering induction. Nuss and Berding (1999) agreed on this result and indicate that flowering induction is best achieved by diminishing the daylength beginning from 12 h 30 min. There is also mentioned that flowering induction is even best achieved in those areas where daylength declines 30 to 60 seconds as a rate per day beginning from 12 h 45 min. Quemé et al. (2011), based on daylength data from the Guatemalan Instituto Nacional de Sismología, Vulcanología, Meteorología e Hidrología (INSIVUMEH) reports that a photoperiod of 12 h 30 min ocurrs during the dates 23 and 25 of August as shown in Figure 1 meanwhile during the first six days of August a photoperiod of 12 h and 45 min, ocurrs.
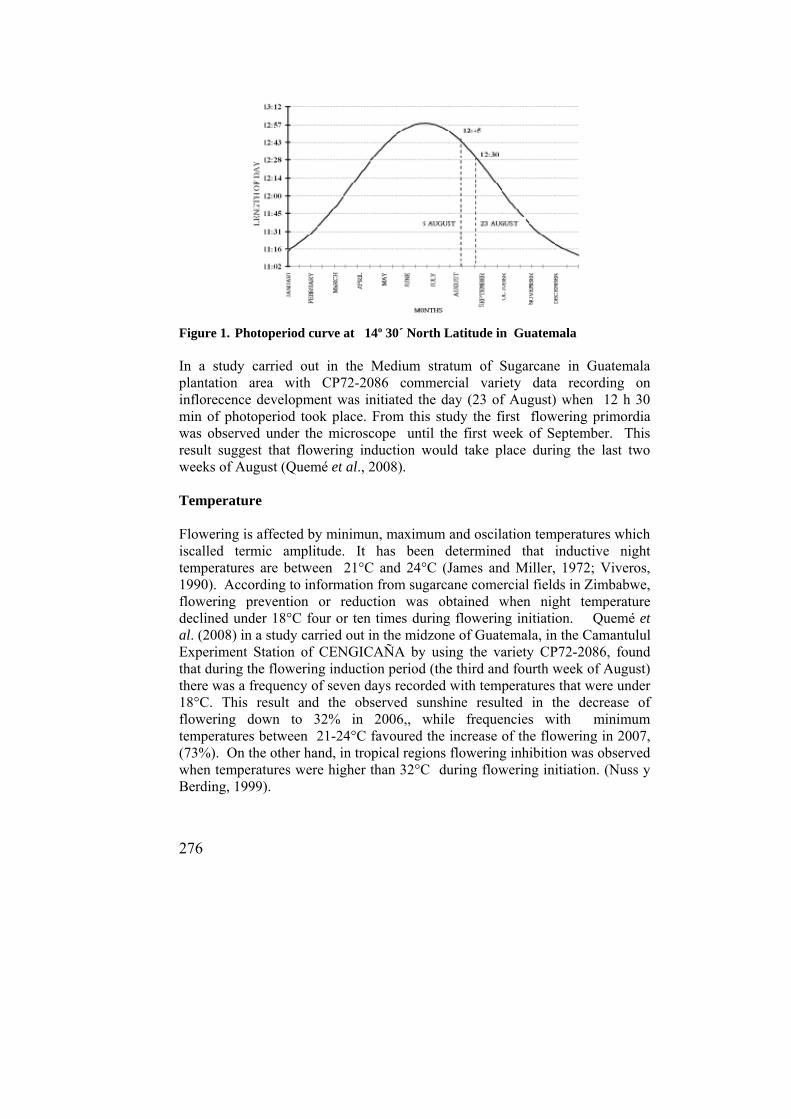
276
Figure 1. Photoperiod curve at 14º 30´ North Latitude in Guatemala In a study carried out in the Medium stratum of Sugarcane in Guatemala plantation area with CP72-2086 commercial variety data recording on inflorecence development was initiated the day (23 of August) when 12 h 30 min of photoperiod took place. From this study the first flowering primordia was observed under the microscope until the first week of September. This result suggest that flowering induction would take place during the last two weeks of August (Quemé et al., 2008). Temperature Flowering is affected by minimun, maximum and oscilation temperatures which iscalled termic amplitude. It has been determined that inductive night temperatures are between 21°C and 24°C (James and Miller, 1972; Viveros, 1990). According to information from sugarcane comercial fields in Zimbabwe, flowering prevention or reduction was obtained when night temperature declined under 18°C four or ten times during flowering initiation. Quemé et al. (2008) in a study carried out in the midzone of Guatemala, in the Camantulul Experiment Station of CENGICAÑA by using the variety CP72-2086, found that during the flowering induction period (the third and fourth week of August) there was a frequency of seven days recorded with temperatures that were under 18°C. This result and the observed sunshine resulted in the decrease of flowering down to 32% in 2006,, while frequencies with minimum temperatures between 21-24°C favoured the increase of the flowering in 2007, (73%). On the other hand, in tropical regions flowering inhibition was observed when temperatures were higher than 32°C during flowering initiation. (Nuss y Berding, 1999).

277
Sunshine or Sunstroke Sunshine is also a wheather factor related with sugarcane flowering. Sunshine is also known as heliophany and it is meassured by using the heliograph. The heliophany is the number of sun hours over a certain place and can be recorded by the heliograph. When cloudy the heliograph intercepts diffuse light interrupting sunshine recording. (Castro, 1998; Guijarro, 2007; Wright, 2003). In a study carried out in Guatemala in the mid zone it was found a higher flowering incidente rather than in the litoral zone, due to insolation increment (Castro, 2000). Particularly, in the mid zone it has been observed an opposite relationship between number of sunshine hours in August and flowering percentage, this means that with greater number of sunshine hours, flowering tends to diminish (Quemé et al., 2008; Quemé et al., 2011). Latitude The latitude has a strong effect on flowering incidence for example in the tropical environments in Sudan (13° 05' N) and Malawi (12° 30' S) flowering values reported ranged between 80 and 100 percent, however; in the subtropical regions like South Africa (25° 22' to 30° 30' S) flowering is scarce and incidence is low (Singels and Donaldson, 2004, reported by Araldi et al., 2010). The sugarcane growing area of Guatemala is located in the tropical region near 14º 30´ N, with a photoperiod that allows high flowering incidence and intensity (Figure 1). Altitude The Guatemalan sugarcane growing area is divided into four different altitude stratum: litoral (0-40 masl), low (40-100 masl), medium (100-300 masl), and high (>300 masl). At a higher altitude, temperature diminishes and this can result in a flowering decrease; even though, in the sugarcane area, flowering intensity is greater while altitude increases, where the higher flowering intensity and incidence is obtained in the high strata (Figure 2). This situation is mainly due to, the fact that in medium and high stratum, there is less sunshine (more cloudy) at the induction time; and the night minimum temperatures, in most of the years, are not less than 18°C (Quemé et al., 2003; Quemé et al., 2008).
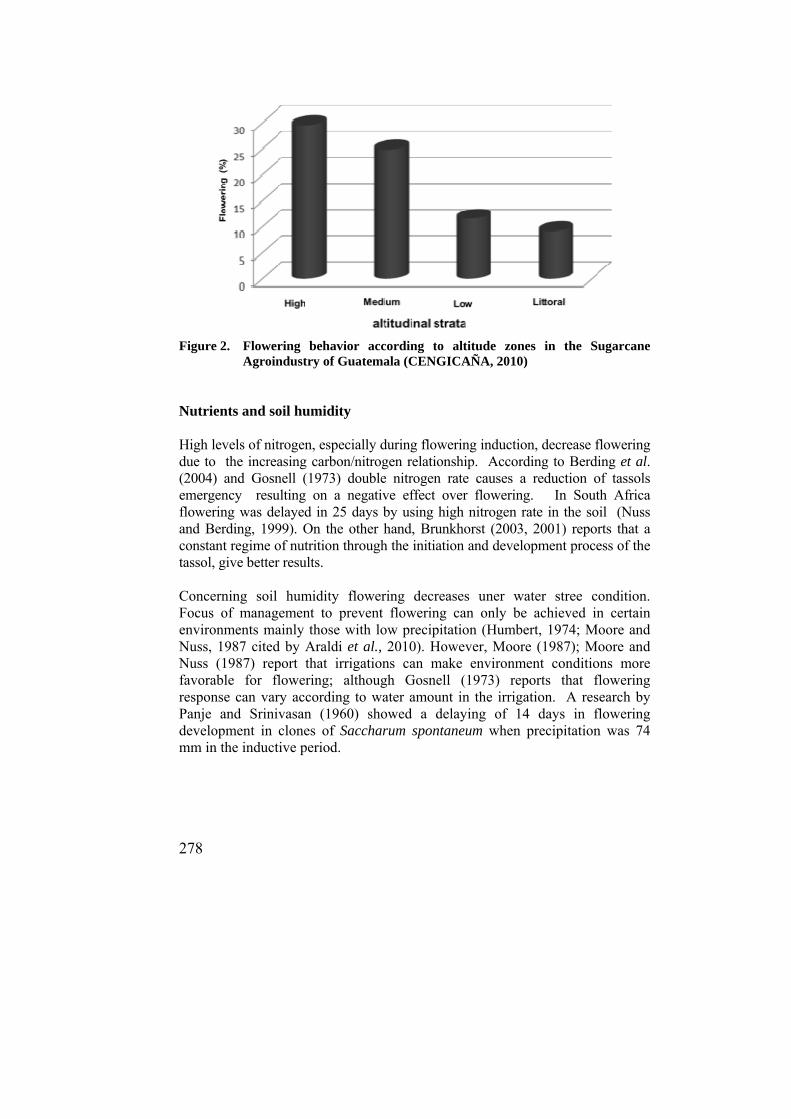
278
Figure 2. Flowering behavior according to altitude zones in the Sugarcane
Agroindustry of Guatemala (CENGICAÑA, 2010) Nutrients and soil humidity High levels of nitrogen, especially during flowering induction, decrease flowering due to the increasing carbon/nitrogen relationship. According to Berding et al. (2004) and Gosnell (1973) double nitrogen rate causes a reduction of tassols emergency resulting on a negative effect over flowering. In South Africa flowering was delayed in 25 days by using high nitrogen rate in the soil (Nuss and Berding, 1999). On the other hand, Brunkhorst (2003, 2001) reports that a constant regime of nutrition through the initiation and development process of the tassol, give better results. Concerning soil humidity flowering decreases uner water stree condition. Focus of management to prevent flowering can only be achieved in certain environments mainly those with low precipitation (Humbert, 1974; Moore and Nuss, 1987 cited by Araldi et al., 2010). However, Moore (1987); Moore and Nuss (1987) report that irrigations can make environment conditions more favorable for flowering; although Gosnell (1973) reports that flowering response can vary according to water amount in the irrigation. A research by Panje and Srinivasan (1960) showed a delaying of 14 days in flowering development in clones of Saccharum spontaneum when precipitation was 74 mm in the inductive period.
279
Physiological maturity Physiological maturity refers to the plant condition that allows to flowering independiently from its age. Before sugarcane plant reaches its physiololigical maturity it must pass through a physiological immaturity called “young phase”. As general rule, stalks with three or four visible nodes are mature enough for flowering. However, exact physiological conditions to distinguish between potencial flowering stalks and young stalks, are still not determined (Alexander, 1973). During physiological maturity phase, sugarcane plant shows awide capacity for responding to the flowering induction as shown in reports from Colombia and Guatemala. Viveros et al., 1991 determined that sugarcane plants between three and six months of age are able to respond to photoinductive treatments in a similar way. In Guatemala based on the assumption that the inductive period is in August, it has been confirmed that floweing induction has been performed in plants between three and nine months of age. (Quemé et al., 2011). Variety sensibility to flowering The genotype sensibility to floral stimulation is consider among the factors that affect sugarcane flowering and its management. Under the Guatemalan climate conditions, sugarcane agroindustry counts with specific varieties despite of the fact that wheater conditions favor natural flowering and they can vary in the flowering incidence. Examples of varieties with high percentage of flowers are: CP73-1547, CP72-1312, and CP88-1508, intermediate flowering are: CP88-1165 and CP72-2086; and non flowering PR75-2002 (Quemé et al., 2011). At commercial level, varietal sensibility for flowering has been proved in Guatemala. In Palo Gordo mill harvest season 2010-2011 it was recorded that the variety CP72-2086 showed on the average 46 percent of flowering, while CP88-1165 variety showed 23 percent (Guzmán, 2011). Phytocroms and hormones Photoperiod response is detected on the leaf through the phytocroms while flowering response is located at the stalk appice. The transportation of the stimulus inductor from the leaf to shoot apical meristem requires the presence of some hormones. Since decades ago, researchers have postulated the existence of the florigen and have dedicated time to isolate and characterize this hormone, trying to understand its interaction with phytocroms with no success so far. Recently, based on genetic analyisis it has been demonstrated that ARNm (florigen signal) has the capacity to translocate in phloem and alterate
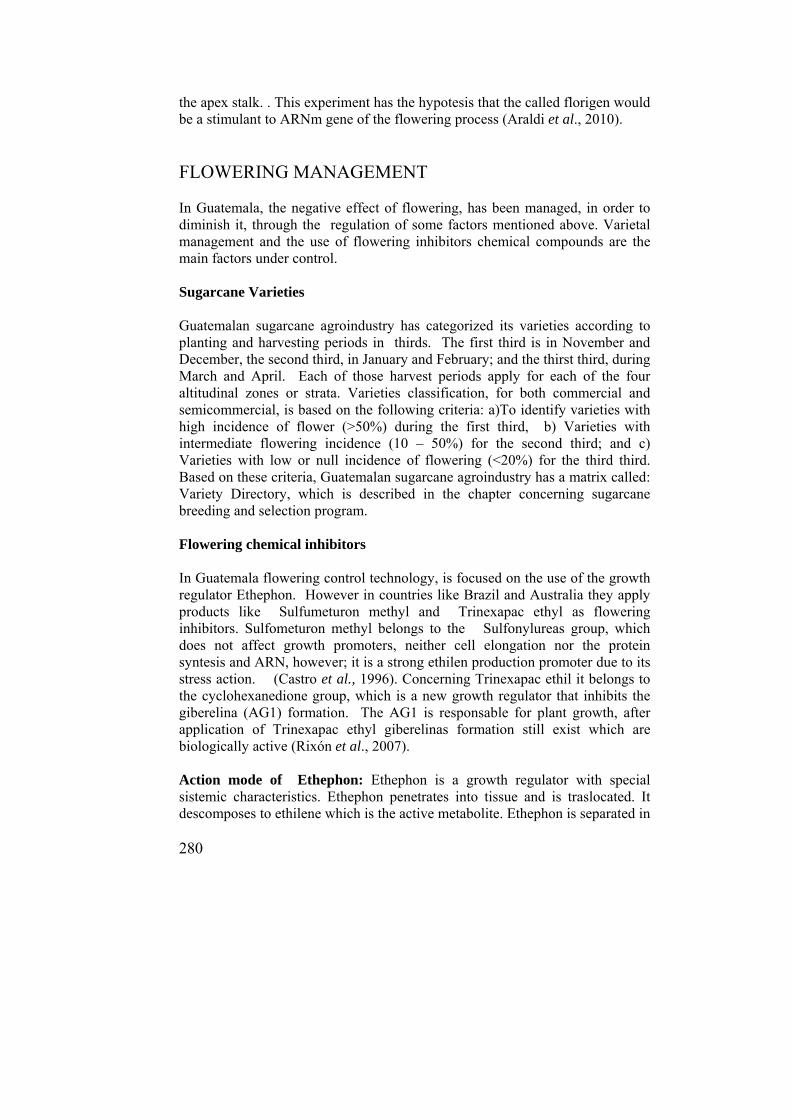
280
the apex stalk. . This experiment has the hypotesis that the called florigen would be a stimulant to ARNm gene of the flowering process (Araldi et al., 2010).
FLOWERING MANAGEMENT In Guatemala, the negative effect of flowering, has been managed, in order to diminish it, through the regulation of some factors mentioned above. Varietal management and the use of flowering inhibitors chemical compounds are the main factors under control. Sugarcane Varieties Guatemalan sugarcane agroindustry has categorized its varieties according to planting and harvesting periods in thirds. The first third is in November and December, the second third, in January and February; and the thirst third, during March and April. Each of those harvest periods apply for each of the four altitudinal zones or strata. Varieties classification, for both commercial and semicommercial, is based on the following criteria: a)To identify varieties with high incidence of flower (>50%) during the first third, b) Varieties with intermediate flowering incidence (10 – 50%) for the second third; and c) Varieties with low or null incidence of flowering (<20%) for the third third. Based on these criteria, Guatemalan sugarcane agroindustry has a matrix called: Variety Directory, which is described in the chapter concerning sugarcane breeding and selection program. Flowering chemical inhibitors In Guatemala flowering control technology, is focused on the use of the growth regulator Ethephon. However in countries like Brazil and Australia they apply products like Sulfumeturon methyl and Trinexapac ethyl as flowering inhibitors. Sulfometuron methyl belongs to the Sulfonylureas group, which does not affect growth promoters, neither cell elongation nor the protein syntesis and ARN, however; it is a strong ethilen production promoter due to its stress action. (Castro et al., 1996). Concerning Trinexapac ethil it belongs to the cyclohexanedione group, which is a new growth regulator that inhibits the giberelina (AG1) formation. The AG1 is responsable for plant growth, after application of Trinexapac ethyl giberelinas formation still exist which are biologically active (Rixón et al., 2007). Action mode of Ethephon: Ethephon is a growth regulator with special sistemic characteristics. Ethephon penetrates into tissue and is traslocated. It descomposes to ethilene which is the active metabolite. Ethephon is separated in
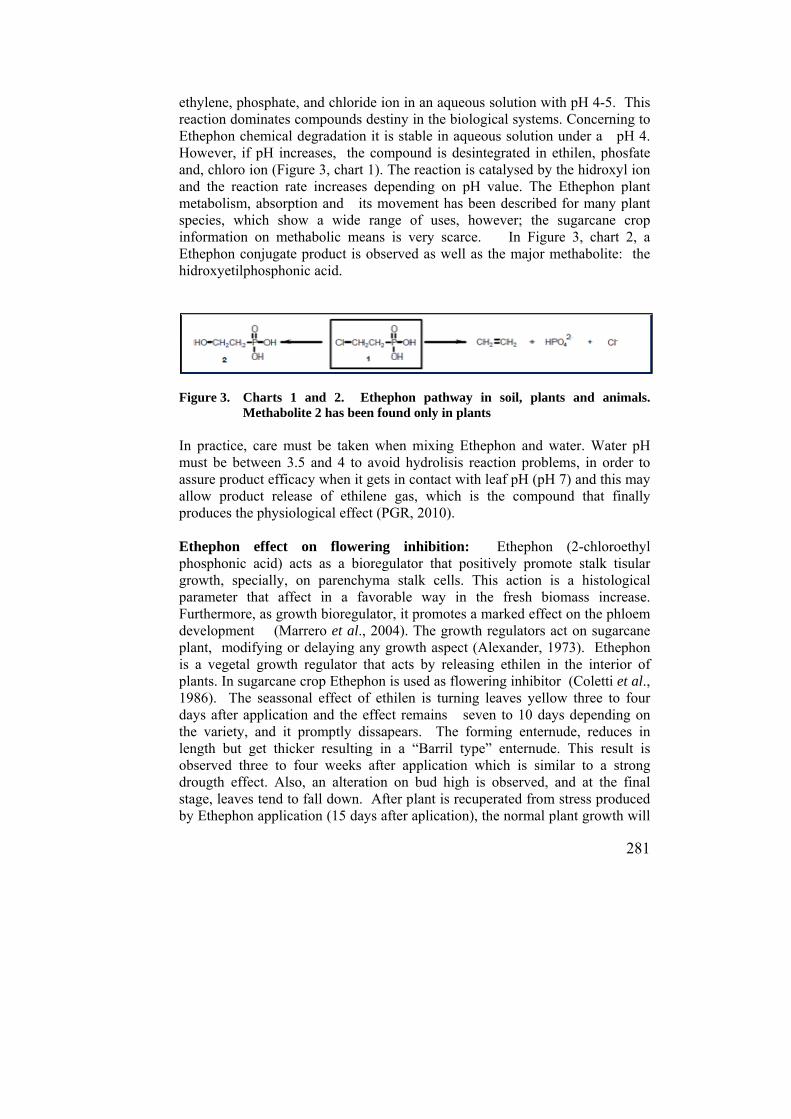
281
ethylene, phosphate, and chloride ion in an aqueous solution with pH 4-5. This reaction dominates compounds destiny in the biological systems. Concerning to Ethephon chemical degradation it is stable in aqueous solution under a pH 4. However, if pH increases, the compound is desintegrated in ethilen, phosfate and, chloro ion (Figure 3, chart 1). The reaction is catalysed by the hidroxyl ion and the reaction rate increases depending on pH value. The Ethephon plant metabolism, absorption and its movement has been described for many plant species, which show a wide range of uses, however; the sugarcane crop information on methabolic means is very scarce. In Figure 3, chart 2, a Ethephon conjugate product is observed as well as the major methabolite: the hidroxyetilphosphonic acid.
Figure 3. Charts 1 and 2. Ethephon pathway in soil, plants and animals.
Methabolite 2 has been found only in plants In practice, care must be taken when mixing Ethephon and water. Water pH must be between 3.5 and 4 to avoid hydrolisis reaction problems, in order to assure product efficacy when it gets in contact with leaf pH (pH 7) and this may allow product release of ethilene gas, which is the compound that finally produces the physiological effect (PGR, 2010). Ethephon effect on flowering inhibition: Ethephon (2-chloroethyl phosphonic acid) acts as a bioregulator that positively promote stalk tisular growth, specially, on parenchyma stalk cells. This action is a histological parameter that affect in a favorable way in the fresh biomass increase. Furthermore, as growth bioregulator, it promotes a marked effect on the phloem development (Marrero et al., 2004). The growth regulators act on sugarcane plant, modifying or delaying any growth aspect (Alexander, 1973). Ethephon is a vegetal growth regulator that acts by releasing ethilen in the interior of plants. In sugarcane crop Ethephon is used as flowering inhibitor (Coletti et al., 1986). The seassonal effect of ethilen is turning leaves yellow three to four days after application and the effect remains seven to 10 days depending on the variety, and it promptly dissapears. The forming enternude, reduces in length but get thicker resulting in a “Barril type” enternude. This result is observed three to four weeks after application which is similar to a strong drougth effect. Also, an alteration on bud high is observed, and at the final stage, leaves tend to fall down. After plant is recuperated from stress produced by Ethephon application (15 days after aplication), the normal plant growth will
282
continue, as well as internodes normal growth (Figure 4). Ethephon must be applied one to two weeks before flowering induction. Flowering mostly depends on sugarcane plant age, variety, duration of the day, and environmental conditions (humidity availability, and temperature) before and at induction date. Favorable conditions for flowering induction are when daylength becomes less than 12 hours and 30 minutes, under adequate soil humidity, and the average temperature is above 18 centigrates (Bocanegra, 1993).
Figure 4. Ethephon application effect on CP88-1165 variety in plant cane, Santa
Marta farm, Madre Tierra Mill, 2009 Aplication methodology: The ethephon methodology of application by using helicopters and light aircrafts is similar to what is described in the chapter concerning ripeners. The water volume in the application can vary between 18-30 l/ha. The application is developed by using GPS, and in some cases, flags and signals are used as tools for air application. Application doses: Based on researchs carried out in Guatemala, the necessary dose of Ethephon (Ethrel 480 SL), for flowering control is 1.5 l/ha. This dose can vary according to the planted variety and its biomass (Xia, 2000). Other researchers do not recommend high doses of the product to avoid unadequate results (Nájera, 2005). According to Xia (2000) the use of a dose between 1.5 and 2.0 l/ha, showed a negative effect, demonstrating emergency of lateral shoots in stalks. From the economic point of view, the application of flowering inhibitor with a dose of (1.5 l/ha) is profitable when sugarcane yield is higher than two metric tones per hectare.

283
Flowering inductive period: In Guatemala, the definition of this period is a little difficult, due to crop location in different altitudinal strata; and it is even more difficult to identify the most adequate moment for flowering inhibitor application. Some sugar mills start the application from the last week of July to August 15. Application dates: According to Nájera (2005) in a study of six application dates, less flowering incidence was found when application was done in August in the low stratum conditions in Madre Tierra mill. Commercial applications of flowering inhibitors, start the last week of July. According to climate conditions, some mills initiate applications in the high stratum, based on previous year experiences, where more flowering occur. Most mills start applications from the first to the last week in August, depending on aircrafts availability. It is important to mention that if dry seasson is present, applications must not be done since lateral shoots formation (lalas) can be estimulated. Ethephon plus Silicio Dioxid 55% study (surfactants) There is a study being conducted to find more options for improving Ethephon use. Important synergic effects by adding Silicon dioxide (55%) to the product , have been obtained. In a study carried out in Santa Marta farm, Madre Tierra mill, it was found that flowering incidence of 30 per cent (without application), 23 per cent (with Ethrel 1.43 l/ha) and 16 per cent (with Ethrel 1.43 l/ha plus 1.4 kg/ha of Silicon dioxide (55%), which confirms the synergy of both products on flowering control.
REFERENCES 1. Alexander, A. G. 1973. Sugarcane physiology. A comprehensive Study of
the Saccharum Source – to – Sink System. Elsevier Scientific Publishing Company, Amsterdam. pp. 523-572.
2. Araldi, R.; Lima, S. F. M.; Orika, O. E.; Domingues, R. J. 2010.
Florescimiento em cana-de-açúcar. Ciência Rural, 40(3):694-702. 3. Arrivillaga, J. 1988. Floración de la caña de azúcar. Revista ATAGUA
(Guatemala) 5:7-16.
4. Bakker, H. 1999. Sugar cane cultivation and management. Kluwer academic/Plenum Publishers. New York.
284
5. Bocanegra, C. J. 1993. Ethrel y Prep en el control de la floración en caña de azúcar. Brasil Rhone Poulenc. 27 p.
6. Berding, N.; Donne, V.; Swain, R. S.; Owens, W. G. 2004. Tropical,
managed initiation of sugarcane flowering: optimization of nonphotoperiodic variables. Proc. Aust. Soc. Sugar Cane Technol, v.26, p.1-12. (CDROM).
7. Brunkhorst, M. J. 2001. A preliminary investigation into the effect of plant
nutrient levels on sugarcane flowering. Proc. S. Afr. Sugar Technol. Assoc. 75, 143–150.
8. Brunkhorst, M. J. 2003. Investigation into the flowering of sugarcane
variety N29 grown under different nutrient regimes. Proc. S. Afr. Sugar Technol. Assoc. 77, 306–312.
9. Castro P. R. C.; Oliveira, D. A.; Panini, E. L. 1996. Ação do sulfometuron-
met i l como maturador da cana-de-açúcar. Em Anais Congresso Nacional da Sociedade dos Técnicos Açucareiros e Alcooleiros do Brasil - STAB 6: 363-369.
10. Castro, O. 1998. El fotoperíodo y la intensidad de la luz solar en la zona
cañera guatemalteca. In: Memoria. Presentación de resultados de investigación. Zafra 1997-1998. Guatemala, CENGICAÑA. pp. 98-101.
11. Castro, O. 2000. La relación entre horas luz y floración en la zona cañera
guatemalteca. In: Memoria. Presentación de resultados de investigación. Zafra 1999-2000. Guatemala, CENGICAÑA. pp. 97-100.
12. CENGICAÑA. 2010. Análisis del comportamiento de la floración a nivel comercial en la Industria Azucarera de Guatemala. Comité Técnico Asesor. (CTA). Presentación Power Point.
13. Coleti, J. T.; Lorenzetti J. M.; Garla J. H.; Campponez, A. 1986. The
inhibition of flowering by Ethephon and its influence on sugarcane quality in Brazil. Proc. XIX Congress ISSCT : 258-262.
14. Gosnell, J.M., 1973. Some factors affecting flowering in sugarcane. Proc. S.
Afr. Sugar Technol. Assoc. 47, 144–147. 15. Guijarro, J. A. 2007. Cambios en la medida de las horas de insolación:
análisis de su impacto en dos observatorios de las Islas Baleares (España). Revista Climatológica Vol. 7 (2007): 27-32.
285
16. Guzmán, M. 2011. Análisis de la floración, zafra 2010-2011. Ingenio Palo Gordo. Departamento de Agronomía. Presentación Power Point.
17. James, N. I.; J. D. Miller. 1972. Photoperiod control in the USDA
sugarcane crossing program. Procceding of 14th. Congress, ISSCT. Breeding and Genetics. pp. 341-347.
18. Larrahondo, E.; Villegas, F. 2009. Control y características de maduración.
Consultado el: 14 julio 2009. Disponible en: http://www.cenicana.org/pdf/documentos_no_seriados/libro_el_cultivo_cana/libro_p297-313.pdf
19. Marrero, P.; Peralta, H.; Pérez, S.; Borroto, J.; Blanco, M. A. 2004. Efecto
de aplicaciones exógenas del ethrel-480 sobre la anatomía del tallo, en cuatro variedades de caña de azúcar (Saccharum spp. híbrida). Caña de Azúcar Vol. 22(2):5-18.
20. Meyer, B. S.; Anderson, D. B.; Bohning, R. H. 1970. Introducción a la
fisiología vegetal. 2ª ed. Editorial Universitaria de Buenos Aires, Argentina.
21. Morales Batista, F. 1996. Fisiología de la reproducción de la caña de
azúcar. 16p. En: Curso Regional, Obtención y Selección de Variedades de Caña de Azúcar. Noviembre de 1996, Cuba.
22. Moore, P. H. 1987. Physiology and control of flowering. In: Copersucar
International Sugarcane Breeding Workshop, Copersucar Technology Centre, Piracicaba, SP, Brazil, May–June, 1987, pp.101–127.
23. Moore, P. H.; Nuss, K. J. 1987. Flowering and flower synchronization. In:
Heinz, D. J (Ed.), Sugarcane Improvement through Breeding. Developments in Crop Science II. Elsevier, New York, pp. 273–311.
24. Nájera E. B. G. 2005. Experiencias en la aplicación del ácido 2-cloroetilo
fosforico como inhibidor de la floración en caña de azúcar (Saccharum spp.). Tesis Ingeniero Agrónomo Facultad de Agronomía, Universidad de San Carlos de Guatemala. 42 p
25. Nuss, K. J.; Berding, N. 1999. Planned recombination in sugarcane
breeding: artificial initiation of flowering in sugarcane in sub-tropical and tropical conditions. Proc Int Soc Sug Cane Technol 2: 202-206.
286
26. Panje, R. R.; Srinivasan, K. 1960. Studies in Saccharum spontaneum. A note on the flowering sequence of Saccharum spontaneum clones. In: CONGRESS OF THE INTERNATIONAL SOCIETY OF SUGAR CANE TECHNOLOGISTS, 10, 1959, Hawaii. Anais... Amsterdam: Elsevier, 1960. pp. 819-824.
27. PGR. 2010. Ethephon. Consultado el 25 noviembre, 2010. Disponible en: http://www.rsc.org/pdf/general/17etheph.pdf. pp. 784-787,
28. Quemé, J. L.; Orozco, H.; Castro, O.; Buc, R.; Ralda, G.; López A.; Acán,
J.; Solares, E.; Natareno, E.; Coronado M. 2011. Comportamiento de la floración de la caña de azúcar (Saccharum spp.) y sus efectos en otras variables relacionadas con la productividad de azúcar. In: Memoria. Presentación de resultados de investigación. Zafra 2010-2011. Guatemala, CENGICAÑA. pp. 94-102.
29. Quemé, J. L.; Orozco, H.; López, A.; Azañón V.; Marroquín, J. 2008. Efecto del brillo solar y la temperatura en la floración de la caña de azúcar (Saccharum spp.) con fines de establecer programas de cruzamientos en Guatemala. In: Memoria. Presentación de resultados de investigación. Zafra 2007-2008. Guatemala, CENGICAÑA. pp. 67-72.
30. Quemé, J. L.; Orozco, H.; Linares, E.; Polo, P. 2003. Comportamiento de la floración de 306 variedades de caña de azúcar (Saccharum spp.) en dos cortes evaluadas en dos estratos altitudinales de la zona cañera de Guatemala. In: Memoria. Presentación de resultados de investigación. Zafra 2002-2003. Guatemala, CENGICAÑA. pp. 60-66.
31. Rixon, C. M.; Di Bella, L. P.; Kingston, G.; Dorahy, K.; Davies, B. y Wood, A.W. 20 MODDUS® A SUGAR ENHANCER. Proc. Aust. Soc. Sugar Cane Technol., Vol. 29.
32. Soto, G. J. 1999. Floración en caña de azúcar (Saccharum spp.) y su
relación con rendimientos. Revista Agricultura (Guatemala) 17:21-25. 33. Viveros, V.; Cassalett, C.; López, F. 1991. Efecto de la edad de la planta y
diferentes tratamientos fotoinductivos en la floración de la caña de azúcar (Saccharum sp.). Acta Agronómica. pp. 37-45
34. Viveros Valens, C. A. 1990. Efecto de la edad de la planta y de varios
tratamientos fotoinductivos en la inducción de la floración de la caña de azúcar. CENICAÑA, Colombia. 63p.

287
35. Wright, J. 2003. Estudio de la variabilidad espacial y temporal de la heliofanía relativa en Costa Rica. Top. Meteoro. Oceanog. 10(1) 20-30.
36. Xia, U. M.U. 2000. Evaluación de tres dosis y seis épocas de aplicación de
Ethrel, utilizado como inhibidor en la floración de caña de azúcar (Saccharum spp.) en el estrato alto del ingenio El Baúl, S.A. Tesis Ingeniero Agrónomo, Facultad de Agronomía, Universidad de San Carlos de Guatemala. 71 p.

288
289
XII. SUGARCANE HARVESTING
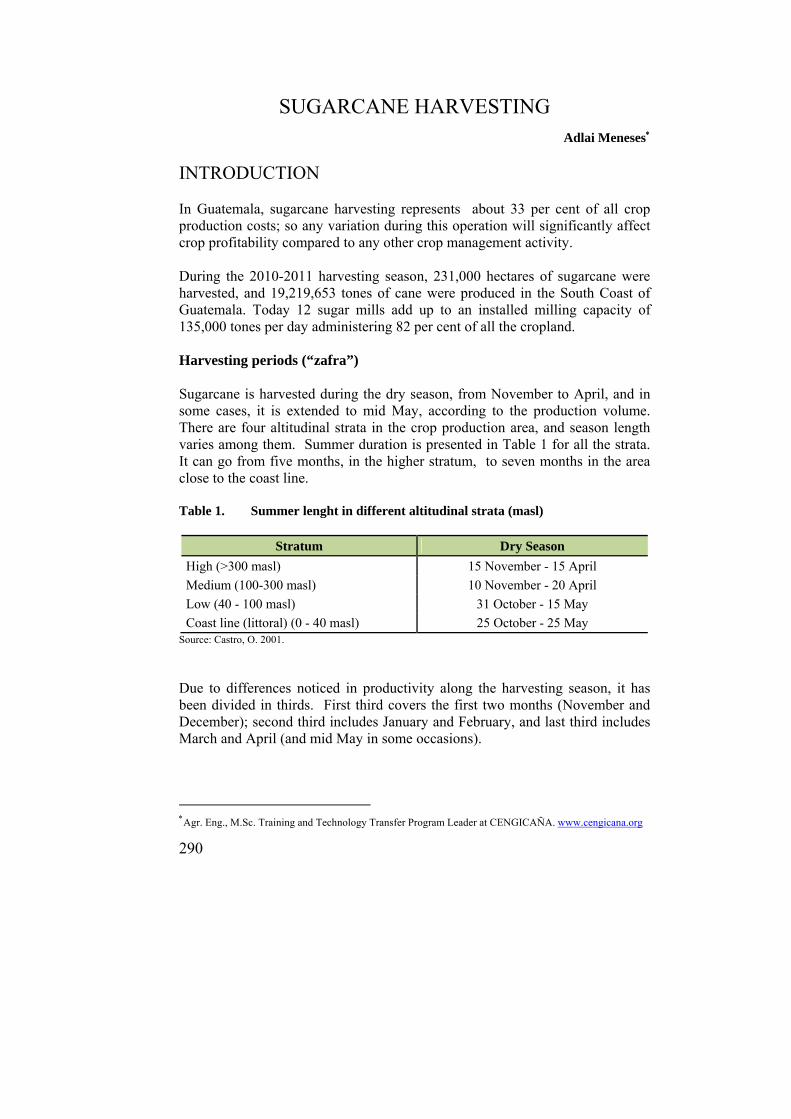
290
SUGARCANE HARVESTING
Adlai Meneses
INTRODUCTION In Guatemala, sugarcane harvesting represents about 33 per cent of all crop production costs; so any variation during this operation will significantly affect crop profitability compared to any other crop management activity. During the 2010-2011 harvesting season, 231,000 hectares of sugarcane were harvested, and 19,219,653 tones of cane were produced in the South Coast of Guatemala. Today 12 sugar mills add up to an installed milling capacity of 135,000 tones per day administering 82 per cent of all the cropland. Harvesting periods (“zafra”) Sugarcane is harvested during the dry season, from November to April, and in some cases, it is extended to mid May, according to the production volume. There are four altitudinal strata in the crop production area, and season length varies among them. Summer duration is presented in Table 1 for all the strata. It can go from five months, in the higher stratum, to seven months in the area close to the coast line. Table 1. Summer lenght in different altitudinal strata (masl)
Stratum Dry Season
High (>300 masl) 15 November - 15 April
Medium (100-300 masl) 10 November - 20 April
Low (40 - 100 masl) 31 October - 15 May
Coast line (littoral) (0 - 40 masl) 25 October - 25 May Source: Castro, O. 2001.
Due to differences noticed in productivity along the harvesting season, it has been divided in thirds. First third covers the first two months (November and December); second third includes January and February, and last third includes March and April (and mid May in some occasions).
Agr. Eng., M.Sc. Training and Technology Transfer Program Leader at CENGICAÑA. www.cengicana.org
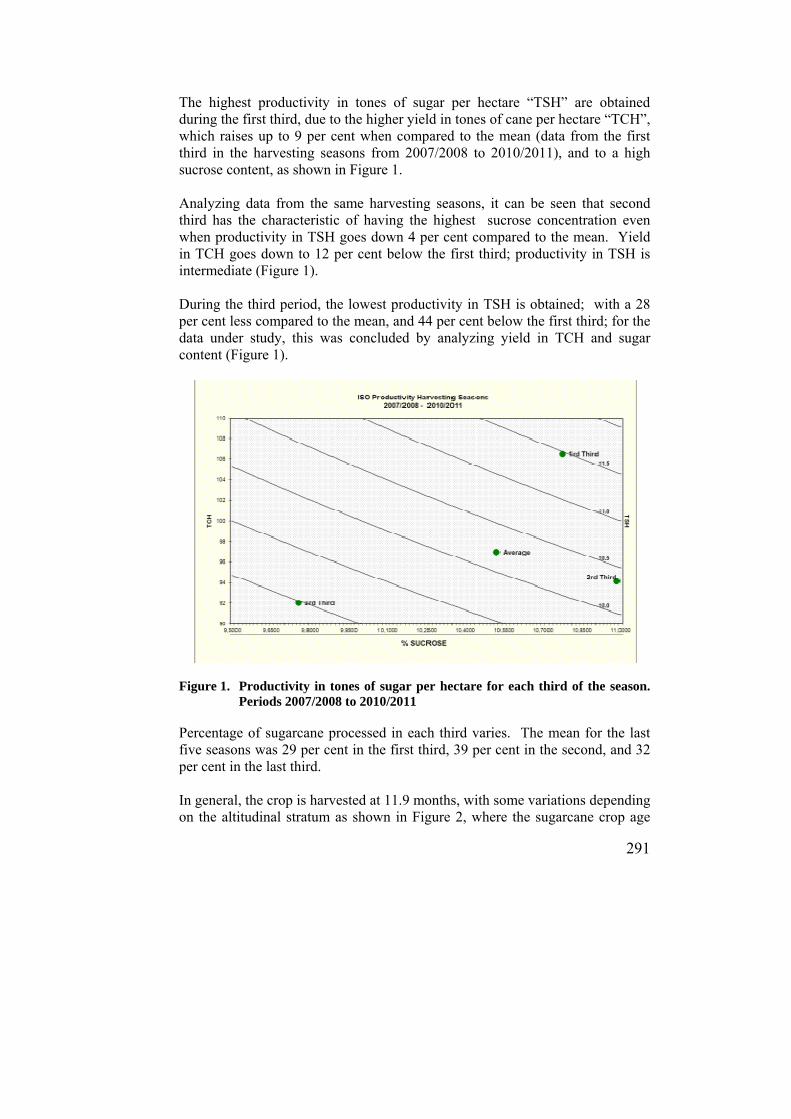
291
The highest productivity in tones of sugar per hectare “TSH” are obtained during the first third, due to the higher yield in tones of cane per hectare “TCH”, which raises up to 9 per cent when compared to the mean (data from the first third in the harvesting seasons from 2007/2008 to 2010/2011), and to a high sucrose content, as shown in Figure 1. Analyzing data from the same harvesting seasons, it can be seen that second third has the characteristic of having the highest sucrose concentration even when productivity in TSH goes down 4 per cent compared to the mean. Yield in TCH goes down to 12 per cent below the first third; productivity in TSH is intermediate (Figure 1). During the third period, the lowest productivity in TSH is obtained; with a 28 per cent less compared to the mean, and 44 per cent below the first third; for the data under study, this was concluded by analyzing yield in TCH and sugar content (Figure 1).
Figure 1. Productivity in tones of sugar per hectare for each third of the season.
Periods 2007/2008 to 2010/2011 Percentage of sugarcane processed in each third varies. The mean for the last five seasons was 29 per cent in the first third, 39 per cent in the second, and 32 per cent in the last third. In general, the crop is harvested at 11.9 months, with some variations depending on the altitudinal stratum as shown in Figure 2, where the sugarcane crop age
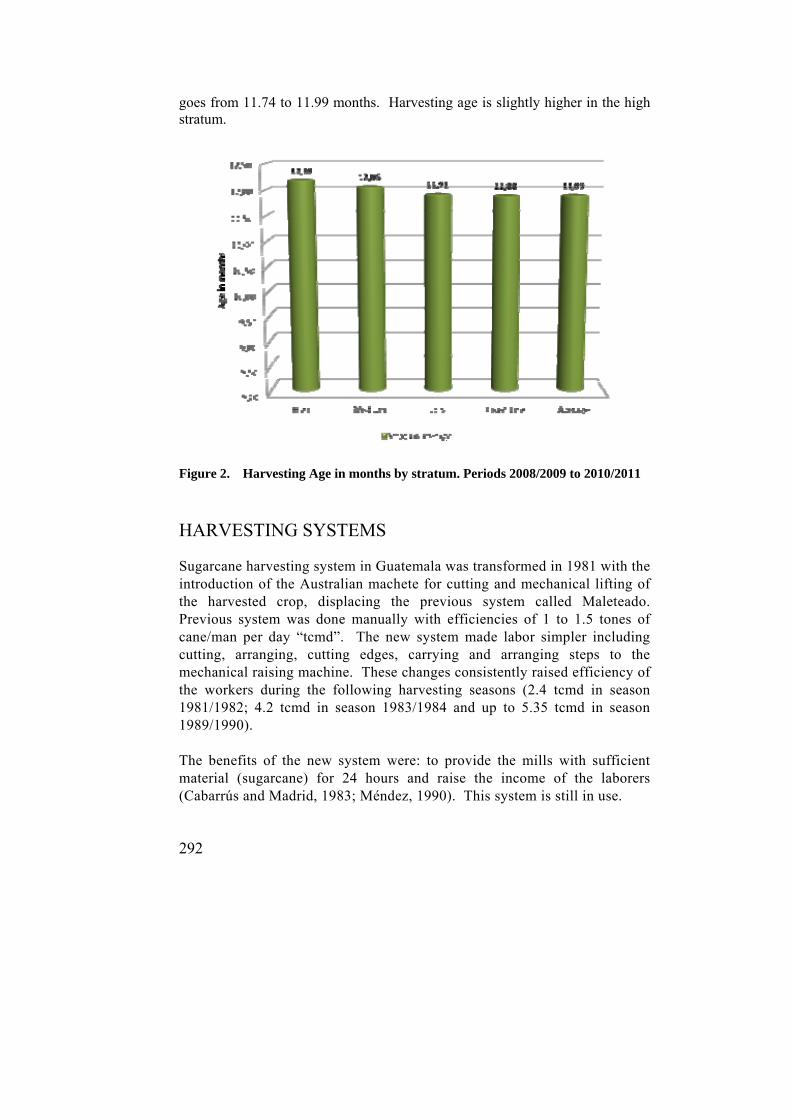
292
goes from 11.74 to 11.99 months. Harvesting age is slightly higher in the high stratum.
Figure 2. Harvesting Age in months by stratum. Periods 2008/2009 to 2010/2011
HARVESTING SYSTEMS Sugarcane harvesting system in Guatemala was transformed in 1981 with the introduction of the Australian machete for cutting and mechanical lifting of the harvested crop, displacing the previous system called Maleteado. Previous system was done manually with efficiencies of 1 to 1.5 tones of cane/man per day “tcmd”. The new system made labor simpler including cutting, arranging, cutting edges, carrying and arranging steps to the mechanical raising machine. These changes consistently raised efficiency of the workers during the following harvesting seasons (2.4 tcmd in season 1981/1982; 4.2 tcmd in season 1983/1984 and up to 5.35 tcmd in season 1989/1990). The benefits of the new system were: to provide the mills with sufficient material (sugarcane) for 24 hours and raise the income of the laborers (Cabarrús and Madrid, 1983; Méndez, 1990). This system is still in use.

293
In Figure 3, a general representation of the organizational structure used in a sugar mill for harvesting is presented. They have a Management of Cutting, Lifting and Transportation Department (CLT)
Figure 3. General organization structure of the CLT Department in a
Guatemalan sugar mill
During harvesting season 2010/2011, 88 per cent of the crop was manually harvested (16.9 million tones of cane) and 12 per cent, mechanical harvesters. Most of the cane harvested manually (87.77 per cent) was previously burned; the remaining 12.23 per cent was green cane mechanically harvested. Yields obtained when harvesting manually, both green and burnt cane, are shown in Figure 4, for the harvesting seasons between 2004/2005 and 2010/2011. The relationship of performance between cutting burnt and green cane, went from 1.61:1 in 2004/2005 to 2.47:1 in 2009/2010, with intermediate values in other harvests.

294
Figure 4. Laborer yield when harvesting burnt and green cane. Period from
2004/2005 to 2010/2011 Manual harvesting During the 2010/2011 harvesting season, 89 per cent of cane was cut manually, similar to the previous years. Laborers come from two groups: camping labor force (not local) that come from different departments such as Quiché, Baja Verapaz, and Chiquimula. They stay in apartment complexes where they are provided with accommodation, meals, and other services. The other are called “volunteers” (local people) come from towns, nearby. They are provided with transportation and hydrating solutions. The proportion of these groups goes from 50 to 70 per cent of camping labor force and the rest are “volunteers”, changing according to the different mills. In the last seven harvesting seasons, mean yield for a laborer cutting burnt cane, has gone from 5.49 up to 6.31 tcmd and for green cane, from 2.53 up to 3.62 tones of cane, per men, per day (Figure 4).
Manual cutting can be done in two different ways; the first is called continuous Chorra (piling up) (Figure 5), which was used for 85 per cent of harvested burnt cane in 2010/2011 season.
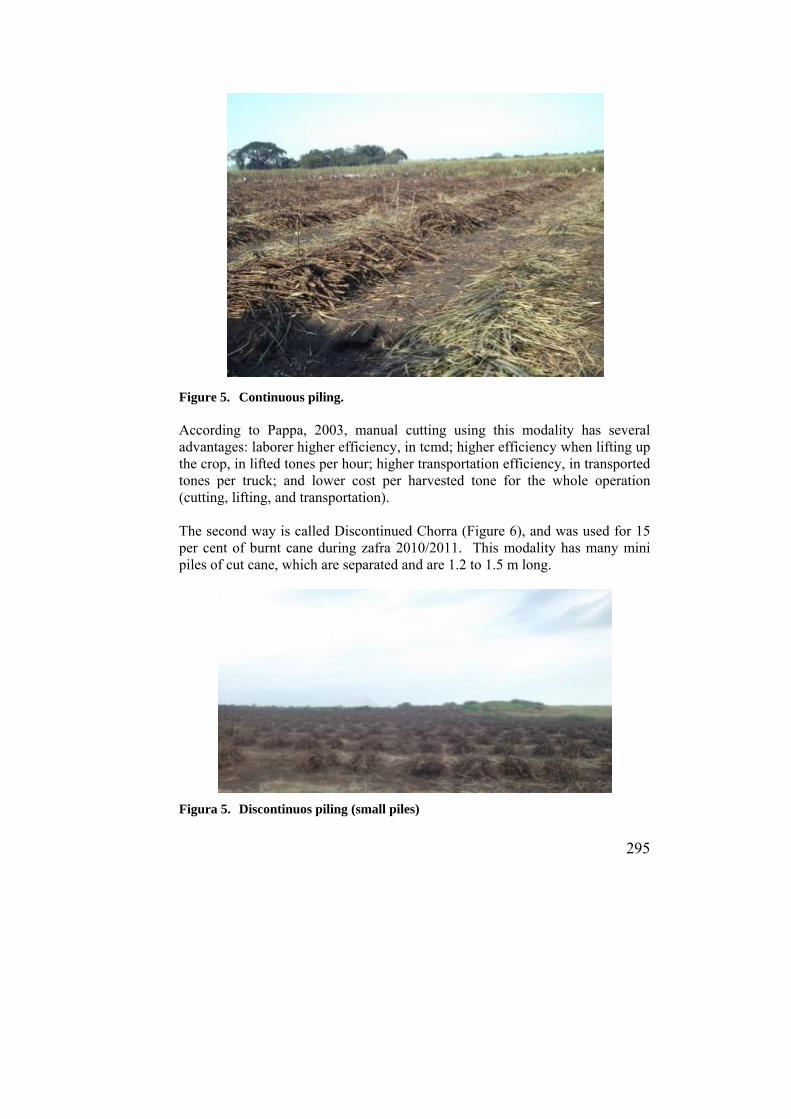
295
Figure 5. Continuous piling. According to Pappa, 2003, manual cutting using this modality has several advantages: laborer higher efficiency, in tcmd; higher efficiency when lifting up the crop, in lifted tones per hour; higher transportation efficiency, in transported tones per truck; and lower cost per harvested tone for the whole operation (cutting, lifting, and transportation). The second way is called Discontinued Chorra (Figure 6), and was used for 15 per cent of burnt cane during zafra 2010/2011. This modality has many mini piles of cut cane, which are separated and are 1.2 to 1.5 m long.
Figura 5. Discontinuos piling (small piles)

296
According to Pappa, 2003, manual cutting using this modality has the following advantages: lesser amount of trash, specially the mineral component (earth and stone), which contributes to higher sucrose recovery; lower wearing and deterioration of the mill machinery; lower time losses in the factory. Peralta (2011) (personal communication) mentioned other advantages such as lower damage to the cane plant, resulting in higher number of cuts and lower investment in re cropping the plantation (ratoon). Trash percentages obtained for both harvesting modalities, are presented in Figure 7. Even though values are similar, differences could be identified when analyzing individual components.
Figure 7. Trash contents per season third with the different manual harvesting
systems (continous and discontinuous “chorra” piling) Mechanical Harvesting This modality was used in 30,080 hectares, which represented 14 per cent of harvested cane, during the season 2010/2011. Most of this cane (90 %) was green cane. Mechanical harvesting is used by most sugar mills to support the operations when there is a lack of laborers for manual cut. The percent of mechanical harvesting varies among sugar mills going from 5 to 33 per cent. Efficiencies obtained per machine during the season 2010/2011 were 35.36 tones of harvested cane/hour, and 478 tones of cane harvested per day. Figure 8 shows percent area harvested mechanically from 2000/2001 to 2011/2012.
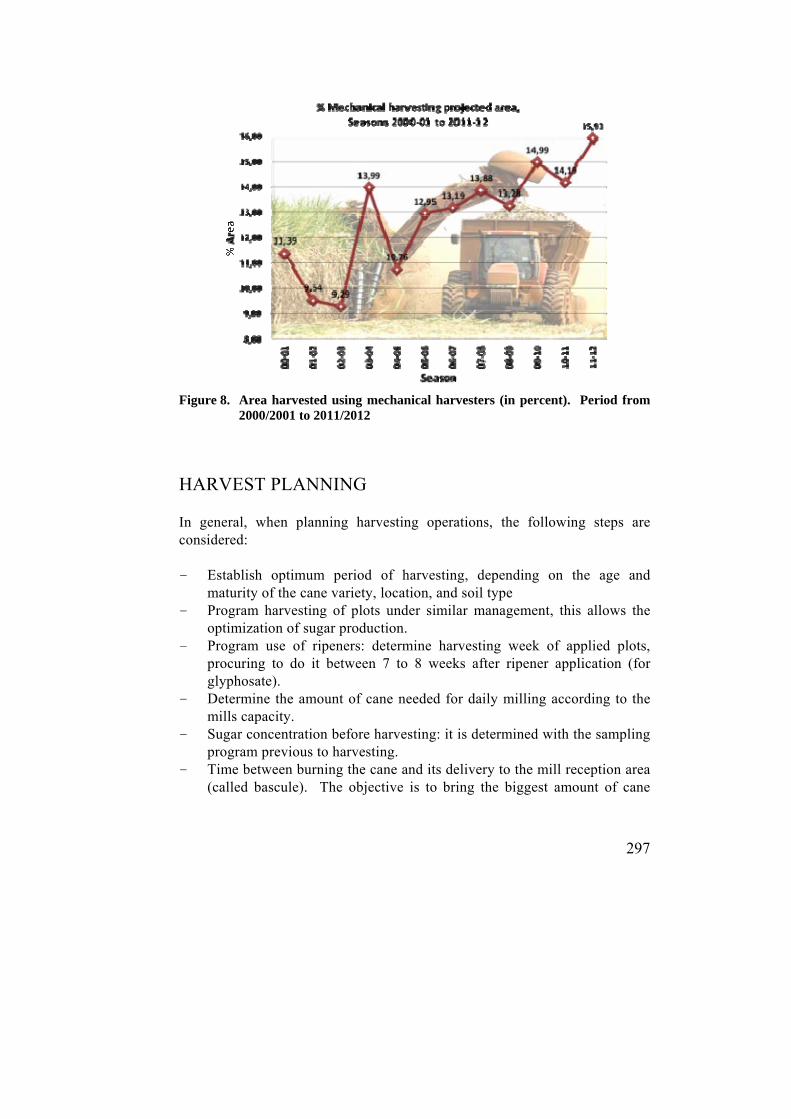
297
Figure 8. Area harvested using mechanical harvesters (in percent). Period from
2000/2001 to 2011/2012
HARVEST PLANNING
In general, when planning harvesting operations, the following steps are considered:
- Establish optimum period of harvesting, depending on the age and
maturity of the cane variety, location, and soil type - Program harvesting of plots under similar management, this allows the
optimization of sugar production. - Program use of ripeners: determine harvesting week of applied plots,
procuring to do it between 7 to 8 weeks after ripener application (for glyphosate).
- Determine the amount of cane needed for daily milling according to the mills capacity.
- Sugar concentration before harvesting: it is determined with the sampling program previous to harvesting.
- Time between burning the cane and its delivery to the mill reception area (called bascule). The objective is to bring the biggest amount of cane
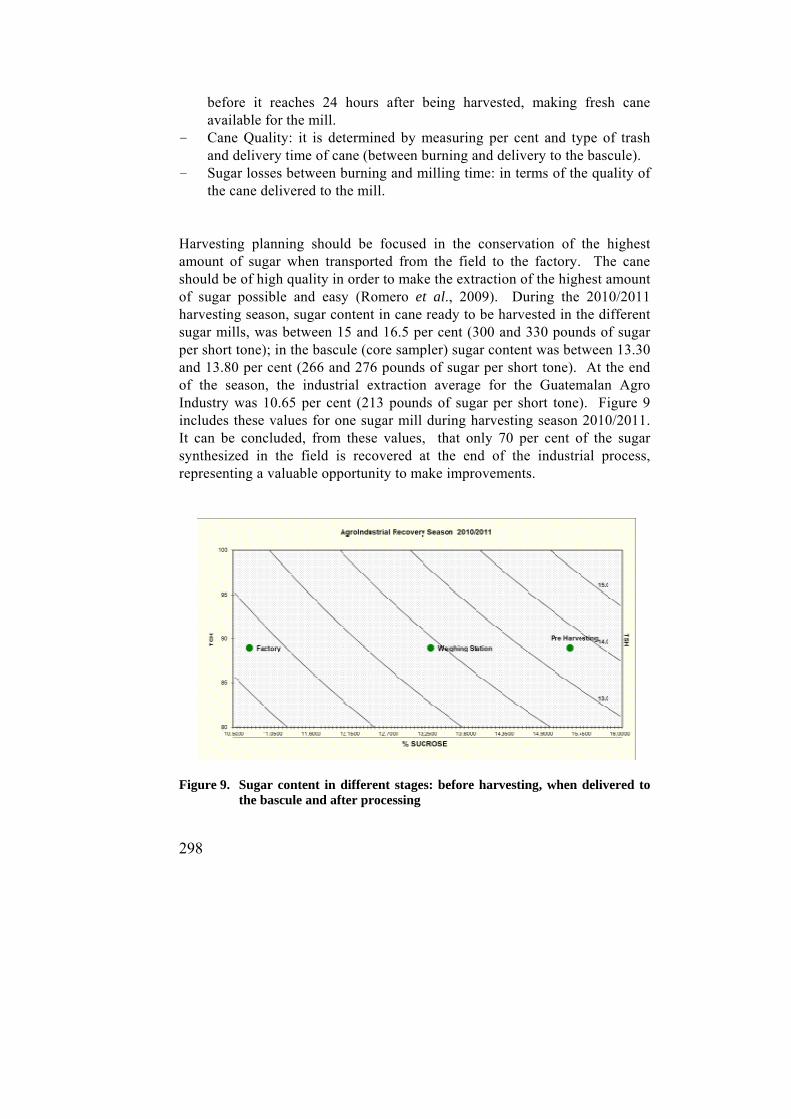
298
before it reaches 24 hours after being harvested, making fresh cane available for the mill.
- Cane Quality: it is determined by measuring per cent and type of trash and delivery time of cane (between burning and delivery to the bascule).
- Sugar losses between burning and milling time: in terms of the quality of the cane delivered to the mill.
Harvesting planning should be focused in the conservation of the highest amount of sugar when transported from the field to the factory. The cane should be of high quality in order to make the extraction of the highest amount of sugar possible and easy (Romero et al., 2009). During the 2010/2011 harvesting season, sugar content in cane ready to be harvested in the different sugar mills, was between 15 and 16.5 per cent (300 and 330 pounds of sugar per short tone); in the bascule (core sampler) sugar content was between 13.30 and 13.80 per cent (266 and 276 pounds of sugar per short tone). At the end of the season, the industrial extraction average for the Guatemalan Agro Industry was 10.65 per cent (213 pounds of sugar per short tone). Figure 9 includes these values for one sugar mill during harvesting season 2010/2011. It can be concluded, from these values, that only 70 per cent of the sugar synthesized in the field is recovered at the end of the industrial process, representing a valuable opportunity to make improvements.
Figure 9. Sugar content in different stages: before harvesting, when delivered to
the bascule and after processing
299
SPECIAL THANKS: To Engineers Emilio Catalán and Danilo Peralta, Harvesting Managers of the Sugar Mills Magdalena and Madre Tierra, respectively, for revising and contributing to the contents presented in this chapter.
BIBLIOGRAPHY 1. Pappa, J. 2003. Cosecha. En: Diplomado de Ingeniería Cañera, Módulo
cosecha. Presentación en Power Point. 2. Giraldo, F. 1995. Cosecha, alce y transporte. En: El cultivo de la caña en la
zona azucarera de Colombia. Colombia, CENICAÑA. pp. 357-362. 3. Méndez, G. 1990. Corte de la caña de azúcar. ATAGUA (Gua) 4:(9) pp.
24-26. 4. Gil, A.; Álvarez, C. 2010. Pol % Caña, ingenio La Unión, S. A. En:
Análisis de resultados Zafra 2009/2010, del área de Fábrica. Presentación en Power Point.
5. Cabarrús, P.; Madrid, G. 1983. Diseño y evaluación de un sistema de corte y alce manual de caña de azúcar. ATAGUA, Boletín No. 8. pp. 1-17.
6. Meneses, A. 2011. Cosecha. In: Memoria XVI Simposio de análisis de la
zafra 2010/2011 Área de Campo. Guatemala, CENGICAÑA. Disco compacto.
7. Meneses, A. 2011. Productividad. In: Memoria XVI Simposio de análisis
de la zafra 2010/2011, Área de Campo. Guatemala, CENGICAÑA. Disco compacto.
8. Castro, O.; Monterroso, H. 2011. La Planificación del uso de la tecnología
del riego con base a procesos, zona cañera de Guatemala. In: Memoria. Presentación de resultados de investigación. Zafra 2010-2011. Guatemala, CENGICAÑA. pp. 215-221.
9. Romero, E.; Scandaliaris, J.; Digonzelli, P.; Tonatto, J.; de Ullivarri, J.;
Giardina, J.; Alonso, L.; Casen, S.; Leggio, F. 2009. Cosecha de la caña de azúcar. En: Manual del Cañero. Argentina, EEAOC. pp. 131-143.

300
301
XIII. THE SUGAR PRODUCTION PROCESS
302
THE SUGAR PRODUCTION PROCESS
José Luis Alfaro, Enrique Velásquez, Luis Monterroso and Rodolfo Espinosa
INTRODUCTION The sugar crop in Guatemala has evolved considerably during the last decades, and its course was marked by predominant agricultural indicators. Some market requirements joined this course along the way as did the need to satisfy the energy as well as the biofuel sectors. From an industrial perspective, it is important to mention that some of the results sought in the field brought about effects in the sugar mills ( Ingenios ) that explain much of the final results and that are worth highlighting. Changes that oriented the vivid operation during the last 30 years in the industrial areas were observed. The main processes in which these changes took place were: Preparation, milling, sucrose recovery, and energy co-generation The theoretical and descriptive fundamentals of the process and subprocesses that intervene in the production of sugar are approached in this chapter; the production of the different sugar qualities found in the local and the international market is covered: raw sugar, sulphite-whited or white sugar and refined sugar. Statistical data on the sugar production and sales of the Guatemalan Agribusiness are also described in this chapter. A short chronology over a period of 40 years of the main impacts of the raw materials on the industrial process is presented. Further on, a chronology of the changes made in the sugar factories geared towards energy savings, to support the consistent increase of milling quantities, as well as the contribution to the Guatemalan power industry, is also presented Some aspects of the preparation and milling are also described, as the first stages of the sugar production process; in which the harvested sugarcane is transformed into smaller pieces, so as to expose the fibers, making the extraction of the juice as efficient as possible. These processes have evolved technologically, therefore time losses have been reduced, milling
José Luis Alfaro is an Electronics Engineer and is the Head of the Electrical and Automatization
Department for the La Union sugar mill; Enrique Velásquez is a Mechanical Engineer and Head of Machinery for the La Union sugar mill. www.launion.com.gt; Luis Monterroso has a major in Chemistry, and is a former specialist in standardization and normalization for CENGICAÑA.; Rodolfo Espinosa, Ph.D., is a Chemical Engineer and Industrial Research Program Leader at CENGICAÑA. www.cengicana.org

303
capacity has been increased, and the extraction of sucrose has improved. Regarding the preparation and milling of the sugarcane, a brief timeline of the main changes that have left a mark in the development of the Guatemalan Sugar Agribusiness, is also presented.
SUGAR PRODUCTION AND COMMERCIALIZATION STATISTICS It can be observed a 175 percent increase from the 1984-1985 zafra to the 1996-1997 zafra in Figure 1, that is, from 0.55 million metric tons to 1.5 million metric tons, in a 12 year period. Until the 1995-1996 harvest, all the sugar refineries in Guatemala had only a single milling tandem, each. Back then, the sugar mill with the largest daily milling capacity was at 12,000 T/day. From the 1997 to 2009, the sugar production had a 45 percent increase, from 1.5 million Ton to 2.2 million Ton.
Figure 1. Sugar production per harvest in Guatemala
Source: ASAZGUA annual report [Acronym in Spanish for the Guatemalan Sugar Producers Association]
Figure 2 shows the local sugar sales and the export sales in the Guatemalan Agribusiness, during the period between the 1993 and 2009; an increase in sales from one million metric tons to a figure higher than two million metric tons (a 100% increase in a 15 year period). In the total sales period, on average, 30 percent corresponds to the local market and 70%, to exports.
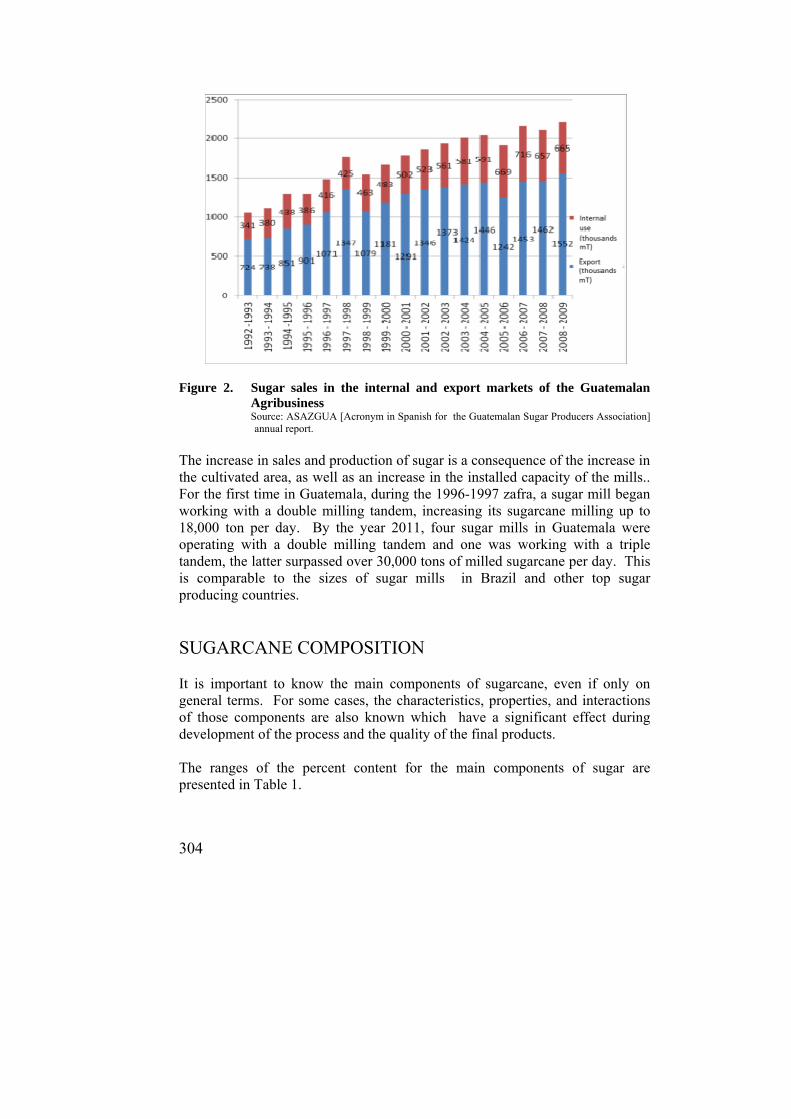
304
Figure 2. Sugar sales in the internal and export markets of the Guatemalan
Agribusiness Source: ASAZGUA [Acronym in Spanish for the Guatemalan Sugar Producers Association] annual report.
The increase in sales and production of sugar is a consequence of the increase in the cultivated area, as well as an increase in the installed capacity of the mills.. For the first time in Guatemala, during the 1996-1997 zafra, a sugar mill began working with a double milling tandem, increasing its sugarcane milling up to 18,000 ton per day. By the year 2011, four sugar mills in Guatemala were operating with a double milling tandem and one was working with a triple tandem, the latter surpassed over 30,000 tons of milled sugarcane per day. This is comparable to the sizes of sugar mills in Brazil and other top sugar producing countries.
SUGARCANE COMPOSITION It is important to know the main components of sugarcane, even if only on general terms. For some cases, the characteristics, properties, and interactions of those components are also known which have a significant effect during development of the process and the quality of the final products. The ranges of the percent content for the main components of sugar are presented in Table 1.
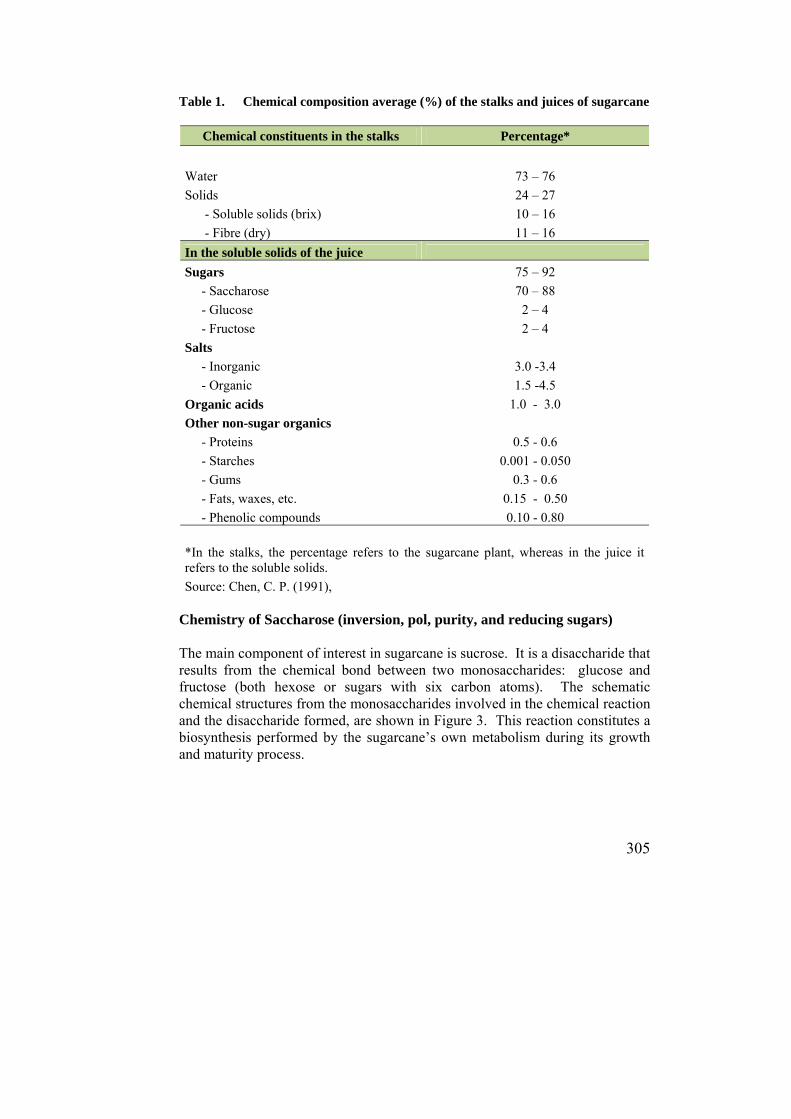
305
Table 1. Chemical composition average (%) of the stalks and juices of sugarcane
Chemical constituents in the stalks Percentage*
Water 73 – 76
Solids 24 – 27
- Soluble solids (brix) 10 – 16
- Fibre (dry) 11 – 16
In the soluble solids of the juice
Sugars 75 – 92
- Saccharose 70 – 88
- Glucose 2 – 4
- Fructose 2 – 4
Salts
- Inorganic 3.0 -3.4
- Organic 1.5 -4.5
Organic acids 1.0 - 3.0
Other non-sugar organics
- Proteins 0.5 - 0.6
- Starches 0.001 - 0.050
- Gums 0.3 - 0.6
- Fats, waxes, etc. 0.15 - 0.50
- Phenolic compounds 0.10 - 0.80
*In the stalks, the percentage refers to the sugarcane plant, whereas in the juice it refers to the soluble solids.
Source: Chen, C. P. (1991), Chemistry of Saccharose (inversion, pol, purity, and reducing sugars) The main component of interest in sugarcane is sucrose. It is a disaccharide that results from the chemical bond between two monosaccharides: glucose and fructose (both hexose or sugars with six carbon atoms). The schematic chemical structures from the monosaccharides involved in the chemical reaction and the disaccharide formed, are shown in Figure 3. This reaction constitutes a biosynthesis performed by the sugarcane’s own metabolism during its growth and maturity process.
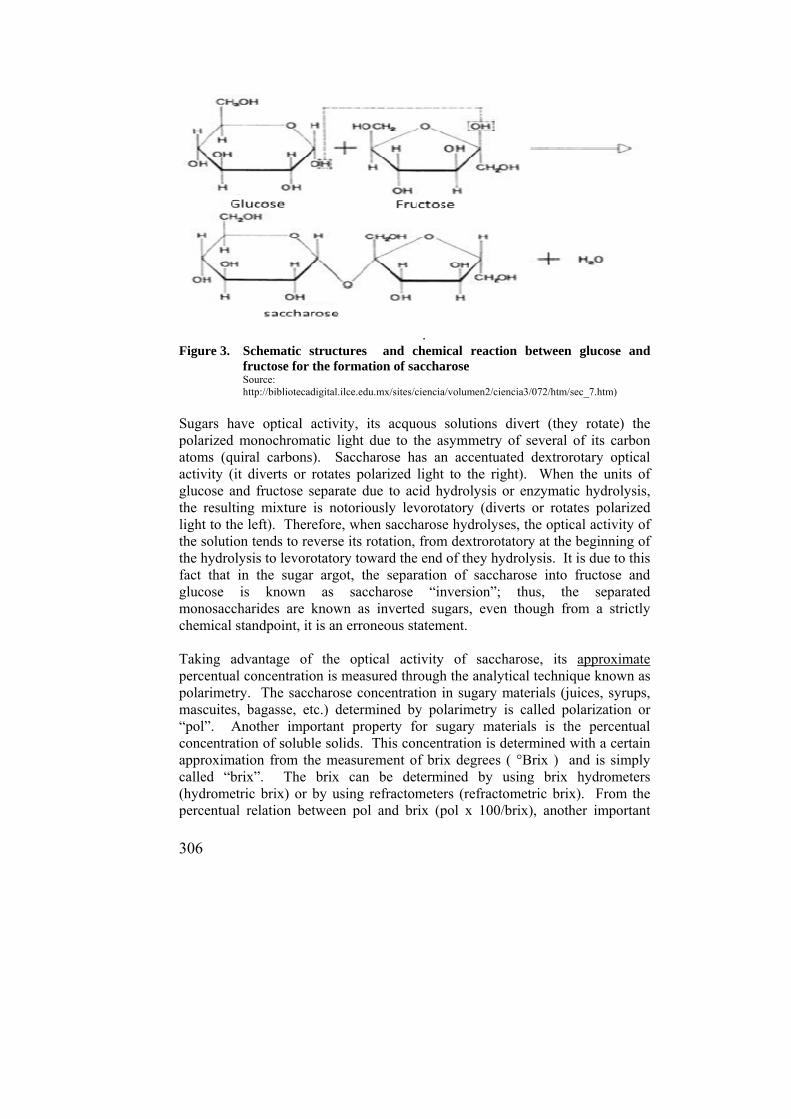
306
.
Figure 3. Schematic structures and chemical reaction between glucose and fructose for the formation of saccharose Source: http://bibliotecadigital.ilce.edu.mx/sites/ciencia/volumen2/ciencia3/072/htm/sec_7.htm)
Sugars have optical activity, its acquous solutions divert (they rotate) the polarized monochromatic light due to the asymmetry of several of its carbon atoms (quiral carbons). Saccharose has an accentuated dextrorotary optical activity (it diverts or rotates polarized light to the right). When the units of glucose and fructose separate due to acid hydrolysis or enzymatic hydrolysis, the resulting mixture is notoriously levorotatory (diverts or rotates polarized light to the left). Therefore, when saccharose hydrolyses, the optical activity of the solution tends to reverse its rotation, from dextrorotatory at the beginning of the hydrolysis to levorotatory toward the end of they hydrolysis. It is due to this fact that in the sugar argot, the separation of saccharose into fructose and glucose is known as saccharose “inversion”; thus, the separated monosaccharides are known as inverted sugars, even though from a strictly chemical standpoint, it is an erroneous statement. Taking advantage of the optical activity of saccharose, its approximate percentual concentration is measured through the analytical technique known as polarimetry. The saccharose concentration in sugary materials (juices, syrups, mascuites, bagasse, etc.) determined by polarimetry is called polarization or “pol”. Another important property for sugary materials is the percentual concentration of soluble solids. This concentration is determined with a certain approximation from the measurement of brix degrees ( °Brix ) and is simply called “brix”. The brix can be determined by using brix hydrometers (hydrometric brix) or by using refractometers (refractometric brix). From the percentual relation between pol and brix (pol x 100/brix), another important

307
property of sugary materials is obtained. It is known as apparent purity, polarimetric purity or simply “purity”. Throughout this chapter, reference will be made to the brix, pol and purity terms as has been explained in this section. Glucose and fructose are also classified as reducing sugars, due to the fact that its carbon group is available (be it in its open structure and/or that in its cycled structure its carbon group is free or forming a hemiacetal) this availability refers to the fact that it can react and reduce the copper cation (Cu 2+) to copper in an oxidation state +I forming copper oxide (Cu2O); on the other hand, with saccharose the carbon groups are blocked (the carbon groups are in acetal form), and are not available to react with the copper ion (Cu2+). The reaction between reducing sugars and the copper ion is called the Fehling reaction (see Figure 4). There are very low concentrations of other reducing sugars in sugary materials (which also react with the Fehling reactor) but its content is insignificant compared to the glucose and fructose content. To determine the glucose and fructose content (to a specific degree) in sugary materials, the Fehling method is applied by titration . From here on, and in accordance to the sugar industry argot, when mentioning reducing sugars or RS, it will be in reference to glucose and fructose.
Figure 4. Fehling reaction Reducing sugars, “RS” do not cristalize, therefore if the purity of the juice (pol/brix relationship) going into the mill is low, then this will be a preliminary indicator of a major presence of RS in the material. This will also mean a higher volume of syrups to be handled, more recirculation, and in consequence, more difficulty saccharose recovery.
308
Pigments and Color Precursors The pigments present in sugarcane are attributed to phenols and polyphenols (among them, flavonoids). Proteins also act as color precursors. Their primary amino groups (RNH2) react with the glucose (non-enzymatic glication) to develop a series of complex reactions (Maillard reaction). These, in turn, generate a brownish appearance in the crystal and in the third massecuites. Polymerized Sugars Polymerized sugars are more or less long chains generated by the bonding of many units of monosaccharides. Starch is a polymer made up of straight chains of glucose joined together consecutively in positions 1-4; it is synthesized by the plant itself and its content will depend on various agricultural aspects of the crop; starch can appear in the finished product and is troublesome for industrial applications, especially in beverage factories, because it gives products an undesireable appearance. Dextrans are polymers that negatively affect the process. They are made up of straight chains of glucose joined together in positions 1-6 that ramify into eventual bonds at 1-3. In considerable concentrations, they add viscosity to the material and this, in turn, causes problems during crystallization, centrifuging and in the quality of the finished product. Dextrans are not synthesized within the sugarcane in the field; they are brought about by the microbian action after the plant is cut and throughout all of the agroindustrial process. The generation of dextrans can be prevented with a series of good practices such as: a reduction in the time between the burning of the crop and its entry to the mill, and adequate handling of the sugarcane in the receiving yard, sanitizing of the grinding mills and at critical points throughout the process.
RECEPTION AND HANDLING OF THE SUGARCANE IN THE RECEIVING YARD
The industrial process begins when the sugarcane is received in the yard. We can identify two sub-processes that intervene here: a) Weighing: The gross weight of the transportation unit is determined here
(weight of the truck and of the hauling bins that contain the sugarcane) to which the tare weight of the truck and the empty bin is subtracted.
b) Sampling and analysis: The frequency and the units that must go to the
sampling area of the sugarcane laboratory are determined and set in the scale
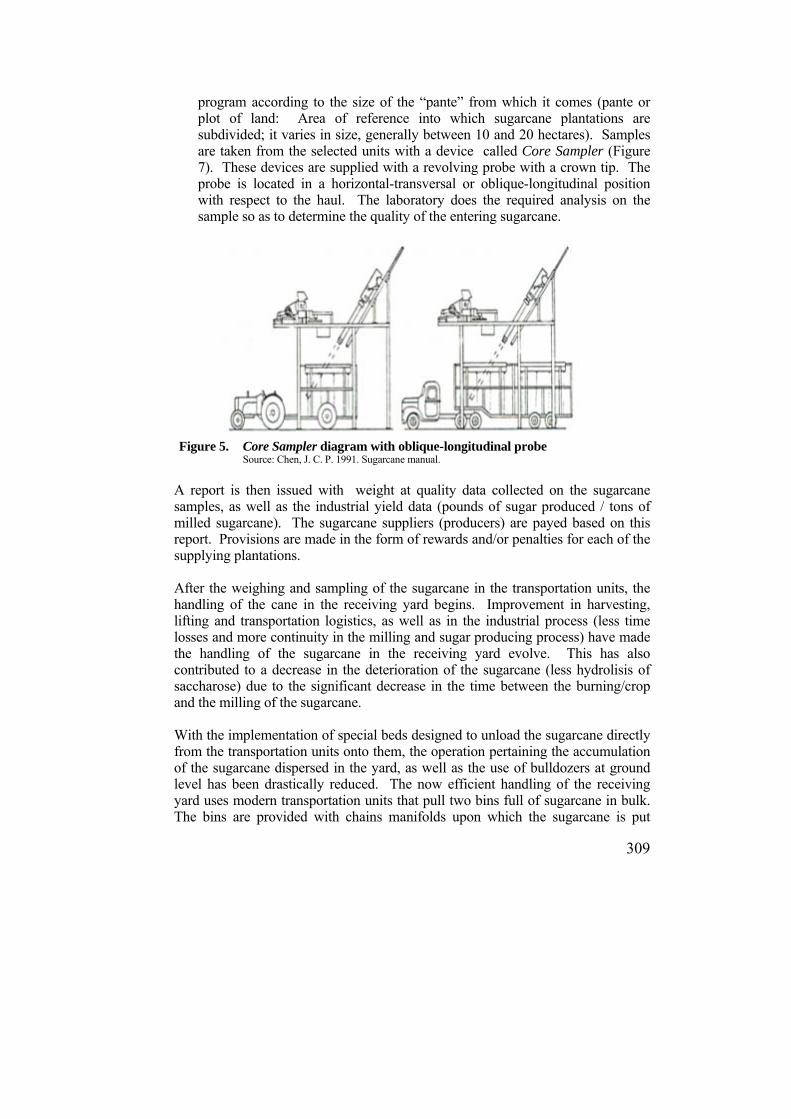
309
program according to the size of the “pante” from which it comes (pante or plot of land: Area of reference into which sugarcane plantations are subdivided; it varies in size, generally between 10 and 20 hectares). Samples are taken from the selected units with a device called Core Sampler (Figure 7). These devices are supplied with a revolving probe with a crown tip. The probe is located in a horizontal-transversal or oblique-longitudinal position with respect to the haul. The laboratory does the required analysis on the sample so as to determine the quality of the entering sugarcane.
Figure 5. Core Sampler diagram with oblique-longitudinal probe
Source: Chen, J. C. P. 1991. Sugarcane manual.
A report is then issued with weight at quality data collected on the sugarcane samples, as well as the industrial yield data (pounds of sugar produced / tons of milled sugarcane). The sugarcane suppliers (producers) are payed based on this report. Provisions are made in the form of rewards and/or penalties for each of the supplying plantations. After the weighing and sampling of the sugarcane in the transportation units, the handling of the cane in the receiving yard begins. Improvement in harvesting, lifting and transportation logistics, as well as in the industrial process (less time losses and more continuity in the milling and sugar producing process) have made the handling of the sugarcane in the receiving yard evolve. This has also contributed to a decrease in the deterioration of the sugarcane (less hydrolisis of saccharose) due to the significant decrease in the time between the burning/crop and the milling of the sugarcane. With the implementation of special beds designed to unload the sugarcane directly from the transportation units onto them, the operation pertaining the accumulation of the sugarcane dispersed in the yard, as well as the use of bulldozers at ground level has been drastically reduced. The now efficient handling of the receiving yard uses modern transportation units that pull two bins full of sugarcane in bulk. The bins are provided with chains manifolds upon which the sugarcane is put
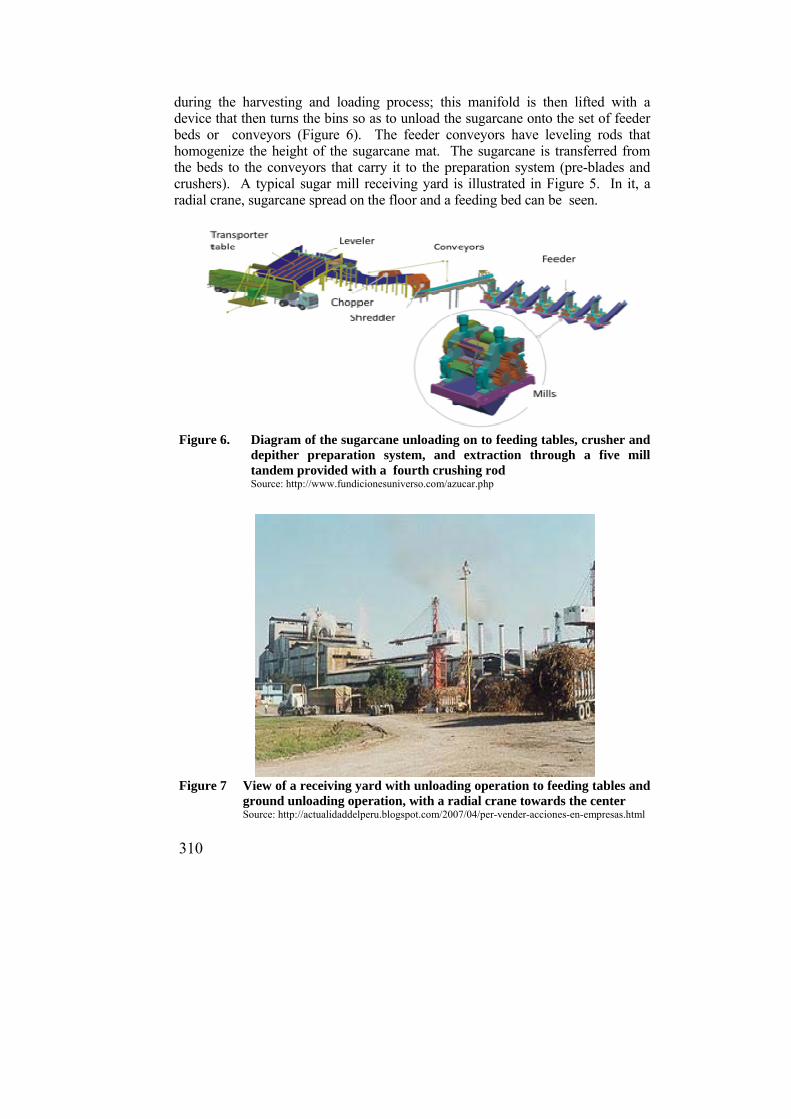
310
during the harvesting and loading process; this manifold is then lifted with a device that then turns the bins so as to unload the sugarcane onto the set of feeder beds or conveyors (Figure 6). The feeder conveyors have leveling rods that homogenize the height of the sugarcane mat. The sugarcane is transferred from the beds to the conveyors that carry it to the preparation system (pre-blades and crushers). A typical sugar mill receiving yard is illustrated in Figure 5. In it, a radial crane, sugarcane spread on the floor and a feeding bed can be seen.
Figure 6. Diagram of the sugarcane unloading on to feeding tables, crusher and
depither preparation system, and extraction through a five mill tandem provided with a fourth crushing rod Source: http://www.fundicionesuniverso.com/azucar.php
Figure 7 View of a receiving yard with unloading operation to feeding tables and
ground unloading operation, with a radial crane towards the center Source: http://actualidaddelperu.blogspot.com/2007/04/per-vender-acciones-en-empresas.html
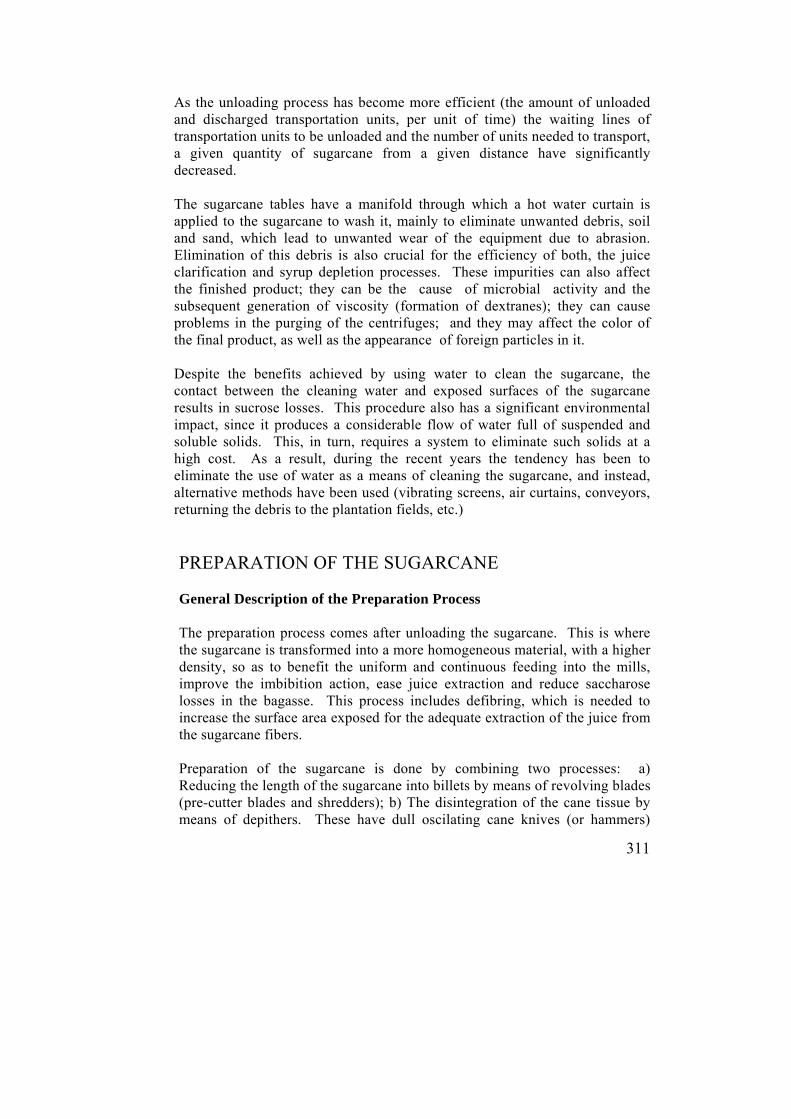
311
As the unloading process has become more efficient (the amount of unloaded and discharged transportation units, per unit of time) the waiting lines of transportation units to be unloaded and the number of units needed to transport, a given quantity of sugarcane from a given distance have significantly decreased. The sugarcane tables have a manifold through which a hot water curtain is applied to the sugarcane to wash it, mainly to eliminate unwanted debris, soil and sand, which lead to unwanted wear of the equipment due to abrasion. Elimination of this debris is also crucial for the efficiency of both, the juice clarification and syrup depletion processes. These impurities can also affect the finished product; they can be the cause of microbial activity and the subsequent generation of viscosity (formation of dextranes); they can cause problems in the purging of the centrifuges; and they may affect the color of the final product, as well as the appearance of foreign particles in it. Despite the benefits achieved by using water to clean the sugarcane, the contact between the cleaning water and exposed surfaces of the sugarcane results in sucrose losses. This procedure also has a significant environmental impact, since it produces a considerable flow of water full of suspended and soluble solids. This, in turn, requires a system to eliminate such solids at a high cost. As a result, during the recent years the tendency has been to eliminate the use of water as a means of cleaning the sugarcane, and instead, alternative methods have been used (vibrating screens, air curtains, conveyors, returning the debris to the plantation fields, etc.)
PREPARATION OF THE SUGARCANE General Description of the Preparation Process
The preparation process comes after unloading the sugarcane. This is where the sugarcane is transformed into a more homogeneous material, with a higher density, so as to benefit the uniform and continuous feeding into the mills, improve the imbibition action, ease juice extraction and reduce saccharose losses in the bagasse. This process includes defibring, which is needed to increase the surface area exposed for the adequate extraction of the juice from the sugarcane fibers. Preparation of the sugarcane is done by combining two processes: a) Reducing the length of the sugarcane into billets by means of revolving blades (pre-cutter blades and shredders); b) The disintegration of the cane tissue by means of depithers. These have dull oscilating cane knives (or hammers)
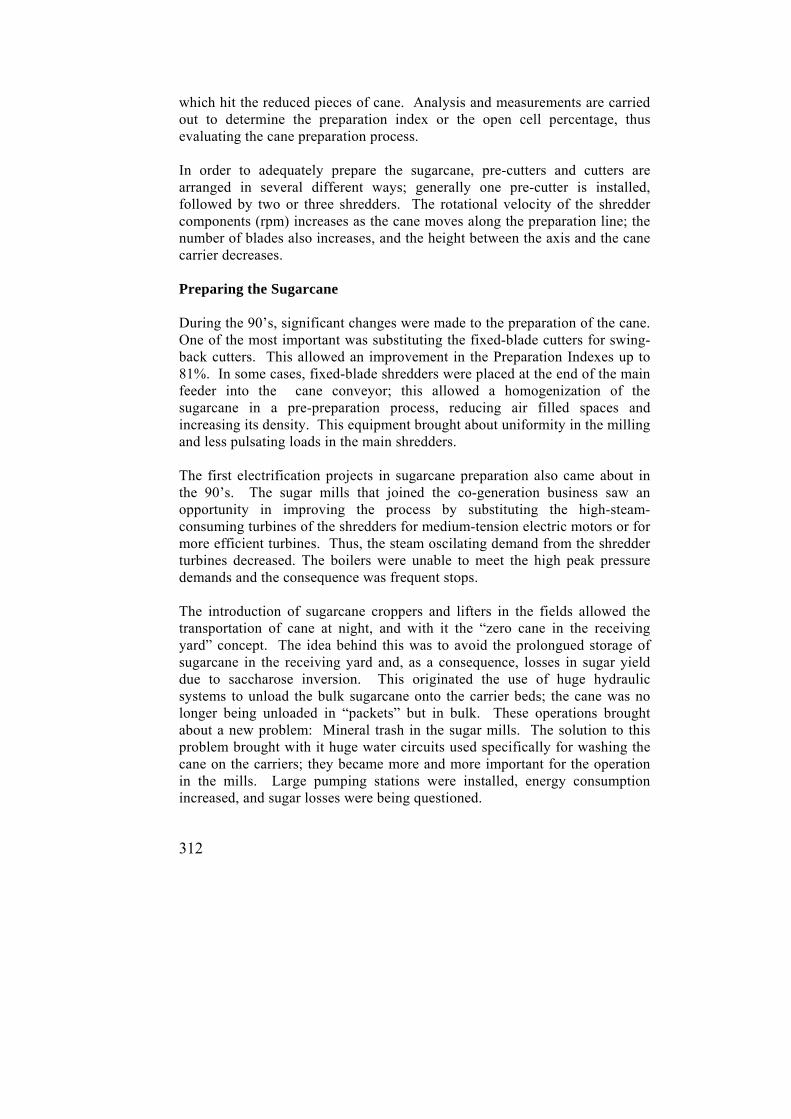
312
which hit the reduced pieces of cane. Analysis and measurements are carried out to determine the preparation index or the open cell percentage, thus evaluating the cane preparation process. In order to adequately prepare the sugarcane, pre-cutters and cutters are arranged in several different ways; generally one pre-cutter is installed, followed by two or three shredders. The rotational velocity of the shredder components (rpm) increases as the cane moves along the preparation line; the number of blades also increases, and the height between the axis and the cane carrier decreases. Preparing the Sugarcane During the 90’s, significant changes were made to the preparation of the cane. One of the most important was substituting the fixed-blade cutters for swing-back cutters. This allowed an improvement in the Preparation Indexes up to 81%. In some cases, fixed-blade shredders were placed at the end of the main feeder into the cane conveyor; this allowed a homogenization of the sugarcane in a pre-preparation process, reducing air filled spaces and increasing its density. This equipment brought about uniformity in the milling and less pulsating loads in the main shredders. The first electrification projects in sugarcane preparation also came about in the 90’s. The sugar mills that joined the co-generation business saw an opportunity in improving the process by substituting the high-steam-consuming turbines of the shredders for medium-tension electric motors or for more efficient turbines. Thus, the steam oscilating demand from the shredder turbines decreased. The boilers were unable to meet the high peak pressure demands and the consequence was frequent stops. The introduction of sugarcane croppers and lifters in the fields allowed the transportation of cane at night, and with it the “zero cane in the receiving yard” concept. The idea behind this was to avoid the prolongued storage of sugarcane in the receiving yard and, as a consequence, losses in sugar yield due to saccharose inversion. This originated the use of huge hydraulic systems to unload the bulk sugarcane onto the carrier beds; the cane was no longer being unloaded in “packets” but in bulk. These operations brought about a new problem: Mineral trash in the sugar mills. The solution to this problem brought with it huge water circuits used specifically for washing the cane on the carriers; they became more and more important for the operation in the mills. Large pumping stations were installed, energy consumption increased, and sugar losses were being questioned.

313
As sugar mills grew so did the amount of sugarcane being processed, and so, in some cases, another sugarcane preparation line became necessary. Improvements made during the previous decades are taken into account when implementing expansions. One of the main implementations to take place during the first decade of the new millennium was the introduction of the horizontal depither manufactured by Copersucar. It consists of a rotor feeder, oscilating hammer depither, which makes the cane go through a screening wall, decreasing the exiting area and therefore separating the fibers. Preparation indexes of up to 91% have been obtained with this type of depither. An oscilating shredder is installed before the depither in this arrangement in order to level out the cane. The output of prepared sugarcane from this system falls as a shallow mat onto a conveyor belt with enough speed to allow the removal of metals in the shredded cane with a magnet. There are high-horsepower depithers dedicated solely to substituting shredders arranged in sequence. Equipment such as this requires horsepower of up to 6,000 HP and 850 rpm. Currently, some mills have begun using dry cleaning. A system like this eliminates the use of water as a means of washing the cane altogether. It consists of a kicker at the end of the first carrier; its function is to shake the cane and make it fall onto a roller bed with discs separated in such a way as to form a sieve. A system like this is able to collect between 1.6 and 3% in trash (both vegetable and mineral) of the cane milled per day.
SUGARCANE MILLING General Description of the Milling Process The prepared sucarcane is fed to the milling tandem, where the juice extraction is verified by the mechanical action of the mills, and by the physical-chemical action of the compound imbibition process. The milling tandem is positioned in four roll arrangements: Cane roll, top roll, bagasse roll and fourth roll. Including the fourth roll in the milling arrangement (Figure 8) integrates the Donnelly feeders (“chute”) into the system. These feeders allow the bypass of any mill component that might need maintenance. With a vertical feeder a mat of depithed cane is formed (in the first mill) or milled cane (from the second to the last mill) in the box that feeds it to the opening between the top and the fourth roll. The height of this mat (known as just height or chute level) is used to control the feed into the mill and the flotation of the top roll. (Flotation: Height to which the top roll rises in counterflow to the 3000-3500 psig exerted by the hydraulic heads.) Flotation

314
should be between 5/8” and 3/4”. The feeder control, the chute level and the flotation of the top roll is attained by varying the rotational speed of said roll.
Figure 8. Roll disposition in a mill with vertical feed.
Source: http://www.scielo.org.ve/scielo.php?pid=S0254-07702005000300006&script=sci_arttext
Co-generating sugar mills have substituted steam powered turbines with electric and/or hydraulic motors because they are much more efficient at converting high pressure steam into an electric current in the turbogenerator that will be transmitted through conductors to the electric motors, as opposed to the transmission of steam from the boiler to the steam turbine in the mill. The compound imbibition process (the most widely used in Guatemala) consists of applying 70°C - 75°C hot water to the bagasse which feeds the last mill. The juice extracted in the last mill is applied to the bagasse that feeds the next to last mill and so on, until reaching the second mill. A diagram of the compound imbibitions process is illustrated in Figure 9.
Figure 9. Compound imbibition diagram
Source: Chen, J. C. P. 1991. “Manual del azúcar de caña” [Sugarcane manual].
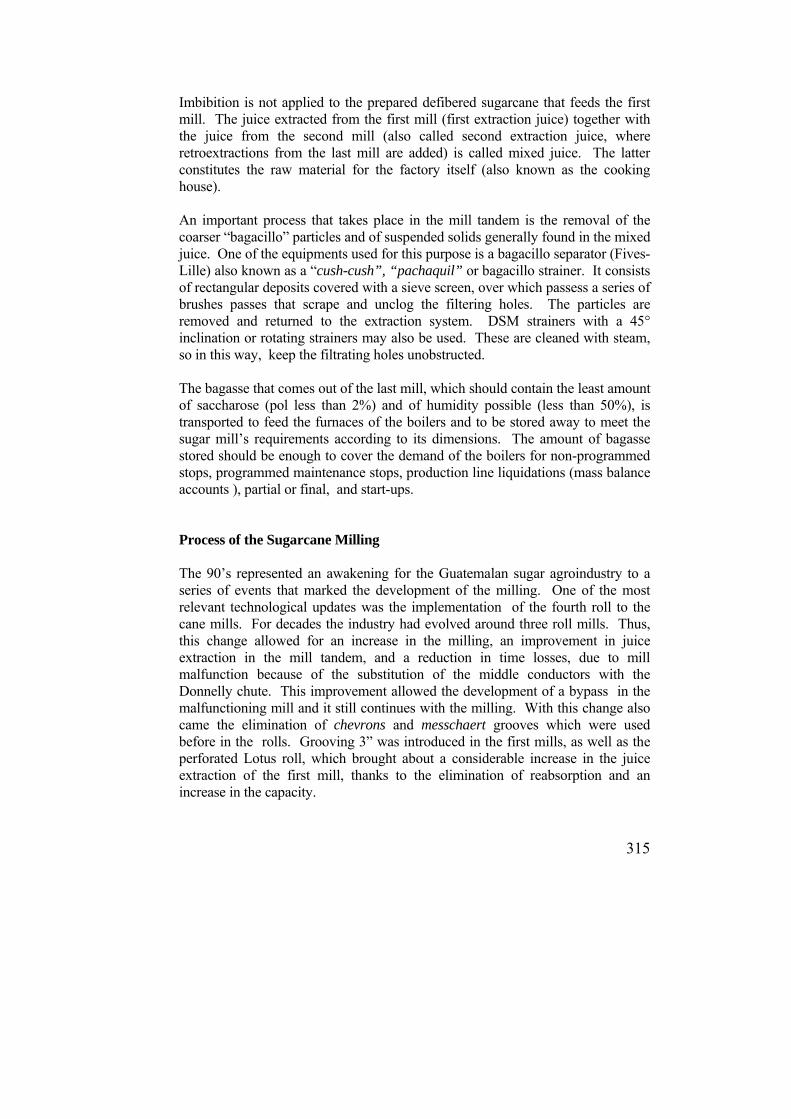
315
Imbibition is not applied to the prepared defibered sugarcane that feeds the first mill. The juice extracted from the first mill (first extraction juice) together with the juice from the second mill (also called second extraction juice, where retroextractions from the last mill are added) is called mixed juice. The latter constitutes the raw material for the factory itself (also known as the cooking house). An important process that takes place in the mill tandem is the removal of the coarser “bagacillo” particles and of suspended solids generally found in the mixed juice. One of the equipments used for this purpose is a bagacillo separator (Fives-Lille) also known as a “cush-cush”, “pachaquil” or bagacillo strainer. It consists of rectangular deposits covered with a sieve screen, over which passess a series of brushes passes that scrape and unclog the filtering holes. The particles are removed and returned to the extraction system. DSM strainers with a 45° inclination or rotating strainers may also be used. These are cleaned with steam, so in this way, keep the filtrating holes unobstructed. The bagasse that comes out of the last mill, which should contain the least amount of saccharose (pol less than 2%) and of humidity possible (less than 50%), is transported to feed the furnaces of the boilers and to be stored away to meet the sugar mill’s requirements according to its dimensions. The amount of bagasse stored should be enough to cover the demand of the boilers for non-programmed stops, programmed maintenance stops, production line liquidations (mass balance accounts ), partial or final, and start-ups. Process of the Sugarcane Milling The 90’s represented an awakening for the Guatemalan sugar agroindustry to a series of events that marked the development of the milling. One of the most relevant technological updates was the implementation of the fourth roll to the cane mills. For decades the industry had evolved around three roll mills. Thus, this change allowed for an increase in the milling, an improvement in juice extraction in the mill tandem, and a reduction in time losses, due to mill malfunction because of the substitution of the middle conductors with the Donnelly chute. This improvement allowed the development of a bypass in the malfunctioning mill and it still continues with the milling. With this change also came the elimination of chevrons and messchaert grooves which were used before in the rolls. Grooving 3” was introduced in the first mills, as well as the perforated Lotus roll, which brought about a considerable increase in the juice extraction of the first mill, thanks to the elimination of reabsorption and an increase in the capacity.
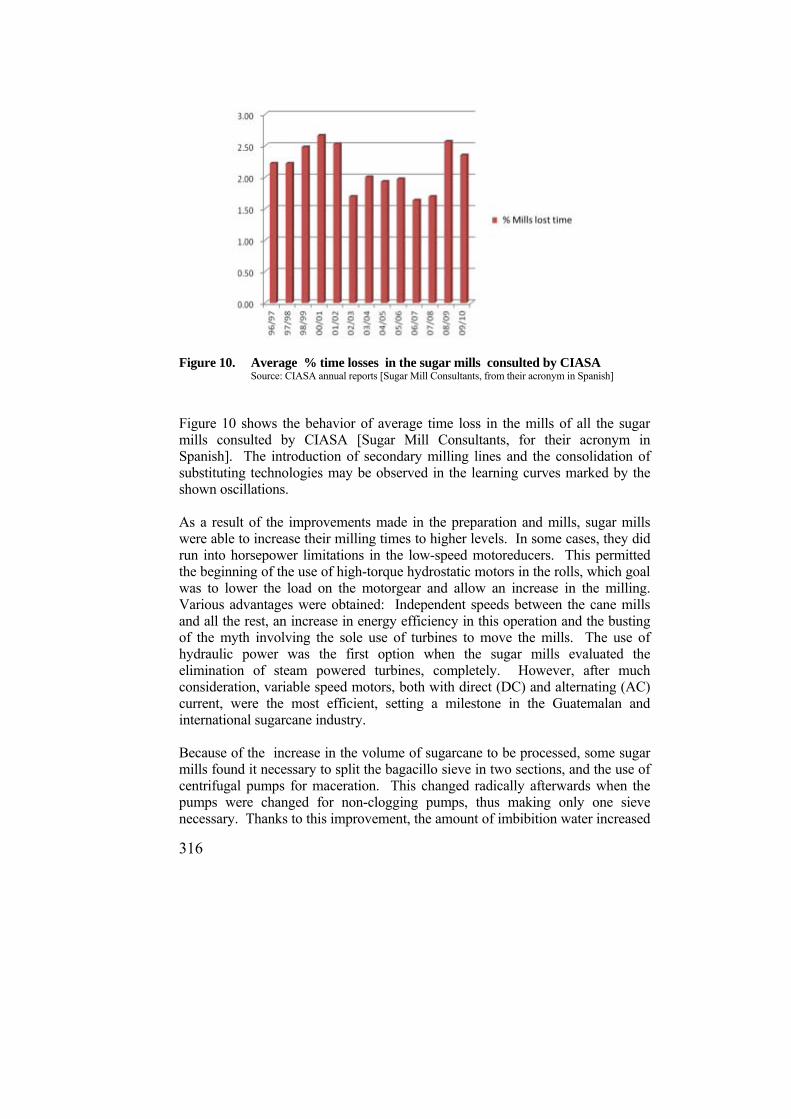
316
Figure 10. Average % time losses in the sugar mills consulted by CIASA
Source: CIASA annual reports [Sugar Mill Consultants, from their acronym in Spanish]
Figure 10 shows the behavior of average time loss in the mills of all the sugar mills consulted by CIASA [Sugar Mill Consultants, for their acronym in Spanish]. The introduction of secondary milling lines and the consolidation of substituting technologies may be observed in the learning curves marked by the shown oscillations. As a result of the improvements made in the preparation and mills, sugar mills were able to increase their milling times to higher levels. In some cases, they did run into horsepower limitations in the low-speed motoreducers. This permitted the beginning of the use of high-torque hydrostatic motors in the rolls, which goal was to lower the load on the motorgear and allow an increase in the milling. Various advantages were obtained: Independent speeds between the cane mills and all the rest, an increase in energy efficiency in this operation and the busting of the myth involving the sole use of turbines to move the mills. The use of hydraulic power was the first option when the sugar mills evaluated the elimination of steam powered turbines, completely. However, after much consideration, variable speed motors, both with direct (DC) and alternating (AC) current, were the most efficient, setting a milestone in the Guatemalan and international sugarcane industry. Because of the increase in the volume of sugarcane to be processed, some sugar mills found it necessary to split the bagacillo sieve in two sections, and the use of centrifugal pumps for maceration. This changed radically afterwards when the pumps were changed for non-clogging pumps, thus making only one sieve necessary. Thanks to this improvement, the amount of imbibition water increased
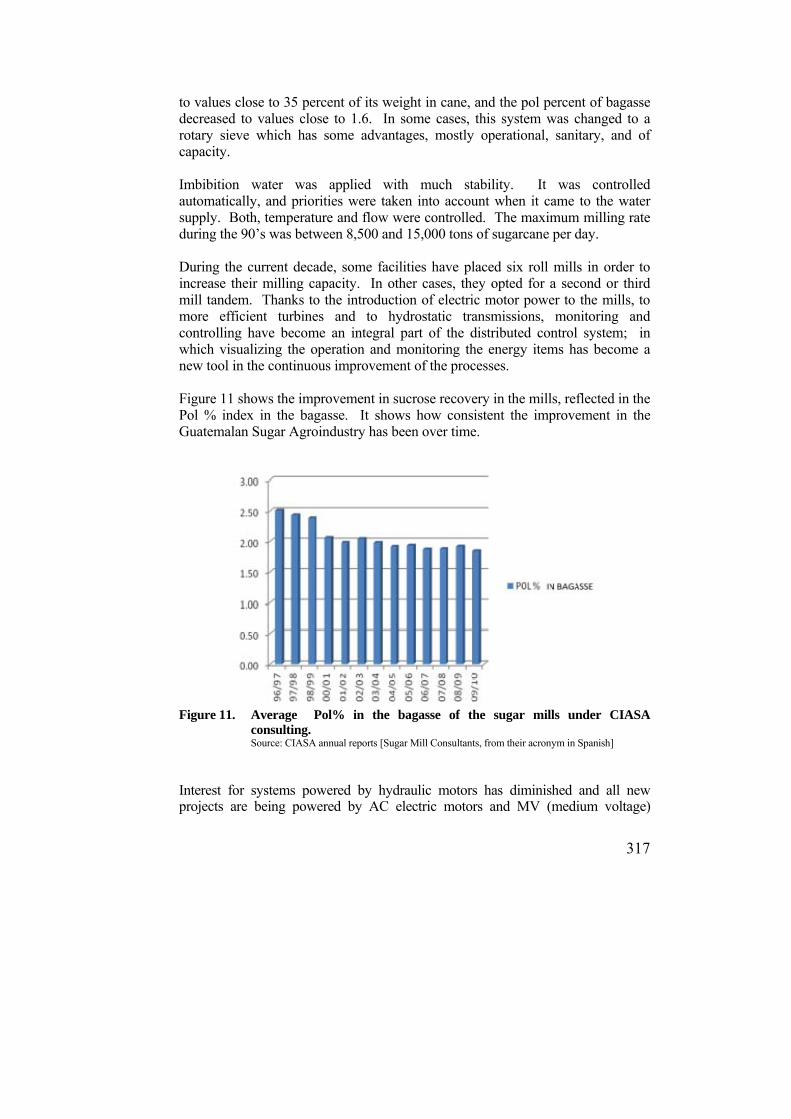
317
to values close to 35 percent of its weight in cane, and the pol percent of bagasse decreased to values close to 1.6. In some cases, this system was changed to a rotary sieve which has some advantages, mostly operational, sanitary, and of capacity. Imbibition water was applied with much stability. It was controlled automatically, and priorities were taken into account when it came to the water supply. Both, temperature and flow were controlled. The maximum milling rate during the 90’s was between 8,500 and 15,000 tons of sugarcane per day. During the current decade, some facilities have placed six roll mills in order to increase their milling capacity. In other cases, they opted for a second or third mill tandem. Thanks to the introduction of electric motor power to the mills, to more efficient turbines and to hydrostatic transmissions, monitoring and controlling have become an integral part of the distributed control system; in which visualizing the operation and monitoring the energy items has become a new tool in the continuous improvement of the processes. Figure 11 shows the improvement in sucrose recovery in the mills, reflected in the Pol % index in the bagasse. It shows how consistent the improvement in the Guatemalan Sugar Agroindustry has been over time.
Figure 11. Average Pol% in the bagasse of the sugar mills under CIASA
consulting. Source: CIASA annual reports [Sugar Mill Consultants, from their acronym in Spanish]
Interest for systems powered by hydraulic motors has diminished and all new projects are being powered by AC electric motors and MV (medium voltage)
318
variable speed systems. Usage of steam powered turbines is no longer considered in new projects, nowadays. Usage of flexible couplings or torque converters substituting bar couplings began. This technology helps to correct misalignment. Its major benefits are: Low maintenance, less energy losses and they offer protection to the motoreducers. There is an advanced regulatory control that may directly influence the milling speed; it has the capacity to adapt to the previous and posterior processes to minimize losses. Donnelly chute´s levels, milling speeds, flow, and temperatures of the imbibition water and energy consumption of the whole operation are indicated with better accuracy. The milling rates for this decade reported were between 15,000 and 30,000 tons of cane per day. STEAM POWER AND ELECTRIC POWER GENERATION Bagasse (a sub-product of the process) is used as fuel. It feeds the furnaces of water-tube boilers for the generation of high pressure superheated steam. This steam is utilized to move the steam powered turbines in mills and in electric power turbogenerators. Depending on the design of the turbines and turbogenerators, the generated high pressure steam may be between 200 and 1500 psig. After the high pressure steam has given its energy to the turbines (either from the mills and/or from the turbogenerators) the exhausted steam, which has a pressure of 20-25 psig, is used for the processes involved in the production of sugar and Ethanol in adjacent distilleries. Figure 12 shows a diagram illustrating the steam cycle at counterpressure, applied to a sugar mill.
Figure 12. Diagram of the steam generation cycle at counter pressure
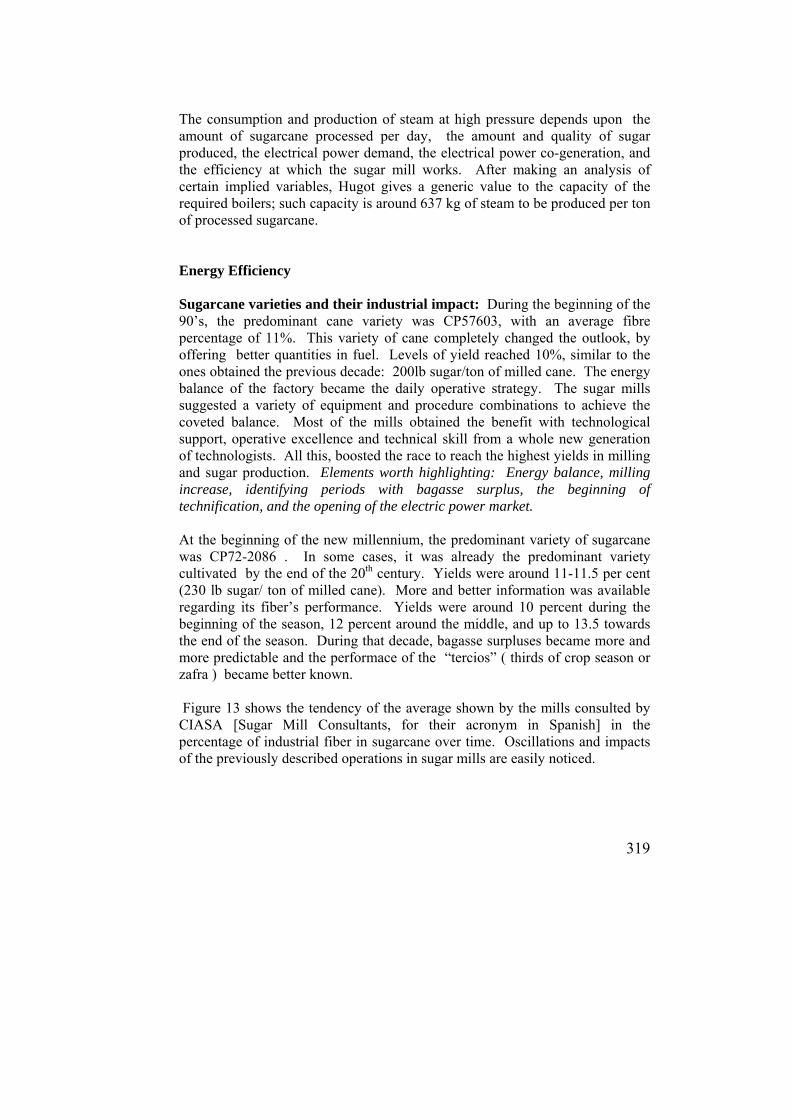
319
The consumption and production of steam at high pressure depends upon the amount of sugarcane processed per day, the amount and quality of sugar produced, the electrical power demand, the electrical power co-generation, and the efficiency at which the sugar mill works. After making an analysis of certain implied variables, Hugot gives a generic value to the capacity of the required boilers; such capacity is around 637 kg of steam to be produced per ton of processed sugarcane. Energy Efficiency Sugarcane varieties and their industrial impact: During the beginning of the 90’s, the predominant cane variety was CP57603, with an average fibre percentage of 11%. This variety of cane completely changed the outlook, by offering better quantities in fuel. Levels of yield reached 10%, similar to the ones obtained the previous decade: 200lb sugar/ton of milled cane. The energy balance of the factory became the daily operative strategy. The sugar mills suggested a variety of equipment and procedure combinations to achieve the coveted balance. Most of the mills obtained the benefit with technological support, operative excellence and technical skill from a whole new generation of technologists. All this, boosted the race to reach the highest yields in milling and sugar production. Elements worth highlighting: Energy balance, milling increase, identifying periods with bagasse surplus, the beginning of technification, and the opening of the electric power market. At the beginning of the new millennium, the predominant variety of sugarcane was CP72-2086 . In some cases, it was already the predominant variety cultivated by the end of the 20th century. Yields were around 11-11.5 per cent (230 lb sugar/ ton of milled cane). More and better information was available regarding its fiber’s performance. Yields were around 10 percent during the beginning of the season, 12 percent around the middle, and up to 13.5 towards the end of the season. During that decade, bagasse surpluses became more and more predictable and the performace of the “tercios” ( thirds of crop season or zafra ) became better known. Figure 13 shows the tendency of the average shown by the mills consulted by CIASA [Sugar Mill Consultants, for their acronym in Spanish] in the percentage of industrial fiber in sugarcane over time. Oscillations and impacts of the previously described operations in sugar mills are easily noticed.
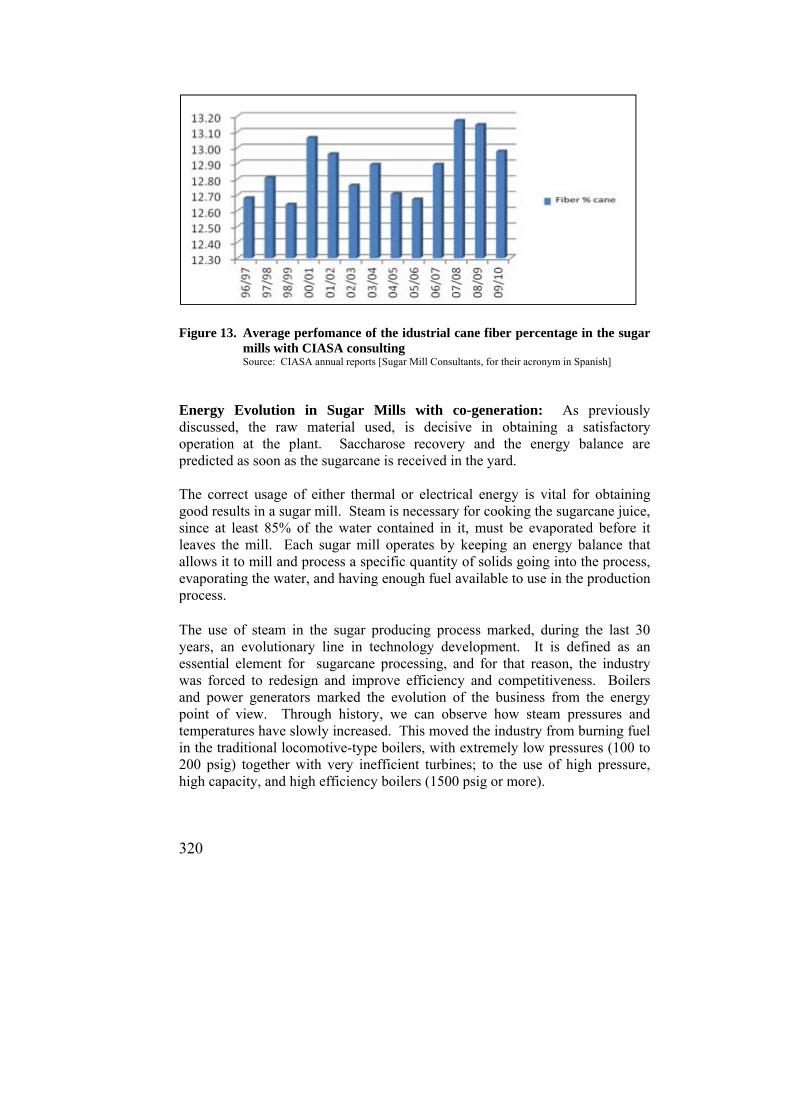
320
Figure 13. Average perfomance of the idustrial cane fiber percentage in the sugar
mills with CIASA consulting Source: CIASA annual reports [Sugar Mill Consultants, for their acronym in Spanish]
Energy Evolution in Sugar Mills with co-generation: As previously discussed, the raw material used, is decisive in obtaining a satisfactory operation at the plant. Saccharose recovery and the energy balance are predicted as soon as the sugarcane is received in the yard. The correct usage of either thermal or electrical energy is vital for obtaining good results in a sugar mill. Steam is necessary for cooking the sugarcane juice, since at least 85% of the water contained in it, must be evaporated before it leaves the mill. Each sugar mill operates by keeping an energy balance that allows it to mill and process a specific quantity of solids going into the process, evaporating the water, and having enough fuel available to use in the production process. The use of steam in the sugar producing process marked, during the last 30 years, an evolutionary line in technology development. It is defined as an essential element for sugarcane processing, and for that reason, the industry was forced to redesign and improve efficiency and competitiveness. Boilers and power generators marked the evolution of the business from the energy point of view. Through history, we can observe how steam pressures and temperatures have slowly increased. This moved the industry from burning fuel in the traditional locomotive-type boilers, with extremely low pressures (100 to 200 psig) together with very inefficient turbines; to the use of high pressure, high capacity, and high efficiency boilers (1500 psig or more).
321
The power generating systems used during the nineties were formed by many small turbines with capacities ranging from 350 kW to some 850 kW, with specific consumptions of 35 to 45 lb/kW. As the slowly growth was happening, it was necessary for them to work in synchronization in order to withstand the electric load required by the factories. Even though some of the machinery used was in good operating condition, much of the ancilliary equipment dated back to the first half of the 20th century (1935-1950). The energy usage of these machines was very high, though they were extremely versatile in their operation. Many of the interconnections from the sugar mills to the Guatemalan Electric Company [EEGSA, from the acronym in Spanish] were done in 13.8 kV lines, mainly to help in their start-ups and to maintain the operations keep going during the off-season. In the factory, steam consumption concentrated mainly on the triple and quadruple-effect evaporators. The direct usage of steam within the factory was commonplace. Outlet steam was the main source of energy for all the unit operations in the factory. Steam consumption per ton of sugarcane exceeded 1,500 to 1,800 lb/TC. From the energy standpoint, a new era began with the new millennium. A new market opened up with the first private contracts between the Guatemalan Electric Company (EEGSA) and the sugar mills. Finally, the existing monopoly in the power generating business brokedown with the new “Law of Electricity” (Decree Number 93-96), which allowed the introduction of private power generators into the national network. With this new horizon on line, sugar mills had to adapt their factories to change the existing operation philosophies to the most important one from that moment on: Work all throughout harvest time linked to the national electric power network. During this stage, sugar mills looked after energy efficiency within the sugar mills. Its main goals were: To assure the bagasse surplus all throughout harvest time, and to sell electric energy by means of a new concept called Co-generation. This new definition linked the sale of electric energy with sugar production. The main improvements in many of the sugar mills were: a) changing the steam-powered turbines to electric motors to drive the cane shredders, pumps, and large sized fans; b) arrangements of triple and quadruple effect evaporators to quintuple effect evaporators; c) use of pre-heaters for the alkalized and clarified cane juice; d) usage of low pressure steam for the massecuite, as well as other particular to each sugar mill. All of these improvements, together with the arrangements that permitted energy savings within the sugar mills, allowed sustainable bagasse surpluses. These surpluses appeared to be consistently higher every harvest. Even though, the
322
management of bagasse became more complex, its value as potential fuel commodity became increasingly evident. As a result of this apparent problem, there was an “awakening” of a secondary bagasse market. Sugar mills which had improved their steam consuming efficiency and had no capacity to burn it for co-generation began to sell their surpluses of bagasse to other sugar mills that did have the capacity to do it. From this period on, bagasse obtained an economic value per ton. Its heat value was the reference for its price in an emerging market. Some of the sugar mills that visualized the newly created country’s incentive, by promoting cheaper electric power generation, they proceeded to install redesigned or modified boilers. Most of the equipment was modified to work at higher pressures in revamped preexisting equipment or in completely renewed facilities. This broke the old myth created by the sugar mill idiosincracy: Sugar mills cannot work at a pressure above 200 psig. The learning curve was complex, and the experience attained was varied, yet it brought the guild together; they decided to share their experiences and advance as a group. A large part of this growth was supported with generating equipment with higher efficiency and capacity than the one used in the previous decade. Typically, the capacities found in these projects were: 400 psig (635°F) or 600 psig (750°F) boilers, with steam production around 125,000 to 150,000 lb/hr; generators were around 1.5 to 7.5 MW, with consumptions in the range of 20 to 30 lb/kWh. By the end of the decade, the concept of a thermal plant began to emerge. These types of facilities brought about a combination between generation and co-generation, and they broke another paradigm: Operating during the off-season to sell electrical energy. They began to install and operate condensing-type thermal plants, all of them generating between 20 and 35 MW. The combined burning of bagasse-petroleum fuel (Bunker C or Fuel Oil No.6) in their boilers is emphasized. Efficiencies within the thermal plants were forced to improve since the new business demanded strict control of operative costs. Usage of petroleum fuel and its financial impact made management focus its attention toward a new form of administration, to insert an unknown, management structure, until then. Figure 14 shows the fuel oil consumption during the different seasons; as a worthy group´s effort to use bagasse instead of fossil fuel. Almost all of the sugar mills belonging negotiated direct individual contracts with the Guatemalan Electric Company (EEGSA). These thermal plants emerged with average capacities between 250,000 and 325,000 lb/hr, and used “condensing” type generators of 20 to 35 MW with consumptions in the range of 9.6 to 10.5 lb/kWh. All of these were connected to the national electrical network with lines of 69kV, and parallel to this, a growth of equipment for co-generation with available capacities of 10 to 20 MW, specific consumptions of 16.5 to 18.0 lb/kWh.
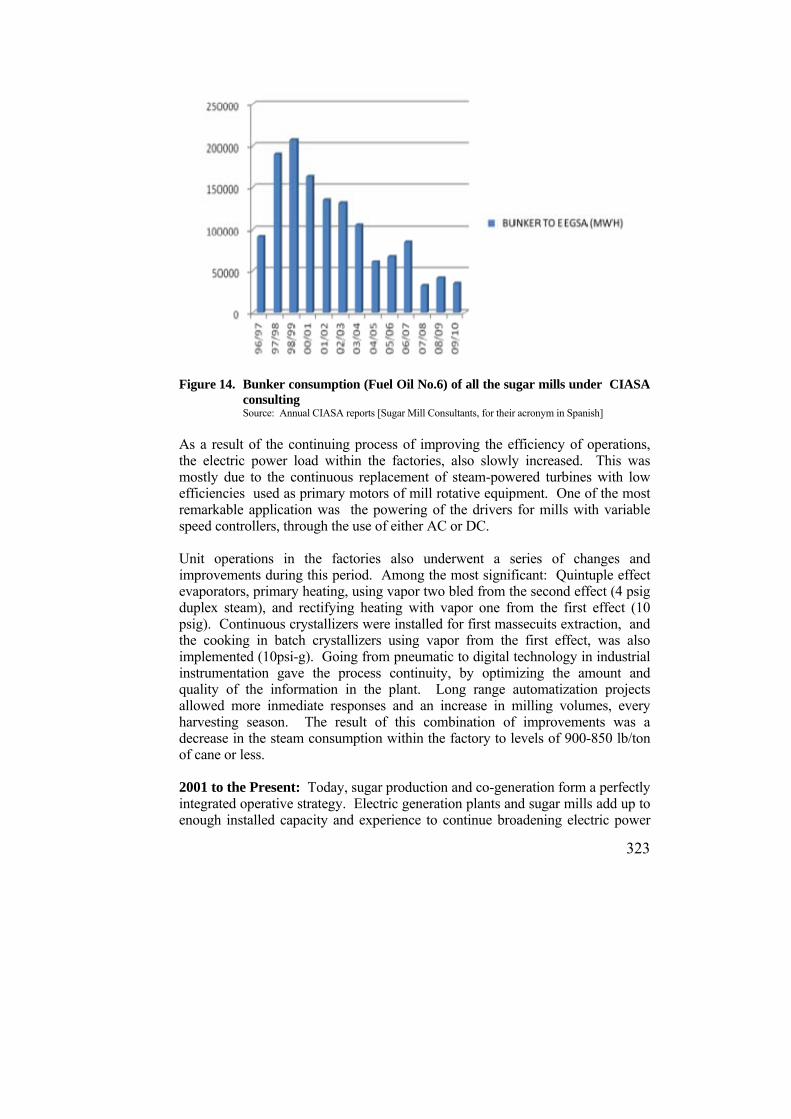
323
Figure 14. Bunker consumption (Fuel Oil No.6) of all the sugar mills under CIASA
consulting Source: Annual CIASA reports [Sugar Mill Consultants, for their acronym in Spanish]
As a result of the continuing process of improving the efficiency of operations, the electric power load within the factories, also slowly increased. This was mostly due to the continuous replacement of steam-powered turbines with low efficiencies used as primary motors of mill rotative equipment. One of the most remarkable application was the powering of the drivers for mills with variable speed controllers, through the use of either AC or DC. Unit operations in the factories also underwent a series of changes and improvements during this period. Among the most significant: Quintuple effect evaporators, primary heating, using vapor two bled from the second effect (4 psig duplex steam), and rectifying heating with vapor one from the first effect (10 psig). Continuous crystallizers were installed for first massecuits extraction, and the cooking in batch crystallizers using vapor from the first effect, was also implemented (10psi-g). Going from pneumatic to digital technology in industrial instrumentation gave the process continuity, by optimizing the amount and quality of the information in the plant. Long range automatization projects allowed more inmediate responses and an increase in milling volumes, every harvesting season. The result of this combination of improvements was a decrease in the steam consumption within the factory to levels of 900-850 lb/ton of cane or less. 2001 to the Present: Today, sugar production and co-generation form a perfectly integrated operative strategy. Electric generation plants and sugar mills add up to enough installed capacity and experience to continue broadening electric power

324
operations. In the last 10 years, most of the electricity production contracts, have either expired or are about to expire. The new electric power generation expansions were inserted as energy blocks into the opportunity market with an interesting and challenging dynamism for the electric sector. During these years, sugar factories and electric power plants absorbed the growth of the sugar mills, especially when dealing with the cane milling and sugar production. High volumes of bagasse were burned in the thermal plants with excellent efficiency levels. Thermal plants were adapted to market demands by increasing equipment efficiencies and capacities. Old boilers were replaced by the new ones, specifically designed for the burning of bagasse, yielding higher operation pressures. Latest generation generators were bought, increasing the production of kWh for every ton of bagasse burned in the boilers. Typical equipments from this decade are: Boilers with a steam production of 350,000 to 450,000 lb/hr at pressures of 1500 psig at 950°F, 35 to 60 MW, condensing type and dual casing electric generators, connected to the national energy network with 230 kV lines. Continuous improvement in the consumption of steam in sugar production plants was achieved through the application of new engineering technology. Among them it can be found: Continuous crystallizers for all massecuites, usage of first and second effect bled steam in operating crystallizers, and heat exchangers, pre-heating of the juice and syrups, etc. All of this, added to the integrated operations and businesses to the sugar mill, as sugar and bioethanol refineries. Figure 15 shows the installed milling potential and processing in the factories of all the sugar mills in Guatemala.
Figure 15. Installed capacity per year for the whole sugar industry in Guatemala
Source: ASAZGUA annual report.
Figure 16 shows one of the most used indicators in the co-generation sector (bagasse generated KW/TC total) in order to know the energy sold per ton of
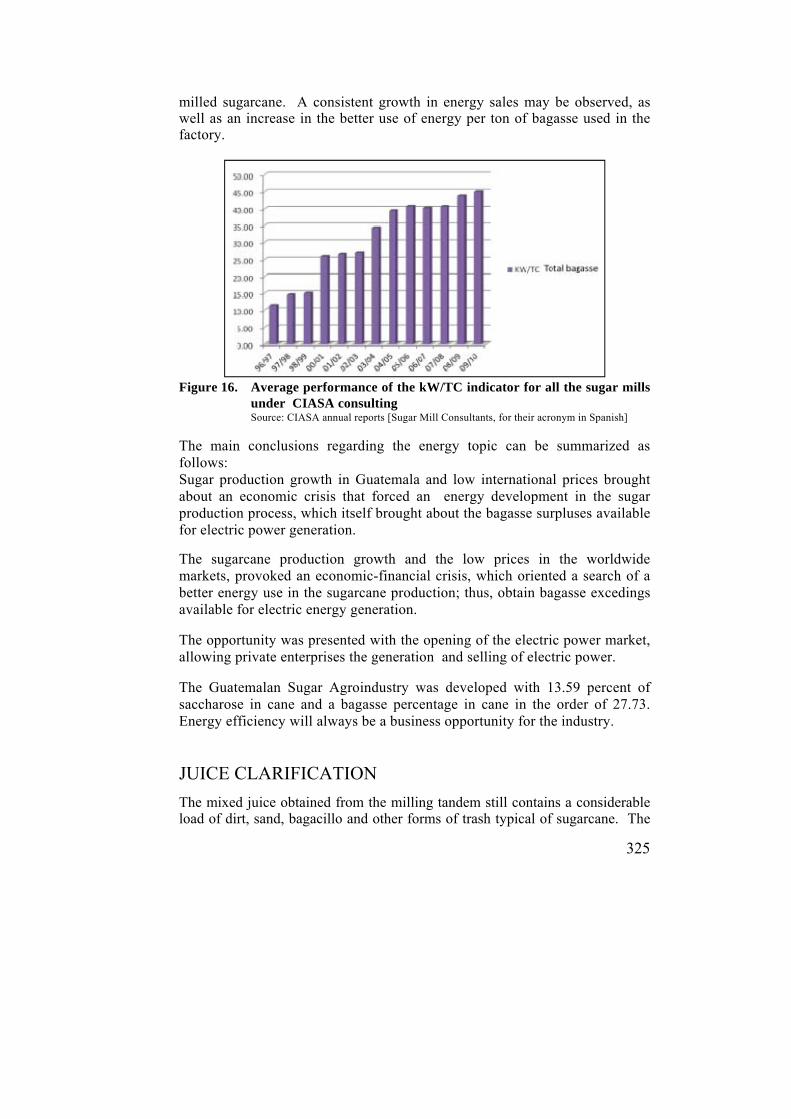
325
milled sugarcane. A consistent growth in energy sales may be observed, as well as an increase in the better use of energy per ton of bagasse used in the factory.
Figure 16. Average performance of the kW/TC indicator for all the sugar mills
under CIASA consulting Source: CIASA annual reports [Sugar Mill Consultants, for their acronym in Spanish]
The main conclusions regarding the energy topic can be summarized as follows: Sugar production growth in Guatemala and low international prices brought about an economic crisis that forced an energy development in the sugar production process, which itself brought about the bagasse surpluses available for electric power generation.
The sugarcane production growth and the low prices in the worldwide markets, provoked an economic-financial crisis, which oriented a search of a better energy use in the sugarcane production; thus, obtain bagasse excedings available for electric energy generation. The opportunity was presented with the opening of the electric power market, allowing private enterprises the generation and selling of electric power. The Guatemalan Sugar Agroindustry was developed with 13.59 percent of saccharose in cane and a bagasse percentage in cane in the order of 27.73. Energy efficiency will always be a business opportunity for the industry. JUICE CLARIFICATION
The mixed juice obtained from the milling tandem still contains a considerable load of dirt, sand, bagacillo and other forms of trash typical of sugarcane. The

326
juice clarification process implies the removal of the impurities contained in the mixed juice in order to produce the required sugar quality. Phosphoric Acid Dosage and Sulphitation
If the sugar quality to be produced is white sulphited sugar, it is recommended that phosphoric acid be added to the mixed juice. Soluble phosphates are typical components of sugarcane. They intervene in the conditioning of slugde for the formation of precipitates when they react with the calcium from the lime (calcium oxide CaO). It is estimated that a phosphate concentration of 300ppm in the juice is necessary, but there are sugarcane varieties with less phosphate concentrations. The juices of such sugarcane varieties are known as refractory, due to the difficulty they present in their clarification. Mixed juice is pumped to the sulphitation process where the juice comes in contact in countercurrent with sulphurous anhydride (SO2), a gas generated by the combustion of elemental sulphur. The furnaces and pipe through which the sulphurous anhydride is conducted, are cooled down with jackets with cold running water. This is done to avoid the formation of sulphuric anhydride (SO3) and the subsequent formation of sulphuric acid (H2SO4). Figure 17 shows a diagram of a typical sulphitation tower arrangement; it is equipped with a furnace for sulphur combustion and a steam ejector to produce the draft in the system by Venturi effect.
Figure 17. Sulphitation tower with furnace for sulphur combustion diagram
Source: Hugot, E. 1963. Sugar engineering manual.
The sulphurous anhydride forms sulphurous acid (H2SO3) through hydrolysis with the juice. The sulphurous acid disassociates into protons (H+) and a

327
sulphite anion (SO32-). Sulphite is a chemical species classified as a medium
power reducing agent; it chemically reduces pigments and coloring agents, disactivating conjugate systems that partially absorbe the electromagnetic radiation in the visible spectrum range. It also eliminates color precursors. Juice sulphitation is essential in obtaining less color in the final white sugar product. The criteria most widely used, is to burn as much sulphur as necessary to achieve a drop of 0.5 pH units between the mixed juice coming from the mills and the suphited juice coming out of the sulphitation tower. Sulphur consumption is between 0.5 and 0.8 pounds per metric ton of milled cane. As a positive additional effect of sulphitation, it has been proved that juice decants more rapidly,it also decreases the viscosity in the main virgin syrup or “meladura”, in the subsequent syrups or “molasses“ and in the massecuites, which in turn produces faster cooking; there is an improvement in crystal formation, syrup deplation and syrup purging in the centrifuges. Clarification Process Alkalinization: The fundamental process for juice clarification lies in the formation of a sedimentable solids of complex composition. Its basic chemical reaction is between the phosphate anion PO43- (contained in the cane and added during the phosphoric acid dosage) and the calcium cation Ca2+ (given by the lime dosage). The chemical reactions involved in the process are the following:
Juice alkalinization is done when it exits from the sulphitation tower. A lime slurry may be used (lime as calcium oxide dispersed in water until a suspension with a 15 °Baumé density, is obtained); the problem with this slurry or whitewash, is the frequent scaling of pipes and pumping equipment. Usage of calcium saccharate (a mixture of lime and clarified juice or main syrup) produces a real solution with the lime and avoids the problems of pipe and equipment obstruction; although some saccharose losses occur due to material recirculation; the benefits obtained in the quality of alkalinization and equipment maintenance, are considerable.
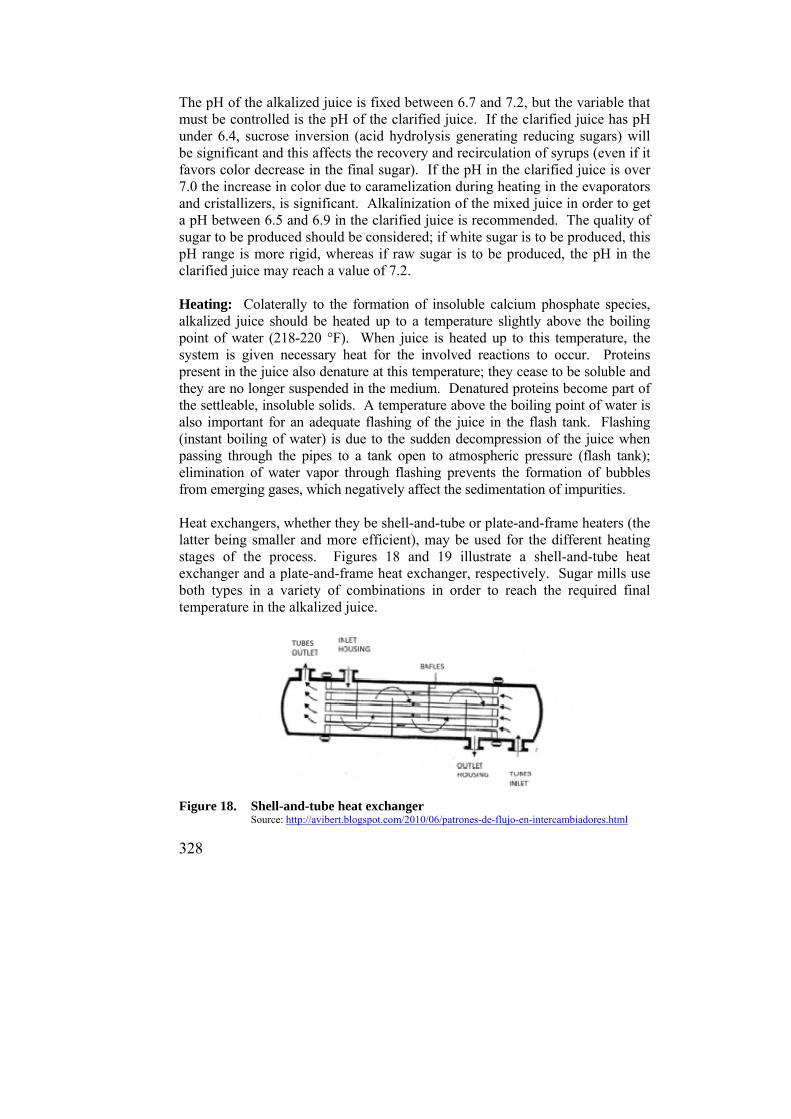
328
The pH of the alkalized juice is fixed between 6.7 and 7.2, but the variable that must be controlled is the pH of the clarified juice. If the clarified juice has pH under 6.4, sucrose inversion (acid hydrolysis generating reducing sugars) will be significant and this affects the recovery and recirculation of syrups (even if it favors color decrease in the final sugar). If the pH in the clarified juice is over 7.0 the increase in color due to caramelization during heating in the evaporators and cristallizers, is significant. Alkalinization of the mixed juice in order to get a pH between 6.5 and 6.9 in the clarified juice is recommended. The quality of sugar to be produced should be considered; if white sugar is to be produced, this pH range is more rigid, whereas if raw sugar is to be produced, the pH in the clarified juice may reach a value of 7.2. Heating: Colaterally to the formation of insoluble calcium phosphate species, alkalized juice should be heated up to a temperature slightly above the boiling point of water (218-220 °F). When juice is heated up to this temperature, the system is given necessary heat for the involved reactions to occur. Proteins present in the juice also denature at this temperature; they cease to be soluble and they are no longer suspended in the medium. Denatured proteins become part of the settleable, insoluble solids. A temperature above the boiling point of water is also important for an adequate flashing of the juice in the flash tank. Flashing (instant boiling of water) is due to the sudden decompression of the juice when passing through the pipes to a tank open to atmospheric pressure (flash tank); elimination of water vapor through flashing prevents the formation of bubbles from emerging gases, which negatively affect the sedimentation of impurities. Heat exchangers, whether they be shell-and-tube or plate-and-frame heaters (the latter being smaller and more efficient), may be used for the different heating stages of the process. Figures 18 and 19 illustrate a shell-and-tube heat exchanger and a plate-and-frame heat exchanger, respectively. Sugar mills use both types in a variety of combinations in order to reach the required final temperature in the alkalized juice.
Figure 18. Shell-and-tube heat exchanger
Source: http://avibert.blogspot.com/2010/06/patrones-de-flujo-en-intercambiadores.html

329
Figure 19. Plate-and-frame heat exchanger
Sourcee: http://www.wcr-regasketing.com/es/heat-exchangers.htm
An additive necessary to complete the clarifying process is the floculant or flocculating polymer dosage, a long chain synthetic polymer. There are many types of flocculant, the most frequently used are the partially hydrolyzed polyacrylamides. The flocculant is prepared by dissolving it in water and letting it rest and mature before dosifying it. This allows the polymer chains to extend themselves. The dosing of the flocculant is done directly into each clarifier. Clarifier Operation (clarified juice decanting and mud removal): The hot alkalized juice is pumped to the flash tank and it tangently enters the wall of such tank; in it, besides liberating water vapor, the juice loses velocity (which will favor the sedimentation of the insoluble impurities). From the flash tank the juice is fed by gravity to the clarifiers. Clarifiers are equipments to sediment insoluble solids and separate them from the liquid phase. The most widely used in Guatemala are the Dorr-Oliver type. These have four independent compartments with conic bottoms, each one with a decanting head for the clarified juice and a set of diaphragm pumps to extract the sedimented sludge. Figure 20 shows a cross section of this type of clarifier. Some sugar mills are already using SRI type Australian-made clarifiers with a single compartment; these, by design, can manage a larger flow of alkalized juice for the clarifying process with a lower retention time than a Dorr-Oliver. During retention time in the clarifier, the precipitates of the calcium phosphate species in formation are associated with the suspended solids in the juice (dirt, bagacillo, trash, debris, etc.) and with the denatured proteins. This initial combination forms solid particles called first stage flakes or flocs (first stage flocculation process). The first-stage floc particles are joined in larger and more compact conglomerates called clots (coagulating process). Parallel to coagulation, the extended flocculant chains begin to bond with various first-
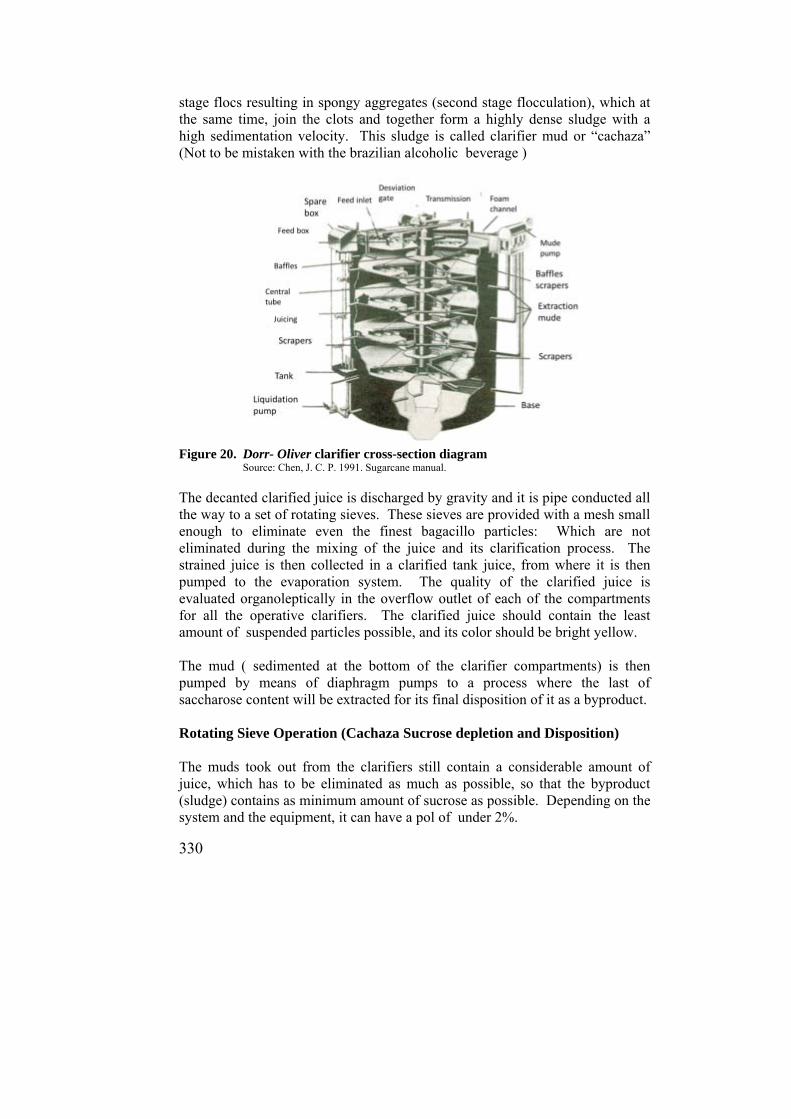
330
stage flocs resulting in spongy aggregates (second stage flocculation), which at the same time, join the clots and together form a highly dense sludge with a high sedimentation velocity. This sludge is called clarifier mud or “cachaza” (Not to be mistaken with the brazilian alcoholic beverage )
Figure 20. Dorr- Oliver clarifier cross-section diagram
Source: Chen, J. C. P. 1991. Sugarcane manual.
The decanted clarified juice is discharged by gravity and it is pipe conducted all the way to a set of rotating sieves. These sieves are provided with a mesh small enough to eliminate even the finest bagacillo particles: Which are not eliminated during the mixing of the juice and its clarification process. The strained juice is then collected in a clarified tank juice, from where it is then pumped to the evaporation system. The quality of the clarified juice is evaluated organoleptically in the overflow outlet of each of the compartments for all the operative clarifiers. The clarified juice should contain the least amount of suspended particles possible, and its color should be bright yellow. The mud ( sedimented at the bottom of the clarifier compartments) is then pumped by means of diaphragm pumps to a process where the last of saccharose content will be extracted for its final disposition of it as a byproduct. Rotating Sieve Operation (Cachaza Sucrose depletion and Disposition) The muds took out from the clarifiers still contain a considerable amount of juice, which has to be eliminated as much as possible, so that the byproduct (sludge) contains as minimum amount of sucrose as possible. Depending on the system and the equipment, it can have a pol of under 2%.
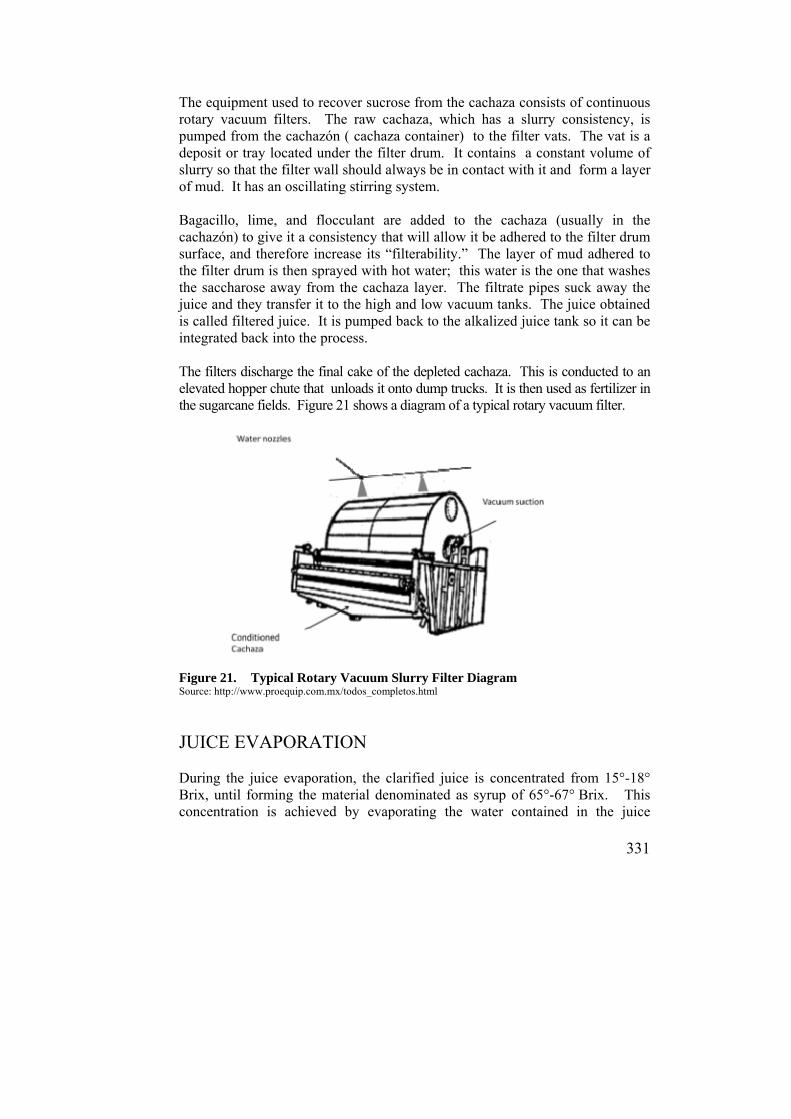
331
The equipment used to recover sucrose from the cachaza consists of continuous rotary vacuum filters. The raw cachaza, which has a slurry consistency, is pumped from the cachazón ( cachaza container) to the filter vats. The vat is a deposit or tray located under the filter drum. It contains a constant volume of slurry so that the filter wall should always be in contact with it and form a layer of mud. It has an oscillating stirring system. Bagacillo, lime, and flocculant are added to the cachaza (usually in the cachazón) to give it a consistency that will allow it be adhered to the filter drum surface, and therefore increase its “filterability.” The layer of mud adhered to the filter drum is then sprayed with hot water; this water is the one that washes the saccharose away from the cachaza layer. The filtrate pipes suck away the juice and they transfer it to the high and low vacuum tanks. The juice obtained is called filtered juice. It is pumped back to the alkalized juice tank so it can be integrated back into the process. The filters discharge the final cake of the depleted cachaza. This is conducted to an elevated hopper chute that unloads it onto dump trucks. It is then used as fertilizer in the sugarcane fields. Figure 21 shows a diagram of a typical rotary vacuum filter.
Figure 21. Typical Rotary Vacuum Slurry Filter Diagram Source: http://www.proequip.com.mx/todos_completos.html
JUICE EVAPORATION During the juice evaporation, the clarified juice is concentrated from 15°-18° Brix, until forming the material denominated as syrup of 65°-67° Brix. This concentration is achieved by evaporating the water contained in the juice

332
through boiling (heating it until it reaches its boiling point) in evaporators (also called evaporating vases or simply vases ). The most widely used evaporators in Guatemala are tube evaporators and rising-film Robert evaporators. Some sugar mills use plate and descending-film evaporators. These have proved to be quite efficient but have an inconvenience: They require frequent cleaning with chemicals so as to preserve the contact area (hest transfer area) between the plates and the juice, and therefore maintain their efficiency. Evaporators are arranged so as to form a multiple effect evaporating system based on the Rillieux principle (first exposed in Louisiana around 1830 by the French-American Norman Rillieux.) This principle establishes that the steam generated by the evaporation of water, which is originated from juice heated by an evaporator or set of evaporators, is able to heat up and evaporate water from an already concentrated juice being transferred to another evaporator or set of evaporators; therefore developing a multiple effect evaporation. The internal pressure in the second evaporator (or set of evaporators) will be less than the internal pressure in the previous evaporator (or set of evaporators), so as to decresase the juice’s boiling point from system to system. Each set of evaporators that form a system with determined pressure, temperature and boiling point conditions, is called an“evaporation effect.” If the arrangement of evaporation is in a quadruple effect, the bled vapor of the third effect will heat the calandria (shell-and-tube unit) of the last effect evaporator (this is where non-clarified meladura of 64°- 67° Brix is obtained.) If the arrangement has five effects (Figure 22), then the bled vapor generated in the fourth effect, with a manometric pressure of -7.0 psi (14.3” Hg vacuum at 181°F) heats the calandria of the last effect evaporator vase. The last effect evaporator’s operation, even the system works from a four effect or a five effect, is at vacuum pressure of -10.8 psi (22” Hg vacuum at 150°F). To obtain boiling point at such a low pressure, a barometric condenser is employed; in which, a cold water flow condenses and drags the steam generated during boiling. Multi jet condensers are provided with a nozzle cage where the nozzles are set up in such a way as to produce a negative differential pressure (through the Venturi effect); they require a considerable injection flow of cold water with a manometric pressure of at least 10 psi. These condensers also extract the noncondensable gases from the evaporator’s body; their only inconvenience is their large water consumption. Due to the problems in cold water supply presently faced by sugar mills, and in an attempt to reduce environmental impact, systems with countercurrent condensers (barometric condensers provided with water curtain producing boxes) are currently used; a vacuum pump is added so as to extract the noncondensing gases in the system (Figure 23).
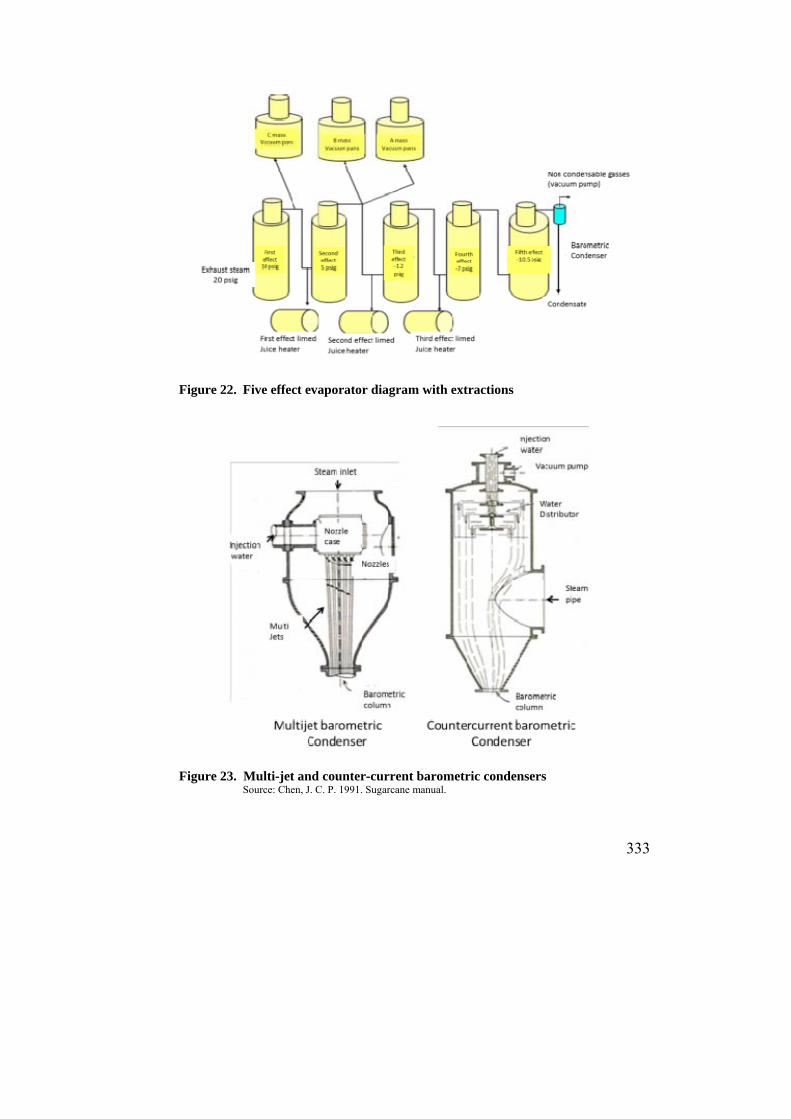
333
Figure 22. Five effect evaporator diagram with extractions
Figure 23. Multi-jet and counter-current barometric condensers
Source: Chen, J. C. P. 1991. Sugarcane manual.
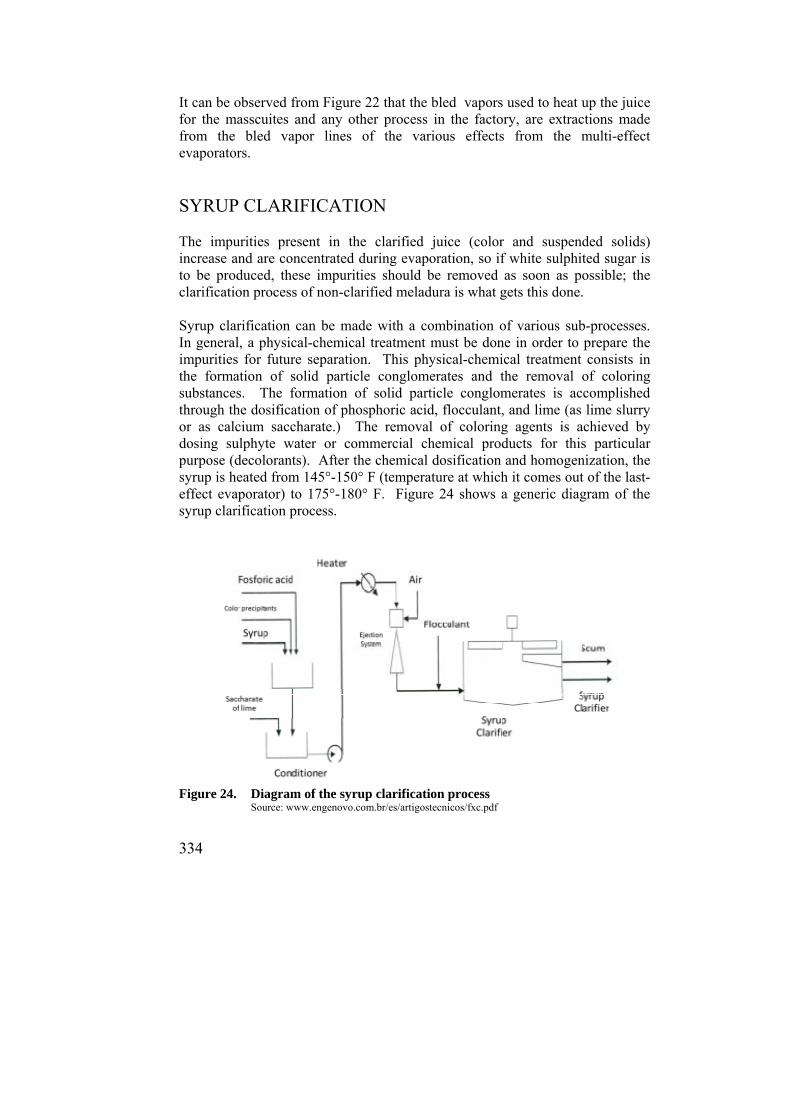
334
It can be observed from Figure 22 that the bled vapors used to heat up the juice for the masscuites and any other process in the factory, are extractions made from the bled vapor lines of the various effects from the multi-effect evaporators.
SYRUP CLARIFICATION The impurities present in the clarified juice (color and suspended solids) increase and are concentrated during evaporation, so if white sulphited sugar is to be produced, these impurities should be removed as soon as possible; the clarification process of non-clarified meladura is what gets this done. Syrup clarification can be made with a combination of various sub-processes. In general, a physical-chemical treatment must be done in order to prepare the impurities for future separation. This physical-chemical treatment consists in the formation of solid particle conglomerates and the removal of coloring substances. The formation of solid particle conglomerates is accomplished through the dosification of phosphoric acid, flocculant, and lime (as lime slurry or as calcium saccharate.) The removal of coloring agents is achieved by dosing sulphyte water or commercial chemical products for this particular purpose (decolorants). After the chemical dosification and homogenization, the syrup is heated from 145°-150° F (temperature at which it comes out of the last-effect evaporator) to 175°-180° F. Figure 24 shows a generic diagram of the syrup clarification process.
Figure 24. Diagram of the syrup clarification process
Source: www.engenovo.com.br/es/artigostecnicos/fxc.pdf
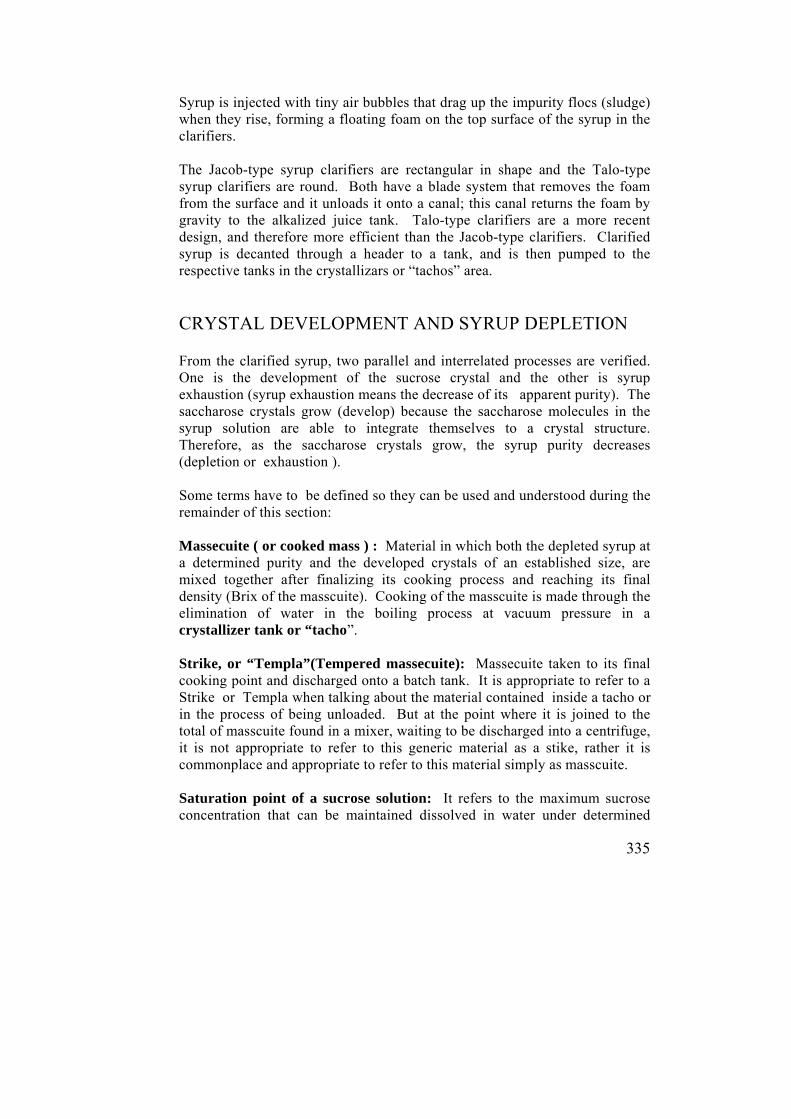
335
Syrup is injected with tiny air bubbles that drag up the impurity flocs (sludge) when they rise, forming a floating foam on the top surface of the syrup in the clarifiers. The Jacob-type syrup clarifiers are rectangular in shape and the Talo-type syrup clarifiers are round. Both have a blade system that removes the foam from the surface and it unloads it onto a canal; this canal returns the foam by gravity to the alkalized juice tank. Talo-type clarifiers are a more recent design, and therefore more efficient than the Jacob-type clarifiers. Clarified syrup is decanted through a header to a tank, and is then pumped to the respective tanks in the crystallizars or “tachos” area.
CRYSTAL DEVELOPMENT AND SYRUP DEPLETION From the clarified syrup, two parallel and interrelated processes are verified. One is the development of the sucrose crystal and the other is syrup exhaustion (syrup exhaustion means the decrease of its apparent purity). The saccharose crystals grow (develop) because the saccharose molecules in the syrup solution are able to integrate themselves to a crystal structure. Therefore, as the saccharose crystals grow, the syrup purity decreases (depletion or exhaustion ). Some terms have to be defined so they can be used and understood during the remainder of this section: Massecuite ( or cooked mass ) : Material in which both the depleted syrup at a determined purity and the developed crystals of an established size, are mixed together after finalizing its cooking process and reaching its final density (Brix of the masscuite). Cooking of the masscuite is made through the elimination of water in the boiling process at vacuum pressure in a crystallizer tank or “tacho”. Strike, or “Templa”(Tempered massecuite): Massecuite taken to its final cooking point and discharged onto a batch tank. It is appropriate to refer to a Strike or Templa when talking about the material contained inside a tacho or in the process of being unloaded. But at the point where it is joined to the total of masscuite found in a mixer, waiting to be discharged into a centrifuge, it is not appropriate to refer to this generic material as a stike, rather it is commonplace and appropriate to refer to this material simply as masscuite. Saturation point of a sucrose solution: It refers to the maximum sucrose concentration that can be maintained dissolved in water under determined
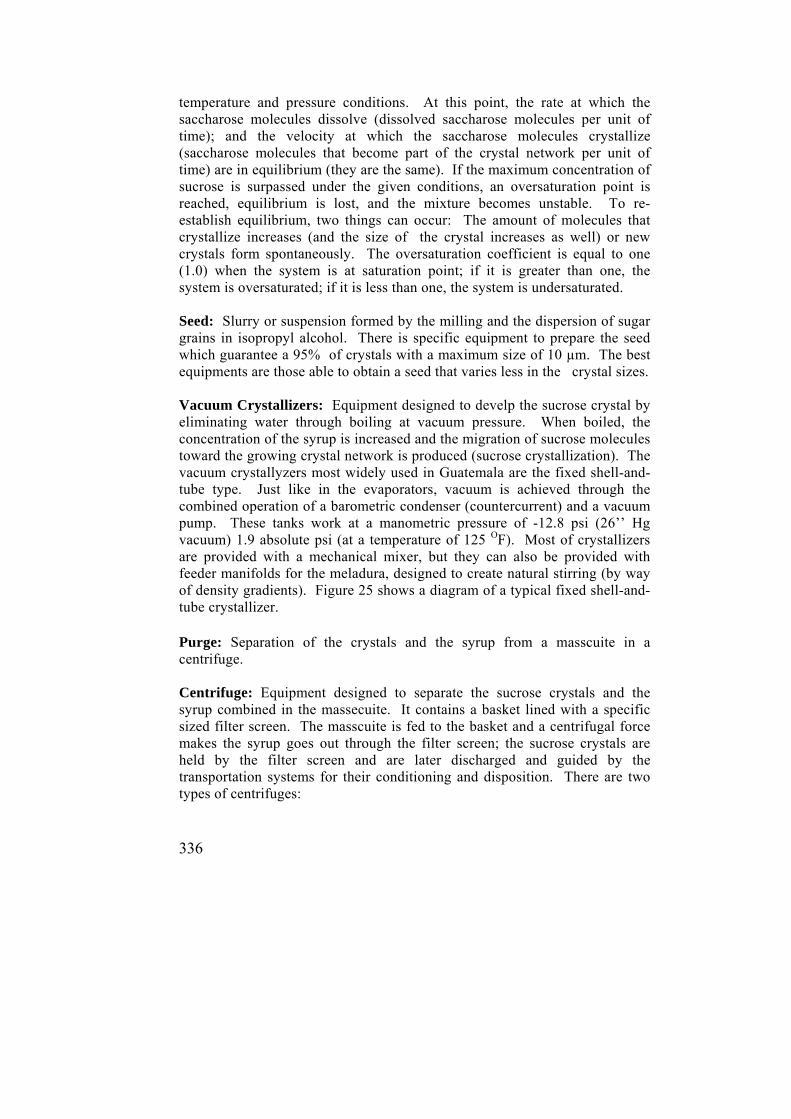
336
temperature and pressure conditions. At this point, the rate at which the saccharose molecules dissolve (dissolved saccharose molecules per unit of time); and the velocity at which the saccharose molecules crystallize (saccharose molecules that become part of the crystal network per unit of time) are in equilibrium (they are the same). If the maximum concentration of sucrose is surpassed under the given conditions, an oversaturation point is reached, equilibrium is lost, and the mixture becomes unstable. To re-establish equilibrium, two things can occur: The amount of molecules that crystallize increases (and the size of the crystal increases as well) or new crystals form spontaneously. The oversaturation coefficient is equal to one (1.0) when the system is at saturation point; if it is greater than one, the system is oversaturated; if it is less than one, the system is undersaturated. Seed: Slurry or suspension formed by the milling and the dispersion of sugar grains in isopropyl alcohol. There is specific equipment to prepare the seed which guarantee a 95% of crystals with a maximum size of 10 µm. The best equipments are those able to obtain a seed that varies less in the crystal sizes. Vacuum Crystallizers: Equipment designed to develp the sucrose crystal by eliminating water through boiling at vacuum pressure. When boiled, the concentration of the syrup is increased and the migration of sucrose molecules toward the growing crystal network is produced (sucrose crystallization). The vacuum crystallyzers most widely used in Guatemala are the fixed shell-and-tube type. Just like in the evaporators, vacuum is achieved through the combined operation of a barometric condenser (countercurrent) and a vacuum pump. These tanks work at a manometric pressure of -12.8 psi (26’’ Hg vacuum) 1.9 absolute psi (at a temperature of 125 OF). Most of crystallizers are provided with a mechanical mixer, but they can also be provided with feeder manifolds for the meladura, designed to create natural stirring (by way of density gradients). Figure 25 shows a diagram of a typical fixed shell-and-tube crystallizer. Purge: Separation of the crystals and the syrup from a masscuite in a centrifuge. Centrifuge: Equipment designed to separate the sucrose crystals and the syrup combined in the massecuite. It contains a basket lined with a specific sized filter screen. The masscuite is fed to the basket and a centrifugal force makes the syrup goes out through the filter screen; the sucrose crystals are held by the filter screen and are later discharged and guided by the transportation systems for their conditioning and disposition. There are two types of centrifuges:

337
Figure 25. Shell-and-tube crystallizer or tacho with mechanic mixer
Source: Chen, J. C. P. 1991. Sugarcane manual.
Continuous centrifuges: As their name implies, they are fed and operated continuously. They consist of an inverted conic basket, fed from down deep at the vortex of the cone. Sugar ascends the walls of the cone all the way up to the top; syrup is collected in the internal wall of the shell. Figure 26 shows a diagram of a typical continuous centrifuge. Automatic or batch centrifuges: As their name implies, these centrifuges are fed discontinuously, one batch of masscuite at a time. They are provided with perforated cylindric baskets lined with a set of filter screens, and counter-filter screens. The syrup goes through the screens, counter-screens and basket; and it is collected in the housing. A complete purge cycle is made with automatic movements which can be controlled by electric timers and switches. Recently, PLC (Programmable Logic Controllers) and proximity switches have been incorporated (Figure 27).
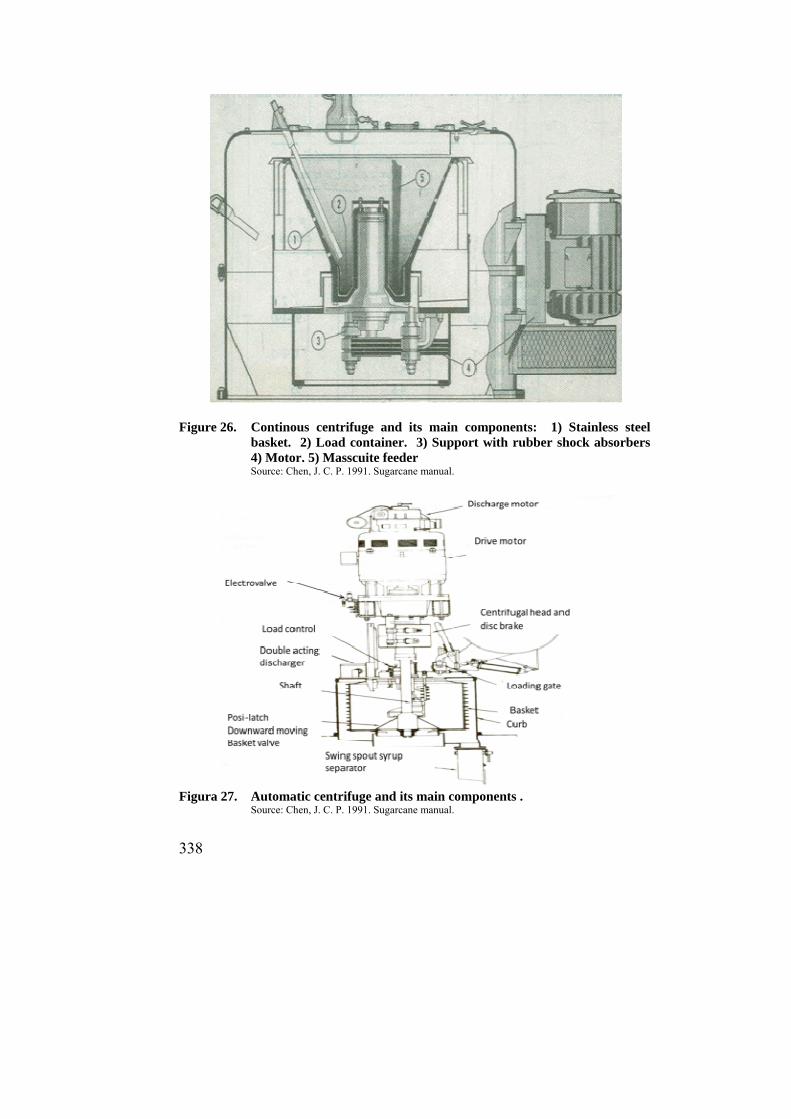
338
Figure 26. Continous centrifuge and its main components: 1) Stainless steel
basket. 2) Load container. 3) Support with rubber shock absorbers 4) Motor. 5) Masscuite feeder
Source: Chen, J. C. P. 1991. Sugarcane manual.
Figura 27. Automatic centrifuge and its main components .
Source: Chen, J. C. P. 1991. Sugarcane manual.
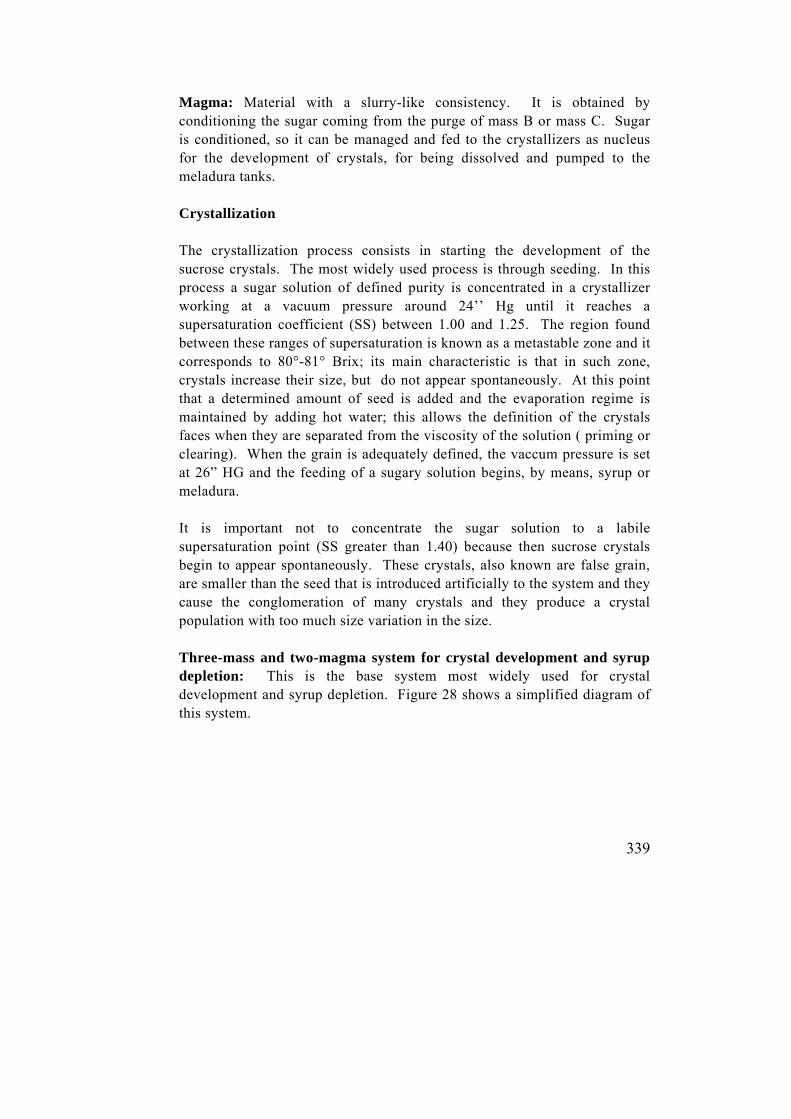
339
Magma: Material with a slurry-like consistency. It is obtained by conditioning the sugar coming from the purge of mass B or mass C. Sugar is conditioned, so it can be managed and fed to the crystallizers as nucleus for the development of crystals, for being dissolved and pumped to the meladura tanks. Crystallization The crystallization process consists in starting the development of the sucrose crystals. The most widely used process is through seeding. In this process a sugar solution of defined purity is concentrated in a crystallizer working at a vacuum pressure around 24’’ Hg until it reaches a supersaturation coefficient (SS) between 1.00 and 1.25. The region found between these ranges of supersaturation is known as a metastable zone and it corresponds to 80°-81° Brix; its main characteristic is that in such zone, crystals increase their size, but do not appear spontaneously. At this point that a determined amount of seed is added and the evaporation regime is maintained by adding hot water; this allows the definition of the crystals faces when they are separated from the viscosity of the solution ( priming or clearing). When the grain is adequately defined, the vaccum pressure is set at 26” HG and the feeding of a sugary solution begins, by means, syrup or meladura. It is important not to concentrate the sugar solution to a labile supersaturation point (SS greater than 1.40) because then sucrose crystals begin to appear spontaneously. These crystals, also known are false grain, are smaller than the seed that is introduced artificially to the system and they cause the conglomeration of many crystals and they produce a crystal population with too much size variation in the size. Three-mass and two-magma system for crystal development and syrup depletion: This is the base system most widely used for crystal development and syrup depletion. Figure 28 shows a simplified diagram of this system.
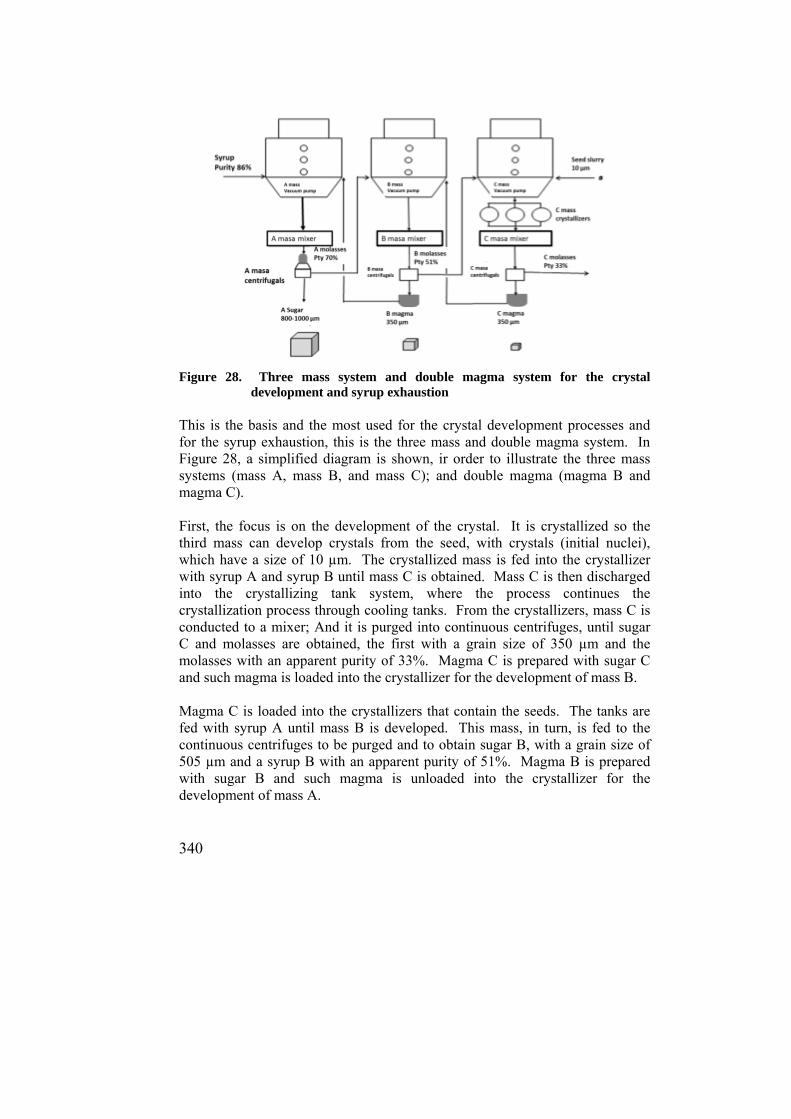
340
Figure 28. Three mass system and double magma system for the crystal
development and syrup exhaustion This is the basis and the most used for the crystal development processes and for the syrup exhaustion, this is the three mass and double magma system. In Figure 28, a simplified diagram is shown, ir order to illustrate the three mass systems (mass A, mass B, and mass C); and double magma (magma B and magma C). First, the focus is on the development of the crystal. It is crystallized so the third mass can develop crystals from the seed, with crystals (initial nuclei), which have a size of 10 µm. The crystallized mass is fed into the crystallizer with syrup A and syrup B until mass C is obtained. Mass C is then discharged into the crystallizing tank system, where the process continues the crystallization process through cooling tanks. From the crystallizers, mass C is conducted to a mixer; And it is purged into continuous centrifuges, until sugar C and molasses are obtained, the first with a grain size of 350 µm and the molasses with an apparent purity of 33%. Magma C is prepared with sugar C and such magma is loaded into the crystallizer for the development of mass B. Magma C is loaded into the crystallizers that contain the seeds. The tanks are fed with syrup A until mass B is developed. This mass, in turn, is fed to the continuous centrifuges to be purged and to obtain sugar B, with a grain size of 505 µm and a syrup B with an apparent purity of 51%. Magma B is prepared with sugar B and such magma is unloaded into the crystallizer for the development of mass A.
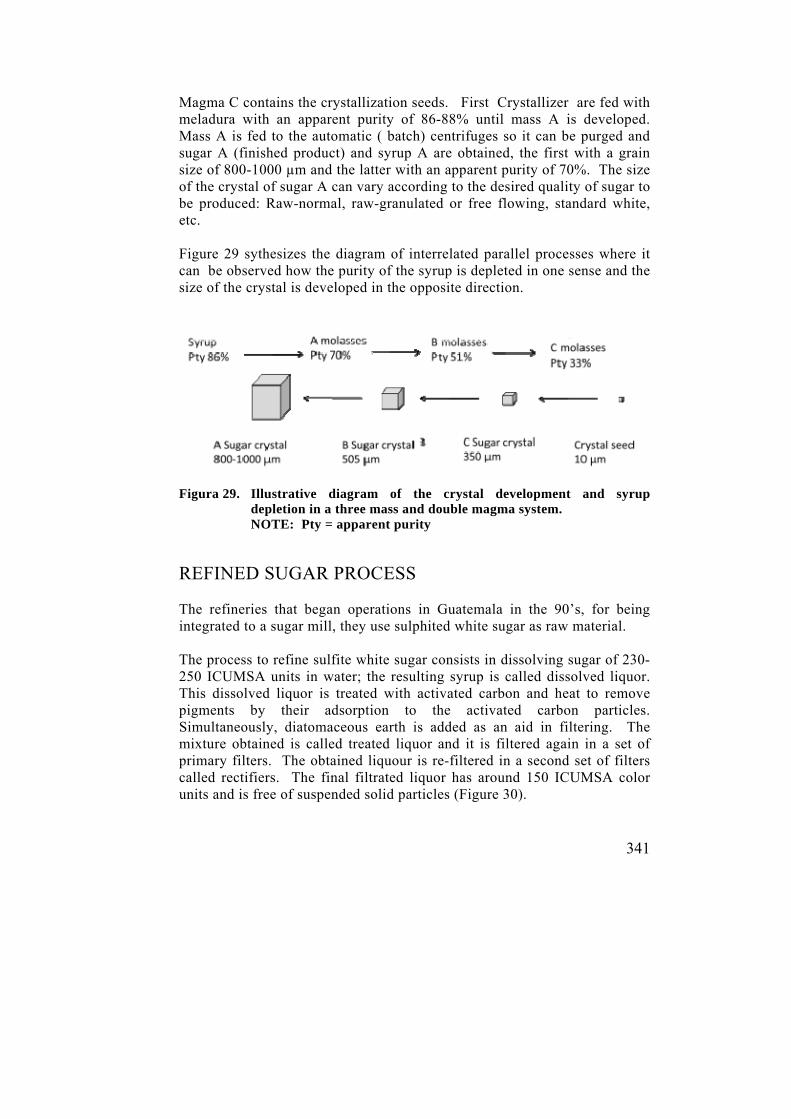
341
Magma C contains the crystallization seeds. First Crystallizer are fed with meladura with an apparent purity of 86-88% until mass A is developed. Mass A is fed to the automatic ( batch) centrifuges so it can be purged and sugar A (finished product) and syrup A are obtained, the first with a grain size of 800-1000 µm and the latter with an apparent purity of 70%. The size of the crystal of sugar A can vary according to the desired quality of sugar to be produced: Raw-normal, raw-granulated or free flowing, standard white, etc. Figure 29 sythesizes the diagram of interrelated parallel processes where it can be observed how the purity of the syrup is depleted in one sense and the size of the crystal is developed in the opposite direction.
Figura 29. Illustrative diagram of the crystal development and syrup
depletion in a three mass and double magma system. NOTE: Pty = apparent purity
REFINED SUGAR PROCESS The refineries that began operations in Guatemala in the 90’s, for being integrated to a sugar mill, they use sulphited white sugar as raw material. The process to refine sulfite white sugar consists in dissolving sugar of 230-250 ICUMSA units in water; the resulting syrup is called dissolved liquor. This dissolved liquor is treated with activated carbon and heat to remove pigments by their adsorption to the activated carbon particles. Simultaneously, diatomaceous earth is added as an aid in filtering. The mixture obtained is called treated liquor and it is filtered again in a set of primary filters. The obtained liquour is re-filtered in a second set of filters called rectifiers. The final filtrated liquor has around 150 ICUMSA color units and is free of suspended solid particles (Figure 30).
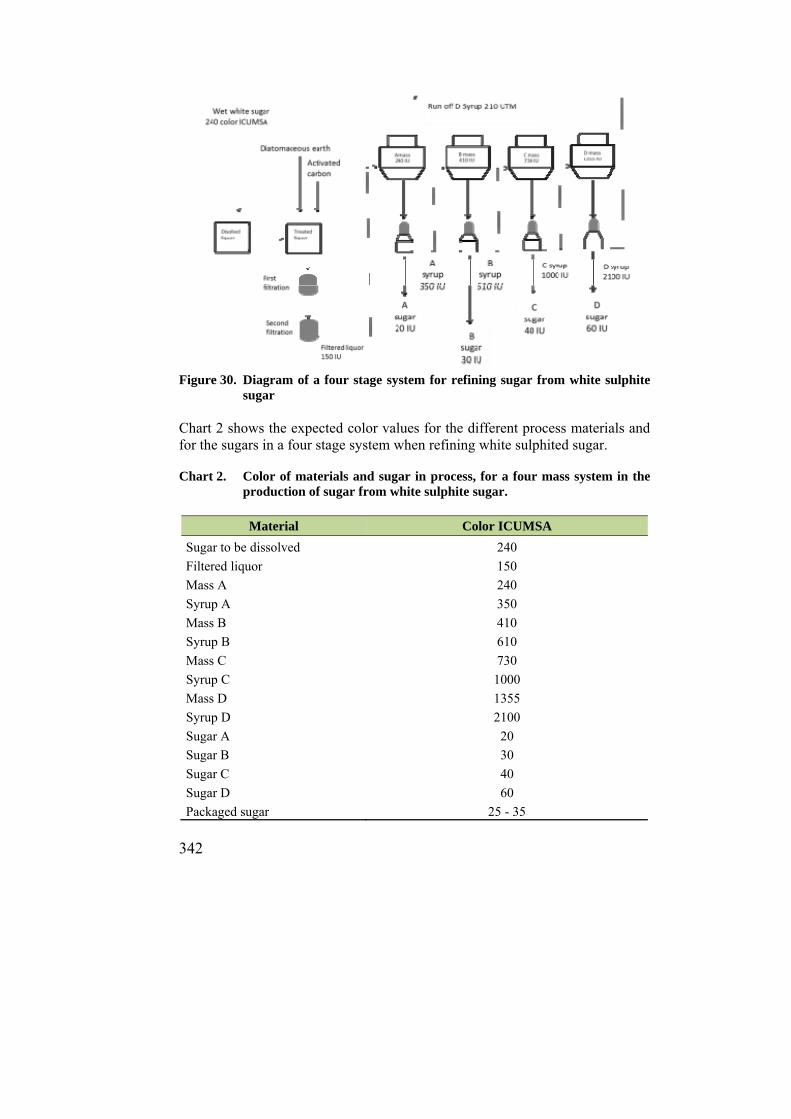
342
Figure 30. Diagram of a four stage system for refining sugar from white sulphite
sugar Chart 2 shows the expected color values for the different process materials and for the sugars in a four stage system when refining white sulphited sugar. Chart 2. Color of materials and sugar in process, for a four mass system in the
production of sugar from white sulphite sugar.
Material Color ICUMSA
Sugar to be dissolved 240
Filtered liquor 150
Mass A 240
Syrup A 350
Mass B 410
Syrup B 610
Mass C 730
Syrup C 1000
Mass D 1355
Syrup D 2100
Sugar A 20
Sugar B 30
Sugar C 40
Sugar D 60
Packaged sugar 25 - 35
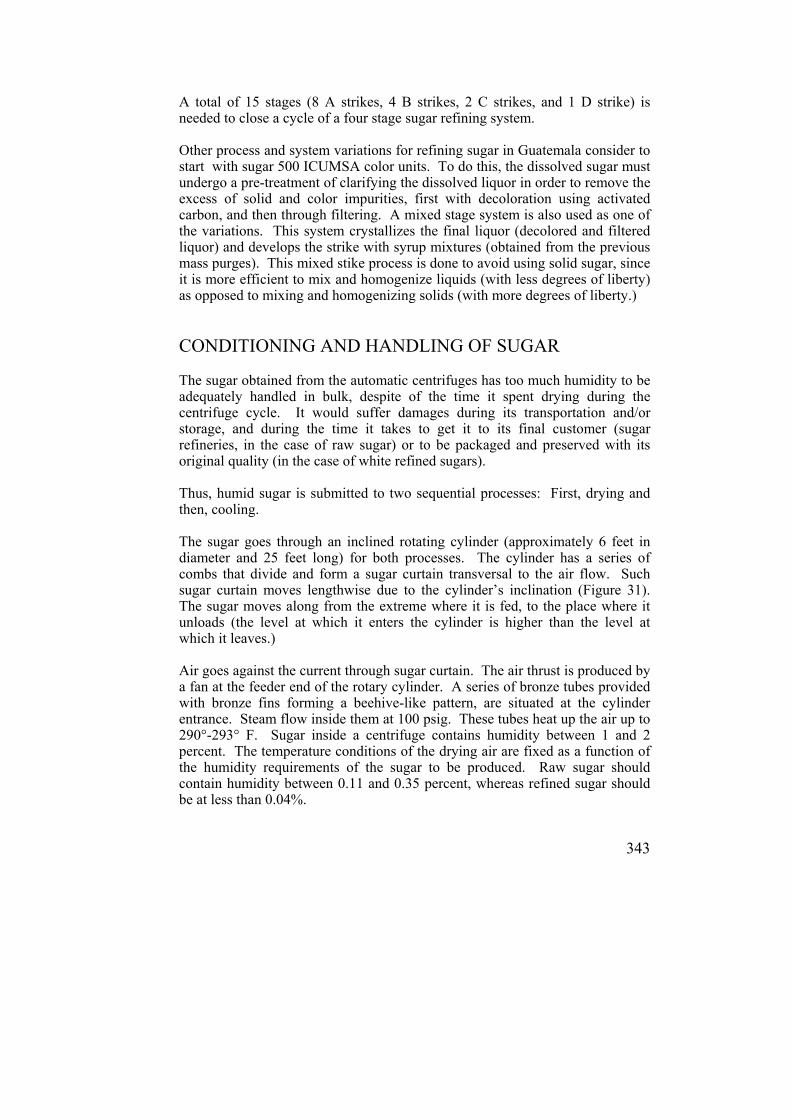
343
A total of 15 stages (8 A strikes, 4 B strikes, 2 C strikes, and 1 D strike) is needed to close a cycle of a four stage sugar refining system. Other process and system variations for refining sugar in Guatemala consider to start with sugar 500 ICUMSA color units. To do this, the dissolved sugar must undergo a pre-treatment of clarifying the dissolved liquor in order to remove the excess of solid and color impurities, first with decoloration using activated carbon, and then through filtering. A mixed stage system is also used as one of the variations. This system crystallizes the final liquor (decolored and filtered liquor) and develops the strike with syrup mixtures (obtained from the previous mass purges). This mixed stike process is done to avoid using solid sugar, since it is more efficient to mix and homogenize liquids (with less degrees of liberty) as opposed to mixing and homogenizing solids (with more degrees of liberty.) CONDITIONING AND HANDLING OF SUGAR The sugar obtained from the automatic centrifuges has too much humidity to be adequately handled in bulk, despite of the time it spent drying during the centrifuge cycle. It would suffer damages during its transportation and/or storage, and during the time it takes to get it to its final customer (sugar refineries, in the case of raw sugar) or to be packaged and preserved with its original quality (in the case of white refined sugars). Thus, humid sugar is submitted to two sequential processes: First, drying and then, cooling. The sugar goes through an inclined rotating cylinder (approximately 6 feet in diameter and 25 feet long) for both processes. The cylinder has a series of combs that divide and form a sugar curtain transversal to the air flow. Such sugar curtain moves lengthwise due to the cylinder’s inclination (Figure 31). The sugar moves along from the extreme where it is fed, to the place where it unloads (the level at which it enters the cylinder is higher than the level at which it leaves.) Air goes against the current through sugar curtain. The air thrust is produced by a fan at the feeder end of the rotary cylinder. A series of bronze tubes provided with bronze fins forming a beehive-like pattern, are situated at the cylinder entrance. Steam flow inside them at 100 psig. These tubes heat up the air up to 290°-293° F. Sugar inside a centrifuge contains humidity between 1 and 2 percent. The temperature conditions of the drying air are fixed as a function of the humidity requirements of the sugar to be produced. Raw sugar should contain humidity between 0.11 and 0.35 percent, whereas refined sugar should be at less than 0.04%.
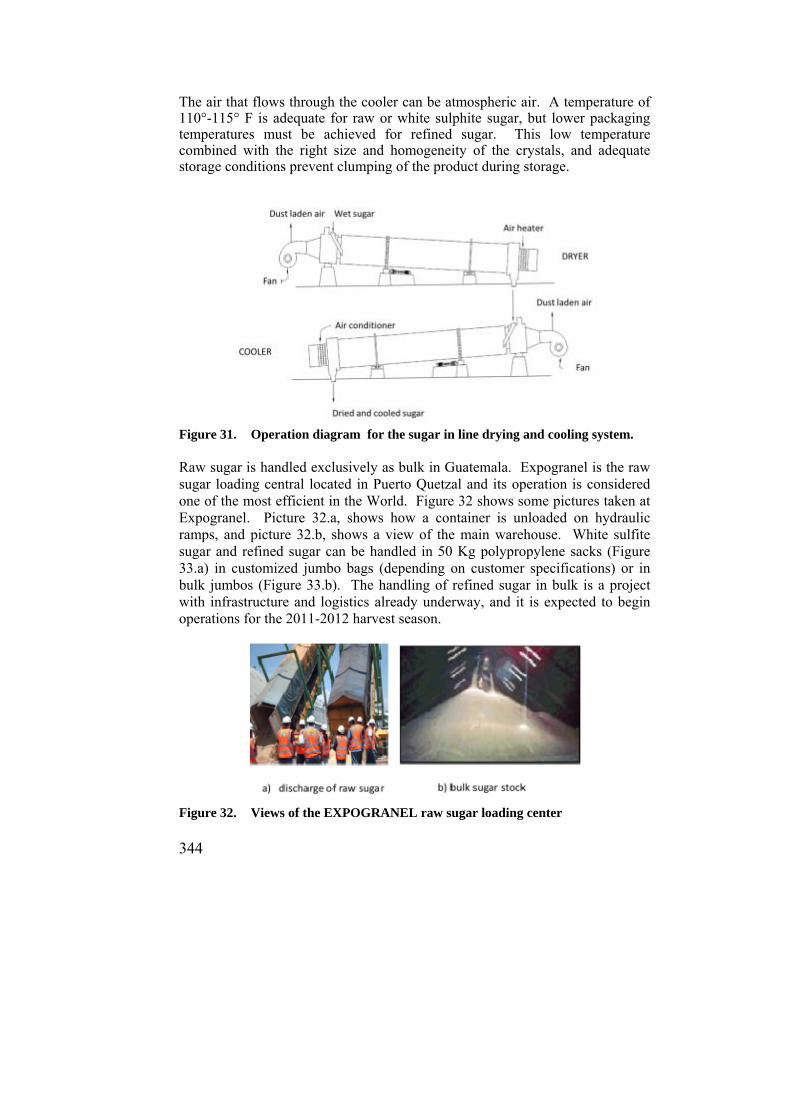
344
The air that flows through the cooler can be atmospheric air. A temperature of 110°-115° F is adequate for raw or white sulphite sugar, but lower packaging temperatures must be achieved for refined sugar. This low temperature combined with the right size and homogeneity of the crystals, and adequate storage conditions prevent clumping of the product during storage.
Figure 31. Operation diagram for the sugar in line drying and cooling system. Raw sugar is handled exclusively as bulk in Guatemala. Expogranel is the raw sugar loading central located in Puerto Quetzal and its operation is considered one of the most efficient in the World. Figure 32 shows some pictures taken at Expogranel. Picture 32.a, shows how a container is unloaded on hydraulic ramps, and picture 32.b, shows a view of the main warehouse. White sulfite sugar and refined sugar can be handled in 50 Kg polypropylene sacks (Figure 33.a) in customized jumbo bags (depending on customer specifications) or in bulk jumbos (Figure 33.b). The handling of refined sugar in bulk is a project with infrastructure and logistics already underway, and it is expected to begin operations for the 2011-2012 harvest season.
Figure 32. Views of the EXPOGRANEL raw sugar loading center

345
Figure 33. White sugar and/or refined sugar in sacks and jumbos warehouses
THE FUTURE: BIO-REFINERIES From the beginning of the sugar production, in any of its forms or presentations (juice, concentrated syrup or meladura, panela, moscabado, melcocha, raw sugar, table sugar, etc.) to the beginning of the XXth century, the main and almost only goal of sugar mills and trapiches, was the production of the sweetener known as sucrose or table sugar. The necessary energy for this purpose was provided by animal or human drive and by firewood cut from the nearby woods. The main sub-product of these processes was molasses, which in some occasions, and depending on the circumstances, was considered a “waste material” and a nuisance; and it was used to keep the dust from rising on dirt roads. Later, a more valuble and useful application was found for it, as a nutritional supplement for cattle feed and a carbon source (substrate) for the emerging alcoholic beverage industry (potable ethanol). As the milling process got better, another use was found for another accumulating nuisance: Cane bagasse, which began to be used as fuel for the generation of heat and mechanical energy. Thus, the next stage in the development of the sugar industry already had, besides their main product, sugar, two sub-products with considerable value: Molasses and bagasse. Globalization of the sugar market also introduced the diversification of the main product and the necessary technology for producing refined sugar and inverted syrup (High Test Molasses – HTM), among other products.

346
With the energy crisis during the second half of the XXth century, the opportunity to add even more value to two by-products of the main sub-products: The generation of electric power in turbines moved by the steam generated by the boilers, for both sugar mill use and for the national network, and the production of ethanol for motor fuel in distilleries annexed to the sugar mills. These, additionally, presented the problem of two by-products: Distilling slops (vinasse, stillage) and carbon dioxide (CO2). In most cases the
CO2 is released into the atmosphere, and occasionally it is used industrially in carbonated drinks or compressed for the production of dry ice (widely used for food preservation.) Recently, stillage ceased to be considered a “waste by- product” and it became a valuable by-product from which heat, protein, fertilizing nutrients, a substrate for methane production, etc., can be extracted. Recently, in Guatemala, an integrated sugar mill can be producing various valuable products and by-products for the country’s economy: Sugars: Raw Brown White Crystal Refined Bagasse: Lignocelullosic fiber Steam: Heat Movement / work Electricity Syrups: Hydrolized meladura (syrup, inverted or HTM) Molasses: Food supplement for cattle Ethanol: Potable Industrial Fuel Vinasse: Fertilizer Methane Single cell protein CO2 The next step, in which huge advances have already been reached in more industrialized countries, is the development of industrial complexes called “Bio-Refineries”, which exploit every fraction of the sugarcane in a large diversity of products and by-products according to their technical and economic factibility, during specific market moments.
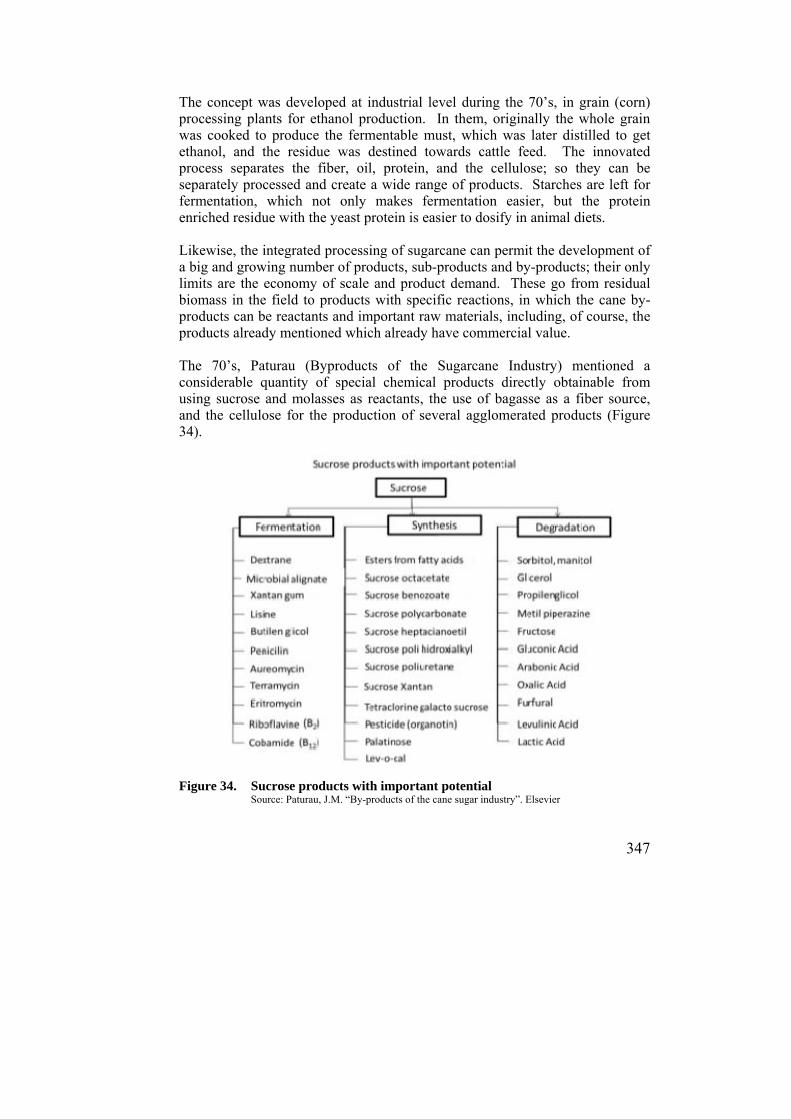
347
The concept was developed at industrial level during the 70’s, in grain (corn) processing plants for ethanol production. In them, originally the whole grain was cooked to produce the fermentable must, which was later distilled to get ethanol, and the residue was destined towards cattle feed. The innovated process separates the fiber, oil, protein, and the cellulose; so they can be separately processed and create a wide range of products. Starches are left for fermentation, which not only makes fermentation easier, but the protein enriched residue with the yeast protein is easier to dosify in animal diets. Likewise, the integrated processing of sugarcane can permit the development of a big and growing number of products, sub-products and by-products; their only limits are the economy of scale and product demand. These go from residual biomass in the field to products with specific reactions, in which the cane by-products can be reactants and important raw materials, including, of course, the products already mentioned which already have commercial value. The 70’s, Paturau (Byproducts of the Sugarcane Industry) mentioned a considerable quantity of special chemical products directly obtainable from using sucrose and molasses as reactants, the use of bagasse as a fiber source, and the cellulose for the production of several agglomerated products (Figure 34).
Figure 34. Sucrose products with important potential Source: Paturau, J.M. “By-products of the cane sugar industry”. Elsevier
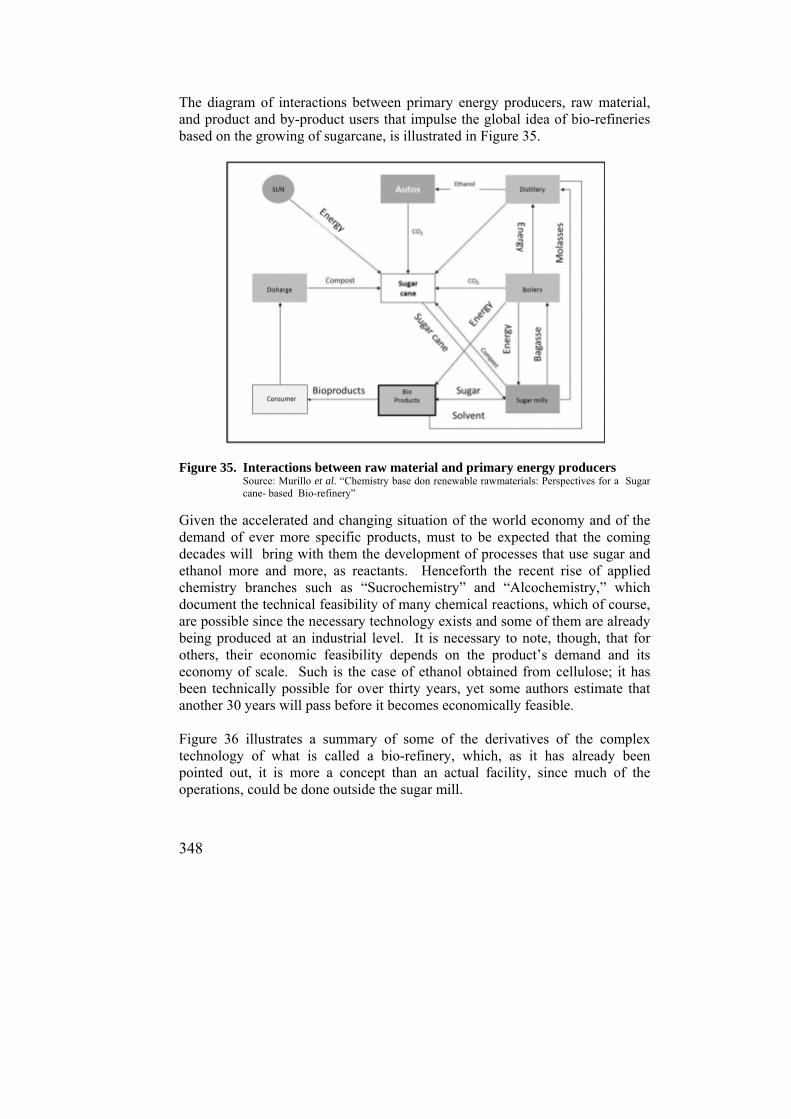
348
The diagram of interactions between primary energy producers, raw material, and product and by-product users that impulse the global idea of bio-refineries based on the growing of sugarcane, is illustrated in Figure 35.
Figure 35. Interactions between raw material and primary energy producers
Source: Murillo et al. “Chemistry base don renewable rawmaterials: Perspectives for a Sugar cane- based Bio-refinery”
Given the accelerated and changing situation of the world economy and of the demand of ever more specific products, must to be expected that the coming decades will bring with them the development of processes that use sugar and ethanol more and more, as reactants. Henceforth the recent rise of applied chemistry branches such as “Sucrochemistry” and “Alcochemistry,” which document the technical feasibility of many chemical reactions, which of course, are possible since the necessary technology exists and some of them are already being produced at an industrial level. It is necessary to note, though, that for others, their economic feasibility depends on the product’s demand and its economy of scale. Such is the case of ethanol obtained from cellulose; it has been technically possible for over thirty years, yet some authors estimate that another 30 years will pass before it becomes economically feasible. Figure 36 illustrates a summary of some of the derivatives of the complex technology of what is called a bio-refinery, which, as it has already been pointed out, it is more a concept than an actual facility, since much of the operations, could be done outside the sugar mill.
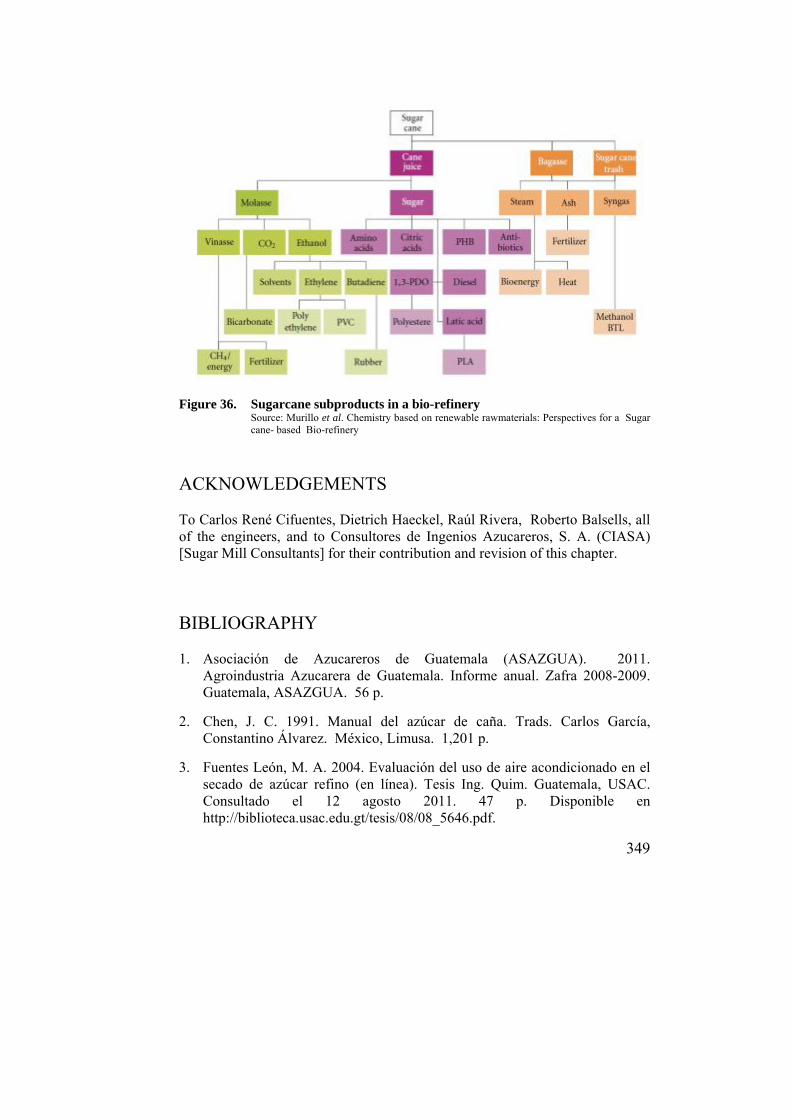
349
Figure 36. Sugarcane subproducts in a bio-refinery
Source: Murillo et al. Chemistry based on renewable rawmaterials: Perspectives for a Sugar cane- based Bio-refinery
ACKNOWLEDGEMENTS To Carlos René Cifuentes, Dietrich Haeckel, Raúl Rivera, Roberto Balsells, all of the engineers, and to Consultores de Ingenios Azucareros, S. A. (CIASA) [Sugar Mill Consultants] for their contribution and revision of this chapter.
BIBLIOGRAPHY 1. Asociación de Azucareros de Guatemala (ASAZGUA). 2011.
Agroindustria Azucarera de Guatemala. Informe anual. Zafra 2008-2009. Guatemala, ASAZGUA. 56 p.
2. Chen, J. C. 1991. Manual del azúcar de caña. Trads. Carlos García, Constantino Álvarez. México, Limusa. 1,201 p.
3. Fuentes León, M. A. 2004. Evaluación del uso de aire acondicionado en el secado de azúcar refino (en línea). Tesis Ing. Quim. Guatemala, USAC. Consultado el 12 agosto 2011. 47 p. Disponible en http://biblioteca.usac.edu.gt/tesis/08/08_5646.pdf.
350
4. Guthrie, J. P. 1975. Carbonyl addition reactions: factors affecting the hydrate-hemiacetal and hemiacetal-acetal equilibrium constants (en línea). Can. J. Chem. 53 (6):898-906. Consultado 30 julio 2011. Disponible en http://www.nrcresearchpress.com/doi/abs/10.1139/v75-125.
5. Hugot, E. 1963. Manual para ingenieros azucareros. Trad. Carlos Ruiz
Coutiño. México, Cía. Editorial Continental. 803 p. 6. Larrahondo, J. E. et al. 1995. Calidad de la caña de azúcar (en línea). El
cultivo de la caña en la zona azucarera de Colombia. CENICAÑA. Cali, Valle del Cauca, Colombia. Consultado 15 julio 2011. Disponible en http://www.cenicana.org/pdf/documentos_no_seriados/libro_el_cultivo_cana/libro_p337-354.pdf.
7. Manohar, P. J. 1997. INDUSTRIAL UTILIZATION OF SUGAR CANE
AN ITS CO-PRODUCTS. ISPCK Publishers. New Delhi. 8. Murillo, F.; Araujo, C.; Bonfá, A.; Porto, W. 2011. Chemistry based on
renewable rawmaterials: Perspectives for a sugar cane based biorrefinery. 8 p. 9. Paturau, J. M. 1989. By – products of the cane sugar industry. 3a. ed. New
York, Elsevier. 436 p. Sugar series No. 11. 10. RENOVETEC. 2010. Tipos de plantas de cogeneración (en línea).
Madrid, RENOVETEC. Consultado 22 agosto. 2011. Disponible en http://www.cogeneracion.renovetec.com/cogeneraciontiposplantas.html.
11. Tecnicaña. 2001. ALCOQUIMICA 2011. Memorias seminario
internacional. Colombia. 12. Vaz, CM. Stamile Soarez, SM. Silva, JO da. Clarificación de meladura por
flotación (en línea). Río de Janeiro, Engenho Novo Cia. Ltda. Consultado 26 julio 2011. Disponible en www.engenovo.com.br/es/artigostecnicos/fxc.pdf.
351
XIV. SUGAR AGROINDUSTRY DIVERSIFICATION
352
CO-GENERATION IN THE SUGAR INDUSTRY
Mario Muñoz
INTRODUCTION Co-generation has had sustainable evolution and development in sugar mills in Guatemala; this impulse has sprouted due to the secondary generation of a subproduct that came from being a waste product to being biomass in abundant quantities, with an exploitable heat value that converted it into a good fuel: Bagasse. With the burning of bagasse as a fuel in the boilers, steam production was produced and maintained, especially since it provides the necessary energy to move most of the equipment in a sugar mill, as well as for being used in all sugar production processes. As a result of the need to increase such steam production, co-generating sugar mills have been developing their technology; so they went from one-stage turbines to multistage turbines; the former are used as simple power transmitters to equipment such as mills, whereas the latter are connected to electric power generators. With this change, sugar mills became electric power co-generators, since they are producing steam for electric power generation and are then using the surplus energy from such steam for the processes involved in the production of sugar, all of this from a single fuel source. , Co-generation has grown even more, by taking advantage of the improvement in the country’s laws. The new laws have promoted and liberated the generation, transportation, and distribution of electrical power. This also gave the sugar mills an incentive to increase the quantity of sugarcane they were milling, in order to optimize the consumption of steam in the factories and to raise their electric power availability through more efficient turbogenerators with larger capacities. The processes associated to co-generation in sugar mills illustrated in this chapter, are conceptually the same or very similar. However, each co-generating sugar mill has a different arrangement; each sugar mill has its own way of managing its operations, from the management and treatment of the bagasse itself, going through the generation of steam and electric power, to the use of the steam that comes out from the sugar factory. The energy balances from each process and each co-generator are different.
Industrial-Mechanical Engineer, Energy Efficiency Professional from CENGICAÑA. www.cengicana.org
353
Currently, resources have begun to limit co-generation. However, in the country’s electrical power market, the demand for more cleaned electrical power surpasses the offer; and therefore, sugar mills are facing two challenges: First, investing and growing in the electrical power generation market together with other fuels, such as mineral coal. Second, optimizing and improving their co-generation processes by improving their internal energy efficiency and the use of the bagasse as fuel efficiency. This section presents a brief summary of the history of the development of co-generators, the efficiency indexes, the benefits, and the processes involved in this form of energy management.
BACKGROUND Some industries, like sugar mills in Guatemala, have been generating their own electrical power for a little over 70 years, with the purpose of satisfying their internal energy needs for the production of sugar. Initially, the generation of electrical power was for local use only, and it was limited to satisfying the kinetic energy demands of the juice extraction equipment, such as shredders and mills, whose main moving force was the steam produced by boilers. The second fundamental energy demand was made by the factory processes, known as treatment, processing, and cooking of the juice and syrups, such as evaporation, heating, and crystallization. To meet this second energy demand, the so called “exhaust” steam was used; that is, steam that has already given part of its energy in a first process (i.e. moving a turbine) but it still has enough energy at a lower pressure and temperature to still be used in other processes. This, to some, is the definition of co-generation. The reason for this statement comes from the fact that the source of the exhaust steam was the discharge of the extraction equipment that used the kinetic energy found in the main steam for a first phase. This means that the main steam used by the juice extraction equipment, is the same that is later used in the sugar production process, except with less energy, lower pressure, and lower temperature. Such energy is almost depleted by the extraction equipment, and whatever remains in the exhaust steam is the doubled used energy. Co-generating sugar mills have been investing in larger turbines connected to the electric power generators due to the increase in the amount of milled sugarcane. This brought about, not only a growth in the size of the factories but an optimization in the sugar production process, as well. Electrical power was thus produced and during harvest season, the sugar mills were able to disconnect themselves from the national electrical power network. This is
354
translated into significant energy savings for the country. The turbines also discharge exhaust steam, and therefore, the availability of the thermal energy needed within the factory for sugar production, was maintained. The next step taken by some co-generating sugar mills has been the change from steam power to electrical power for the equipment used in the juice extraction processes (shredders and mills). As a result, the use of energy is much more efficient for the main steam flow, since the previously used to move the shredders and mills, is now exclusively used to move turbogenerators. These, in turn, produce electrical power, making the whole operation of extraction and other much more efficient processes. With this strategy, sugar mills have been able to co-generate, at the same time, and sequentially, main energy and exhaust energy, both thermal and electrical. The production of these forms of energy has been attained with the burning of a single fuel in the boilers, the bagasse. Bagasse is a sub-product of the sugarcane milling. It comes from the cane in the form of fiber that can not be used in the extraction of sugar. Along history, sugar mills have made tremendous efforts to efficiently burn bagasse so as to obtain ever more surpluses and so, produce more electrical energy. Those who have reached this goal, generate all the thermal and electrical energy they need for themselves, and sell part of the excess to the national electrical network. This has allowed sugar mills to contribute to the country’s ever increasing electrical power demand. Additionally, co-generation in sugar mills has represented a positive factor to the environment. The argument is that the use of a “non-fossil” fuel has decreased the amount of green house gases discharged into the air.
BASIC CONCEPT There isn’t just one definition for co-generation. Various authors consider it a technique while others say it is a process or system. From an energy point of view, co-generation is defined as follows: Co-generation is a technique employed for the sequential production of energy, generally thermal and electrical, from a single source of energy. However, co-generation can be viewed as an integral process and not as a technique: It is a process by which a heat discharge from a process is converted into an energy source for another later conversion process.
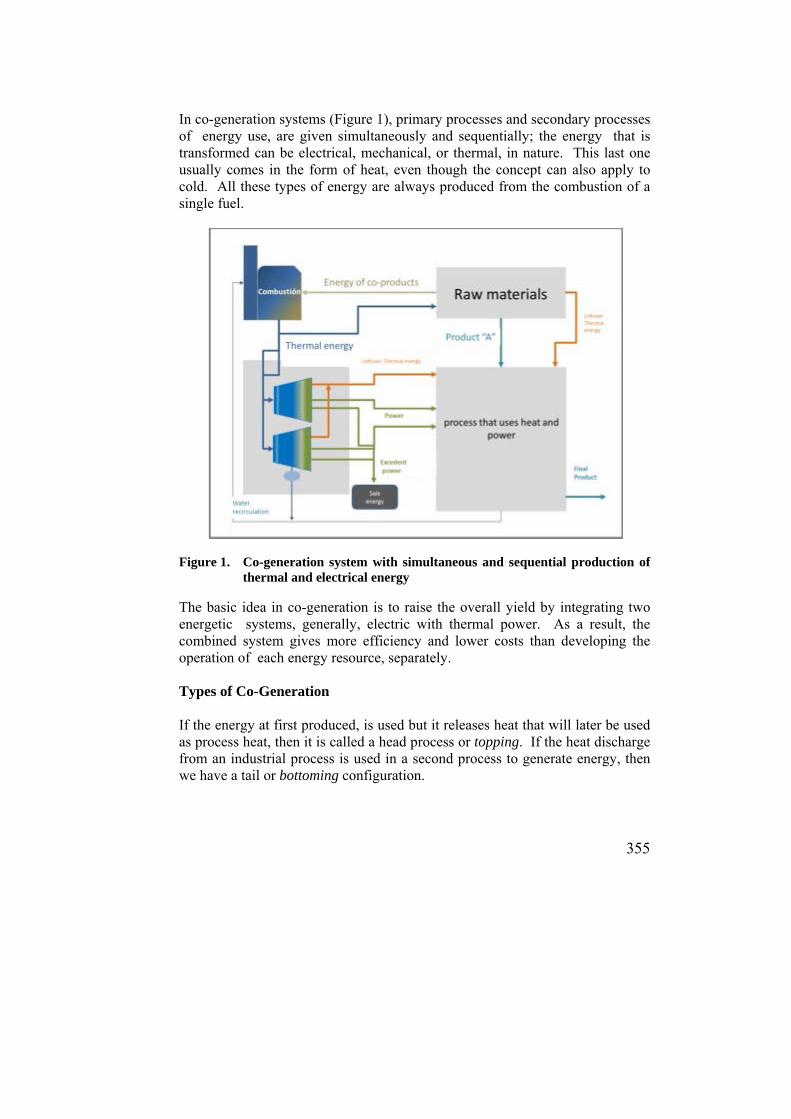
355
In co-generation systems (Figure 1), primary processes and secondary processes of energy use, are given simultaneously and sequentially; the energy that is transformed can be electrical, mechanical, or thermal, in nature. This last one usually comes in the form of heat, even though the concept can also apply to cold. All these types of energy are always produced from the combustion of a single fuel.
Figure 1. Co-generation system with simultaneous and sequential production of
thermal and electrical energy The basic idea in co-generation is to raise the overall yield by integrating two energetic systems, generally, electric with thermal power. As a result, the combined system gives more efficiency and lower costs than developing the operation of each energy resource, separately. Types of Co-Generation If the energy at first produced, is used but it releases heat that will later be used as process heat, then it is called a head process or topping. If the heat discharge from an industrial process is used in a second process to generate energy, then we have a tail or bottoming configuration.
356
Head Co-Generation Cycle: In this cycle, electrical energy is produced first; steam turbines, gas turbines, or diesel engines are used to generate the electrical energy and then the heat given off is used in some later industrial process. Examples of processes using this discharge heat include evaporators and cooker, or any other equipment using thermal energy. It is the most widely used system in the sugar industry. If steam turbines are used, then both, the exhaust gases from the boilers as well as the steam discharged by the turbines, become sources of heat for other processes. Tail Cycle Co-generation: This is a thermal cycle. Its goal is to recover heat from an industrial process so as to produce electrical energy with it later. This type of cycle requires steam at a specific pressure and termperature, for an adequate operation of turbogenerators that generate electrical energy. This process is not useful in co-generating sugar mills. Necessary Characteristics for Co-generation In principle, any process with an important heat and electricity demand is a possible co-generator. However, in general terms, it can be established that potential generators must meet some of the following characteristics: Produce important heat surpluses, either from the hot gases coming from
the boiler combustion, or as low pressure exhaust steam coming from the turbine discharge.
To have a very cheap fuel, with continuous supply, stable and uniform. In fact, the higher the difference between the price of the fuel and the price of electricity, the greater the financial or economic benefit from implementing a co-generation system.
The industrial process involved must be continuous; otherwise, the co-produced energy would be lost.
CO-GENERATION IN THE SUGAR INDUSTRY Co-generation in the sugar industry is subject for a legal framework, supported by the General Law of Electricity. Legal Framework1 The General Law of Electricity of Guatemala establishes that the generation of electricity is a free market that requires no previous authorization from the
357
State. Article 8 of the same legal body establishes that the installation of electrical power generation centrals is open to anyone. The generation, transportation, and distribution process of electrical energy in Guatemala had been regulated by the Law of the National Electrification Institute [INDE, for its acronym in Spanish] Legistlative Decree Number 1287 from March 27, 1959. It established the mechanisms to go into the electricity business, and it was the Executive Council, the organism in charge of proposing the fares to be charged. This institution was created as a de-centralized State entity with operating autonomy, legal status, private funds, and full capacity to acquire rights and contract obligations within its competency realm. The electrical energy business had been managed by way of the State (through INDE, Empresa Elécrica de Guatemala [EEGSA, for its acronym in Spanish], and municipal electrical energy enterprises); the Guatemalan Constitution has established for many years (article No. 129) that private sector can participate in the production of electricity. In the last years, the national economy has experimented a series of changes, framed within the globalization process and the structural adjustment propelled by the international financial organisms, which has promoted economic modernization. This aspect has been manifested by a higher liberalization towards the international market and a restructuring of the State, in terms of higher participation of private agents and under the outline of a free market. The idea that the State has to relegate (subsidize) the productive activities that the private sector cannot fulfill has become fundamental. It has motivated an order, which in the case of the electrical sub-sector has materialized in the form of concrete legal proposals. It is directly allowing a free market in this sub-sector. Within the electrical energy sub-sector framework briefly outlined above, the free market process began. The first step was to name a Multi-sector Committee that would take care of proposing integral solutions to the problems produced by the upcoming General Law of Electricity. Some of the most important conclusions produced by the Committee were: a) Create a free market for the electrical energy sub-sector. b) Establish the necessary mechanisms, so that the participating agents would
do so without political interference. c) Guarantee that the agents participating in any of the operations of the
service (generation, transmission, distribution, and marketing) do so in conditions of equality.
d) Revise the legislation and structure of the public enterprises of the sub-sector.
358
e) Guarantee the rational use of renewable and non-renewable natural resources.
f) Promote the use of alternative sources of energy for the generation of electricity.
g) Revise the energy distribution structure and promote competition and reconversion of the companies in charge of distribution, as well as to promote participations of new companies.
h) Establish the mechanisms for the sale of stocks and any other process that allows the optimization of resources owned by the Guatemalan Electric Company [EEGSA, for its acronym in Spanish].
i) All the electric companies will have autonomy to manage the production, acquisition, and distribution of electricity.
j) Make the necessary changes to the existing legislation, so that each company can set their own prices.
Law to Promote the Development of New and Renewable Sources of Energy: The General Law of Electricity constitutes the framework for every activity dedicated to any part of the process (generation, transmission, distribution, and marketing). It is important to point out that where the process of co-generation itself is concerned, there is the existence of this law (Law-Decree No. 20-86). It has as its fundamental purpose, to promote the exploitation for new and renewable sources of energy, non-conventional sources and new sources of energy in the country. It establishes incentives and legal advantages for the activities involving one or more of the following fields: Research, experimenting, education, training, promoting, diffusing, production, and the manufacturing of specific equipment. The use of new and renewable resources of energy and the marketing of products obtained from theses activities, are defined as “those such as solar radiation, wind, ocean tides, water, geothermal, biomass, and any other energy source that is not nuclear or that is produced by hydrocarbons and its derivates” (Article 7). Flow of Energy in Co-Generation In a typical co-generation plant, the main production of steam is made in the boilers. A water tube boiler constantly receives hot condensates from the evaporation process; the evaporators produce the condensate after using the exhaust steam and they return it to the boiler again. The condensate evaporates only if it receives heat transfer by radiation and convection supplied by the combustion of bagasse. Simultaneously, bagasse (fuel) will not burn unless there’s enough ventilation with air from the atmosphere flowing into the burner. Most modern facilities nowadays pre-heat the air flowing into the combustion chamber with the chimney gases from the boiler. This maintains an adequate turbulence and a bagasse bed that favors complete combustion.

359
Bagasse is a fuel obtained from the extraction process of sugarcane, meaning that the efficiency in the boiler will depend on the stability of the milling and the industrial processes. Two other energy flows generated from the boiler: On the one side, we have the steam produced that will later be used by the turbines; and on the other, the energy lost in the chimney gases, which represent the entropy in this process and which are expelled into the atmosphere. Even though, the boiler gases are sometimes used to pre-heat the condensates and the combustion air, they still carry with them an energy surplus that will not be completely used. The turbogenerator uses all the energy contained in the steam when it converts its enthalpy into electrical energy. This electrical energy is used to cover the demand from the industrial process, the boiler needs, and the turbine itself. The electrical energy surplus leaves the system towards the national electric network and the exhaust steam from the turbine, with less pressure and temperature, goes into the industrial process again to be reused, and then, condensated so it can go back to the boiler and begin the cycle again. Figure 2 illustrates the flow of the necessary energy inputs for the co-generation of thermal and electrical energy.
Figure 2. Flow of energy in a co-generating sugar mill
Offer and Demand in the Energy Market In practice, the amount of energy that can be produced and co-produced by each sugar mill varies according the capacity of each one has. This has been an incentive for growth and for investments in the future. At first, sugar mills
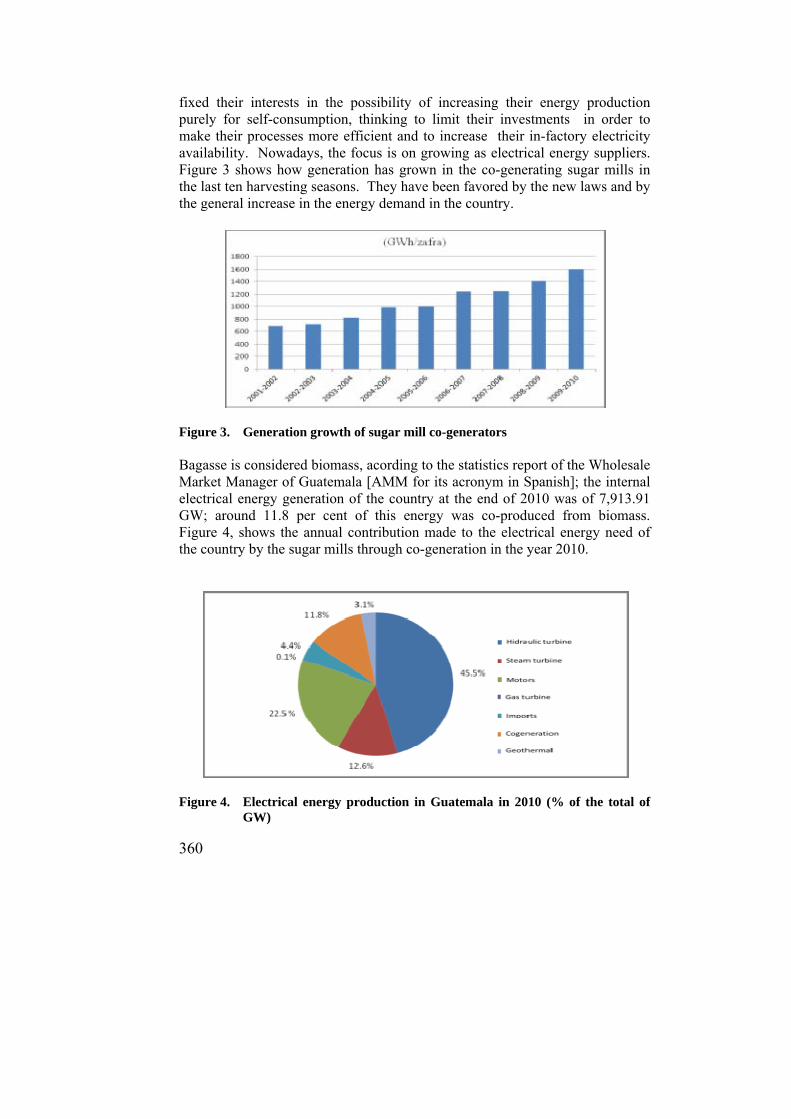
360
fixed their interests in the possibility of increasing their energy production purely for self-consumption, thinking to limit their investments in order to make their processes more efficient and to increase their in-factory electricity availability. Nowadays, the focus is on growing as electrical energy suppliers. Figure 3 shows how generation has grown in the co-generating sugar mills in the last ten harvesting seasons. They have been favored by the new laws and by the general increase in the energy demand in the country.
Figure 3. Generation growth of sugar mill co-generators Bagasse is considered biomass, acording to the statistics report of the Wholesale Market Manager of Guatemala [AMM for its acronym in Spanish]; the internal electrical energy generation of the country at the end of 2010 was of 7,913.91 GW; around 11.8 per cent of this energy was co-produced from biomass. Figure 4, shows the annual contribution made to the electrical energy need of the country by the sugar mills through co-generation in the year 2010.
Figure 4. Electrical energy production in Guatemala in 2010 (% of the total of
GW)
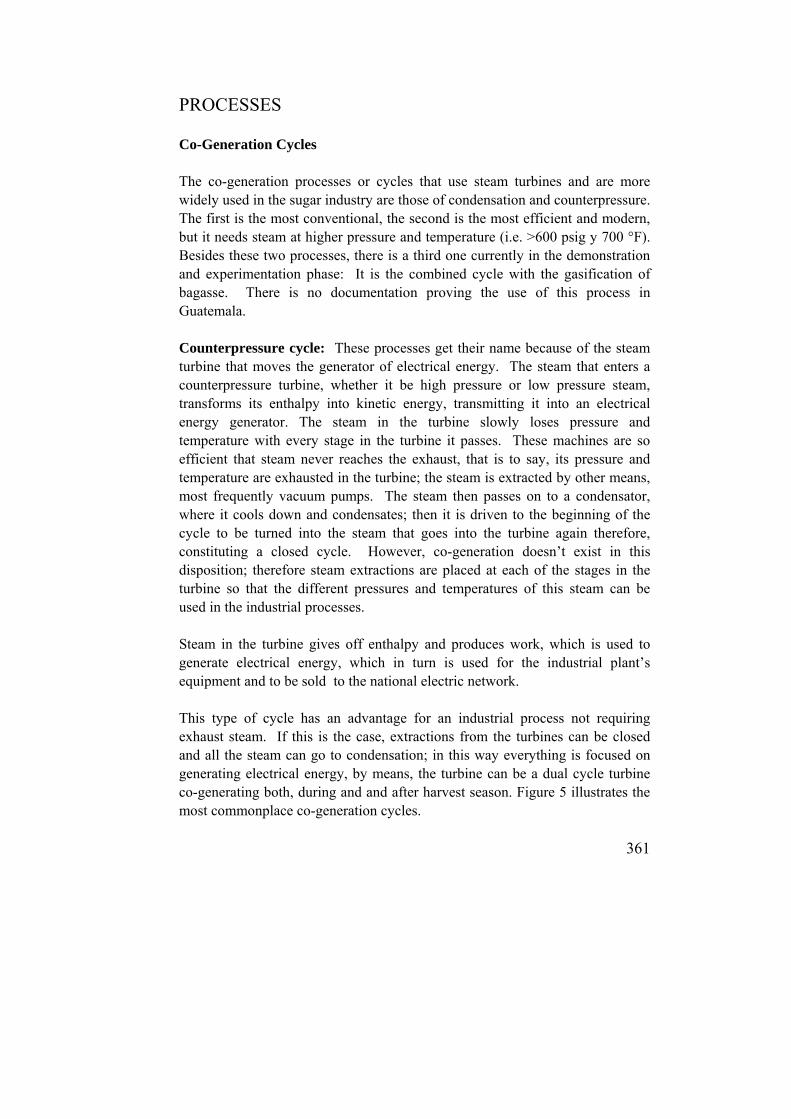
361
PROCESSES Co-Generation Cycles The co-generation processes or cycles that use steam turbines and are more widely used in the sugar industry are those of condensation and counterpressure. The first is the most conventional, the second is the most efficient and modern, but it needs steam at higher pressure and temperature (i.e. >600 psig y 700 °F). Besides these two processes, there is a third one currently in the demonstration and experimentation phase: It is the combined cycle with the gasification of bagasse. There is no documentation proving the use of this process in Guatemala. Counterpressure cycle: These processes get their name because of the steam turbine that moves the generator of electrical energy. The steam that enters a counterpressure turbine, whether it be high pressure or low pressure steam, transforms its enthalpy into kinetic energy, transmitting it into an electrical energy generator. The steam in the turbine slowly loses pressure and temperature with every stage in the turbine it passes. These machines are so efficient that steam never reaches the exhaust, that is to say, its pressure and temperature are exhausted in the turbine; the steam is extracted by other means, most frequently vacuum pumps. The steam then passes on to a condensator, where it cools down and condensates; then it is driven to the beginning of the cycle to be turned into the steam that goes into the turbine again therefore, constituting a closed cycle. However, co-generation doesn’t exist in this disposition; therefore steam extractions are placed at each of the stages in the turbine so that the different pressures and temperatures of this steam can be used in the industrial processes. Steam in the turbine gives off enthalpy and produces work, which is used to generate electrical energy, which in turn is used for the industrial plant’s equipment and to be sold to the national electric network. This type of cycle has an advantage for an industrial process not requiring exhaust steam. If this is the case, extractions from the turbines can be closed and all the steam can go to condensation; in this way everything is focused on generating electrical energy, by means, the turbine can be a dual cycle turbine co-generating both, during and and after harvest season. Figure 5 illustrates the most commonplace co-generation cycles.
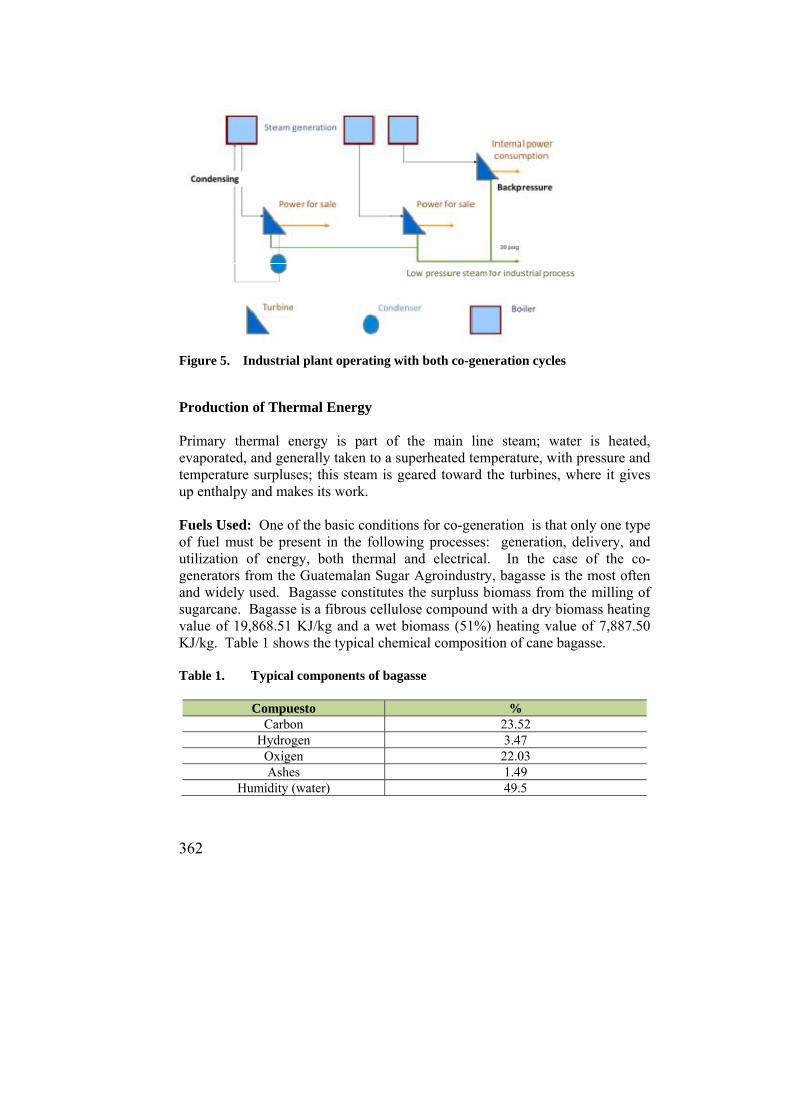
362
Figure 5. Industrial plant operating with both co-generation cycles
Production of Thermal Energy Primary thermal energy is part of the main line steam; water is heated, evaporated, and generally taken to a superheated temperature, with pressure and temperature surpluses; this steam is geared toward the turbines, where it gives up enthalpy and makes its work. Fuels Used: One of the basic conditions for co-generation is that only one type of fuel must be present in the following processes: generation, delivery, and utilization of energy, both thermal and electrical. In the case of the co-generators from the Guatemalan Sugar Agroindustry, bagasse is the most often and widely used. Bagasse constitutes the surpluss biomass from the milling of sugarcane. Bagasse is a fibrous cellulose compound with a dry biomass heating value of 19,868.51 KJ/kg and a wet biomass (51%) heating value of 7,887.50 KJ/kg. Table 1 shows the typical chemical composition of cane bagasse. Table 1. Typical components of bagasse
Compuesto % Carbon 23.52
Hydrogen 3.47 Oxigen 22.03 Ashes 1.49
Humidity (water) 49.5
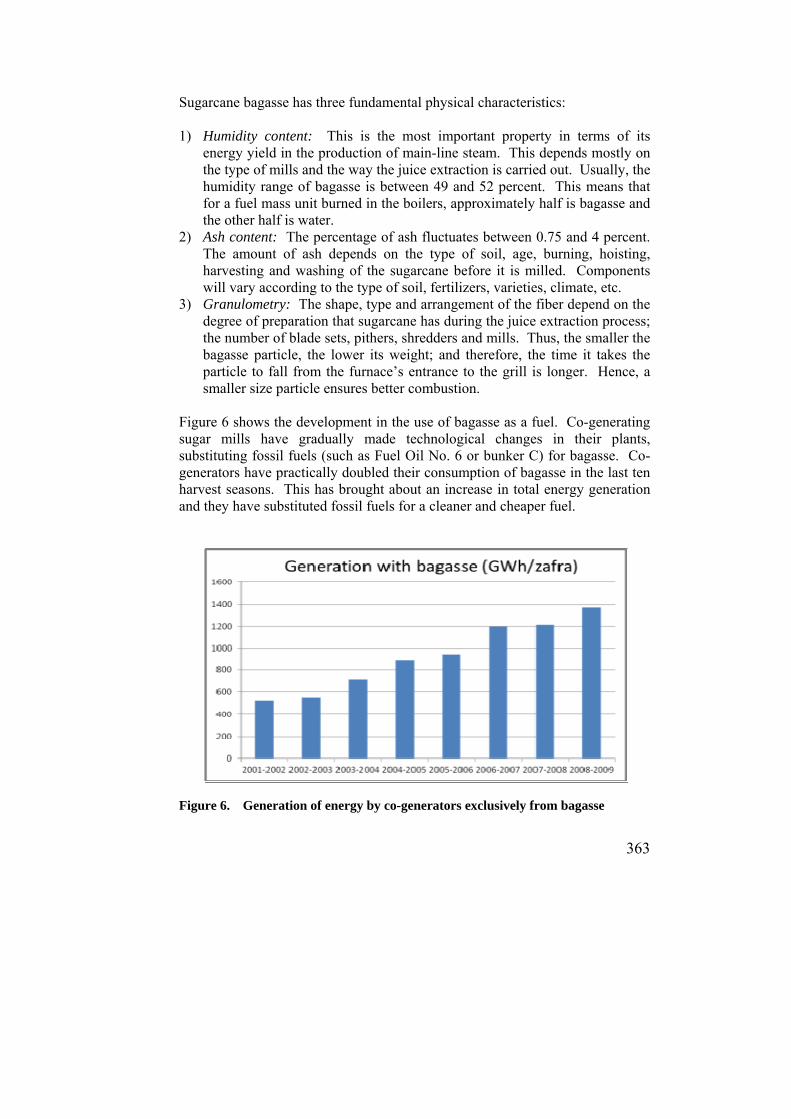
363
Sugarcane bagasse has three fundamental physical characteristics: 1) Humidity content: This is the most important property in terms of its
energy yield in the production of main-line steam. This depends mostly on the type of mills and the way the juice extraction is carried out. Usually, the humidity range of bagasse is between 49 and 52 percent. This means that for a fuel mass unit burned in the boilers, approximately half is bagasse and the other half is water.
2) Ash content: The percentage of ash fluctuates between 0.75 and 4 percent. The amount of ash depends on the type of soil, age, burning, hoisting, harvesting and washing of the sugarcane before it is milled. Components will vary according to the type of soil, fertilizers, varieties, climate, etc.
3) Granulometry: The shape, type and arrangement of the fiber depend on the degree of preparation that sugarcane has during the juice extraction process; the number of blade sets, pithers, shredders and mills. Thus, the smaller the bagasse particle, the lower its weight; and therefore, the time it takes the particle to fall from the furnace’s entrance to the grill is longer. Hence, a smaller size particle ensures better combustion.
Figure 6 shows the development in the use of bagasse as a fuel. Co-generating sugar mills have gradually made technological changes in their plants, substituting fossil fuels (such as Fuel Oil No. 6 or bunker C) for bagasse. Co-generators have practically doubled their consumption of bagasse in the last ten harvest seasons. This has brought about an increase in total energy generation and they have substituted fossil fuels for a cleaner and cheaper fuel.
Figure 6. Generation of energy by co-generators exclusively from bagasse

364
Main-line steam production: The fuel coming from the milling of the cane or from the stock warehouses is fed to the boilers by conveyor belts; once there, it is either automatically or manually fed into the boiler furnaces. Boilers are water tube steam generators. They take the thermal energy from the combustion of bagasse and transfer it to the water inside the tubes, through convection and conduction on the pipe walls, until it reaches a boiling and superheating temperature. The furnace in the boiler then continues to absorb energy in the form of vaporization latent heat; therefore the supply of water to the boiler must be continuous and constant during operation. The steam produced is led to the turbine facility through the piping system. The most important factors to take into account for an adequate and efficient production of steam in the boilers are: Automatic gauging of the pressure is a factor that must be designed
correctly. The gauging circuits must be able to balance the fuel-air ratio fed to the boilers as well as the gases produced and extracted from the furnace, so that the operation settings remain constant.
The humidity in the bagasse is a variable that directly affects the combustion. If it is too high, the heat produced by the fuel will first have to evaporate the water contained in the bagasse before burning and gasifying the fiber. The amount of humidity will depend on the imbibition water used during the extraction of the juice and on the operating conditions of the mills. A balance must be found so that resources and operations can be optimized in order to obtain the greatest possible yield in the extraction processes and in the generation of the steam.
Excess air. An efficient steam production process is in which, the excess in the combustion air is strictly controlled. An excess in air will ensure the transformation of all the carbon dioxide that will leave in the chimney gases. On the contrary, a lack of excess air will prevent the fuel from fully burning, producing carbon monoxide (CO), and carbonous particles. This increases the losses due to the fuel that didn’t burn completely and therefore the amount of ashes in the draining systems, the ashtrays and the chimneys as well. Too much air allows the production of NOX and it lowers gas temperatures.
The amount of ash produced. The ashes produced during combustion are mostly composed of sand from the fields, which doesn’t burn and immediately passes to the “non-burned” form the boiler. The lightest ashes and sand fly together with the combustion gases to the chimney; they cause wear, due to abrasion wherever they pass, especially in the areas where gases have a maximum velocity.
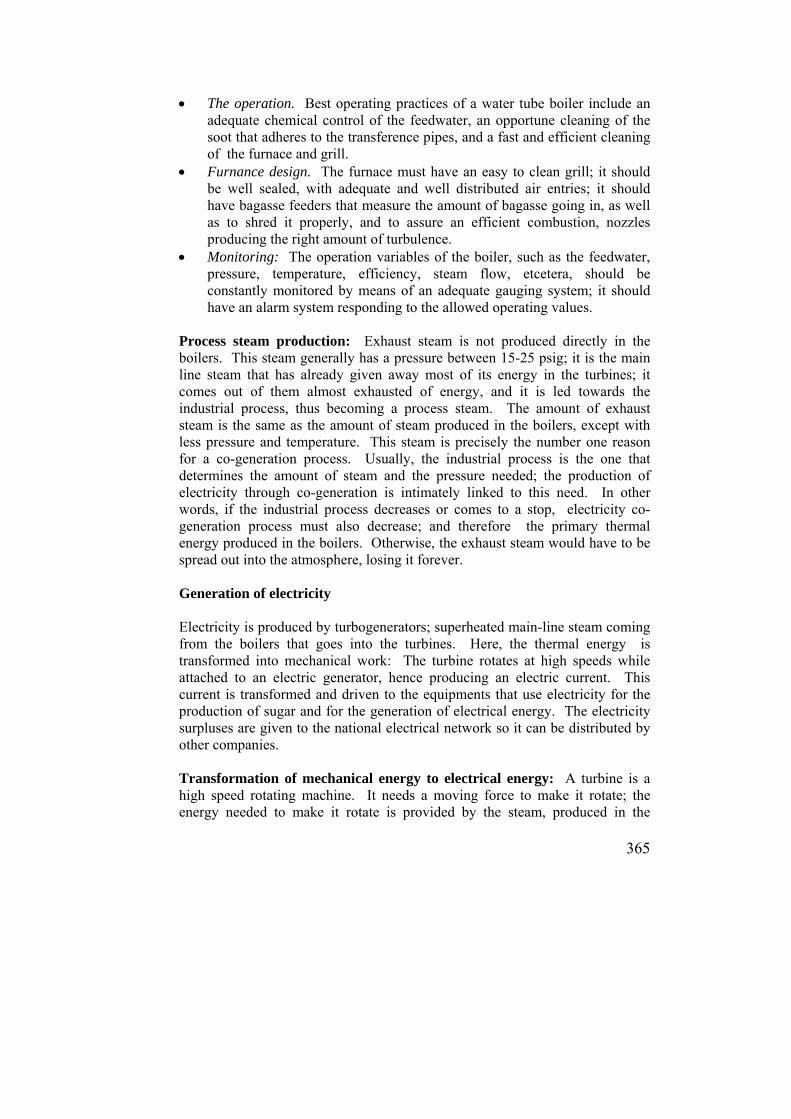
365
The operation. Best operating practices of a water tube boiler include an adequate chemical control of the feedwater, an opportune cleaning of the soot that adheres to the transference pipes, and a fast and efficient cleaning of the furnace and grill.
Furnance design. The furnace must have an easy to clean grill; it should be well sealed, with adequate and well distributed air entries; it should have bagasse feeders that measure the amount of bagasse going in, as well as to shred it properly, and to assure an efficient combustion, nozzles producing the right amount of turbulence.
Monitoring: The operation variables of the boiler, such as the feedwater, pressure, temperature, efficiency, steam flow, etcetera, should be constantly monitored by means of an adequate gauging system; it should have an alarm system responding to the allowed operating values.
Process steam production: Exhaust steam is not produced directly in the boilers. This steam generally has a pressure between 15-25 psig; it is the main line steam that has already given away most of its energy in the turbines; it comes out of them almost exhausted of energy, and it is led towards the industrial process, thus becoming a process steam. The amount of exhaust steam is the same as the amount of steam produced in the boilers, except with less pressure and temperature. This steam is precisely the number one reason for a co-generation process. Usually, the industrial process is the one that determines the amount of steam and the pressure needed; the production of electricity through co-generation is intimately linked to this need. In other words, if the industrial process decreases or comes to a stop, electricity co-generation process must also decrease; and therefore the primary thermal energy produced in the boilers. Otherwise, the exhaust steam would have to be spread out into the atmosphere, losing it forever. Generation of electricity Electricity is produced by turbogenerators; superheated main-line steam coming from the boilers that goes into the turbines. Here, the thermal energy is transformed into mechanical work: The turbine rotates at high speeds while attached to an electric generator, hence producing an electric current. This current is transformed and driven to the equipments that use electricity for the production of sugar and for the generation of electrical energy. The electricity surpluses are given to the national electrical network so it can be distributed by other companies. Transformation of mechanical energy to electrical energy: A turbine is a high speed rotating machine. It needs a moving force to make it rotate; the energy needed to make it rotate is provided by the steam, produced in the
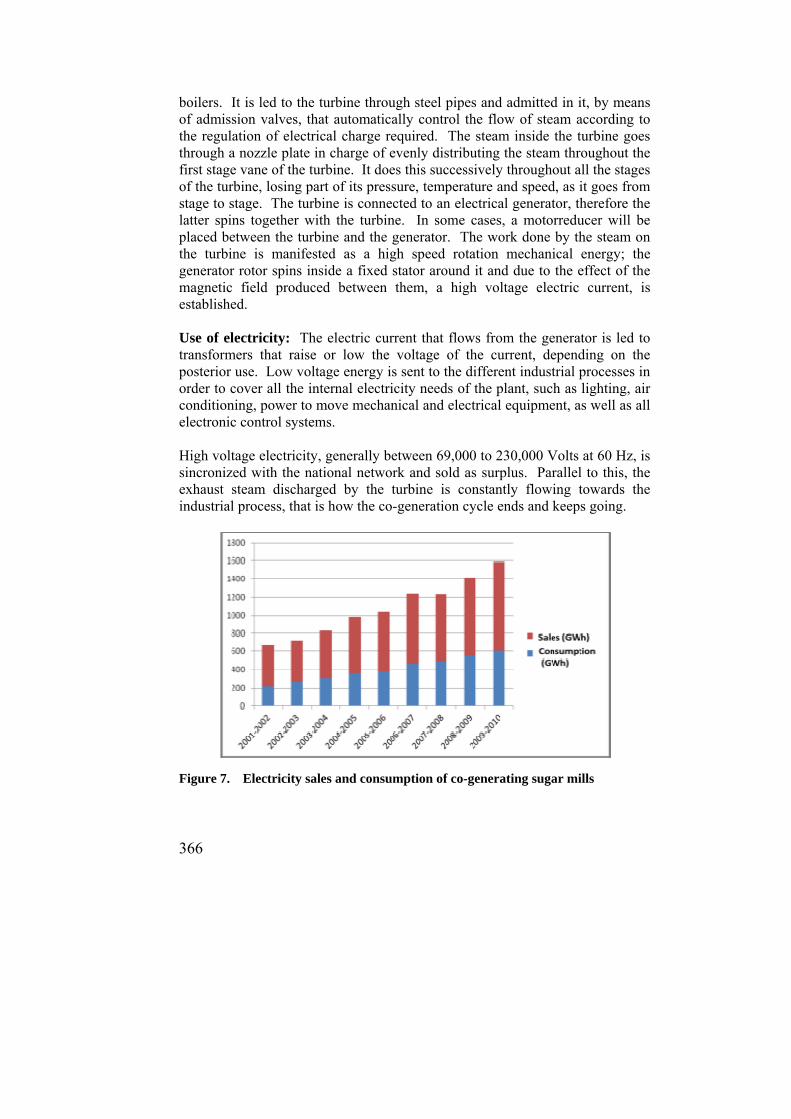
366
boilers. It is led to the turbine through steel pipes and admitted in it, by means of admission valves, that automatically control the flow of steam according to the regulation of electrical charge required. The steam inside the turbine goes through a nozzle plate in charge of evenly distributing the steam throughout the first stage vane of the turbine. It does this successively throughout all the stages of the turbine, losing part of its pressure, temperature and speed, as it goes from stage to stage. The turbine is connected to an electrical generator, therefore the latter spins together with the turbine. In some cases, a motorreducer will be placed between the turbine and the generator. The work done by the steam on the turbine is manifested as a high speed rotation mechanical energy; the generator rotor spins inside a fixed stator around it and due to the effect of the magnetic field produced between them, a high voltage electric current, is established. Use of electricity: The electric current that flows from the generator is led to transformers that raise or low the voltage of the current, depending on the posterior use. Low voltage energy is sent to the different industrial processes in order to cover all the internal electricity needs of the plant, such as lighting, air conditioning, power to move mechanical and electrical equipment, as well as all electronic control systems. High voltage electricity, generally between 69,000 to 230,000 Volts at 60 Hz, is sincronized with the national network and sold as surplus. Parallel to this, the exhaust steam discharged by the turbine is constantly flowing towards the industrial process, that is how the co-generation cycle ends and keeps going.
Figure 7. Electricity sales and consumption of co-generating sugar mills

367
Figure 7 shows the increase in electricity produced by co-generating sugar mills, as well as the consumption within the mills; part of the reason for the latter, is the electrification of the milling tandems. This consumption represents an improvement that can be monitored through efficient usage of energy efficiency indexes.
EFFICIENCY INDEXES The energy efficiency of a co-generating central in a sugar mill, is measured by the steam consumption, the production (generation) surplus and the steam production. These indexes are expressed as:
Specific process steam consumption (Kgv) per ton of milled sugarcane (Tc). If the consumption of process steam is decreased, the surpluses in fuel increase and the range of operation schedules for the co-generating plant broadens.
Steam consumption = Kgv / Tc
Specific production index of surplus electricity, expressed in KWh of
surplus electricity (internal consumption not taken into account) per milled sugarcane ton (Tc). The higher the surplus of electricity, the greater the revenue due to the increase in volume sold to the national electric network.
Production surplus = KWh/Tc
Steam production index; it represents the kg of steam generated in the
boiler for every kg of bagasse used as fuel.
Steam genetarion with bagasse = Kgs / Kgb
It represents the yield of the co-generating process cycle; less bagasse consumption means a higher fuel surplus and a better use of resources. COSTS In order to keep track of the co-generating costs, the cost of fuel-bagasse must first be established; its cost corresponds to the energy consumed in the extraction process. Operating costs must be added (personnel and maintenance), as well as the costs for chemical supplies for the water treatment

368
and electricity costs pertaining to the functioning of the equipment in the co-generating plant. In order to determine the costs of co-generation, a differentiation and distribution of the costs associated with each of the different processes must first take place: The cost of producing electricity The cost of producing sugar and of all the electricity consumed during the
process The cost of the exhaust steam used in the industrial process. Second, the way to assign the fuel is defined, which is attributed to each energy consumer in the process. This allocation should be based, as much as possible, according to the available enthalpy head, that is to say that energy should be weighed according to its ability to produce work at the specific point of demand.
GLOSSARY Biomass: Mass integrated by a diversity of bio-components with combustibility characteristics. For the present document, it refers to the mass subject to combustion in sugar mills, based on, sugarcane bagasse. Electric power: For a generator, power is the measure of the plant’s capacity to produce electric energy. It is the amount of electricity available at the plant for its clients. For a consumer, it is the measure of the amount of electricity it needs to operate or the amount of electricity demanded by its supplier. Electrical energy: It refers to the energy resulting from the existence of a potential difference between two points; this difference allows establishing current between both points. Shredders and mills: Equipment that prepares, shreds, and extracts juice and bagasse from sugarcane. Harvest season: Period of the year in which sugarcane is harvested, transported, milled, and processed to produce sugar. Boiler: Steam generator that uses heat produced by the burning of a fuel in order to produce steam at specific pressures and temperatures.

369
Turbine: Rotating machine in which steam is used in order to transform thermal energy to mechanical energy. If it is coupled to a generator, electrical energy is produced at the same time. The combination of these two machines is called: a TURBO-GENERATOR. Water-tube boiler: Boiler that uses a large amount of pipes in which water circulates; heat is transferred to the circulating water through the pipe walls and steam is thus produced. Main-line steam: Steam produced in the water-tube boilers for later use, exclusively by turbines. Exhaust steam: Steam that is discharged in the last stage of the turbines, for which energy can be used in subsequent industrial processes. AMM: [For the acronym it represents in Spanish] Guatemalan Wholesale Market Manager. It is the entity in charge of coordinating transactions between the agents in the electrical energy sector in Guatemala.
BIBLIOGRAPHY
1. Administrador del Mercado Mayorista. 2011. Informe Estadístico 2010. Guatemala. 32 p.
2. Agüero, C.; Pisa, J.; Andina, R. 2006. Consideraciones sobre el
aprovechamiento racional del bagazo de caña como combustible. Perú. 8 p. 3. Batres, Luis. 2008. Beneficios económicos de instalar una planta
cogeneradora de energía en Guatemala. España. 89 p. 4. Castillo, Leonidas. 2010. Resultados zafra 2009-2010. Presentación de la
Asociación de cogeneradores independientes. Guatemala, CENGICAÑA. 5. Hugot, E. 1964. Manual para Ingenios Azucareros. USA. 6. Kenneth Wark, Jr. 1996. Termodinámica. Quinta Edición. Editorial
McGRAW-HILL. pp. 783-787.

370
7. Logan, Christel. 2008. Régimen jurídico aplicable a la actividad de generación de energía eléctrica en el ordenamiento jurídico guatemalteco. Guatemala. 134 p.
8. Spiewak, Scott A. 1987. Cogeneration & Small power production manual.
USA. The Fairmont Press, INC. 642 p. 9. Vargas, Luis; La Fuente, Fernando. 2000. Cogeneración en Chile.
Potencialidad y desafíos. Revista Chilena de Energía. Volumen 430. pp. 1-4.

371
PRODUCTION OF ETHANOL
Rodolfo Espinosa y Claudia Ovando
INTRODUCTION
Ethanol or ethyl alcohol is a natural hydrocarbon, with general formula C2H5OH, which in chemical nomenclature is a derivate of ethane (C2H6). It is industrially produced by the fermentation process of glucose, a monomeric carbohydrate present in sucrose and other polymeric compounds, such as starch and cellulose. The intermediate or final syrups produced in sugar mills are rich in glucose or in sucrose. They can be converted into a mix of glucose/fructose by means of acid hydrolysis. These, in turn, can be transformed into ethanol by means of catalyzed glycolysis reactions with enzymes produced by microorganisms such as the yeast Saccharomyces cereviseae. The industrial production process of ethanol consists of three perfectly well defined stages: 1) Biochemical reactions which are a product of the metabolism of the microorganisms used to the effect; they transform fermentable sugars into ethyl alcohol, as a main product, and into other metabolic or residual byproducts, that depend on the purity of the raw material used, and on the environmental conditions in which the reaction takes place. 2) The separation of the desired product (ethanol) from the rest of the compounds present in the fermented mash and the concentration of the product, in order to reduce its volume for its later handling. The most widely used method to achieve this is distillation – separation of components due to their relative volatility, its different boiling and condensation temperatures, and other unit operations such as extraction, adsorption, etc. 3) The treatment, disposition, and best use of the byproducts separated during distillation. This last stage has recently gained vital importance in the better use of resources and environmental protection.
Rodolfo Espinosa, Ph.D., is a Chemical Engineer and Industrial Research Program Leader at
CENGICAÑA. www.cengicana.org; Claudia Ovando is Chemical Engineer, M.Sc. Head of Laboratory Processes, Bio Etanol, S.A. (Group Pantaleon) www.pantaleon.com

372
Figure 1. Production of ethanol Ethanol, as a product of fermentation has been used for over 40 centuries, mainly as an intoxicating drink. Other uses have been found for it in the last 200 years, such as industrial and medicinal uses. In the last 40 years yet another use for it has been found, as motor fuel, mostly due to the high prices of petroleum. Uses of ethanol: Intoxicating drink
Solvent for perfume industry and others
Medicine (antiseptic at 85%)
Industrial reactant
Fuel
Fuel for 4 stroke engines
Others
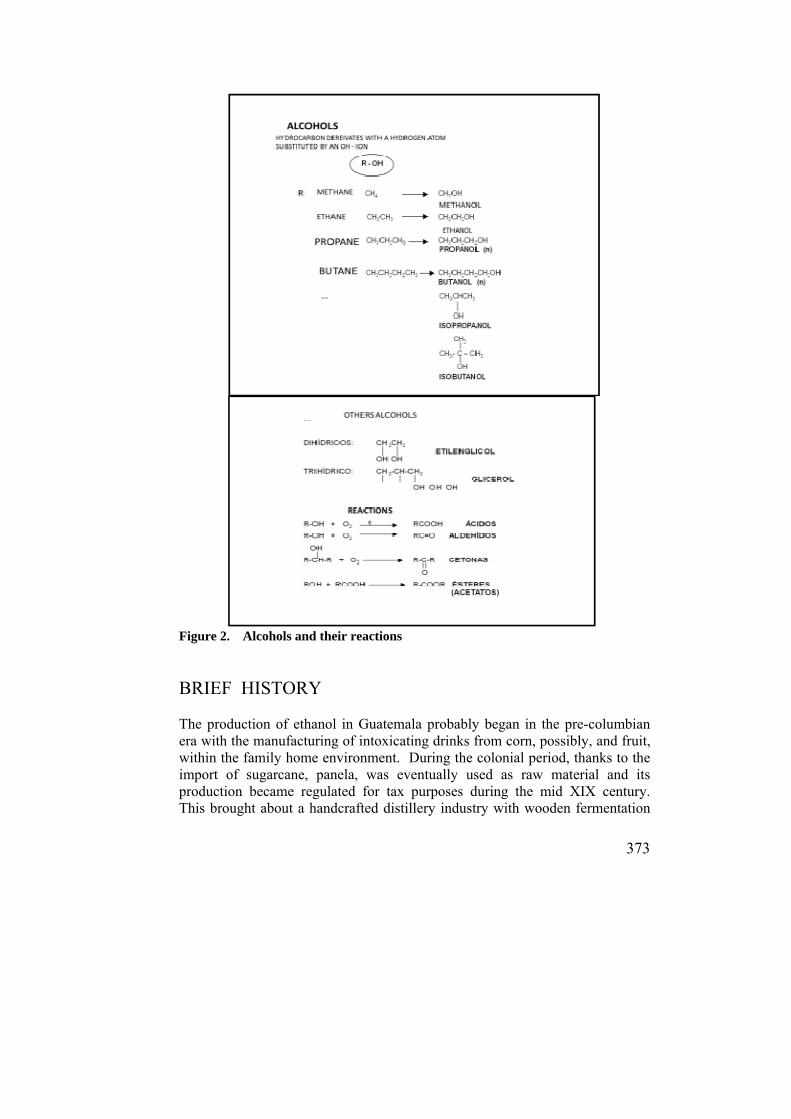
373
Figure 2. Alcohols and their reactions
BRIEF HISTORY The production of ethanol in Guatemala probably began in the pre-columbian era with the manufacturing of intoxicating drinks from corn, possibly, and fruit, within the family home environment. During the colonial period, thanks to the import of sugarcane, panela, was eventually used as raw material and its production became regulated for tax purposes during the mid XIX century. This brought about a handcrafted distillery industry with wooden fermentation
374
tanks and copper stills installed on the outskirts of the Income Revenue Service of each of the departments of Guatemala, for better tax control. During the mid XXth century, panela, and virgin syrups (concentrated juice at 45-60 Brix) producers, together with alchohol producers, got together to install a production and aging central facility in Santa Lucía Cotzumalguapa, with a more industrial than traditional infrastructure. Trapiches and sugar mills back then were the raw material suppliers (virgin syrup for “potable” alcohol and molasses for industrial alcohol (Circa, 1960)). The Guatemalan annual production in those years was approximately 5 million liters of ethanol, mostly for consumption as alcoholic beverages. Production increased during the next two decades up to 15 million liters, then to 30 million liters per year. Ultimately, it reached 40 million liters per year and two other distilleries emerged, one of them annexed, for the first time, to a sugar mill. Nowadays, sugarcane is harvested in 230,000 hectares of flatlands in the south coast and some small regions of the east and northeast of Guatemala. The average yield is 100 ton of cane/hectare. Twenty million tons of cane is annually milled with an average yield of 0.1 ton of sugar / ton of milled sugarcane. With the quantity of sugarcane actually cultivated in Guatemala, it could be possible to produce annually, between 360 million gallons of ethanol, if if sugar wasn’t produced; and 55 millions of gallons if only the molasses was processed. The current installed capacity to produce ethanol from molasses is approximately 40 million gallons a year in five distilleries adjacent to sugar mills. The annual consumption of gasoline in Guatemala, which is all imported, is 150 million gallons. If the necessary legislation existed, anhydrous ethanol mixed with gasoline to a 10% proportion would be able to substitute the MTBE (methyl-ter butyl-ether) that is incorporated into gasoline as an antiknocking agent, without making any modification to the vehicles already in circulation. The current production of ethanol from molasses is enough for such a substitution without affecting the sugar production in any way. Any surplus in the production of ethanol could be exported as a means of generating foreign currency capital, as is already done with present sugar exports.
DISTILLERY ANNEXED TO A SUGAR MILL With the increase of oil prices and its by-products (i.e. gasoline), the production of steam inside a distillery became non- cost effective. Steam is used as the main heat source in the distillation process and its production depended mostly on Bunker C. At the same time, co-generation of electricity within the sugar
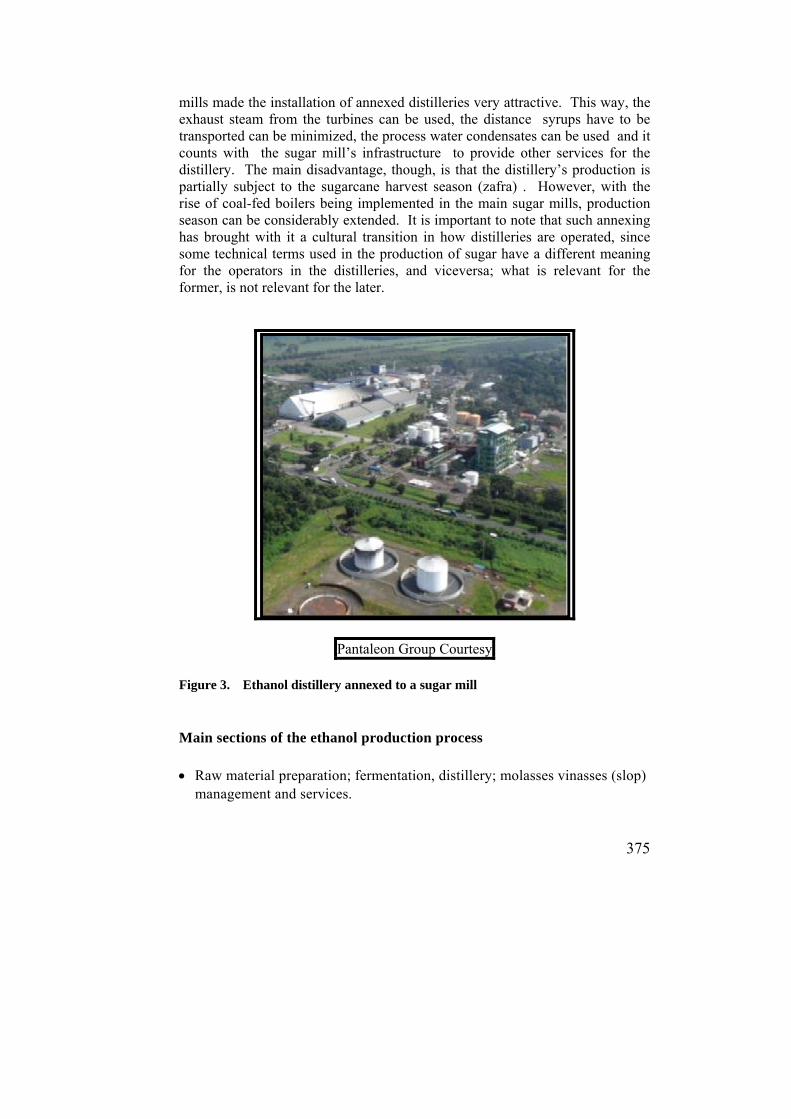
375
mills made the installation of annexed distilleries very attractive. This way, the exhaust steam from the turbines can be used, the distance syrups have to be transported can be minimized, the process water condensates can be used and it counts with the sugar mill’s infrastructure to provide other services for the distillery. The main disadvantage, though, is that the distillery’s production is partially subject to the sugarcane harvest season (zafra) . However, with the rise of coal-fed boilers being implemented in the main sugar mills, production season can be considerably extended. It is important to note that such annexing has brought with it a cultural transition in how distilleries are operated, since some technical terms used in the production of sugar have a different meaning for the operators in the distilleries, and viceversa; what is relevant for the former, is not relevant for the later.
Pantaleon Group Courtesy
Figure 3. Ethanol distillery annexed to a sugar mill Main sections of the ethanol production process Raw material preparation; fermentation, distillery; molasses vinasses (slop)
management and services.

376
Figure 4. Diagram of a typical process in a distillery
APPLIED PROCESSES Raw material Sugarcane mill produce juice with 13% of sugars; it is filtered and concentrated through evaporation to obtain syrup with 65% of sugars (saccharose, fructose, glucose, and others). This syrup or “meladura” is subjected to an evaporation/crystallization process , then separation of the cristals ( table sugar ) by consecutive centrifuging of syrups A and B. The final syrup, or syrup C, better known as molasses, has an average content of 50% of fermentable sugars (typically 33% saccharose, 9% glucose, and 8% fructose). The production of molasses is of 0.03 ton/ ton of milled cane, that is, 0.24 ton of molasses/ ton of sugar produced.
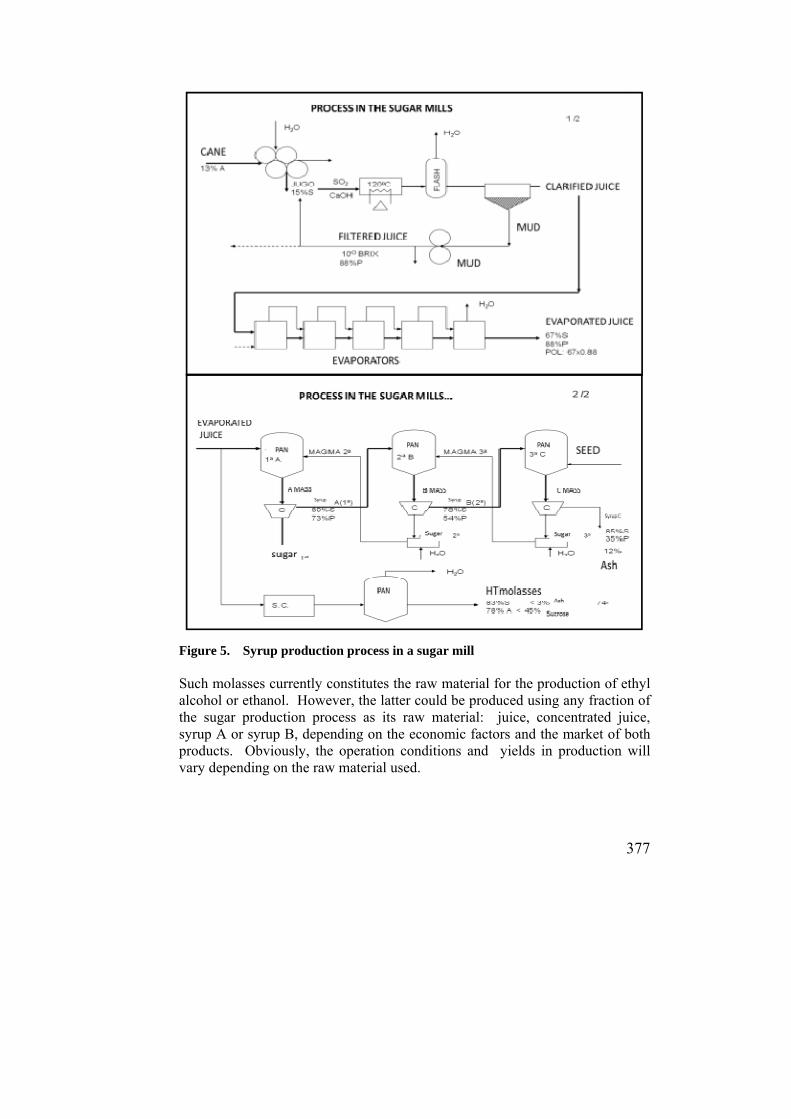
377
Figure 5. Syrup production process in a sugar mill
Such molasses currently constitutes the raw material for the production of ethyl alcohol or ethanol. However, the latter could be produced using any fraction of the sugar production process as its raw material: juice, concentrated juice, syrup A or syrup B, depending on the economic factors and the market of both products. Obviously, the operation conditions and yields in production will vary depending on the raw material used.
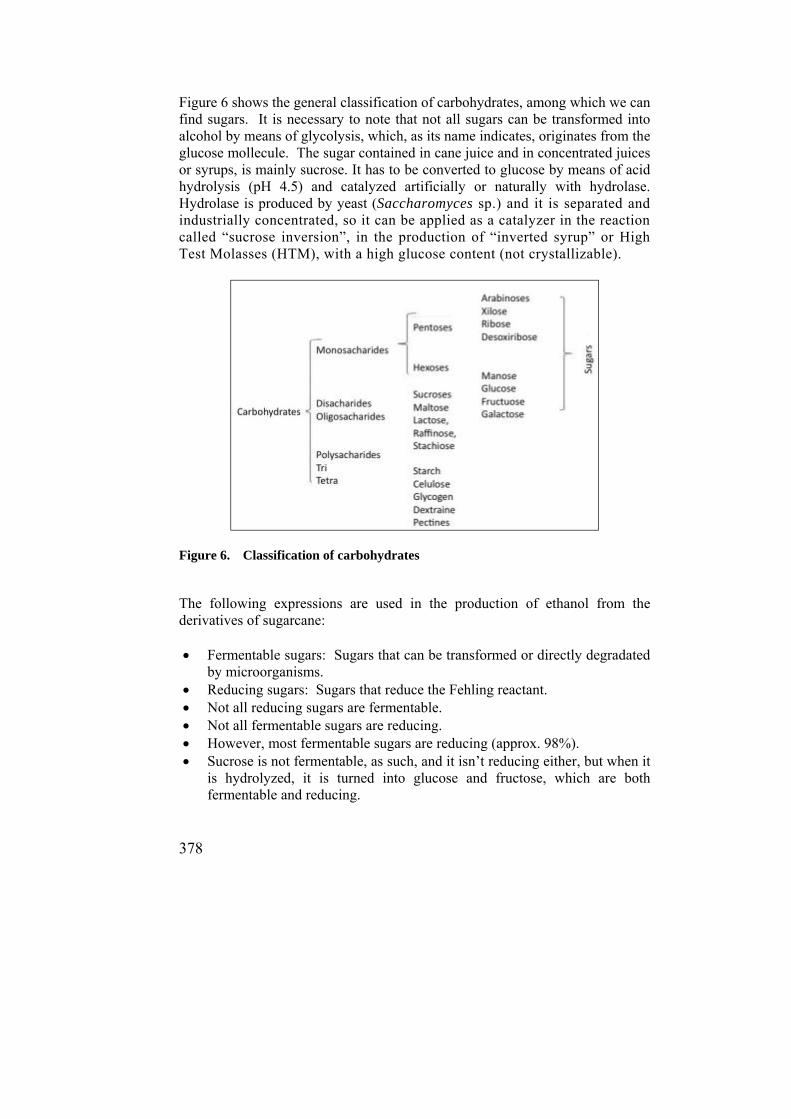
378
Figure 6 shows the general classification of carbohydrates, among which we can find sugars. It is necessary to note that not all sugars can be transformed into alcohol by means of glycolysis, which, as its name indicates, originates from the glucose mollecule. The sugar contained in cane juice and in concentrated juices or syrups, is mainly sucrose. It has to be converted to glucose by means of acid hydrolysis (pH 4.5) and catalyzed artificially or naturally with hydrolase. Hydrolase is produced by yeast (Saccharomyces sp.) and it is separated and industrially concentrated, so it can be applied as a catalyzer in the reaction called “sucrose inversion”, in the production of “inverted syrup” or High Test Molasses (HTM), with a high glucose content (not crystallizable).
Figure 6. Classification of carbohydrates The following expressions are used in the production of ethanol from the derivatives of sugarcane: Fermentable sugars: Sugars that can be transformed or directly degradated
by microorganisms. Reducing sugars: Sugars that reduce the Fehling reactant. Not all reducing sugars are fermentable. Not all fermentable sugars are reducing. However, most fermentable sugars are reducing (approx. 98%). Sucrose is not fermentable, as such, and it isn’t reducing either, but when it
is hydrolyzed, it is turned into glucose and fructose, which are both fermentable and reducing.
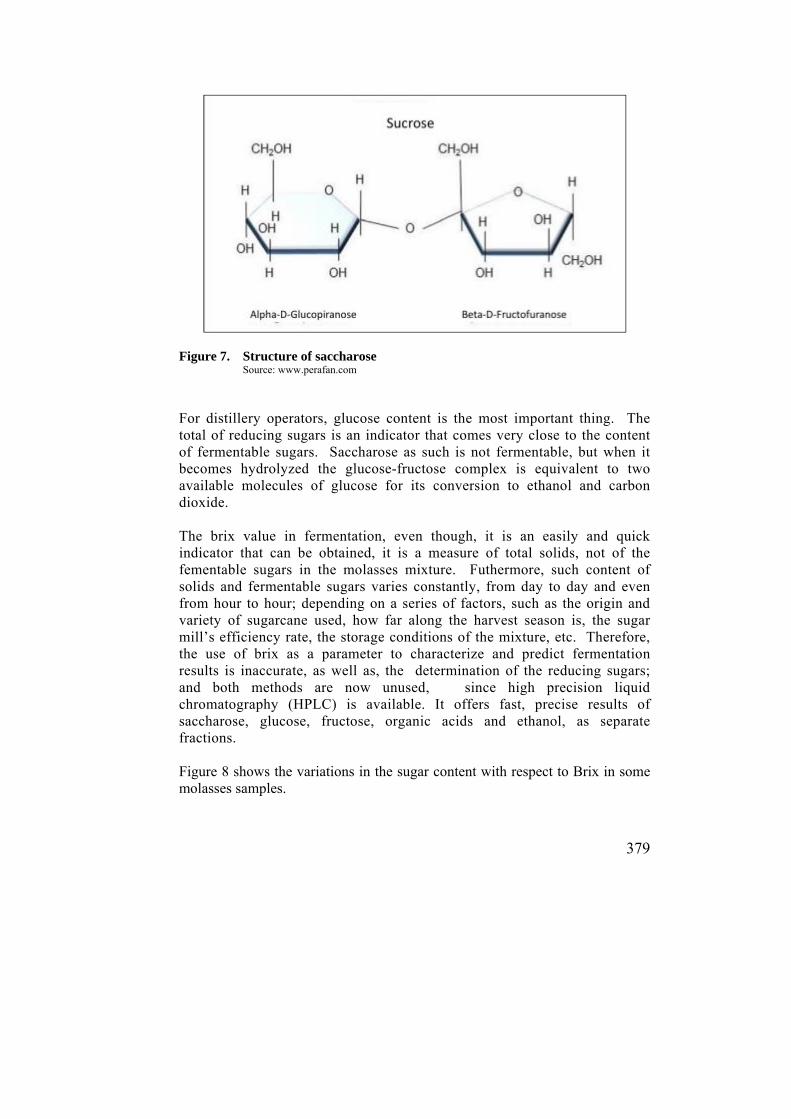
379
Figure 7. Structure of saccharose Source: www.perafan.com
For distillery operators, glucose content is the most important thing. The total of reducing sugars is an indicator that comes very close to the content of fermentable sugars. Saccharose as such is not fermentable, but when it becomes hydrolyzed the glucose-fructose complex is equivalent to two available molecules of glucose for its conversion to ethanol and carbon dioxide. The brix value in fermentation, even though, it is an easily and quick indicator that can be obtained, it is a measure of total solids, not of the fementable sugars in the molasses mixture. Futhermore, such content of solids and fermentable sugars varies constantly, from day to day and even from hour to hour; depending on a series of factors, such as the origin and variety of sugarcane used, how far along the harvest season is, the sugar mill’s efficiency rate, the storage conditions of the mixture, etc. Therefore, the use of brix as a parameter to characterize and predict fermentation results is inaccurate, as well as, the determination of the reducing sugars; and both methods are now unused, since high precision liquid chromatography (HPLC) is available. It offers fast, precise results of saccharose, glucose, fructose, organic acids and ethanol, as separate fractions. Figure 8 shows the variations in the sugar content with respect to Brix in some molasses samples.

380
Figure 8. Relationship in sugar concentration and Brix degrees
Microbiology The production of alcohol is a multidisciplinary process based on chemistry, biochemistry, and microbiology. In the past, the production of alcohol was considered an artform, and it wasn’t until 150 years ago that the science of alcohol fermentation was described. Treating the process with full knowledge on its scientific basis it is possible to reduce the number of microbiological and engineering problems, thus obtaining better operation results and a better use of the raw materials (Ingledew, ATB). Having knowledge of the microbiological aspects of alcohol fermentation is fundamental, since the main players in the reaction are yeasts and the other competing microorganisms (bacterial contamination). Yeast is a type of unicellular fungus (eumycete). It is generally reproduced through budding. Being unicellular microorganisms, they grow and reproduce faster than filamentous fungi in proportion to their weight; they are better equipped to carry out chemical changes since they have a greater surface area in proportion to their volume. They are easily differentiated from most bacteria due to their relatively large size (Pelczar, 1982). They differ in size and shape; they can measure anywhere from 1-5 microns in diameter. The most widely used yeast in the regular alcohol fermentation processes is the Saccharomyces cereviseae strain (bread leavening yeast).
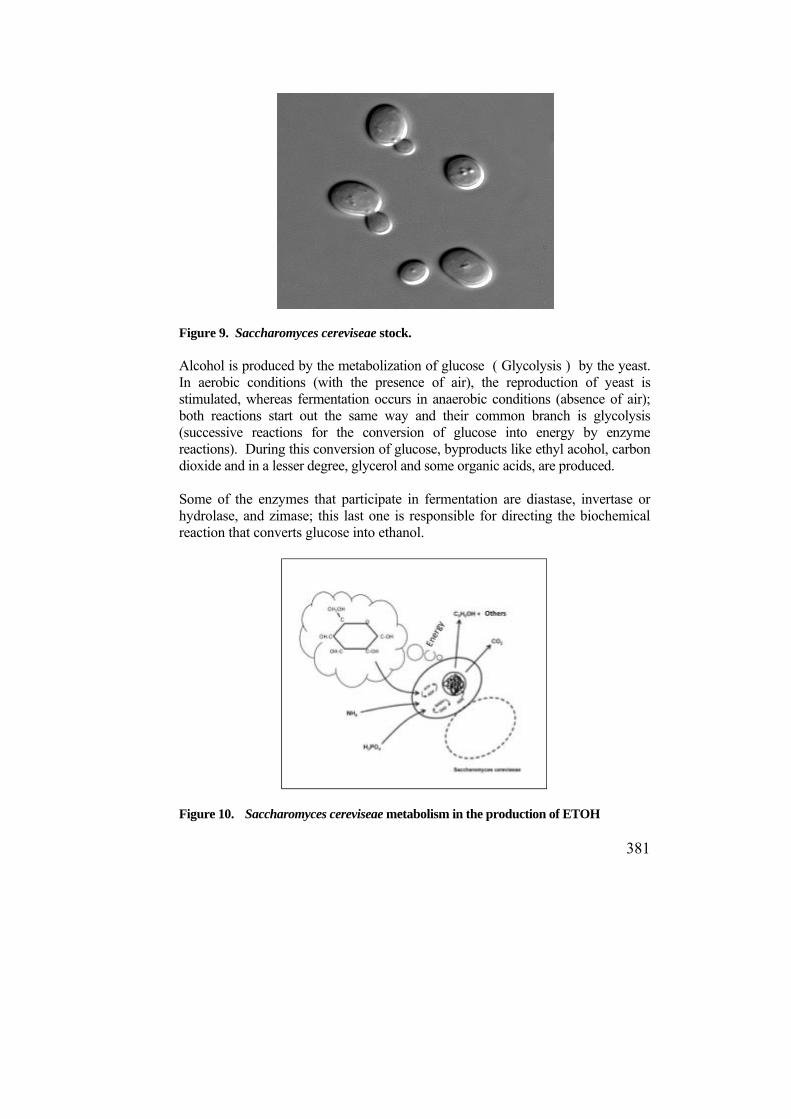
381
Figure 9. Saccharomyces cereviseae stock. Alcohol is produced by the metabolization of glucose ( Glycolysis ) by the yeast. In aerobic conditions (with the presence of air), the reproduction of yeast is stimulated, whereas fermentation occurs in anaerobic conditions (absence of air); both reactions start out the same way and their common branch is glycolysis (successive reactions for the conversion of glucose into energy by enzyme reactions). During this conversion of glucose, byproducts like ethyl acohol, carbon dioxide and in a lesser degree, glycerol and some organic acids, are produced. Some of the enzymes that participate in fermentation are diastase, invertase or hydrolase, and zimase; this last one is responsible for directing the biochemical reaction that converts glucose into ethanol.
Figure 10. Saccharomyces cereviseae metabolism in the production of ETOH
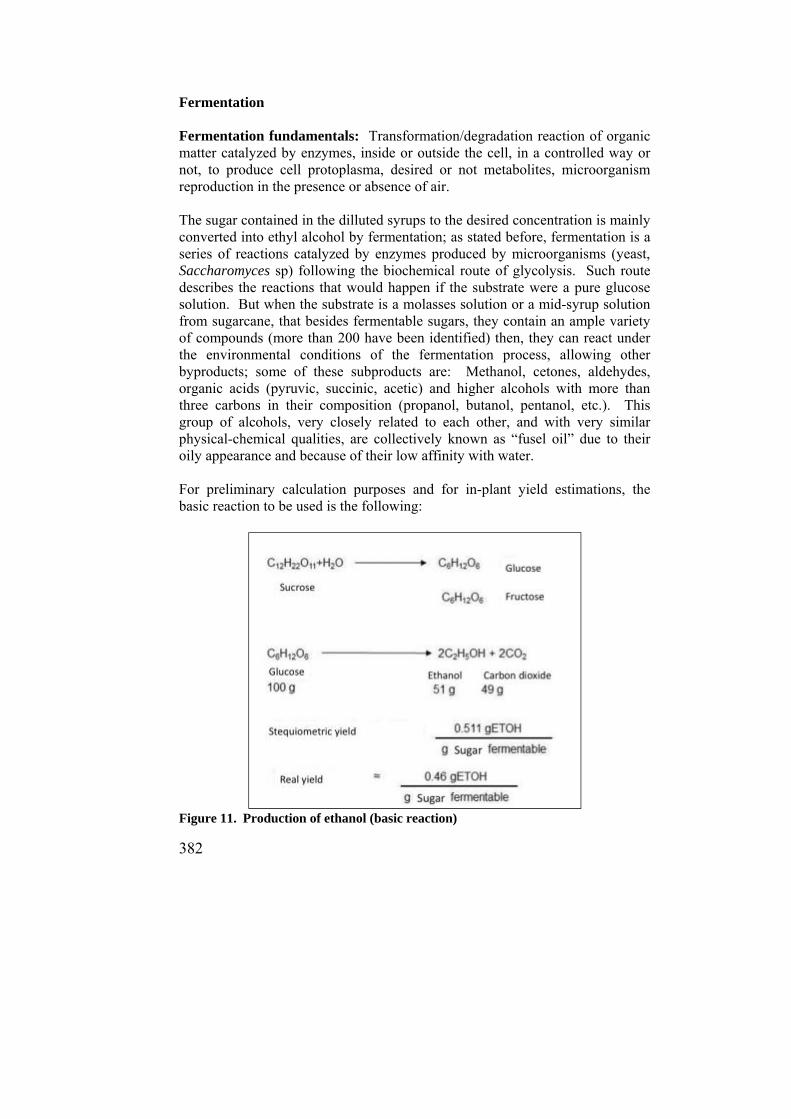
382
Fermentation Fermentation fundamentals: Transformation/degradation reaction of organic matter catalyzed by enzymes, inside or outside the cell, in a controlled way or not, to produce cell protoplasma, desired or not metabolites, microorganism reproduction in the presence or absence of air. The sugar contained in the dilluted syrups to the desired concentration is mainly converted into ethyl alcohol by fermentation; as stated before, fermentation is a series of reactions catalyzed by enzymes produced by microorganisms (yeast, Saccharomyces sp) following the biochemical route of glycolysis. Such route describes the reactions that would happen if the substrate were a pure glucose solution. But when the substrate is a molasses solution or a mid-syrup solution from sugarcane, that besides fermentable sugars, they contain an ample variety of compounds (more than 200 have been identified) then, they can react under the environmental conditions of the fermentation process, allowing other byproducts; some of these subproducts are: Methanol, cetones, aldehydes, organic acids (pyruvic, succinic, acetic) and higher alcohols with more than three carbons in their composition (propanol, butanol, pentanol, etc.). This group of alcohols, very closely related to each other, and with very similar physical-chemical qualities, are collectively known as “fusel oil” due to their oily appearance and because of their low affinity with water. For preliminary calculation purposes and for in-plant yield estimations, the basic reaction to be used is the following:
Figure 11. Production of ethanol (basic reaction)
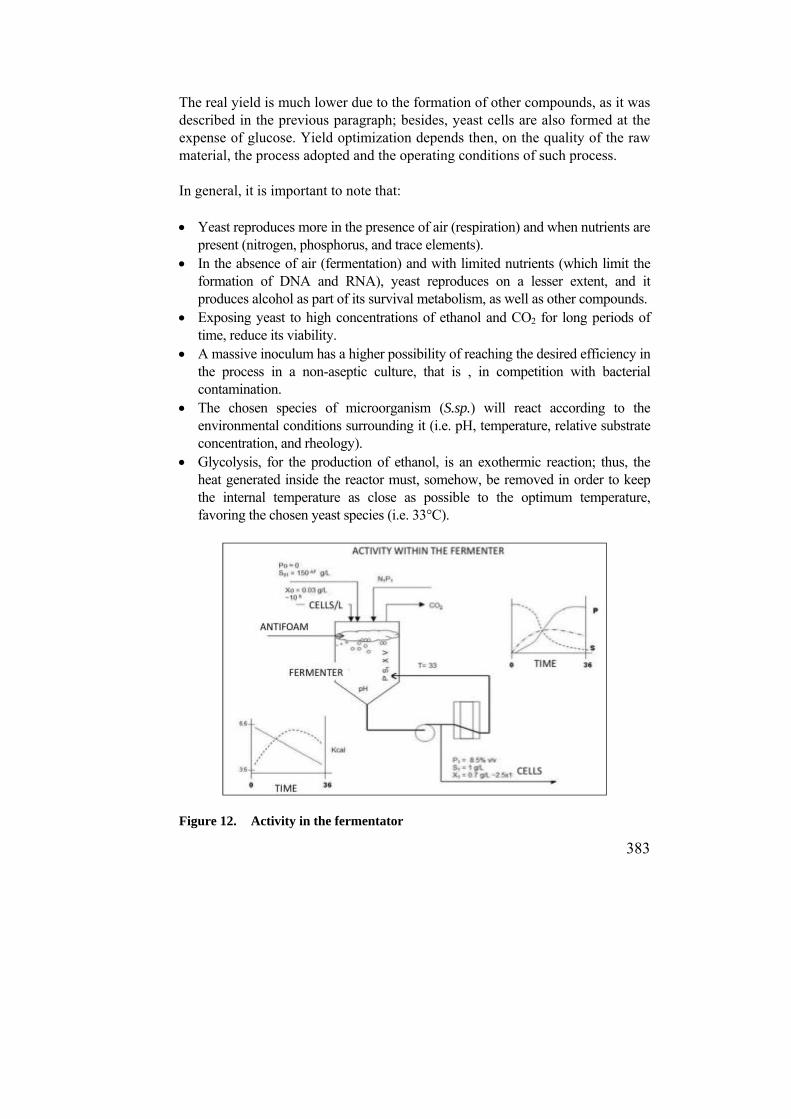
383
The real yield is much lower due to the formation of other compounds, as it was described in the previous paragraph; besides, yeast cells are also formed at the expense of glucose. Yield optimization depends then, on the quality of the raw material, the process adopted and the operating conditions of such process. In general, it is important to note that: Yeast reproduces more in the presence of air (respiration) and when nutrients are
present (nitrogen, phosphorus, and trace elements). In the absence of air (fermentation) and with limited nutrients (which limit the
formation of DNA and RNA), yeast reproduces on a lesser extent, and it produces alcohol as part of its survival metabolism, as well as other compounds.
Exposing yeast to high concentrations of ethanol and CO2 for long periods of time, reduce its viability.
A massive inoculum has a higher possibility of reaching the desired efficiency in the process in a non-aseptic culture, that is , in competition with bacterial contamination.
The chosen species of microorganism (S.sp.) will react according to the environmental conditions surrounding it (i.e. pH, temperature, relative substrate concentration, and rheology).
Glycolysis, for the production of ethanol, is an exothermic reaction; thus, the heat generated inside the reactor must, somehow, be removed in order to keep the internal temperature as close as possible to the optimum temperature, favoring the chosen yeast species (i.e. 33°C).
Figure 12. Activity in the fermentator
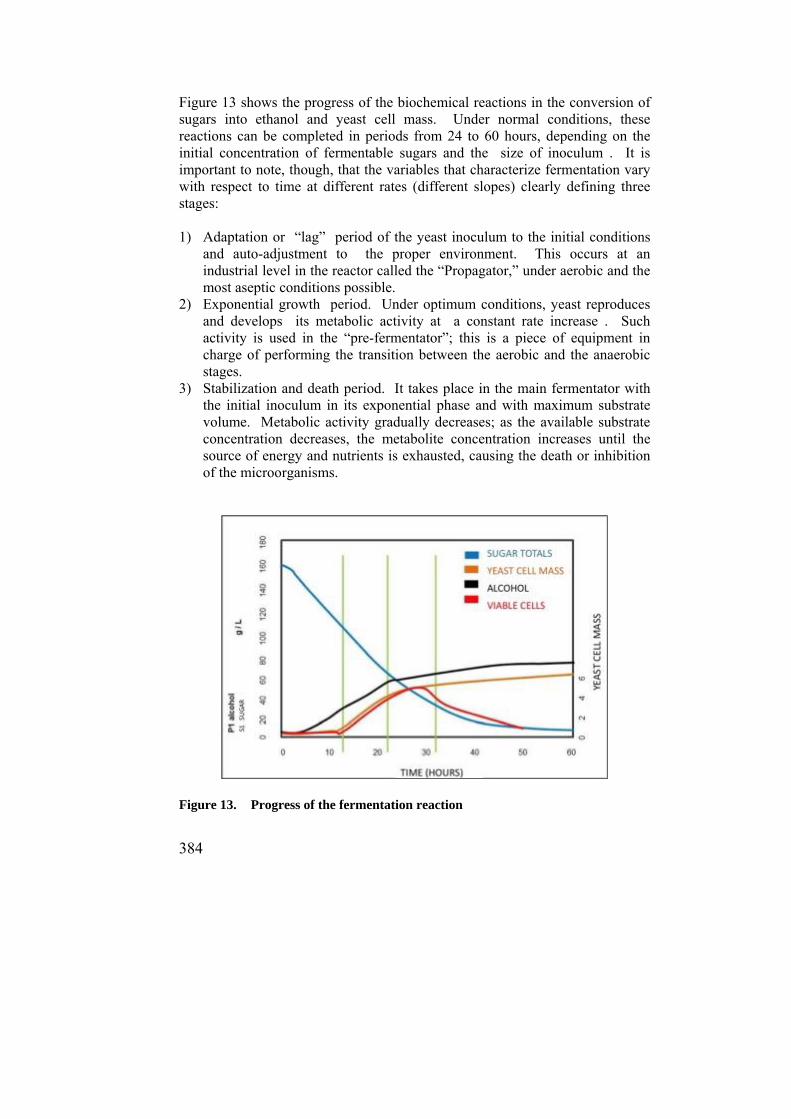
384
Figure 13 shows the progress of the biochemical reactions in the conversion of sugars into ethanol and yeast cell mass. Under normal conditions, these reactions can be completed in periods from 24 to 60 hours, depending on the initial concentration of fermentable sugars and the size of inoculum . It is important to note, though, that the variables that characterize fermentation vary with respect to time at different rates (different slopes) clearly defining three stages: 1) Adaptation or “lag” period of the yeast inoculum to the initial conditions
and auto-adjustment to the proper environment. This occurs at an industrial level in the reactor called the “Propagator,” under aerobic and the most aseptic conditions possible.
2) Exponential growth period. Under optimum conditions, yeast reproduces and develops its metabolic activity at a constant rate increase . Such activity is used in the “pre-fermentator”; this is a piece of equipment in charge of performing the transition between the aerobic and the anaerobic stages.
3) Stabilization and death period. It takes place in the main fermentator with the initial inoculum in its exponential phase and with maximum substrate volume. Metabolic activity gradually decreases; as the available substrate concentration decreases, the metabolite concentration increases until the source of energy and nutrients is exhausted, causing the death or inhibition of the microorganisms.
Figure 13. Progress of the fermentation reaction
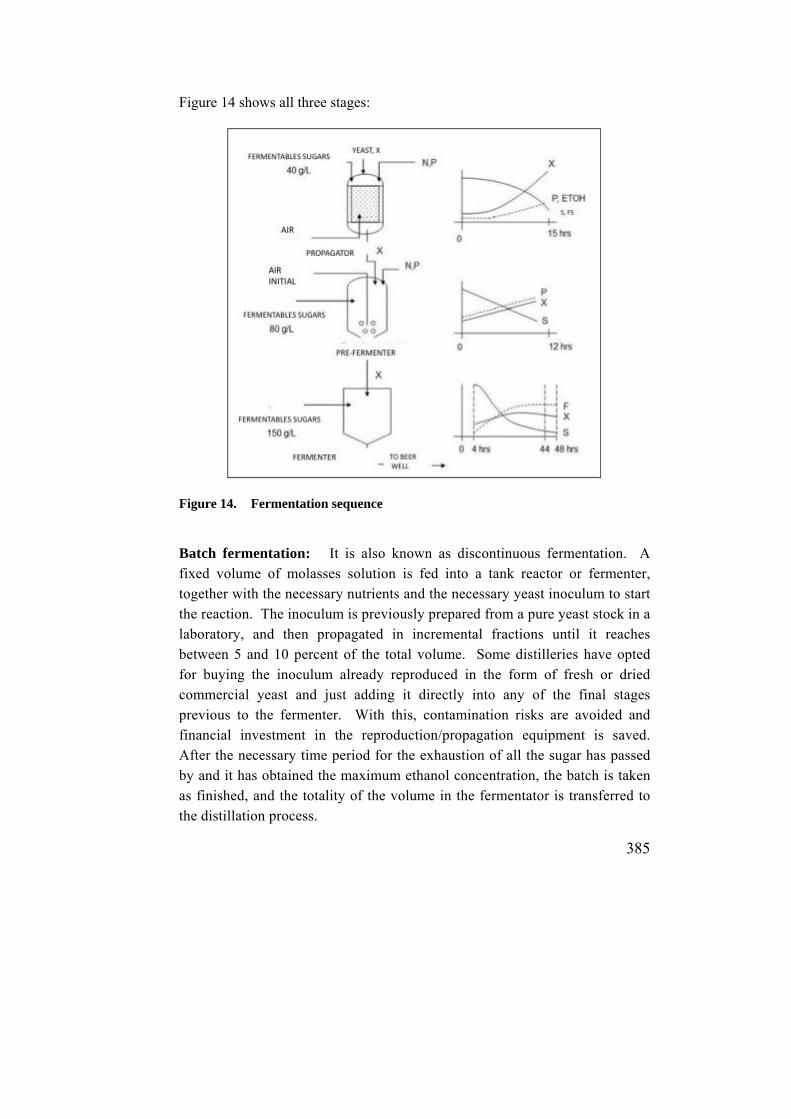
385
Figure 14 shows all three stages:
Figure 14. Fermentation sequence
Batch fermentation: It is also known as discontinuous fermentation. A fixed volume of molasses solution is fed into a tank reactor or fermenter, together with the necessary nutrients and the necessary yeast inoculum to start the reaction. The inoculum is previously prepared from a pure yeast stock in a laboratory, and then propagated in incremental fractions until it reaches between 5 and 10 percent of the total volume. Some distilleries have opted for buying the inoculum already reproduced in the form of fresh or dried commercial yeast and just adding it directly into any of the final stages previous to the fermenter. With this, contamination risks are avoided and financial investment in the reproduction/propagation equipment is saved. After the necessary time period for the exhaustion of all the sugar has passed by and it has obtained the maximum ethanol concentration, the batch is taken as finished, and the totality of the volume in the fermentator is transferred to the distillation process.
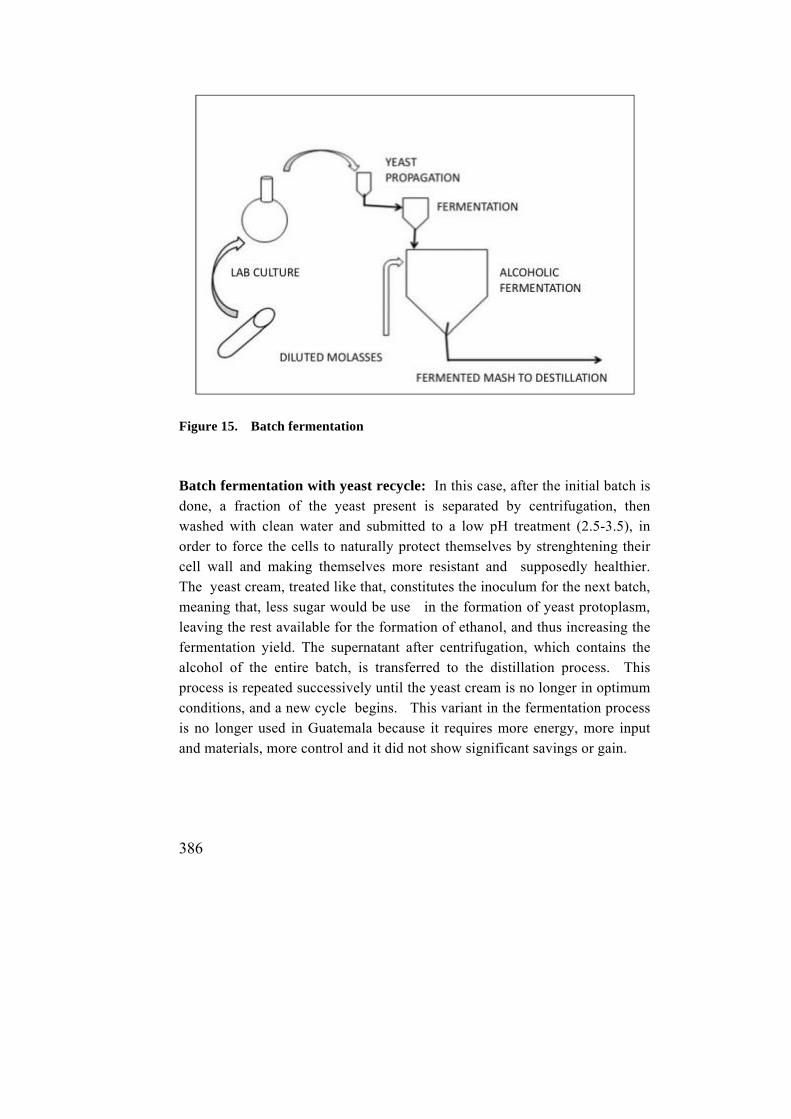
386
Figure 15. Batch fermentation
Batch fermentation with yeast recycle: In this case, after the initial batch is done, a fraction of the yeast present is separated by centrifugation, then washed with clean water and submitted to a low pH treatment (2.5-3.5), in order to force the cells to naturally protect themselves by strenghtening their cell wall and making themselves more resistant and supposedly healthier. The yeast cream, treated like that, constitutes the inoculum for the next batch, meaning that, less sugar would be use in the formation of yeast protoplasm, leaving the rest available for the formation of ethanol, and thus increasing the fermentation yield. The supernatant after centrifugation, which contains the alcohol of the entire batch, is transferred to the distillation process. This process is repeated successively until the yeast cream is no longer in optimum conditions, and a new cycle begins. This variant in the fermentation process is no longer used in Guatemala because it requires more energy, more input and materials, more control and it did not show significant savings or gain.
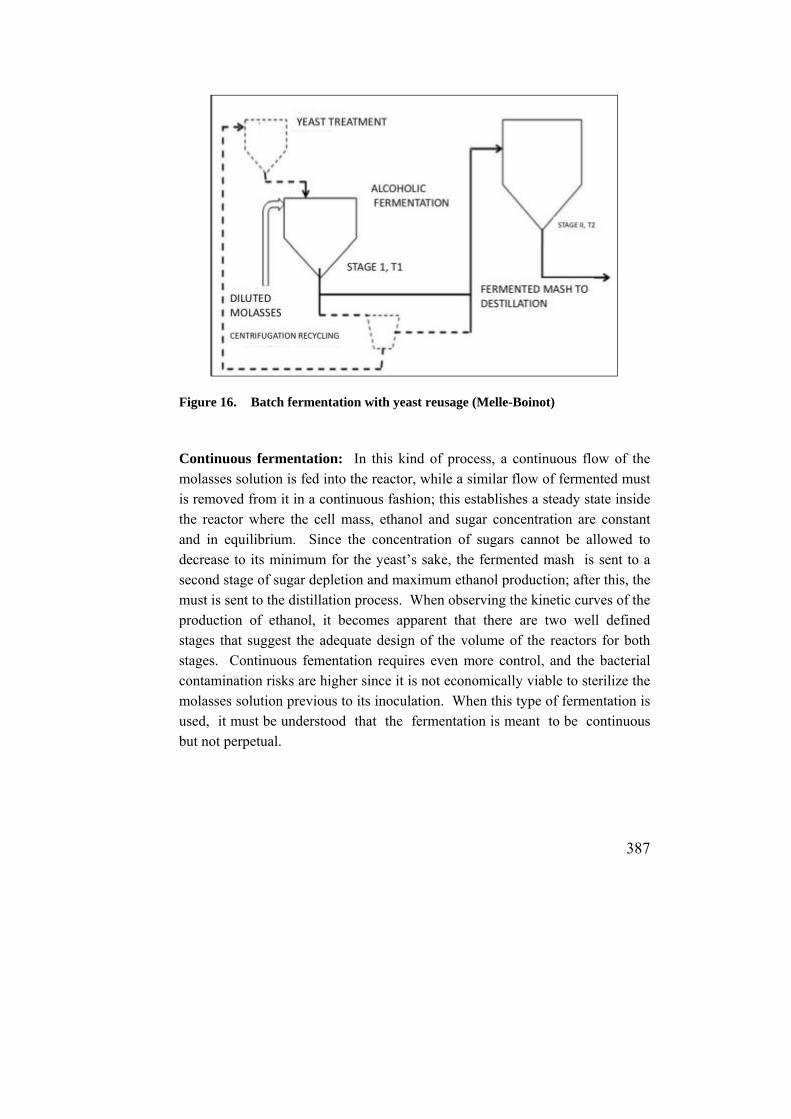
387
Figure 16. Batch fermentation with yeast reusage (Melle-Boinot) Continuous fermentation: In this kind of process, a continuous flow of the molasses solution is fed into the reactor, while a similar flow of fermented must is removed from it in a continuous fashion; this establishes a steady state inside the reactor where the cell mass, ethanol and sugar concentration are constant and in equilibrium. Since the concentration of sugars cannot be allowed to decrease to its minimum for the yeast’s sake, the fermented mash is sent to a second stage of sugar depletion and maximum ethanol production; after this, the must is sent to the distillation process. When observing the kinetic curves of the production of ethanol, it becomes apparent that there are two well defined stages that suggest the adequate design of the volume of the reactors for both stages. Continuous fementation requires even more control, and the bacterial contamination risks are higher since it is not economically viable to sterilize the molasses solution previous to its inoculation. When this type of fermentation is used, it must be understood that the fermentation is meant to be continuous but not perpetual.

388
Figure 17. Continuous fermentation
Discontinuous fermentation with continuous pre-fermentation: This is a variant of the previous process where the kinetics of alcohol fermentation is used at a maximum level. Yeast is propagated once and fed into the pre-fermentator, so it can develop its logarithmic cell growth and production rate of ethanol. Feeding the syrup or molasses solution is done in a continuous manner. When the volume is complete and the culture has been kept in its optimum exponential conditions, part of it (80%) is transferred to the final fermentator as inoculum , at the same time that this is being filled up. The 20% that remains in the pre-fermentator is used as inoculum for the fermentable culture medium that is continuously fed into it, in preparation for the subsequent fermentator, and so on. This allows the fermentation curves to be kept optimized; it also shortens the total fermentation cycle since fermentation also occurs during the filling and emptying of the fermenters.
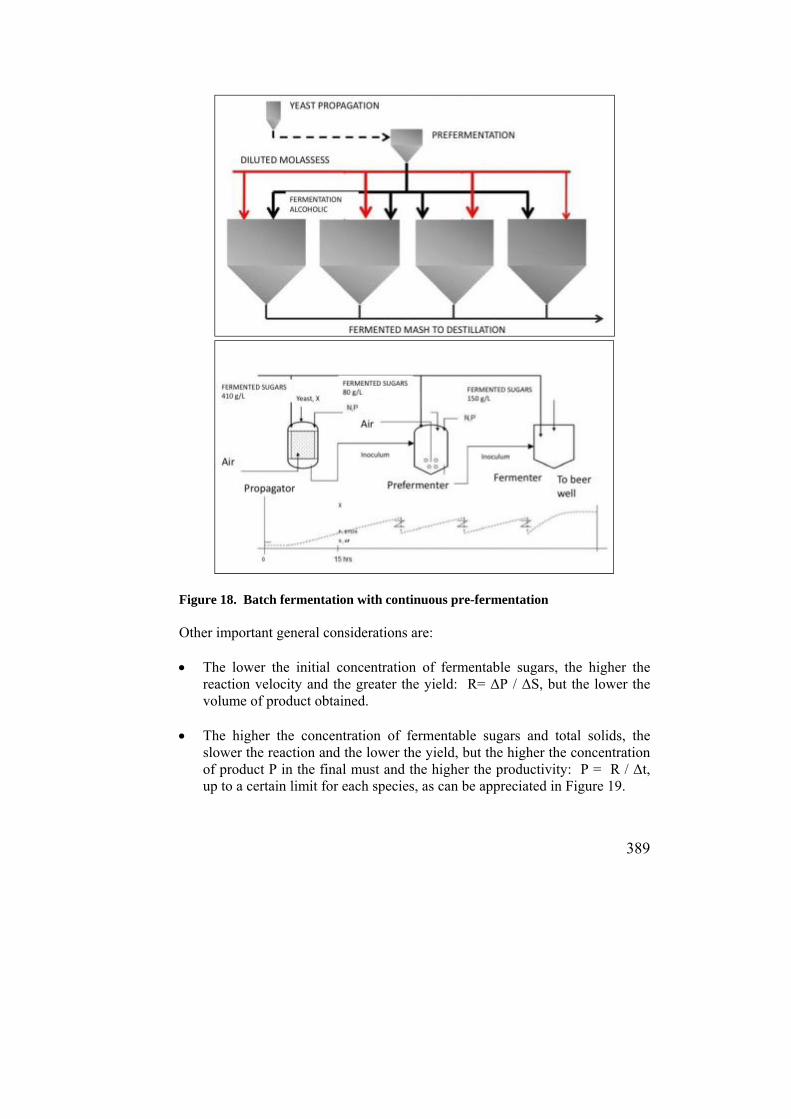
389
Figure 18. Batch fermentation with continuous pre-fermentation
Other important general considerations are: The lower the initial concentration of fermentable sugars, the higher the
reaction velocity and the greater the yield: R= ΔP / ΔS, but the lower the volume of product obtained.
The higher the concentration of fermentable sugars and total solids, the
slower the reaction and the lower the yield, but the higher the concentration of product P in the final must and the higher the productivity: P = R / Δt, up to a certain limit for each species, as can be appreciated in Figure 19.
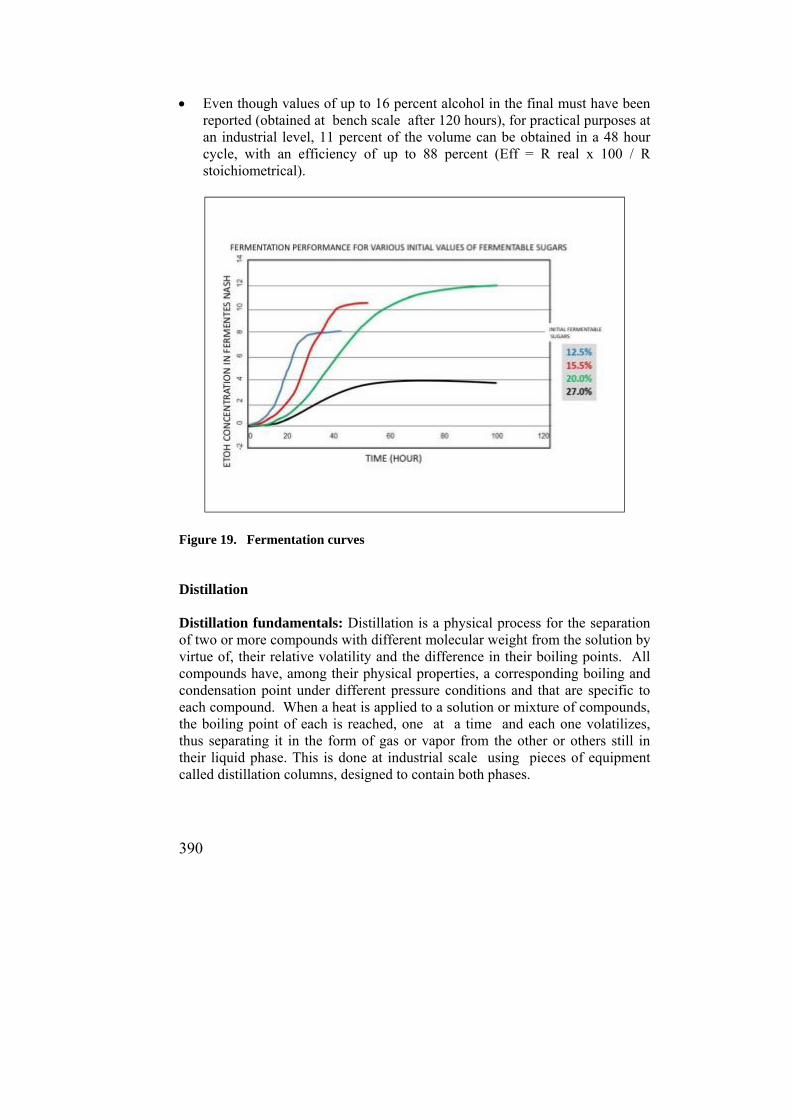
390
Even though values of up to 16 percent alcohol in the final must have been reported (obtained at bench scale after 120 hours), for practical purposes at an industrial level, 11 percent of the volume can be obtained in a 48 hour cycle, with an efficiency of up to 88 percent (Eff = R real x 100 / R stoichiometrical).
Figure 19. Fermentation curves
Distillation
Distillation fundamentals: Distillation is a physical process for the separation of two or more compounds with different molecular weight from the solution by virtue of, their relative volatility and the difference in their boiling points. All compounds have, among their physical properties, a corresponding boiling and condensation point under different pressure conditions and that are specific to each compound. When a heat is applied to a solution or mixture of compounds, the boiling point of each is reached, one at a time and each one volatilizes, thus separating it in the form of gas or vapor from the other or others still in their liquid phase. This is done at industrial scale using pieces of equipment called distillation columns, designed to contain both phases.

391
Figure 20. Separation of two components through distillation
In a continuous column, the heat is applied at the bottom and the solution to be distilled is fed through the top or middle of the column. In this way, the vapors at the bottom have to go up and while they do so, they are enriched with the compound that is to be separated when they come in contact with the liquid being fed. The vertical column has horizontal trays that provide surface contact between the vapor and liquid to promote mass transfer. The liquid that comes down, transfer the content of the product being separated into the rising vapors, without reaching its own boiling point. The more volatile fractions that reach the higher part of the column have to turn back to the liquid phase in order to be adequately recovered and managed. This is achieved by cooling the product down in heat exchangers called condensers. In distilling two or more components, as it is the case of ethanol from sugarcane by-products, akin fractions of the solution can be separated by parcial condensers. The desired product, free of its similar undesired components, is recirculated to the highest tray to enrich the liquid phase and henceforth become extracted from the column as a final product. Not all the individual fractions can be separated in a single distillation column, first, because for large production volumes, a single column would be difficult and impractical to be built , for structural reasons; and also
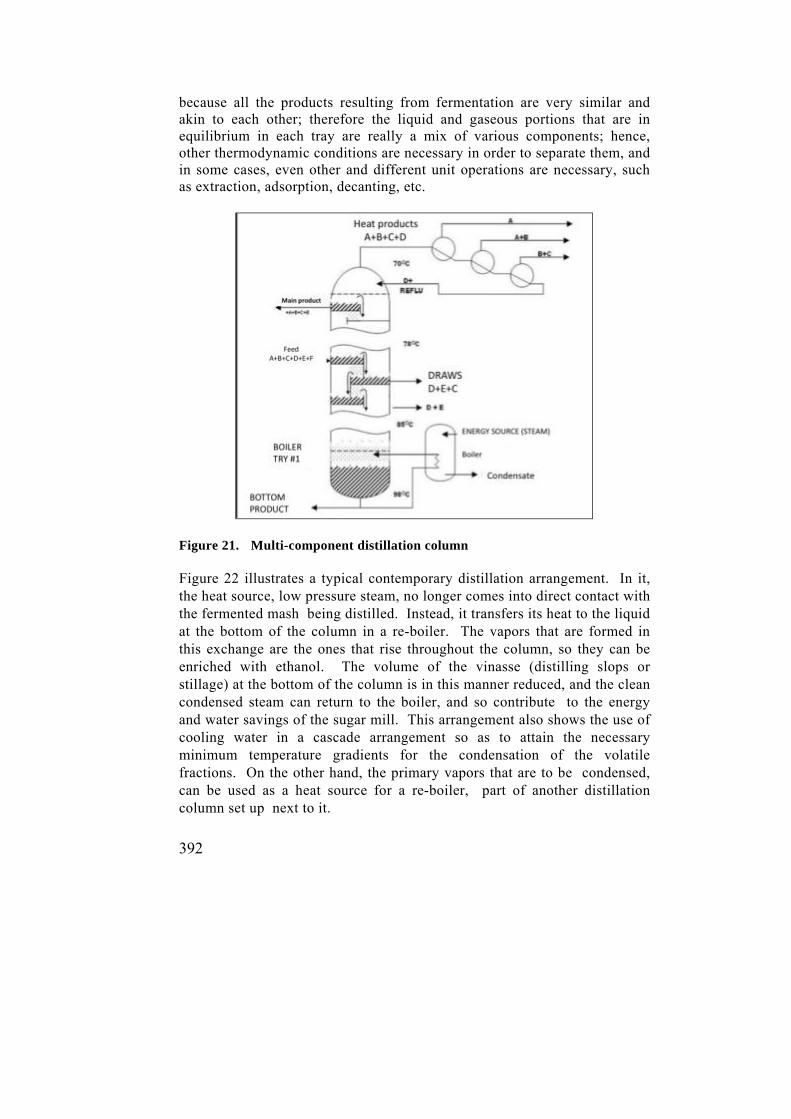
392
because all the products resulting from fermentation are very similar and akin to each other; therefore the liquid and gaseous portions that are in equilibrium in each tray are really a mix of various components; hence, other thermodynamic conditions are necessary in order to separate them, and in some cases, even other and different unit operations are necessary, such as extraction, adsorption, decanting, etc.
Figure 21. Multi-component distillation column Figure 22 illustrates a typical contemporary distillation arrangement. In it, the heat source, low pressure steam, no longer comes into direct contact with the fermented mash being distilled. Instead, it transfers its heat to the liquid at the bottom of the column in a re-boiler. The vapors that are formed in this exchange are the ones that rise throughout the column, so they can be enriched with ethanol. The volume of the vinasse (distilling slops or stillage) at the bottom of the column is in this manner reduced, and the clean condensed steam can return to the boiler, and so contribute to the energy and water savings of the sugar mill. This arrangement also shows the use of cooling water in a cascade arrangement so as to attain the necessary minimum temperature gradients for the condensation of the volatile fractions. On the other hand, the primary vapors that are to be condensed, can be used as a heat source for a re-boiler, part of another distillation column set up next to it.
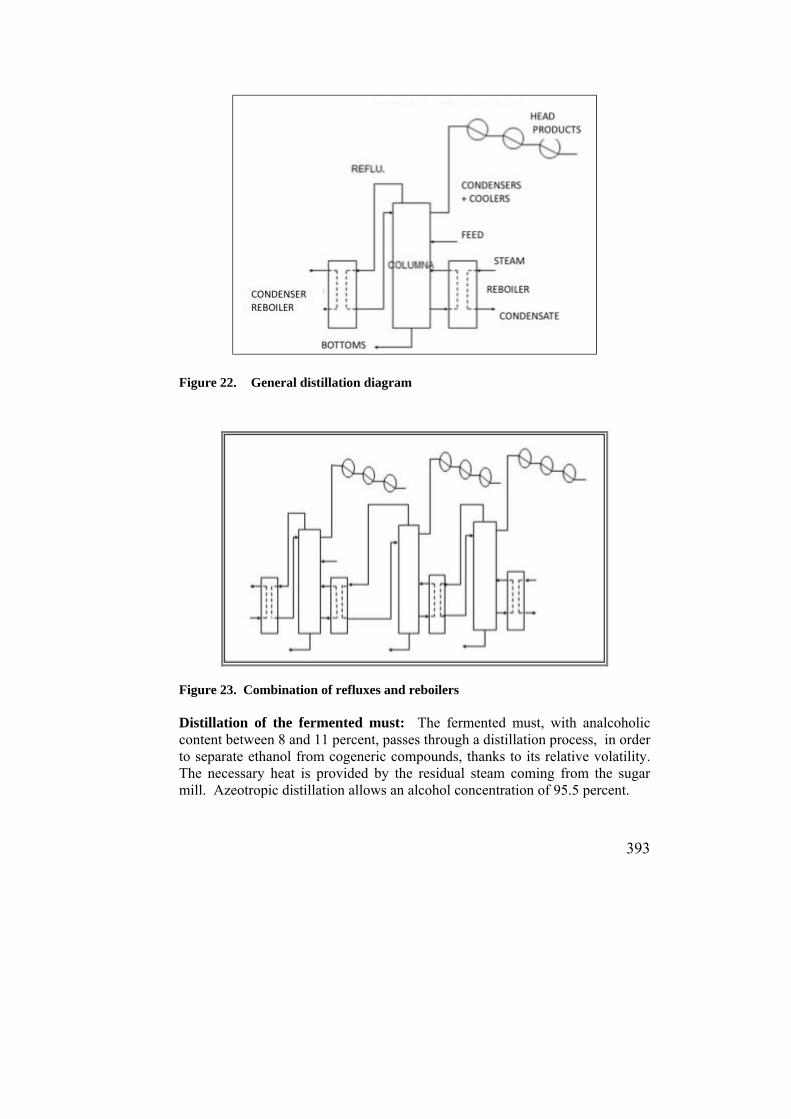
393
Figure 22. General distillation diagram
Figure 23. Combination of refluxes and reboilers Distillation of the fermented must: The fermented must, with analcoholic content between 8 and 11 percent, passes through a distillation process, in order to separate ethanol from cogeneric compounds, thanks to its relative volatility. The necessary heat is provided by the residual steam coming from the sugar mill. Azeotropic distillation allows an alcohol concentration of 95.5 percent.
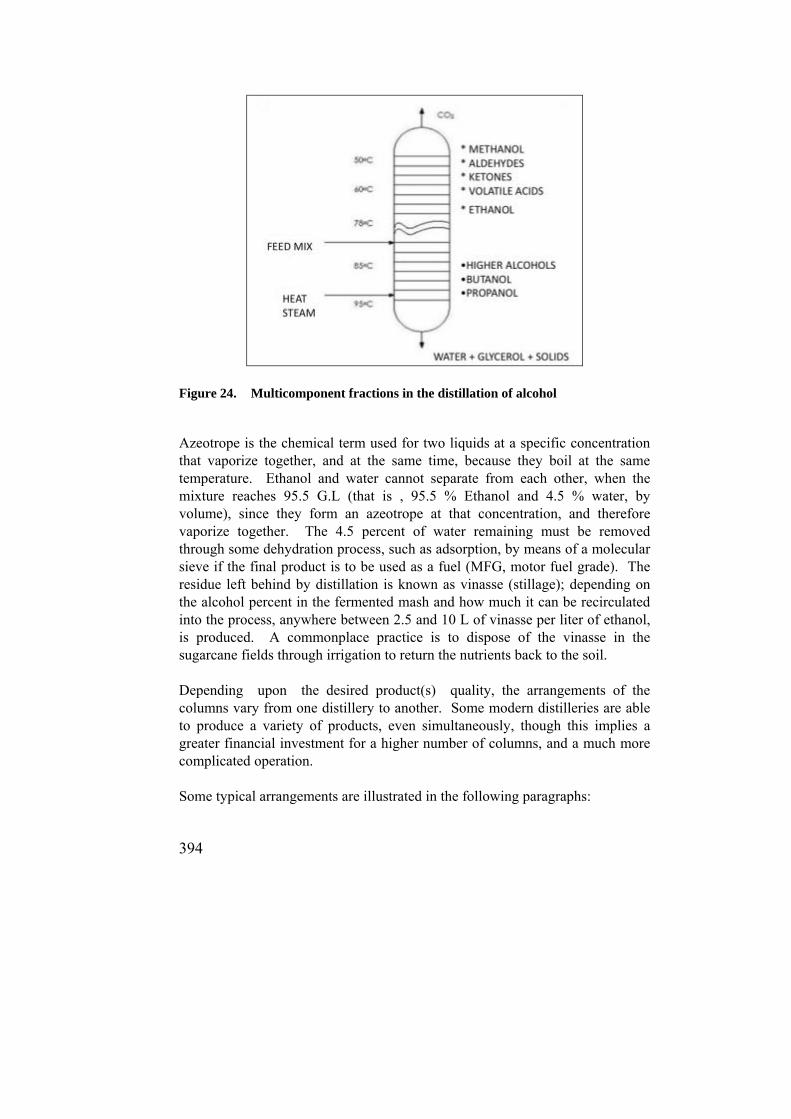
394
Figure 24. Multicomponent fractions in the distillation of alcohol
Azeotrope is the chemical term used for two liquids at a specific concentration that vaporize together, and at the same time, because they boil at the same temperature. Ethanol and water cannot separate from each other, when the mixture reaches 95.5 G.L (that is , 95.5 % Ethanol and 4.5 % water, by volume), since they form an azeotrope at that concentration, and therefore vaporize together. The 4.5 percent of water remaining must be removed through some dehydration process, such as adsorption, by means of a molecular sieve if the final product is to be used as a fuel (MFG, motor fuel grade). The residue left behind by distillation is known as vinasse (stillage); depending on the alcohol percent in the fermented mash and how much it can be recirculated into the process, anywhere between 2.5 and 10 L of vinasse per liter of ethanol, is produced. A commonplace practice is to dispose of the vinasse in the sugarcane fields through irrigation to return the nutrients back to the soil. Depending upon the desired product(s) quality, the arrangements of the columns vary from one distillery to another. Some modern distilleries are able to produce a variety of products, even simultaneously, though this implies a greater financial investment for a higher number of columns, and a much more complicated operation.
Some typical arrangements are illustrated in the following paragraphs:

395
Barbet Distillation: It is the most widely used column combination for the production of heavy rums and spirits. The first column (beer or stripper column) separates everything that isn’t water, glycerol and solids into vapor; the former elements go to the bottom of the column as vinasse (stillage). The light components mixture goes on to the top of this column and then into the second column (purifying or “heads” column), where the compounds more volatile than ethanol (methanol, adehydes, ketones and volatile acids), evaporate; ethanol remains in a mixture with water and heavy alcohols (fusel oil) in liquid form; this mixture is removed from the bottom of the column so as to feed the third column (concentrating or rectifying column). In this last column, the fusel oil is extracted by the first third of the column; the water (flegm) is extracted from the bottom and the ethanol and its remaining cogenerics are recovered as the final distilled product from.
Figure 25. Barbet distillation
Extractive distillation: This is a variation of the previous arrangement. In it, the purifying column is substituted by an extractive distillation column. That is, a column in which the operations of distilling and extraction are combined and take place simultaneously. Thanks to a phenomenon discovered in the middle of the XXth century, both the light cogenerates as well as the heavy ones, when combined, have a relative volatility higher than the ethanol solution – water, when it is close to 14 percent of the volume. The water at the bottom of the third column is used to dilute the recovered solution from the first column, favoring the necessary conditions to extract alcohol from the mixture; then take
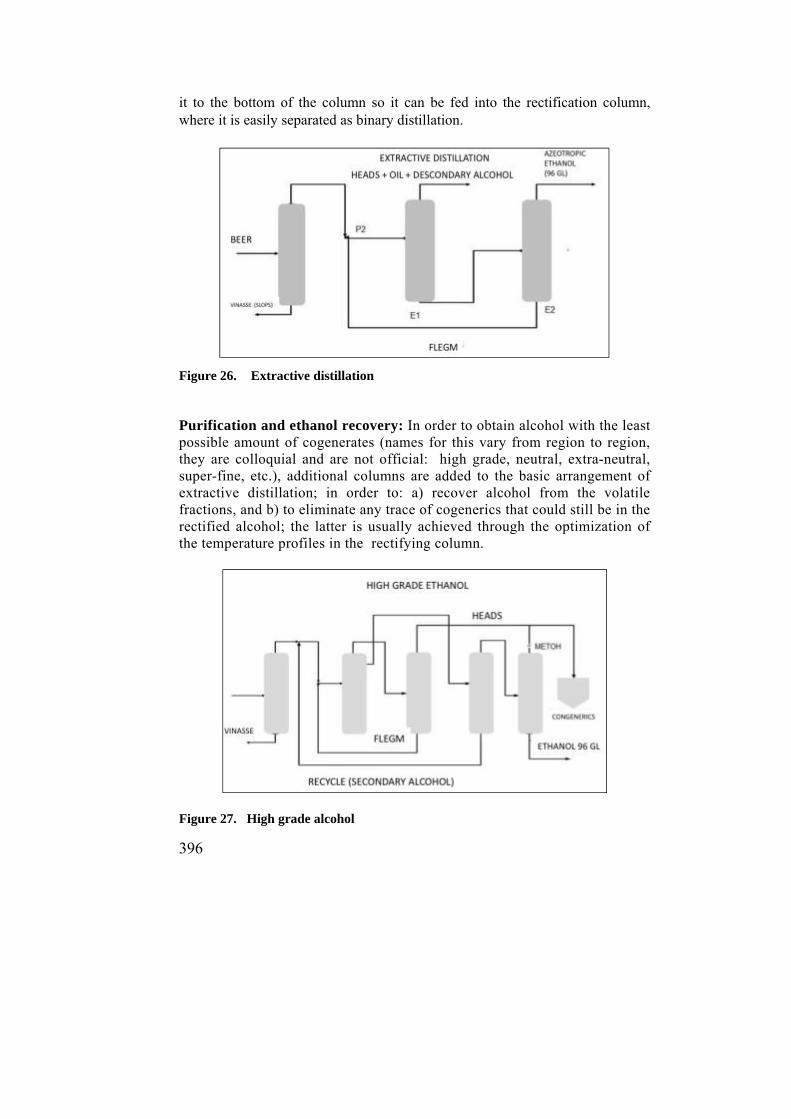
396
it to the bottom of the column so it can be fed into the rectification column, where it is easily separated as binary distillation.
Figure 26. Extractive distillation
Purification and ethanol recovery: In order to obtain alcohol with the least possible amount of cogenerates (names for this vary from region to region, they are colloquial and are not official: high grade, neutral, extra-neutral, super-fine, etc.), additional columns are added to the basic arrangement of extractive distillation; in order to: a) recover alcohol from the volatile fractions, and b) to eliminate any trace of cogenerics that could still be in the rectified alcohol; the latter is usually achieved through the optimization of the temperature profiles in the rectifying column.
Figure 27. High grade alcohol
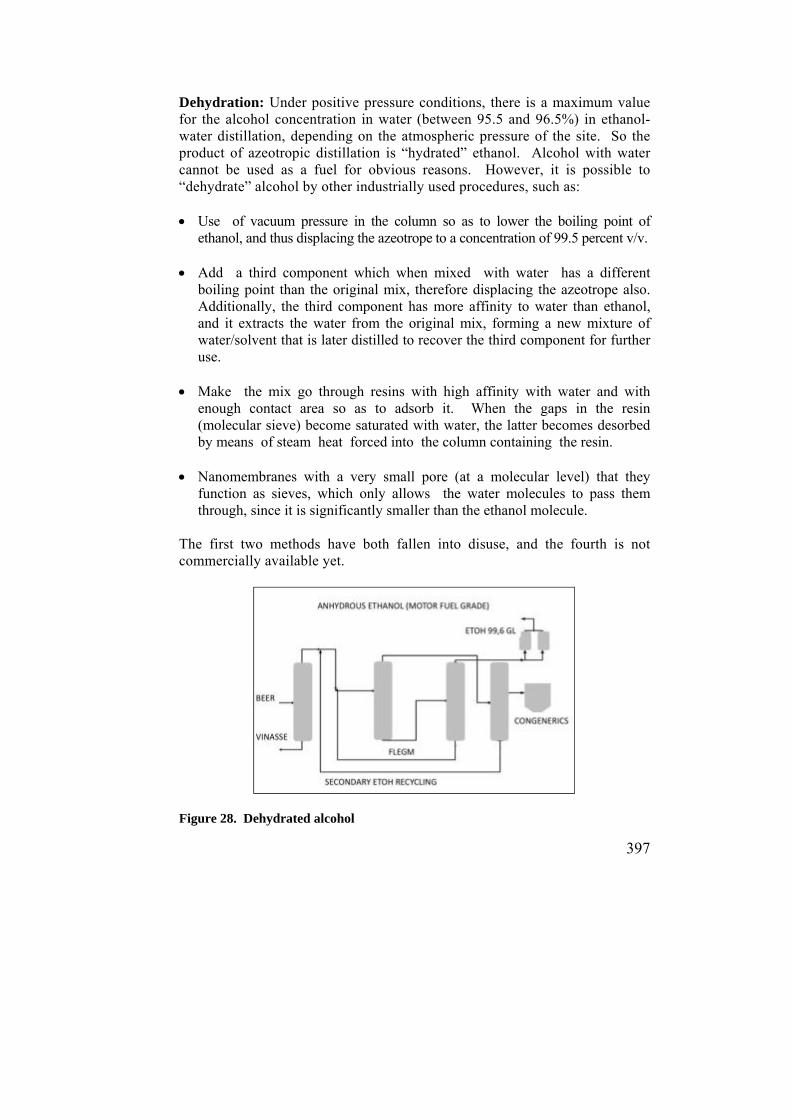
397
Dehydration: Under positive pressure conditions, there is a maximum value for the alcohol concentration in water (between 95.5 and 96.5%) in ethanol-water distillation, depending on the atmospheric pressure of the site. So the product of azeotropic distillation is “hydrated” ethanol. Alcohol with water cannot be used as a fuel for obvious reasons. However, it is possible to “dehydrate” alcohol by other industrially used procedures, such as: Use of vacuum pressure in the column so as to lower the boiling point of
ethanol, and thus displacing the azeotrope to a concentration of 99.5 percent v/v. Add a third component which when mixed with water has a different
boiling point than the original mix, therefore displacing the azeotrope also. Additionally, the third component has more affinity to water than ethanol, and it extracts the water from the original mix, forming a new mixture of water/solvent that is later distilled to recover the third component for further use.
Make the mix go through resins with high affinity with water and with
enough contact area so as to adsorb it. When the gaps in the resin (molecular sieve) become saturated with water, the latter becomes desorbed by means of steam heat forced into the column containing the resin.
Nanomembranes with a very small pore (at a molecular level) that they
function as sieves, which only allows the water molecules to pass them through, since it is significantly smaller than the ethanol molecule.
The first two methods have both fallen into disuse, and the fourth is not commercially available yet.
Figure 28. Dehydrated alcohol
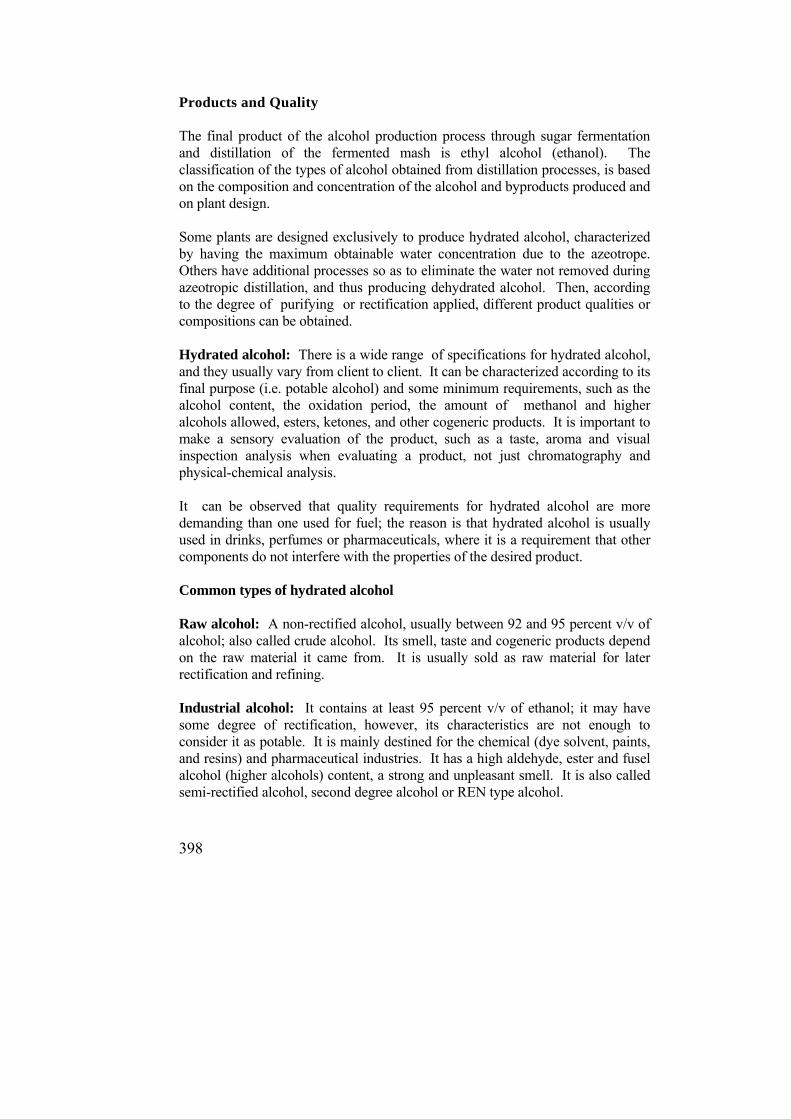
398
Products and Quality The final product of the alcohol production process through sugar fermentation and distillation of the fermented mash is ethyl alcohol (ethanol). The classification of the types of alcohol obtained from distillation processes, is based on the composition and concentration of the alcohol and byproducts produced and on plant design. Some plants are designed exclusively to produce hydrated alcohol, characterized by having the maximum obtainable water concentration due to the azeotrope. Others have additional processes so as to eliminate the water not removed during azeotropic distillation, and thus producing dehydrated alcohol. Then, according to the degree of purifying or rectification applied, different product qualities or compositions can be obtained. Hydrated alcohol: There is a wide range of specifications for hydrated alcohol, and they usually vary from client to client. It can be characterized according to its final purpose (i.e. potable alcohol) and some minimum requirements, such as the alcohol content, the oxidation period, the amount of methanol and higher alcohols allowed, esters, ketones, and other cogeneric products. It is important to make a sensory evaluation of the product, such as a taste, aroma and visual inspection analysis when evaluating a product, not just chromatography and physical-chemical analysis. It can be observed that quality requirements for hydrated alcohol are more demanding than one used for fuel; the reason is that hydrated alcohol is usually used in drinks, perfumes or pharmaceuticals, where it is a requirement that other components do not interfere with the properties of the desired product. Common types of hydrated alcohol Raw alcohol: A non-rectified alcohol, usually between 92 and 95 percent v/v of alcohol; also called crude alcohol. Its smell, taste and cogeneric products depend on the raw material it came from. It is usually sold as raw material for later rectification and refining. Industrial alcohol: It contains at least 95 percent v/v of ethanol; it may have some degree of rectification, however, its characteristics are not enough to consider it as potable. It is mainly destined for the chemical (dye solvent, paints, and resins) and pharmaceutical industries. It has a high aldehyde, ester and fusel alcohol (higher alcohols) content, a strong and unpleasant smell. It is also called semi-rectified alcohol, second degree alcohol or REN type alcohol.
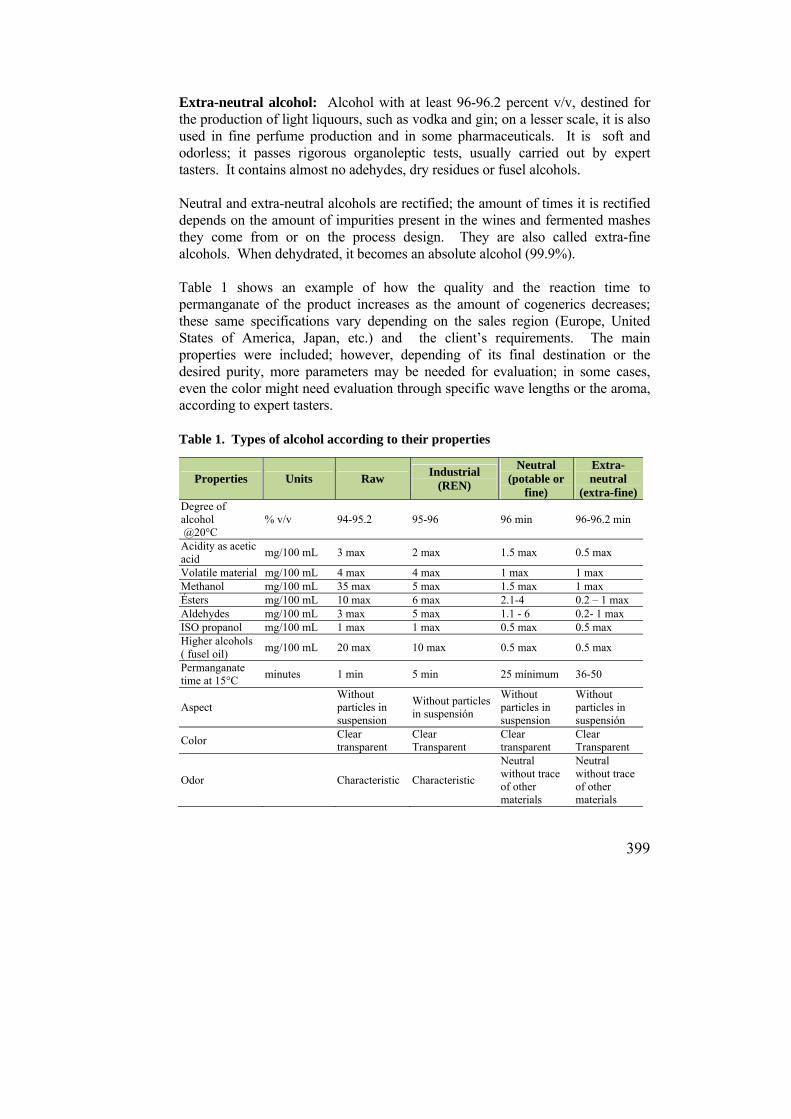
399
Extra-neutral alcohol: Alcohol with at least 96-96.2 percent v/v, destined for the production of light liquours, such as vodka and gin; on a lesser scale, it is also used in fine perfume production and in some pharmaceuticals. It is soft and odorless; it passes rigorous organoleptic tests, usually carried out by expert tasters. It contains almost no adehydes, dry residues or fusel alcohols. Neutral and extra-neutral alcohols are rectified; the amount of times it is rectified depends on the amount of impurities present in the wines and fermented mashes they come from or on the process design. They are also called extra-fine alcohols. When dehydrated, it becomes an absolute alcohol (99.9%). Table 1 shows an example of how the quality and the reaction time to permanganate of the product increases as the amount of cogenerics decreases; these same specifications vary depending on the sales region (Europe, United States of America, Japan, etc.) and the client’s requirements. The main properties were included; however, depending of its final destination or the desired purity, more parameters may be needed for evaluation; in some cases, even the color might need evaluation through specific wave lengths or the aroma, according to expert tasters. Table 1. Types of alcohol according to their properties
Properties Units Raw Industrial
(REN)
Neutral (potable or
fine)
Extra- neutral
(extra-fine) Degree of alcohol @20°C
% v/v 94-95.2 95-96 96 min 96-96.2 min
Acidity as acetic acid
mg/100 mL 3 max 2 max 1.5 max 0.5 max
Volatile material mg/100 mL 4 max 4 max 1 max 1 max Methanol mg/100 mL 35 max 5 max 1.5 max 1 max Ésters mg/100 mL 10 max 6 max 2.1-4 0.2 – 1 max Aldehydes mg/100 mL 3 max 5 max 1.1 - 6 0.2- 1 max ISO propanol mg/100 mL 1 max 1 max 0.5 max 0.5 max Higher alcohols ( fusel oil)
mg/100 mL 20 max 10 max 0.5 max 0.5 max
Permanganate time at 15°C
minutes 1 min 5 min 25 mínimum 36-50
Aspect Without particles in suspension
Without particles in suspensión
Without particles in suspension
Without particles in suspensión
Color Clear transparent
Clear Transparent
Clear transparent
Clear Transparent
Odor Characteristic Characteristic
Neutral without trace of other materials
Neutral without trace of other materials
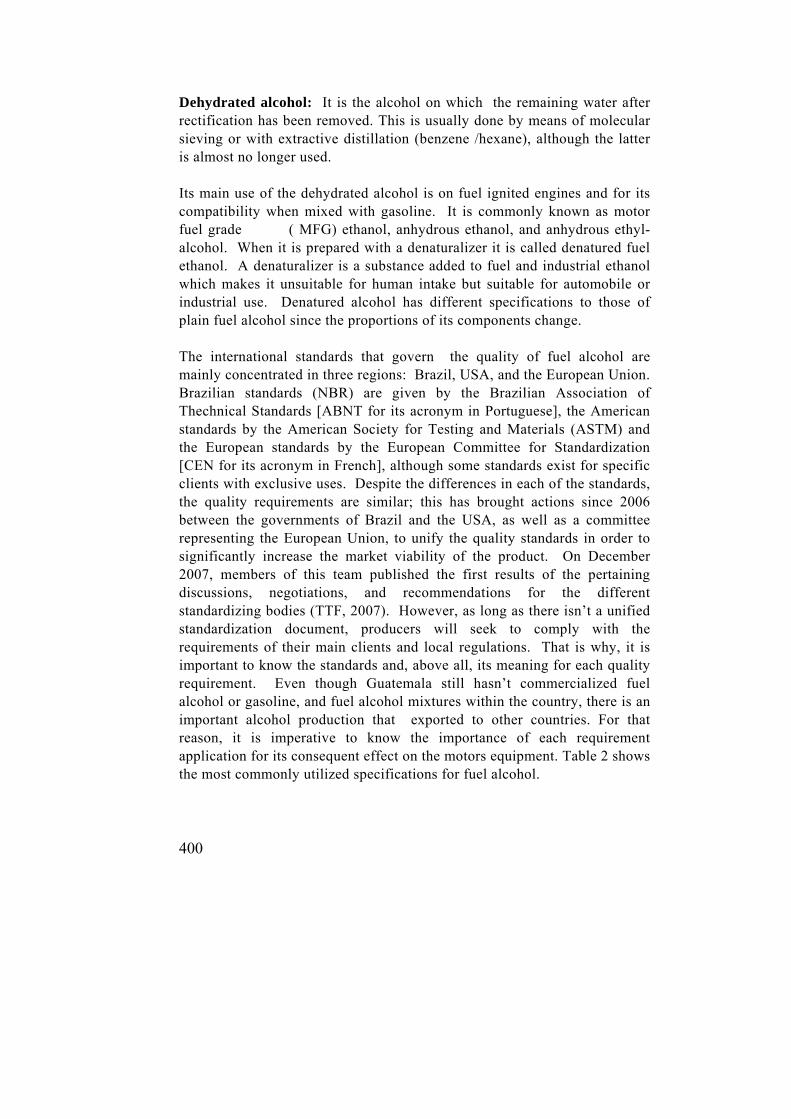
400
Dehydrated alcohol: It is the alcohol on which the remaining water after rectification has been removed. This is usually done by means of molecular sieving or with extractive distillation (benzene /hexane), although the latter is almost no longer used. Its main use of the dehydrated alcohol is on fuel ignited engines and for its compatibility when mixed with gasoline. It is commonly known as motor fuel grade ( MFG) ethanol, anhydrous ethanol, and anhydrous ethyl-alcohol. When it is prepared with a denaturalizer it is called denatured fuel ethanol. A denaturalizer is a substance added to fuel and industrial ethanol which makes it unsuitable for human intake but suitable for automobile or industrial use. Denatured alcohol has different specifications to those of plain fuel alcohol since the proportions of its components change. The international standards that govern the quality of fuel alcohol are mainly concentrated in three regions: Brazil, USA, and the European Union. Brazilian standards (NBR) are given by the Brazilian Association of Thechnical Standards [ABNT for its acronym in Portuguese], the American standards by the American Society for Testing and Materials (ASTM) and the European standards by the European Committee for Standardization [CEN for its acronym in French], although some standards exist for specific clients with exclusive uses. Despite the differences in each of the standards, the quality requirements are similar; this has brought actions since 2006 between the governments of Brazil and the USA, as well as a committee representing the European Union, to unify the quality standards in order to significantly increase the market viability of the product. On December 2007, members of this team published the first results of the pertaining discussions, negotiations, and recommendations for the different standardizing bodies (TTF, 2007). However, as long as there isn’t a unified standardization document, producers will seek to comply with the requirements of their main clients and local regulations. That is why, it is important to know the standards and, above all, its meaning for each quality requirement. Even though Guatemala still hasn’t commercialized fuel alcohol or gasoline, and fuel alcohol mixtures within the country, there is an important alcohol production that exported to other countries. For that reason, it is imperative to know the importance of each requirement application for its consequent effect on the motors equipment. Table 2 shows the most commonly utilized specifications for fuel alcohol.
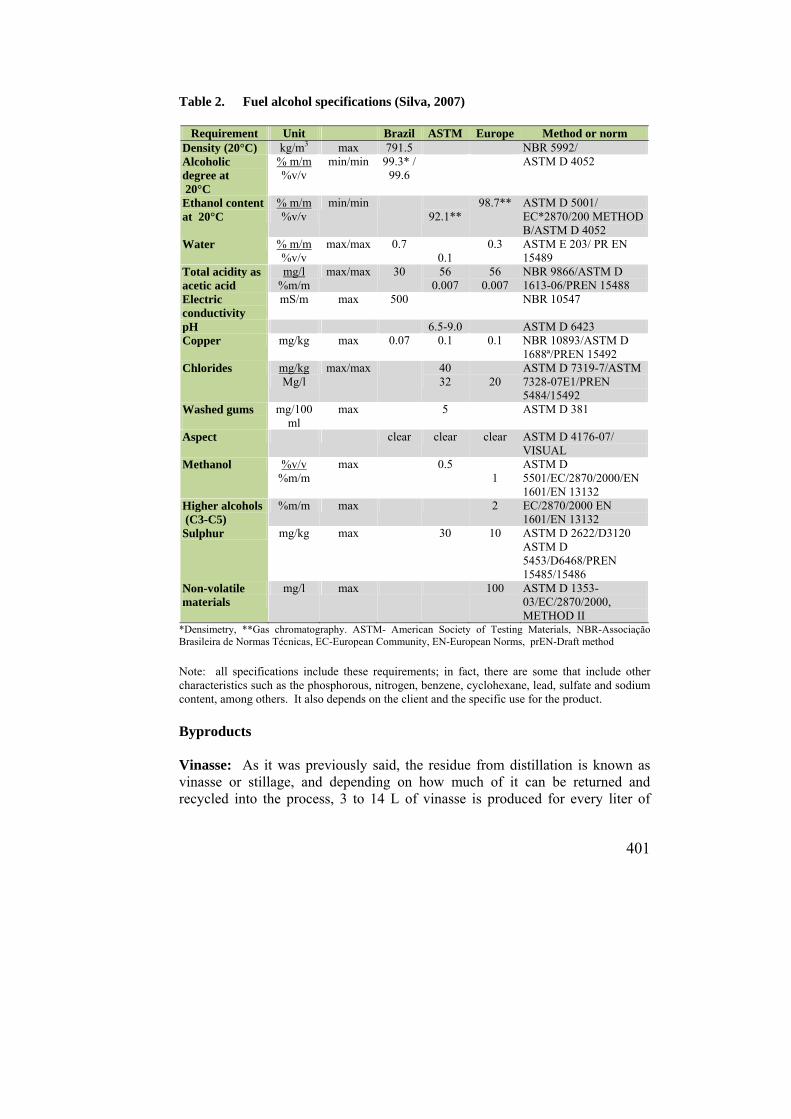
401
Table 2. Fuel alcohol specifications (Silva, 2007)
Requirement Unit Brazil ASTM Europe Method or norm Density (20°C) kg/m3 max 791.5 NBR 5992/ Alcoholic degree at 20°C
% m/m %v/v
min/min 99.3* / 99.6
ASTM D 4052
Ethanol content at 20°C
% m/m %v/v
min/min 92.1**
98.7** ASTM D 5001/ EC*2870/200 METHOD B/ASTM D 4052
Water % m/m %v/v
max/max 0.7 0.1
0.3 ASTM E 203/ PR EN 15489
Total acidity as acetic acid
mg/l %m/m
max/max 30 56 0.007
56 0.007
NBR 9866/ASTM D 1613-06/PREN 15488
Electric conductivity
mS/m max 500 NBR 10547
pH 6.5-9.0 ASTM D 6423 Copper mg/kg max 0.07 0.1 0.1 NBR 10893/ASTM D
1688ª/PREN 15492 Chlorides mg/kg
Mg/l max/max 40
32
20 ASTM D 7319-7/ASTM 7328-07E1/PREN 5484/15492
Washed gums
mg/100 ml
max 5 ASTM D 381
Aspect clear clear clear ASTM D 4176-07/ VISUAL
Methanol %v/v %m/m
max 0.5 1
ASTM D 5501/EC/2870/2000/EN 1601/EN 13132
Higher alcohols (C3-C5)
%m/m max 2 EC/2870/2000 EN 1601/EN 13132
Sulphur mg/kg max 30 10 ASTM D 2622/D3120 ASTM D 5453/D6468/PREN 15485/15486
Non-volatile materials
mg/l max 100 ASTM D 1353-03/EC/2870/2000, METHOD II
*Densimetry, **Gas chromatography. ASTM- American Society of Testing Materials, NBR-Associação Brasileira de Normas Técnicas, EC-European Community, EN-European Norms, prEN-Draft method
Note: all specifications include these requirements; in fact, there are some that include other characteristics such as the phosphorous, nitrogen, benzene, cyclohexane, lead, sulfate and sodium content, among others. It also depends on the client and the specific use for the product. Byproducts Vinasse: As it was previously said, the residue from distillation is known as vinasse or stillage, and depending on how much of it can be returned and recycled into the process, 3 to 14 L of vinasse is produced for every liter of
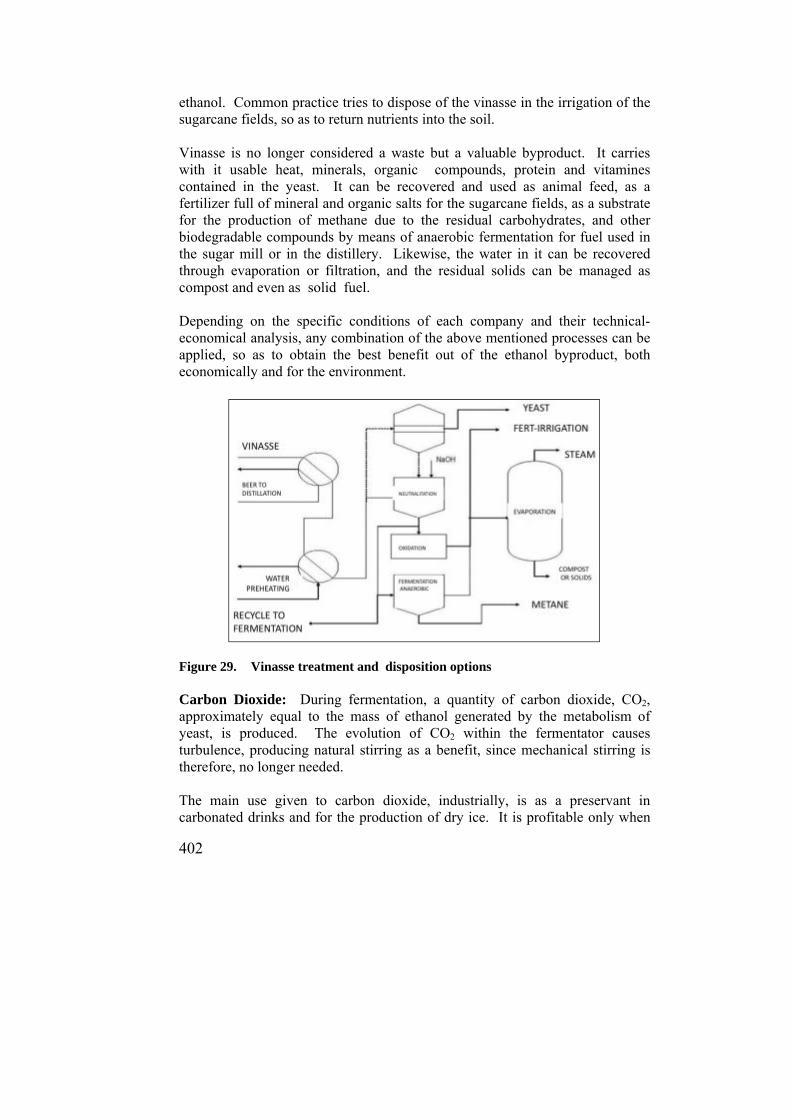
402
ethanol. Common practice tries to dispose of the vinasse in the irrigation of the sugarcane fields, so as to return nutrients into the soil. Vinasse is no longer considered a waste but a valuable byproduct. It carries with it usable heat, minerals, organic compounds, protein and vitamines contained in the yeast. It can be recovered and used as animal feed, as a fertilizer full of mineral and organic salts for the sugarcane fields, as a substrate for the production of methane due to the residual carbohydrates, and other biodegradable compounds by means of anaerobic fermentation for fuel used in the sugar mill or in the distillery. Likewise, the water in it can be recovered through evaporation or filtration, and the residual solids can be managed as compost and even as solid fuel. Depending on the specific conditions of each company and their technical-economical analysis, any combination of the above mentioned processes can be applied, so as to obtain the best benefit out of the ethanol byproduct, both economically and for the environment.
Figure 29. Vinasse treatment and disposition options Carbon Dioxide: During fermentation, a quantity of carbon dioxide, CO2, approximately equal to the mass of ethanol generated by the metabolism of yeast, is produced. The evolution of CO2 within the fermentator causes turbulence, producing natural stirring as a benefit, since mechanical stirring is therefore, no longer needed. The main use given to carbon dioxide, industrially, is as a preservant in carbonated drinks and for the production of dry ice. It is profitable only when
403
these industries are located close to the distilleries. It is also an inhibitor for undesired fermentations that occur during the storing of molasses or syrups; in such cases, molasses are sometimes kept under a CO2 atmosphere, on the top of the content in the storage tank. It is important to consider that it is also a greenhouse gas, and because of this, the research is being done on its recovery and uses so as to decrease its effect on the atmosphere. Cogenerics Fusel oils or Higher alcohols: Sugar products also contain aminoacids; yeasts assimilate the radical nitrogen in the synthesis of new aminoacid compounds, such as proteins and enzymes. Among these aminoacids present in the juices and syrups, leucine, isoleucine, valine, etc, can be mentioned. Which when deprived of the radical containing nitrogen, they give alcohols as a product of the reaction, causing the formation of aliphatic higher alcohols with the general formula CnH2n+1OH (n from 3 to 8). They have high molecular weight, and it is due to their viscuous appearance, that their mixture is called fusel oil. The name fusel oil comes from the German word fousel which means “evil spirits”. Among the main higher alcohols found in fuel alcohol are: propanol, isopropanol, butanol, isobutanol, amyl and isoamyl alcohol, these last two, generally in a higher proportion than the others. As an example of the conversion reactions from aminoacids in alcohols, the following global reactions are presented:
leucine + water -----------------------> isoamyl alcohol
(CH3)2.CH.CH2.CH(NH2).COOH + H2O----> (CH3)2.CH.CH2.CH2OH + NH3 + CO2
isoleucine + water --------------------> amyl alcohol
CH3 (CH2)3.CH (NH2).COOH + H2O --->CH3. (CH2)3. CH2OH + NH3 + CO2
valine + water ------------------------> n-butyl alcohol
(CH3) 2.CH.CH(NH2).COOH + H2O ----> (CH3)2.CH.CH2OH + NH3 + CO2
alfa-amino butyl alcohol + water -----> n-propyl alcohol
CH3.CH2.CH (NH2).COOH + H2O ------> CH3.CH2.CH2OH + NH3 + CO2
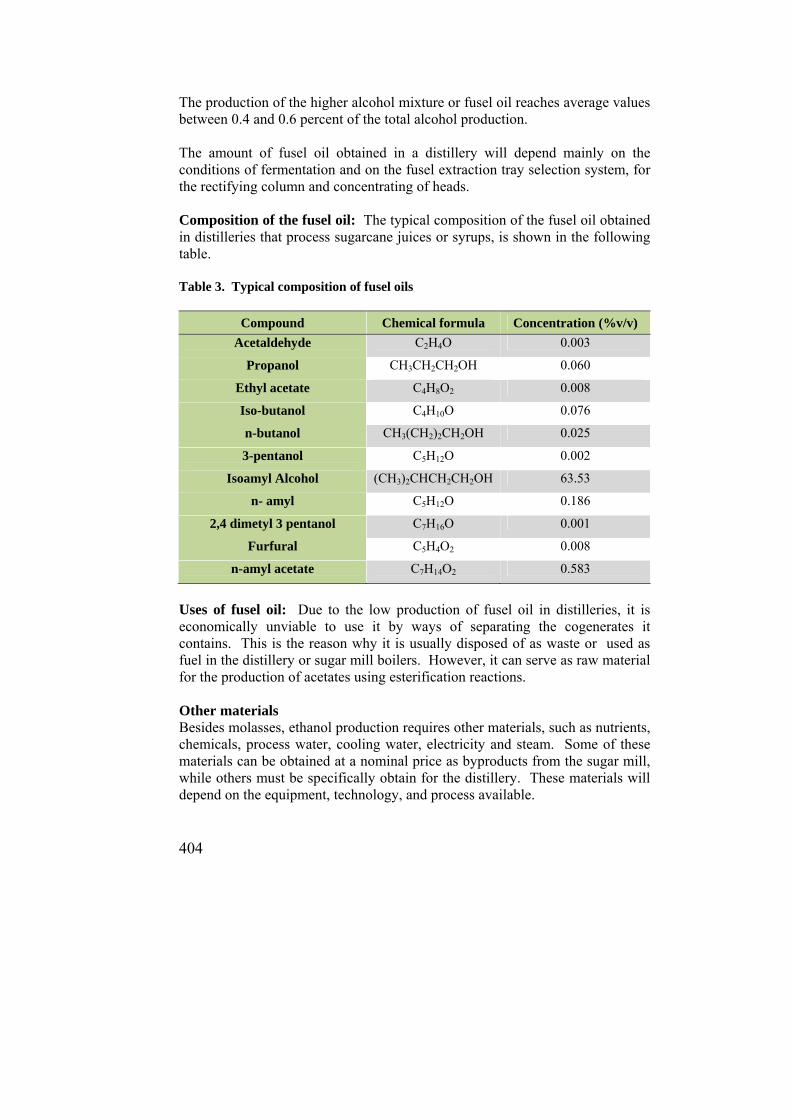
404
The production of the higher alcohol mixture or fusel oil reaches average values between 0.4 and 0.6 percent of the total alcohol production.
The amount of fusel oil obtained in a distillery will depend mainly on the conditions of fermentation and on the fusel extraction tray selection system, for the rectifying column and concentrating of heads. Composition of the fusel oil: The typical composition of the fusel oil obtained in distilleries that process sugarcane juices or syrups, is shown in the following table. Table 3. Typical composition of fusel oils
Compound Chemical formula Concentration (%v/v)
Acetaldehyde C2H4O 0.003
Propanol CH3CH2CH2OH 0.060
Ethyl acetate C4H8O2 0.008
Iso-butanol C4H10O 0.076
n-butanol CH3(CH2)2CH2OH 0.025
3-pentanol C5H12O 0.002
Isoamyl Alcohol (CH3)2CHCH2CH2OH 63.53
n- amyl C5H12O 0.186
2,4 dimetyl 3 pentanol C7H16O 0.001
Furfural C5H4O2 0.008
n-amyl acetate C7H14O2 0.583
Uses of fusel oil: Due to the low production of fusel oil in distilleries, it is economically unviable to use it by ways of separating the cogenerates it contains. This is the reason why it is usually disposed of as waste or used as fuel in the distillery or sugar mill boilers. However, it can serve as raw material for the production of acetates using esterification reactions. Other materials Besides molasses, ethanol production requires other materials, such as nutrients, chemicals, process water, cooling water, electricity and steam. Some of these materials can be obtained at a nominal price as byproducts from the sugar mill, while others must be specifically obtain for the distillery. These materials will depend on the equipment, technology, and process available.

405
Table 4. Energy and other materials required in distilleries DIST 1 DIST 2 DIST 3 DIST 4 DIST 5 KATZEN LITERATURE ** Steam, Kg / Liter of Alcohol *
3 4.2 3.5 5.5 4.8 2.28- 5.21 4.8
EE KW / Liter of Alcohol
0.033 0.2 0.15 0.15 0.03 0.03
L Alcohol / t molasses 49FS
252 262 260 264 261 267
H2SO4 lb / L Alcohol
0.004 0.006 0.008 0.01 0.0038
UREA, lb / L Alcohol
0.004 0.008 0.0015
H3PO4 lb / L Alcohol
0.0025 0.0015
Yeast lb / L Alcohol
0.0015 0.02 0.005 0.008 0.0025
* Depending on the arrangement of the columns and on the final product design ** Peters & Timmerhaus. IRAS Statement of Capabilities.
BIBLIOGRAPHY 1. Aiba, S.; Humphrey, A.; Millis, N. 1975. Biochemical Engineering. 2nd
Edition, Academic press, London , UK. 2. Borzani, W.; Almeida e Lima, V.; Aquarone, E. 1975. Biotecnología –
Enghaniaria Bioquímica. Edgard Blucker Ltda. 3. Espinosa, R. 1984. The alcoholic Fermentation of molasses- practical
aspects. Doctoral dissertation, Century University, New Mexico. 4. Duarte, P.; Vânya, Marcia. 2006. Especificaciones de la calidad del etanol
carburante y del gasohol (mezcla de dasolina y etanol) y normas técnicas para la infrastructura. Naciones Unidas, Comisión Económica para América Latina y El Caribe-CEPAL. LC/MEX/L.71/Rev.1. pp. 3-7.
5. Ingledew, W. M. 2009. The Alcohol Textbook, 5th Edition. Ethanol
Technology Institute. Nothingham,University press. 6. Normas: ASTM D 891-95, 2004; ASTM D 4052-96, 1996; ASTM D 4806-
6 c, 2006; ASTM D 5798-06, 2006; ASTM D 5501, 2004; ASTM D 1613, 2006; ASTM D 6423-99, 2004; ASTM D 4176, 2004.
406
7. Paturau, J. M. 1982. Byproducts of the Cane Sugar Industry. Elsevier Scientific Publishing Co. New York.
8. Prescott, S.; Dunn, C. 1967. Industrial Microbiology, McGraw- Hill, co. 9. Peters, M.; Timmerhaus, K. 1980. Plant Design and Economics for
Chemical Engineers, McGraw –Hill, N.Y. 10. Reynolds, R. 2002. Fuel Specification and Fuel Property Issues and Their
Potential Impact on the Use of Ethanol as a Transportation Fuel. Downstream Alternatives Inc. Phase III Project Deliverable Report. Oak Ridge National Laboratory, Ethanol Project. pp. 2-2/2.
11. Silva Junior, J. F. 2007. Market specification and Methods for Fuel Ethanol.
Simposium on BioFuels: Measurements and Standars to Facilitate the Transition to a Global Commodity. US National Institute of Standards and Technology (NIST), Brazil's National Institute of Metrology (INMETRO). UNICA/IETHA. June 26-29, 2007. Pp.
407
COPRODUCER PERSPECTIVES ON SUGARCANE
Mario Muñoz
INTRODUCTION Traditionally, the Sugar Industry bases its production on three main products: Sugar, electricity, and alcohol. The markets for these three products show demands with a certain variation, which at specific times may show uncertainty and less revenue than the one foreseen by the producers. Among the most important factors affecting production, generation, demand, and consumption of these products are: Government policies such as subsidies or taxes, both of the producing countries as well as of the buying companies; local climate effects and environmental conservation regulations; the entrance of countries with emerging economies into the market; the need to substitute non-renewable materials, such as petroleoum and its byproducts; the rise and search for biofuels and biodegradable raw materials; and in general, the growth in economies in an evermore globalized world. All of this forces the sugar producers to find alternatives for new co-products that can be developed either as by-products of the products still in progress within the process or from their waste and residual sub-products. The range of possibilities is great; however, its commercial success will depend on the degree of development of the technologies applied and on the added value of said products. That is, if products with high added values can be produced, even though this implies that high priced products will be sold in low volumes, or, if on the contrary, they are sold at lower prices but in higher volumes; either way, producing these co-products is full of challenges not only technological but in marketing as well. Throughout the sugar production process, there are several stages where “products still in progress” can be extracted; they would constitute the raw material for other co-products and by-products, sometimes, with well differentiated fabrication methods, and in some others with adjoining chemical processes; the integration of these processes is known as a bio-refinery. The first product usually not used is the harvest residue; this is due to the burning that takes place in the sugarcane fields. When the sugarcane is harvested “in green” (without burning the fields prior to cutting the cane), a large amount of biomass is left behind in the fileds; it could be used as animal
Industrial-Mechanical engineer, Professional in the Energy Efficiency Industrial Research Program of CENGICAÑA. www.cengicana.org
408
feed, as fuel for the boilers, as fertilizer, as a medium for growing mushrooms, as a paper pulp generator, etc. Another important by-product is the bagasse that comes out from the milled sugarcane; because of its high heat value, it is usually used as fuel for boilers; however, it could also be used for the production of a variety of products such as concrete aggregates, construction boards, animal feed, pulps and papers and it can even be used as absorbent material during on-land oil spills. The syrups and juices not used for sugar production are fundamentally the raw material for the production of alcohol; alcohol, in turn, is used in fine chemical applications to make other compounds and a number of chemical substances in the pharmaceutical and food industries. Bio-refineries can process sugary products to produce sweeteners and the likes to make chemical products with a variety of applications in all kinds of industries. Finally, residues from the sugar process, such as vinasse, mud cakes left from the filters, and the ashes leftover from the boilers also have a possible participation in the markets of important industries, such as the production of biogas, fodders and puzzolanic aggregates. The technologies used to produce all of these products go from elementary and conventional all the way to experimental; again, it will be the market the one that marks the plausibility and development of these technologies at a given moment. What is for sure, in a rapidly changing and demanding world where the demands are many and the raw materials are limited, sugar mills will be forced to develop technologies and alternative co-products to face the everchanging future. There is an ample range of processes and products, and this allows a modern sugar producing factory some flexibility. However, it will all depend on its size, its potential and its persperctives on the market in which these co-products will develop. Figure 1 illustrates some of the pathways in which some of the co-product in the sugar industry can develop. Coproducts A co-product is derived form the main materials in a production process (raw material, labor, and indirect costs) where two or more products are obtained simultaneously; they are considered of equal importance with respect to the total production, whether it be for the needs they cover or for their commercial value. Subproduct (byproduct) or derivative A byproduct is derived from the materials in a production process (raw material, labor and indirect costs) where two or more different products are obtained simultaneously or successively, and according to their commercial value, they are considered of lesser importance with respect to the main products.
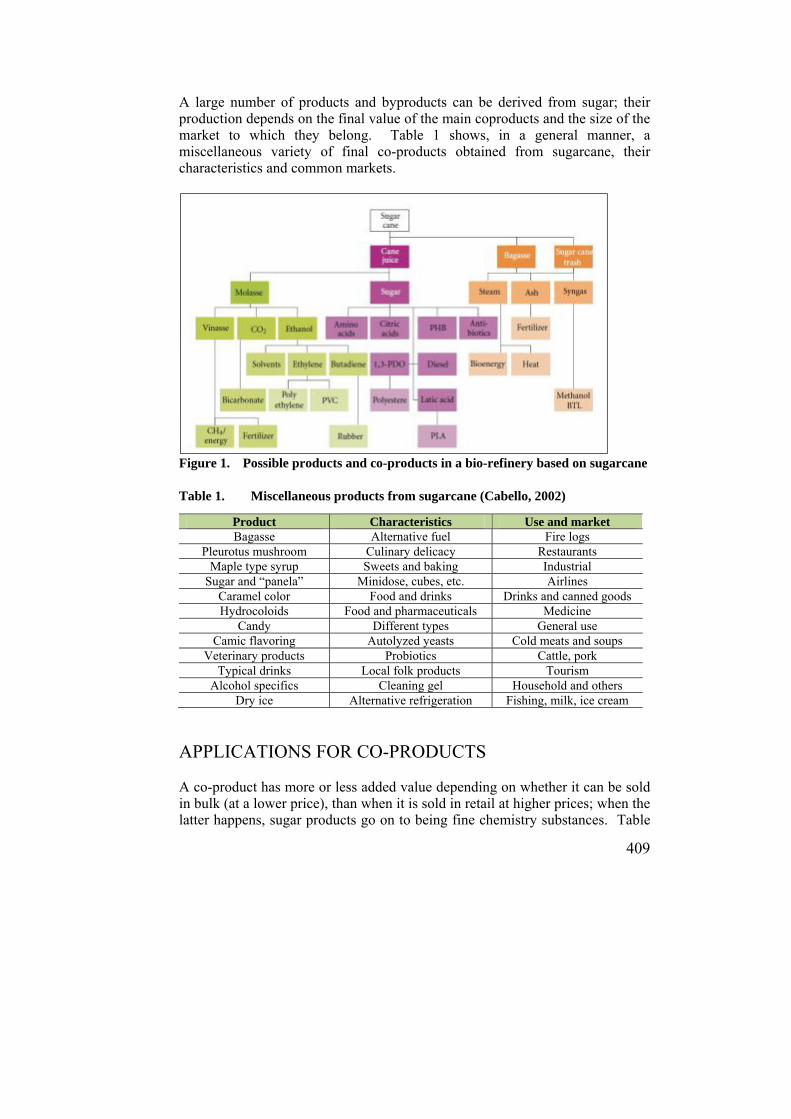
409
A large number of products and byproducts can be derived from sugar; their production depends on the final value of the main coproducts and the size of the market to which they belong. Table 1 shows, in a general manner, a miscellaneous variety of final co-products obtained from sugarcane, their characteristics and common markets.
Figure 1. Possible products and co-products in a bio-refinery based on sugarcane Table 1. Miscellaneous products from sugarcane (Cabello, 2002)
Product Characteristics Use and market Bagasse Alternative fuel Fire logs
Pleurotus mushroom Culinary delicacy Restaurants Maple type syrup Sweets and baking Industrial
Sugar and “panela” Minidose, cubes, etc. Airlines Caramel color Food and drinks Drinks and canned goods Hydrocoloids Food and pharmaceuticals Medicine
Candy Different types General use Camic flavoring Autolyzed yeasts Cold meats and soups
Veterinary products Probiotics Cattle, pork Typical drinks Local folk products Tourism
Alcohol specifics Cleaning gel Household and others Dry ice Alternative refrigeration Fishing, milk, ice cream
APPLICATIONS FOR CO-PRODUCTS A co-product has more or less added value depending on whether it can be sold in bulk (at a lower price), than when it is sold in retail at higher prices; when the latter happens, sugar products go on to being fine chemistry substances. Table

410
2 shows the products that are commercialized in bulk and are carbohydrates; saccharose occupies second place after cellulose, and it easily exceeds the combined production of all the other carbohydrates.
Table 2. Annual production of carbohydrate products
Carbohydrate products Annual production (millons of tons)
Cellulose < 130Saccharose ~ 124
Starch ~ 25Glucose ~ 6Cellulose ~ 5
Gums < 1
It is estimated that only 1.7 percent of the annual saccharose production is destined for “non” food uses. Sugarcane and its co-products are open to possibilities in the following areas: Fine chemistry products Pharmaceutical products Polymers (biodegradable plastics) Construction and structural materials Fermentation or enzyme substrate for the production of chemical products New food products and sweeteners Co-generation of energy Fuels such as bio-diesel and ethanol DIVERSIFICATION OF THE COPRODUCTS The coproducts and derivatives of sugarcane can participate in different markets, according to the technology used in their production, from the raw material and other materials used throughout all the stages of the sugar production process. It is said that they are used in an elementary way when their application is direct and without added value due to process; they can also be processed with conventional industrial procedures, where the products have very distinct and known technologies and markets. A third and fourth markets are represented by complex and latest technologies, where the processing of raw materials is complex, of high added value but sometimes limited use, and in some cases still in the developing or experimental phase. In Table 3, the different raw materials coming from the different phases of sugar production can be appreciated; to the right, the technologies and frequent uses of derivative co-products are shown.
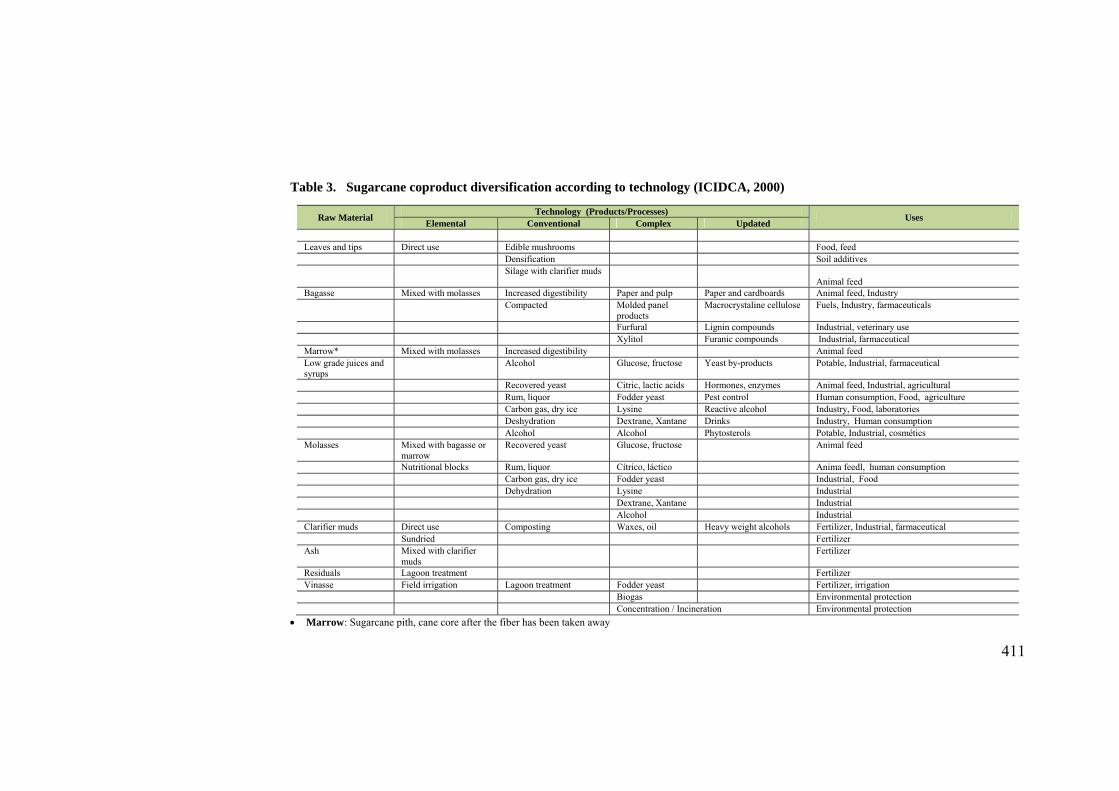
411
Table 3. Sugarcane coproduct diversification according to technology (ICIDCA, 2000)
Raw Material Technology (Products/Processes)
Uses Elemental Conventional Complex Updated
Leaves and tips Direct use Edible mushrooms Food, feed Densification Soil additives Silage with clarifier muds
Animal feed Bagasse Mixed with molasses Increased digestibility Paper and pulp Paper and cardboards Animal feed, Industry Compacted Molded panel
products Macrocrystaline cellulose Fuels, Industry, farmaceuticals
Furfural Lignin compounds Industrial, veterinary use Xylitol Furanic compounds Industrial, farmaceutical Marrow* Mixed with molasses Increased digestibility Animal feed Low grade juices and syrups
Alcohol Glucose, fructose Yeast by-products Potable, Industrial, farmaceutical
Recovered yeast Citric, lactic acids Hormones, enzymes Animal feed, Industrial, agricultural Rum, liquor Fodder yeast Pest control Human consumption, Food, agriculture Carbon gas, dry ice Lysine Reactive alcohol Industry, Food, laboratories Deshydration Dextrane, Xantane Drinks Industry, Human consumption Alcohol Alcohol Phytosterols Potable, Industrial, cosmétics Molasses Mixed with bagasse or
marrow Recovered yeast Glucose, fructose Animal feed
Nutritional blocks Rum, liquor Cítrico, láctico Anima feedl, human consumption Carbon gas, dry ice Fodder yeast Industrial, Food Dehydration Lysine Industrial Dextrane, Xantane Industrial Alcohol Industrial Clarifier muds Direct use Composting Waxes, oil Heavy weight alcohols Fertilizer, Industrial, farmaceutical Sundried Fertilizer Ash Mixed with clarifier
muds Fertilizer
Residuals Lagoon treatment Fertilizer Vinasse Field irrigation Lagoon treatment Fodder yeast Fertilizer, irrigation Biogas Environmental protection Concentration / Incineration Environmental protection
Marrow: Sugarcane pith, cane core after the fiber has been taken away
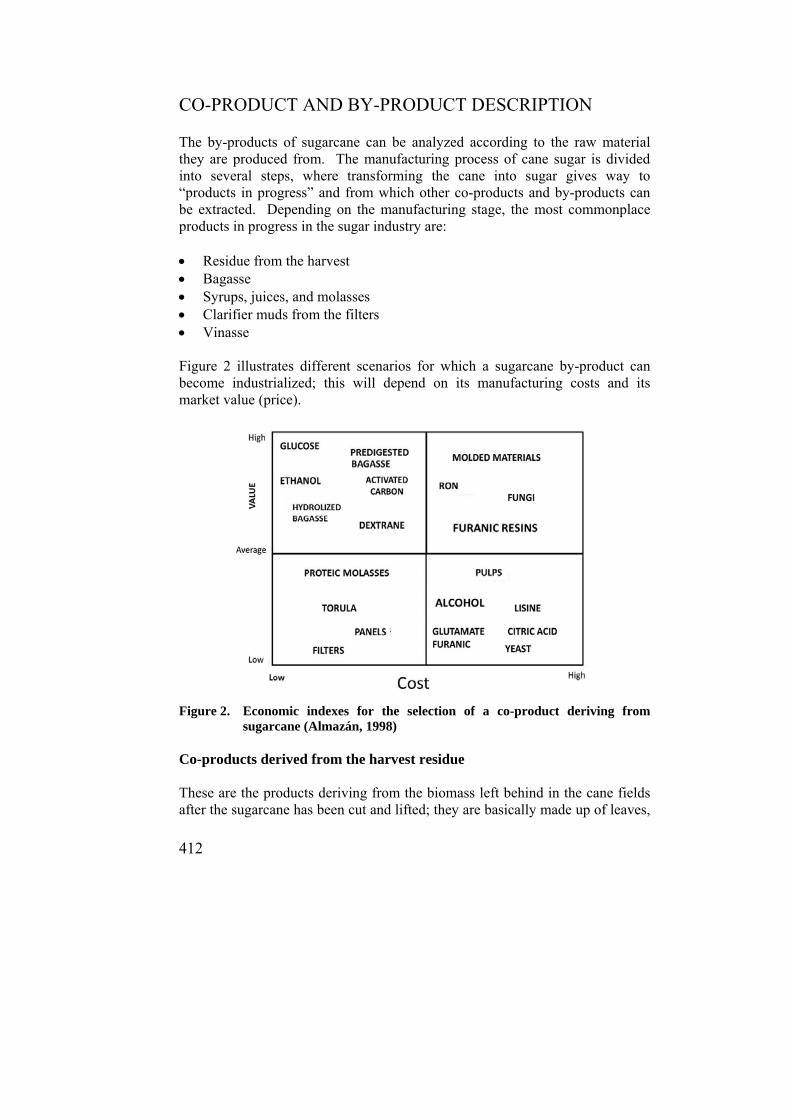
412
CO-PRODUCT AND BY-PRODUCT DESCRIPTION The by-products of sugarcane can be analyzed according to the raw material they are produced from. The manufacturing process of cane sugar is divided into several steps, where transforming the cane into sugar gives way to “products in progress” and from which other co-products and by-products can be extracted. Depending on the manufacturing stage, the most commonplace products in progress in the sugar industry are: Residue from the harvest Bagasse Syrups, juices, and molasses Clarifier muds from the filters Vinasse Figure 2 illustrates different scenarios for which a sugarcane by-product can become industrialized; this will depend on its manufacturing costs and its market value (price).
Figure 2. Economic indexes for the selection of a co-product deriving from
sugarcane (Almazán, 1998) Co-products derived from the harvest residue These are the products deriving from the biomass left behind in the cane fields after the sugarcane has been cut and lifted; they are basically made up of leaves,
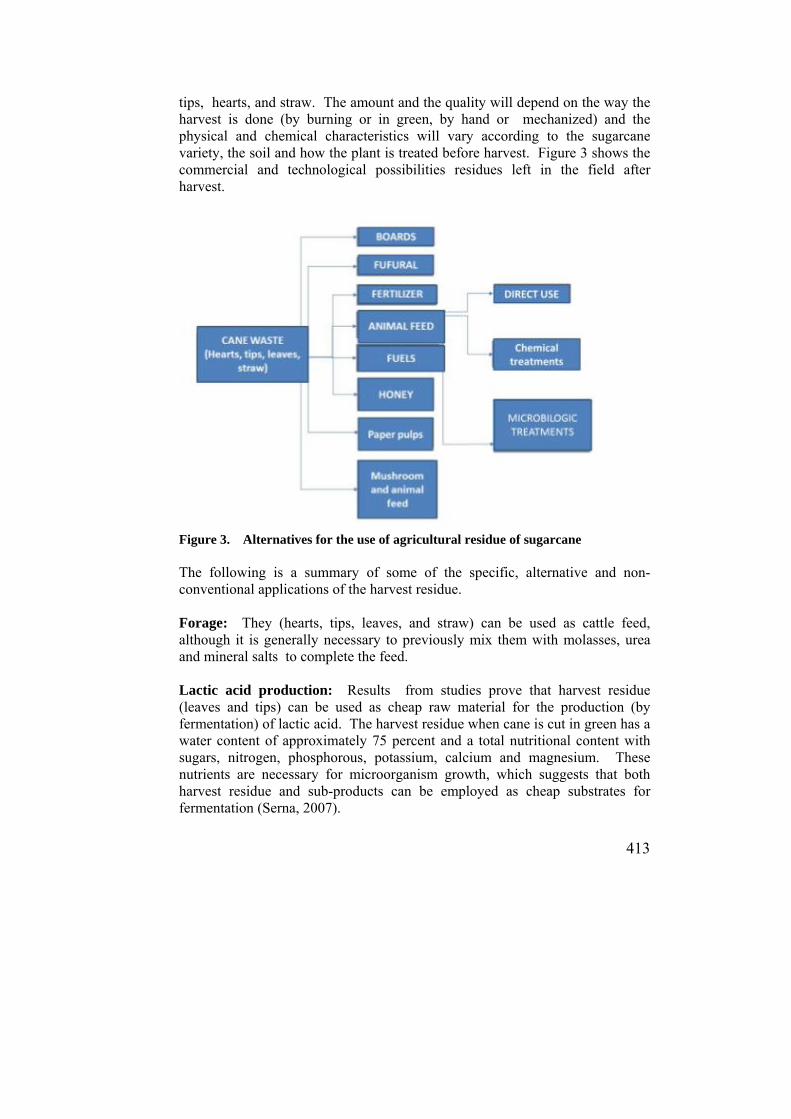
413
tips, hearts, and straw. The amount and the quality will depend on the way the harvest is done (by burning or in green, by hand or mechanized) and the physical and chemical characteristics will vary according to the sugarcane variety, the soil and how the plant is treated before harvest. Figure 3 shows the commercial and technological possibilities residues left in the field after harvest.
Figure 3. Alternatives for the use of agricultural residue of sugarcane The following is a summary of some of the specific, alternative and non-conventional applications of the harvest residue. Forage: They (hearts, tips, leaves, and straw) can be used as cattle feed, although it is generally necessary to previously mix them with molasses, urea and mineral salts to complete the feed. Lactic acid production: Results from studies prove that harvest residue (leaves and tips) can be used as cheap raw material for the production (by fermentation) of lactic acid. The harvest residue when cane is cut in green has a water content of approximately 75 percent and a total nutritional content with sugars, nitrogen, phosphorous, potassium, calcium and magnesium. These nutrients are necessary for microorganism growth, which suggests that both harvest residue and sub-products can be employed as cheap substrates for fermentation (Serna, 2007).
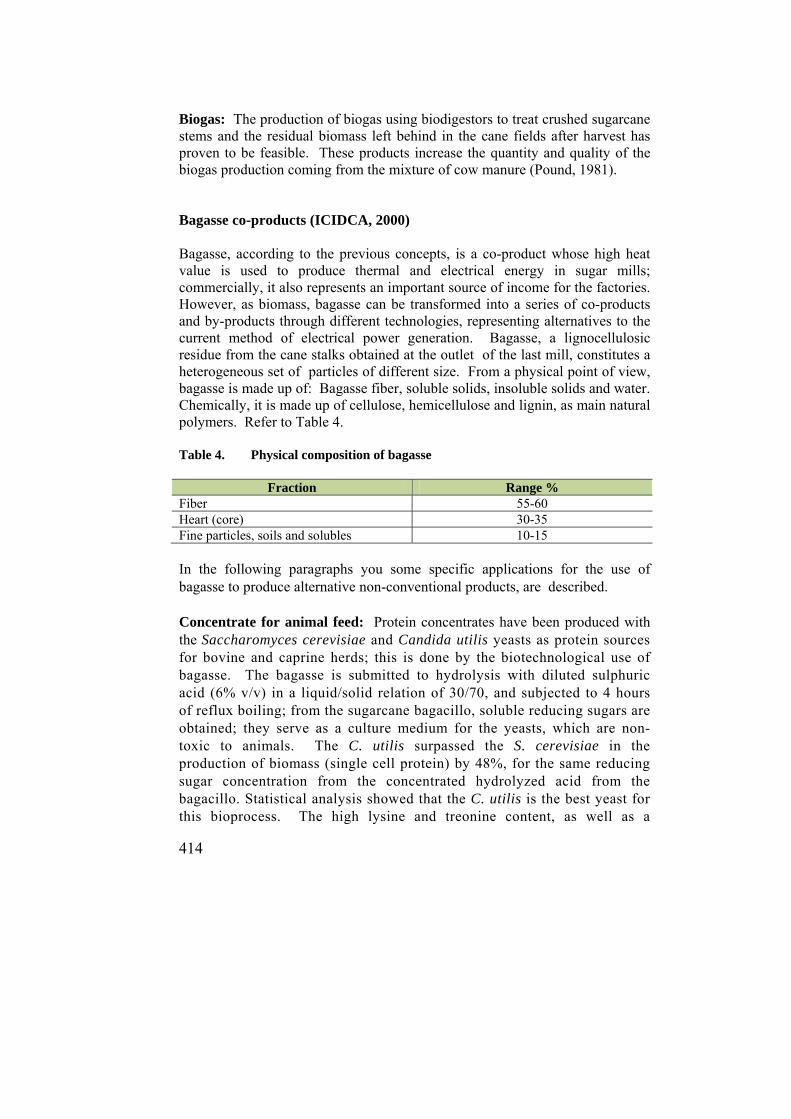
414
Biogas: The production of biogas using biodigestors to treat crushed sugarcane stems and the residual biomass left behind in the cane fields after harvest has proven to be feasible. These products increase the quantity and quality of the biogas production coming from the mixture of cow manure (Pound, 1981). Bagasse co-products (ICIDCA, 2000) Bagasse, according to the previous concepts, is a co-product whose high heat value is used to produce thermal and electrical energy in sugar mills; commercially, it also represents an important source of income for the factories. However, as biomass, bagasse can be transformed into a series of co-products and by-products through different technologies, representing alternatives to the current method of electrical power generation. Bagasse, a lignocellulosic residue from the cane stalks obtained at the outlet of the last mill, constitutes a heterogeneous set of particles of different size. From a physical point of view, bagasse is made up of: Bagasse fiber, soluble solids, insoluble solids and water. Chemically, it is made up of cellulose, hemicellulose and lignin, as main natural polymers. Refer to Table 4.
Table 4. Physical composition of bagasse
Fraction Range %
Fiber 55-60 Heart (core) 30-35 Fine particles, soils and solubles 10-15
In the following paragraphs you some specific applications for the use of bagasse to produce alternative non-conventional products, are described. Concentrate for animal feed: Protein concentrates have been produced with the Saccharomyces cerevisiae and Candida utilis yeasts as protein sources for bovine and caprine herds; this is done by the biotechnological use of bagasse. The bagasse is submitted to hydrolysis with diluted sulphuric acid (6% v/v) in a liquid/solid relation of 30/70, and subjected to 4 hours of reflux boiling; from the sugarcane bagacillo, soluble reducing sugars are obtained; they serve as a culture medium for the yeasts, which are non-toxic to animals. The C. utilis surpassed the S. cerevisiae in the production of biomass (single cell protein) by 48%, for the same reducing sugar concentration from the concentrated hydrolyzed acid from the bagacillo. Statistical analysis showed that the C. utilis is the best yeast for this bioprocess. The high lysine and treonine content, as well as a
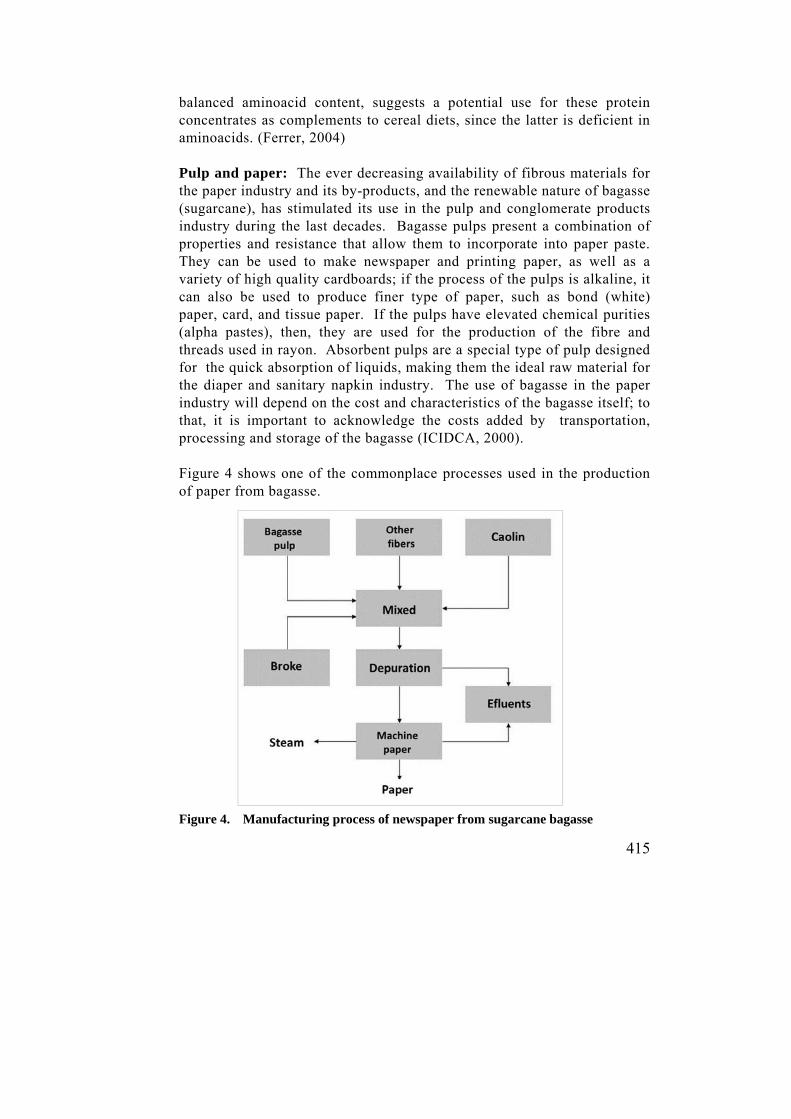
415
balanced aminoacid content, suggests a potential use for these protein concentrates as complements to cereal diets, since the latter is deficient in aminoacids. (Ferrer, 2004) Pulp and paper: The ever decreasing availability of fibrous materials for the paper industry and its by-products, and the renewable nature of bagasse (sugarcane), has stimulated its use in the pulp and conglomerate products industry during the last decades. Bagasse pulps present a combination of properties and resistance that allow them to incorporate into paper paste. They can be used to make newspaper and printing paper, as well as a variety of high quality cardboards; if the process of the pulps is alkaline, it can also be used to produce finer type of paper, such as bond (white) paper, card, and tissue paper. If the pulps have elevated chemical purities (alpha pastes), then, they are used for the production of the fibre and threads used in rayon. Absorbent pulps are a special type of pulp designed for the quick absorption of liquids, making them the ideal raw material for the diaper and sanitary napkin industry. The use of bagasse in the paper industry will depend on the cost and characteristics of the bagasse itself; to that, it is important to acknowledge the costs added by transportation, processing and storage of the bagasse (ICIDCA, 2000). Figure 4 shows one of the commonplace processes used in the production of paper from bagasse.
Figure 4. Manufacturing process of newspaper from sugarcane bagasse

416
Celluloses: Carboxymethylcellulose and microcrystaline cellulose can also be produced from sugarcane bagasse. Carboxymethylcellulose is used as detergent, thickener and glue in the tobacco and rayon industries; it is also used to glue threads in the textile industry. Microcrystaline cellulose, due to its chemical purity, posseses properties that make it suitable for the manufacture of creams, cosmetics, detergents and as an excipient in the pharmaceutical industry. Filter aids and filter media: Bagasse has proven to be feasible, in combination with other wooden fibers, in the production of filter aids. These have several uses: Filters for rum and beer, for sugary syrups, for vinegars, wines, pharmaceutical products, papers for laboratories, and for paints and varnishes. Pharmaceuticals: Pharmaceuticals for gastrointestinal disorders are developed from lignin (due to its absorbing capacity). It has been proven to be capable of bonding nitrates, cancerogenous substances, bile salts, nitrosamines and mineral salts in the gastrointestinal tract. Panel products: These are panel sheets and boards made with bagasse particles aglomerated with organic glue under specific temperature and pressure conditions. The furniture business is the largest consumer of these sheets, especially in the form of mdf and the likes. If the glue is in the form of cement, then the bagasse sheets can be used for the building of houses and schools. Additionally, if the conglomerates include plaster, then they can be used as sheetrock for ceilings. Furfural: This is an aldehyde by-product from the pentosans found together with cellulose in many of the plant tissues. It constitutes the main element of furans. Their chemical properties make it a very versatile product with a high reactivity for organic compound synthesis. Its main applications are industrial products such as polymers and pesticides. They derive from the following chemical reaction:
C5H8O4 + H2O ----------C5H10O5----------C5H4O2 + 3H2O
Xylan Xylose Furfural
In practice, clos to 25 tons of bagasse are necessary to produce one ton of furfural. Figure 5 shows a diagram description of the products that can be derived from it.
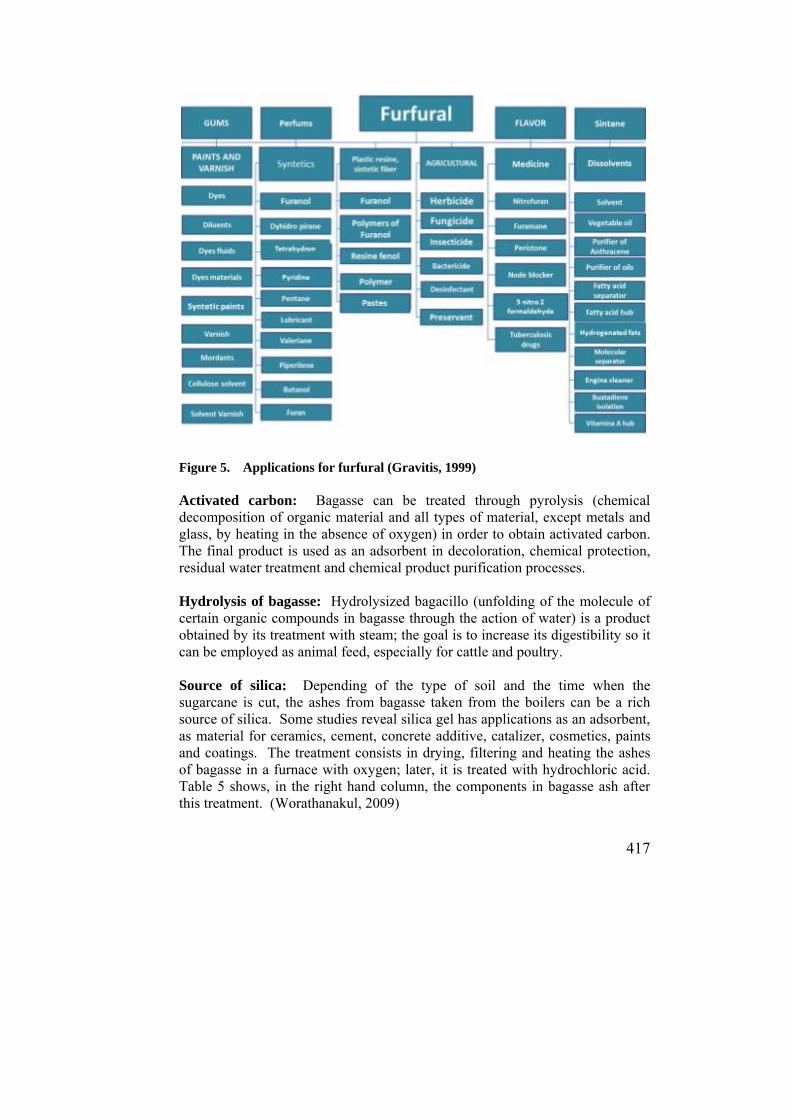
417
Figure 5. Applications for furfural (Gravitis, 1999)
Activated carbon: Bagasse can be treated through pyrolysis (chemical decomposition of organic material and all types of material, except metals and glass, by heating in the absence of oxygen) in order to obtain activated carbon. The final product is used as an adsorbent in decoloration, chemical protection, residual water treatment and chemical product purification processes. Hydrolysis of bagasse: Hydrolysized bagacillo (unfolding of the molecule of certain organic compounds in bagasse through the action of water) is a product obtained by its treatment with steam; the goal is to increase its digestibility so it can be employed as animal feed, especially for cattle and poultry. Source of silica: Depending of the type of soil and the time when the sugarcane is cut, the ashes from bagasse taken from the boilers can be a rich source of silica. Some studies reveal silica gel has applications as an adsorbent, as material for ceramics, cement, concrete additive, catalizer, cosmetics, paints and coatings. The treatment consists in drying, filtering and heating the ashes of bagasse in a furnace with oxygen; later, it is treated with hydrochloric acid. Table 5 shows, in the right hand column, the components in bagasse ash after this treatment. (Worathanakul, 2009)
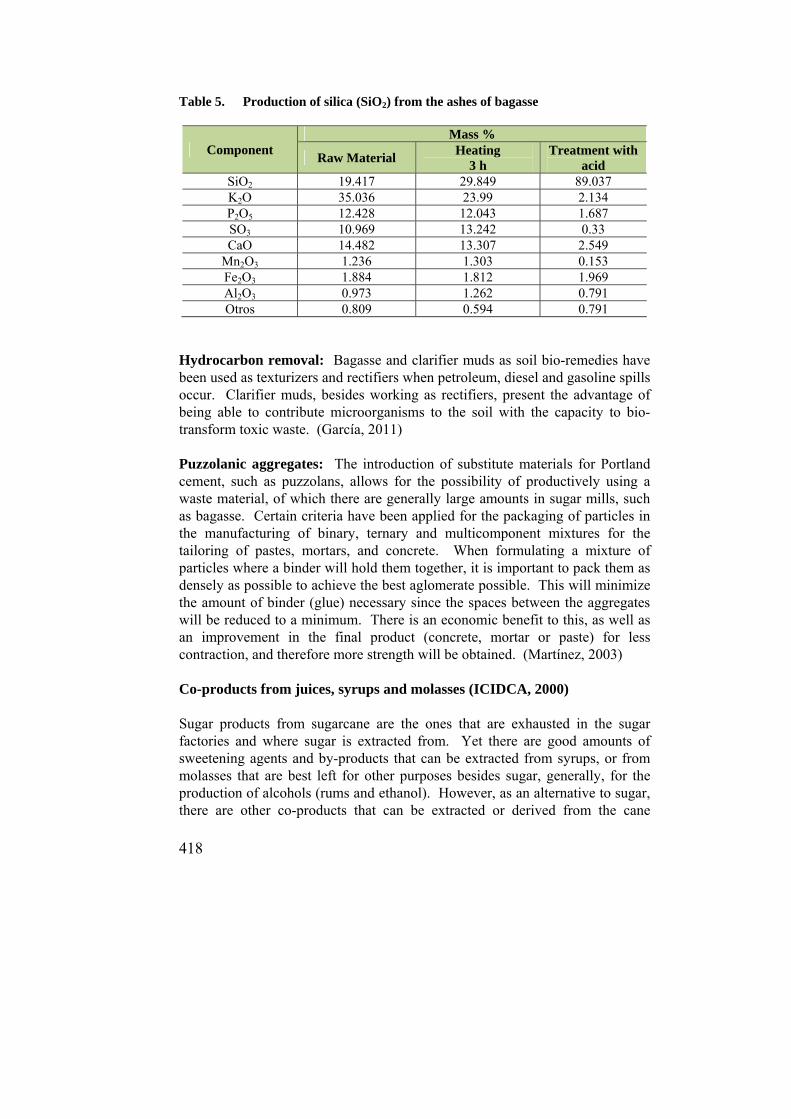
418
Table 5. Production of silica (SiO2) from the ashes of bagasse
Component Mass %
Raw Material Heating
3 h Treatment with
acid SiO2 19.417 29.849 89.037 K2O 35.036 23.99 2.134 P2O5 12.428 12.043 1.687 SO3 10.969 13.242 0.33 CaO 14.482 13.307 2.549
Mn2O3 1.236 1.303 0.153 Fe2O3 1.884 1.812 1.969 Al2O3 0.973 1.262 0.791 Otros 0.809 0.594 0.791
Hydrocarbon removal: Bagasse and clarifier muds as soil bio-remedies have been used as texturizers and rectifiers when petroleum, diesel and gasoline spills occur. Clarifier muds, besides working as rectifiers, present the advantage of being able to contribute microorganisms to the soil with the capacity to bio-transform toxic waste. (García, 2011) Puzzolanic aggregates: The introduction of substitute materials for Portland cement, such as puzzolans, allows for the possibility of productively using a waste material, of which there are generally large amounts in sugar mills, such as bagasse. Certain criteria have been applied for the packaging of particles in the manufacturing of binary, ternary and multicomponent mixtures for the tailoring of pastes, mortars, and concrete. When formulating a mixture of particles where a binder will hold them together, it is important to pack them as densely as possible to achieve the best aglomerate possible. This will minimize the amount of binder (glue) necessary since the spaces between the aggregates will be reduced to a minimum. There is an economic benefit to this, as well as an improvement in the final product (concrete, mortar or paste) for less contraction, and therefore more strength will be obtained. (Martínez, 2003) Co-products from juices, syrups and molasses (ICIDCA, 2000) Sugar products from sugarcane are the ones that are exhausted in the sugar factories and where sugar is extracted from. Yet there are good amounts of sweetening agents and by-products that can be extracted from syrups, or from molasses that are best left for other purposes besides sugar, generally, for the production of alcohols (rums and ethanol). However, as an alternative to sugar, there are other co-products that can be extracted or derived from the cane
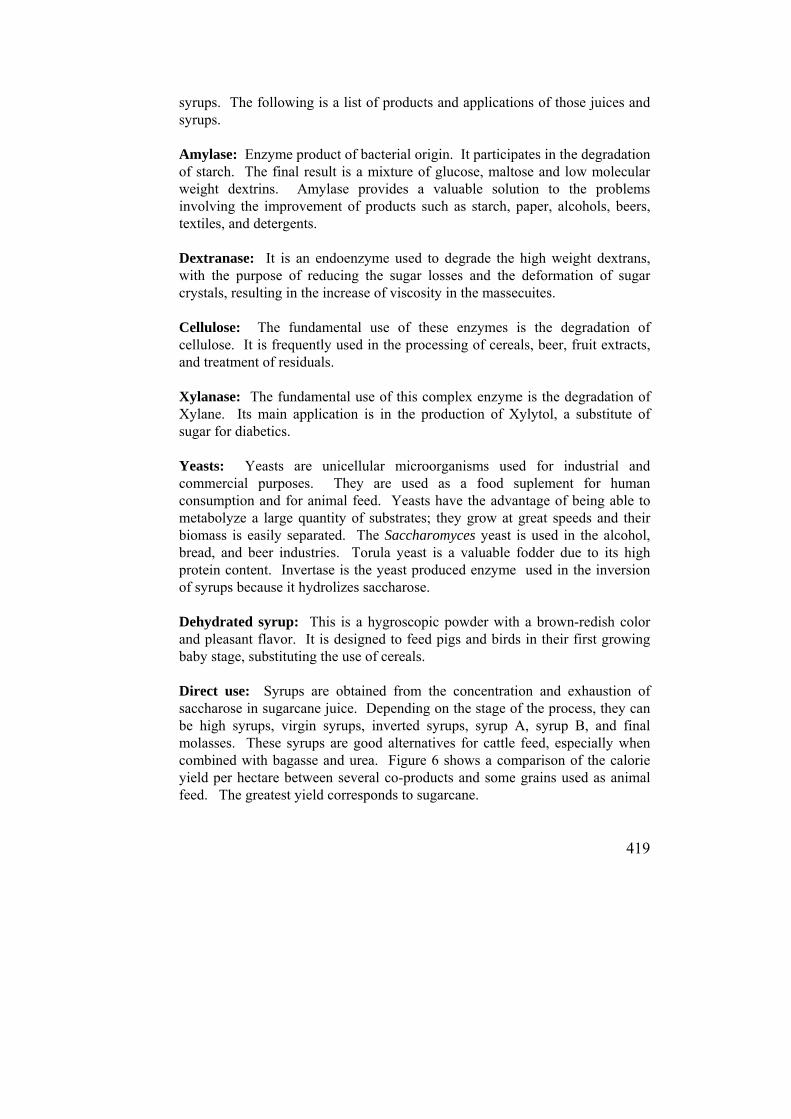
419
syrups. The following is a list of products and applications of those juices and syrups. Amylase: Enzyme product of bacterial origin. It participates in the degradation of starch. The final result is a mixture of glucose, maltose and low molecular weight dextrins. Amylase provides a valuable solution to the problems involving the improvement of products such as starch, paper, alcohols, beers, textiles, and detergents. Dextranase: It is an endoenzyme used to degrade the high weight dextrans, with the purpose of reducing the sugar losses and the deformation of sugar crystals, resulting in the increase of viscosity in the massecuites. Cellulose: The fundamental use of these enzymes is the degradation of cellulose. It is frequently used in the processing of cereals, beer, fruit extracts, and treatment of residuals. Xylanase: The fundamental use of this complex enzyme is the degradation of Xylane. Its main application is in the production of Xylytol, a substitute of sugar for diabetics. Yeasts: Yeasts are unicellular microorganisms used for industrial and commercial purposes. They are used as a food suplement for human consumption and for animal feed. Yeasts have the advantage of being able to metabolyze a large quantity of substrates; they grow at great speeds and their biomass is easily separated. The Saccharomyces yeast is used in the alcohol, bread, and beer industries. Torula yeast is a valuable fodder due to its high protein content. Invertase is the yeast produced enzyme used in the inversion of syrups because it hydrolizes saccharose. Dehydrated syrup: This is a hygroscopic powder with a brown-redish color and pleasant flavor. It is designed to feed pigs and birds in their first growing baby stage, substituting the use of cereals. Direct use: Syrups are obtained from the concentration and exhaustion of saccharose in sugarcane juice. Depending on the stage of the process, they can be high syrups, virgin syrups, inverted syrups, syrup A, syrup B, and final molasses. These syrups are good alternatives for cattle feed, especially when combined with bagasse and urea. Figure 6 shows a comparison of the calorie yield per hectare between several co-products and some grains used as animal feed. The greatest yield corresponds to sugarcane.
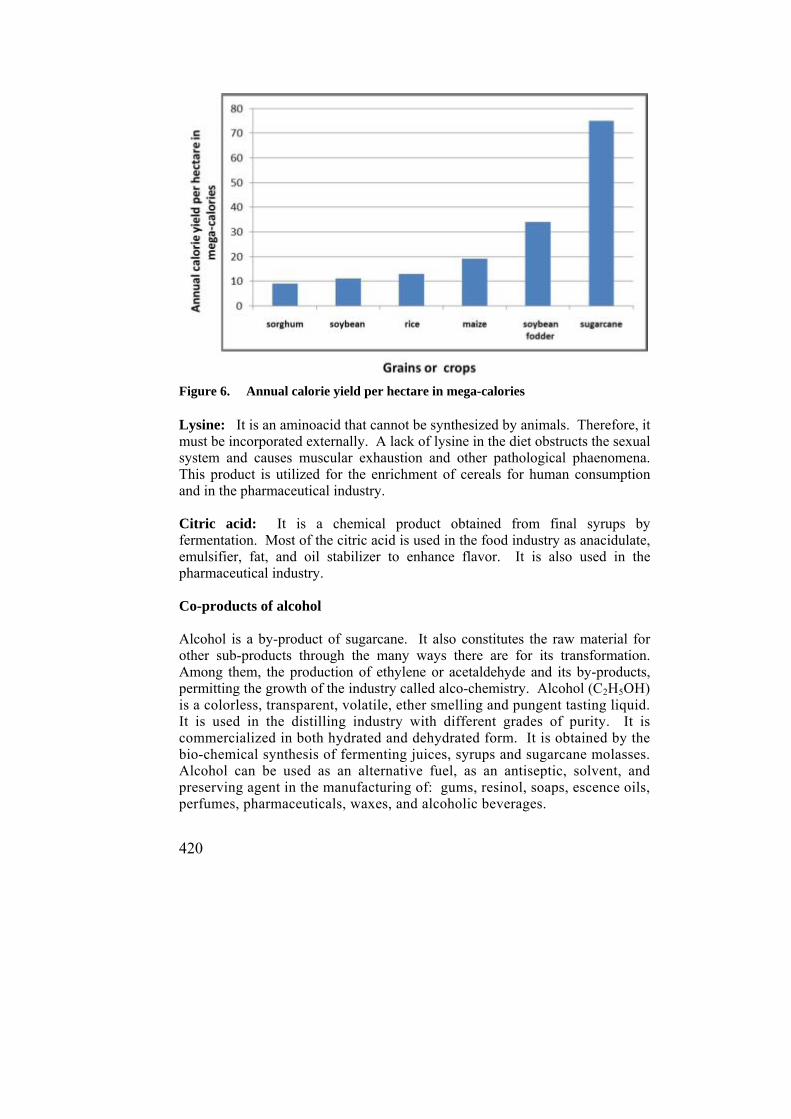
420
Figure 6. Annual calorie yield per hectare in mega-calories Lysine: It is an aminoacid that cannot be synthesized by animals. Therefore, it must be incorporated externally. A lack of lysine in the diet obstructs the sexual system and causes muscular exhaustion and other pathological phaenomena. This product is utilized for the enrichment of cereals for human consumption and in the pharmaceutical industry. Citric acid: It is a chemical product obtained from final syrups by fermentation. Most of the citric acid is used in the food industry as anacidulate, emulsifier, fat, and oil stabilizer to enhance flavor. It is also used in the pharmaceutical industry. Co-products of alcohol Alcohol is a by-product of sugarcane. It also constitutes the raw material for other sub-products through the many ways there are for its transformation. Among them, the production of ethylene or acetaldehyde and its by-products, permitting the growth of the industry called alco-chemistry. Alcohol (C2H5OH) is a colorless, transparent, volatile, ether smelling and pungent tasting liquid. It is used in the distilling industry with different grades of purity. It is commercialized in both hydrated and dehydrated form. It is obtained by the bio-chemical synthesis of fermenting juices, syrups and sugarcane molasses. Alcohol can be used as an alternative fuel, as an antiseptic, solvent, and preserving agent in the manufacturing of: gums, resinol, soaps, escence oils, perfumes, pharmaceuticals, waxes, and alcoholic beverages.
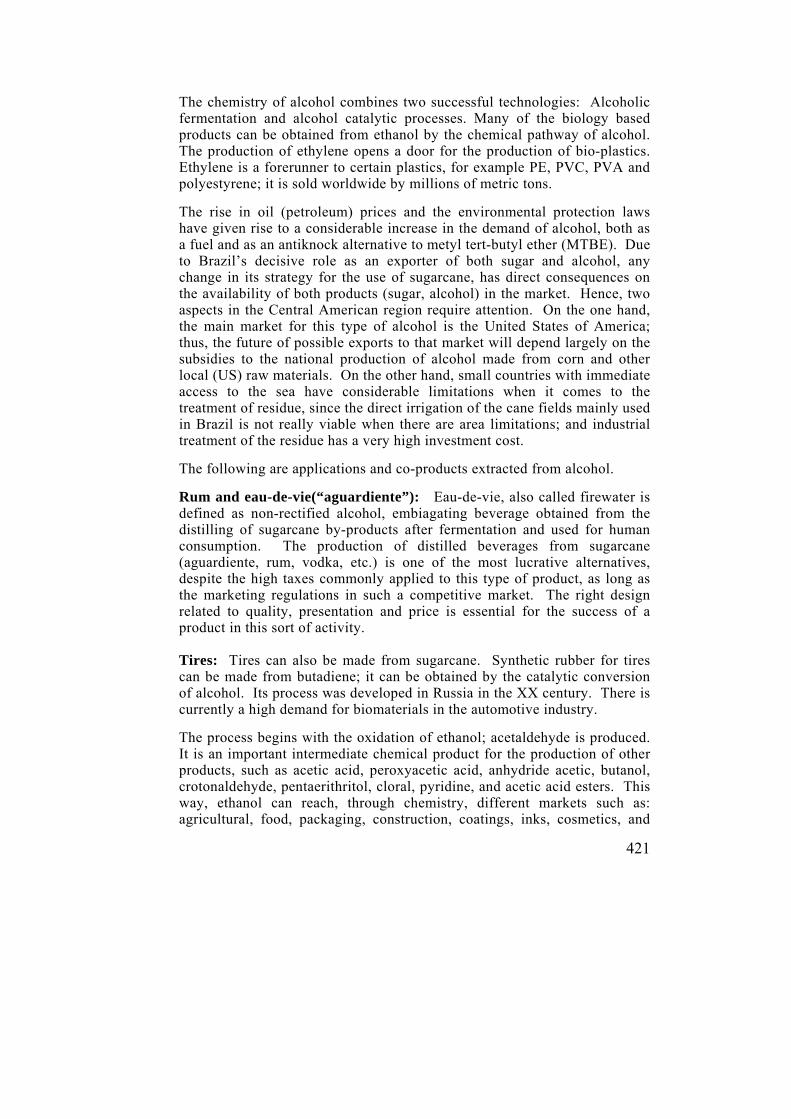
421
The chemistry of alcohol combines two successful technologies: Alcoholic fermentation and alcohol catalytic processes. Many of the biology based products can be obtained from ethanol by the chemical pathway of alcohol. The production of ethylene opens a door for the production of bio-plastics. Ethylene is a forerunner to certain plastics, for example PE, PVC, PVA and polyestyrene; it is sold worldwide by millions of metric tons.
The rise in oil (petroleum) prices and the environmental protection laws have given rise to a considerable increase in the demand of alcohol, both as a fuel and as an antiknock alternative to metyl tert-butyl ether (MTBE). Due to Brazil’s decisive role as an exporter of both sugar and alcohol, any change in its strategy for the use of sugarcane, has direct consequences on the availability of both products (sugar, alcohol) in the market. Hence, two aspects in the Central American region require attention. On the one hand, the main market for this type of alcohol is the United States of America; thus, the future of possible exports to that market will depend largely on the subsidies to the national production of alcohol made from corn and other local (US) raw materials. On the other hand, small countries with immediate access to the sea have considerable limitations when it comes to the treatment of residue, since the direct irrigation of the cane fields mainly used in Brazil is not really viable when there are area limitations; and industrial treatment of the residue has a very high investment cost.
The following are applications and co-products extracted from alcohol.
Rum and eau-de-vie(“aguardiente”): Eau-de-vie, also called firewater is defined as non-rectified alcohol, embiagating beverage obtained from the distilling of sugarcane by-products after fermentation and used for human consumption. The production of distilled beverages from sugarcane (aguardiente, rum, vodka, etc.) is one of the most lucrative alternatives, despite the high taxes commonly applied to this type of product, as long as the marketing regulations in such a competitive market. The right design related to quality, presentation and price is essential for the success of a product in this sort of activity. Tires: Tires can also be made from sugarcane. Synthetic rubber for tires can be made from butadiene; it can be obtained by the catalytic conversion of alcohol. Its process was developed in Russia in the XX century. There is currently a high demand for biomaterials in the automotive industry.
The process begins with the oxidation of ethanol; acetaldehyde is produced. It is an important intermediate chemical product for the production of other products, such as acetic acid, peroxyacetic acid, anhydride acetic, butanol, crotonaldehyde, pentaerithritol, cloral, pyridine, and acetic acid esters. This way, ethanol can reach, through chemistry, different markets such as: agricultural, food, packaging, construction, coatings, inks, cosmetics, and
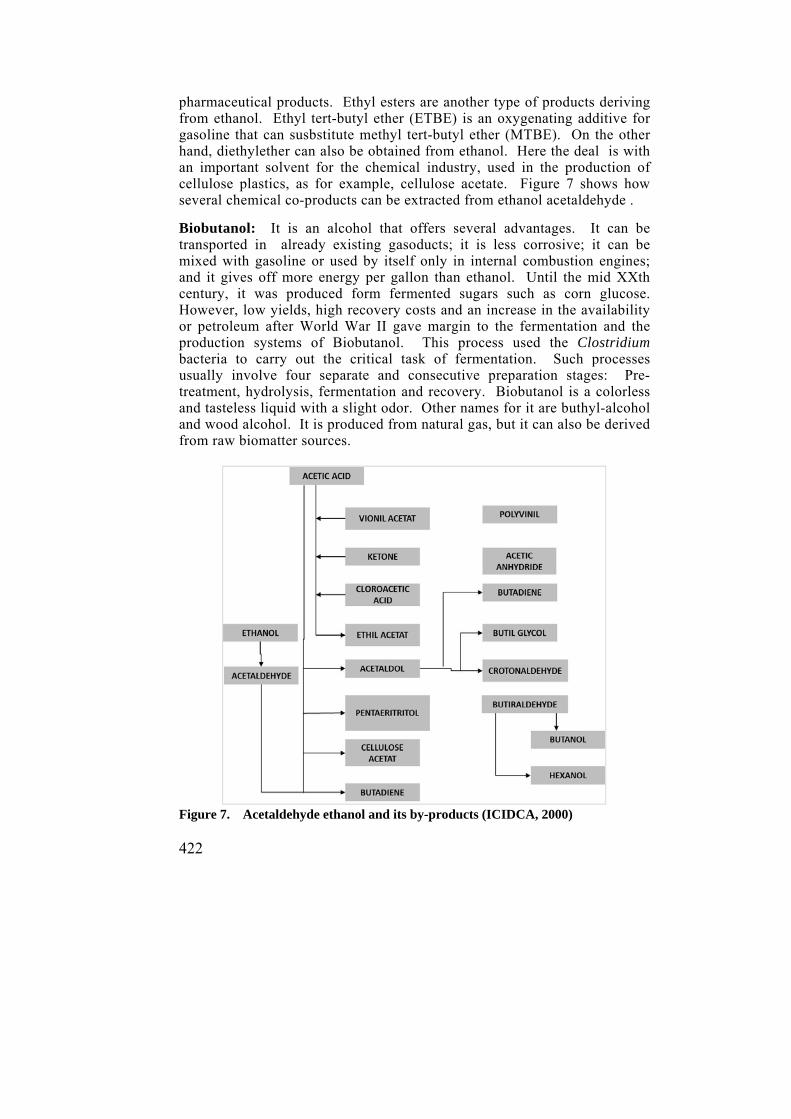
422
pharmaceutical products. Ethyl esters are another type of products deriving from ethanol. Ethyl tert-butyl ether (ETBE) is an oxygenating additive for gasoline that can susbstitute methyl tert-butyl ether (MTBE). On the other hand, diethylether can also be obtained from ethanol. Here the deal is with an important solvent for the chemical industry, used in the production of cellulose plastics, as for example, cellulose acetate. Figure 7 shows how several chemical co-products can be extracted from ethanol acetaldehyde .
Biobutanol: It is an alcohol that offers several advantages. It can be transported in already existing gasoducts; it is less corrosive; it can be mixed with gasoline or used by itself only in internal combustion engines; and it gives off more energy per gallon than ethanol. Until the mid XXth century, it was produced form fermented sugars such as corn glucose. However, low yields, high recovery costs and an increase in the availability or petroleum after World War II gave margin to the fermentation and the production systems of Biobutanol. This process used the Clostridium bacteria to carry out the critical task of fermentation. Such processes usually involve four separate and consecutive preparation stages: Pre-treatment, hydrolysis, fermentation and recovery. Biobutanol is a colorless and tasteless liquid with a slight odor. Other names for it are buthyl-alcohol and wood alcohol. It is produced from natural gas, but it can also be derived from raw biomatter sources.
Figure 7. Acetaldehyde ethanol and its by-products (ICIDCA, 2000)
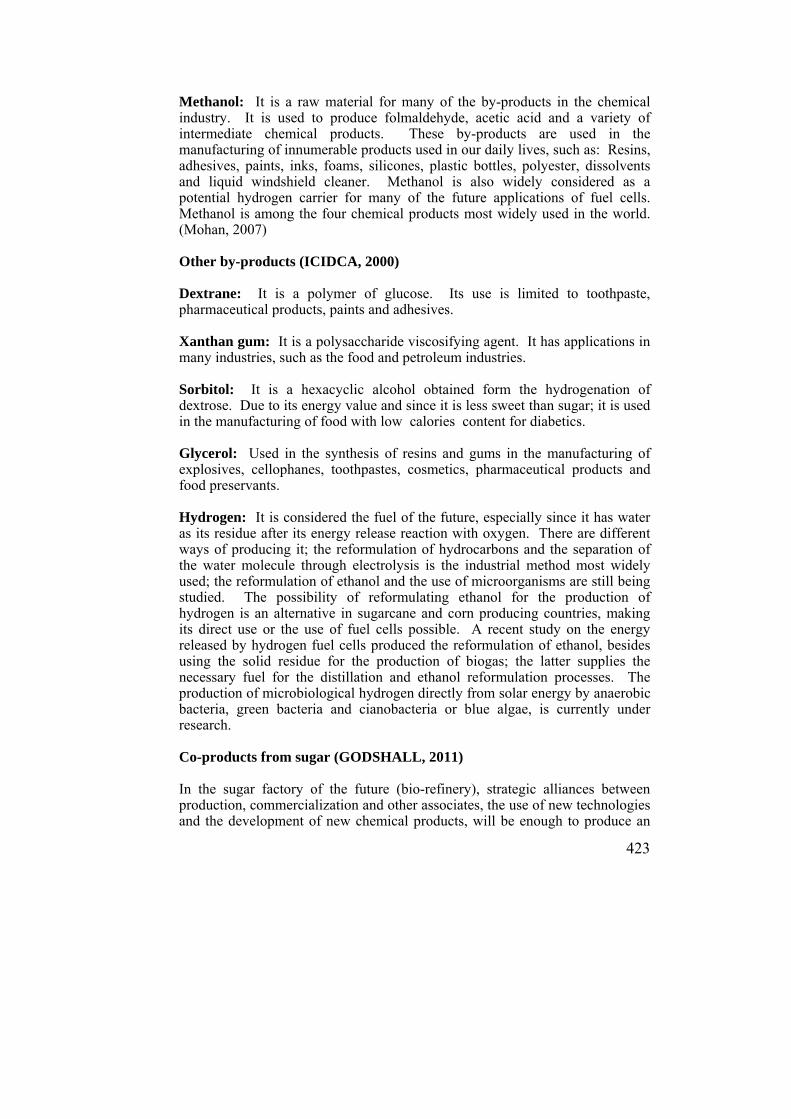
423
Methanol: It is a raw material for many of the by-products in the chemical industry. It is used to produce folmaldehyde, acetic acid and a variety of intermediate chemical products. These by-products are used in the manufacturing of innumerable products used in our daily lives, such as: Resins, adhesives, paints, inks, foams, silicones, plastic bottles, polyester, dissolvents and liquid windshield cleaner. Methanol is also widely considered as a potential hydrogen carrier for many of the future applications of fuel cells. Methanol is among the four chemical products most widely used in the world. (Mohan, 2007) Other by-products (ICIDCA, 2000) Dextrane: It is a polymer of glucose. Its use is limited to toothpaste, pharmaceutical products, paints and adhesives. Xanthan gum: It is a polysaccharide viscosifying agent. It has applications in many industries, such as the food and petroleum industries. Sorbitol: It is a hexacyclic alcohol obtained form the hydrogenation of dextrose. Due to its energy value and since it is less sweet than sugar; it is used in the manufacturing of food with low calories content for diabetics. Glycerol: Used in the synthesis of resins and gums in the manufacturing of explosives, cellophanes, toothpastes, cosmetics, pharmaceutical products and food preservants. Hydrogen: It is considered the fuel of the future, especially since it has water as its residue after its energy release reaction with oxygen. There are different ways of producing it; the reformulation of hydrocarbons and the separation of the water molecule through electrolysis is the industrial method most widely used; the reformulation of ethanol and the use of microorganisms are still being studied. The possibility of reformulating ethanol for the production of hydrogen is an alternative in sugarcane and corn producing countries, making its direct use or the use of fuel cells possible. A recent study on the energy released by hydrogen fuel cells produced the reformulation of ethanol, besides using the solid residue for the production of biogas; the latter supplies the necessary fuel for the distillation and ethanol reformulation processes. The production of microbiological hydrogen directly from solar energy by anaerobic bacteria, green bacteria and cianobacteria or blue algae, is currently under research. Co-products from sugar (GODSHALL, 2011) In the sugar factory of the future (bio-refinery), strategic alliances between production, commercialization and other associates, the use of new technologies and the development of new chemical products, will be enough to produce an
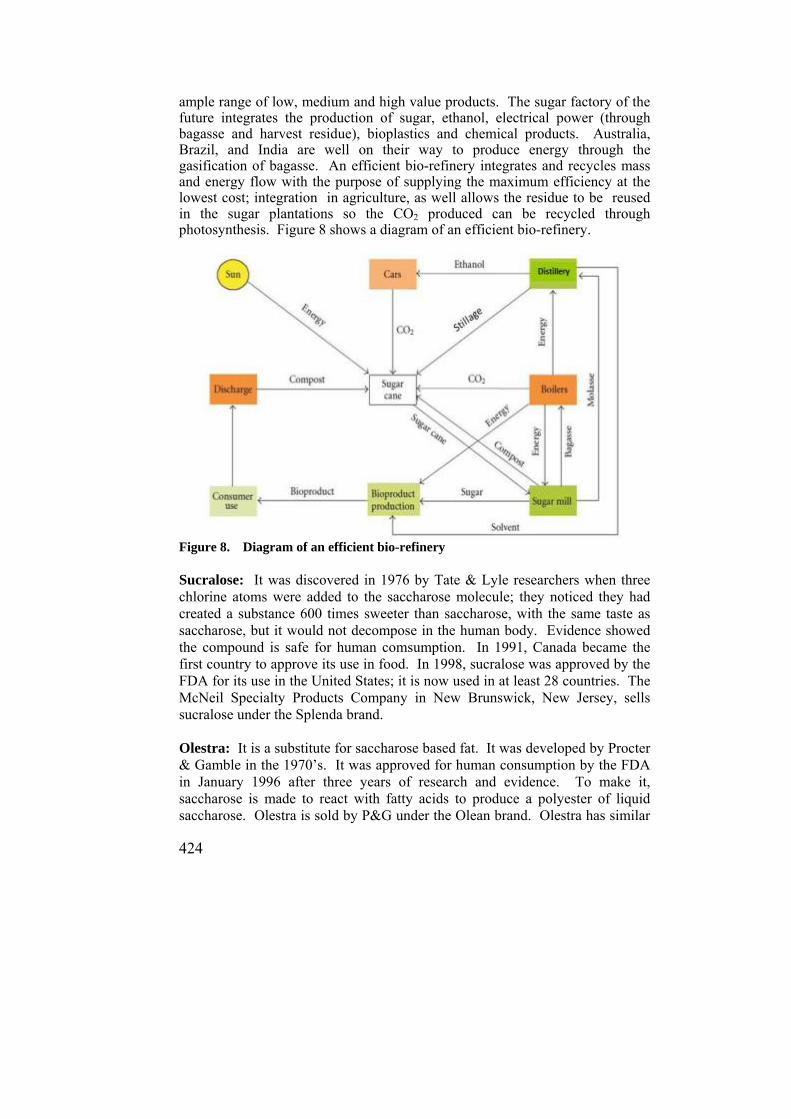
424
ample range of low, medium and high value products. The sugar factory of the future integrates the production of sugar, ethanol, electrical power (through bagasse and harvest residue), bioplastics and chemical products. Australia, Brazil, and India are well on their way to produce energy through the gasification of bagasse. An efficient bio-refinery integrates and recycles mass and energy flow with the purpose of supplying the maximum efficiency at the lowest cost; integration in agriculture, as well allows the residue to be reused in the sugar plantations so the CO2 produced can be recycled through photosynthesis. Figure 8 shows a diagram of an efficient bio-refinery.
Figure 8. Diagram of an efficient bio-refinery Sucralose: It was discovered in 1976 by Tate & Lyle researchers when three chlorine atoms were added to the saccharose molecule; they noticed they had created a substance 600 times sweeter than saccharose, with the same taste as saccharose, but it would not decompose in the human body. Evidence showed the compound is safe for human comsumption. In 1991, Canada became the first country to approve its use in food. In 1998, sucralose was approved by the FDA for its use in the United States; it is now used in at least 28 countries. The McNeil Specialty Products Company in New Brunswick, New Jersey, sells sucralose under the Splenda brand. Olestra: It is a substitute for saccharose based fat. It was developed by Procter & Gamble in the 1970’s. It was approved for human consumption by the FDA in January 1996 after three years of research and evidence. To make it, saccharose is made to react with fatty acids to produce a polyester of liquid saccharose. Olestra is sold by P&G under the Olean brand. Olestra has similar
425
properties to liquid vegetable oil, but without the calories. It is currently being used to prepare salty appetizers, in particular for French fries, in a merger between Frito-Lay and P&G. Fructo-oligosaccharides: They represent an interesting study case in the development of a new product; it falls some place between the category of food additives and neutraceutics. They are also known as FOS, and commercially they are known as Neosugar and Meijioligo. FOS is a new healthy food developed through the fermentation or enzymatic transformation of saccharose. It is extremely popular in Japan, although it has also raised interest in Europe and North America. It is said that FOS is good for “abdominal health” in the sense that it promotes the growth of bifidobacteria in the intestine, and they supposedly give many other benefits to the body. Its sweetness ranges between 30 and 80 percent than that of saccharose, depending on its composition. It is sold in the form of syrup or in a powder; it generally contains a certain proportion of saccharose and fructose, together with another three oligosaccharides: Kestose, nitrose, and fructofuransonil nistose. Some of their most promising uses include the protection of pork from E. coli infenction and porcine odor control. Sucralphate: It is a complex aluminum hydroxide, saccharose sulphate used as medicine for ulcers in humans and animals. It is not absorbed by the body and it has its own characteristics in the fight agains ulcers; it acts as an “ulcer bandage”, actively aiding in healing. Polysucrose: It is a copolymer of saccharose and epiclorohydrine. It is used to make density gradients for cellular separation and as a diagnostics agent. It also has some potential as a nutraceutic or as a food additive. Patents in the United States have promoted it as ingredient in sports’ drinks, and in India, as an iron supplement. Sucrose esters: These can take many forms because they have eight available hydroxyl to react with numerous fatty acid groups. This flexibility means that many products and functionalities can be adapted depending on the fraction of the fatty acid used. Saccharose esters have many applications in food and non-food products, especially as surfactants and emulsifiers; they have evergrowing uses in pharmaceutical products, cosmetics, detergents, and food products. They are easily biodegradable, non toxic and soft for the skin. Isobutyrate acetate: This (SAIB) is the one with the highest volume of use, both in food and industrially. It is used in automotive paints, as a clouding and stabilizing agent in beverages, in nail polish and in hair spray, among other uses.
426
Detergents with a saccharose base: Biodegradable non-ionic detergents with antibacterial properties can be made from saccharose esters; it is a small but emerging market. Derisa Corp., in Argentina, commercializes a saccharose based detergent called Sucrotex; some are also manufactured in the Philipines. Europe has shown a significant interest in these types of products. Thermal sucrose-oligosaccharide caramel: Researches from the University of Montana developed sucrose thermal-oligosaccharide (STOC) by means of the controlled pyrolysis of saccharose. Amorphous saccharose is heated with citric acid to produce fructoglucan. This functions as a dietary supplement to increase the growth in poultry and it can be applied as a possible non-calorie agent in foods. These researchers have also experimented with the reaction of other carbohydrates from saccharose to manufacture other products. For example, a controlled thermal reaction between sucrose and ciclodextrine produces fructose cyclodextrin compounds with the ability to improve the solubility of inclusion complexes, and as flavor and vitamin carriers in processed foods, these can have applications as flavor and vitamin carriers in food. Epoxies: Doctor Nozar Sachinvala, a scientific researcher form the South Regional Research Center for the FDA in New Orleans, has discovered a series of sucrose epoxies that are neither mutagenic nor cytotoxic, they can adhere metal to metal, metal to glass, and fiber to fiber. The big sucrose based adhesive producers are trying to introduce them into the textile, housing insulation, and other construction materials industries. Hydrogels (sucrogels): Compounds made in a two stage processs. Their properties can be manipulated on a wide scale by adjusting the reticulation relation and initial monomer concentration. These products are super-porous and they have a potential use in the controlled release of pharmaceuticals. They can be made in any size, shape and form, with the required properties. They have many industrial applications. Biodegradable plastic (bioplastic): An area that creates a lot of enthusiasm for environmental preservation using “green chemistry” is the production of natural biodegradable plastics using microorganisms. Several species of bacteria produce biodegradable plastics by storing polymers within their cells. Between 50 and 60 percent of the microorganism’s body weight can be bioplastics, and in some cases even up to 90 percent. Bioplastics are expensive, but they have the advantage of being able to be processed in the same equipment used to manufacture conventional plastics. Research is being done to design bacteria capable of producing polyhydroxyalkanoates (PHA) and other polymers. Fermentation has benefited from the recent events in
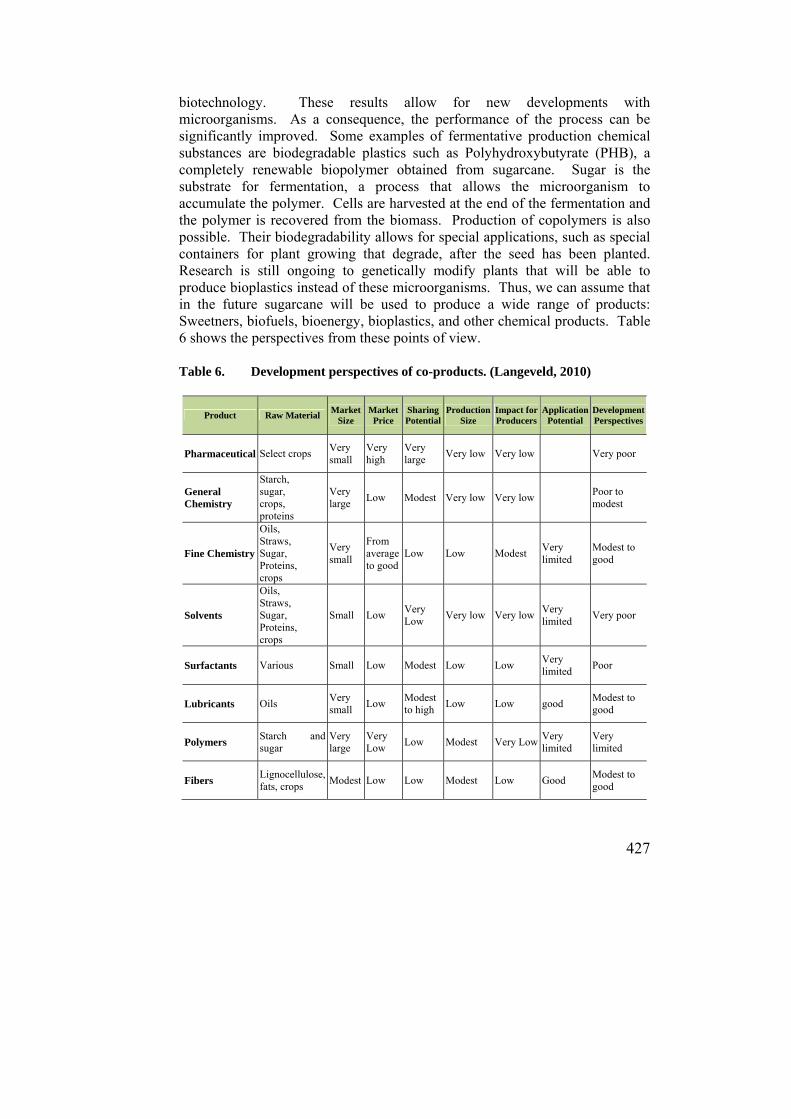
427
biotechnology. These results allow for new developments with microorganisms. As a consequence, the performance of the process can be significantly improved. Some examples of fermentative production chemical substances are biodegradable plastics such as Polyhydroxybutyrate (PHB), a completely renewable biopolymer obtained from sugarcane. Sugar is the substrate for fermentation, a process that allows the microorganism to accumulate the polymer. Cells are harvested at the end of the fermentation and the polymer is recovered from the biomass. Production of copolymers is also possible. Their biodegradability allows for special applications, such as special containers for plant growing that degrade, after the seed has been planted. Research is still ongoing to genetically modify plants that will be able to produce bioplastics instead of these microorganisms. Thus, we can assume that in the future sugarcane will be used to produce a wide range of products: Sweetners, biofuels, bioenergy, bioplastics, and other chemical products. Table 6 shows the perspectives from these points of view. Table 6. Development perspectives of co-products. (Langeveld, 2010)
Product Raw Material Market
Size Market Price
Sharing Potential
Production Size
Impact for Producers
Application Potential
Development Perspectives
Pharmaceutical Select crops Very small
Very high
Very large
Very low Very low Very poor
General Chemistry
Starch, sugar, crops, proteins
Very large
Low Modest Very low Very low Poor to modest
Fine Chemistry
Oils, Straws, Sugar, Proteins, crops
Very small
From average to good
Low Low Modest Very limited
Modest to good
Solvents
Oils, Straws, Sugar, Proteins, crops
Small Low Very Low
Very low Very lowVery limited
Very poor
Surfactants Various Small Low Modest Low Low Very limited
Poor
Lubricants Oils Very small
Low Modest to high
Low Low good Modest to good
Polymers Starch and sugar
Very large
Very Low
Low Modest Very LowVery limited
Very limited
Fibers Lignocellulose, fats, crops
Modest Low Low Modest Low Good Modest to good
428
Co-products and By-products of Clarifier Muds Wax: Wax, oil, and resine make up the three fractions of the raw wax found in clarifier muds. Refined wax is used in shoe and floor waxes, cosmetics, dyes, emulsions for fruit, etc. Phytosterols: Oil from the clarifier muds is a product obtained from the refining of waxes and it represents a source of phytosterols. The mixture of phytosterols has a wide usage in the pharmaceutical industry to obtain hormones such as progesterone, pregnenolone, testosterone and their derivates. Hydrocarbon removers: In the event of an oil-spill with hydrocarbons such as petroleum, diesel or gasoline, bagasse and clarifier muds can be used as as soil bioremedy for they are able to texturize and absorb the spill. Clarifier muds not only work as rectifiers but they also gives microorganisms to the soil, biotransforming toxic materials. (García, 2011) Co-products and By-products of Vinasse Vinasse for fertirrigation: Vinasse is the residue left over by the alcohol industry. It is applied to the sugarcane fields mainly because it constitutes a source of potassium and other nutrients, besides providing carbohydrates that are easily assimilated and benefit microbial growth. Decomposition of the straw depends mainly on the activity of microorganisms, which are mainly responsible for the mineralization and recycling of nutrients to the soil. An increase in the production of CO2 can be considered as a result of the mineralization of straw, due to an increase in microbial activity. The addition of vinasse stimulates the production of CO2 and the activity of cellulose in the straw (Sanomiya, 2006). A more feasible and immediate alternative would be fertirrigation, where vinasse would be mixed in, with the residual liquids from the sugar mill during harvest season, and then it can be applied after no more than five days, of the retention time. Biogas: Vinasse is fundamental for the production of energy; it constitutes the raw material for the production of biogas. Among its main characteristics, it has low pH, high temperature, high biological oxygen demand (BOD), high chemical oxygen demand (QOD), and it also possess an important nutrient content. In order to take advantage of the potential of its physical-chemical characteristics, vinasse is subjected to an anaerobic digestion process through which methane gas is produced and captured. Then, in specially equipped chambers in the biodigestors, the methane gas is piped up towards the
429
industrial plant, where it is used as a fuel for the boilers that produce the steam necessary for the plant’s operation. Needless to say, it is a source of renewable energy or bioenergy. BIBLIOGRAPHY 1. Almazán, O.; González, Gálvez, L. 1998. The Sugar Cane, its byproducts
and coproducts. Asociación de Técnicos Azucareros de Cuba. 12 p. 2. Alriksson, B. et al. 2009. Cellulase production from spent lignocellulose
hydrolysates by recombinant aspergillus niger. 10 p. 3. Broderick, G. A.; Radlo, W. J. 2004. Effect of molasses supplementation on
the production of lactating dairy cows fed diets based on alfalfa and corn silage. 13 p.
4. Brossard, L. E.; Penedo, M. Pirolisis al vacío del bagazo de la caña de azúcar. 10 p.
5. Cabello, A. 2002. La producción de derivados de la caña de azúcar en Cuba,
situación actual y perspectiva. pp. 12 6. Craig, K.; Overend R. 1995. Biomass power systems, where are we, where
are we going, and how do we get there? 19 p. 7. Ferrer, J.; Davalillo, Y.; Chandler, C.; Páez, G.; Mármol, Z.; Ramones, E.
2004. Producción de proteína microbiana a partir de los desechos del procesamiento de la caña de azúcar (bagacillo). 59 p.
8. García, C.; Bueno, V. Estudio toxicológico de un producto derivado de la
caña de azúcar. 11 p. 9. García, R. 2011. Uso de cachaza y bagazo de caña de azúcar en la remoción
de hidrocarburos en suelo contaminado. 10. Godshall, M. A. Future directions for the sugar industry. 8 p. 11. Gravitis, J.; Suzuki, M. 1993. Biomass refinery a way to produce value
added products and base for agricultural zero emissions system. 14 p.
430
12. ICIDCA. 2000. Manual de los derivados de la caña de azúcar. MINAZ, La Habana, Cuba, tercera edición. 458 p.
13. Jeffries, T. W.; Schartman, R. Bioconversion of secondary fiber fines
ethanol using counter current enzymatic saccharification and cofermentation.
14. Kodera, K. 2007. Analysis of allocation methods of bioethanol LCA. 55 p. 15. Langeveld, J. W.; Dixon, A. J.; Jaworski, J. F. 2010. Development
perspectives of the biobased economy: A review. pp. 141-151. 16. Martínez, L.; Quintana, R.; Martirena, J. F. Aglomerante puzolánico
formado por cal y ceniza de paja de caña de azúcar: la influencia granulométrica de sus componentes en la actividad aglomerante. 15 p.
17. Médoc, J.; Guerrin, F.; Courdier, R. Paillat, J. A multi modelling approach
to help agricultural stakeholders design animal wastes management strategies in the reunion island. 6 p.
18. Meneses B. 2008. www.Sugarjournal.com. La Producción de Biogás con Vinaza una Alternativa Factible para Contribuir al Desarrollo de la Bioenergía. pp. 17-18.
19. Mohan, P. 2006. Liquid energy from cane in India. India. 6 p. 20. Murillo, F.; Araujo, C.; Bonfá, A.; Porto, W. 2011. Chemistry based on
renewable rawmaterials: Perspectives for a sugar cane based biorrefinery. 8 p.
21. Paturau, J. M. Usos Alternativos de la caña de azúcar y sus derivados en las
agroindustrias. 22 p. 22. Perdigón, S. M. La vinaza de jugos de caña energética y su aplicación en los
suelos cañeros. 11 p. 23. Pound, B.; Preston, T.R. 1981. Biogas production from mixtures of cattle
slurry and pressed sugar cane stalk, with and without urea. pp 11. 24. Sanomiya, L.; Assis, L.; De Oliveira, J. Nahas, E. Mineralización de la paja
de caña de azúcar en suelo adicionado con vinaza, subproducto de la industria del alcohol de caña de azúcar y fertilizante. 8 p.

431
25. Serna, L. S.; Rodríguez, A. 2007. Lactic acid fermentative production using waste from the harvest of green sugar cane as a substrate. 6 p.
26. Worathanakul, P.; Payubnop, W.; Muangpet, A. 2009. Characterization for
posttreatment effect of bagasse ash for silica extraction. 3 p.

432
433
XV. METEOROLOGY IN SUGARCANE

434
METEOROLOGY IN SUGARCANE
Otto Castro and Alfredo Suárez
INTRODUCTION A network of well-distributed meteorological stations in each altitudinal stratum is needed in order to assess meterorological effects that influence sugarcane production. They must measure data on: rainfall, global radiation or solar brightness, temperature, relative humidity, wind speed and its direction. Analysis of these variables facilitates the understanding climate positive or negative effects in sugarcane production at each altitudinal stratum and between years of production. This comprehension will help to develop management alternatives to minimize adverse climate effects.
Nowadays, the Guatemalan Sugar Agroindustry has an automatized meteorological information system which is an option that allows visualization of meteorological variables in real time and displays climatic information of several years and sites. Real time information contributes to manage with greater efficiency tasks where meteorological variables are important, like the application of chemical products or irrigation. Climatic information analysis allows the study of the effects on meteorological variables due to phenomena impact such as ENSO and/or climate change, moreover, the study of relations between meteorological variables in the balances behavior: energy and hydric.
METEOROLOGICAL INFORMATION SYSTEM Background In 1997, the Guatemalan Sugar Agroindustry (AIA for its acronym in Spanish) started the automatic meterorological stations network. Its main purpose was to have real time meteorological information that would help in the decision-making process for sugarcane management, mainly in the crop burning subject.
Otto Castro is Agr. Eng., M.Sc. Specialist in Irrigation and Agrometeorology at CENGICAÑA www.cengicana.org and Alfredo Suárez is Agr. Eng., M.Sc. Climate and Hydrology Research Programme Coordinator at ICC. www.icc.org.gt
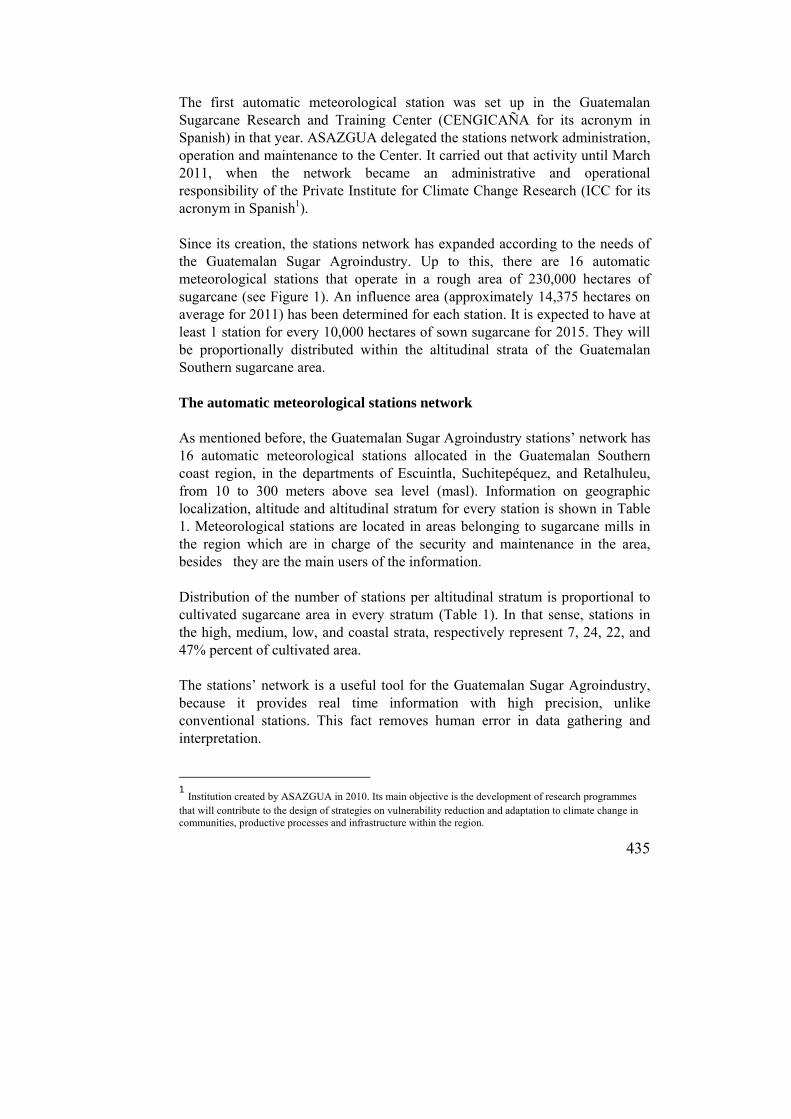
435
The first automatic meteorological station was set up in the Guatemalan Sugarcane Research and Training Center (CENGICAÑA for its acronym in Spanish) in that year. ASAZGUA delegated the stations network administration, operation and maintenance to the Center. It carried out that activity until March 2011, when the network became an administrative and operational responsibility of the Private Institute for Climate Change Research (ICC for its acronym in Spanish1).
Since its creation, the stations network has expanded according to the needs of the Guatemalan Sugar Agroindustry. Up to this, there are 16 automatic meteorological stations that operate in a rough area of 230,000 hectares of sugarcane (see Figure 1). An influence area (approximately 14,375 hectares on average for 2011) has been determined for each station. It is expected to have at least 1 station for every 10,000 hectares of sown sugarcane for 2015. They will be proportionally distributed within the altitudinal strata of the Guatemalan Southern sugarcane area. The automatic meteorological stations network
As mentioned before, the Guatemalan Sugar Agroindustry stations’ network has 16 automatic meteorological stations allocated in the Guatemalan Southern coast region, in the departments of Escuintla, Suchitepéquez, and Retalhuleu, from 10 to 300 meters above sea level (masl). Information on geographic localization, altitude and altitudinal stratum for every station is shown in Table 1. Meteorological stations are located in areas belonging to sugarcane mills in the region which are in charge of the security and maintenance in the area, besides they are the main users of the information. Distribution of the number of stations per altitudinal stratum is proportional to cultivated sugarcane area in every stratum (Table 1). In that sense, stations in the high, medium, low, and coastal strata, respectively represent 7, 24, 22, and 47% percent of cultivated area.
The stations’ network is a useful tool for the Guatemalan Sugar Agroindustry, because it provides real time information with high precision, unlike conventional stations. This fact removes human error in data gathering and interpretation.
1 Institution created by ASAZGUA in 2010. Its main objective is the development of research programmes that will contribute to the design of strategies on vulnerability reduction and adaptation to climate change in communities, productive processes and infrastructure within the region.
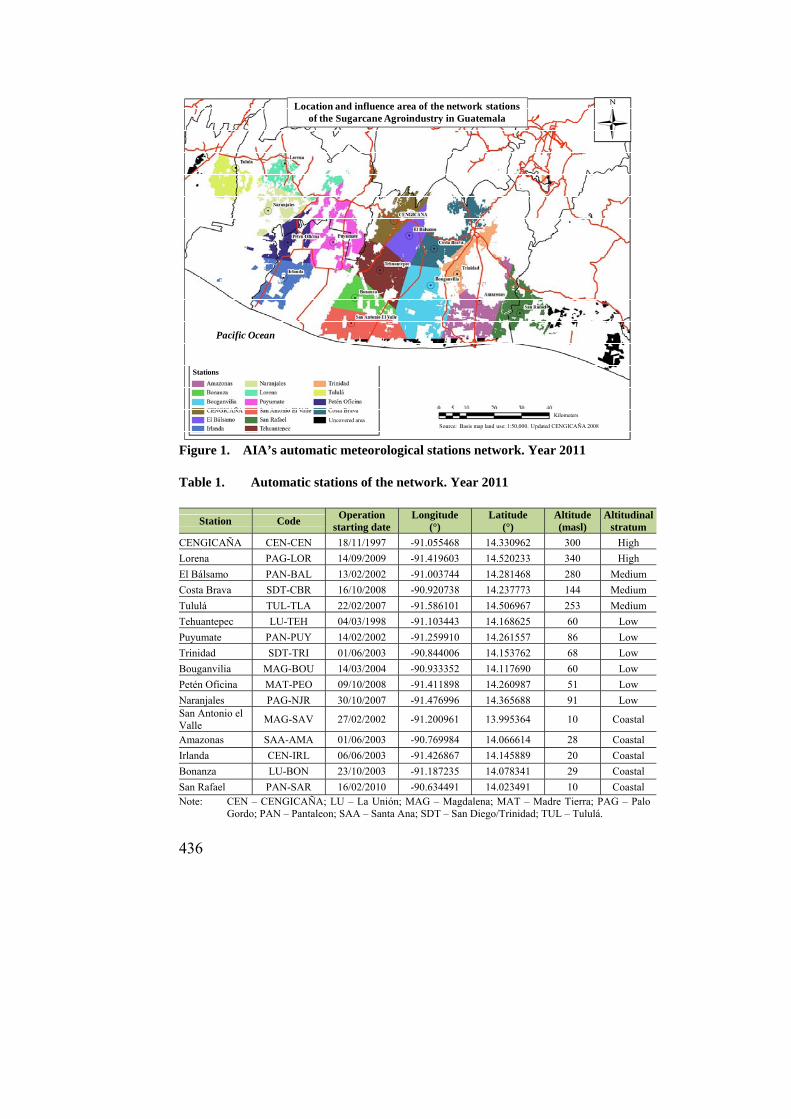
436
Figure 1. AIA’s automatic meteorological stations network. Year 2011
Table 1. Automatic stations of the network. Year 2011
Station Code Operation
starting date Longitude
(°) Latitude
(°) Altitude (masl)
Altitudinal stratum
CENGICAÑA CEN-CEN 18/11/1997 -91.055468 14.330962 300 High
Lorena PAG-LOR 14/09/2009 -91.419603 14.520233 340 High
El Bálsamo PAN-BAL 13/02/2002 -91.003744 14.281468 280 Medium
Costa Brava SDT-CBR 16/10/2008 -90.920738 14.237773 144 Medium
Tululá TUL-TLA 22/02/2007 -91.586101 14.506967 253 Medium
Tehuantepec LU-TEH 04/03/1998 -91.103443 14.168625 60 Low
Puyumate PAN-PUY 14/02/2002 -91.259910 14.261557 86 Low
Trinidad SDT-TRI 01/06/2003 -90.844006 14.153762 68 Low
Bouganvilia MAG-BOU 14/03/2004 -90.933352 14.117690 60 Low
Petén Oficina MAT-PEO 09/10/2008 -91.411898 14.260987 51 Low
Naranjales PAG-NJR 30/10/2007 -91.476996 14.365688 91 Low San Antonio el Valle
MAG-SAV 27/02/2002 -91.200961 13.995364 10 Coastal
Amazonas SAA-AMA 01/06/2003 -90.769984 14.066614 28 Coastal
Irlanda CEN-IRL 06/06/2003 -91.426867 14.145889 20 Coastal
Bonanza LU-BON 23/10/2003 -91.187235 14.078341 29 Coastal
San Rafael PAN-SAR 16/02/2010 -90.634491 14.023491 10 Coastal Note: CEN – CENGICAÑA; LU – La Unión; MAG – Magdalena; MAT – Madre Tierra; PAG – Palo
Gordo; PAN – Pantaleon; SAA – Santa Ana; SDT – San Diego/Trinidad; TUL – Tululá.
Location and influence area of the network stationsof the Sugarcane Agroindustry in Guatemala
Pacific Ocean
Stations
Source: Basis map land use: 1:50,000. Updated CENGICAÑA 2008
KilometersUncovered area
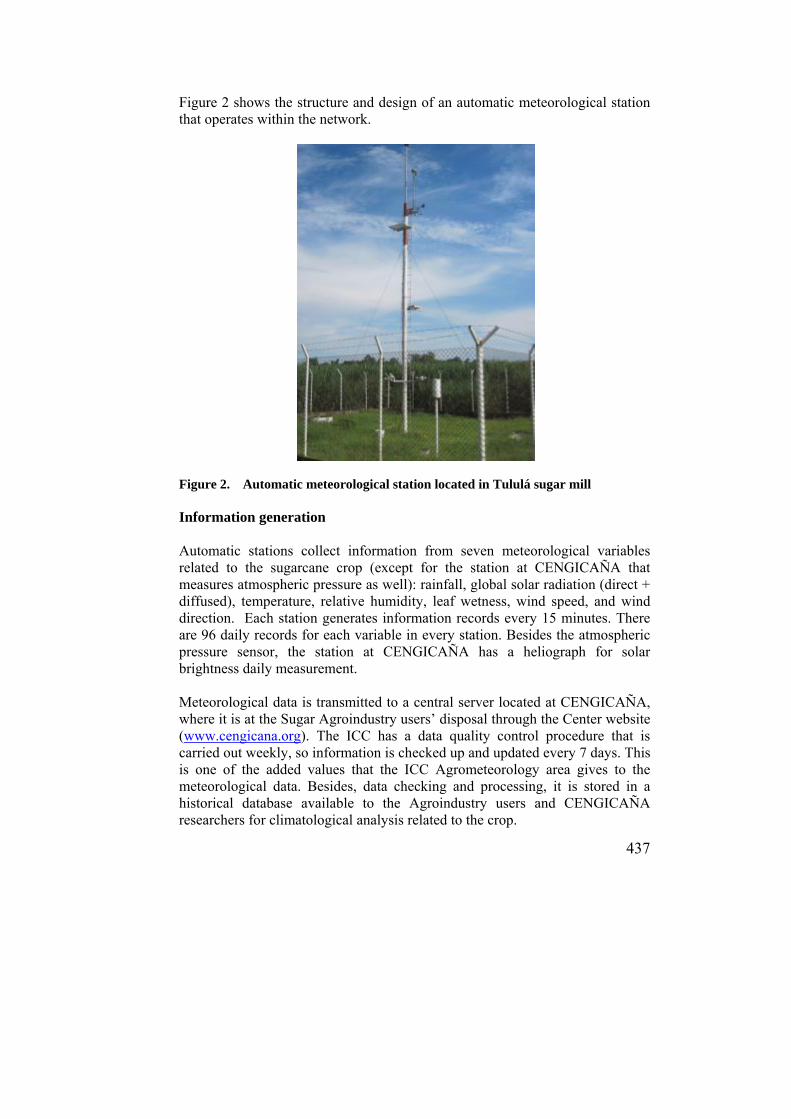
437
Figure 2 shows the structure and design of an automatic meteorological station that operates within the network.
Figure 2. Automatic meteorological station located in Tululá sugar mill Information generation
Automatic stations collect information from seven meteorological variables related to the sugarcane crop (except for the station at CENGICAÑA that measures atmospheric pressure as well): rainfall, global solar radiation (direct + diffused), temperature, relative humidity, leaf wetness, wind speed, and wind direction. Each station generates information records every 15 minutes. There are 96 daily records for each variable in every station. Besides the atmospheric pressure sensor, the station at CENGICAÑA has a heliograph for solar brightness daily measurement. Meteorological data is transmitted to a central server located at CENGICAÑA, where it is at the Sugar Agroindustry users’ disposal through the Center website (www.cengicana.org). The ICC has a data quality control procedure that is carried out weekly, so information is checked up and updated every 7 days. This is one of the added values that the ICC Agrometeorology area gives to the meteorological data. Besides, data checking and processing, it is stored in a historical database available to the Agroindustry users and CENGICAÑA researchers for climatological analysis related to the crop.
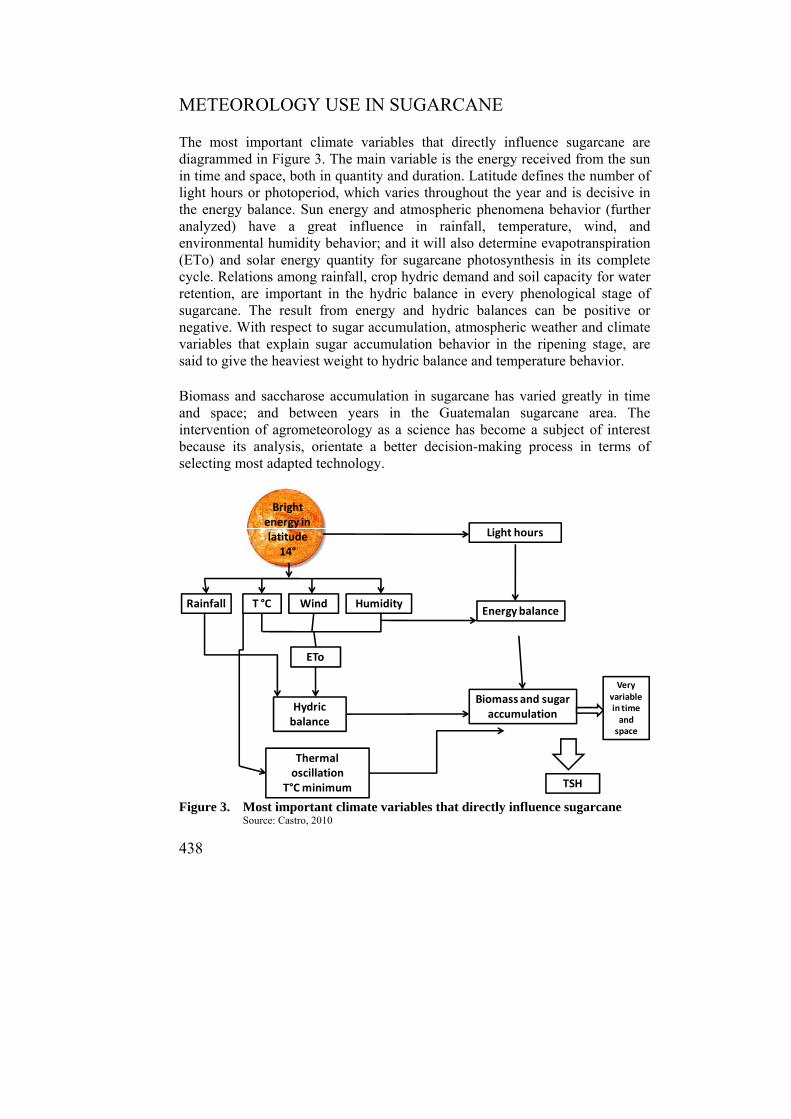
438
METEOROLOGY USE IN SUGARCANE
The most important climate variables that directly influence sugarcane are diagrammed in Figure 3. The main variable is the energy received from the sun in time and space, both in quantity and duration. Latitude defines the number of light hours or photoperiod, which varies throughout the year and is decisive in the energy balance. Sun energy and atmospheric phenomena behavior (further analyzed) have a great influence in rainfall, temperature, wind, and environmental humidity behavior; and it will also determine evapotranspiration (ETo) and solar energy quantity for sugarcane photosynthesis in its complete cycle. Relations among rainfall, crop hydric demand and soil capacity for water retention, are important in the hydric balance in every phenological stage of sugarcane. The result from energy and hydric balances can be positive or negative. With respect to sugar accumulation, atmospheric weather and climate variables that explain sugar accumulation behavior in the ripening stage, are said to give the heaviest weight to hydric balance and temperature behavior. Biomass and saccharose accumulation in sugarcane has varied greatly in time and space; and between years in the Guatemalan sugarcane area. The intervention of agrometeorology as a science has become a subject of interest because its analysis, orientate a better decision-making process in terms of selecting most adapted technology.
Figure 3. Most important climate variables that directly influence sugarcane
Source: Castro, 2010
Rainfall T °C Wind Humidity
ETo
Hydricbalance
Energy balance
Biomass and sugaraccumulation
Light hours
Thermaloscillation
T°C minimum
Brightenergy in latitude14°
TSH
Veryvariable in time and space

439
Solar energy balance
The solar energy that is received in a georeferentiated spot in the planet is constant every year, but different in other locations. This is due to the Earth rotation axis placed at 23° 27’, in relation with the movement axis and the sun apparent movement, which define different energy quantity and duration in eachlatitude. Solar radiation to the atmosphere limit at latitude 14°: Solar radiation behavior in latitude 14° during the year is defined and constant across the years. In that sense, from April 18th to August 20th, between 38.16 and 37.86 MJ/m2/energy day, are respectively received to the atmosphere limit. It corresponds to the maximum energy period (FAO, 2008). In December this energy is reduced 24 percent. Maximum energy duration is recorded June 21st of every year, with 12.84227 hours. In December, there is a reduction of 1 hour 39 minutes and 57.89 seconds. Solar radiation in terrestrial surface at latitude 14°: In clear sky days where n=N, in which n is the real duration of insolation or solar brightness, and N possible maximum duration of insolation; solar radiation could reach maximum energy quantities between April 18th and August 20th. According to a FAO model, they are equivalent to about 28.85 MJ/m2/day, mainly in places close to sea level, i.e. 75.6 percent of received energy to the atmosphere limit. In the history of global radiation records with the pyranometer SP-lite, the maximum reached record has been 27.39 MJ/m2/day in the meteorological station located in finca Irlanda from the coastal stratum, on October 2nd 2009. It was equivalent to 78 percent of the total. Maximum potential radiation in latitude 14° that could be recorded in places near to sea level would be between 72-78 percent of the received total to the atmosphere limit. In the conditions of the Guatemalan sugarcane area, energy quantities that reach terrestrial surface, fluctuate every year. Figure 4 presents different scenarios of solar radiation, solar energy quantity that reaches the atmosphere limit in latitude 14° (Ra), solar energy quantity if n=N (Rdd), and solar energy quantity that reaches terrestrial surface measured with a pyranometer (Rg), recorded for the last four years. Fluctuation of solar energy recorded as global radiation (direct solar radiation or short wave radiation + diffused radiation) is mainly due to cloud incidence. Maximum energy quantity to the atmosphere limit is received from April 18th to August 20th.
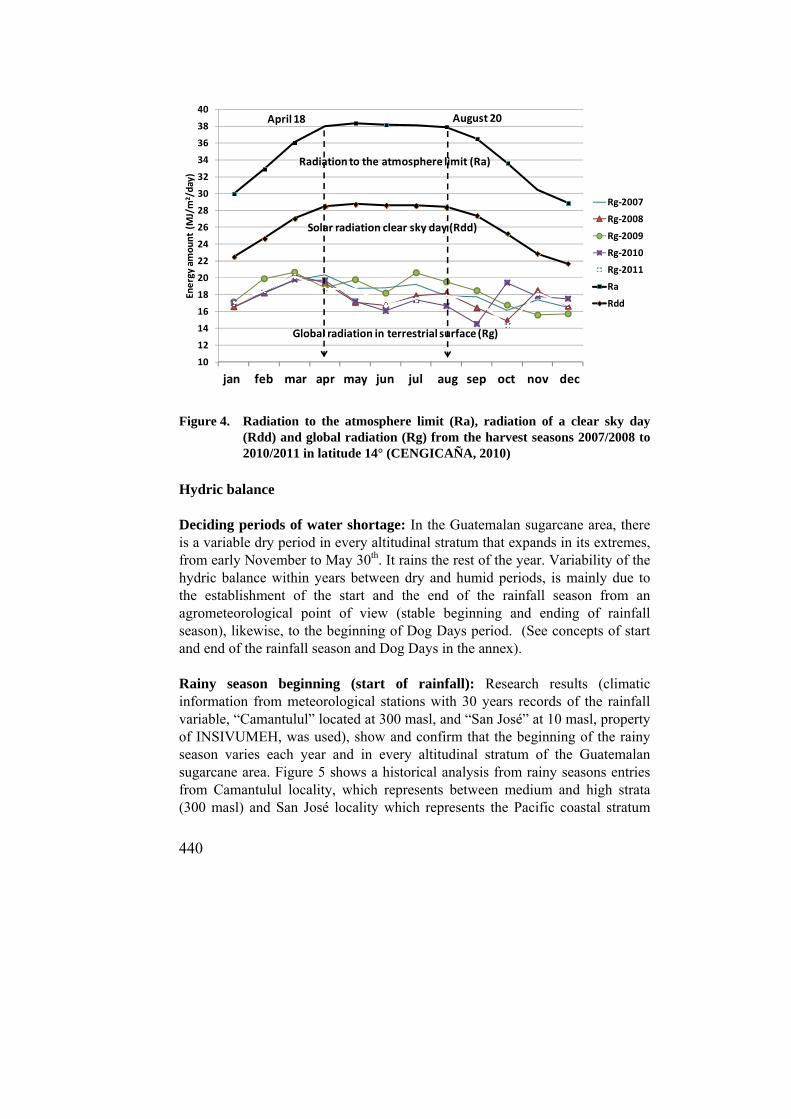
440
Figure 4. Radiation to the atmosphere limit (Ra), radiation of a clear sky day
(Rdd) and global radiation (Rg) from the harvest seasons 2007/2008 to 2010/2011 in latitude 14° (CENGICAÑA, 2010)
Hydric balance
Deciding periods of water shortage: In the Guatemalan sugarcane area, there is a variable dry period in every altitudinal stratum that expands in its extremes, from early November to May 30th. It rains the rest of the year. Variability of the hydric balance within years between dry and humid periods, is mainly due to the establishment of the start and the end of the rainfall season from an agrometeorological point of view (stable beginning and ending of rainfall season), likewise, to the beginning of Dog Days period. (See concepts of start and end of the rainfall season and Dog Days in the annex). Rainy season beginning (start of rainfall): Research results (climatic information from meteorological stations with 30 years records of the rainfall variable, “Camantulul” located at 300 masl, and “San José” at 10 masl, property of INSIVUMEH, was used), show and confirm that the beginning of the rainy season varies each year and in every altitudinal stratum of the Guatemalan sugarcane area. Figure 5 shows a historical analysis from rainy seasons entries from Camantulul locality, which represents between medium and high strata (300 masl) and San José locality which represents the Pacific coastal stratum
10
12
14
16
18
20
22
24
26
28
30
32
34
36
38
40
ene feb mar abr may jun jul ago sep oct nov dic
Energy am
ount (M
J/m
2/day)
Rg‐2007
Rg‐2008
Rg‐2009
Rg‐2010
Rg‐2011
Ra
Rdd
Radiation to the atmosphere limit (Ra)
Solar radiation clear sky day (Rdd)
Global radiation in terrestrial surface (Rg)
August 20April 18
jan feb mar apr may jun jul aug sep oct nov dec

441
(10 masl). In Camantulul, rainy season starts on April 22nd on average and in San José, it starts on May 10th. Historically, in Camantulul, there is a 71 day variation (between March 15th and May 25th) and in the Pacific coast, a 45 day variation (between April 20th and June 5th). The latest beginning of the rainy season was in 1997 and 1998, when El Niño phenomenon was the strongest of all times.
Figure 5. Historical analysis of rainfall beginning in two altitudinal strata of the
Guatemalan sugarcane area Dog Days period (reduction of rainfaill between July and August): Just like the rainy season beginning, Dog Days period varies every year and in every altitudinal stratum of the Guatemalan sugarcane area. Its duration fluctuates too. In the high stratum, the decrease of rainy days in July and August (according to records in the meteorological station Camantulul since 1980 to this date) has not lasted above 10 days, which means that there are no significant effects on productivity from the point of view of irrigation. The contrary occurs in the coastal stratum of the Pacific (0 – 40 masl) where effects are greater, mainly in soils with sandy predominance and with no capillary input. Table 2 presents rainfall decrease in July and August, due to Dog Days season in the Guatemalan Pacific coast. 1982 and 1989 are considered as dry years for a long period of time; 1988 had a short Dog Days season; and in 1997, Dog Days season entered later (from August 20th-30th).
MAY 25
MARCH 31
71 days
X = 112 daysAPRIL 22
_
JUNE 05
APRIL20
45 days
X = 133 daysMAY 10
_
JULIAN
DAYS
145
1998 20081980
maximum
minimum
1980 1995 2009
maximum
minimum
Rainyseason beginning ‐CAMANTULUL, 300 masl
Rainyseason beginning‐SAN JOSÉ, 10 masl
90
110
155
SOURCE OF INFORMATION: INSIVUMEH

442
Table 2. Dog Days behavior in the Guatemalan Pacific coast, according to measured rainfall records in the meteorological station San José, property of INSIVUMEH
Source: INSIVUMEH
Rainy season ending (end of the rainfall season): Figure 6 shows that, on average, rainy season ending in Camantulul is November 25th, and in San José, November 7th. Differences between these two strata are in annual variabilities. Historically, there is a 61 day variation in Camantulul (between October 25th and December 25th) and in the Pacific coast, a 56 day variation (between October 10th and November 25th). 1981 was the year with the latest rainy season ending for Camantulul, and 1997 was for San José. On the other hand, 1983 was the year with the earliest rainy season ending for Camantulul, and 1980 was for San José.
Figure 6. Historical analysis of the rainy season ending in two altitudinal strata
of the Guatemalan sugarcane area
YEAR
JULY AUGUST#
5 dayperiod
withrainfall
less than25 mm
Continued5 dayperiod
05 10 15 20 25 30 05 10 15 20 25 30
5 dayperiod accumulated rainfall inmm
1982 1 11 12.5 4.3 34.5 14.1 32.2 0 12 4.5 0 37 9 4
1988 87.8 15.7 39.7 24.8 6.3 2.4 55 64.2 257.9 17.7 91.7 130.4 4 2
1989 10.2 8.9 1.9 18.2 11.3 319.4 8.3 12.5 85.2 8.5 21.8 70.5 9 5
1997 168.2 0 3 26.6 35.2 52.8 13 37.5 61.6 13.7 0 11 6 3
Rainyseason ending ‐CAMANTULUL, 300 masl
Rainyseason ending‐SAN JOSÉ, 10 masl
198
1
198
3
2008
61 days
DECEMBER 25
OCTOBER 25
NOVEMBER 25
OCTOBER 10
198
0
1980
1997
2008
359
298
283
339
56 days
X = 329 daysNOVEMBER 25
X = 311 daysNOVEMBER 07
JULIAN
DAYS
INFORMATION SOURCE: INSIVUMEH

443
Meteorological variables in the sugar accumulation during the ripening stage In the last 45 days of the sugarcane cycle (ripening stage), greater saccharose quantity increases. The saccharose producing capacity mainly depends on the variety, management, and climatic conditions that influence in this stage, such as: temperature, solar brightness, atmospheric rainfall, and wind. Temperature behavior in the Guatemalan sugarcane area varies during every month of the year2, and between years as well. Thermal amplitude (difference in degrees Centigrades between highest and lowest temperature) and lowest temperature are among the most important effects of temperature in sugar accumulation. Figure 7 shows a graphical analysis of the overall relation between thermal amplitude and sugar productivity for harvesting period. During the periods from 1999/2000 to 2005/2006, sugar productivity and thermal amplitudes were high, unlike the period from 2006/2007 to 2010/2011, where sugar productivities and thermal amplitudes were lower.
Figure 7. Historical overall relation between sugar productivity and thermal
amplitude behavior. Guatemalan sugarcane area
2 TEMPERATURE VARIATIONS: Received solar energy quantity, in any region of the planet, varies with
the day hour, the season of the year and the latitude. These differences in radiation, originate temperature variations. On the other hand, temperature can vary due to distribution of different surfaces types and according to altitude.
192 186
197
207
194
184
192
190
196
207 202
205 200
199
205
203
202
231 226
226
226
226
229 225 2
19 212
220
208
214
82/8383/8484/8585/8686/8787/8888/8989/9090/9191/9292/9393/9494/9595/9696/9797/9898/9999/0000/0101/0202/0303/0404/0505/0606/0707/0808/0909/1010/11
lbs azúcar/TC AT Lineal (lbs azúcar/TC)
General relation between sugar productivity and thermal amplitude
Harvesting periods
17.7
17.5
16.5
16.5
15.4
15.2
15.1
15.0
13.0
15.6
14.9Average= 16.5
Average= 14.6
Thermalamplitude
Thermalamplitude
14.0
Pounds of sugar/CT Lineal (poundsof sugar/CTTA

444
When overall behavior of sugar yield and thermal amplitude during the harvesting period are analyzed, months with higher thermal amplitude (from December to March) presented sugar yields greater than 215 pounds of sugar/TS. November, April and May have historically been months with lowest yields: this is related to thermal amplitudes lower than 15°C, as observed in Figure 8.
Figure 8. Historical overall relation between sugar productivity and thermal amplitude behavior for every month of the harvesting period. Guatemalan sugarcane area. CENGICAÑA, 2009
With historical information on sugar yield at a plot level close to the meteorological station Belén (La Unión – Los Tarros), the association degree between temperature (accumulated minimal average temperature of 30 and 45 days before harvest) and commercial sugar yield, was determined to be -0.74 and -0.73 through a Pearson correlation. Regression coefficient indicates that for each degree the minimal temperature rises, sugar yield decreases 10.541 pounds per sugarcane tonne (Figure 9). It was confirmed that minimum temperatures below 18 ° C (average 30 days before harvest) provide better sugar accumulation in a natural way. Added to thermal amplitude behavior, rainfalls above 20 mm (accumulated 30 days before harvest) were analyzed to reduce sugar yield.
192 18
6197
207
194
184
192
190
196
207 202
205 200199
205
203
202
231 226226226226
229 225 21
9 212
220
208
214
82/83
83/84
84/85
85/86
86/87
87/88
88/89
89/90
90/91
91/92
92/93
93/94
94/95
95/96
96/97
97/98
98/99
99/00
00/01
01/02
02/03
03/04
04/05
05/06
06/07
07/08
08/09
09/10
10/11
lbs azúcar/TC AT Lineal (lbs azúcar/TC)
General relation between sugar productivity and thermal amplitude
Harvesting periods
17.7
17.5
16.5
16.5
15.4
15.2
15.1
15.0
13.0
15.6
14.9Average= 16.5
Average= 14.6
Thermalamplitude
Thermalamplitude
14.0
Pounds of sugar/CT Lineal (poundsof sugar/CTTA
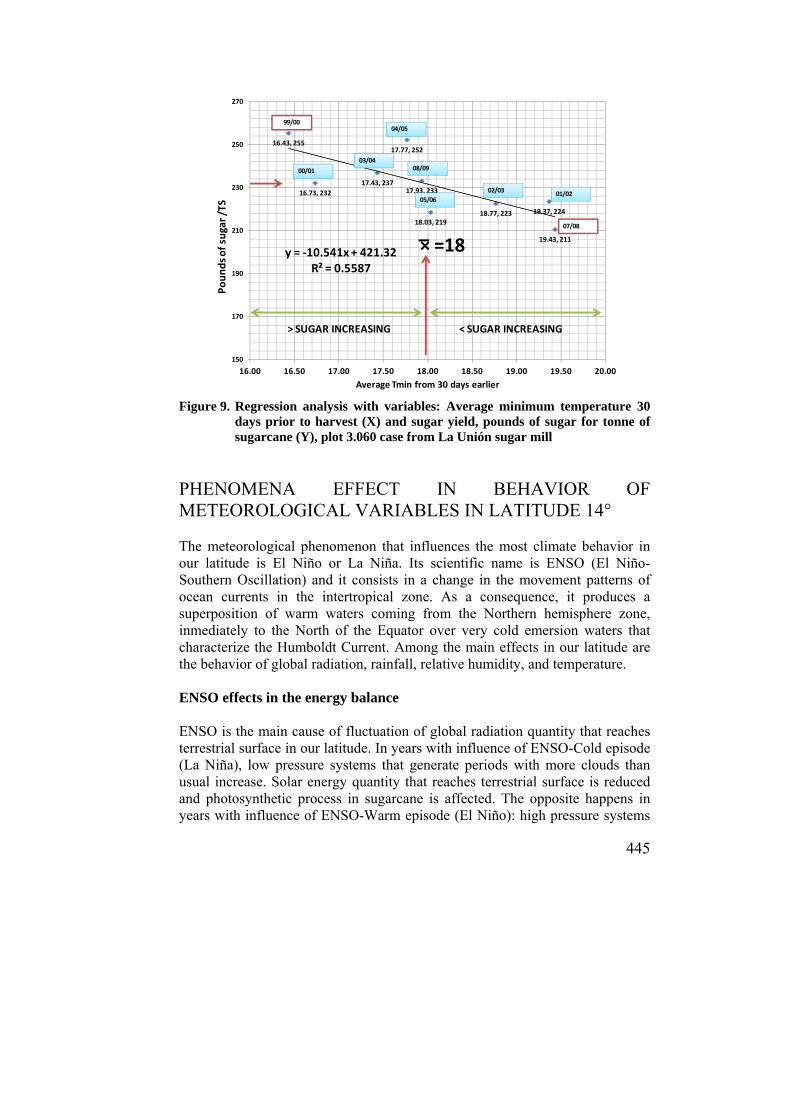
445
Figure 9. Regression analysis with variables: Average minimum temperature 30
days prior to harvest (X) and sugar yield, pounds of sugar for tonne of sugarcane (Y), plot 3.060 case from La Unión sugar mill
PHENOMENA EFFECT IN BEHAVIOR OF METEOROLOGICAL VARIABLES IN LATITUDE 14° The meteorological phenomenon that influences the most climate behavior in our latitude is El Niño or La Niña. Its scientific name is ENSO (El Niño-Southern Oscillation) and it consists in a change in the movement patterns of ocean currents in the intertropical zone. As a consequence, it produces a superposition of warm waters coming from the Northern hemisphere zone, inmediately to the North of the Equator over very cold emersion waters that characterize the Humboldt Current. Among the main effects in our latitude are the behavior of global radiation, rainfall, relative humidity, and temperature.
ENSO effects in the energy balance ENSO is the main cause of fluctuation of global radiation quantity that reaches terrestrial surface in our latitude. In years with influence of ENSO-Cold episode (La Niña), low pressure systems that generate periods with more clouds than usual increase. Solar energy quantity that reaches terrestrial surface is reduced and photosynthetic process in sugarcane is affected. The opposite happens in years with influence of ENSO-Warm episode (El Niño): high pressure systems
16.43, 255
16.73, 232
19.37, 22418.77, 223
17.43, 237
17.77, 252
18.03, 219
19.43, 211
17.93, 233
y = ‐10.541x + 421.32R² = 0.5587
150
170
190
210
230
250
270
16.00 16.50 17.00 17.50 18.00 18.50 19.00 19.50 20.00
Pounds of sugar /TS
Average Tmin from 30 days earlier
99/00
× =18
00/01
03/04
04/05
08/09
05/06
02/0301/02
07/08
> SUGAR INCREASING < SUGAR INCREASING
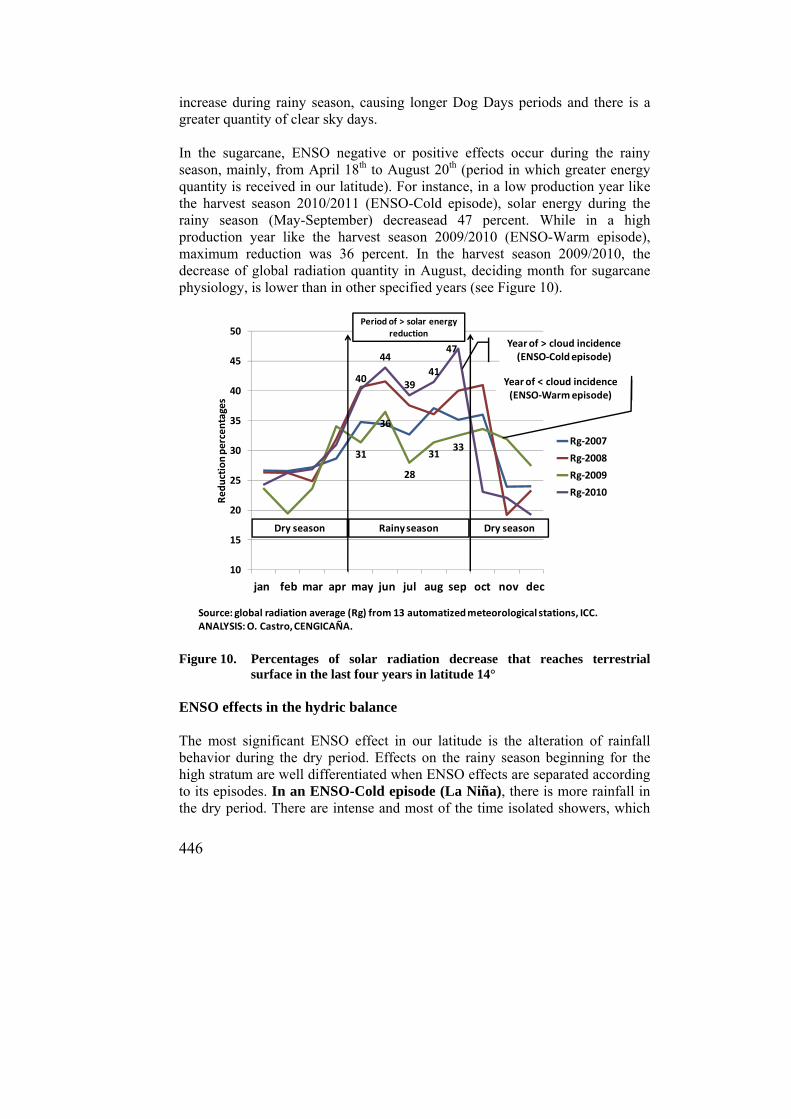
446
increase during rainy season, causing longer Dog Days periods and there is a greater quantity of clear sky days. In the sugarcane, ENSO negative or positive effects occur during the rainy season, mainly, from April 18th to August 20th (period in which greater energy quantity is received in our latitude). For instance, in a low production year like the harvest season 2010/2011 (ENSO-Cold episode), solar energy during the rainy season (May-September) decreasead 47 percent. While in a high production year like the harvest season 2009/2010 (ENSO-Warm episode), maximum reduction was 36 percent. In the harvest season 2009/2010, the decrease of global radiation quantity in August, deciding month for sugarcane physiology, is lower than in other specified years (see Figure 10).
Figure 10. Percentages of solar radiation decrease that reaches terrestrial
surface in the last four years in latitude 14° ENSO effects in the hydric balance The most significant ENSO effect in our latitude is the alteration of rainfall behavior during the dry period. Effects on the rainy season beginning for the high stratum are well differentiated when ENSO effects are separated according to its episodes. In an ENSO-Cold episode (La Niña), there is more rainfall in the dry period. There are intense and most of the time isolated showers, which
31
36
28
3133
40
44
3941
47
10
15
20
25
30
35
40
45
50
ene feb mar abr may jun jul ago sep oct nov dic
Reduction percentages
Rg‐2007
Rg‐2008
Rg‐2009
Rg‐2010
Source: global radiation average (Rg) from 13 automatizedmeteorological stations, ICC. ANALYSIS: O. Castro, CENGICAÑA.
Period of > solar energyreduction
RainyseasonDry season Dry season
Yearof > cloud incidence(ENSO‐Coldepisode)
Yearof < cloud incidence(ENSO‐Warmepisode)
jan feb mar apr may jun jul aug sep oct nov dec

447
from an agrometeorological point of view represent an early rainy season beginning. This period is characterized by many cloudy days. Rainy season beginning can be established between Julian Day 90 (March 31st) and Julian Day 130 (May 10th). In an ENSO-Warm episode (El Niño), there are more droughts, mainly when ONI (Oceanic Niño Index) indexes are high. Rainy season starts later and there are fewer clouds. When ONI indexes records are greater than 1.8 (Niño with a high qualification), rainy season can begin until Julian Day 145 (May 25th) just the way it happened in 1998, a year with no intense isolated showers during the dry period in this stratum. Effects of the rainy season beginning in the coastal stratum (the other extreme) differ in relation with the high stratum and ENSO, according to its episodes. In this stratum, ENSO-Cold episode (La Niña) and ENSO-Warm episode (El Niño) effects are similar with records of ONI indexes between -1.5 and +1.5. The difference in effects is that in an ENSO-Warm episode year, the beginning of the rainy season is later when ONI index is greater than 1.5 (Niño with a high qualification). In this case, rainy season beginning can happen even during the first days of June. This happened in 1983, 1992, 1998, and 2009. ENSO effects in sugarcane production (TSH)
ENSO in the sugarcane productive history: When productive history of the Guatemalan sugarcane area is analyzed (see Figure 11), during ENSO-Warm episodes years, there have been higher productivities. This mainly occured since the 2000 decade when even 103 tonnes of sugarcane per hectare have been reached, just like in the harvest season 2009/2010. The slope indicates that every year this episode has occured; there is an increase of 1.17 TSH. While in ENSO-Cold episodes years, 91TSH has been the maximum and it was reached in 2008 (year with an ENSO-Cold episode qualified as weak). The slope indicates that every year this episode has occurred; there is an increase of 0.82 TSH, 0.35 TSH less if compared with the ENSO-Warm episode. Positive trends in the three ENSO scenarios reflects that technological development reached in the 2000 decade has been important to minimize negative effects of ENSO. In the last years, there have been well differentiated contrasts: 2009 (ENSO-Warm episodes, strong) with a harvest season record of 103 TSH and 2010 (ENSO-Cold episodes, strong) with a production of 89 TSH. There was a reduction of 14 percent compared to the one obtained in the harvest season 2009/10. Global radiation quantity received in August is decisive in flowering behavior. In warm episodes, average global radiation is greater than 20 MJ/m2/day (greater than 55 percent of solar brightness), while in cold episodes it is lower than 18 MJ/m2/day (lower than 50 percent of solar brightness).
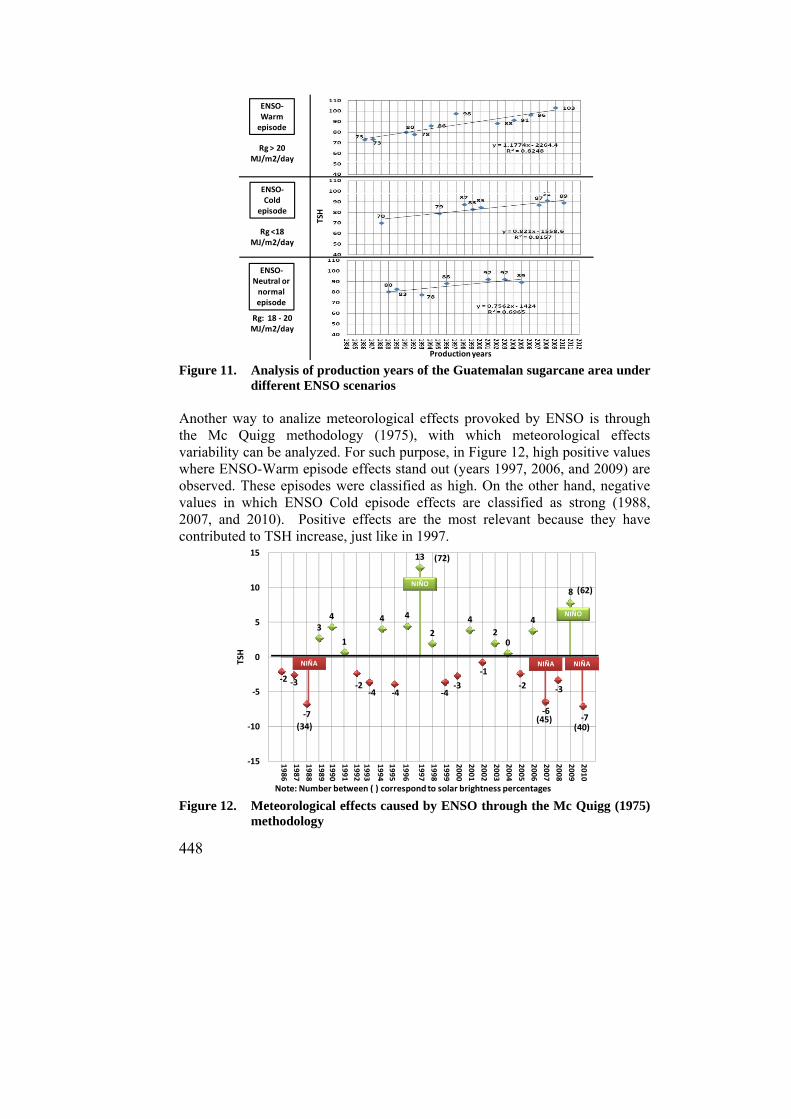
448
Figure 11. Analysis of production years of the Guatemalan sugarcane area under
different ENSO scenarios Another way to analize meteorological effects provoked by ENSO is through the Mc Quigg methodology (1975), with which meteorological effects variability can be analyzed. For such purpose, in Figure 12, high positive values where ENSO-Warm episode effects stand out (years 1997, 2006, and 2009) are observed. These episodes were classified as high. On the other hand, negative values in which ENSO Cold episode effects are classified as strong (1988, 2007, and 2010). Positive effects are the most relevant because they have contributed to TSH increase, just like in 1997.
Figure 12. Meteorological effects caused by ENSO through the Mc Quigg (1975) methodology
ENSO‐Warmepisode
ENSO‐Cold
episode
ENSO‐Neutral ornormal episode
TSH
Rg > 20 MJ/m2/day
Rg<18 MJ/m2/day
Rg: 18 ‐ 20 MJ/m2/day
Productionyears
‐2 ‐3
‐7
34
1
‐2‐4
4
‐4
4
13
2
‐4‐3
4
‐1
20
‐2
4
‐6
‐3
8
‐7
‐15
‐10
‐5
0
5
10
15
TSH
1986
1987
1988
1989
1990
1991
1992
1993
1994
1995
1996
1997
1998
1999
2000
2001
2002
2003
2004
2005
2006
2007
2008
2009
2010
NIÑA NIÑA NIÑA
NIÑO
NIÑO
(72)
(62)
(34)(45)
(40)
Note: Number between ( ) correspond to solar brightness percentages
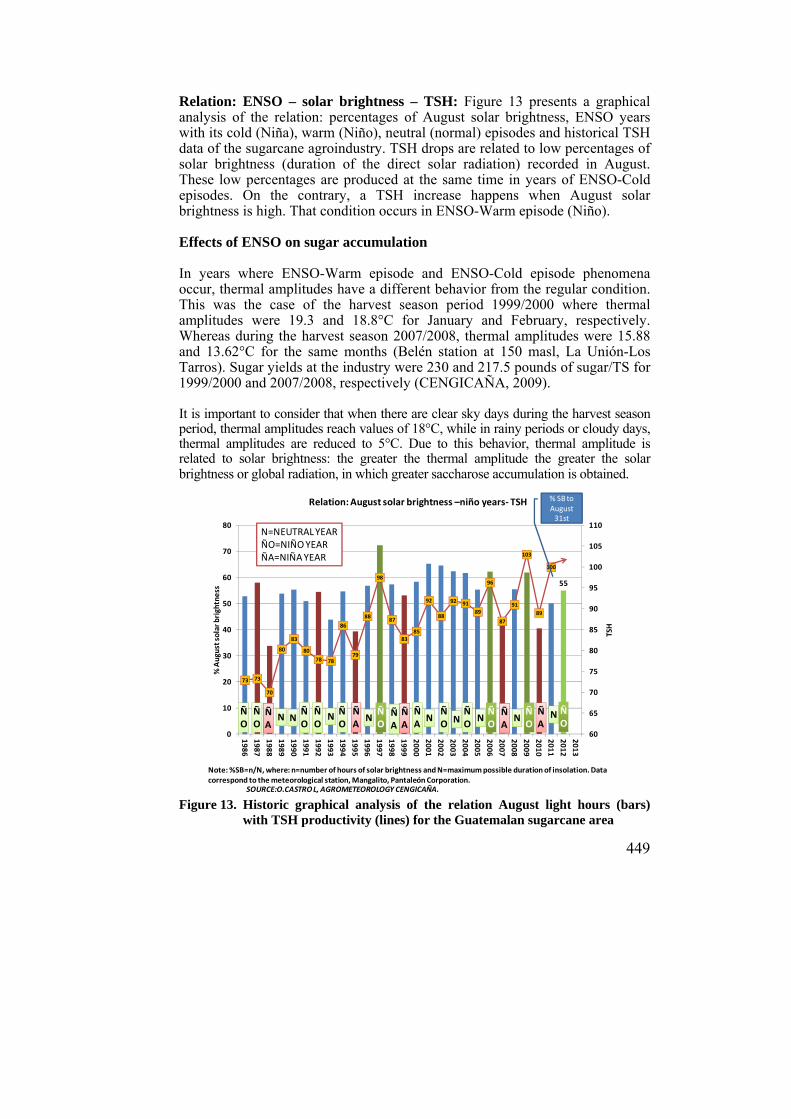
449
Relation: ENSO – solar brightness – TSH: Figure 13 presents a graphical analysis of the relation: percentages of August solar brightness, ENSO years with its cold (Niña), warm (Niño), neutral (normal) episodes and historical TSH data of the sugarcane agroindustry. TSH drops are related to low percentages of solar brightness (duration of the direct solar radiation) recorded in August. These low percentages are produced at the same time in years of ENSO-Cold episodes. On the contrary, a TSH increase happens when August solar brightness is high. That condition occurs in ENSO-Warm episode (Niño). Effects of ENSO on sugar accumulation In years where ENSO-Warm episode and ENSO-Cold episode phenomena occur, thermal amplitudes have a different behavior from the regular condition. This was the case of the harvest season period 1999/2000 where thermal amplitudes were 19.3 and 18.8°C for January and February, respectively. Whereas during the harvest season 2007/2008, thermal amplitudes were 15.88 and 13.62°C for the same months (Belén station at 150 masl, La Unión-Los Tarros). Sugar yields at the industry were 230 and 217.5 pounds of sugar/TS for 1999/2000 and 2007/2008, respectively (CENGICAÑA, 2009). It is important to consider that when there are clear sky days during the harvest season period, thermal amplitudes reach values of 18°C, while in rainy periods or cloudy days, thermal amplitudes are reduced to 5°C. Due to this behavior, thermal amplitude is related to solar brightness: the greater the thermal amplitude the greater the solar brightness or global radiation, in which greater saccharose accumulation is obtained.
Figure 13. Historic graphical analysis of the relation August light hours (bars)
with TSH productivity (lines) for the Guatemalan sugarcane area
55
73 73
70
80
83
80
78 78
86
79
88
98
87
8385
92
88
92 91
89
96
87
91
103
89
100
60
65
70
75
80
85
90
95
100
105
110
0
10
20
30
40
50
60
70
80
1986
1987
1988
1989
1990
1991
1992
1993
1994
1995
1996
1997
1998
1999
2000
2001
2002
2003
2004
2005
2006
2007
2008
2009
2010
2011
2012
2013
TSH
% Augustsolar brightness
ÑO
ÑO
ÑO
ÑO
ÑO
ÑO
ÑO
ÑO
ÑO
ÑO
ÑA
ÑA
ÑA
ÑA
ÑA
N NNNNÑA
ÑA
NNNNÑO
Relation: August solar brightness –niño years‐ TSH
Note: %SB=n/N, where: n=number of hours of solar brightness and N=maximumpossible durationof insolation. Data correspond to the meteorological station, Mangalito, Pantaleón Corporation.
SOURCE:O.CASTRO L, AGROMETEOROLOGY CENGICAÑA.
% SB toAugust31st
N=NEUTRAL YEAR ÑO=NIÑO YEARÑA=NIÑA YEAR

450
POTENTIAL USE AND INTERPRETATION OF METEOROLOGICAL VARIABLES IN TECHNICAL DECISIONS
Measuring meteorological variables represents a valuable tool to generate an important analytical process in the technical decision-making process for sugarcane. Figure 14 outlines the usefulness that every value of a meteorological variable generated in a meteorological station can represent. Energy and hydric balances are emphasized, which are decisive in sugarcane biomass and saccharose accumulation.
Figure 14. Potential use of meteorological information for technological decision-
making process in sugarcane
Interpretation of meteorological variables for important technical decisions In irrigation: One of the meteorological variables that affect the most water distribution efficiency for sprinklers is wind speed. Wind speeds greater than 10 km/hour begin to significantly reduce the distribution efficiency to 75 percent (usual efficiency for canon type sprinklers), mainly in the period close to noon. Figure 15 shows wind direction and speed behavior for the harvest season period in the Guatemalan sugarcane area.
Wind can also cause effects in two ways, when wind is hot and dry and when it is warm and humid. Hot and dry winds cause greater effect mainly in ETo (Figure 16).
Source: O. Castro, CENGICAÑA
Variable del SIM
Rg
T°C
HR
VV
DV
MJ
Balance Energético
Balance hídrico
ETo
Note: SIM= Meteorological information system for its acronym in Spanish, ETo= Climaticdemandobtained Penman‐Monteithmethod.
D
T
Hydricbalance
SIM variable
Energybalance
Maximun and minimumproductivity estimates varietiesselection: TSH/MJ/m2/day
Sugar accumulation ripeningstage
Warnings on diseasesappearance
Warnings on pests appearance
Warnings on irrigation spacingreduction
Decision making on agriculturalfires
Decision making of aerialapplications
Thermal amplitude
Minimum teperature
Maximumrelative
Wind speedbetween 11 a 15 hours
Hourly speedand direction
rainfall
Global radiation
Temperature
Relativehumidity
Windspeed
Winddirection
Leafwetness
Productivity estimates: Maximummand minimum.
Varieties selection: TSH/waterstress (mm) orTSH/excesswater
Humidty stress orexcess alarms
1. Rainy seasonbeginning.2. Periodof canicula.
3. Rainy seasonending.
4. Water stress.5. Excesswater
Climaticzoningor
stratification
Hidricdemand=Eto*Kc
Irrigationperiodendingand harvesting
Floweringstagemagnitude and
irrigationIrrigationperiodbeginningand
harvestingperiodIrrigationdecision
making
Drainagedecisionmaking
Sugarcane dailyconsumptionaccording to
phenologicalstage
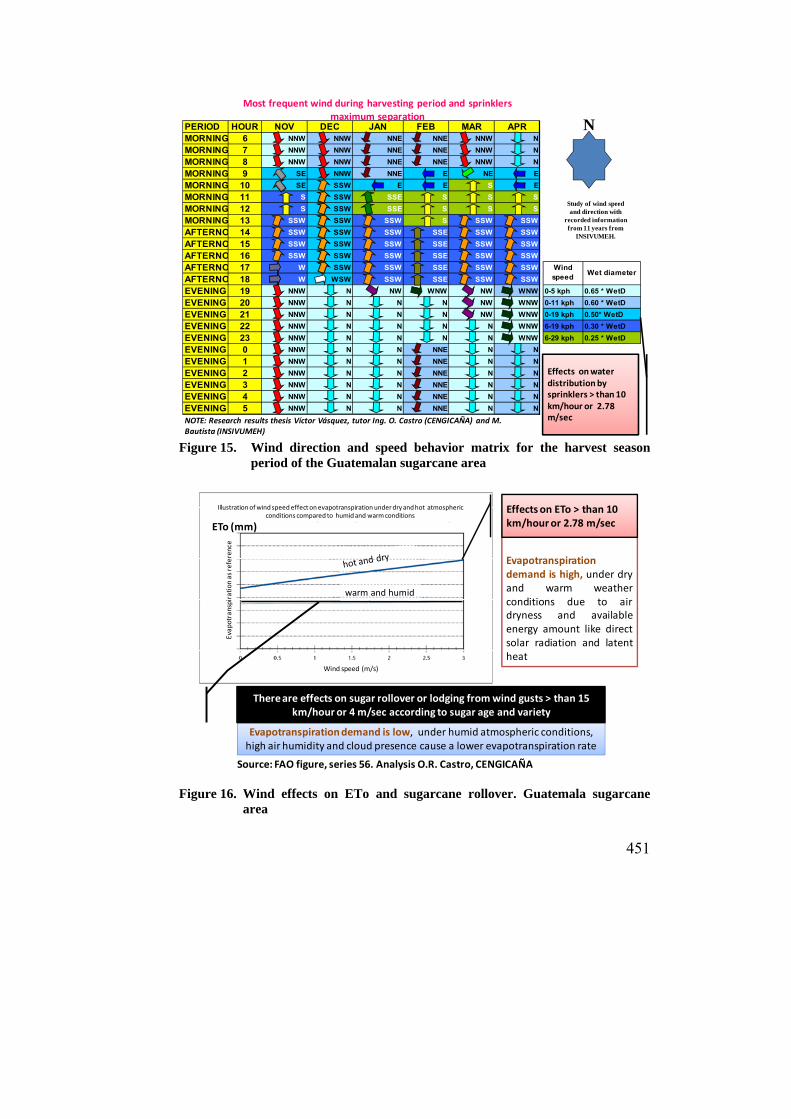
451
Figure 15. Wind direction and speed behavior matrix for the harvest season
period of the Guatemalan sugarcane area
Figure 16. Wind effects on ETo and sugarcane rollover. Guatemala sugarcane
area
PERIOD HOUR NOV DEC JAN FEB MAR APRMORNING 6 NNW NNW NNE NNE NNW N
MORNING 7 NNW NNW NNE NNE NNW N
MORNING 8 NNW NNW NNE NNE NNW N
MORNING 9 SE NNW NNE E NE E
MORNING 10 SE SSW E E S E
MORNING 11 S SSW SSE S S S
MORNING 12 S SSW SSE S S S
MORNING 13 SSW SSW SSW S SSW SSW
AFTERNO 14 SSW SSW SSW SSE SSW SSW
AFTERNO 15 SSW SSW SSW SSE SSW SSW
AFTERNO 16 SSW SSW SSW SSE SSW SSW
AFTERNO 17 W SSW SSW SSE SSW SSW
AFTERNO 18 W WSW SSW SSE SSW SSW
EVENING 19 NNW N NW WNW NW WNW 0-5 kph 0.65 * WetD
EVENING 20 NNW N N N NW WNW 0-11 kph 0.60 * WetD
EVENING 21 NNW N N N NW WNW 0-19 kph 0.50* WetD
EVENING 22 NNW N N N N WNW 6-19 kph 0.30 * WetD
EVENING 23 NNW N N N N WNW 6-29 kph 0.25 * WetD
EVENING 0 NNW N N NNE N N
EVENING 1 NNW N N NNE N N
EVENING 2 NNW N N NNE N N
EVENING 3 NNW N N NNE N N
EVENING 4 NNW N N NNE N N
EVENING 5 NNW N N NNE N N
Wet diameterWind speed
N
Study of wind speedand direction with
recorded informationfrom 11 years from
INSIVUMEH.
NOTE: Research results thesis Víctor Vásquez, tutor Ing. O. Castro (CENGICAÑA) and M. Bautista (INSIVUMEH)
Most frequent wind during harvesting period and sprinklersmaximum separation
Effects onwaterdistributionbysprinklers > than10 km/hour or 2.78 m/sec
Evapotranspirationdemand is high, under dryand warm weatherconditions due to airdryness and availableenergy amount like directsolar radiation and latentheat
Evapotranspirationdemand is low, under humid atmospheric conditions, high air humidity and cloud presence cause a lower evapotranspiration rate
Effectson ETo > than 10 km/houror 2.78 m/sec
Thereare effects on sugar rollover or lodging fromwind gusts > than 15 km/hour or 4 m/sec according to sugar age and variety
Source: FAO figure, series 56. Analysis O.R. Castro, CENGICAÑA
ETo (mm)
warm and humid
Illustration of wind speed effect on evapotranspirationunder dry and hot atmospheric conditions compared to humid and warm conditions
Wind speed (m/s)
Evapotranspiration
as reference

452
During the harvest season period (from November to May), thermal amplitude (difference between maximum and minimum temperatures) behavior is very variable. On clear sky days, minimum temperatures are below 19°C and maximum temperatures reach values of 35°C. On clear sky days, thermal amplitude exceeds 15°C, which favors sugar accumulation and photosynthesis intensity when ETo (climatic demand) increases. On cloudy days, maximum temperature decreases and minimum temperature rises; thermal amplitude can reach values close to 5°C. This condition affects sugar accumulation and ETo decreases (Figure 17).
Figure 17. Thermal amplitude en clear sky and cloudy days, their effect on ETo Air humidity is very important in the ETo behavior and for diseases development. Figure 18 shows an explanation on air humidity effect in the process of climatic demand and critical values.
Well irrigated areas in hot and dry arid region consume great water quantities due to a great energy availability and extraction power of the atmosphere vapor. On the other hand, in tropical humid regions, in spite of a high energy income, high air humidity will reduce evapotranspiration demand. In this last case, since the air is close to saturation levels, it can absorb less additional water, and therefore, evapotranspiration rate is lower than in arid regions.
Figure 18. Effects of air humidity in ETo
TA
Cloudydays
Clear sky daysRainfall
Temperature
Air temperature
In a sunny and hot day , water loss due to
evapotranspiration willbe greater than on a cloudy and fresh day.
Thermal amplitude (AT) > than 15°C indicates that
there is more evapotranspirationduringharvesting season. Values
< than15°C of TA correspond to cloudy
days.
Air humidity
Difference between pressure ofwater vapor in theevapotranspiration surface andthe surrounding air is decidingfactor for vapor removal
RH than 40% during thedaymeans that there is
greater evapotranspirationduring irrigationperiod. Values than 40% duringthe day correspond to
cloudydays propitious todiseasesdevelopment.
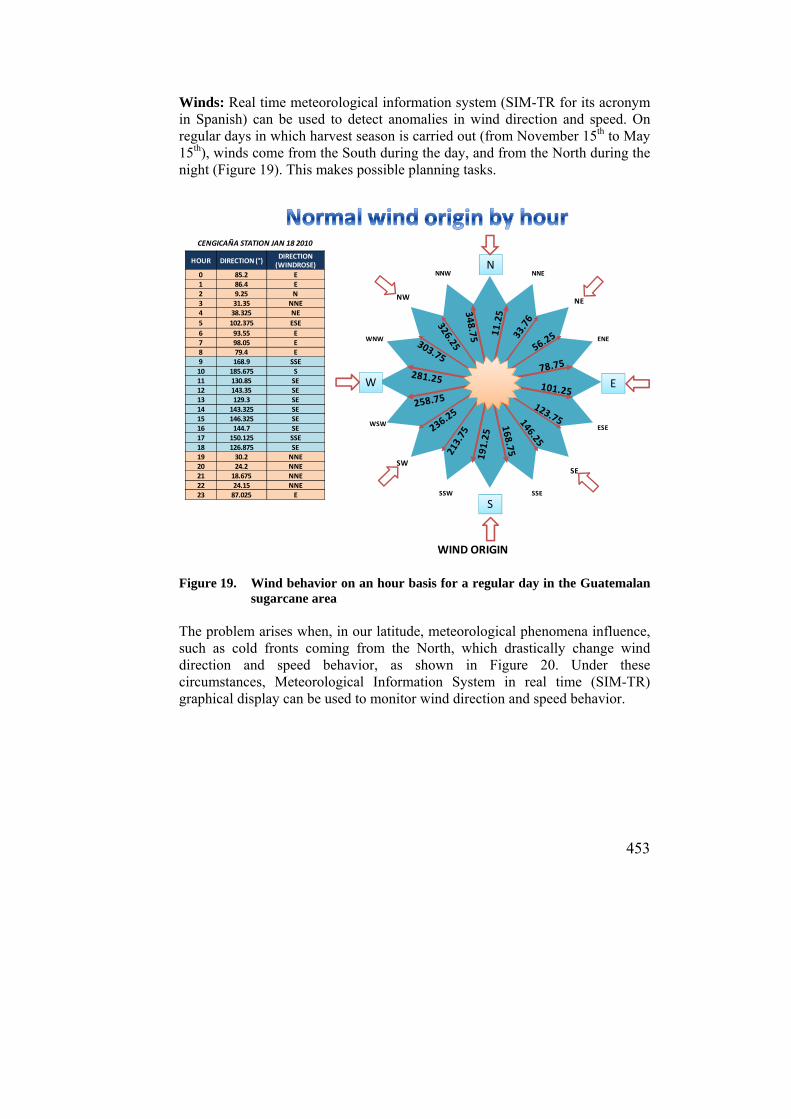
453
Winds: Real time meteorological information system (SIM-TR for its acronym in Spanish) can be used to detect anomalies in wind direction and speed. On regular days in which harvest season is carried out (from November 15th to May 15th), winds come from the South during the day, and from the North during the night (Figure 19). This makes possible planning tasks.
Figure 19. Wind behavior on an hour basis for a regular day in the Guatemalan
sugarcane area The problem arises when, in our latitude, meteorological phenomena influence, such as cold fronts coming from the North, which drastically change wind direction and speed behavior, as shown in Figure 20. Under these circumstances, Meteorological Information System in real time (SIM-TR) graphical display can be used to monitor wind direction and speed behavior.
WIND ORIGIN
NNNE
NE
ENE
EW
S
NW
SWSE
NNW
SSE
ESE
WNW
WSW
SSW
HOUR DIRECTION (°)DIRECTION (WINDROSE)
0 85.2 E1 86.4 E2 9.25 N3 31.35 NNE4 38.325 NE
5 102.375 ESE
6 93.55 E7 98.05 E8 79.4 E9 168.9 SSE10 185.675 S11 130.85 SE12 143.35 SE13 129.3 SE14 143.325 SE15 146.325 SE16 144.7 SE17 150.125 SSE18 126.875 SE19 30.2 NNE20 24.2 NNE21 18.675 NNE22 24.15 NNE23 87.025 E
CENGICAÑA STATION JAN 18 2010
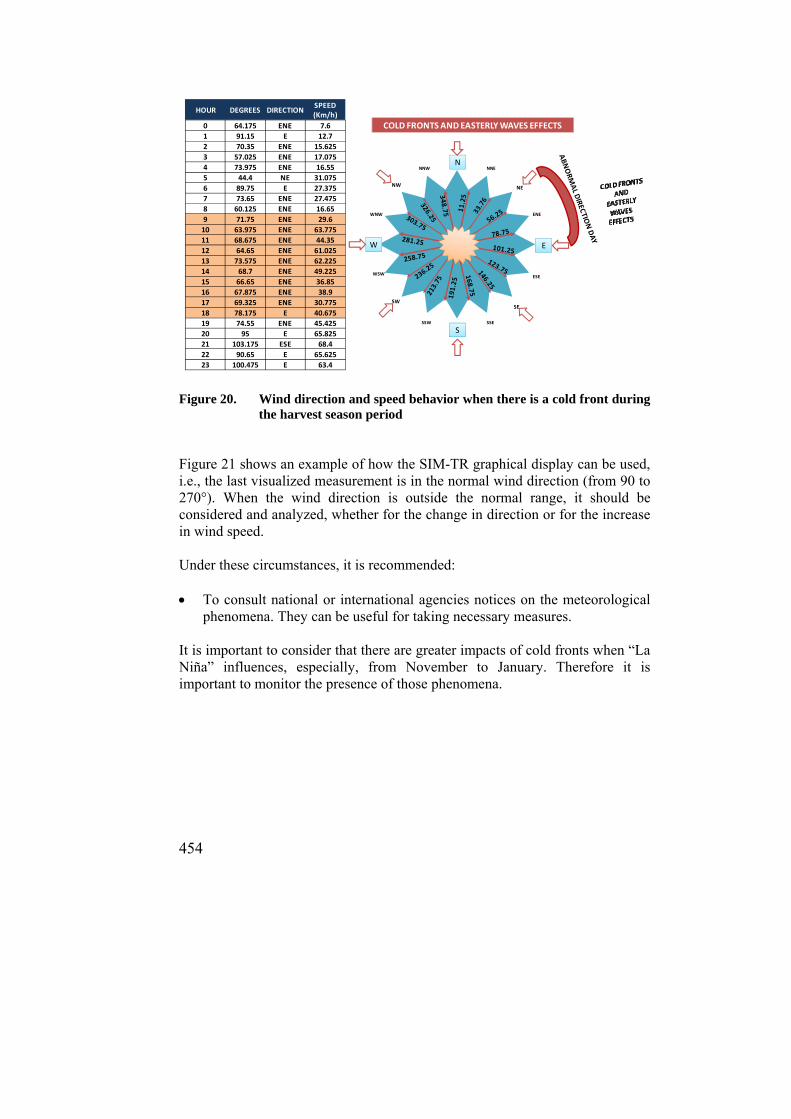
454
Figure 20. Wind direction and speed behavior when there is a cold front during
the harvest season period Figure 21 shows an example of how the SIM-TR graphical display can be used, i.e., the last visualized measurement is in the normal wind direction (from 90 to 270°). When the wind direction is outside the normal range, it should be considered and analyzed, whether for the change in direction or for the increase in wind speed. Under these circumstances, it is recommended: To consult national or international agencies notices on the meteorological
phenomena. They can be useful for taking necessary measures. It is important to consider that there are greater impacts of cold fronts when “La Niña” influences, especially, from November to January. Therefore it is important to monitor the presence of those phenomena.
HOUR DEGREES DIRECTION SPEED (Km/h)
0 64.175 ENE 7.6
1 91.15 E 12.7
2 70.35 ENE 15.625
3 57.025 ENE 17.075
4 73.975 ENE 16.55
5 44.4 NE 31.075
6 89.75 E 27.375
7 73.65 ENE 27.475
8 60.125 ENE 16.65
9 71.75 ENE 29.6
10 63.975 ENE 63.775
11 68.675 ENE 44.35
12 64.65 ENE 61.025
13 73.575 ENE 62.225
14 68.7 ENE 49.225
15 66.65 ENE 36.85
16 67.875 ENE 38.9
17 69.325 ENE 30.775
18 78.175 E 40.675
19 74.55 ENE 45.425
20 95 E 65.825
21 103.175 ESE 68.4
22 90.65 E 65.625
23 100.475 E 63.4
COLD FRONTS AND EASTERLY WAVES EFFECTS
NNNE
NE
ENE
EW
S
NW
SWSE
NNW
SSE
ESE
WNW
WSW
SSW
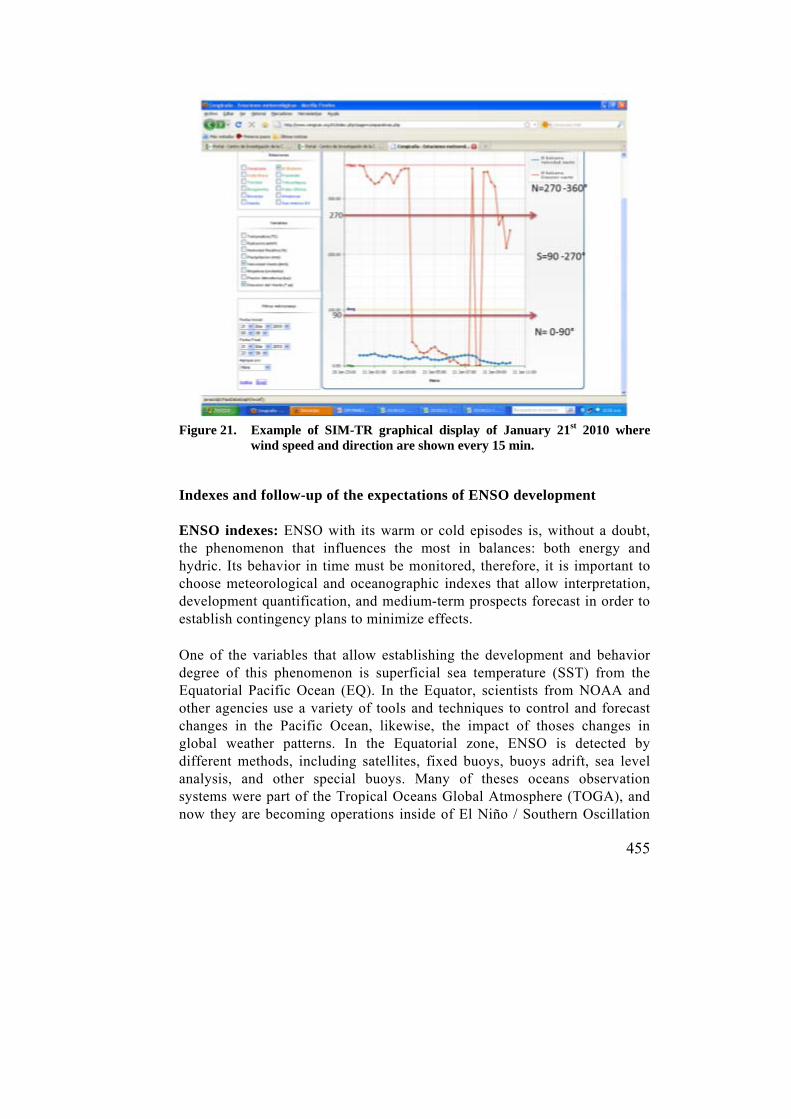
455
Figure 21. Example of SIM-TR graphical display of January 21st 2010 where
wind speed and direction are shown every 15 min.
Indexes and follow-up of the expectations of ENSO development
ENSO indexes: ENSO with its warm or cold episodes is, without a doubt, the phenomenon that influences the most in balances: both energy and hydric. Its behavior in time must be monitored, therefore, it is important to choose meteorological and oceanographic indexes that allow interpretation, development quantification, and medium-term prospects forecast in order to establish contingency plans to minimize effects.
One of the variables that allow establishing the development and behavior degree of this phenomenon is superficial sea temperature (SST) from the Equatorial Pacific Ocean (EQ). In the Equator, scientists from NOAA and other agencies use a variety of tools and techniques to control and forecast changes in the Pacific Ocean, likewise, the impact of thoses changes in global weather patterns. In the Equatorial zone, ENSO is detected by different methods, including satellites, fixed buoys, buoys adrift, sea level analysis, and other special buoys. Many of theses oceans observation systems were part of the Tropical Oceans Global Atmosphere (TOGA), and now they are becoming operations inside of El Niño / Southern Oscillation
456
(ENSO) observation system. There is a research boat in NOAA too, the KA'IMIMOANA, devoted to the service of the Tropical Atmosphere Ocean (TAO), a part of the buoy network of the observation system. Oceanographic information resulting from these tools and techniques is used in important informatic agencies of the ocean and the atmosphere worldwide, like this phenomenon National Forecast NOAA Centers. They are also used by NOAA’s geophysicists, in the Fluids Dynamic Laboratory and other non governmental research institutions.
Expectations development for harvest estimations: ENSO behavior provides clear technical elements on sugarcane production; for a year with presence of an ENSO-Warm episode, between May and December, positive expectations on production would be generated; especially when there is a quantity of energy greater than 20 MJ/m2/day in August. On the contrary, with an ENSO-Cold episode, in the period of May to December, negative expectations on production should be considered. In both cases, appropriate technology application will allow minimizing effects, as an example, the use of hydric balance in the irrigation technology (Niño years) and the use of drainage technology in periods of water excesses (Niña years). With an ENSO-Neutral episode, no extreme conditions are expected in terms of solar brightness behavior and, consequently, in production. With this base, the forecast follow-up since May on the development of ENSO will allow improving the expectations for estimation of productions. This is an activity that usually begins in May. For instance, the International Research Institute for Climate and Society (IRI) in his periodic bulletins, analyzes dynamic (around 14) and SST statistical (around 8) models in the region Niño 3.4. Forecasts made for some seasons of the year are better when they are done between June and December than when they are produced between February and May. It is necessary for each IRI emitted expectation to be assessed on a monthly basis for better results. Figure 22 shows an analysis on ENSO behavior and meteorological and physiological effects on sugarcane for the last 7 years. Real indexes known as ONI emitted by CPC of NCEP (NOAA) and the expectations development from average results of dynamic and statistical models analyzed by IRI (http://iri.columbia.edu/), are also observed.
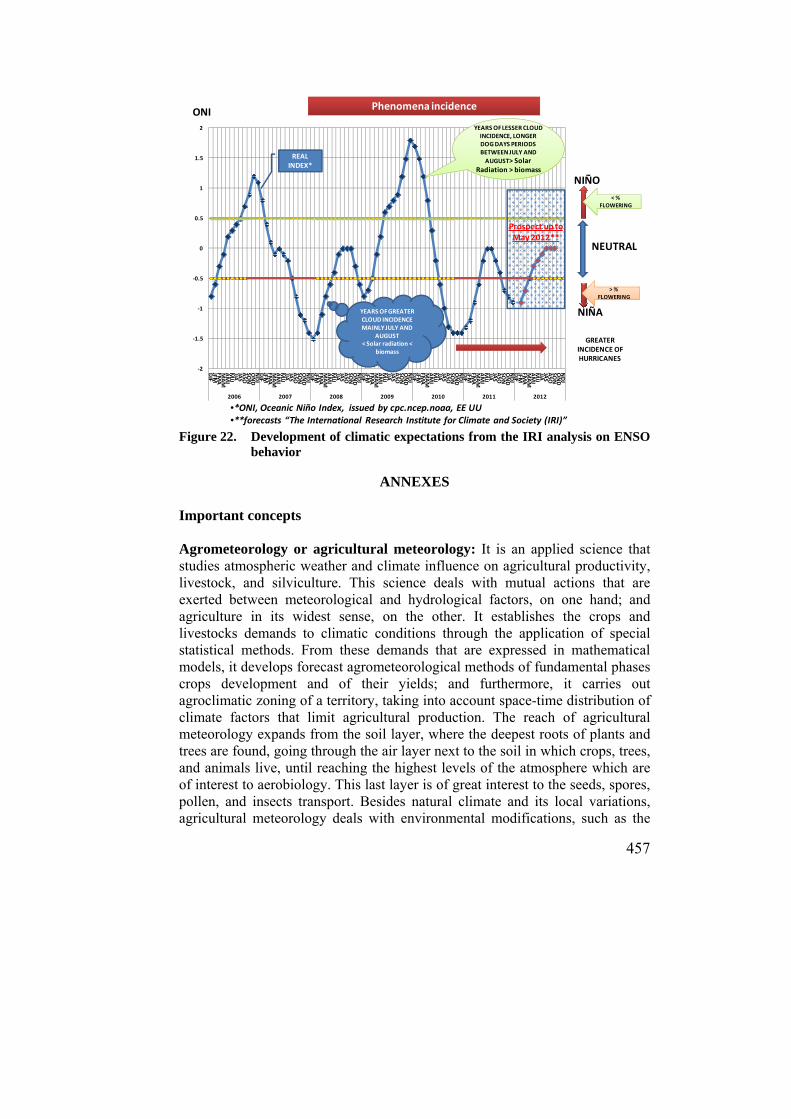
457
Figure 22. Development of climatic expectations from the IRI analysis on ENSO
behavior
ANNEXES Important concepts Agrometeorology or agricultural meteorology: It is an applied science that studies atmospheric weather and climate influence on agricultural productivity, livestock, and silviculture. This science deals with mutual actions that are exerted between meteorological and hydrological factors, on one hand; and agriculture in its widest sense, on the other. It establishes the crops and livestocks demands to climatic conditions through the application of special statistical methods. From these demands that are expressed in mathematical models, it develops forecast agrometeorological methods of fundamental phases crops development and of their yields; and furthermore, it carries out agroclimatic zoning of a territory, taking into account space-time distribution of climate factors that limit agricultural production. The reach of agricultural meteorology expands from the soil layer, where the deepest roots of plants and trees are found, going through the air layer next to the soil in which crops, trees, and animals live, until reaching the highest levels of the atmosphere which are of interest to aerobiology. This last layer is of great interest to the seeds, spores, pollen, and insects transport. Besides natural climate and its local variations, agricultural meteorology deals with environmental modifications, such as the
‐2
‐1.5
‐1
‐0.5
0
0.5
1
1.5
2
DJF
JFMFM
AMAM
AMJ
MJJ
JJAJAS
ASO
SON
OND
NDJ
DJF
JFMFM
AMAM
AMJ
MJJ
JJAJAS
ASO
SON
OND
NDJ
DJF
JFMFM
AMAM
AMJ
MJJ
JJAJAS
ASO
SON
OND
NDJ
DJF
JFMFM
AMAM
AMJ
MJJ
JJAJAS
ASO
SON
OND
NDJ
DJF
JFMFM
AMAM
AMJ
MJJ
JJAJAS
ASO
SON
OND
NDJ
DJF
JFMFM
AMAM
AMJ
MJJ
JJAJAS
ASO
SON
OND
NDJ
DJF
JFMFM
AMAM
AMJ
MJJ
JJAJAS
ASO
SON
OND
NDJ
2006 2007 2008 2009 2010 2011 2012
REAL INDEX*
NIÑO
NIÑA
NEUTRAL
ONI
YEARS OF GREATER CLOUD INCIDENCE MAINLY JULY AND
AUGUST< Solar radiation <
biomass
YEARS OF LESSER CLOUD INCIDENCE, LONGER DOG DAYS PERIODS BETWEEN JULY AND
AUGUST> Solar Radiation > biomass
< % FLOWERING
> % FLOWERING
Prospect up toMay 2012**
•*ONI, Oceanic Niño Index, issued by cpc.ncep.noaa, EE UU•**forecasts “The International Research Institute for Climate and Society (IRI)”
Phenomena incidence
GREATER INCIDENCE OF HURRICANES
458
ones produced by windbreaking barriers and irrigation, climatic conditions during storage, in both the interior and the field, environmental conditions in cattle shelters and in agricultural buildings; and finally, inside vehicles during the transportation of agricultural products (www.ecured.cu/).
Solar brightness: It refers to direct solar radiation in one day (n), it is measured with a heliograph. When it is expressed as the duration of the relative direct solar radiation, it is equal (%BS) = n/N, where N is equal to the maximum possible duration of solar radiation.
Rainy season beginning: It is defined as the period in which effective rainfall quantity from the beginning of April to the beginning of June is enough to satisfy hydric needs of sugarcane. Its effect is variable according to atitudinal stratum, sugarcane age and soil type, in which the cultivar is located. Dog days: Period between July and August in which effective rainfall decreases and causes water shortage to sugarcane. “Dog days” is a characteristic climatic phenomenon that happens in our latitude every year. Its effect is variable according to altitudinal stratum, sugarcane age, and soil type, in which the cultivar is located. Rainy season ending: Period between October and November in which effective rainfall quantities are no longer sufficient to satisfy sugarcane hydric needs and cause water shortage. This period is variable according to altitudinal stratum, sugarcane age, and soil type on which the cultivar is located. To determine beginning and ending of the periods of rainy season, as well as the Dog Days season, the graphical analysis is used. Variables rainfall (bars) and estimated potential evapotranspiration (ETo) with Penman-Monteith (line) are also graphed. Rainfall values are accumulated in pentads (five-day rainfall) and should be greater than ETo; if not, they will cause water shortage. Interpretation according to texture is as follows:, a period of two pentads with rainfall lower than ETP means a deficit for a sandy soil. For a loamy soil, a period between three and four pentads and for silt-loamy soil with capillar input, a period between four and five pentads. Usual wind direction in latitude 14° During the day: As the sun comes up, it warms up the earth faster than the sea water. The earth warms up the air close to it, which ascends when it becomes lighter; its place is taken by sea air that is cooler. A thermal gradient is originated, which at the same time, originates a pressure gradient that causes the air displacement of the higher pressure zone –sea surface – to the lower pressure one –earth surface -, generating a wind coming from the sea to the earth that is
459
called sea breeze or virazon. During the night: When solar radiation disappears, sea surface maintains for a longer period the heat caught during the day more than the earth, which cools off more quickly. A thermal and inversely pressure gradient to daily case is produced: the sea hotter air goes up and its place is taken by cooler air coming from the earth. That is the origin of terrestrial breeze or terral. The cold front. It is a band of bad weather that happens when a mass of cool air gets close to a mass of warm air. Cool dense air, generates an edge and gets under warm and less dense air. Cold fronts move quickly, they are strong and can cause atmospheric disturbances such as as storms, showers, tornadoes, and strong winds. Its activity in our latitude increases especially in ENSO-Cold episodes years. What is El Niño?
The term El Niño refers to the big-scale ocean-atmosphere climatic phenomenon related to periodic warming of sea superficial temperatures in the central zone and center-eastern zone of the Equatorial Pacific (around date line and 120 o W). El Niño represents the cycle warm phase of the El Niño/ Southern Oscillation (ENSO) phenomenon and sometimes if it referes to as a warm episode of the Pacific. El Niño originally referred to an annual warming of the sea superficial temperature across the western coast of South America. The Climate Forecast NOAA Center, which is part of the National Meteorological Service, states the beginning of an El Niño episode, when for three months the sea superficial temperature exceeds 0.5 o C in the central- eastern Equatorial Pacific between 5 o N-5 o S and 170 o W-120 oW.
What is La Niña?
La Niña refers to a periodic cooling of ocean superficial temperatures in the central and central-eastern zones of the Equatorial Pacific, which happens every three to five years or less. La Niña represents the cycle cold phase of El Niño / Southern Oscillation (ENSO) phenomenon, and it is sometimes referred to as a cold episode of the Pacific. La Niña originally referes to an annual cooling of oceanic waters in the East coast of Perú and Ecuador.
ENSO-neutral
It refers to periods with no presence of El Niño or La Niña. These periods often coincide with transition between El Niño and La Niña. It is ENSO-neutral during periods when ocean temperature, tropical rainfall patterns, and

460
atmospheric winds over the Equatorial Pacific Ocean are close to average on the long term. Important conversions
Conversion of solar brightness duration to energy quantity or viceversa
Where: n=Solar brightness in hours and tenths
Rg=Global radiation in MJ/m2/day Ra=Solar radiation to the atmosphere limit in latitude 14° (See Table 3) in
MJ/m2/day. N=Possible maximum duration of solar radiation, latitude 14° (See Table 3) in
hours and tenths Source: CENGICAÑA, 2009.
Rg =( 0.26 + 0.48 (n/N))*Ra R2=0.77
n = (‐0.32+ 1.61 (Rg/Ra))*N R2=0.77
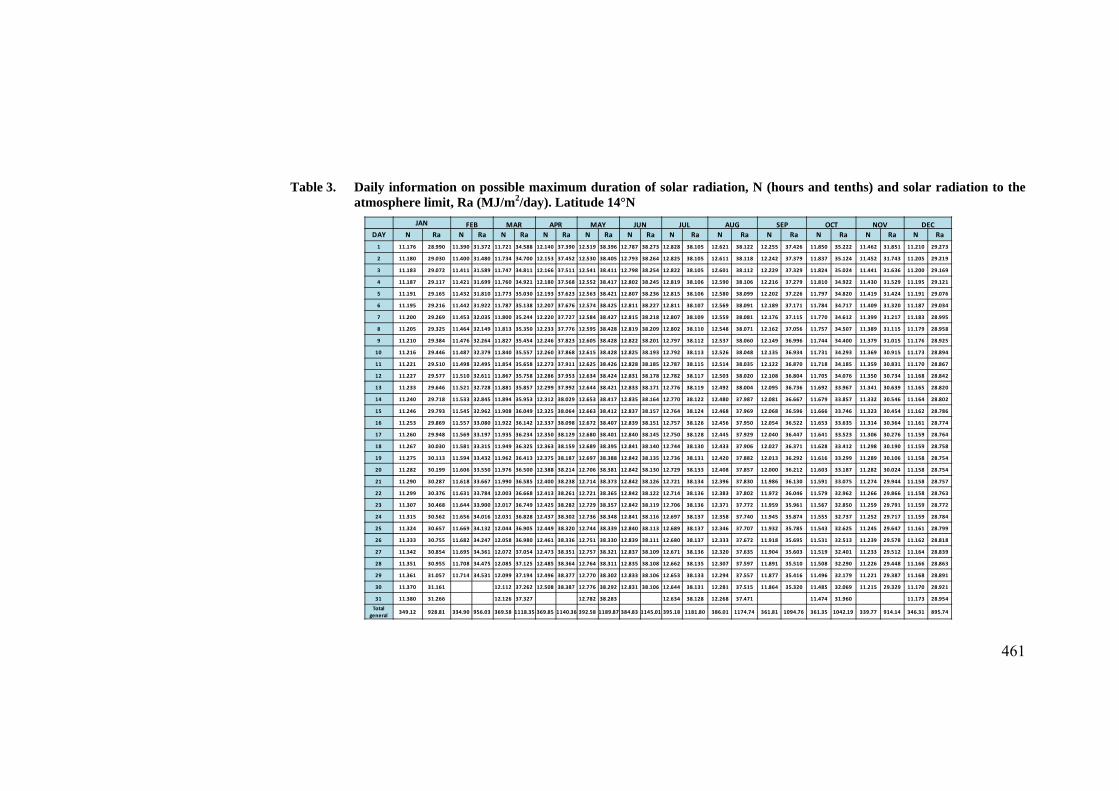
461
Table 3. Daily information on possible maximum duration of solar radiation, N (hours and tenths) and solar radiation to the atmosphere limit, Ra (MJ/m2/day). Latitude 14°N
JAN FEB MAR APR MAY JUN JUL AUG SEP OCT NOV DEC
DAY N Ra N Ra N Ra N Ra N Ra N Ra N Ra N Ra N Ra N Ra N Ra N Ra
1 11.176 28.990 11.390 31.372 11.721 34.588 12.140 37.390 12.519 38.396 12.787 38.273 12.828 38.105 12.621 38.122 12.255 37.426 11.850 35.222 11.462 31.851 11.210 29.273
2 11.180 29.030 11.400 31.480 11.734 34.700 12.153 37.452 12.530 38.405 12.793 38.264 12.825 38.105 12.611 38.118 12.242 37.379 11.837 35.124 11.452 31.743 11.205 29.219
3 11.183 29.072 11.411 31.589 11.747 34.811 12.166 37.511 12.541 38.411 12.798 38.254 12.822 38.105 12.601 38.112 12.229 37.329 11.824 35.024 11.441 31.636 11.200 29.169
4 11.187 29.117 11.421 31.699 11.760 34.921 12.180 37.568 12.552 38.417 12.802 38.245 12.819 38.106 12.590 38.106 12.216 37.279 11.810 34.922 11.430 31.529 11.195 29.121
5 11.191 29.165 11.432 31.810 11.773 35.030 12.193 37.623 12.563 38.421 12.807 38.236 12.815 38.106 12.580 38.099 12.202 37.226 11.797 34.820 11.419 31.424 11.191 29.076
6 11.195 29.216 11.442 31.922 11.787 35.138 12.207 37.676 12.574 38.425 12.811 38.227 12.811 38.107 12.569 38.091 12.189 37.171 11.784 34.717 11.409 31.320 11.187 29.034
7 11.200 29.269 11.453 32.035 11.800 35.244 12.220 37.727 12.584 38.427 12.815 38.218 12.807 38.109 12.559 38.081 12.176 37.115 11.770 34.612 11.399 31.217 11.183 28.995
8 11.205 29.325 11.464 32.149 11.813 35.350 12.233 37.776 12.595 38.428 12.819 38.209 12.802 38.110 12.548 38.071 12.162 37.056 11.757 34.507 11.389 31.115 11.179 28.958
9 11.210 29.384 11.476 32.264 11.827 35.454 12.246 37.823 12.605 38.428 12.822 38.201 12.797 38.112 12.537 38.060 12.149 36.996 11.744 34.400 11.379 31.015 11.176 28.925
10 11.216 29.446 11.487 32.379 11.840 35.557 12.260 37.868 12.615 38.428 12.825 38.193 12.792 38.113 12.526 38.048 12.135 36.934 11.731 34.293 11.369 30.915 11.173 28.894
11 11.221 29.510 11.498 32.495 11.854 35.658 12.273 37.911 12.625 38.426 12.828 38.185 12.787 38.115 12.514 38.035 12.122 36.870 11.718 34.185 11.359 30.831 11.170 28.867
12 11.227 29.577 11.510 32.611 11.867 35.758 12.286 37.953 12.634 38.424 12.831 38.178 12.782 38.117 12.503 38.020 12.108 36.804 11.705 34.076 11.350 30.734 11.168 28.842
13 11.233 29.646 11.521 32.728 11.881 35.857 12.299 37.992 12.644 38.421 12.833 38.171 12.776 38.119 12.492 38.004 12.095 36.736 11.692 33.967 11.341 30.639 11.165 28.820
14 11.240 29.718 11.533 32.845 11.894 35.953 12.312 38.029 12.653 38.417 12.835 38.164 12.770 38.122 12.480 37.987 12.081 36.667 11.679 33.857 11.332 30.546 11.164 28.802
15 11.246 29.793 11.545 32.962 11.908 36.049 12.325 38.064 12.663 38.412 12.837 38.157 12.764 38.124 12.468 37.969 12.068 36.596 11.666 33.746 11.323 30.454 11.162 28.786
16 11.253 29.869 11.557 33.080 11.922 36.142 12.337 38.098 12.672 38.407 12.839 38.151 12.757 38.126 12.456 37.950 12.054 36.522 11.653 33.635 11.314 30.364 11.161 28.774
17 11.260 29.948 11.569 33.197 11.935 36.234 12.350 38.129 12.680 38.401 12.840 38.145 12.750 38.128 12.445 37.929 12.040 36.447 11.641 33.523 11.306 30.276 11.159 28.764
18 11.267 30.030 11.581 33.315 11.949 36.325 12.363 38.159 12.689 38.395 12.841 38.140 12.744 38.130 12.433 37.906 12.027 36.371 11.628 33.412 11.298 30.190 11.159 28.758
19 11.275 30.113 11.594 33.432 11.962 36.413 12.375 38.187 12.697 38.388 12.842 38.135 12.736 38.131 12.420 37.882 12.013 36.292 11.616 33.299 11.289 30.106 11.158 28.754
20 11.282 30.199 11.606 33.550 11.976 36.500 12.388 38.214 12.706 38.381 12.842 38.130 12.729 38.133 12.408 37.857 12.000 36.212 11.603 33.187 11.282 30.024 11.158 28.754
21 11.290 30.287 11.618 33.667 11.990 36.585 12.400 38.238 12.714 38.373 12.842 38.126 12.721 38.134 12.396 37.830 11.986 36.130 11.591 33.075 11.274 29.944 11.158 28.757
22 11.299 30.376 11.631 33.784 12.003 36.668 12.413 38.261 12.721 38.365 12.842 38.122 12.714 38.136 12.383 37.802 11.972 36.046 11.579 32.962 11.266 29.866 11.158 28.763
23 11.307 30.468 11.644 33.900 12.017 36.749 12.425 38.282 12.729 38.357 12.842 38.119 12.706 38.136 12.371 37.772 11.959 35.961 11.567 32.850 11.259 29.791 11.159 28.772
24 11.315 30.562 11.656 34.016 12.031 36.828 12.437 38.302 12.736 38.348 12.841 38.116 12.697 38.137 12.358 37.740 11.945 35.874 11.555 32.737 11.252 29.717 11.159 28.784
25 11.324 30.657 11.669 34.132 12.044 36.905 12.449 38.320 12.744 38.339 12.840 38.113 12.689 38.137 12.346 37.707 11.932 35.785 11.543 32.625 11.245 29.647 11.161 28.799
26 11.333 30.755 11.682 34.247 12.058 36.980 12.461 38.336 12.751 38.330 12.839 38.111 12.680 38.137 12.333 37.672 11.918 35.695 11.531 32.513 11.239 29.578 11.162 28.818
27 11.342 30.854 11.695 34.361 12.072 37.054 12.473 38.351 12.757 38.321 12.837 38.109 12.671 38.136 12.320 37.635 11.904 35.603 11.519 32.401 11.233 29.512 11.164 28.839
28 11.351 30.955 11.708 34.475 12.085 37.125 12.485 38.364 12.764 38.311 12.835 38.108 12.662 38.135 12.307 37.597 11.891 35.510 11.508 32.290 11.226 29.448 11.166 28.863
29 11.361 31.057 11.714 34.531 12.099 37.194 12.496 38.377 12.770 38.302 12.833 38.106 12.653 38.133 12.294 37.557 11.877 35.416 11.496 32.179 11.221 29.387 11.168 28.891
30 11.370 31.161 12.112 37.262 12.508 38.387 12.776 38.292 12.831 38.106 12.644 38.131 12.281 37.515 11.864 35.320 11.485 32.069 11.215 29.329 11.170 28.921
31 11.380 31.266 12.126 37.327 12.782 38.283 12.634 38.128 12.268 37.471 11.474 31.960 11.173 28.954
Total general
349.12 928.81 334.90 956.03 369.58 1118.35 369.85 1140.36 392.58 1189.87 384.83 1145.01 395.18 1181.80 386.01 1174.74 361.81 1094.76 361.35 1042.19 339.77 914.14 346.31 895.74
462
BIBLIOGRAPHY 1. Castro, O. 2010. La variabilidad de la radiación solar en la superficie
terrestre y sus efectos en la producción de caña de azúcar en Guatemala. In: Memoria. Presentación de resultados de investigación. Zafra 2009-2010. Guatemala, CENGICAÑA. pp. 281-287.
2. Castro, O.; Suárez, A.; Ramírez, C. 2010. Estudio de las relaciones entre
duración de radiación solar y radiación global para la latitud 14°N de la zona cañera guatemalteca. In: Memoria. Presentación de resultados de investigación. Zafra 2009-2010. Guatemala, CENGICAÑA. pp. 288-293.
3. Climate Prediction Center of The National Centers for Environmental
Prediction. Cold & Warm Episodes by Season, ONI, Oceanic Niño Index. http://www.cpc.ncep.noaa.gov/
4. FAO, 2006. Evapotranspiración del cultivo. Guía para la determinación de
los requerimientos de agua de los cultivos. Estudio serie Riego y drenaje No. 56. 298 p.
5. ICC, 2011. Base de datos de variables meteorológicas de las estaciones
meteorológicas ubicadas en la zona cañera de Guatemala, años 2007-mayo 2011. ICC. Archivo electrónico.
6. International Research Institute for Climate and Society (IRI).
Probabilidades de comportamiento ONI (Oceanic Niño Index). http://iri.columbia.edu/
7. LA UNIÓN-LOS TARROS, 2009. Base de datos de temperatura y lluvia,
estación meteorológica “Belén” ubicada en la finca Belén. 8. Meneses, A.; Melgar, M. 2009. Series históricas de producción, exportación
y consumo de azúcar en Guatemala. Boletín estadístico, año 10, No. 1. Guatemala, CENGICAÑA. 8p.
9. Ortiz, Carlos. 1987. Elementos de agrometeorología cuantitativa. 3ª edición.
Departamento de suelos. Universidad Autónoma Chapingo, México. Páginas consultadas 18-53 y 306-321.
10. PANTALEON, LA UNIÓN-LOS TARROS, MAGDALENA. 2009. Base
de datos de brillo solar años 2007, 2008 y 2009. 11. PANTALEON. 2011. Base de datos de variables meteorológicas de 1986 a
la fecha. Departamento de Investigación. Archivo electrónico.

463
XVI. CLIMATE CHANGE AND THE SUGARCANE CROP
464
CLIMATE CHANGE AND THE SUGARCANE CROP
Alex Guerra and Alejandra Hernández INTRODUCTION Climate change appears to be among the greatest challenges to mankind at present. There is scientific evidence about changes that are obvious, and also the relation between these changes and human activities which have caused them (IPCC, 2007). International discussions and debates focus on how to stop (or at least decelerate) future climate change and, every time with greater importance, how to attain populations to adapt to changes that appear. It is important to recognize that climate change does not only represent an additional problem for humanity, but that it lends greater degree of difficulty to the challenges that already exist. This chapter aims to briefly set out the climate change topic and its relation with the sugarcane crop. Although CENGICAÑA’s research and training have not dealt deliberately with the subject, much of its work does have a relation, as it will be further exposed. Aside from the general relevance of the subject, a special chapter is included because the Guatemalan Sugar Agroindustry has funded a climate change specialized institution: the Private Institute for Climate Change Research (ICC, for its acronym in Spanish). It was created not only aiming to support the Sugarcane Agroindustry to tackle climate change, but it constitutes a contribution to the country, since its work will include other sectors, communities, and national infrastructure. Besides the introduction, the chapter contains three main parts. The first one outlines the general relation between climate and the sugarcane crop. Within the same part, knowledge on climate change in Guatemala is presented, and it concludes with possible effects on sugar production. The second part raises climate change mitigation and the sugarcane crop. In the beginning, it presents the context of the greenhouse gases (GHG) emission in Guatemala, and then, points out action opportunities. The third part deals with adaptation to climate change. It starts with a general introduction to adaptation, and then, focuses on the sugarcane crop case. To finalize, the ICC and its main research and action areas are presented; focusing on the existent opportunity to achieve benefits for
Alex Guerra is a Forestry Engineer, Ph.D. General Director of the Private Institute for Climate Change Research, ICC for its acronym in Spanish; Alejandra Hernández is a Forestry Engineer M.Sc., Coordinator of the Ecosystems Research Programme of the ICC. www.icc.org.gt
465
the Sugar Agroindustry, the communities, and the country, contributing in this way, with global efforts. CLIMATE CHANGE The United Nations Framework Convention on Climate Change (UNFCCC), defines climate change as “a change of climate which is attributed directly or indirectly to human activity, that alters the composition of the global atmosphere, and which is in addition to natural climate variability observed over comparable time periods” (IPCC, 2007). The objective of the convention consists in stabilizing concentration of greenhouse gases (GHG) in the atmosphere to a level that prevents dangerous anthropogenic interferences with the global climate system, and that should be achieved in a period that allows the ecosystems natural adaptation to climate change, ensuring food production and sustainable economic development. At the beginning of the XIX century, research on the atmosphere composing gases and their ability to retain heat had already begun. At the time of the First Global Conference on Climate in Geneva, in 1979, the topic reaches its peak. In 1989, the World Meterorological Organization (WMO) and the United Nations Environment Programme (UNEP) created the Intergovernmental Panel on Climate Change (IPCC), which was established to analyze in a thorough, objective, open and transparent way all relevant scientific, technical and socioeconomic information to understand the climate change phenomenon. Up to the date, the IPCC has generated four general reports (1990, 1995, 2001, and 2007), which have been decisive to keep moving forward in the climate change international negotiations. The last of them, presented in 2007, allowed drawing a roadmap to review international agreements on required actions to carry them out after 2012. One of the achievements of internacional negotiations is the existence of binding commitments, adopted through the Kyoto Protocol, tool that was created in 1997. Intentions of reduction of GHG emissions and the creation of market mechanisms to facilitate their fulfillment are captured in that document. In the same way, individual goals (by country) on GHG emissions reduction or control are fixed. Another relevant aspect was the production of emissions scenarios that represent a likely future and at the same time, is the foundation of the climatic projections. Model and scenario based simulated results describe possible climate change effects at a global level and by sector, in the case that no adaptation measures are considered. Some effects for the agricultural sector in general (Table 1), especially those that could affect sugarcane crop in Guatemala, are described below.
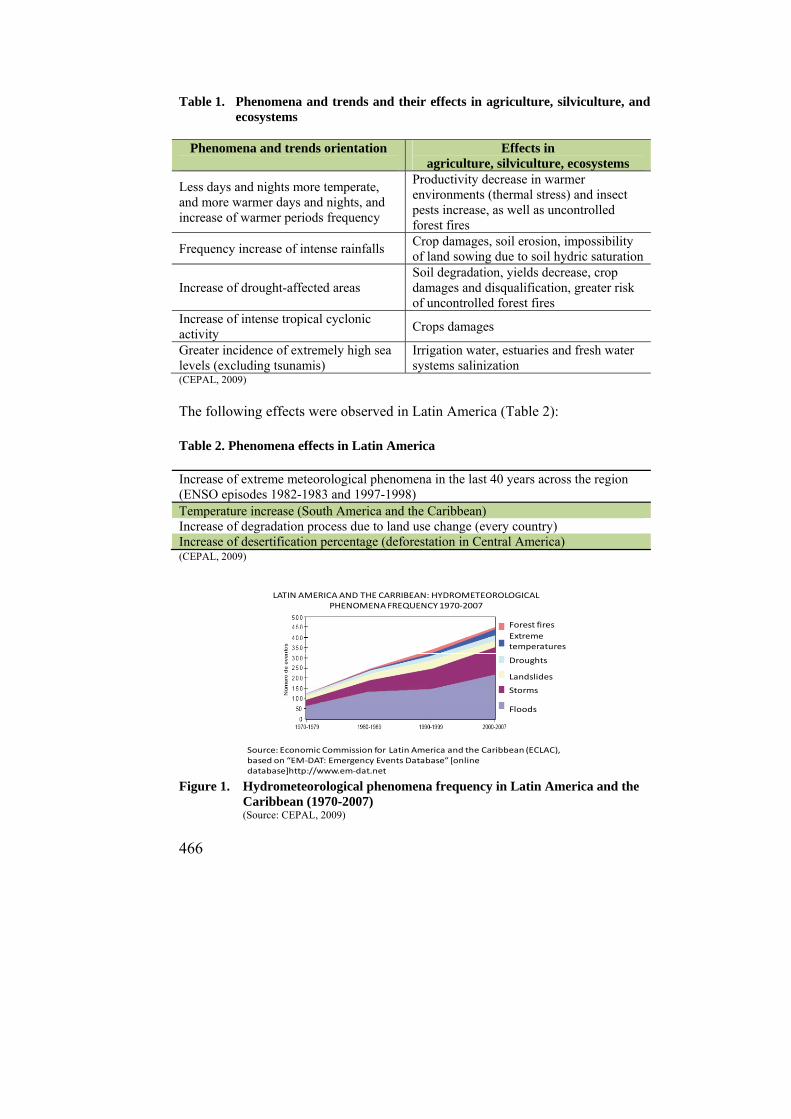
466
Table 1. Phenomena and trends and their effects in agriculture, silviculture, and ecosystems
Phenomena and trends orientation
Effects in
agriculture, silviculture, ecosystems
Less days and nights more temperate, and more warmer days and nights, and increase of warmer periods frequency
Productivity decrease in warmer environments (thermal stress) and insect pests increase, as well as uncontrolled forest fires
Frequency increase of intense rainfalls Crop damages, soil erosion, impossibility of land sowing due to soil hydric saturation
Increase of drought-affected areas Soil degradation, yields decrease, crop damages and disqualification, greater risk of uncontrolled forest fires
Increase of intense tropical cyclonic activity
Crops damages
Greater incidence of extremely high sea levels (excluding tsunamis)
Irrigation water, estuaries and fresh water systems salinization
(CEPAL, 2009)
The following effects were observed in Latin America (Table 2): Table 2. Phenomena effects in Latin America Increase of extreme meteorological phenomena in the last 40 years across the region (ENSO episodes 1982-1983 and 1997-1998) Temperature increase (South America and the Caribbean) Increase of degradation process due to land use change (every country) Increase of desertification percentage (deforestation in Central America) (CEPAL, 2009)
Figure 1. Hydrometeorological phenomena frequency in Latin America and the
Caribbean (1970-2007) (Source: CEPAL, 2009)
LATIN AMERICA AND THE CARRIBEAN: HYDROMETEOROLOGICAL PHENOMENA FREQUENCY 1970‐2007
Forest fires
Droughts
Landslides
Storms
Floods
Extreme temperatures
Source: Economic Commission for Latin America and the Caribbean (ECLAC), based on “EM‐DAT: Emergency Events Database” [online database]http://www.em‐dat.net
467
Figure 1 shows the frequency of hydrometeorological phenomena that have occured in Latin America and the Caribbean since the 1970’s to 2007. For 37 years, all types of phenomena that generally occur in Latinamerican lands have increased. In 1970, less than 150 phenomena which included forest fires, droughts, landslides, storms and floods, were accounted for. In 2007, those incidents have almost tripled.
RELATION BETWEEN CLIMATE AND THE SUGARCANE CROP Climatic conditions for the sugarcane crop Sugarcane, as much as every other crop, develops under specific climatic conditions, and only under some of them, its growth turns out to be optimal. Optimal temperature for its development must be between 27°C and 33°C. Subirós (2000) mentions that growth clearly decreases at values of 20°C. If temperature drops even more, growth practically paralyzes. According to Gawander (2007), cold nights and early mornings in which the temperature does not exceed 14°C in the dry season, or 20°C in the rainy one, greatly affects the photosynthetic process the next day. When temperature is higher than 35°C, respiration increases and as a consequence, reduces the photosynthetic rate, which leads to a reduction in growth and dry matter accumulation. Whereas wilting signs become evident when temperature increases above 36°C (Subirós, 2000). If temperature is higher, growth rate increases more than photosynthesis, which adversely affects saccharose accumulation (Gawander, 2007). At present, the network of 16 meteorological stations located in the four sugarcane strata (high, medium, low, and coastal) records environmental temperature measurements. The network allows possessing the range of mimimum and maximum daily temperatures, and to determine if they are within optimal values for the crop development. During January 2010, for example, the minimum recorded temperature was 14.1°C in Puyumate station, whereas the maximum one was 36.5°C in Trinidad station. As important as air temperature is soil temperature that must be around 27°C to fulfill its role in root development, nutrient absorption, and biological activity. Below 21°C, it becomes a limiting factor in the crop development and a temperature of 24°C is considered as an appropriate average (Subirós, 2000). With respect to that variable, there are no measurements carried out
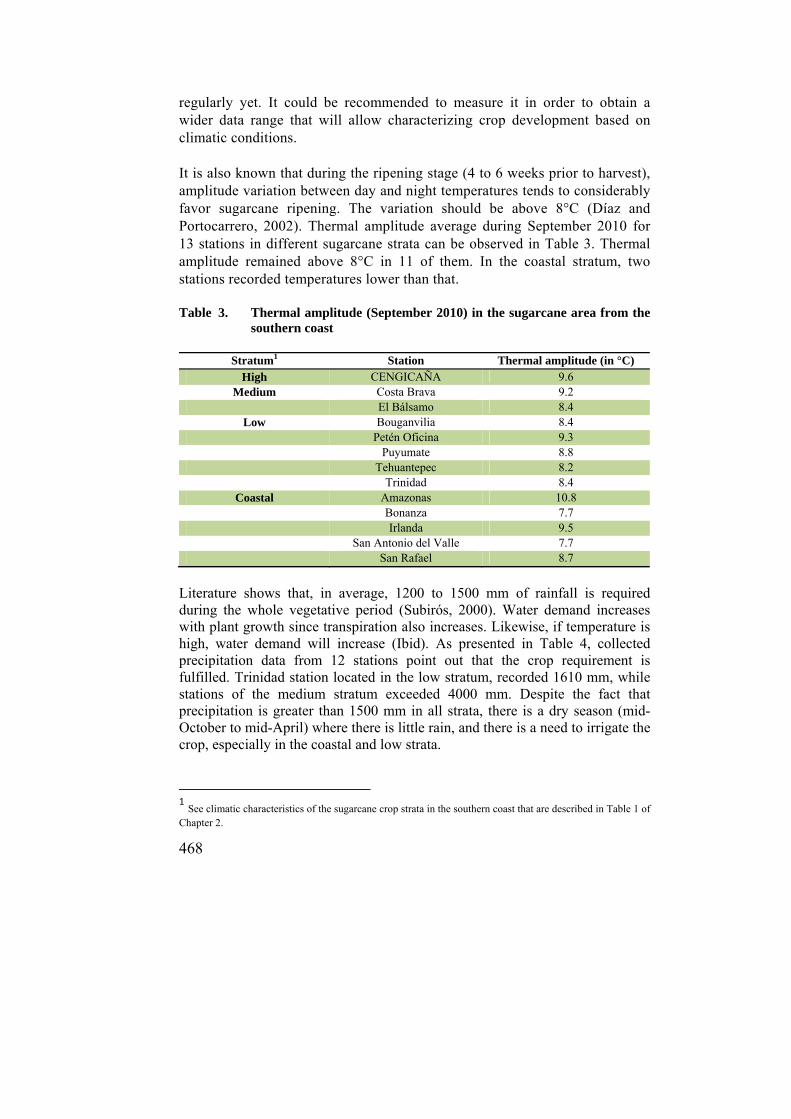
468
regularly yet. It could be recommended to measure it in order to obtain a wider data range that will allow characterizing crop development based on climatic conditions. It is also known that during the ripening stage (4 to 6 weeks prior to harvest), amplitude variation between day and night temperatures tends to considerably favor sugarcane ripening. The variation should be above 8°C (Díaz and Portocarrero, 2002). Thermal amplitude average during September 2010 for 13 stations in different sugarcane strata can be observed in Table 3. Thermal amplitude remained above 8°C in 11 of them. In the coastal stratum, two stations recorded temperatures lower than that. Table 3. Thermal amplitude (September 2010) in the sugarcane area from the
southern coast
Stratum1 Station Thermal amplitude (in °C) High CENGICAÑA 9.6
Medium Costa Brava 9.2 El Bálsamo 8.4
Low Bouganvilia 8.4 Petén Oficina 9.3 Puyumate 8.8 Tehuantepec 8.2 Trinidad 8.4
Coastal Amazonas 10.8 Bonanza 7.7 Irlanda 9.5 San Antonio del Valle 7.7 San Rafael 8.7
Literature shows that, in average, 1200 to 1500 mm of rainfall is required during the whole vegetative period (Subirós, 2000). Water demand increases with plant growth since transpiration also increases. Likewise, if temperature is high, water demand will increase (Ibid). As presented in Table 4, collected precipitation data from 12 stations point out that the crop requirement is fulfilled. Trinidad station located in the low stratum, recorded 1610 mm, while stations of the medium stratum exceeded 4000 mm. Despite the fact that precipitation is greater than 1500 mm in all strata, there is a dry season (mid-October to mid-April) where there is little rain, and there is a need to irrigate the crop, especially in the coastal and low strata.
1 See climatic characteristics of the sugarcane crop strata in the southern coast that are described in Table 1 of Chapter 2.
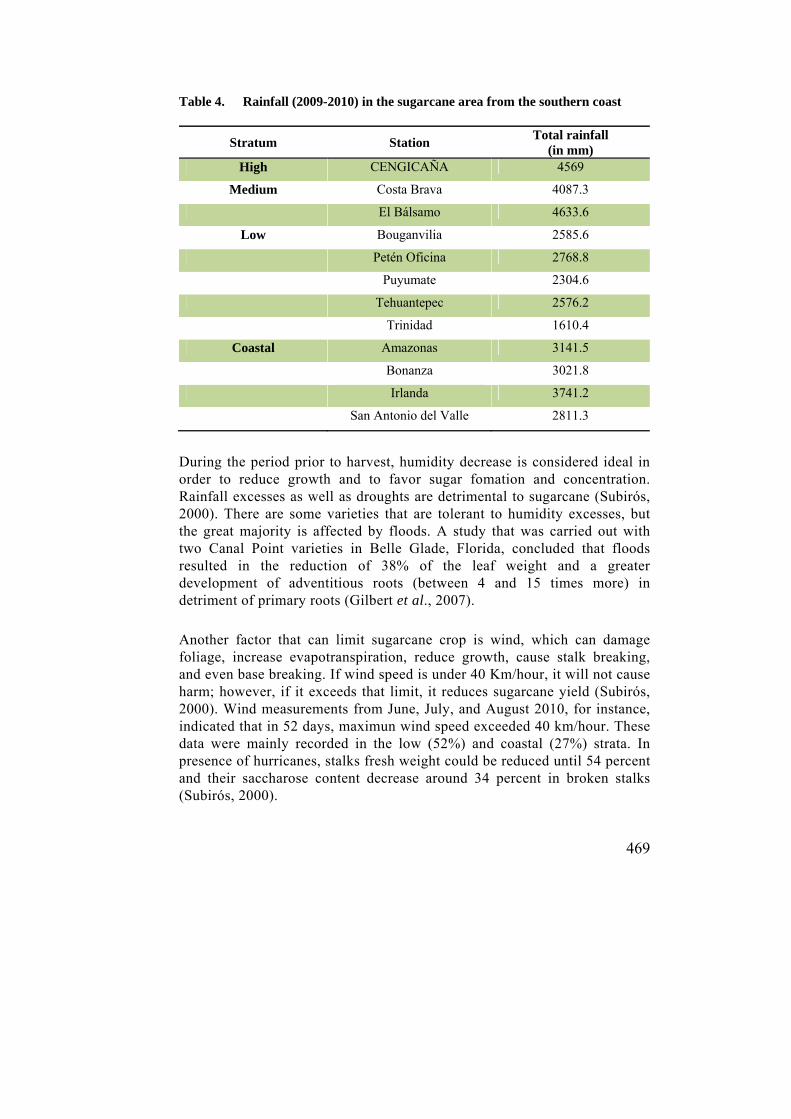
469
Table 4. Rainfall (2009-2010) in the sugarcane area from the southern coast
Stratum Station Total rainfall
(in mm) High CENGICAÑA 4569
Medium Costa Brava 4087.3
El Bálsamo 4633.6
Low Bouganvilia 2585.6
Petén Oficina 2768.8
Puyumate 2304.6
Tehuantepec 2576.2
Trinidad 1610.4
Coastal Amazonas 3141.5
Bonanza 3021.8
Irlanda 3741.2
San Antonio del Valle 2811.3
During the period prior to harvest, humidity decrease is considered ideal in order to reduce growth and to favor sugar fomation and concentration. Rainfall excesses as well as droughts are detrimental to sugarcane (Subirós, 2000). There are some varieties that are tolerant to humidity excesses, but the great majority is affected by floods. A study that was carried out with two Canal Point varieties in Belle Glade, Florida, concluded that floods resulted in the reduction of 38% of the leaf weight and a greater development of adventitious roots (between 4 and 15 times more) in detriment of primary roots (Gilbert et al., 2007).
Another factor that can limit sugarcane crop is wind, which can damage foliage, increase evapotranspiration, reduce growth, cause stalk breaking, and even base breaking. If wind speed is under 40 Km/hour, it will not cause harm; however, if it exceeds that limit, it reduces sugarcane yield (Subirós, 2000). Wind measurements from June, July, and August 2010, for instance, indicated that in 52 days, maximun wind speed exceeded 40 km/hour. These data were mainly recorded in the low (52%) and coastal (27%) strata. In presence of hurricanes, stalks fresh weight could be reduced until 54 percent and their saccharose content decrease around 34 percent in broken stalks (Subirós, 2000).
470
Extreme events effect in production An extreme rainfall event can be climatologically defined as being the one that occurs in one of the extremes of the climatological frequency distribution, and the choice of a limit value can be arbitrary and even subjective (Marengo et al., 2004). According to the IPCC glossary (2001a), an event that is rare in a certain place and station, is called an extreme event (Ex. an extreme event can come out of the 10 or 90 percentile). Extremes vary from one place to another; therefore, what can be defined as extreme in a specific area, in another can be usual. Extreme events cannot be solely claimed to climate change, for they can happen naturally, however, climate change is expected to increase their ocurrence. Conducted studies in Australia have shown that anomalous heavy rainfalls in a certain season of the year, are followed by sugarcane yields below normal in the next harvest (Kuhnel, 1993). In Viti Levu island, changes in rainfall regimes could entail agricultural losses valued in 14 million dollars. The former is due to an 8 percent reduction of rainfall that would affect most crops on that island and especially sugarcane, which is very sensitive to droughts. Taking into account the above-mentioned information, an approximately 9% drop in sugarcane production could be expected by 2050; and, until 50 percent of production could be lost every four years (World Bank, 2000), caused by “El Niño” phenomena. Madre Tierra sugar mill provided data revealing that heavy precipitations during the rainy season which include those provoked by Agatha, Alex, and Matthew storms, in the 2010-2011 harvest season, greatly affected the sugarcane crop production. For five production areas, rainfall of almost 2000 mm caused yield reduction of 10 to 28 percent compared to 2009-2010 harvest season. In other locations rainfall exceeded 3000 mm (Madre Tierra sugar mill, 2011). In 2005, tropical storm Stan caused damages and losses in agricultural and livestock areas of 15 departments, amongst them Retalhuleu and Escuintla. Besides economic losses, natural phenomena damages are derived into environmental actives like soil, vegetation, and water. The first effects result from changes in environmental services. Subsequently, effects lie in natural capital restoration or recovery so that it can return to its original state (or to a similar one). Among the ones that could affect surgacane crop directly or indirectly, are: loss of agricultural soils due to hydric erosion, sediment dragging, and alteration in natural drainage systems. Soil loss by erosion due to Stan equaled 12.7 percent from annual erosion (CEPAL and Segeplan, 2005).
471
Future climate and the sugarcane crop Worldwide, one of the unknowns of greater concern is the way climate change will demonstrate itself. On the one hand, there is global warming, which concerns change in mean temperature of the whole planet and is known to be different everywhere (IPCC, 2007). Until this moment, a greater increment temperature in polar areas (high latitudes) and on top of mountains (high altitudes) has been observed. It is very likely that the trend will continue in the future (ibid.). On the other hand, climate change manifests itsef through other variables such as rainfall, wind, solar radiation, and electrical activity. The greatest concern lies on precipitation due to changes that can happen in annual quantities, intensity and temporality, among other variables. Study of future climate is eminently based on simulation models. Comprehension and information on the global climatic system have been used to create computer based models. These show changes in the system, in different scenarios of greenhouse gases concentrations, which depend on used energy sources, created technological options, land management and, in general, development model that humanity pursues. This is why usually results from different future scenarios are presented simultaneously. Regarding models, the trend has started from the global (Global Circulation Models) to regional and local ones. These last ones are the hardest to achieve and are the ones where efforts are being put on. There are 22 most used global circulation models. At a country level the Primera Comunicación Nacional sobre Cambio Climático (First National Communication on Climate Change), was published. The study began in 1998 and included an analysis on climatic, socioeconomic, and environmental future scenarios which allowed assessing vulnerability of several important sectors of the country to climate change (Castellanos and Guerra, 2009). This was a result of the commitment that the country acquired after signing the United Nations Framework Convention on Climate Change (UNFCCC), when it was created in 1992 and that was ratified in 1995. For the historic climatic analysis, the study was based on records from 1960 to 1990 from the stations network of the National Institute of Seismology, Vulcanology, Meteorology and Hydrology (INSIVUMEH for its acronym in Spanish). To describe future climate behavior in Guatemala, three GHG emissions scenarios produced by the IPCC were used (IS92a, IS92c y IS92e). The three scenarios were chosen because they take into account medium, low
472
and high climatic sensibilities, respectively, and a wide range of global warming forecasts based on GHG increase (MARN, 2001). To assess impacts that may happen due to weather changes, five scenarios were identified. They covered the range of possible future situations: a humid scenario of little change; a humid scenario of great change; a dry scenario of little change; a dry scenario of great change, and a scenario of no change.2 According to the study, all scenarios are consistent when indicating an increase in temperature between 0.5 and 4 degrees for 2050. It is foreseen that temperature increase will be reflected in all months and not in some months more than others. For rainfall, scenarios show that there could be a decrease in the trimester from July to September, which entails an intensification of the Dog Days period (MARN, 2001). There have been other attempts of future climate projections in Guatemala, especially in terms of temperature and rainfall. The weakness is however that they are based on information which resolution does not capture detail level that requires the climatic variability of the country resulting from its rough orography. Despite the above-mentioned, they represent departure points in which improvements can be looked for. Figures 2 to 5 show one of these exercises and they are based in 15 climatic models of the 22 that composed the assemblage used by the Intergovernmental Panel of Experts on Climate Change for the Fourth Assessment (McSweeney et al., 2009). Values are expressed as abnomalies from the mean climate of the period 1970-1999. Regarding to annual rainfall, the trend slightly decreases until the 2060 decade, and it would only diminish around 20 percent until the end of the century, especially in the northeast part of the country (see Figure 2). These results are similar to executed projections by Sáenz-Romero et al. (2010). Trimester focus assessment contributes to more specific information. In Figure 3 in the March-May trimester, which is a keystone because it is the season with higher irrigation water demand, rainfall decrease emphasizes. The figure indicates that decreases around 40 percent could be expected in the northeast and east region of Guatemala. Extreme events, given as an example in Figure 4, show little and non significant increase when compared to magnitude of rainfall maximum events in one day.
2 Consult the document on the Primera Comunicación Nacional sobre Cambio Climático (First National Communication on Climate Change) (MARN, 2001) to learn about the scenarios making process and the assumptions on which they are based.

473
Figure 2. Percentage changes of annual rainfall
(Source: McSweeney, 2010 in Guerra-Noriega, 2010).
Figure 3. Rainfall percentage changes in March-May trimester (Source: McSweeney,
2010 in Guerra-Noriega, 2010).
Figure 4. Increase in maximum annual rainfall in 24 hours
(Source: McSweeney, 2010 in Guerra-Noriega, 2010).

474
Figure 5. Climate change severity indexes until the decade 2020 (Source: Anderson et
al., 2008 quoted in Ligorría, 2009).
The Ministry of Environment and Natural Resources (MARN for its acronym in Spanish) conducted a series of studies related to vulnerability and adaptation to climate change in Guatemala. Temperature and rainfall behaviors focused on 2050 were investigated, considering the scenarios A2 (medium to high emissions) and B2 (low to medium emissions) (MARN, 2007). Studies focused in the Naranjo river watershed in San Marcos and in the subwatershed of San José river, in Chiquimula and Jutiapa. Among the most relevant findings are: 1) In the intermediate and high parts of the Naranjo river watershed, under both scenarios, rainfall tends to decrease in the first months of the rainy season and in October it becomes more rainy: 2) There is no defined trend in the low part of the Naranjo river watershed, because it rises in some months and decreases in others: 3) Temperature increases in general, but between 0.3 and 0.8 degrees for both minimum and maximum temperature. In the sub-watershed of San José river, main findings are: 1) Under both scenarios, rainfall tends to increase from May to July and to decrease from July to September in the medium part of the sub-watershed: 2) In the high part of the sub-watershed, rainfall increases in all months in one location (La Ceibita) while in other (Asunción Mita), it is expected to increase from May to October under B2 scenario (MARN, 2007a). These study cases could show that it is possible for temperature change to be a little greater in dry areas of the country.
Climatechange severity index
Outside the comfort zone
Far outside of the comfort zone
Pressure on the comfort zone limits
Variation to significant changes during the year
Low severitty
Close to significant changes
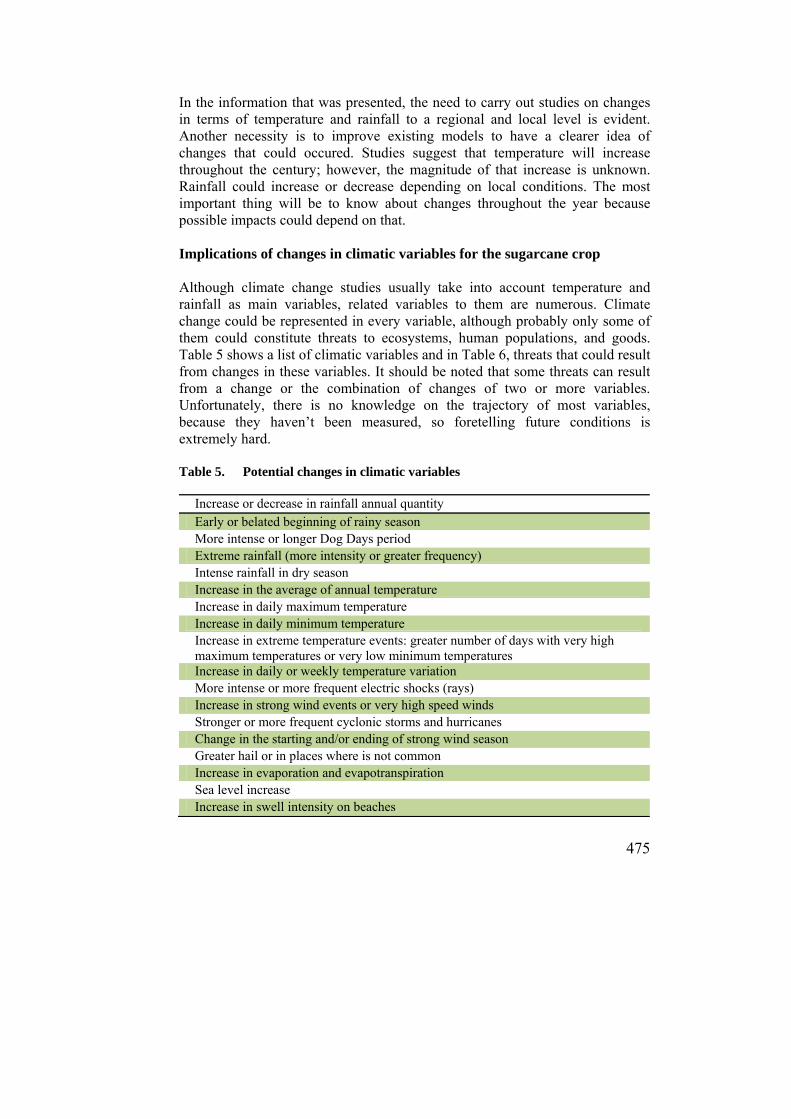
475
In the information that was presented, the need to carry out studies on changes in terms of temperature and rainfall to a regional and local level is evident. Another necessity is to improve existing models to have a clearer idea of changes that could occured. Studies suggest that temperature will increase throughout the century; however, the magnitude of that increase is unknown. Rainfall could increase or decrease depending on local conditions. The most important thing will be to know about changes throughout the year because possible impacts could depend on that. Implications of changes in climatic variables for the sugarcane crop Although climate change studies usually take into account temperature and rainfall as main variables, related variables to them are numerous. Climate change could be represented in every variable, although probably only some of them could constitute threats to ecosystems, human populations, and goods. Table 5 shows a list of climatic variables and in Table 6, threats that could result from changes in these variables. It should be noted that some threats can result from a change or the combination of changes of two or more variables. Unfortunately, there is no knowledge on the trajectory of most variables, because they haven’t been measured, so foretelling future conditions is extremely hard. Table 5. Potential changes in climatic variables
Increase or decrease in rainfall annual quantity Early or belated beginning of rainy season More intense or longer Dog Days period Extreme rainfall (more intensity or greater frequency) Intense rainfall in dry season Increase in the average of annual temperature Increase in daily maximum temperature Increase in daily minimum temperature Increase in extreme temperature events: greater number of days with very high maximum temperatures or very low minimum temperatures Increase in daily or weekly temperature variation More intense or more frequent electric shocks (rays) Increase in strong wind events or very high speed winds Stronger or more frequent cyclonic storms and hurricanes Change in the starting and/or ending of strong wind season Greater hail or in places where is not common Increase in evaporation and evapotranspiration Sea level increase Increase in swell intensity on beaches
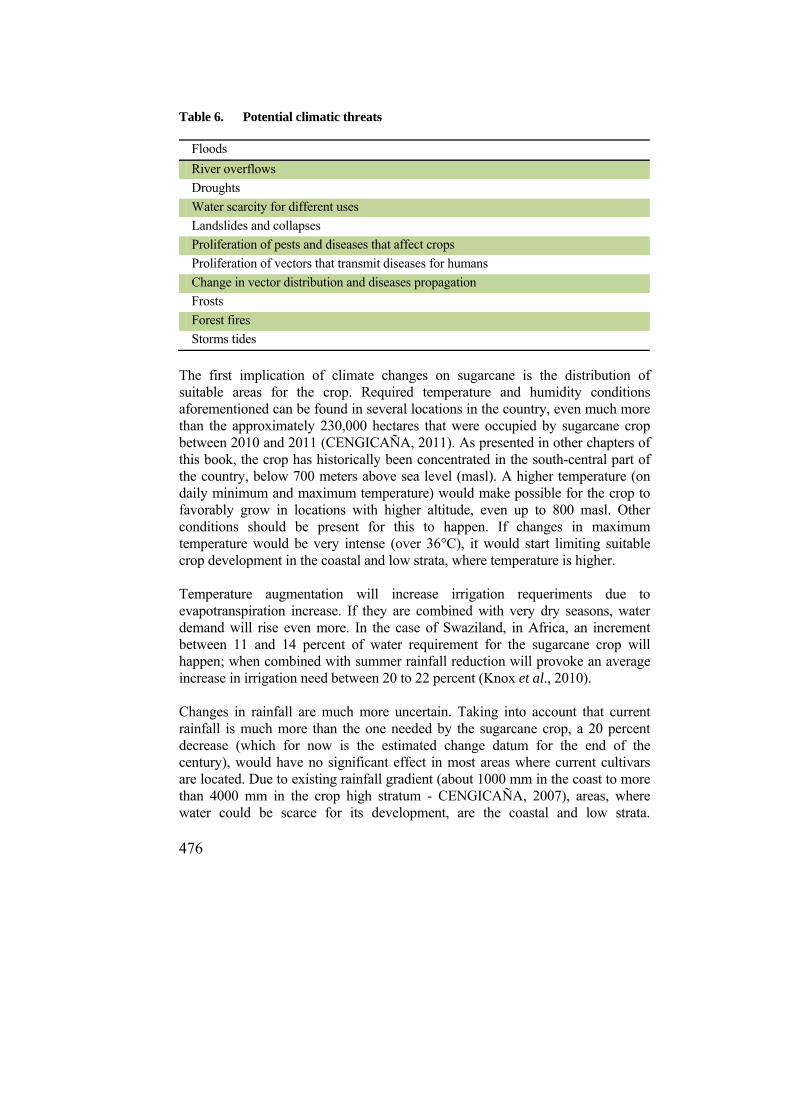
476
Table 6. Potential climatic threats
Floods
River overflows
Droughts
Water scarcity for different uses
Landslides and collapses
Proliferation of pests and diseases that affect crops
Proliferation of vectors that transmit diseases for humans
Change in vector distribution and diseases propagation
Frosts
Forest fires
Storms tides
The first implication of climate changes on sugarcane is the distribution of suitable areas for the crop. Required temperature and humidity conditions aforementioned can be found in several locations in the country, even much more than the approximately 230,000 hectares that were occupied by sugarcane crop between 2010 and 2011 (CENGICAÑA, 2011). As presented in other chapters of this book, the crop has historically been concentrated in the south-central part of the country, below 700 meters above sea level (masl). A higher temperature (on daily minimum and maximum temperature) would make possible for the crop to favorably grow in locations with higher altitude, even up to 800 masl. Other conditions should be present for this to happen. If changes in maximum temperature would be very intense (over 36°C), it would start limiting suitable crop development in the coastal and low strata, where temperature is higher. Temperature augmentation will increase irrigation requeriments due to evapotranspiration increase. If they are combined with very dry seasons, water demand will rise even more. In the case of Swaziland, in Africa, an increment between 11 and 14 percent of water requirement for the sugarcane crop will happen; when combined with summer rainfall reduction will provoke an average increase in irrigation need between 20 to 22 percent (Knox et al., 2010). Changes in rainfall are much more uncertain. Taking into account that current rainfall is much more than the one needed by the sugarcane crop, a 20 percent decrease (which for now is the estimated change datum for the end of the century), would have no significant effect in most areas where current cultivars are located. Due to existing rainfall gradient (about 1000 mm in the coast to more than 4000 mm in the crop high stratum - CENGICAÑA, 2007), areas, where water could be scarce for its development, are the coastal and low strata.

477
Longitudinally, there is also a gradient in which rainfall increases from southeast to southwest; so the southeast could be potentially affected due to the general decrease in annual rainfall. How changes present themselves on a monthly basis will be more relevant. Although the panorama is still uncertain, in some places that have been evaluated, as seen in studies of MARN (2007), decrease in rainfall could be stronger for the March-May trimester, while in the September-November trimester, there could be even an increase. Some estimations on production impact with regards to possible changes in rainfall have been made for sugarcane in Belize. Sugarcane crop in Belize is located in the northern part of the country (Santos and García, 2008), where rainfall regime is similar to low and coastal rainfall strata regimes of sugarcane in Guatemala. A reduction of 12 percent in rainfall would not influence yield during the first three growth stages. However, for the fourth stage a reduction of 55 percent has been calculated, this would cause a decrease in total harvest of 11.9 percent (ibid.). On the other hand, an increase of 12 percent in annual rainfall would influence in a reduction of 4.5 percent in harvest. With rainfall decrease of 20 percent projected for 2050, sugarcane production would be reduced in 17.4 percent (ibid.). Related to precipitation, rainfall extreme events are a concern subject. They can cause serious damage to sugar cultivars, transportation, processing, and marketing. For instance, Fiji Islands, a country that greatly depends on sugar, has been considerably affected by climatic events. Droughts and tropical cyclones have caused losses of over 50 percent of the production in years like 1997, 1998, and 2003 (Gawander, 2007). Although there is uncertainty in the scenarios, it has been mentioned that rainfall extreme events will increase (IPCC, 2000); (Jiménez and Girot, 2002) and for Central America and the north of South America, increases have already been recorded (Aguilar et al., 2005). Existing projections, as already shown, say little about extreme events and, for now, they point out at minimum increases. There are combined effects from climatic and atmospheric future conditions for sugarcane. Yields can increase because of higher temperatures, greater solar radiation, and also greater CO2 concentration in the atmosphere. In the case of Swaziland, the first two are minimal (less than 5%), while the increase due to a greater CO2 concentration (in A2 scenario) has been calculated in 15 percent of sucrose production (Knox et al., 2010). According to Downing et al. (1997) when CO2 concentration in the atmosphere is doubled, an increase in water use efficiency can reach even 50 percent, with greater effects in C3 metabolic pathway plants. On sugarcane, it is expected that such effect be lower because it is a C4 metabolic pathway plant, which is less efficient in water use (Knox et al.,
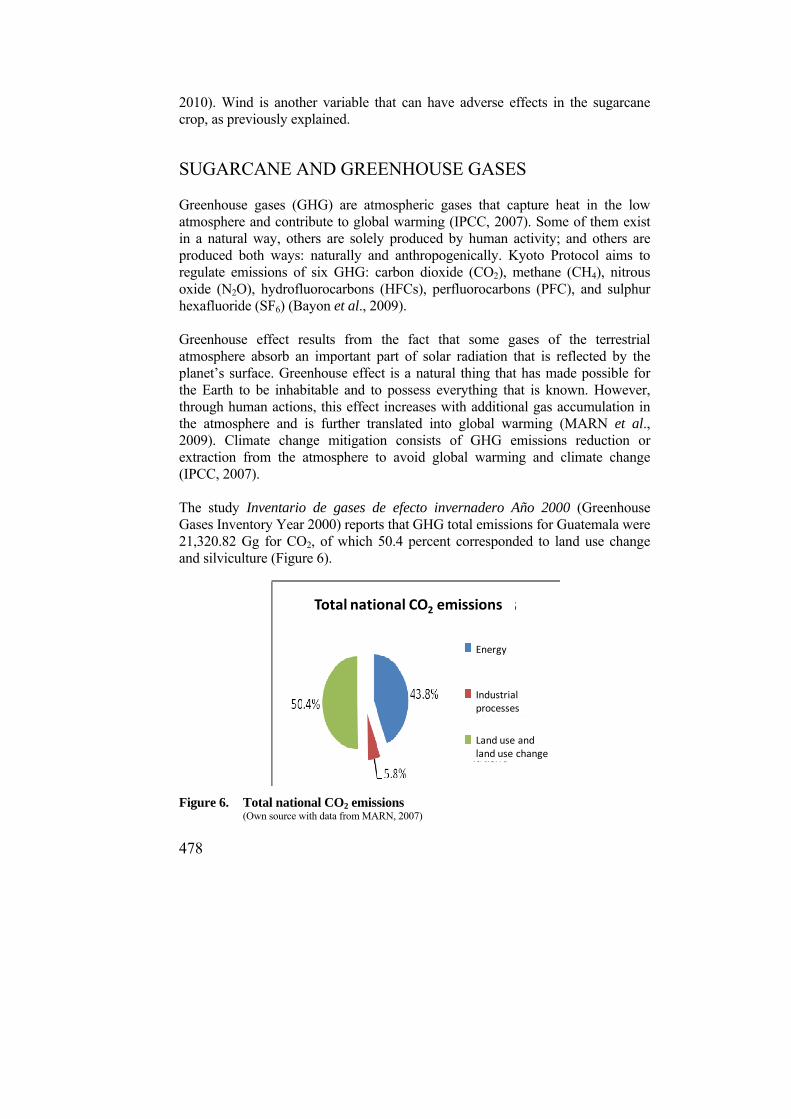
478
2010). Wind is another variable that can have adverse effects in the sugarcane crop, as previously explained.
SUGARCANE AND GREENHOUSE GASES Greenhouse gases (GHG) are atmospheric gases that capture heat in the low atmosphere and contribute to global warming (IPCC, 2007). Some of them exist in a natural way, others are solely produced by human activity; and others are produced both ways: naturally and anthropogenically. Kyoto Protocol aims to regulate emissions of six GHG: carbon dioxide (CO2), methane (CH4), nitrous oxide (N2O), hydrofluorocarbons (HFCs), perfluorocarbons (PFC), and sulphur hexafluoride (SF6) (Bayon et al., 2009). Greenhouse effect results from the fact that some gases of the terrestrial atmosphere absorb an important part of solar radiation that is reflected by the planet’s surface. Greenhouse effect is a natural thing that has made possible for the Earth to be inhabitable and to possess everything that is known. However, through human actions, this effect increases with additional gas accumulation in the atmosphere and is further translated into global warming (MARN et al., 2009). Climate change mitigation consists of GHG emissions reduction or extraction from the atmosphere to avoid global warming and climate change (IPCC, 2007). The study Inventario de gases de efecto invernadero Año 2000 (Greenhouse Gases Inventory Year 2000) reports that GHG total emissions for Guatemala were 21,320.82 Gg for CO2, of which 50.4 percent corresponded to land use change and silviculture (Figure 6).
Figure 6. Total national CO2 emissions (Own source with data from MARN, 2007)
Energy
Total national CO2 emissions
Industrial processes
Land use and land use change
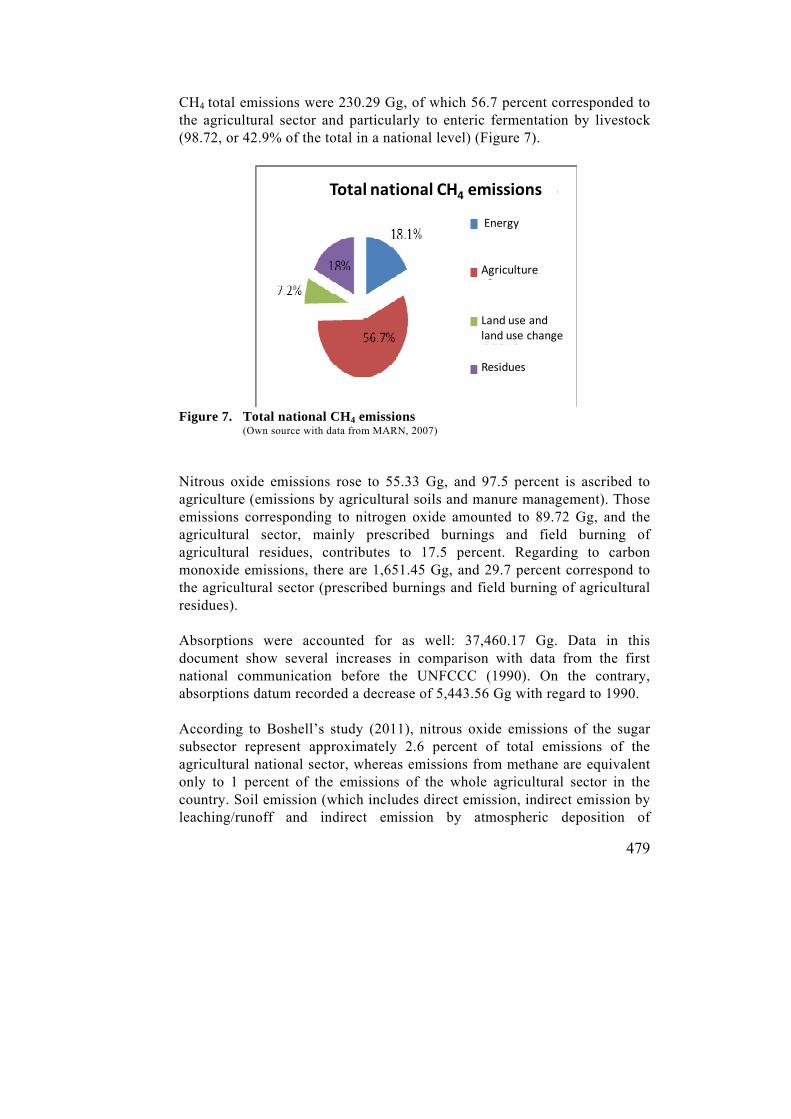
479
CH4 total emissions were 230.29 Gg, of which 56.7 percent corresponded to the agricultural sector and particularly to enteric fermentation by livestock (98.72, or 42.9% of the total in a national level) (Figure 7).
Figure 7. Total national CH4 emissions
(Own source with data from MARN, 2007)
Nitrous oxide emissions rose to 55.33 Gg, and 97.5 percent is ascribed to agriculture (emissions by agricultural soils and manure management). Those emissions corresponding to nitrogen oxide amounted to 89.72 Gg, and the agricultural sector, mainly prescribed burnings and field burning of agricultural residues, contributes to 17.5 percent. Regarding to carbon monoxide emissions, there are 1,651.45 Gg, and 29.7 percent correspond to the agricultural sector (prescribed burnings and field burning of agricultural residues). Absorptions were accounted for as well: 37,460.17 Gg. Data in this document show several increases in comparison with data from the first national communication before the UNFCCC (1990). On the contrary, absorptions datum recorded a decrease of 5,443.56 Gg with regard to 1990. According to Boshell’s study (2011), nitrous oxide emissions of the sugar subsector represent approximately 2.6 percent of total emissions of the agricultural national sector, whereas emissions from methane are equivalent only to 1 percent of the emissions of the whole agricultural sector in the country. Soil emission (which includes direct emission, indirect emission by leaching/runoff and indirect emission by atmospheric deposition of
Total national CH4 emissions
Agriculture
Energy
Land use and land use change
Residues
480
volatilized N), exceeds emission due to burning for all sugar mills. Values of total emissions for each sugar mill vary proportionally with cultivated and harvested area, harvest form (mechanized) and fertilization programme: approximately 400 t CO2eq/year to almost 50,000 t CO2eq/year. Total emissions for the Guatemalan sugar subsector are less than 1 Gg for nitrogen dioxide and approximately 4 Gg for methane, which are equivalent to less than 300,000 t CO2eq/year. The Colombian Sugarcane Growers Association, ASOCAÑA (for its acronym in Spanish), uses the following information: every hectare of sugarcane sown land produces and releases 40 tonnes of oxygen to the atmosphere, and removes 60 of carbon dioxide. In 230,000 ha cultivated with sugarcane in Guatemala, the sugar subsector would be releasing nearly 9.2 million tonnes of oxygen, removing at the same time 13.8 million tonnes of carbon dioxide for a net capture of 4.6 million tonnes. This information requires deeper investigation through specific measurements of field and factory CO2 emissions; however, it provides a foundation on which to perfect exact quantities. Climate change mitigation opportunities Among the proposed measures for greenhouse effect gases mitigation actions, are the ones described in Table 7. These measures could be considered to access different financing mechanisms in the international carbon market; especially the voluntary one, which is characterized for being an alternative for voluntary buyers, others than the regulated market buyers (under the UNFCCC regulations). Among the actions for the sugar industry, are fossil fuels substitution by biofuels (biodiesel and bioethanol) considering its use as much as its production; reduction of mineral fertilizers use for a more efficient one and/or replacement by biofertilizers (also produced internally); gasification of bagasse and sugarcane residues and greater bioelectricity generation (cogeneration) (Olivério et al., 2010; Thomas and Davies, 2010). Carbon capture can also be accomplished through lignine and its corresponding mineral lignite (Thomas and Davies, 2010). Many of the measures have already been adopted by the Sugarcane Agroindustry worldwide, and also in Guatemala.
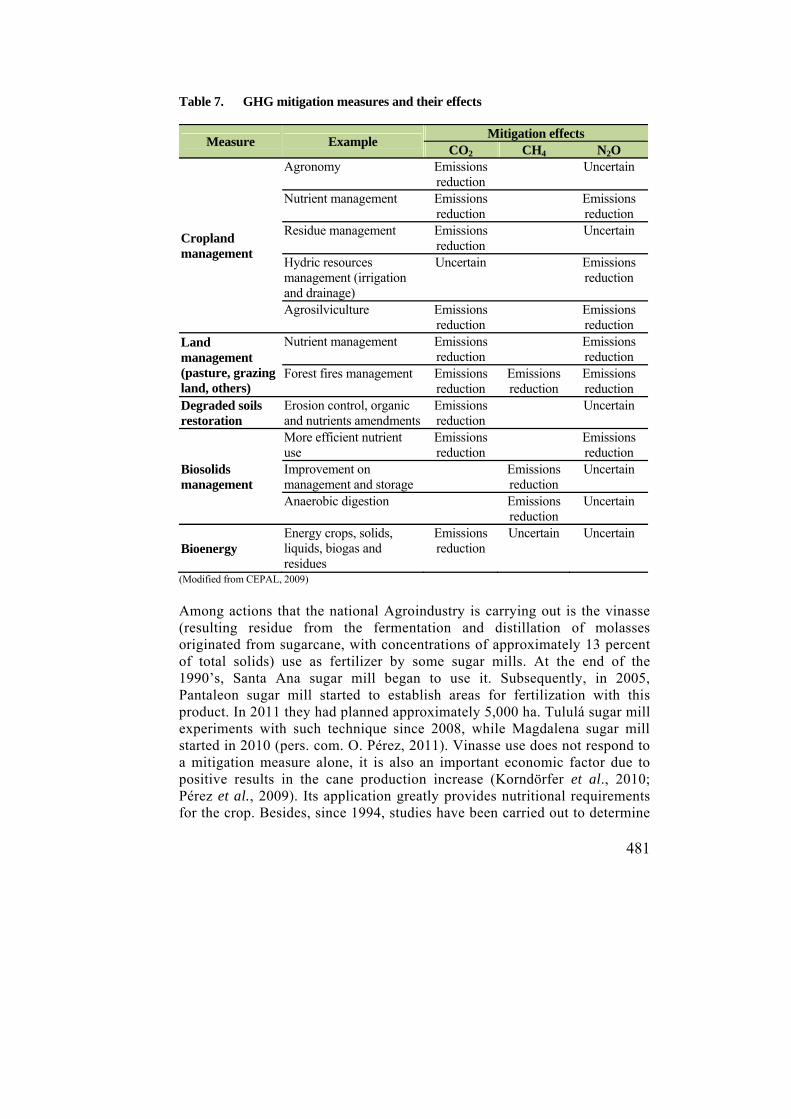
481
Table 7. GHG mitigation measures and their effects
Measure Example Mitigation effects
CO2 CH4 N2O
Cropland management
Agronomy Emissions reduction
Uncertain
Nutrient management Emissions reduction
Emissions reduction
Residue management Emissions reduction
Uncertain
Hydric resources management (irrigation and drainage)
Uncertain Emissions reduction
Agrosilviculture Emissions reduction
Emissions reduction
Land management (pasture, grazing land, others)
Nutrient management Emissions reduction
Emissions reduction
Forest fires management Emissions reduction
Emissions reduction
Emissions reduction
Degraded soils restoration
Erosion control, organic and nutrients amendments
Emissions reduction
Uncertain
Biosolids management
More efficient nutrient use
Emissions reduction
Emissions reduction
Improvement on management and storage
Emissions reduction
Uncertain
Anaerobic digestion Emissions reduction
Uncertain
Bioenergy Energy crops, solids, liquids, biogas and residues
Emissions reduction
Uncertain Uncertain
(Modified from CEPAL, 2009)
Among actions that the national Agroindustry is carrying out is the vinasse (resulting residue from the fermentation and distillation of molasses originated from sugarcane, with concentrations of approximately 13 percent of total solids) use as fertilizer by some sugar mills. At the end of the 1990’s, Santa Ana sugar mill began to use it. Subsequently, in 2005, Pantaleon sugar mill started to establish areas for fertilization with this product. In 2011 they had planned approximately 5,000 ha. Tululá sugar mill experiments with such technique since 2008, while Magdalena sugar mill started in 2010 (pers. com. O. Pérez, 2011). Vinasse use does not respond to a mitigation measure alone, it is also an important economic factor due to positive results in the cane production increase (Korndörfer et al., 2010; Pérez et al., 2009). Its application greatly provides nutritional requirements for the crop. Besides, since 1994, studies have been carried out to determine
482
fertilization recommendations with different nutrients, among them nitrogen, phosphorus, and potassium. Research results and analysis have allowed to recommend the needed dosage of nutrients and, consequently, of fertilizers for the different phases of the sugarcane crop. This has influenced in the decrease of used fertilizers quantities (Pérez, 2002). Many executed field tests have allowed, among other aspects, validation of irrigation programmes under specific soil conditions in the sugarcane area of the southern coast (Castro et al., 2009). Methodologies to measure energy efficiency under diverse irrigation methods, have also been assessed. This has concluded with the determination of a series of recommendations for field implementation (Castro and Sandoval, 2009). Likewise, results from other studies have revealed that irrigation programmes are a tool for this activity planning because they vary depending on texture class, phenological stage, and the used irrigation system type (Castro et al., 2010). Research results in Cuba have informed that burning 1 ha of sugarcane releases 24.3 Mg of CO2 annually to the atmosphere and, if this is compared with the crop sequestration capacity (defined in 60 Mg or tonnes of CO2 by ASOCAÑA), it turns out to be non significant (Cabrera and Zuaznábar, 2010). It has been demonstrated that carbon emission to the atmosphere by means of burning of a part of aerial biomass is lower to carbon capture, so the balance favors capture (ibid.). In spite of the previous thing, mechanized harvest (non-burnt) is considered as another option to reduce CO2 emissions. This technique mainly adapts in slopes lower than 12 percent. Also the return of crop residues into the soil surface has been verified to indirectly favor organic matter accumulation and gases emission reduction when it is compared to burnings (Cerri et al., 2007). Nowadays, most sugar mills have experimented with this technique in a range of 5 to 17 percent of cultivated area surface. During harvest season 2006-2007, Palo Gordo sugar mill used combined harvesters to work 16 percent of the area; whereas Tululá sugar mill harvested 17 percent. Santa Ana, La Unión-Los Tarros, and Magdalena sugar mills harvested 2099, 4000, and 8932 ha, respectively (CENGICAÑA, 2008). Most recent data indicate that mechanized harvest is between 10 and 15 percent of cultivated area. Since 1994, the cogeneration project using sugarcane bagasse by means of the subscription of an energy and power provision contract, which included six sugar mills, has started. In order to permanently satisfy the interconnected national system demand, bagasse is combined with fossil fuels (bunker) to produce energy (Vila, 2003). Thanks to this, sugarcane bagasse dumping to river banks or its open-sky disposition has been avoided, and at the same time it has represented a decrease on fossil fuels
483
usage. During harvest seasons 2007/2008 and 2008/2009, 97 percent of the energy has been produced through bagasse. Bunker consumption went from almost 18,900 gallons in harvest season 1997/1998 to nearly 3,700 gallons in harvest season 2008/2009. Sugar mills cogeneration has increased in almost 6 percent of the energy production for the National Electrical System, going from 14.54 percent in 2003/2004 to 20.59 percent in 2008/2009 (CENGICAÑA, 2009). Now he interest in investigating energy sugarcane varieties arises: however they should preserve necessary sugar properties such as fiber, to keep or even increase cultivated areas with such variety as in other countries like Australia, Barbados, and the United States (Falla and Melgar, 2010). To the date, the agroindustry has contributed with over 9,800 reforested hectares with different forest species (pines, teak, eucalypts, rubber, mahogany, cedar, fruit trees, and native species, among others) with several objectives: energy, timber, latex production, as natural reserve, watershed protection as well as other research trials (Pers. com. Environmental Management ASAZGUA, 2011). These forest plantations have also contributed to carbon sequestration. One of the opportunitites can emerge from the change in the agricultural soils management, since it is possible to reduce and/or eliminate carbon release from fertility loss, as well as to sequestrate carbon through increasing organic matter levels and promoting a rational use of fertilizers. Change to conservation agriculture systems, as well as the adequate fertilization management, will bring mitigation and adaptation opportunities because, in both cases, inputs use is optimized, an additional income is generated, and medium to long term benefits are obtained. For example, related to land degradation and crop adaptability facing current changes (PNUD, 2009). The use of fertilizers with lower potential of greenhouse gases emission should be further investigated. Up to the moment, it is known that urease and nitrification inhibitors have shown potential to increase soil retention and to improve applied N recovery by plants, but little is known on the impact in the reduction of N2O total emissions. It has been demonstrated that slow, controlled and stabilized release fertilizers, reduce losses due to drainage and by atmospheric emissions. This could suggest that they could be effective in reducing short-term emissions. However, lack of simultaneous measurements on the three greenhouse gases over extensive time periods in agricultural and environmental studies is a critical challenge. An adequate fertilization can contribute with soil organic matter (SOM) increase or to reduce SOM loss rate. Factors such as the implementation of strategies of crop residues management, minimize net global warming potential (Snyder et al., 2008).
484
Other opportunity lies on phytoliths, epidermal cellular structures with silica on leaves and stalks that occlude carbon (Parr et al., 2009). Organic carbon content can be considerable: 5 to 5.8 percent of carbon content has been extracted from oat flakes (Parr and Sullivan, 2005). Measuring occluded carbon fraction in these structures could allow quantification of this element before it is added to the soil. True grasses phytoliths are particularly efficient in occluding carbon, and some studies have demonstrated that sugarcane is particularly efficient in that sense (Parr et al., 2009). Another advantage that has been verified is that occluded carbon in phytoliths is very resistant to oxidation (Parr and Sullivan, 2005). A range between 0.12 and 0.36 t e-CO2 (ha-year)-1 of occluded carbon by phytoliths has been observed in sugarcane under specific environmental conditions (Parr et al., 2009). This carbon can be a key component of soil organic carbon and its accumulation would represent an important process in terrestrial sequestration of soil carbon (Parr and Sullivan, 2005). Based on previous findings, the possibility of including the content of occluded carbon in phytoliths in sugarcane variety combinations, should be considered as a desirable feature too (Parr et al., 2009).
SUGARCANE ADAPTATION TO CLIMATE CHANGE Adaptation to climate change The term adaptation can be understood as the arrangements in a system’s behavior and characteristics that increase its aptitude to bear external pressures (Brooks, 2003). For climate change, adaptation has been defined as “an adjustment in ecological, social or economic systems in response to expected or observed changes on weather and its effects to ease adverse impact of such change or to take advantage of new opportunities” (Adger et al., 2005); (IPCC, 2001b). Towards the end of the 20Xth century, adaptation didn’t have much relevance because it was thought that pulling attention and resources to the subject, would mean setting aside the reduction of emissions from gases that cause climate change (Pielke et al., 2007). However, adaptation has gained importance and it is considered as an alternative or complementary strategy for mitigating this change (Pielke et al., 2007; Smit et al., 2000). Different adaptation definitions have in common that they mention changes in a system in response to climatic stimuli; however, they also present variations. These are related to application and context. Some, as for its application, refer to climate change while others do to climatic variability; adaptation could be the response to adverse effects, vulnerabilities or
485
opportunities. There are variations too, regarding to whom or what has to adapt, as they could be social and economic sectors, ecological systems with or without management, or practices, processes or structure systems. Adaptation can also be passive, reactive or preventive (Smit et al., 2000). Many societies, institutions and individuals, have modified their behavior in response to past climate changes and others are considering adapting to future climatic alterations. Part of this adaptation is reactive, since it responds to past or current events, but it is also preventive because it is based on future conditions assessments. Adaptation is composed of individual, group, and governmental actions. Among the factors that can drive adaptation are: economic well-being protection and improvement of both, individual and community security (Adger et al., 2005). It is commonly thought, that population in developing countries is not passive victimes, but in the past they have shown stronger resilience3 to droughts, floods, and other catastrophes (Adger et al., 2003). One way to look for adaptation options, is taking the analogous approach, which consists in considering case studies of past responses to variability and climatic extremes (temporary analogies), or present behavior in regions with climatic conditions similar to those that might take place in the region of interest (spatial analogies) (Adger et al., 2003). Most adaptation in developing countries will depend on past experiences on how to cope with climate related risks. Like that, a great part of the adaptation of farmers, fishermen, coast inhabitants, and residents of great metropolis, will be autonomous and facilitated by its own resources and social capital (Adger et al., 2003). Sugarcane adaptation to climate change Many adaptation options can be considered for the sugar industry, both in the field and in the factory. However, most climate impacts could happen in the field and they would influence in a lower productivity, so the greatest adaptation potential is in that area (SRDC, 2007). Table 8 shows different recommended measures for climate change adaptation. Most of them have been realized, or are in process inside the Guatemalan Sugar Agroindustry; although not necessarily with the objective to tackle climate change, but without a doubt they increase its resilience.
3 Resilience: Ability of ecosystems to absorb disturbances without significantly affecting characteristics of structure and ways of functioning. Another definition is the aptitude that ecosystems have to return to their former state after it has been disturbed.

486
Table 8. Adaptation options for the sugarcane crop
Production area Adaptation options
Field
To move forward sowing season to fit in changes in minimum temperatures
To implement a longer harvest season to capitalize minimum temperatures increases
To consider sugarcane sowing in other seasons of the year Increase irrigation water existence through:
• Investment in irrigation infrastructure • Increase of supplementary water use through
irrigation • Installation of water storage infrastructure inside the
cultivars • Use and development of sugarcane varieties that will
be more efficient in water use and that will better resist droughts
• Greater efficiency in irrigation technologies • Greater use of other irrigation technologies (Ex.central
pivots) Sugarcane varieties adapted to local conditions To consider pests management strategies in areas with
climatic conditions similar to those in the future Search of greater efficiency in cutting operations To increase efficiency in transportation operations Improvement on soil drainage in heavy rainy seasons Staff continuous training to implement changes in crop
management according to new requirements Soil conservation Crop diversification Agricultural insurances Improvement of information and climate forecasts
Factory
To continue with improvement of milling efficiency Energy efficiency Several or alternative energy sources Decrease in water use Water re-use Assessment of disaster risk in the mill and measures to
reduce it Contingency plans for sugarcane transportation towards the
mill and then of the produced sugar (including alternative roads)
Source: Own production that includes inputs from SRDC (2007), Santos and García (2008), CATHALAC/PNUD/GEF (2008) and Gbetibouo and Hassan (2005).
487
THE PRIVATE INSTITUTE FOR CLIMATE CHANGE RESEARCH (ICC): facing climate change through science This is the institution founded by the Guatemalan sugar sector to face challenges that climate represents, both in the present and in the future. Its purpose is the development of research programmes and projects promotion that contribute to vulnerability reduction, climate change mitigation and adaptation in communities, productive systems, infrastructure, and services. Its foundation responds as well, to an identified need of the country to have an institution that collaborates with generation of essential information for mitigation and adaptation to climate change activities. The geographical action area of the Institute is initially the Guatemalan southern coast and related watersheds; although afterwards it will be able to work in other areas of Guatemala and Central America according to the arisen needs and opportunities. The ICC seeks to work in alliance with other institutions from the public and private sector to join efforts that help the country. This is visualized for research development and for implementation of actions that contribute to mitigate and adapt to climate change. An essential element that the Institute aims to invest in is capacity building from the professional level to the community one. A great part of the impact that will be achieved will depend on the internalization degree of people knowledge and skills inside companies, institutions or communities. In spite of occupying only 2.1 percent of the country’s territory, the actions of the Guatemalan sugar sector as regards to climate change, can generate an important impact at the national level. The Institute seeks to identify actions that have already been set in place; and that directly contribute to climate change mitigation and adaptation in order to promote them both inside and outside the Sugar Agroindustry. Besides that, it has the mission to create and to drive new actions that are based in technical and scientific guidelines. An example of actions that have influenced on climate change mitigation, is the reduction of fossil fuels use to produce electricity, that is now widely produced from sugarcane bagasse, which meet not only the energy needs of the sugar mills, but also contributes to the national network with the surplus. Most of CENGICAÑA’s work has contributed to having indirectly worked on climate change mitigation and adaptation; and this represents an investment example that provides to the long-term sustainability of the Agroindustry.

488
Research and action lines: valuable opportunities After checking the existing conditions on climate change in Guatemala and its relation with the sugarcane crop, the need to develop research is evident according to national and local conditions. Information and basic knowledge is required on the country’s climatic systems, in order to understand in a better way, how they work nowadays and, as a departure point, to know possible effects of future climate change. That is why the Climate and Hydrology Research Programme has been created for, which is in charge of information generation above all, carrying out analysis that will provide inputs for planning and setting in motion actions, especially for climate change adaptation. One research challenge is modelling development that simulate influence of climatic conditions in growth, development and productivity of the sugarcane crop. Studies have already been conducted with the agroecological areas model, which have proved to have a good precision to estimate potential productivity. The Ecosystems Research Programme tackles climate change mitigation and adaptation in forests and agricultural crops. In mitigation, the Programme has the purpose of studying actions and technology for the GHG emissions reduction, as well as assessing and creating strategies to preserve existing vegetal coverage and to recover it in strategic places. In this context, the estimation of CO2 emissions from agricultural lands will be tackled. The investigation will begin with soil organic carbon reserves, using the following variables: carbon concentration, bulk density, autochthonous vegetation, and soil type. These studies will facilitate improving sugarcane crop GHG inventories. On the mid-term there will be an emissions inventory of all industry related to sugarcane, including its culture and also electric energy production (cogeneration with biomass), ethanol production, sugar transportation, and other activities that are not only reducing local contamination, but are greatly contributing to climate change mitigation. Some aforementioned researches will be carried out jointly with staff of the different programmes of CENGICAÑA. One of the potential projects is to observe behavior of different pests and diseases that attack sugarcane crop face to climate change effects. A pilot programme on soil health could also begin in order to determine humidity and water availability and to continue like that with precision agriculture, as well as with other improvements for the efficiency of the hydric resource use and irrigation technology.
489
The ICC has two programmes addressed to the promotion or implementation of actions that contribute to climate change mitigation and adaptation. One of them is the Integrated Watershed Management Programme, and the other is the Disaster Risk Management Programme. They both seek to influence within the sugar sector as well as other priority actors in the working area, such as municipalities and communities. The Institute fifth programme is rather transversal to the other four, for it focuses in building capacity and dissemination. These activities are essential for actions promoted by the Institute to be set in place and for its impact to be significant. Specifically for the sugar crop and climate change case, working in research and development of the following topics, will be essential (based in SRDC, 2007). It could be carried out by the Institute, CENGICAÑA or the sugar mills themselves, although ideally it should be a joint work: • Soil health (soil humidity retention, reduced erosivity, nutrient retention) • Precision agriculture • Water availability (superficial and underground) • Improvement of the irrigation technology and the water use efficiency • Opportunities for greater water availability (collecting, storage, supply
and reuse) • Implications of the sea level increase (for the coastal area) • Seasonal and risk forecasts • Biofuels opportunities along the value chain • Industry footprint (to account Sugar Agroindustry contributions on GHG
emissions) A part of the work of the ICC will be to optimize climate change related actions that are already in motion and to promote them in all sugar mills. These actions can become a national role model, while promoting that other industries and sectors will follow the same steps. There is great improvement potential that will benefit the sugar sector, nearby communities and authorities, as the sum of global efforts in order to avoid that climate changes reach dangerous levels and harm population. There is a valuable opportunity in getting on with it and that the Guatemalan Sugar Agroindustry is an example at a regional and worldwide level.
490
BIBLIOGRAPHY 1. Adger, N.; Arnell, N. and Tompkins, E. 2005. Successful adaptation to
climate change across scales. Global Environmental Change 15 (2005) 77–86.
2. Adger, N.; Huq, S.; Brown, K.; Conwaya, D. and Hulme M. 2003.
Adaptation to climate change in the developing world. Progress in Development Studies (3) pp.179–195.
3. Aguilar, E. et al. 2005. Changes in precipitation and temperature extremes
in Central America and northern South America, 1961-2003. Journal of Geophysical Research 110: 1-15.
4. Aguilar, J. et al. 2009. Boletín Estadístico. Recopilación de la información
de los simposios de análisis de la zafra 1997/98-2008/09. Área de cogeneración. Año 10, No.2. Guatemala, CENGICAÑA.
5. Banco Mundial/ Unidad de País de Papuasia Nueva Guinea y las Islas del
Pacífico. 2000. Impact of Climate Change on a High Island Viti Levu, Fiji (Chapter 3) In Cities, Seas and Storms: Managing Change in Pacific Island economies, Vol IV: Adapting to Climate Change. Washington, D.C., USA. http://siteresources.worldbank.org/INTPACIFICISLANDS/Resources/4-Chapter+3.pdf
6. Bayon, R.; Hawn, A. and Hamilton, K. 2009. Voluntary Carbon Markets:
An International Business Guide to What They Are and How They Work. 2a ed. Earthscan. Londres. 160p.
7. Boshell, J. F. 2011. Informe final del Inventario de Emisiones de Gases de
Efecto Invernadero del Subsector de la Caña de Azúcar de Guatemala. (Versión preliminar). Guatemala.
8. Brooks, N. 2003. Vulnerability, Risk and Adaptation: A conceptual
framework. Norwich: Tyndall Centre for Climate Change Research. Working Paper 38.
9. Cabrera, J. A.; Zuaznábar R. 2010. Impacto sobre el ambiente del
monocultivo de la caña de azúcar con el uso de la quema para la cosecha y la fertilización nitrogenada. Cultivos tropicales 31(1); 5-13. Instituto Nacional de Ciencias Agrícolas (INCA), La Habana, Cuba.
491
10. Castellanos, E.; Guerra, A. 2009. El cambio climático y sus efectos sobre el desarrollo humano en Guatemala. Cuadernos de desarrollo humano 2007/2008. Elaborado para el Programa de las Naciones Unidas para el Desarrollo, Guatemala. 51 p.
11. Castro Loarca, O. R.; Ramírez, C.; Martínez, A.; Sánchez, M.; Celada, C.
2009. Validación de Programas de Riego pre-corte en diferentes condiciones de suelo en la zona cañera de Guatemala. In: Memoria. Presentación de resultados de investigación. Zafra 2008-2009. Guatemala, CENGICAÑA. pp. 188-197.
12. Castro Loarca, O. R.; Sandoval, J. 2009. La medición de la eficiencia
energética en el riego presurizado: una descripción de metodologías y recomendaciones para su implementación en el campo. In: Memoria. Presentación de resultados de investigación. Zafra 2008-2009. Guatemala, CENGICAÑA. pp. 198-206.
13. Castro Loarca, O. R.; Veliz, E.; Esquit V. 2010. Programación del riego
según la relación: agua-suelo-caña de azúcar-clima. Una herramienta técnica para planificar el riego y responder a las interrogantes: ¿Cuánto y cuándo regar? In: Memoria. Presentación de resultados de investigación. Zafra 2009-2010. Guatemala, CENGICAÑA. pp. 249-255.
14. CATHALAC/PNUD/GEF. 2008. Fomento de las capacidades para la etapa
II de adaptación al cambio climático en Centroamérica, México y Cuba. Síntesis regional. Ciudad de Panamá. 36 p.
15. CENGICAÑA. 2010. Memoria. Presentación de resultados de
investigación. Zafra 2009-2010. Guatemala, CENGICAÑA. 442 p. 16. Comisión Económica para América Latina y el Caribe-CEPAL. 2009.
Cambio climático y desarrollo en América Latina y el Caribe: una reseña. Naciones Unidas, Santiago de Chile. 148 p.
17. Comisión Económica para América Latina y el Caribe-CEPAL. 2010. La
economía del cambio climático. Síntesis 2010. Naciones Unidas, Santiago de Chile. 113 p.
18. Comisión Económica para América Latina y el Caribe-CEPAL/Secretaría
de Planificación y Programación –SEGEPLAN. 2005. Efectos en Guatemala de las lluvias torrenciales y la tormenta tropical Stan, Octubre de 2005. 212 p.
492
19. Downing, T. E.; Ringius, L.; Hulme, M. and Waughray, D. 1997. Adapting to climate change in Africa: prospects and guidelines. Mitigation and Adaptation Strategies for Global Change 2: 19–44.
20. Falla, C.; Melgar M. 2010. Situación actual de las investigaciones en caña
energética a nivel mundial. In: Memoria. Presentación de resultados de investigación. Zafra 2009-2010. Guatemala, CENGICAÑA. pp. 133-142.
21. Gawander, J. 2007. Las consecuencias del cambio climático sobre los
cultivos de caña de azúcar en Fiji. Boletín de la OMM 65 (1): 34-39. 22. Gbetibouo, G. A.; Hassan R. M. 2005. Measuring the economic impact of
climate change on major South African field crops: a Ricardian approach. Global and Planetary Change 47: 143–152.
23. Gilbert, R. A.; Rainbolt, C. R.; Morris, D. R.; Bennett A.C. 2007.
Morphological responses of sugarcane to long-term flooding. Agronomy Journal 99: 1622-1628.
24. Gouvêa, J. R. F.; Sentelhas, P .C.; Gazzola, S. T.; Cabral Santos M. 2009.
Climate changes and technological advances: impacts on sugarcarne productivity in tropical Southern Brazil. Sci. Agric. (Piracicaba, Braz.), 66 (5): 593-605.
25. Guerra-Noriega, A. 2010. Climate-related Disaster Risk in Mountain Areas:
the Guatemalan highlands at the start of the 21st Century. Tesis doctoral, Universidad de Oxford, Inglaterra. 287 p.
26. Ingenio Madre Tierra. Comunicación personal y Presentaciones realizadas
para reunión de Análisis de Merma de Producción 2010-2011. 29 de abril de 2011. Auditorio CENGICAÑA. Santa Lucía Cotzumalguapa, Escuintla, Guatemala.
27. IPCC. 2007. “Summary for Policymakers”. En “Climate Change 2007: The
Physical Science Basis. Contribution of Working Group I to the Fourth Assessment Report of the Intergovernmental Panel on Climate Change”. (S. Solomon, D. Qin, M. Manning, Z. Chen, M. Marquis, K.B. Averyt, M. Tignor y H.L. Miller, eds.). Cambridge University Press, Cambridge y Nueva York.
28. IPCC. 2001a. Climate Change 2001: Synthesis Report. A Contribution of
Working Groups I,II, and III to the Third Assessment Report of the Intergovernmental Panel on Climate Change. [Watson, R.T. Watson and the Core Writing Team (eds.)]. Cambridge University Press, Cambridge, United Kingdom and New York, NY, USA.
493
29. IPCC. 2001b. Overview of Impacts, Adaptation and Vulnerability to Climate Change. En Climate Change 2001: Impacts, Adaptation and Vulnerability, editado por S. Schneider and J. Sarukhan: Intergovernmental Panel on Climate Change.
30. IPCC. 2000. América Latina. En Impactos regionales del cambio climático:
evaluación de la vulnerabilidad, editado por O. Canziani y S. Díaz: Inter Governmental Panel on Climate Change.
31. Jiménez, A.; Girot, P. 2002. Marco de adaptación al cambio climático para
los recursos hídricos en Centro América. San José: Sistema de Integración Centro Americana, Unión Mundial para la Conservación de la Naturaleza y Global Water Partnership.
32. Knox, J. W.; Rodríguez, Díaz, J. A.; Nixon, D. J.; Mkhwanazi, M. 2010. A
preliminary assessment of climate change impacts on sugarcane in Swaziland. Agricultural Systems 103: 63–72.
33. Korndörfer, G. H.; Nolla, A.; Gama, A. J. M. 2010. Manejo, aplicación y
valor fertilizante de la vinaza para caña de azúcar y otros cultivos. 23-28 p. En www.tecnicana.org
34. Kuhnel, I. 1993. Impacts of extreme climatic conditions on sugar cane
production in Northeastern Australia. En Extreme Hydrological Events: Precipitation, Floods and Droughts (Proceedings of the Yokohama Symposium, July 1993) 213: 157-163.
35. Ligorría, J. P. 2009. Evaluación sobre el cambio climático y vulnerabilidad
socioambiental de Guatemala. Insumo para el Informe del Estado Ambiental de Guatemala. 60 p.
36. Manejo Ambiental de ASAZGUA. 2011. Comunicación personal. Guatemala, C.A.
37. Marengo, J. A.; Menéndez, A.; Guetter, A.; Hogue, T.; Mechoso, C.R.
2004. Caracterización y evaluación de métodos de predicción de eventos extremos de clima y de la hidrología en la Cuenca del Plata. En: Predicción Hidroclimática, Componente 2a: Definición del Sistema de Predicción Hidroclimática Subcomponente 2a4 Tema 3 Eventos Hidrometeorológicos Extremos. FMAM/PNUMA/OEA/FONPLATA/OMM.
38. Meneses, A.; Melgar, M.; Posadas, W. 2008. Boletín Estadístico.
Recopilación de la información de los simposios de análisis de la zafra 1990/91-2006/2007. Área de Campo. Año 9, No.2. Guatemala, CENGICAÑA.
494
39. Meneses, B. 2011. Comunicación personal. Guatemala, C.A. 40. Ministerio de Ambiente y Recursos Naturales-MARN/ Universidad Rafael
Landívar –URL/ Instituto de Agricultura, Recursos Naturales y Ambiente –IARNA/ Programa de las Naciones Unidas para el Medio Ambiente –PNUMA. 2009. Informe Ambiental del Estado de Guatemala GEO Guatemala 2009. Guatemala. 277 p.
41. Ministerio de Ambiente y Recursos Naturales-MARN/Fondo para el Medio
Ambiente Mundial -GEF/Programa de las Naciones Unidas para el Desarrollo –PNUD. 2001. Inventario de Gases de Efecto Invernadero Año Base 1990. Guatemala. 10 p.
42. Ministerio de Ambiente y Recursos Naturales-MARN/Programa Nacional
de Cambio Climático. 2007. Resumen Inventario de Gases de Efecto Invernadero año 2000 Versión Preliminar. Guatemala. 17 p.
43. Olivério, J. L.; Carmo, V. B.; Gurgel, M. A. 2010. The DSM –Dedini
Sustainable Mill: A new concept in designing complete sugarcane mills. In Proceedings of the International Society of Sugar Cane Technologists –ISSCT. Vol 27: 1-34.
44. Parr, J.; Sullivan, L.; Quirk, R. 2009. Sugarcane phytoliths: Encapsulation
and sequestration of a long-lived carbon fraction. Sugar Tech 11(1); 17-21. 45. Parr, J. F.; Sullivan, L. A. 2005. Soil carbon sequestration in phytoliths. Soil
Biology & Biochemistry 37: 117-124. 46. Pérez, O. 2002. Nutrición y fertilización de caña de azúcar en Guatemala.
Boletín Técnico Informativo, año 10, No.1: 3-8. Guatemala. 47. Pérez, O. 2011. Comunicación personal. CENGICAÑA, Guatemala. 48. Pérez, O.; López, A.; Hernández, F.; Ralda, G. 2009. Evaluación de las
aplicaciones continuadas de vinaza en el cultivo de caña de azúcar y su efecto en un suelo Andisol de Guatemala. In: Memoria. Presentación de resultados de investigación. Zafra 2008-2009. Guatemala, CENGICAÑA. pp. 173-181.
49. Pielke, R. Jr.; Prins, G.; Rayner, S. and Sarewitz, D. 2007. Lifting the taboo
on adaptation. Nature 445 (2007) 597-598.
495
50. Programa de las Naciones Unidas para el Desarrollo. 2009. Documento de Discusión Nacional acerca de los Asuntos Claves en el Análisis del Sector Agricultura (Mitigación). Bogotá, Colombia. http://www.pnud.org.co/img_upload/61626461626434343535373737353535/CAMBIOCLIMATICO/3.%20Memorias%20Di%C3%A1logo%20Nacional%20Interministerial%20sobre%20cambio%20clim%C3%A1tico%20en%20el%20sector%20agropecuario/2DocdiscusionAgriculturayMitigacionColombia.pdf
51. Sáenz-Romero, C.; Rehfeldt, G. E.; Crookston, N. L.; Duval, P.; St-Amant R.;
Beaulieu, J.; Richardson, B.A. 2010. Spline models of contemporary, 2030, 2060 and 2090 climates for Mexico and their use in understanding climate-change impacts on the vegetation. Climatic Change 102: 595–623.
52. Santos, C.; García, S. 2008. Climate Change Vulnerability and Adaptation
Assessment for Sugarcane and Citrus. Belize Second National Communication Project, Final Report. City of Belmopan. 54 p.
53. Smit, B.; Burton, I.; Klein, R. J. T.; Wandel, J. 2000. An anatomy of adaptation
to climate change and variability. Climatic Change 45: 223–251. 54. Snyder, C.; Bruulsema, T.; Jensen, T. 2008. Mejores prácticas de manejo para
minimizar las emisiones de gases de efecto invernadero asociadas con el uso de los fertilizantes. Informaciones Agronómicas del Cono Sur. 40: 7-10. Argentina.
55. SRDC. 2007. Climate Change and the Australian Sugarcane Industry: Impacts,
adaptation and R&D opportunities. Sugar Research and Development Corporation, Australian Government. Brisbane. 45p.
56. Suárez, A.; Meneses, A.; Melgar, M. 2007. Evolución de la producción y
productividad de la Agroindustria Azucarera y mapas generales de la zona cañera de la Costa Sur de la República de Guatemala. Guatemala. 20 p.
57. Subirós, F. 2000. El cultivo de la caña de azúcar. Editorial Universidad Estatal
a Distancia, San José, Costa Rica. 58. Thomas, G.; Davies, W.A. 2010. Carbon captura with sugarcane technology. In
Proceedings of the Australian Society of Sugar Cane Technologists –ASSCT. Vol. 32: 588-599.
59. Vila, A. 2003. El impacto social de la Agroindustria Azucarera en Guatemala.
Tesis Lic. Administración de Empresas. Universidad Francisco Marroquín, Guatemala. 46 p.

CENGICAÑA Alcance del Sistema de Gestión de la Calidad ISO 9001:2008 “Investigación y Desarrollo de Variedades de Caña de Azúcar y Tecnologías en Manejo Integrado de Plagas, Fertilización, Riegos y Capacitación para la Agroindustria Azucarera”. OTROS PROGRAMAS Y ÁREAS: Transferencia de Tecnología Análisis de Productividad (campo y fábrica) Programa de Investigación Industrial Malezas y Madurantes Biotecnología Detección de Patógenos en Semilleros Servicios Analíticos de Laboratorio Sistema de Información para Agricultura de Precisión Servicio de Información y Documentación de la Caña de Azúcar