bird’s-eye view of a-shares helps capture china’s
TRANSCRIPT
Important Information1. The Fund invests primarily (at least 70%) in equity securities issued in the People’s Republic of China (“PRC”) including but not limited to China A-Shares listed on the PRC stock exchanges (e.g. Shanghai Stock Exchange and Shenzhen Stock Exchange). The Fund may also
invest in derivative for investment and hedging purposes.2. The Fund is therefore exposed to risks related to equity, emerging markets, concentration, smaller companies, PRC tax, liquidity and derivatives. The Fund has exposure to the China A-Share market via the Shanghai-Hong Kong Stock Connect and/or Shenzhen-Hong Kong
Stock Connect (collectively, the “China Connect”) and/or Qualified Foreign Investor (“QFI”) status. Investors will be subject to the risks associated with QFI, China market, application of QFI rules, RMB currency, China Connect and investments in stocks listed on the Small and Medium Enterprise Board and/or the ChiNext Board of the Shenzhen Stock Exchange and/or the Science and Technology Innovation Board of the Shanghai Stock Exchange risks. RMB is currently not freely convertible and RMB convertibility from o�shore RMB (CNH) to onshore RMB (CNY) is a managed currency process subject to foreign exchange control policies of and restrictions imposed by the Chinese government. There can be no assurance that RMB will not be subject to devaluation at some point.
3. Investors may be subject to substantial losses.4. Investors should not solely rely on this document to make any investment decision.
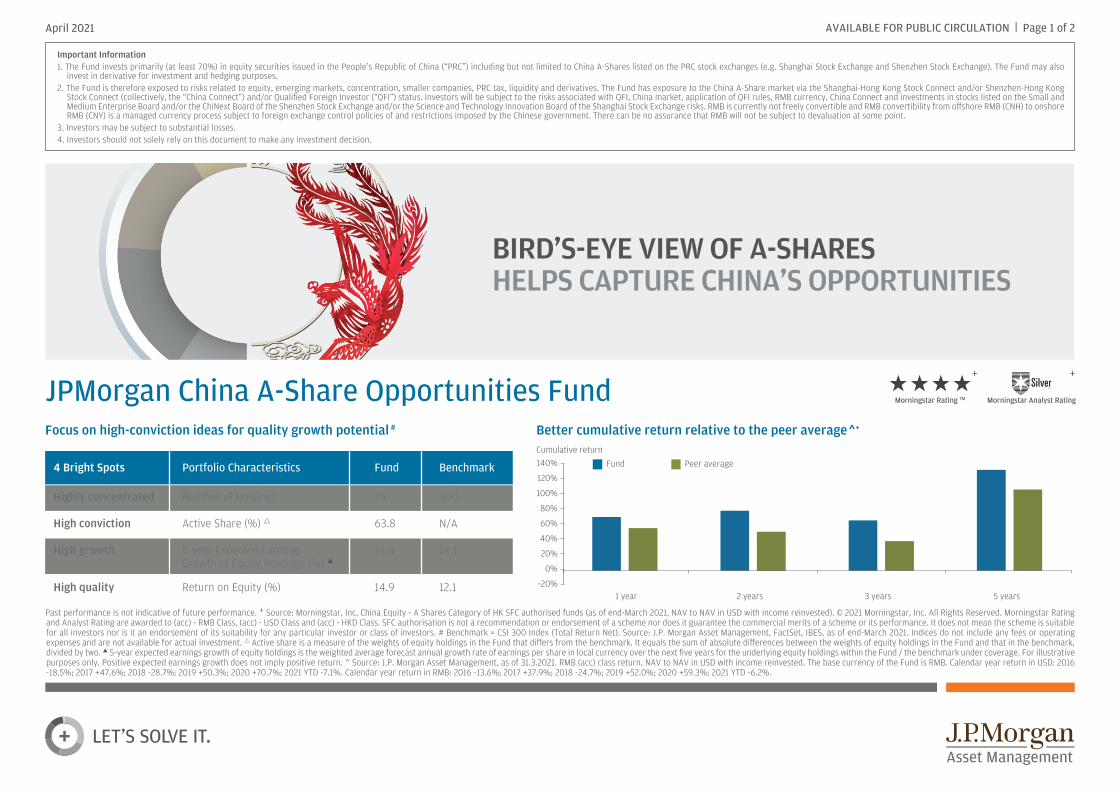
Better cumulative return relative to the peer average ^+Focus on high-conviction ideas for quality growth potential #
JPMorgan China A-Share Opportunities Fund
FundCumulative return
Peer average
Morningstar Rating TM
+
Morningstar Analyst Rating
+
4 Bright Spots Portfolio Characteristics Fund Benchmark
Highly concentrated Number of Holdings 75 300
High conviction Active Share (%) 63.8 N/A
High growth 5-year Expected Earnings 19.8 14.1 Growth of Equity Holdings (%)
High quality Return on Equity (%) 14.9 12.1
AVAILABLE FOR PUBLIC CIRCULATION | Page 1 of 2April 2021
BIRD’S-EYE VIEW OF A-SHARESHELPS CAPTURE CHINA’S OPPORTUNITIES
1 year 2 years 3 years 5 years
Past performance is not indicative of future performance. + Source: Morningstar, Inc, China Equity - A Shares Category of HK SFC authorised funds (as of end-March 2021, NAV to NAV in USD with income reinvested). © 2021 Morningstar, Inc. All Rights Reserved. Morningstar Rating and Analyst Rating are awarded to (acc) - RMB Class, (acc) - USD Class and (acc) - HKD Class. SFC authorisation is not a recommendation or endorsement of a scheme nor does it guarantee the commercial merits of a scheme or its performance. It does not mean the scheme is suitable for all investors nor is it an endorsement of its suitability for any particular investor or class of investors. # Benchmark = CSI 300 Index (Total Return Net). Source: J.P. Morgan Asset Management, FactSet, IBES, as of end-March 2021. Indices do not include any fees or operating expenses and are not available for actual investment. Active share is a measure of the weights of equity holdings in the Fund that di�ers from the benchmark. It equals the sum of absolute di�erences between the weights of equity holdings in the Fund and that in the benchmark, divided by two. 5-year expected earnings growth of equity holdings is the weighted average forecast annual growth rate of earnings per share in local currency over the next five years for the underlying equity holdings within the Fund / the benchmark under coverage. For illustrative purposes only. Positive expected earnings growth does not imply positive return. ^ Source: J.P. Morgan Asset Management, as of 31.3.2021. RMB (acc) class return, NAV to NAV in USD with income reinvested. The base currency of the Fund is RMB. Calendar year return in USD: 2016 -18.5%; 2017 +47.6%; 2018 -28.7%; 2019 +50.3%; 2020 +70.7%; 2021 YTD -7.1%. Calendar year return in RMB: 2016 -13.6%; 2017 +37.9%; 2018 -24.7%; 2019 +52.0%; 2020 +59.3%; 2021 YTD -6.2%.
-20%
0%
20%
40%
60%
80%
120%
100%
140%

JPMorgan China A-Share Opportunities FundPositioned towards China’s structural growth opportunities
Images are for illustrative purposes only. The opinions and views expressed here are those held by the author as at the date of this document, which are subject to change and are not to be taken as or construed as investment advice. Forecasts, projections and other forward looking statements are based upon current beliefs and expectations. They are for illustrative purposes only and serve as an indication of what may occur. Given the inherent uncertainties and risks associated with forecast, projections or other forward statements, actual events, results or performance may di�er materially from those reflected or contemplated. The Fund is an actively managed portfolio; holdings, sector weights, allocations and leverage, as applicable are subject to change at the discretion of the Investment Manager without notice. Unless stated otherwise, all information is sourced from J.P. Morgan Asset Management, as of end-March 2021. The information contained in this document does not constitute investment advice, or an o�er to sell, or a solicitation of an o�er to buy any security, investment product or service. Informational sources are considered reliable but you should conduct your own verification of information contained herein. Investment involves risk. Past performance is not indicative of future performance. Please refer to the o�ering document(s) for details, including the risk factors. This document has not been reviewed by the SFC. Issued by JPMorgan Funds (Asia) Limited.
10.0% Consumer Discretionary
5.5% Materials
0.2% Net Liquidity
20.0% Information Technology
13.5% Health Care
13.3% Industrials
19.3% Financials
18.1% Consumer Staples
Cloud infrastructure and semiconductors benefitting from growth drivers like 5G technology rollout support and rising demand for greater e�ciency
Digitalisation and import substitution trends opening up opportunities for software development and data centres
Social distancing measures have spurred demand for technology; the awareness for cybersecurity should push forward the sector’s developmentTechnology
>RMB 429 billion2023’s expected size of China’s public cloud market RMB 30 billion in 2017Source: J.P. Morgan estimates, Bloomberg, J.P. Morgan Asset Management, as of end-June 2020.
Rising household income driving demand for goods and services of higher quality
Industry leaders within consumer staples such as condiments, snacks and dairy products to benefit from further industry consolidationConsumption
>RMB 298 billion2023’s expected market size of condiments in China~RMB 128.2 billion in 2013
Source: World Bank, HSBC, company data, J.P. Morgan Asset Management, as of end-May 2019.
AVAILABLE FOR PUBLIC CIRCULATION | Page 2 of 2April 2021
Sector breakdown
Contract research and manufacturing organisations benefitting from outsourcing trends in R&D
Innovative pharmaceuticals reaping rewards from long-term R&D investments; hospitals and medical equipment companies benefitting from rising healthcare spending
Demand for vaccines, diagnostic and testing equipment and other related products bolstered amid public health crisis, potentially driving market penetration in the long runHealthcare
RMB 9.2 billion2021’s expected market size ofChina’s biologics outsourcing servicesRMB 2.1 billion in 2016
R&D: research and development. Source: PWC, Frost & Sullivan, company data, J.P. Morgan Asset Management, as of end-May 2019.