what can you tell me about the bird’s motion?
DESCRIPTION
What can you tell me about the bird’s motion?. What would the d vs t graph look like?. What about changes in velocity?. - PowerPoint PPT PresentationTRANSCRIPT
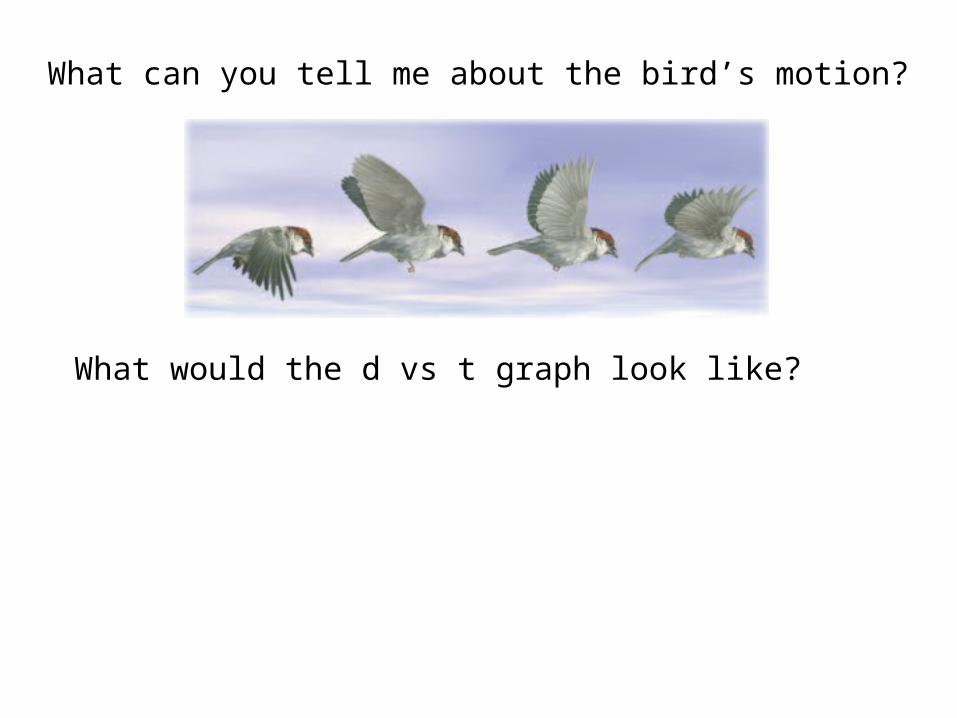
What can you tell me about the bird’s motion?
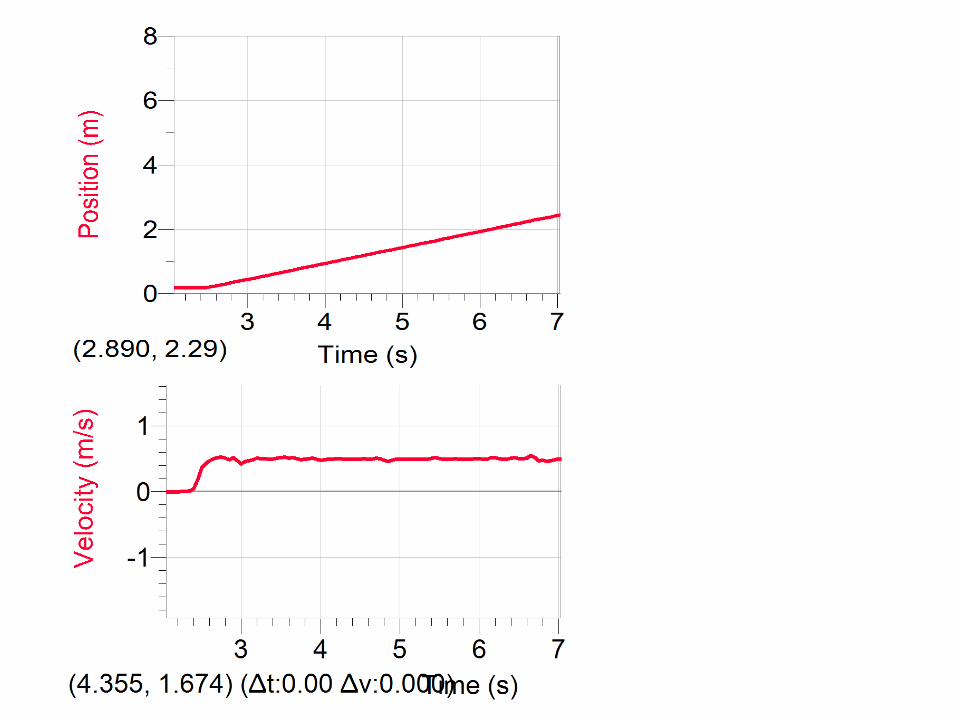
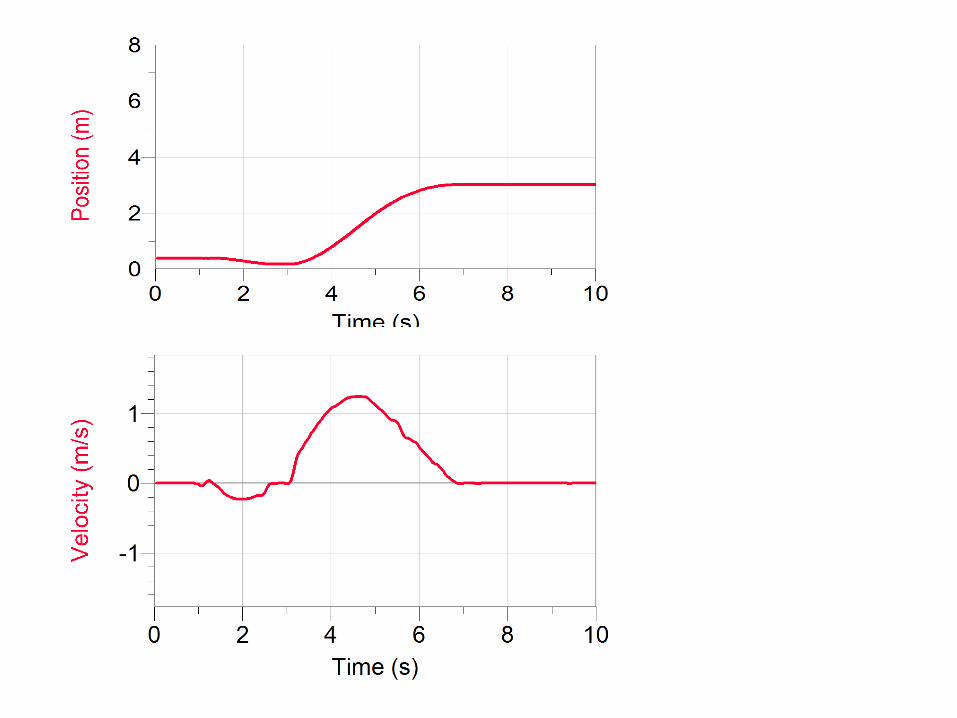
What would the d vs t graph look like?
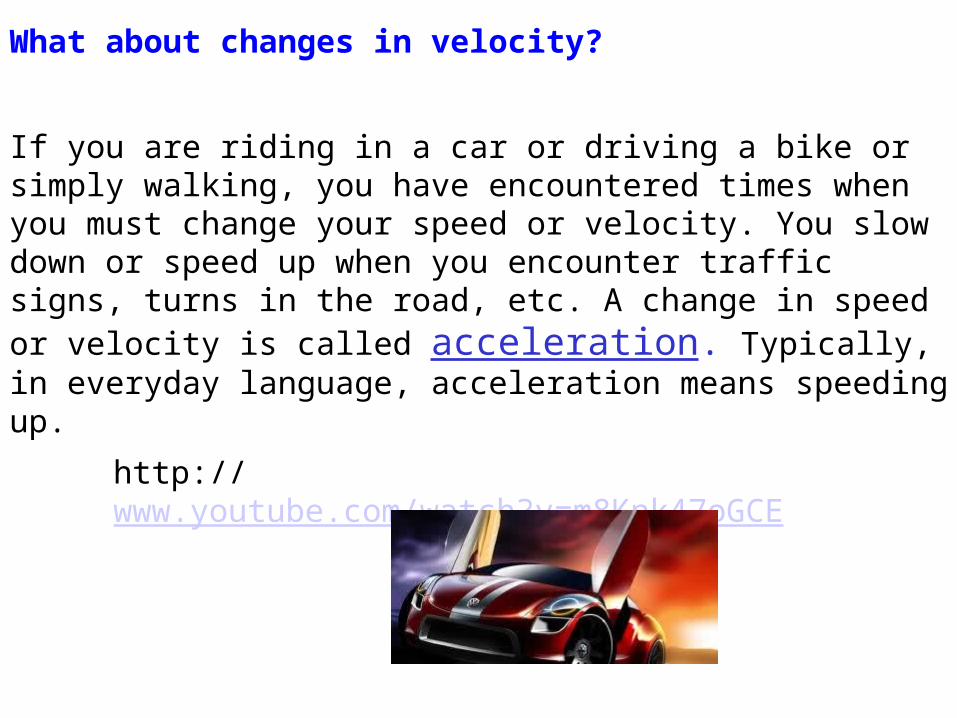
What about changes in velocity?
If you are riding in a car or driving a bike or simply walking, you have encountered times when you must change your speed or velocity. You slow down or speed up when you encounter traffic signs, turns in the road, etc. A change in speed or velocity is called acceleration. Typically, in everyday language, acceleration means speeding up.
http://www.youtube.com/watch?v=m8Knk47oGCE
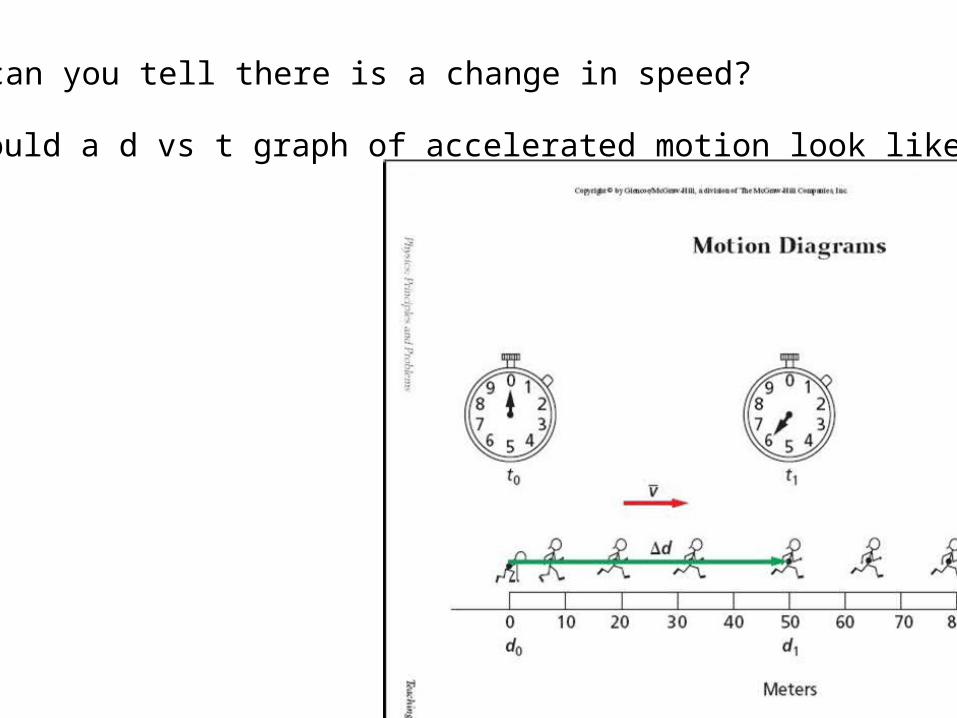
What would a d vs t graph of accelerated motion look like?
How can you tell there is a change in speed?

http://jersey.uoregon.edu/vlab/block/Block.html
http://www.teachersdomain.org/asset/phy03_int_accel/
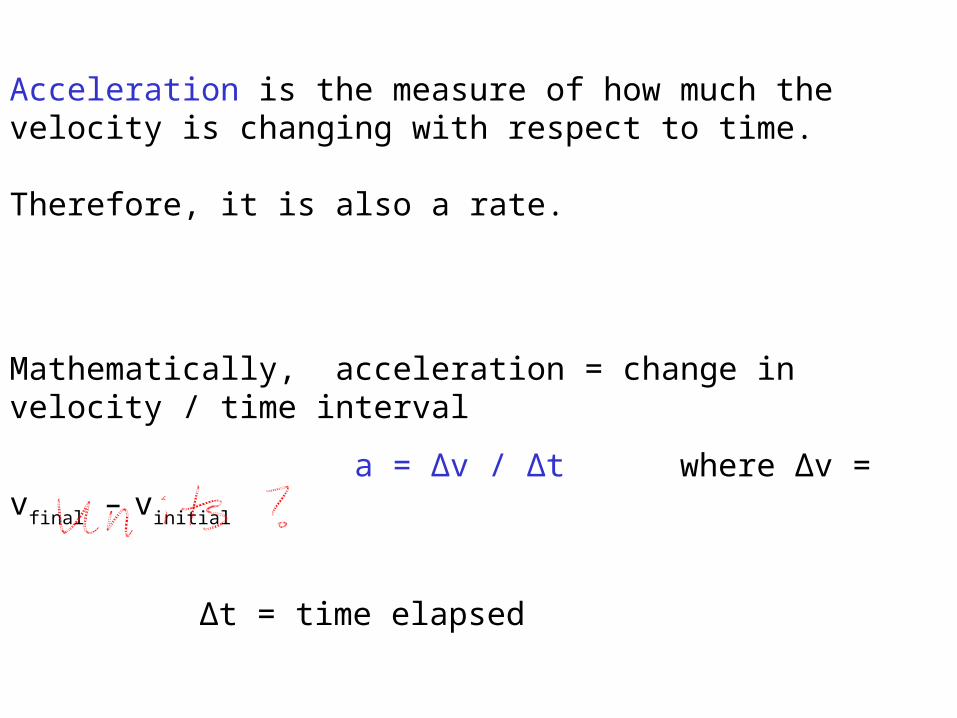
Acceleration is the measure of how much the velocity is changing with respect to time.
Therefore, it is also a rate.
Mathematically, acceleration = change in velocity / time interval
a = Δv / Δt where Δv = vfinal – vinitial
Δt = time elapsed
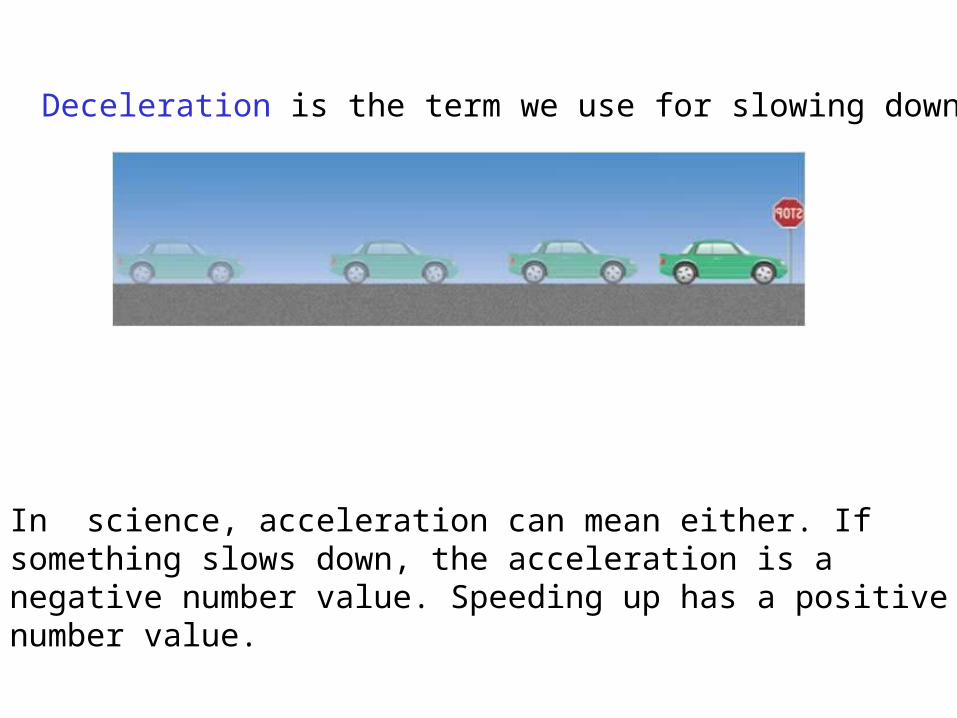
Deceleration is the term we use for slowing down.
In science, acceleration can mean either. If something slows down, the acceleration is a negative number value. Speeding up has a positive number value.

http://www.walter-fendt.de/ph14e/acceleration.htm
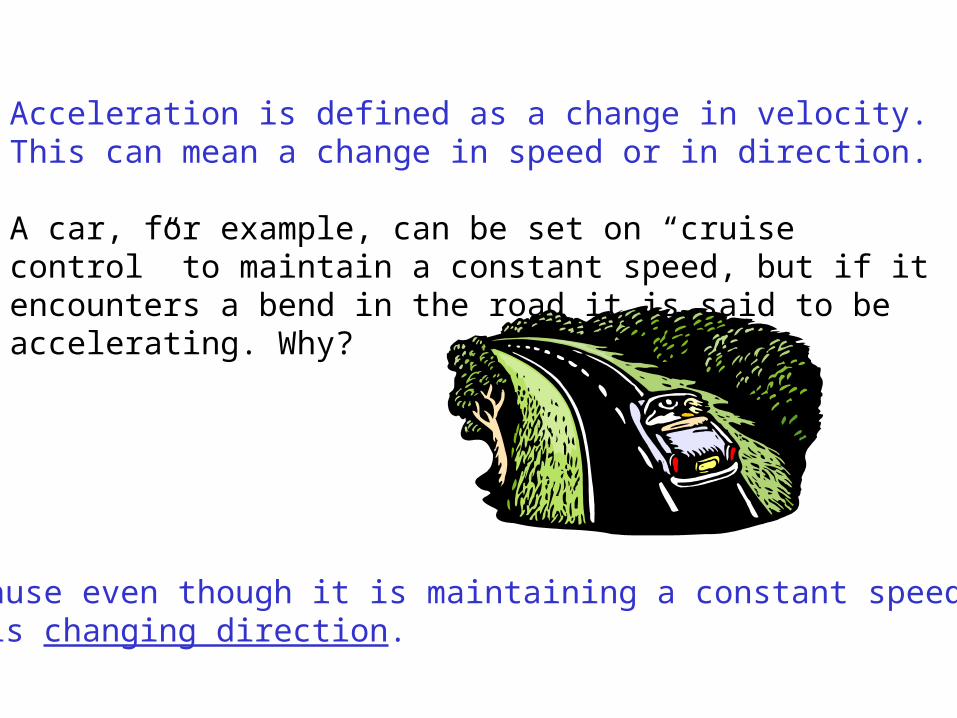
Acceleration is defined as a change in velocity. This can mean a change in speed or in direction.
A car, for example, can be set on “cruise control” to maintain a constant speed, but if it encounters a bend in the road it is said to be accelerating. Why?
Because even though it is maintaining a constant speed, it is changing direction.
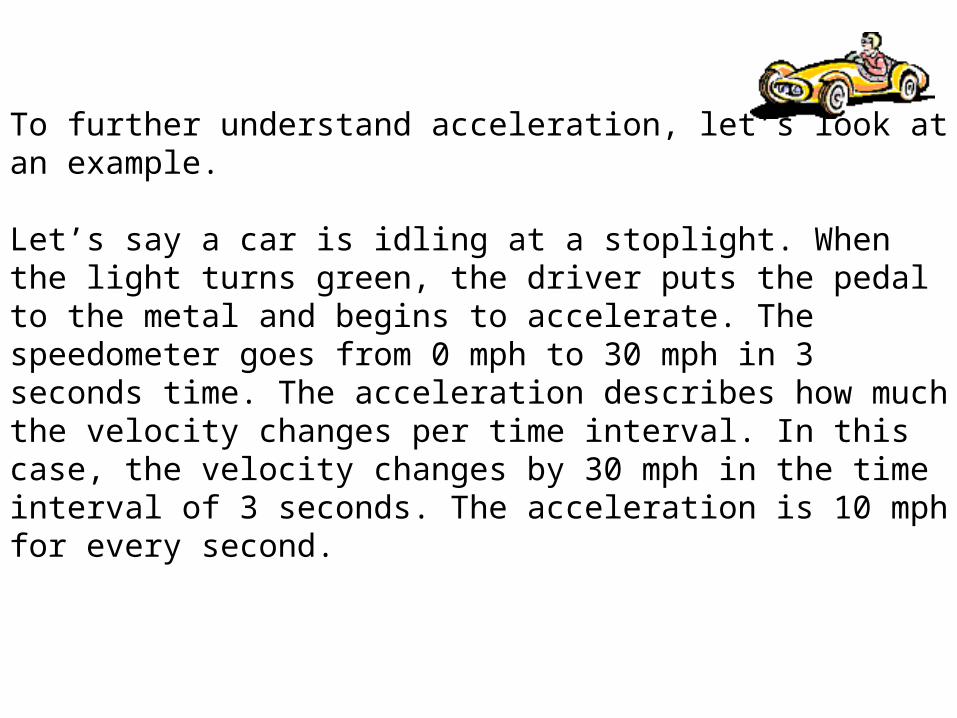
To further understand acceleration, let’s look at an example. Let’s say a car is idling at a stoplight. When the light turns green, the driver puts the pedal to the metal and begins to accelerate. The speedometer goes from 0 mph to 30 mph in 3 seconds time. The acceleration describes how much the velocity changes per time interval. In this case, the velocity changes by 30 mph in the time interval of 3 seconds. The acceleration is 10 mph for every second.

Let’s look at another example. A motor boat is cruising at 40 mph when the driver notices a large wake ahead. He lowers the engine throttle and brings the boat to a speed of 10 mph in a matter of 2 seconds. Calculate the boat’s acceleration.
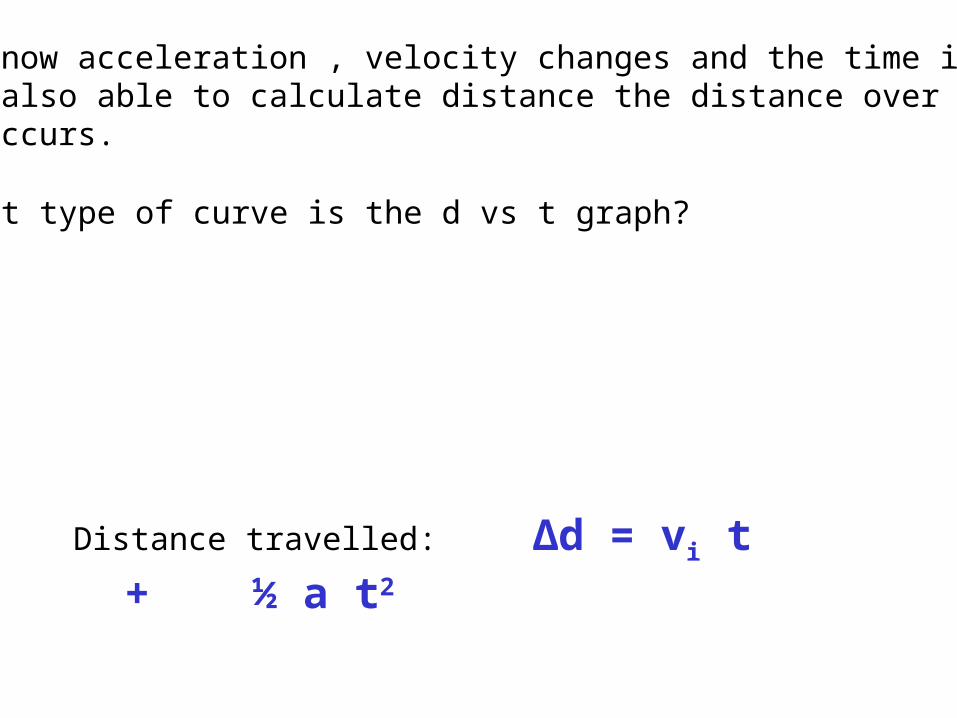
If we know acceleration , velocity changes and the time interval,we are also able to calculate distance the distance over which this occurs.
What type of curve is the d vs t graph?
Distance travelled: ∆d = vi t + ½ a t2
Time for practice!