bihar state quarterly monitoring report
TRANSCRIPT

NATIONAL HEALTH SYSTEMS RESOURCES CENTRE
Bihar State Quarterly
Monitoring Report April to June 2013
V Roddawar
06/17/13
This report is based on health providers and beneficiary interviews and HMIS data analysis of Bihar state and Aurangabad district. The monitoring visit includes all levels of health facilities in the district. One needs to be cautious in interpretation of HMIS data, the state and districts may have good health service delivery but there might be problems in reporting data.

1
Table of Contents Executive Summary ...................................................................................................................................... 4
1. Introduction ........................................................................................................................................... 6
2. State and District Profile ..................................................................................................................... 6
3. Key health and service delivery indicators ...................................................................................... 7
4. Health Infrastructure ............................................................................................................................ 9
5. Human Resources for Health ............................................................................................................ 10
6. Maternal Health .................................................................................................................................. 12
6.1 ANC and PNC ................................................................................................................................ 12
6.2 institutional deliveries ................................................................................................................. 12
6.3 Maternal Death Review ............................................................................................................... 14
6.4 Janani-Shishu Suraksha Karyakram (JSSK) ............................................................................ 14
6.4. A User fee in Out Patient Department (OPD) and In Patient Department (IPD) ........ 14
6.4. B. Drugs and Consumables .................................................................................................... 15
6.4. C. Diagnostics ........................................................................................................................... 15
6.4. D. Diet ........................................................................................................................................ 15
6.4. E. Referral Transport ............................................................................................................... 16
6.4. F. Display of entitlements ...................................................................................................... 16
6.4. G. Awareness of community .................................................................................................. 16
6.4. H. Grievance Redressal Cell .................................................................................................. 16
6.4. I. Out of pocket expenditure / informal charges ................................................................ 17
6.5 Janani-Shishu Yojana (JSY) ......................................................................................................... 17
7 Child Health .......................................................................................................................................... 17
7.1 SNCU ................................................................................................................................................. 17
7.2 Nutritional Rehabilitation Centre ............................................................................................. 18
7.3 Immunization ................................................................................................................................ 19
8. Family Planning .................................................................................................................................. 20
9. Quality in Health Services ................................................................................................................ 21
9.1 Infection Control and Bio-Medical Waste Management ....................................................... 21
9.2 Information Display ..................................................................................................................... 22
10. Community Processes ...................................................................................................................... 22
10.1 ASHA and MAMTA ................................................................................................................... 22

2
10.2 Skill Development ...................................................................................................................... 23
10.3 Functionality of the ASHAs ...................................................................................................... 23
11. Disease Control Programme ........................................................................................................... 23
11.1 Revised National Tuberculosis Control Programme ........................................................... 23
11.2 National Leprosy Eradication Programme (NLEP) ............................................................... 24
11.3 National Vector Borne Diseases Control Programme .......................................................... 24
11.4 National Programme for Control of Blindness (NPCB) ...................................................... 25
12. Others .................................................................................................................................................. 26
12.1 OPD and IPD ............................................................................................................................... 26
12.2 Information Systems .................................................................................................................. 27
12.2a Mother and Child Tracking System (MCTS) .................................................................. 27
12.3 Village Health and Nutrition Day ........................................................................................... 28
Table 1 Description of the area and facilities visited in Aurangabad, Bihar ..................................... 6
Table 2 State and District Profile .............................................................................................................. 7
Table 3 Key health and service delivery indicators .............................................................................. 8
Table 4 Health Facility Mapping – Bihar and Aurangabad ................................................................ 9
Table 5 Block wise health facilities in Aurangabad, Bihar Source: DHS, Aurangabad .................... 9
Table 6 Delivery points – Bihar and Aurangabad .............................................................................. 10
Table 7 Human Resources Status in Bihar ........................................................................................... 11
Table 8 Selected maternal indicators of Bihar and Aurangabad from Jan to May 2013 ................ 12
Table 9 Functional delivery points in public health facilities – Bihar and Aurangabad ............... 12
Table 10 Causes of maternal deaths – Bihar and Aurangabad, January to May 2013 ................... 14
Table 11 Status of different type of new born care facilities in Bihar and Aurangabad ................ 17
Table 12 Immunization session held in Bihar and Aurangabad from Jan to May 2013 ................ 20
Table 13 Family Planning Key Indicators – Bihar and Aurangabad from January to May 2013 . 21
Table 14 Block wise ASHAs against target as on April 2013 ............................................................ 22
Table 15 Status of Facility Wise Data Uploading, Aurangabad........................................................ 27
Table 16 Block wise VHND held and ANC coverage for the month of April 2013, Aurangabad
.................................................................................................................................................................... 28
Table 17 Block wise VHND held and hemoglobin test conducted for the month of April 2013,
Aurangabad .............................................................................................................................................. 28
Graph 1Human Resources Status in Aurangabad .............................................................................. 11
Graph 2 Institution wise Deliveries from January to May 2013 – Aurangabad ............................. 13
Graph 3Duration of stay after delivery in Aurangabad district from Jan to May 2013 ................. 15
Graph 4Month wise ambulance service (both to and fro) against reported deliveries from Jan to
May 2013 – Aurangabad ......................................................................................................................... 16
Graph 5 Assessment of NBCC Centers – Aurangabad, Bihar ........................................................... 18
3
Graph 6 Output Indicators of NRC Aurangabad, Bihar .................................................................... 19
Graph 7 Immunization Coverage of various antigens against estimated live births from January
to May 2013 ............................................................................................................................................... 20
Graph 8 RNTCP Month wise performance of Aurangabad, Bihar .................................................. 23
Graph 9 Year wise Bihar state Malaria situation from 2009 to 2013 ................................................. 24
Graph 10 Malaria Situation of Aurangabad between two periods 2012 and 2013 (up to May) ... 25
Graph 11 State level progress of NPCB, Bihar (up to May 2013) ...................................................... 25
Graph 12 Correlation of health staff and Out Patient Attendance for the month of May 2013,
Aurangabad .............................................................................................................................................. 26
Graph 13 % MCTS reported against total expected registration as on May 2013 .......................... 27
Map 1 Block wise Aurangabad district ................................................................................................... 7

4
Executive SummaryExecutive SummaryExecutive SummaryExecutive Summary
• Services delivery indicators like ANC, PNC, institutional deliveries, TFR and unmet
needs for family planning indicate that Bihar’s performance is far below national
average.
• % of three ANC check-ups and institutional deliveries against estimated deliveries in
Bihar is 25% and 14.3% lower than national average.
• Bihar state unmet need for FP is 39.2%, which is 26.4% higher than national unmet need
• The major concern across the state and district is identifying high risk pregnant women;
those with severe anemia and hypertension.
• PHC’s alone contributes 53% of deliveries and rests of the health facilities contribute
47% in the district.
• APHC’s, which are equal to PHC in comparison with other states contributes only 1% of
total deliveries during first five months of 2013.
• The state and district needs to review the low performance of C Section deliveries across
state, which is mere 1.5%, much below the physiological need of around 15%
• In terms of required facilities, there is a deficit of 83.5%, 67.5%, 53.8% and 26.9% of
health sub-centers, additional PHC’s, Community health centers and sub-divisional
hospitals respectively in the state.
• Similar in Aurangabad, only 21.3%, 59.2% and 28.5% of health sub-centers, additional
PHC’s and CHC are available in the district in terms of required facilities as per
population norm.
• Out of 11,584 health facilities available in the state only 8% of them are serving as
delivery points. Excluding HSC, 45% of health facilities are operationalized as delivery
points in the state
• Large number of vacancies in regular posts in Bihar – Medical Officers 2476, ANMs
2388, LT 1925, MPW 1216, LHV 749, and Staff nurses 393
• The state has 13 medical officers and 27 staff nurse per one lakh population in public
health sector.
• Out of 226 sanctioned MO posts, only 43% of them are in position. 12 MO’s and 18 staff
nurse per 1 lakh population available in public health sector, which is below than state
average.
• State needs to develop a mechanism to follow-up trained MOs whether they are using
acquired skills in preventing and reducing maternal mortality at health facility level.
• There are total 34 blood bank and 115 blood storage units available but only 28 BBs and
9 BSUs are functional in the state.
• Renewal of license for existing BSU’s is a concern in the state and there should be proper
action plan for the renewal
• Non-performing EmOC trained doctors is one of the major concern in the state.
• There is a need to constitute/strengthen MDR task force at district and state level to
regularly review MDs and follow-up action to reduce MMR.

5
• Priority of the state is to train district, block MOs, MOICs and private hospitals on
maternal death review in regular interval to strengthen MD reviews
• It is observed that there is shortage of drugs in all health facilities in the district.
• Districts need to renew the contract of outsourced agencies to provide interrupted
services such as diet, diagnostic and bio-medical waste management.
• The signage of JSSK well displayed in PHC and above health facilities but there is no
display of any IEC material below PHC facilities. There is no grievance redressal
mechanism available in the visited facilities. Out of pocket expenditure arises mostly
from transportation and drug charges.
• The state need to ensure regular release of funds to outsourced agencies for
uninterrupted diet, diagnosis and referral transport services to the beneficiary
• State should monitor and ensure timely procurement of drug with two months of buffer
stock. Avoid administrative delays in procuring drugs and releasing funds to
outsourced agencies
• State should develop mechanism to monitor JSSK with physical verification to provide
onsite correction and recommendations
• NRC, Aurangabad admitted 83 SAM children and completed 5 batches. Total 42%
children cured and discharged and 58% children were followed up till 8th week.
• The full immunization coverage of Aurangabad is 82%, which is 13% higher than state
average.
• Build supportive supervision structure at regional and district level for successful
implementation of JSSK
• Ensure flow of communication from state to district and district to block
• Need to reorient district and block level officials on JSSK scheme
• Conduct state level JSSK reviews and submit monthly state progress report on JSSK
entitlement to GoI
• Display and distribute JSSK IEC material and it would be appropriate to have wall
paintings on every levels of health facilities (HSC, APHC/PHC, CHC/RH, SDH and
DH).

6
1. Introduction
The report is based on monitoring visit carried out in Aurangabad district of Bihar from 4th to
6thJune 2013. The monitoring visit include all levels of health facilities – Health Sub Centre
(HSC), Additional Primary Health Centre (APHC), Primary Health Centre (PHC), Community
Health Centre (CHC) / Referral Hospital (RH) and District Hospital (DH). Few of Health Sub-
Centers are operationalized as delivery point and rest of them are yet to operationalize as
delivery points in the district. PHCs and CHC/Referral hospitals are catering to the health
needs of the people. Details of visit provided in the below table.
Table 1 Description of the area and facilities visited in Aurangabad, Bihar
Block Description Facilities visited
Madanpur Comprise of one PHC 24x7, five APHC's and 29 HSC's which caters to 1.96 lakhs population
Pharpura APHCs, Aajan HSC
Barun Comprise of one PHC 24x7, five APHC's and 19 HSC's which caters to 1.99 lakhs population
Jankop HSC, Jankop VHND, Barun PHC, Barun DMC
Kutumba Comprise of one RH (FRU), eight APHC's and 26 HSC's which caters to 2.25 lakhs population
Kutumba RH/CHC/PHC, Kutumba DMC
Aurangabad Comprise of one DH, fivet APHC's and 27 HSC's which caters to 2.82 lakhs population
District Hospital, DTCO, DLO, DBCS
2. State and District Profile
Bihar state and Aurangabad district profile
State/District Bihar Aurangabad
State/Dist. Headquarters
Patna Aurangabad
No. of Blocks 534 11
No. of Revenue Villages
45,103 1884
No. of Panchayats
8463 203
Population (2011)
10,38,04,637 25,11,243
Literacy 63.82% 72.77%
Sex Ratio 919 916
Density of Population
1100/km2 760/km2

7
Table 2 State and District Profile
Bihar, third most populated state in the
country has four regions, nine divisions and
38 districts. Bihar population constitute
8.58% of total India population. The state has
534 blocks, 45103, revenue villages and 8463
Panchayats. Aurangabad is one of the 38
districts located at southwest of the state with
a population of 2.51million, which is 2.4% of
the state population. The district literacy rate is 72.77%, which is 8.95% higher in comparison
with state literacy rate, 63.82%. Bihar state density of population is 1100/km2, which is higher
by 340 persons/km2 in comparison with Aurangabad district, 760 persons/km2.
Map 1 Block wise Aurangabad district
3. Key health and service delivery indicators
The key health indicators of Bihar reflects poor performance in comparison with national level.
Bihar recorded 305 Maternal Mortality Ratio (MMR) per 100,000 live births, which is 93 points
State/District Boarder
North Nepal Jahanabad
East West
Bengal Gaya
West Uttar
Pradesh Rohtas
South Jharkhand Jharkhand

8
higher in comparison with national average, 212/100,000 live births. However, when compare
with Aurangabad district, 119 points higher than national average and 26 points higher than
state average. The MMR of Bihar and Aurangabad indicate 305 and 331 female deaths per
100,000 live births from any cause related to or aggravated by pregnancy.
Maternal health is one of the eight goals of Millennium Development Goals (MDG’s) that
targets to reduce MMR by three quarters (of 1990) by 2015. India has substantially reduced the
MMR from 523 in 1990 to 212 in 2007-09. Despite the progress, India tends to fall short to
achieve MDG maternal goal by 135 per 100,000 live births in 2015. The southern states like
Kerala and Tamil Nadu have achieved considerable success in arresting incidence and tend to
reach targets before 2015. Whereas northern states like Bihar, Uttar Pradesh, Madhya Pradesh
and Rajasthan might fall behind the targets. Broadly, some of the challenges include socio-
economic barrier, human resource and management, monitoring and accountability, linkages
and role of local institutions.
Table 3 Key health and service delivery indicators
Sl. No. Health indicators India Bihar Aurangabad
1 MMR 212 (SRS '07-09) 305 331
2 CBR 21.8 (SRS 2011) 26.7 25.6
3 CDR 7.1 (SRS 2011) 7.2 6.4
4 IMR 44(SRS 2011) 55 48
5 Neo- natal Mortality Rate 33 (SRS 2010) 35 29
6 Under Five Mortality Rate 59 (SRS 2010) 77 61
7 Antenatal Care (AHS 2011)
a ANC Check-up in first trimester - 44% (HMIS '12-13)
35% (HMIS '12-13)
b 3 or more ANC Check-up 69% (HMIS '11-12)
44% (HMIS '12-13)
55% (HMIS '12-13)
8 Postnatal Care (AHS 2011)
a Breastfed within 1 hour of birth - 30.3% 23.5%
9 Instit. Deli. Against Esti. Deliveries
62% 47.7% 53.4%
10 Total Fertility Rate 2.5 (SRS 2010) 3.7 (SRS 2010) -
11 Full Immunization 82 (HMIS '11-12) 64.5 69.8
12 Unmet Need for FP 12.8 (DLHS '05-06) 39.2 41.3
a Spacing 6.2 21.3 24.1
b Limiting 6.6 17.9 17.2 Source: AHS 2011
IMR for the country declined by nine points between 2008 and 2011, with IMR at national level
being 44 in 2010. However, the set target of MDG is to reduce IMR by 27 per 1000 by 2015.
Bihar IMR is 55 per 1000 live births, which is 11 points higher than national average and 7
points higher than Aurangabad district. Bihar and Aurangabad is short of 50% (28 points) and
43.75% (21 points) in achieving MDG’s IMR goal by 2015. Under 5 Mortality Rate (U5MR) in
India for the year 2010, stands at 59 and it varies from 66 in rural areas to 38 in urban areas.

9
Given to reduce U5MR to 42 per thousand live birthsby 2015, India tends to short of 28.8% at
the current rate of U5MR. Bihar and Aurangabad reported 77 and 61 U5MR as per AHS 2011
and they shortfall of 45.45% and 31.14% to reach the goal of MDG by 2015.
Services delivery indicators like ANC, PNC, institutional deliveries, TFR and unmet needs for
family planning indicate that Bihar’s performance is far below national average. % of three
ANC check-ups and institutional deliveries against estimated deliveries in Bihar is 25% and
14.3% lower than national average. Bihar state unmet need for FP is 39.2%, which is 26.4%
higher than national unmet need
4. Health Infrastructure Bihar has inadequate health infrastructure as per population norms. In terms of required
facilities, there is a deficit of 83.5%, 67.5%, 53.8% and 26.9% of health sub-centers, additional
PHC’s, Community health centers and sub-divisional hospitals in the state. The state of the
health infrastructure in such a condition, which is one of the essential factor, shows deficiency
in providing public health services in the state. Similar picture reflects in Aurangabad district
in terms of required facilities, only 21.3%, 59.2% and 28.5% of health sub-centers, additional
PHC’s and CHC available in the district.
Table 4 Health Facility Mapping – Bihar and Aurangabad
Health Facility Level
Bihar Aurangabad
Required Existing Under Const.
Short fall
Required Existing Under Const.
Short fall
District Hospital 38 36 4 2 1 1 0 0
Sub-Divisional Hospital
63 46 9 8 1 1 0 0
Referral Hospital NA 71 NA NA NA 3 NA NA
Community Health Centre
864 399 NA 465 21 6 6 9
Additional PHCs 3460 1122 381 1957 84 50 11 23
Health Sub-Centre
20761 3415 3983 13366 502 107 93 302
Source: Bihar State PIP 2013-14
Aurangabad district has 11 blocks with a population of 2.5 million. Block population range
from minimum 1.6 lakhs in Haspura block to maximum 3.1 lakhs in Rafiganj block. On average
every block has 5 to 6 health sub-centers and each sub-center covers minimum eight thousands
to maximum 13 thousand population, which is above the population norms. The catchment
area of APHCs covers minimum 28 thousands to maximum of 62 thousand in Aurangabad
district.
Table 5 Block wise health facilities in Aurangabad, Bihar Source: DHS, Aurangabad
Name of Block
Population Sub Centers Additional
PHCs PHC
Referral Hospital
Aurangabad 282224 27 5 - -
Barun 199745 19 5 1 -

10
Daudnagar 206808 16 4 1 -
Deo 172606 19 6 1 -
Goh 234019 21 5 1 -
Haspura 160350 16 4 - 1
Kutumba 225139 26 8 - 1
Madanpur 196310 29 5 1 -
Nabinagar 296679 23 8 - 1
Obra 226401 18 5 1 -
Rafiganj 310962 20 5 1 -
Total 2511243 234 60 7 3
There are total 11,584 health facilities available at different level in the state and out of which
only 8% of them are serving as delivery points. Mere 8% health facilities catered to 3.1 million
expected pregnancies and 2.9 million expected deliveries during these five months in the state.
By this calculation every delivery point in the state need to cater 263 deliveries per month.
Excluding HSC in calculating delivery points, the state has only 45% of health facilities as
operationalized delivery point in the state, which is below than the 50% of total health facilities.
The situation is different across different delivery points and mostly PHCs and above level
facilities supply the needs of pregnant women. There is a need for strategy to strengthen
APHCs and HSC as delivery points in the state.
The situation remains the same at district level, for example in Aurangabad district out of 305
health facilities only 8% serve as delivery points that catered to 72,327 expected pregnancy and
67,330 expected deliveries during these five months. Similarly, excluding HSC, the district has
32% of available health facilities operationalized as delivery points in the district. The below
table provides facility level institutions and delivery points.
Table 6Delivery points – Bihar and Aurangabad
Health Facilities Bihar Aurangabad
State Total Delivery Points District Total Delivery Points
HSC 9696 74 234 0
PHC 1243 204 60 12
CHC Non FRU/PHC 588 588 7 7
CHC/FRU 20 20 3 3
DH/DWH 37 37 1 1
Total 11584 923 [8%] 305 23 [8%] Source: State and district PIP 2013-14
5. Human Resources for Health Large number of vacancies in regular posts in Bihar – Medical Officers 2476, ANMs 2388, LT
1925, MPW 1216, LHV 749, and Staff nurses 393. State has huge gap of medical, nursing and
paramedic staff in terms of requirement, sanctioned and in position at different level health
facilities. Irregular recruitment and lack of qualified manpower has led to vacancies in critical
healthcare workforce both in regular and contractual positions. There is no mechanism existing

11
in the state to regularise contractual medical officers under NRHM in the state. The state has 13
medical officers and 27 staff nurse per one lakh population in public health sector.
Table 7Human Resources Status in Bihar
HR categories
HR Requirement Current HR Situation
Delivery points
All Facilities
In position
Sanctioned posts
Regular Contractual Total Shortfall/
Excess
ANM 2784 23928 23772 9420 8196 17616 -6312 SN 9029 12146 13415 393 1619 2012 -10134 LHV 204 1243 1181 432 0 432 -811 LT 1642 2681 2207 282 387 669 -2012 Pharmacist 960 1999 NA NA NA NA NA MO 3003 12094 7315 2464 1581 4045 -8049 Specialist 878 878 NA 684 273 957 79 Source: Bihar state PIP 2013-14
The situation in Aurangabad is similar to the state. There are around 554 various para-medical
personnel available across different health facilities. Out of 969 sanctioned HR, only 47% of
them are available in the district. Regarding medical officers, out of 226 sanctioned posts, only
43% of them are in position. In Aurangabad district, 12 MO’s and 18 staff nurse per 1 lakh
population available in public health sector, which is below the state average.
Graph 1Human Resources Status in Aurangabad
Source: District PIP 2013-14
12 13 2241
97
466
23 76 72
150
226
648
0
100
200
300
400
500
600
700
LHV LT Pharmacist SN MO ANM
HUMAN RESOURCES- SANCTIONED VS POSITIONED AURANGABAD, BIHAR 2013
In Position Sanctioned posts

12
6. Maternal Health
6.1 ANC and PNC
ANC registration against expected pregnancies and ANC in first trimester against reported
ANC of Aurangabad district recorded below 4% and 5% in comparison with state average.
However, the major concern across the state and district is identifying severe anemia and
hypertensive cases who are high risk pregnant women group. Reported number of severe
anemia and hypertension cases in the state and district is far below than expected level.
Table 8 Selected maternal indicators of Bihar and Aurangabad from Jan to May 2013
Sl. No. Key Indicators Jan to May 2013
Bihar Aurangabad
1 ANC Registration against Expected Pregnancies 83% 79%
2 ANC Registration in first trimester against Reported ANC registration
45% 37%
3 Severe anemia (Hb<7) treated against reported ANC registration
0.60% 0.40%
4 Hypertension in pregnancy- detected against ANC reported
2.50% 2.50%
5 Institutional Deliveries against Estimated Deliveries 56% 59%
6 Home deliveries( SBA& Non SBA) against estimated deliveries
14.70% 20.10%
7 C Section deliveries against institutional deliveries 1.50% 1.10% Source: DHIS2
6.2 institutional deliveries
As shown in the table 8 above, institutional deliveries of the district is higher by 3% in
comparison with state. The state and district needs to review the low performance of C Section
deliveries across state, which is mere 1.5%. However, to improve the situation, the state has
trained 101 medical officers in EmOC and 113 MOs in LSAS in the year 2012. State needs to
develop a mechanism to follow-up trained MOs whether they are using acquired skills in
preventing and reducing maternal mortality at health facility level.
Table 9 Functional delivery points in public health facilities – Bihar and Aurangabad
Sl .No
Health facilities Bihar Aurangabad
1 Total No. of SCs/conducting >3 deliveries per month 9696/74 234/0
2 Total No. of 24X7 PHCs/conducting >10 deliveries per month
496/496 8/8
3 Total No. of any other PHCs/Conducting >10 deliveries per month
1243/204 60/12
4 Total No. of CHCs ( FRU) conducting > 20 deliveries /month /C-section
67/67/8 3/3/0
5
Total No. of any other FRUs (excluding CHC-FRUs)/conducting > 20 deliveries per month with C-section
45/45/12 2/2/2

13
6 Total No. of DH conducting > 50 deliveries /month with C-section
36/36/36 1/1/1
7 Total No. of Medical colleges conducting > 50 deliveries/month with C-section
06/06/06 0/0/0
8 No. of Blood bank licensed / functional 34/28 1/1
9 No. of Blood Storage Units licensed / functional 115/9 NA Source: State and district PIP 2013-14
Only 8% of the total available health facilities are operationalized as delivery points in the state
and district. State and district needs to prioritize health sub-centers as delivery
points based on maternal indicators and need of the locality. Only 1% of sub-centers are
operationalized as delivery points at state level and in Aurangabad district none of them are
operationalized as DP who are conducting >3 deliveries. However, few of the HSC in
Aurangabad have been operationalized as DP but fall below the requirement of >3 deliveries
per month. Availability of round the clock FRU services in the state and district is
questionable.
There are total 34 blood bank and 115 blood storage units available but only 28BBs and 9 BSUs
are functional in the state. Renewal of license for existing BSU’s is a concern in the state and
there should be proper action plan for the renewal and maintenance of these BSU’s.
Graph 2Institution wise Deliveries from January to May 2013 – Aurangabad
Out of total deliveries, PHC’s alone contributes 53% and rest of the health facilities contribute to
the remaining 47% in the district. APHC’s, which are equal to PHC in comparison with other
states contributes only 1% of total deliveries during first five months of 2013. Only 18% of
Aurangabad Institution wise Deliveries January to May 2013
DH
RH
PHCs
APHCs
HSCs

14
available 60 APHCs are conducting deliveries. Strategically 5 to 6 APHCs are located in every
block serving 30 to 60 thousand population, which are best positioned to meet the demand of
maternal services. However, the state adopted to operationalize these APHCs equal to PHCs
but the progress is very slow. Mere 2 HSC conducted 3 deliveries during first five months of
2013.
Non-performing EmOC trained doctors is one of the major concern in the state. Quality of
training and post training follow-up needs to strengthen to improve the utilization of acquired
skills in the health facilities. Rational deployment of human resources particularly in APHCs
and PHCs to ensure functionality of health facilities at primary level would improve the
maternal outcomes.
6.3 Maternal Death Review
Bihar is one of the high MMR (305/100,000) burden state in India but yet to establish robust
mechanism to review maternal deaths in the district and state level. No facility and community
based MDR committees are constituted in the district. Total 5 MDs reviewed by Civil Surgeon
(CS) from April ’12 to March ’13 out of 22 reported MDs.There is need to constitute/strengthen
MDR task force at district and state level to regularly review MDs and follow-up action to
reduce MMR. Of total 495 reported MDs in the state during 2013, 71% of cases fall under other
causes that includes causes not known. Second major cause of death is abortion followed by
hemorrhage and severe hypertension. Priority of the state is to train district, block MOs, MOICs
and private hospitals on maternal death review in regular interval to strengthen MD reviews, to
understand major cause of death and to reduce MMR burden.
Table 10 Causes of maternal deaths – Bihar and Aurangabad, January to May 2013
Maternal Deaths Bihar Aurangabad
Abortion 74 [15%] 1
Obstructed/prolonged labor 11 [2%] 0
Severe hypertension/fits 13 [3%] 0
Bleeding 40 [8%] 1
High fever 5 [1%] 0
Other Causes (including causes not known) 352 [71%] 3
Total 495 5 Source: DHIS2
6.4 Janani-ShishuSurakshaKaryakram (JSSK)
6.4. A User fee in Out Patient Department (OPD) and In Patient Department (IPD)
User charge of Rs. 2 observed for OPD in DH, Aurangabad and IPD services are free in all
facilities. Out of 15 beneficiaries interviewed across different health facilities, no one reported
paying any money for IPD services.

6.4. B. Drugs and Consumables
It is observed that there is shortage of drugs in all health facilities in the district. Out of 15
beneficiaries interviewed at PHC, Barun and DH Aurangabad, 7 beneficiaries reported buying
prescribed medicine from private medical store. On an average, each beneficiary spent Rs.170.
Beneficiaries revealed that after delivery MOs prescribed few medicine, which are common
across beneficiaries.
6.4. C. Diagnostics
Diagnostic services are available at the facilities visited, which include routine blood and urine
examination. Pregnant women are exempted from paying money for laboratory tests.
However, exit interview with beneficiaries revealed that almost all beneficiaries undergo partial
laboratory test and most of the facilities depend on ANC test results. It is evident from the
visited facilities that due to lack of human resource and inadequate facilities, these services are
not available. Hence, many of the beneficiaries (pregnant women)
diagnostic test which has direct implication on out of pocket expenditure.
6.4. D. Diet
Provision of free diet available in the facilities visited. At DH
services outsourced to third party, which pr
Women (PW). It is learned that the renewal of outsourced agency is pending due to end of the
contract. During the field visit, it is observed that the food quality need to improve.
It was observed across all the facilities that more than 90% of the beneficiaries leave the health
facilities immediate after delivery, within 2 to 6 hours. All most all deliveries are normal
deliveries except DH Aurangabad and no other PHC caters to complications. Hence,
the deliveries discharged within few hours. Although the provision of diet is available across all
health facilities designated as delivery points but due to immediate discharge, utilization of diet
service is questionable.
Graph 3Duration of stay after delivery in Aurangabad district from
Source: DHIS2
1400
1500
1600
1700
1800
1900
2000
March '13
D U R A T I O N O F S T A Y -
Deliveries conducted at Public Institutions
It is observed that there is shortage of drugs in all health facilities in the district. Out of 15
beneficiaries interviewed at PHC, Barun and DH Aurangabad, 7 beneficiaries reported buying
prescribed medicine from private medical store. On an average, each beneficiary spent Rs.170.
Beneficiaries revealed that after delivery MOs prescribed few medicine, which are common
ailable at the facilities visited, which include routine blood and urine
examination. Pregnant women are exempted from paying money for laboratory tests.
However, exit interview with beneficiaries revealed that almost all beneficiaries undergo partial
oratory test and most of the facilities depend on ANC test results. It is evident from the
visited facilities that due to lack of human resource and inadequate facilities, these services are
not available. Hence, many of the beneficiaries (pregnant women) dependent on private labs for
diagnostic test which has direct implication on out of pocket expenditure.
Provision of free diet available in the facilities visited. At DH Aurangabad
services outsourced to third party, which provides meals for all in-patients including Pregnant
Women (PW). It is learned that the renewal of outsourced agency is pending due to end of the
contract. During the field visit, it is observed that the food quality need to improve.
ross all the facilities that more than 90% of the beneficiaries leave the health
facilities immediate after delivery, within 2 to 6 hours. All most all deliveries are normal
deliveries except DH Aurangabad and no other PHC caters to complications. Hence,
the deliveries discharged within few hours. Although the provision of diet is available across all
health facilities designated as delivery points but due to immediate discharge, utilization of diet
Duration of stay after delivery in Aurangabad district from March to May 2013
April '13 May '13
A U R A N G A B A D , B I H A R
Deliveries conducted at Public Institutions
15
It is observed that there is shortage of drugs in all health facilities in the district. Out of 15
beneficiaries interviewed at PHC, Barun and DH Aurangabad, 7 beneficiaries reported buying
prescribed medicine from private medical store. On an average, each beneficiary spent Rs.170.
Beneficiaries revealed that after delivery MOs prescribed few medicine, which are common
ailable at the facilities visited, which include routine blood and urine
examination. Pregnant women are exempted from paying money for laboratory tests.
However, exit interview with beneficiaries revealed that almost all beneficiaries undergo partial
oratory test and most of the facilities depend on ANC test results. It is evident from the
visited facilities that due to lack of human resource and inadequate facilities, these services are
dependent on private labs for
Aurangabad, food catering
patients including Pregnant
Women (PW). It is learned that the renewal of outsourced agency is pending due to end of the
contract. During the field visit, it is observed that the food quality need to improve.
ross all the facilities that more than 90% of the beneficiaries leave the health
facilities immediate after delivery, within 2 to 6 hours. All most all deliveries are normal
deliveries except DH Aurangabad and no other PHC caters to complications. Hence, most of
the deliveries discharged within few hours. Although the provision of diet is available across all
health facilities designated as delivery points but due to immediate discharge, utilization of diet
to May 2013

16
6.4. E. Referral Transport
In Aurangabad district, there are 11 blocks and each block has one JananiShishuArogya Express
(102) exclusively for pregnant women to transport nearby health facility. Out of 15
beneficiaries interviewed only three of them availed the ambulance service to reach the health
facility and for drop-back 8 beneficiaries utilized or utilizing the service. Remaining 7
beneficiaries are not aware how they will go.
It is evident from the reported data that only 30 to 40 percent of the beneficiaries are availing
the ambulance facility and remaining of them are dependent on private vehicles which is one of
the major contribution for out of pocket expenditure among the PWs.
Graph 4Month wise ambulance service (both to and fro) against reported deliveries from March to May 2013 – Aurangabad
Source: DHIS2
6.4. F. Display of entitlements
The signage of JSSK well displayed in PHC and above health facilities but there is no display of
any IEC material below PHC facilities.
6.4. G. Awareness of community
When enquired about JSSK entitlements with beneficiaries, there is no clear differentiation
between JSY and JSSK. Almost all aware about Rs.1400 incentives under JSY but no clarity
about JSSK entitlements like assured referral transport, diet, diagnostic and medicines for
mothers and new born babies. The source of information for PWs are ASHAs, 15 out of 15
beneficiaries informed that ASHAs are the point person for the information.
6.4. H. Grievance Redressal Cell
There is no grievance redressal mechanism available in the visited facilities, when enquired
with the beneficiaries, 8 out of 15 informed that they will approach ASHA and rest of them said
they don’t know whom to approach for their grievances.
19
56
17
51
18
76
77
6
72
8
74
4
M A R C H ' 1 3 A P R I L ' 1 3 M A Y ' 1 3
A M B U L A N C E S E R V I C E A G A I N S T D E L I V E R I E S -A U R A N G A B A D , B I H A R
Deliveries conducted at Public Institutions
Total Number of times the Ambulance was used for transporting patients during the
month

17
6.4. I. Out of pocket expenditure / informal charges
Interaction with beneficiaries revealed that out of pocket expenditure arise mostly on
transportation and drug charges. Regarding informal charges, there are some instance where
paramedics also demand money after deliveries in the health facilities.
Regarding diet, PHCs, SDH/RHs and DH empanelled agencies to provide cooked food, but
hardly any beneficiaries stay more than 6 hours in PHC and SDH/RH because most of the
deliveries are normal and complications are referred to DH or nearby private hospitals.
6.5 Janani-ShishuYojana (JSY)
JSY is known as JBSY in Bihar and the DHS trying hard to disburse the prescribed money to
beneficiary on the same day of delivery. However, it is observed that there is no pending
amount under JSY and regularly disbursing amount to the beneficiaries within one or two days
of time.
7 Child Health
7.1 SNCU7.1 SNCU7.1 SNCU7.1 SNCU
According to AHS (2011) IMR of the state was 55 and the Aurangabad was reported 48, which is
7 points below the states average. State has 484 NBCCs, 7 NBSU and 37 nutritional
rehabilitation centers. However, in the district one SNCU sanctioned and separate building has
been constructed within DH campus but yet to operational since 2 years.
Table 11 Status of different type of new born care facilities in Bihar and Aurangabad
Status NBCC NBSU SNCU NRC
Approved
Operational
Approved
Operational
Approved
Operational
Approved
Operational
Bihar 484 484 40 7 39 8 38 37
Aurangabad
11 11 1 0 1 0 1 1
Source: Bihar PIP 2013-14
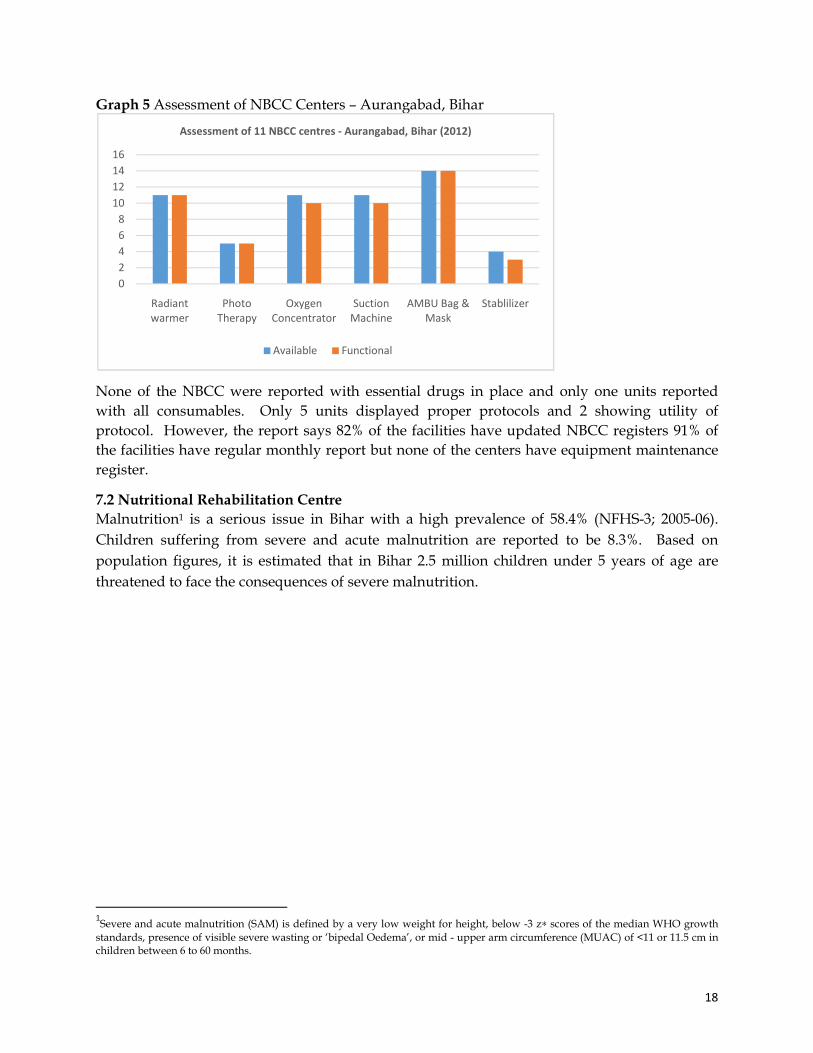
UNICEF in collaboration with State Health Society, Bihar conducted state wide quality
assessment of NBCC in April 2012. The assessment conducted in 11 NBCC in Aurangabad
district and found that only three NBCC’sare fully functional and remaining 8 NBCCs are
partially functional.45% of NBCCs are located inside labor room and remaining 55% were
reported outside of the labor room. Around 44 ANM/Staff Nurse trained and only 64% of
them possess required skills for NBCCs.
18
Graph 5 Assessment of NBCC Centers – Aurangabad, Bihar
None of the NBCC were reported with essential drugs in place and only one units reported
with all consumables. Only 5 units displayed proper protocols and 2 showing utility of
protocol. However, the report says 82% of the facilities have updated NBCC registers 91% of
the facilities have regular monthly report but none of the centers have equipment maintenance
register.
7.2 Nutritional Rehabilitation Centre
Malnutrition1 is a serious issue in Bihar with a high prevalence of 58.4% (NFHS-3; 2005-06).
Children suffering from severe and acute malnutrition are reported to be 8.3%. Based on
population figures, it is estimated that in Bihar 2.5 million children under 5 years of age are
threatened to face the consequences of severe malnutrition.
1Severe and acute malnutrition (SAM) is defined by a very low weight for height, below -3 z∗ scores of the median WHO growth
standards, presence of visible severe wasting or ‘bipedal Oedema’, or mid - upper arm circumference (MUAC) of <11 or 11.5 cm in children between 6 to 60 months.
0
2
4
6
8
10
12
14
16
Radiant
warmer
Photo
Therapy
Oxygen
Concentrator
Suction
Machine
AMBU Bag &
Mask
Stablilizer
Assessment of 11 NBCC centres - Aurangabad, Bihar (2012)
Available Functional

Graph 6 Output Indicators of NRC Aurangabad, Bihar
NRCs run through district health society via qualified NOGs and UNICEF continuously
provide technical and supervisory support to NRCs. In
hospital run by NGO. NRC, Aura
Demonstrator (FD), a cook, two helpers and a pediatrician who checks children for their
nutritional and medical needs. NRC,
batches. Total 42% children cured and discharged and 58% children were followed up till 8
week. However, no defaulter and deaths
referred to any other facilities.
male and 59% females. Of the total 83 children, 84% of children fall under 6 to 36 months and
remaining 16% fall under 37 to 60 months.
7.3 Immunization
Cumulative figures of Aurangabad from Jan
compared to Bihar state. The full immunization coverage of Aurangabad is 82%, which is 13%
higher than state average. Except BCG, all other
comparably higher than state’s average. DPT3 to Measles dropout
and Bihar, by 20% and 18%. However,
11% in Aurangabad and Bihar.
temperature card duly filled and adequate temperature maintained. In Bihar,
power supply, most of the ILR/deep freezer dependent on power generator, which were
outsourced to third party. Facility level official informed that in case of generator failure, they
depend on ice cubes which are locally available.
Output Indicators of NRC Aurangabad, Bihar
Cured (C)
Non Respondent (NR)
Deaths (D)
icators of NRC Aurangabad, Bihar
NRCs run through district health society via qualified NOGs and UNICEF continuously
provide technical and supervisory support to NRCs. In Aurangabad, NRC is located in
Aurangabad is 20 bedded facility staffed by a nurse, a Feeding
Demonstrator (FD), a cook, two helpers and a pediatrician who checks children for their
NRC, Aurangabad admitted 83 SAM children and completed
cured and discharged and 58% children were followed up till 8
week. However, no defaulter and deaths reported and none of the children were transferred or
referred to any other facilities. All admitted children belong to SC/EBC/OBC, of which
male and 59% females. Of the total 83 children, 84% of children fall under 6 to 36 months and
remaining 16% fall under 37 to 60 months.
Cumulative figures of Aurangabad from Jan to May 2013 show improved performance as
Bihar state. The full immunization coverage of Aurangabad is 82%, which is 13%
higher than state average. Except BCG, all other immunization coverage in the district
comparably higher than state’s average. DPT3 to Measles dropout observed in
and 18%. However, BCG-DPT3 drop out percentage decreased by 37% and
. Facilities visited had functional ILR and deep freezer with
temperature card duly filled and adequate temperature maintained. In Bihar,
power supply, most of the ILR/deep freezer dependent on power generator, which were
outsourced to third party. Facility level official informed that in case of generator failure, they
depend on ice cubes which are locally available.
Output Indicators of NRC Aurangabad, Bihar
Defaulter (DF)
Medical Transfer/ Referred (R)
Under follow up till 8th week
19
NRCs run through district health society via qualified NOGs and UNICEF continuously
, NRC is located in district
is 20 bedded facility staffed by a nurse, a Feeding
Demonstrator (FD), a cook, two helpers and a pediatrician who checks children for their
SAM children and completed 5
cured and discharged and 58% children were followed up till 8th
and none of the children were transferred or
to SC/EBC/OBC, of which 41%
male and 59% females. Of the total 83 children, 84% of children fall under 6 to 36 months and
improved performance as
Bihar state. The full immunization coverage of Aurangabad is 82%, which is 13%
immunization coverage in the district is
observed in Aurangabad
decreased by 37% and
Facilities visited had functional ILR and deep freezer with
temperature card duly filled and adequate temperature maintained. In Bihar, due to short of
power supply, most of the ILR/deep freezer dependent on power generator, which were
outsourced to third party. Facility level official informed that in case of generator failure, they

Graph 7 Immunization Coverage of various antigens against estimated live births from January to May 2013
The district shows good performance of planned versus held immunization sessions which
correlates with immunization achieveme
improvement shown in sessions held
immunization sessions were attended by ASHAs who are supposed to do community
mobilization.
Table 12 Immunization session held in Bihar and Aurangabad from Jan to May 2013
Immunization Sessions
Bihar
Aurangabad
8. Family Planning
Performance of family planning programmes reflects poor outcome in the
per the DLHS III, state and district has 39.2% and 41.3%
district population, total eligible couples for unmet need calculated for the
2013. 11% of the total unmet needs were catered in the district, which
state average in meeting family planning needs. Aurangabad district outperformed in
providing IUDs against total reported FP users in comparison with state, which is 17%
than the state’s average.
79%88%
73%
100%
0%
20%
40%
60%
80%
100%
120%
BCG DPT 3
% I M M U N I Z A T I O N C O V E R A G E A U R A N G A B A D
Bihar
Immunization Coverage of various antigens against estimated live births from January
performance of planned versus held immunization sessions which
correlates with immunization achievement in the district. However, in comparison with
improvement shown in sessions held. It is concern to note that only 83% to 88
immunization sessions were attended by ASHAs who are supposed to do community
mmunization session held in Bihar and Aurangabad from Jan to May 2013
% of immunization sessions held vs planned
% of immunization sessions where ASHA were present (out of the held sessions)
96% 83%
99% 88%
Performance of family planning programmes reflects poor outcome in the state and
state and district has 39.2% and 41.3% total unmet needs and on the basis of
district population, total eligible couples for unmet need calculated for the first five months of
% of the total unmet needs were catered in the district, which is 3% higher than the
family planning needs. Aurangabad district outperformed in
providing IUDs against total reported FP users in comparison with state, which is 17%
85%
72% 69%
99%
80% 82%
OPV 3 Measles Full
Immunization
% I M M U N I Z A T I O N C O V E R A G E - B I H A R A N D A U R A N G A B A D
Bihar Aurangabad
20
Immunization Coverage of various antigens against estimated live births from January
performance of planned versus held immunization sessions which
nt in the district. However, in comparison with state,
is concern to note that only 83% to 88% of
immunization sessions were attended by ASHAs who are supposed to do community
mmunization session held in Bihar and Aurangabad from Jan to May 2013
% of immunization sessions where ASHA were present (out of the held sessions)
83%
88%
state and district. As
total unmet needs and on the basis of
first five months of
% higher than the
family planning needs. Aurangabad district outperformed in
providing IUDs against total reported FP users in comparison with state, which is 17% more

21
Table 13 Family Planning Key Indicators – Bihar and Aurangabad from January to May 2013
FP Key Indicators Bihar Aurangabad
Unmet Need 39.2 41.3
Eligible Couples for unmet need- Calculated Using DLHSIII Unmet need
6917541.01 176314.371
Total reported FP Users against estimated eligible couples 8.3%
[579693] 11%
[19371]
Total IUDs reported against total reported FP users 29.4%
[170534] 47.2% [9150]
Total OCP users against total reported FP users 4%
[25400] 4%
[679] of Total sterilization (against Estimated Level of Achievement)
5% [346229]
5% [8510]
Postpartum sterilization out of total female sterilizations 1.75% [6017]
0.11% [10]
Male sterilizations out of total sterilizations 0.7%
[2458] 1.5% [126]
Female sterilizations out of total sterilizations 99.2%
[343771] 98.5% [8384]
Source: DHIS2
99% of total sterilization are female sterilization and there is a need for proper counselling for
male partners to improve the male sterilization. OCP users remain the same across state and
district and there is a need to promote OCP for spacing. However, postpartum sterilization is
very low and it seems state has already worked out the training schedule for MO to impart
skills in PPIUCDs. The unmet need (41.3) for Aurangabad district correlates well with literacy
rate of the district (72.77). Yet, there is huge gap between demand and supply but the district
health facilities are not equipped to fill the gap. There is an urgent need to appraise family
planning activities in the district, which should accommodate the needs of the district.
9. Quality in Health Services
9.1 Infection Control and Bio-Medical Waste Management
The state has outsourced the Biomedical Waste Management (BWM) system for all health
facilities from medical colleges to PHC level. MOs and paramedical staff are satisfied with
outsourced agency and they are regular in picking bio-waste. Infection prevention practices
needs improvement in all health facilities. Many of the health facilities, which visited do not
have proper coded buckets for segregation of biomedical waste management, some facilities
have coded buckets but they are in partial usage. Disposable gloves and masks are not
available almost in all health facilities. Needles and syringes are not properly mutilated and
disinfected before putting in waste bin. The district has need for additional trainings and robust
monitoring as far as infection prevention (IP) practices are concerned.
DH in Aurangabad district is ISO certified and diagnostic services are outsourced to third party
in the district. However, to improve the quality of delivery of diagnostic services, state needs to

22
develop program for capacity building and quality assurance in laboratory and radiology
services. Standardized quality norms should be maintained at sub-centre, APHC and PHC
level for delivery of effective RCH services. Supportive supervision at block level, district level
and follow-up action by state level should be streamlined.
9.2 Information Display
Information related to health programs are not well displayed in PHCs and below health
facilities. DH Aurangabad has displayed citizen charter at the entrance of DH and various
other information related to national schemes like JSSK well displayed in the DH campus.
However, no sub-center which are the first contact point for community access basic health
services, has any IEC material on any health programmes,. Proper display of information will
have a positive impact on utilization of health services and also improve the accountability
health system.
10. Community Processes
10.1 ASHA and MAMTA
The state currently has about 84,365 ASHAs, representing 97% of the total selected. As per the
revised norm, Aurangabad requires 2511 ASHAs and only 2146 ASHAs are placed, which is
about 85% of the required ASHAs. There are total 105mamatas position approved in the district
and 97 of them are placed in DH and RH/CHC hospitals.
Table 14 Block wise ASHAs against target as on April 2013
Sl. No.
Block ASHA Selection Shortfall
Target Achievement
1 Aurangabad 157 155 2
2 Daudnagar 152 151 1
3 Deo 161 161 0
4 Goh 217 215 2
5 Haspura 148 147 1
6 Kutumba 215 215 0
7 Madanpur 195 193 2
8 Nabinagar 264 264 0
9 Obra 210 209 1
10 Rafiganj 252 252 0
11 Barun 189 184 5
Total 2160 2146 14
Source: DHS, Aurangabad
The state has established support structures at state, divisional, district, block level for ASHA
functioning. There are 102 ASHA facilitator available in the district out of 103 positions
available in the district and 8 Block Community Mobilizer (BCM) available out of 11 approved
post. DCM at district level and BCM at block level take responsibility of ASHAs. The district
has identified 14 villages where ASHAs are yet to be selected. Wherever ASHAs are not
available ANMs are taking care of outreach activities.
23
10.2 Skill Development
All ASHA were trained up to module 4 and 95% (2052) of ASHA were trained in first round of
module 6 and 7, which is fully residential. Round 3rd, 4th, and 5th of module 6 and 7 yet to start.
District has distributed drug kits to all ASHAs however, no HBNC kits were distributed. The
district has identified DORD, an NGO for rolling out trainings for ASHA in the district.
10.3 Functionality of the ASHAs
There are total 10 ASHA’s dropout and 40 terminated. Reasons for dropout are lack of interest
and some of them are migrated to other areas and some expired. There is no grievance
redressal mechanism available for ASHA in the district. The process of refilling of drug kit of
ASHAs is done from PHC once in a year. The payment of ASHAs in the state and district is
through bank account and there is no pending of ASHA payment in the district. However,
ASHAs lack the provision of rest houses in the health facilities, no help desk available in the
district.
11. Disease Control Programme
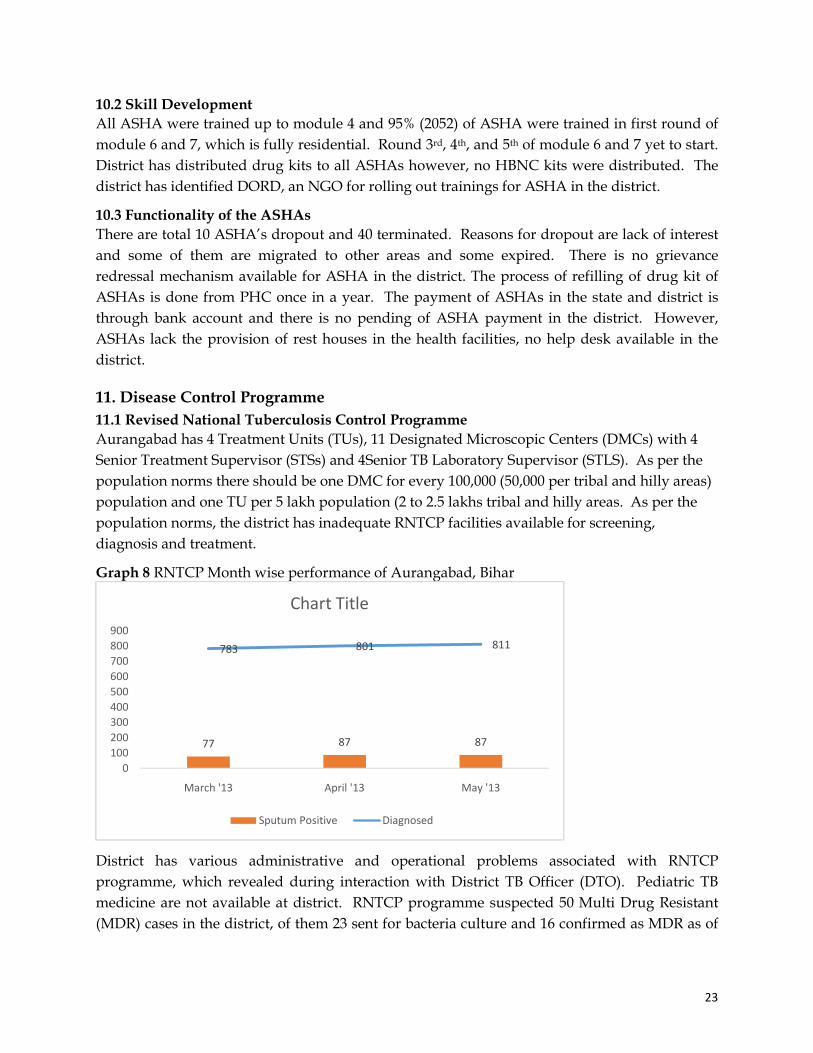
11.1 Revised National Tuberculosis Control Programme
Aurangabad has 4 Treatment Units (TUs), 11 Designated Microscopic Centers (DMCs) with 4
Senior Treatment Supervisor (STSs) and 4Senior TB Laboratory Supervisor (STLS). As per the
population norms there should be one DMC for every 100,000 (50,000 per tribal and hilly areas)
population and one TU per 5 lakh population (2 to 2.5 lakhs tribal and hilly areas. As per the
population norms, the district has inadequate RNTCP facilities available for screening,
diagnosis and treatment.
Graph 8 RNTCP Month wise performance of Aurangabad, Bihar
District has various administrative and operational problems associated with RNTCP
programme, which revealed during interaction with District TB Officer (DTO). Pediatric TB
medicine are not available at district. RNTCP programme suspected 50 Multi Drug Resistant
(MDR) cases in the district, of them 23 sent for bacteria culture and 16 confirmed as MDR as of
77 87 87
783 801 811
0
100
200
300
400
500
600
700
800
900
March '13 April '13 May '13
Chart Title
Sputum Positive Diagnosed

24
June 2013. DTCO office informed that there are two suspected Extreme Drug Resistance (XDR)
in the district but yet to confirmed.
It is observed that there is no referral linkages for TB suspect in the field, only OPD cases were
screened in the DMCs. Need for reorientation of LT training as per RNTCP modules and many
of the LTs do not have information on referral of suspected MDR cases in the district. As per
RNTCP, it is estimated 75 new smear-positive (NSP) cases per 100,000 populations and the
national target is to detect at least 70% of the total estimated cases, which is 53 cases per 100,000
population. However, the performance of the district shows far below the national target of the
total NSP cases per annum as per estimated district population.
11.2 National Leprosy Eradication Programme (NLEP)
Bihar is one of the high burden state for leprosy with a prevalence of 0.89 cases per 10,000 and
2.51 child cases per 100,000 population with 16.77 annual new case detection rate as on March
2012. There is no adequate staff for leprosy detection at PHC level and CMO is the in-charge of
DLO. There is no skin smear test available in any health facility and almost all cases were
detected based on nerve and skin patches. Total 60 cases detected in the month of April and
May 20013, which include 40 PB and 20 MB, which include 15 child cases. Around 27 cases
were released from treatment and 396 cases under treatment in the district by the end of May
2013. Every block has one non-medical assistant for leprosy outreach activities and other para-
medic staff include ASHA’s also support in leprosy outreach activities in the district. However,
health facilities do not have the capacity to treat disabilities and they refer to nearby referral
center in the district.
11.3 National Vector Borne Diseases Control Programme
As on April 2013, the state has examined 39,586 blood smear and confirmed 313 cases. Out of
313 positive cases, 21% of them are Plasmodium falciparum (Pf) cases. Aurangabad district
examined 11,612 blood smear and 84 found positive out of which 4.8% cases are Pf. Out of 80
basic health worker (BHW) sanctioned in the district only 7 BHW available and there is no
malaria LT available in the district.
Graph 9 Year wise Bihar state Malaria situation from 2009 to 2013
32
55
19
08
26
43
24
19
31
3
24
08
93
3 12
73
84
5
65
21
1 0 0 0
2 0 0 9 2 0 1 0 2 0 1 1 2 0 1 2 ( P ) 2 0 1 3 *
Y E A R W I S E M A L A R I A S I T U A T I O N - B I H A R
Malaria Cases Pf Cases Deaths

25
The district received Mass Drug Administration (MDA) stock for prevention of filariasis but
due to lack of human resources it would be a challenge for the district to distribute across 11
blocks.
Graph 10 Malaria Situation of Aurangabad between two periods 2012 and 2013 (up to May)
11.4 National Programme for Control of Blindness (NPCB)
The state has annual target of 607070 cataract operations and 85640 free spectacles to school
children out of which 46.2% and 7.1 achieved for cataracts and spectacles the end of May 2013.
The district has a target of 5000 cataracts of which only 20 achieved from April to May 2013.
Around 143 school teachers trained in screening of refractive errors in the month of April and
14,705 school going children screened out of which 85 detected with refractive error and
distributed spectacles to them.
Graph 11 State level progress of NPCB, Bihar (up to May 2013)
10336
70 0 0
11612
83 4 00
2000
4000
6000
8000
10000
12000
14000
BS Examination Positive cases Pf Deaths
Malaria situation between 2012 and 2013 (up to May)
2012 2013
607070
281067
0
100000
200000
300000
400000
500000
600000
700000
Target achieved
Cataract Operations as on May 2013 Bihar
85640
6138
0
20000
40000
60000
80000
100000
Target achieved
Free Spectacles to School Children

26
12. Others
12.1 OPD and IPD
On an average 300 OPD per 1000 population at state level and 467 OPD per 1000 population at
district level reported for the first five months of 2013. 15 and 18 IPD per 1000 population
recorded at state and district level. However, when correlated district OPD and IPD with
available human resources, it doesn’t correlate well with available resources in the district. The
staff include medical officers and staff nurse grade-A.
Graph 12 Correlation of health staff and Out Patient Attendance for the month of May 2013, Aurangabad
Referral hospitals are best positioned in terms of available human resource but the OPD attendance is far below than PHCs in the district. This correlation indicates that PHC perform better than RH with minimal human and infrastructure resources.

27
12.2 Information Systems
In Bihar, DHIS2 application is in use for HMIS and data entry takes place at block level. Block
level BPMU structure is similar to DPMU, but district and block level HMIS analysis needs to be
strengthen to provide feedback and improve the facility level performance. RHMIS indicates
85.3% facility wise data uploading in Aurangabad.
Table 15 Status of Facility Wise Data Uploading, Aurangabad
Facility No. of Facility Facility wise uploading
SC 400 338
PHC 81 72
CHC 0 0
SDH 2 2
DH 0 0
Total 483 412
Source: RHMIS
12.2a Mother and Child Tracking System (MCTS)
The below graph provides block wise MCTS performance against total expected registration as
on May 2013. Only six blocks achieved above 50% of expected registrations and Obra block
achieved the highest MCTS registrations by 82.2%.

28
Graph 13 % MCTS reported against total expected registration as on May 2013
12.3 Village Health and Nutrition Day
VHND Table 16 Block wise VHND held and ANC coverage for the month of April 2013, Aurangabad
Block Name No. of VHND Session Held
Coverage of ANC
Up to 12 week (1st )
13 to 24 week (2nd)
25 to 34 week (3rd)
More than 35 week (4th)
Aurangabad Sadar 292 280 238 154 98
Daudnagar 219 76 48 84 32
Deo 240 85 283 152 55
Goh 258 254 170 128 0
Haspura 276 204 218 152 57
Kutumba 215 122 433 242 77
Madanpur 234 137 321 165 75
Nabinagar 322 217 86 10 0
Obera 214 145 340 271 7
Rafiganj 312 180 164 184 47
Varun 219 71 224 59 1
Table 17Block wise VHND held and hemoglobin test conducted for the month of April 2013, Aurangabad
Block Name No. of VHND Session Held
Hemoglobin
Below 7 gm 7-11 gm 11+ gm
Aurangabad Sadar 292 10 250 17
Daudnagar 219 25 54 45
Deo 240 21 154 14
Goh 258 15 184 55
82.2
76.7
71.1
71.0
68.6
68.3
53.4
43.6
40.4
34.0
22.0
0.0 10.0 20.0 30.0 40.0 50.0 60.0 70.0 80.0 90.0
Obra
Madanpur
Aurangabad(PHC)
Deo
Kutumba
Goh
Barun
Haspura
Nabinagar
Daudnagar
Rafiganj
% MCTS reported against total expected registration as on May 2013

29
Haspura 276 0 122 36
Kutumba 215 0 0 0
Madanpur 234 0 13 0
Nabinagar 322 0 0 0
Obera 214 0 141 0
Rafiganj 312 4 0 5
Varun 219 0 11 0