beyond borders 2016: biotech deals - ey - united...
TRANSCRIPT
Beyond borders 2016
Biotech dealsBiotech deal market soars

DealsThe same sector optimism that spurred biotech’s financing renaissance from 2013 through 2015 has also lifted alliance and acquisition activity. In 2015, scientific advances in critical therapeutic areas and a more positive regulatory environment gave both strategic buyers and investors greater confidence when it came time to place their bets.
Facing organic growth challenges, pharma acquirers continued to see M&A as a quicker and less risky way to fill pipeline and revenue gaps. Public investors, meanwhile, continued to provide biotech companies with significant capital via initial public offerings (IPOs) and follow-on raises. This prolonged access to capital and the resulting competition for assets meant biotech management teams enjoyed multiple strategic alternatives, even as valuations began to surpass pharmaceutical buyers’ comfort levels.
Indeed, as 2014’s warm transactional climate extended into 2015, the biotech sector set new standards in multiple categories:
• Potential value of M&A deals (US$100.2 billion)• Volume of M&A deals (89 deals with disclosed terms)• Potential value of alliances (US$55.4 billion)
Most of the activity involved US-based biotechs. This cohort accounted for roughly 90% of all M&A dollars (US$90 billion) and about three-quarters of 2015’s deal volume. (Of those 89 biotechs acquired during 2015, 64 were based in the US.) US biotechs also captured 78% of the year’s potential alliance value, a metric that includes milestones and earn-outs, but not royalties.
Summary
ContentsDeals
Strategic alliances: big biotechs flex their muscle
Record year for M&A
Key dealmaking insights
United States
Europe
Appendix
Data exhibit index
3
4
5
6
12
15
18
18
3Beyond borders 2016 — Biotech deals2 Beyond borders 2016 — Biotech deals
For deals with disclosed terms, 2015’s 173 alliances, worth potentially US$55.4 billion, eclipsed 2014’s already robust totals. The average potential deal value also increased, rising from US$309 million in 2014 to US$320 million in 2015. This increase was due to a notable uptick in biotech–biotech alliances.
The potential value of intra-biotech alliances doubled from 2014 to 2015, reaching a new record of US$20.9 billion. The new high suggests that, on one hand, the industry’s largest biotechs are more regularly competing with big pharma — in terms of both capital and cultural fit — to become smaller biotechs’ preferred partners. (As we will see, biotech–biotech M&A enjoyed similarly impressive growth.) On the other hand, it also underscores the notion that big biotechs have in many cases become saddled with the same growth challenges that have made big pharmaceutical companies such avid dealmakers.
Although a significant percentage of total alliance value was tied up in earn-outs and royalty payments, biotech sellers in 2015 took in more than US$6 billion in total up-front payments, a record total. The ratio of up-front cash to total deal value reached 11%, ticking up slightly for the fourth consecutive year.
A closer analysis reveals a more nuanced picture. Interestingly, those up-front payments included a record amount tied to equity stakes. In 2015, biotechs issued equity worth more than US$1.8 billion to strategic alliance partners, the most in any year since at least 2006. For buyers accessing biotech assets and technologies, buying equity — often at a massive premium — can be both P&L–sparing and a sign of long-term interest in the partnership.
Much of the alliance activity focused on technologies or products in the gene editing, gene therapy or immuno-oncology arenas. Vertex Pharmaceuticals’ October 2015 alliance with Swiss biotech CRISPR Therapeutics is the year’s most potentially lucrative. That deal, worth up to US$2.6 billion, included a US$30 million equity investment as well as an up-front cash payment of US$70 million. It aims to use CRISPR’s gene editing platform to correct mutations in the cystic fibrosis transmembrane conductance regulator (CFTR) gene. In December 2015, CRISPR, which also counts GlaxoSmithKline and Celgene among its investors, signed another strategic arrangement, forming a rare joint venture (JV) with Bayer’s new Bayer Lifescience Center unit. As part of the JV, the German pharma will invest US$335 million to advance therapies in blood disorders, blindness and cardiovascular disease.
Juno Therapeutics, meanwhile, received the year’s largest up-front alliance payment. Celgene paid US$1 billion, including US$850 million for a 10% equity stake in the biotech, to cement the broad chimeric antigen receptor-T-cell (CAR-T) deal, which gives the New Jersey-based biotech commercial options outside the US to Juno’s programs for 10 years. What’s more, Celgene secured rights — under certain conditions — to raise its stake in Juno to up to 30% over about a decade. The deal’s structure enables a symbiotic long-term alliance in the style of Roche-Genentech or Sanofi-Regeneron. It also makes Juno less vulnerable to the ups and downs of the capital markets.
Celgene remains one of the most active strategic investors in the industry; it is also one of the most active dealmakers. In 2015, the big biotech struck a dozen deals and paid US$1.6 billion up front across four oncology alliances, in addition to its US$7.2 billion acquisition of the autoimmune-focused biotech Receptos.
Strategic alliances: big biotechs flex their muscle
Record year for M&A
Biotech deals
Although large biopharma companies have made strides in improving R&D productivity and enjoyed regulatory successes over the past few years, most still require M&A to reach their growth goals. 2015 showcased a variety of biopharma trends: targeted divestitures, focused acquisitions and significant competition for biotech assets, which, along with interest from public market investors, drove valuations higher for much of the year. Interestingly, these higher valuations may have even blunted some pharmas’ naturally acquisitive instincts.
AbbVie’s acquisition of Imbruvica developer Pharmacyclics for US$21 billion was the year’s largest biotech acquisition and illustrated the competitive deal environment. As a result of the acquisition, AbbVie gained an immediate and significant presence in the hematology/oncology marketplace, but only partial ownership of Imbruvica.
Recall that in 2011, Pharmacyclics licensed its key asset to Johnson & Johnson. To most industry observers, that previous alliance meant the diversified pharma was Pharmacyclics’ most natural suitor. Yet competition for the recently approved asset was fierce: in addition to bids by J&J and AbbVie, a proposal by a third undisclosed pharma helped drive the terms above the US$20 billion mark.
Analysts questioned the take-out valuation, which was about a 40% premium to where the biotech’s shares were trading before deal rumors started. However, most understood the underlying strategy: buying Pharmacyclics helps AbbVie diversify its revenue base as potential biosimilar competition looms for its autoimmune therapy Humira. That product, which generated more than US$14 billion in 2015 sales, accounted for more than 61% of AbbVie’s total 2015 revenue.
The AbbVie/Pharmacyclics transaction may be better understood as 2015’s exception rather than its rule. In fact, the biotechnology sector’s record M&A metrics arrive despite the professed reluctance of most buyers to overspend on biotech targets. Throughout 2015, large pharmaceutical companies repeatedly cautioned that biotech valuations were giving executives pause and therefore analysts shouldn’t expect a deal deluge.
Indeed, one of the most talked about “buyers” in 2015 was Gilead Sciences, a company that has historically wielded its M&A acumen and strong balance sheet to bolster its product pipeline. In September 2015, the company raised US$10 billion in debt, a move that increased analysts’ expectations that the big biotech would pursue an acquisition. As 2016 unfolds, Gilead has yet to announce a major transaction. However, biotech valuations have dropped precipitously due to a variety of factors, including concerns over drug pricing, uncertainty in the global market and sector rotation. With deal valuations no longer eye-popping, Gilead and other interested acquirers may be motivated to look anew at others’ promising pipeline assets.
Beyond Gilead, several big biotechs have the financial wherewithal to pursue a robust dealmaking agenda in 2016. As we wrote in the Firepower Index and Growth Gap Report 2016, payer strategies to contain costs increase the imperative for leading biotechs and pharmas to use their firepower to complement internal R&D successes, bolster therapeutic and geographic strongholds, and fill strategic gaps. 2015’s biggest deals suggest industry’s firepower is already being put to use to do just that: the top dozen acquisitions (by potential deal value) were for biotechs with on-market products and/or late-stage clinical assets.
2015 showcased a variety of biopharma trends: targeted divestitures, focused acquisitions and significant competition for biotech assets.
5Beyond borders 2016 — Biotech deals4 Beyond borders 2016 — Biotech deals
Key dealmaking insights
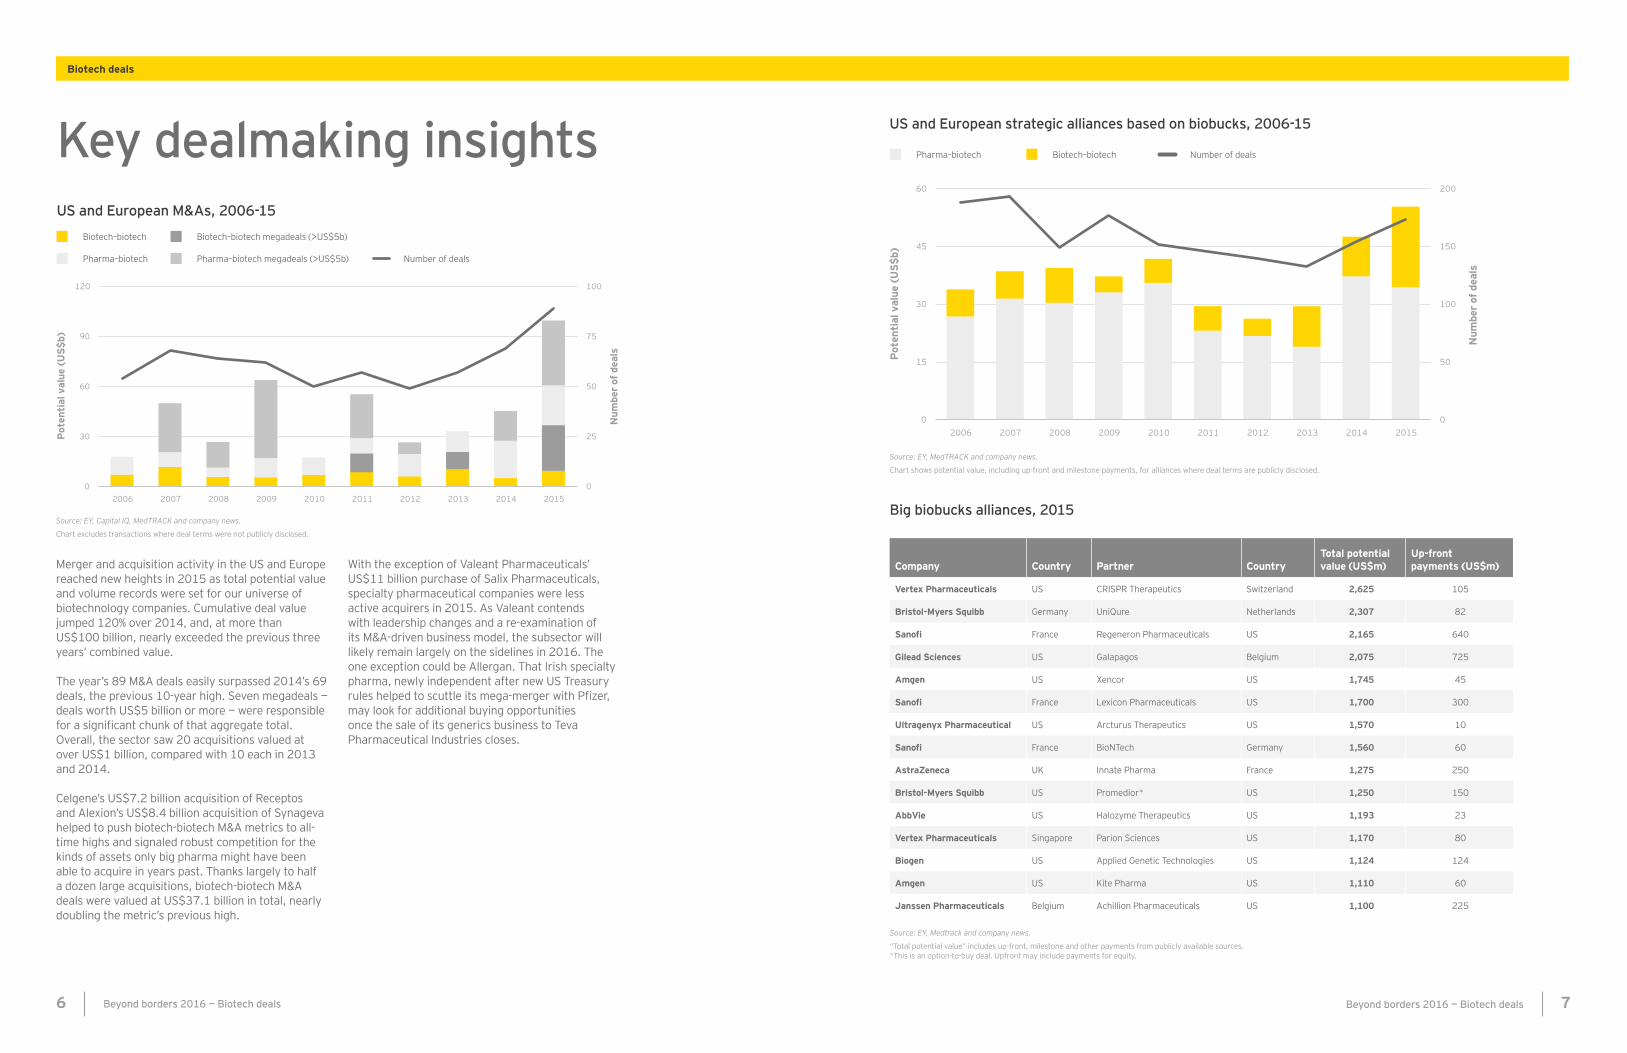
Merger and acquisition activity in the US and Europe reached new heights in 2015 as total potential value and volume records were set for our universe of biotechnology companies. Cumulative deal value jumped 120% over 2014, and, at more than US$100 billion, nearly exceeded the previous three years’ combined value.
The year’s 89 M&A deals easily surpassed 2014’s 69 deals, the previous 10-year high. Seven megadeals — deals worth US$5 billion or more — were responsible for a significant chunk of that aggregate total. Overall, the sector saw 20 acquisitions valued at over US$1 billion, compared with 10 each in 2013 and 2014.
Celgene’s US$7.2 billion acquisition of Receptos and Alexion’s US$8.4 billion acquisition of Synageva helped to push biotech-biotech M&A metrics to all-time highs and signaled robust competition for the kinds of assets only big pharma might have been able to acquire in years past. Thanks largely to half a dozen large acquisitions, biotech-biotech M&A deals were valued at US$37.1 billion in total, nearly doubling the metric’s previous high.
With the exception of Valeant Pharmaceuticals’ US$11 billion purchase of Salix Pharmaceuticals, specialty pharmaceutical companies were less active acquirers in 2015. As Valeant contends with leadership changes and a re-examination of its M&A-driven business model, the subsector will likely remain largely on the sidelines in 2016. The one exception could be Allergan. That Irish specialty pharma, newly independent after new US Treasury rules helped to scuttle its mega-merger with Pfizer, may look for additional buying opportunities once the sale of its generics business to Teva Pharmaceutical Industries closes.
US and European M&As, 2006-15
Source: EY, Capital IQ, MedTRACK and company news.
Chart excludes transactions where deal terms were not publicly disclosed.
Biotech–biotech megadeals (>US$5b)Biotech–biotech
Pharma–biotech Pharma–biotech megadeals (>US$5b) Number of deals
Big biobucks alliances, 2015
Source: EY, Medtrack and company news.
“Total potential value” includes up-front, milestone and other payments from publicly available sources.*This is an option-to-buy deal. Upfront may include payments for equity.
Company Country Partner CountryTotal potential value (US$m)
Up-front payments (US$m)
Vertex Pharmaceuticals US CRISPR Therapeutics Switzerland 2,625 105
Bristol-Myers Squibb Germany UniQure Netherlands 2,307 82
Sanofi France Regeneron Pharmaceuticals US 2,165 640
Gilead Sciences US Galapagos Belgium 2,075 725
Amgen US Xencor US 1,745 45
Sanofi France Lexicon Pharmaceuticals US 1,700 300
Ultragenyx Pharmaceutical US Arcturus Therapeutics US 1,570 10
Sanofi France BioNTech Germany 1,560 60
AstraZeneca UK Innate Pharma France 1,275 250
Bristol-Myers Squibb US Promedior* US 1,250 150
AbbVie US Halozyme Therapeutics US 1,193 23
Vertex Pharmaceuticals Singapore Parion Sciences US 1,170 80
Biogen US Applied Genetic Technologies US 1,124 124
Amgen US Kite Pharma US 1,110 60
Janssen Pharmaceuticals Belgium Achillion Pharmaceuticals US 1,100 225
Biotech deals
US and European strategic alliances based on biobucks, 2006-15
Biotech–biotechPharma–biotech Number of deals
Source: EY, MedTRACK and company news.
Chart shows potential value, including up-front and milestone payments, for alliances where deal terms are publicly disclosed.
7Beyond borders 2016 — Biotech deals6 Beyond borders 2016 — Biotech deals
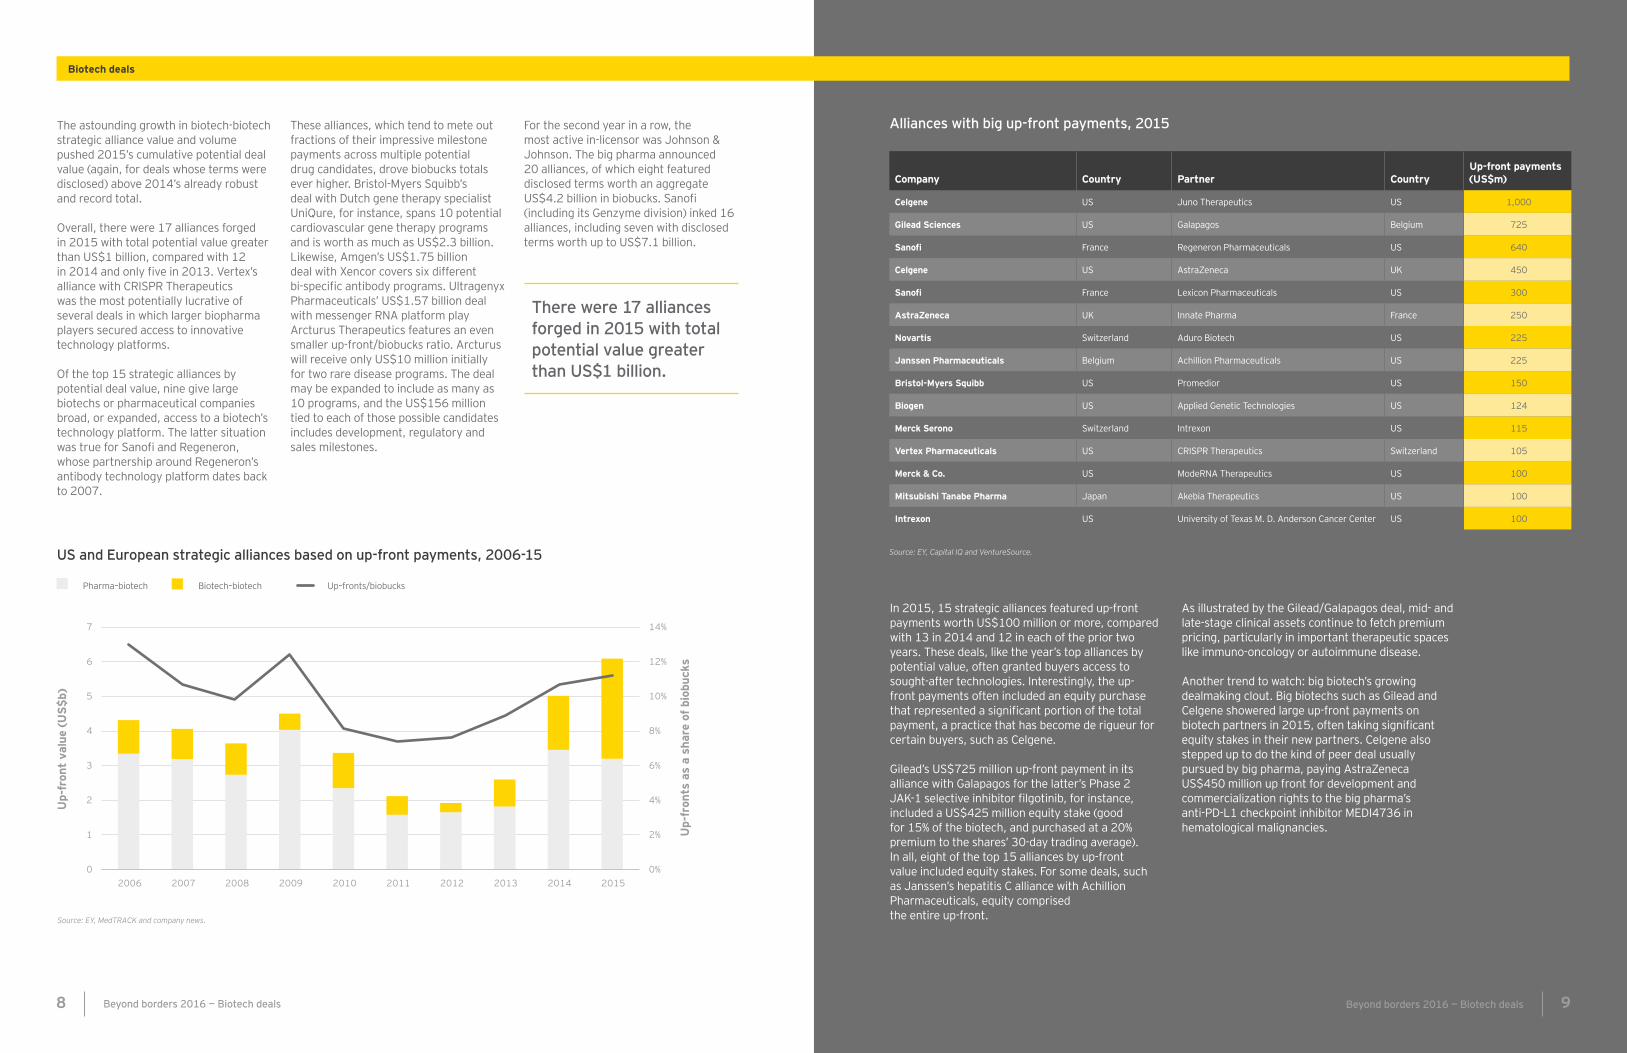
The astounding growth in biotech-biotech strategic alliance value and volume pushed 2015’s cumulative potential deal value (again, for deals whose terms were disclosed) above 2014’s already robust and record total.
Overall, there were 17 alliances forged in 2015 with total potential value greater than US$1 billion, compared with 12 in 2014 and only five in 2013. Vertex’s alliance with CRISPR Therapeutics was the most potentially lucrative of several deals in which larger biopharma players secured access to innovative technology platforms.
Of the top 15 strategic alliances by potential deal value, nine give large biotechs or pharmaceutical companies broad, or expanded, access to a biotech’s technology platform. The latter situation was true for Sanofi and Regeneron, whose partnership around Regeneron’s antibody technology platform dates back to 2007.
These alliances, which tend to mete out fractions of their impressive milestone payments across multiple potential drug candidates, drove biobucks totals ever higher. Bristol-Myers Squibb’s deal with Dutch gene therapy specialist UniQure, for instance, spans 10 potential cardiovascular gene therapy programs and is worth as much as US$2.3 billion. Likewise, Amgen’s US$1.75 billion deal with Xencor covers six different bi-specific antibody programs. Ultragenyx Pharmaceuticals’ US$1.57 billion deal with messenger RNA platform play Arcturus Therapeutics features an even smaller up-front/biobucks ratio. Arcturus will receive only US$10 million initially for two rare disease programs. The deal may be expanded to include as many as 10 programs, and the US$156 million tied to each of those possible candidates includes development, regulatory and sales milestones.
For the second year in a row, the most active in-licensor was Johnson & Johnson. The big pharma announced 20 alliances, of which eight featured disclosed terms worth an aggregate US$4.2 billion in biobucks. Sanofi (including its Genzyme division) inked 16 alliances, including seven with disclosed terms worth up to US$7.1 billion.
US and European strategic alliances based on up-front payments, 2006-15
Pharma–biotech Biotech–biotech Up –fronts/biobucks
Source: EY, MedTRACK and company news.
There were 17 alliances forged in 2015 with total potential value greater than US$1 billion.
Source: EY, Capital IQ and VentureSource.
In 2015, 15 strategic alliances featured up-front payments worth US$100 million or more, compared with 13 in 2014 and 12 in each of the prior two years. These deals, like the year’s top alliances by potential value, often granted buyers access to sought-after technologies. Interestingly, the up-front payments often included an equity purchase that represented a significant portion of the total payment, a practice that has become de rigueur for certain buyers, such as Celgene.
Gilead’s US$725 million up-front payment in its alliance with Galapagos for the latter’s Phase 2 JAK-1 selective inhibitor filgotinib, for instance, included a US$425 million equity stake (good for 15% of the biotech, and purchased at a 20% premium to the shares’ 30-day trading average). In all, eight of the top 15 alliances by up-front value included equity stakes. For some deals, such as Janssen’s hepatitis C alliance with Achillion Pharmaceuticals, equity comprised the entire up-front.
As illustrated by the Gilead/Galapagos deal, mid- and late-stage clinical assets continue to fetch premium pricing, particularly in important therapeutic spaces like immuno-oncology or autoimmune disease.
Another trend to watch: big biotech’s growing dealmaking clout. Big biotechs such as Gilead and Celgene showered large up-front payments on biotech partners in 2015, often taking significant equity stakes in their new partners. Celgene also stepped up to do the kind of peer deal usually pursued by big pharma, paying AstraZeneca US$450 million up front for development and commercialization rights to the big pharma’s anti-PD-L1 checkpoint inhibitor MEDI4736 in hematological malignancies.
Alliances with big up-front payments, 2015
Company Country Partner CountryUp-front payments (US$m)
Celgene US Juno Therapeutics US 1,000
Gilead Sciences US Galapagos Belgium 725
Sanofi France Regeneron Pharmaceuticals US 640
Celgene US AstraZeneca UK 450
Sanofi France Lexicon Pharmaceuticals US 300
AstraZeneca UK Innate Pharma France 250
Novartis Switzerland Aduro Biotech US 225
Janssen Pharmaceuticals Belgium Achillion Pharmaceuticals US 225
Bristol-Myers Squibb US Promedior US 150
Biogen US Applied Genetic Technologies US 124
Merck Serono Switzerland Intrexon US 115
Vertex Pharmaceuticals US CRISPR Therapeutics Switzerland 105
Merck & Co. US ModeRNA Therapeutics US 100
Mitsubishi Tanabe Pharma Japan Akebia Therapeutics US 100
Intrexon US University of Texas M. D. Anderson Cancer Center US 100
Biotech deals
9Beyond borders 2016 — Biotech deals8 Beyond borders 2016 — Biotech deals
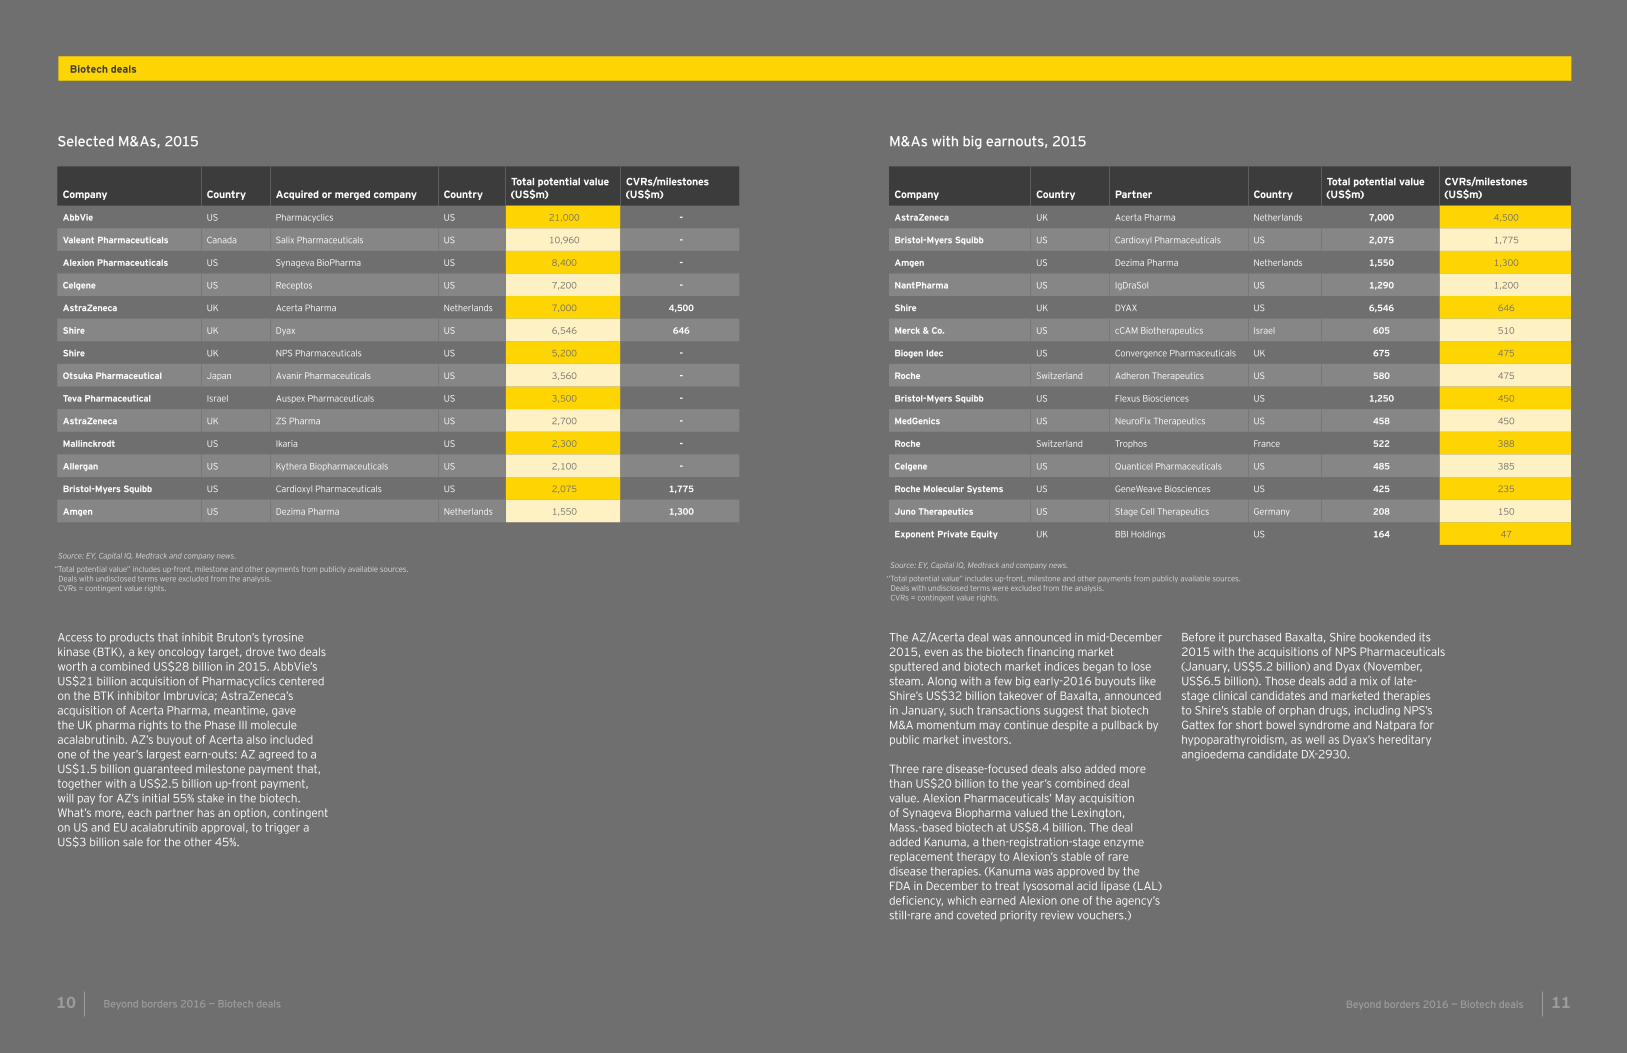
Selected M&As, 2015
Source: EY, Capital IQ, Medtrack and company news.
“Total potential value” includes up-front, milestone and other payments from publicly available sources. Deals with undisclosed terms were excluded from the analysis. CVRs = contingent value rights.
Company Country Acquired or merged company CountryTotal potential value (US$m)
CVRs/milestones (US$m)
AbbVie US Pharmacyclics US 21,000 -
Valeant Pharmaceuticals Canada Salix Pharmaceuticals US 10,960 -
Alexion Pharmaceuticals US Synageva BioPharma US 8,400 -
Celgene US Receptos US 7,200 -
AstraZeneca UK Acerta Pharma Netherlands 7,000 4,500
Shire UK Dyax US 6,546 646
Shire UK NPS Pharmaceuticals US 5,200 -
Otsuka Pharmaceutical Japan Avanir Pharmaceuticals US 3,560 -
Teva Pharmaceutical Israel Auspex Pharmaceuticals US 3,500 -
AstraZeneca UK ZS Pharma US 2,700 -
Mallinckrodt US Ikaria US 2,300 -
Allergan US Kythera Biopharmaceuticals US 2,100 -
Bristol-Myers Squibb US Cardioxyl Pharmaceuticals US 2,075 1,775
Amgen US Dezima Pharma Netherlands 1,550 1,300
Access to products that inhibit Bruton’s tyrosine kinase (BTK), a key oncology target, drove two deals worth a combined US$28 billion in 2015. AbbVie’s US$21 billion acquisition of Pharmacyclics centered on the BTK inhibitor Imbruvica; AstraZeneca’s acquisition of Acerta Pharma, meantime, gave the UK pharma rights to the Phase III molecule acalabrutinib. AZ’s buyout of Acerta also included one of the year’s largest earn-outs: AZ agreed to a US$1.5 billion guaranteed milestone payment that, together with a US$2.5 billion up-front payment, will pay for AZ’s initial 55% stake in the biotech. What’s more, each partner has an option, contingent on US and EU acalabrutinib approval, to trigger a US$3 billion sale for the other 45%.
The AZ/Acerta deal was announced in mid-December 2015, even as the biotech financing market sputtered and biotech market indices began to lose steam. Along with a few big early-2016 buyouts like Shire’s US$32 billion takeover of Baxalta, announced in January, such transactions suggest that biotech M&A momentum may continue despite a pullback by public market investors.
Three rare disease-focused deals also added more than US$20 billion to the year’s combined deal value. Alexion Pharmaceuticals’ May acquisition of Synageva Biopharma valued the Lexington, Mass.-based biotech at US$8.4 billion. The deal added Kanuma, a then-registration-stage enzyme replacement therapy to Alexion’s stable of rare disease therapies. (Kanuma was approved by the FDA in December to treat lysosomal acid lipase (LAL) deficiency, which earned Alexion one of the agency’s still-rare and coveted priority review vouchers.)
Before it purchased Baxalta, Shire bookended its 2015 with the acquisitions of NPS Pharmaceuticals (January, US$5.2 billion) and Dyax (November, US$6.5 billion). Those deals add a mix of late-stage clinical candidates and marketed therapies to Shire’s stable of orphan drugs, including NPS’s Gattex for short bowel syndrome and Natpara for hypoparathyroidism, as well as Dyax’s hereditary angioedema candidate DX-2930.
M&As with big earnouts, 2015
Company Country Partner CountryTotal potential value (US$m)
CVRs/milestones (US$m)
AstraZeneca UK Acerta Pharma Netherlands 7,000 4,500
Bristol-Myers Squibb US Cardioxyl Pharmaceuticals US 2,075 1,775
Amgen US Dezima Pharma Netherlands 1,550 1,300
NantPharma US IgDraSol US 1,290 1,200
Shire UK DYAX US 6,546 646
Merck & Co. US cCAM Biotherapeutics Israel 605 510
Biogen Idec US Convergence Pharmaceuticals UK 675 475
Roche Switzerland Adheron Therapeutics US 580 475
Bristol-Myers Squibb US Flexus Biosciences US 1,250 450
MedGenics US NeuroFix Therapeutics US 458 450
Roche Switzerland Trophos France 522 388
Celgene US Quanticel Pharmaceuticals US 485 385
Roche Molecular Systems US GeneWeave Biosciences US 425 235
Juno Therapeutics US Stage Cell Therapeutics Germany 208 150
Exponent Private Equity UK BBI Holdings US 164 47
Source: EY, Capital IQ, Medtrack and company news.
“Total potential value” includes up-front, milestone and other payments from publicly available sources.Deals with undisclosed terms were excluded from the analysis.CVRs = contingent value rights.
Biotech deals
11Beyond borders 2016 — Biotech deals10 Beyond borders 2016 — Biotech deals
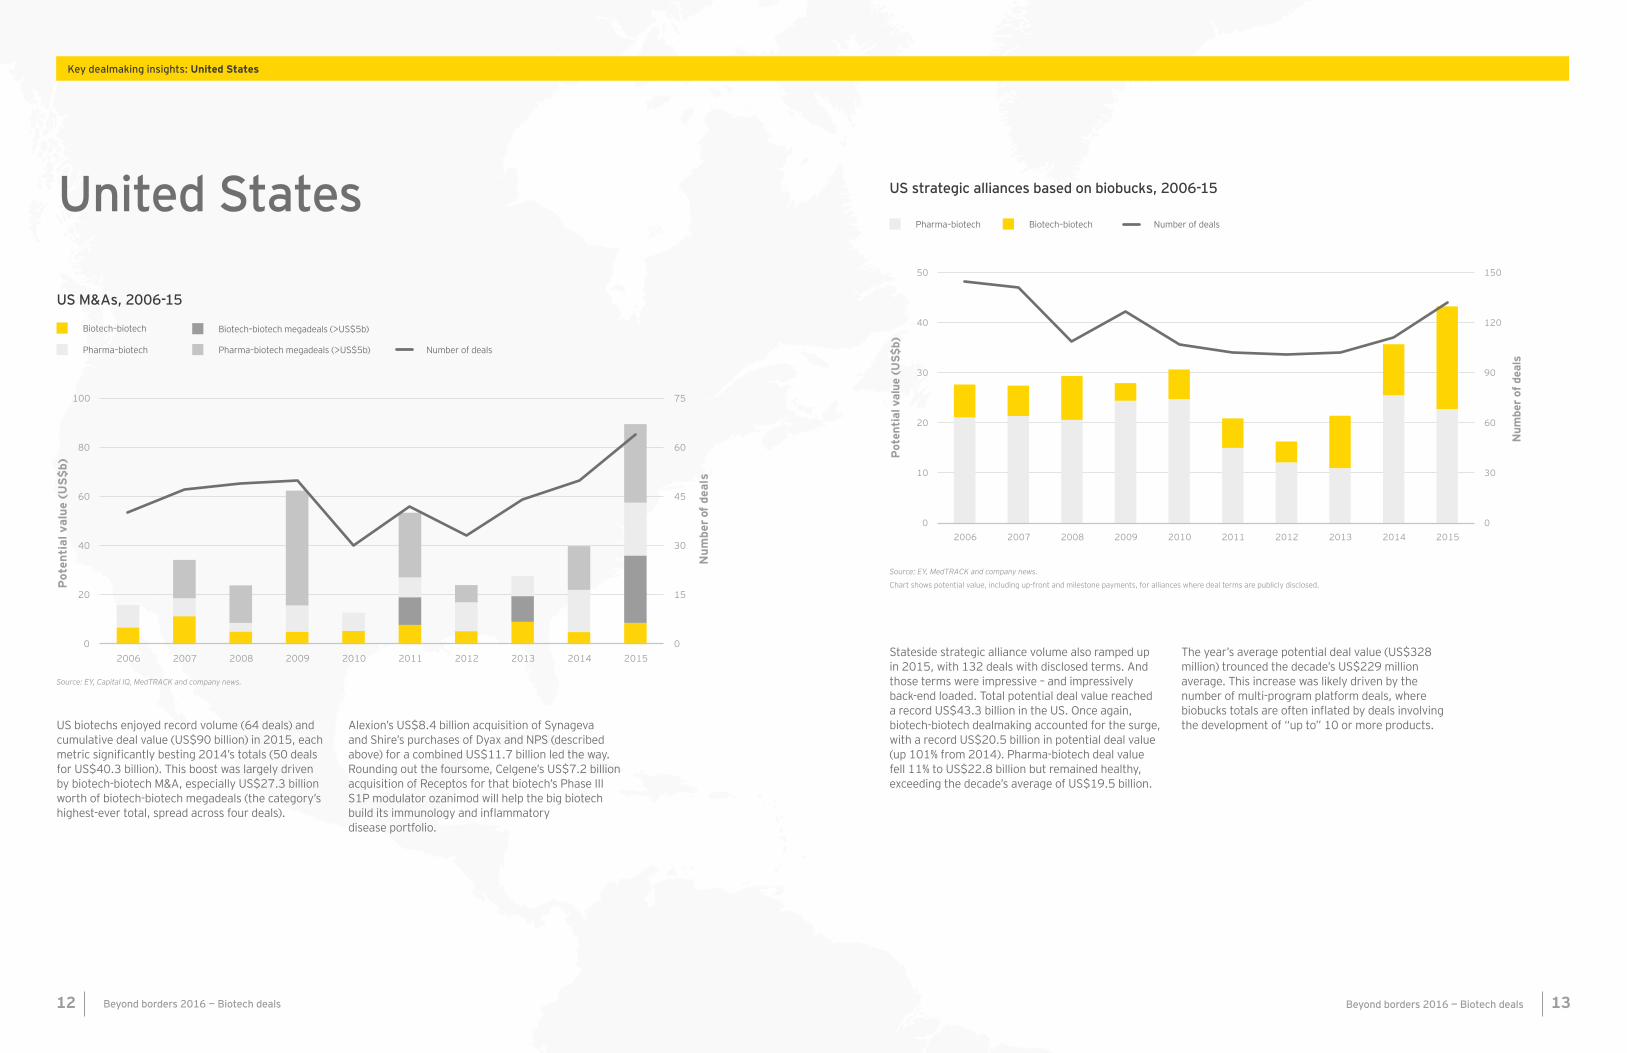
US M&As, 2006-15
United States
US biotechs enjoyed record volume (64 deals) and cumulative deal value (US$90 billion) in 2015, each metric significantly besting 2014’s totals (50 deals for US$40.3 billion). This boost was largely driven by biotech-biotech M&A, especially US$27.3 billion worth of biotech-biotech megadeals (the category’s highest-ever total, spread across four deals).
Alexion’s US$8.4 billion acquisition of Synageva and Shire’s purchases of Dyax and NPS (described above) for a combined US$11.7 billion led the way. Rounding out the foursome, Celgene’s US$7.2 billion acquisition of Receptos for that biotech’s Phase III S1P modulator ozanimod will help the big biotech build its immunology and inflammatory disease portfolio.
Key dealmaking insights: United States
Biotech–biotech megadeals (>US$5b)Biotech–biotech
Pharma–biotech Pharma–biotech megadeals (>US$5b) Number of deals
Source: EY, Capital IQ, MedTRACK and company news.
0
15
30
45
60
75
0
20
40
60
80
100
2006 2007 2008 2009 2010 2011 2012 2013 2014 2015
Num
ber o
f de
als
Pot
enti
al v
alue
(U
S$b
)
Stateside strategic alliance volume also ramped up in 2015, with 132 deals with disclosed terms. And those terms were impressive – and impressively back-end loaded. Total potential deal value reached a record US$43.3 billion in the US. Once again, biotech-biotech dealmaking accounted for the surge, with a record US$20.5 billion in potential deal value (up 101% from 2014). Pharma-biotech deal value fell 11% to US$22.8 billion but remained healthy, exceeding the decade’s average of US$19.5 billion.
The year’s average potential deal value (US$328 million) trounced the decade’s US$229 million average. This increase was likely driven by the number of multi-program platform deals, where biobucks totals are often inflated by deals involving the development of “up to” 10 or more products.
US strategic alliances based on biobucks, 2006-15
Pharma–biotech Biotech–biotech Number of deals
Source: EY, MedTRACK and company news.
Chart shows potential value, including up-front and milestone payments, for alliances where deal terms are publicly disclosed.
13Beyond borders 2016 — Biotech deals12 Beyond borders 2016 — Biotech deals
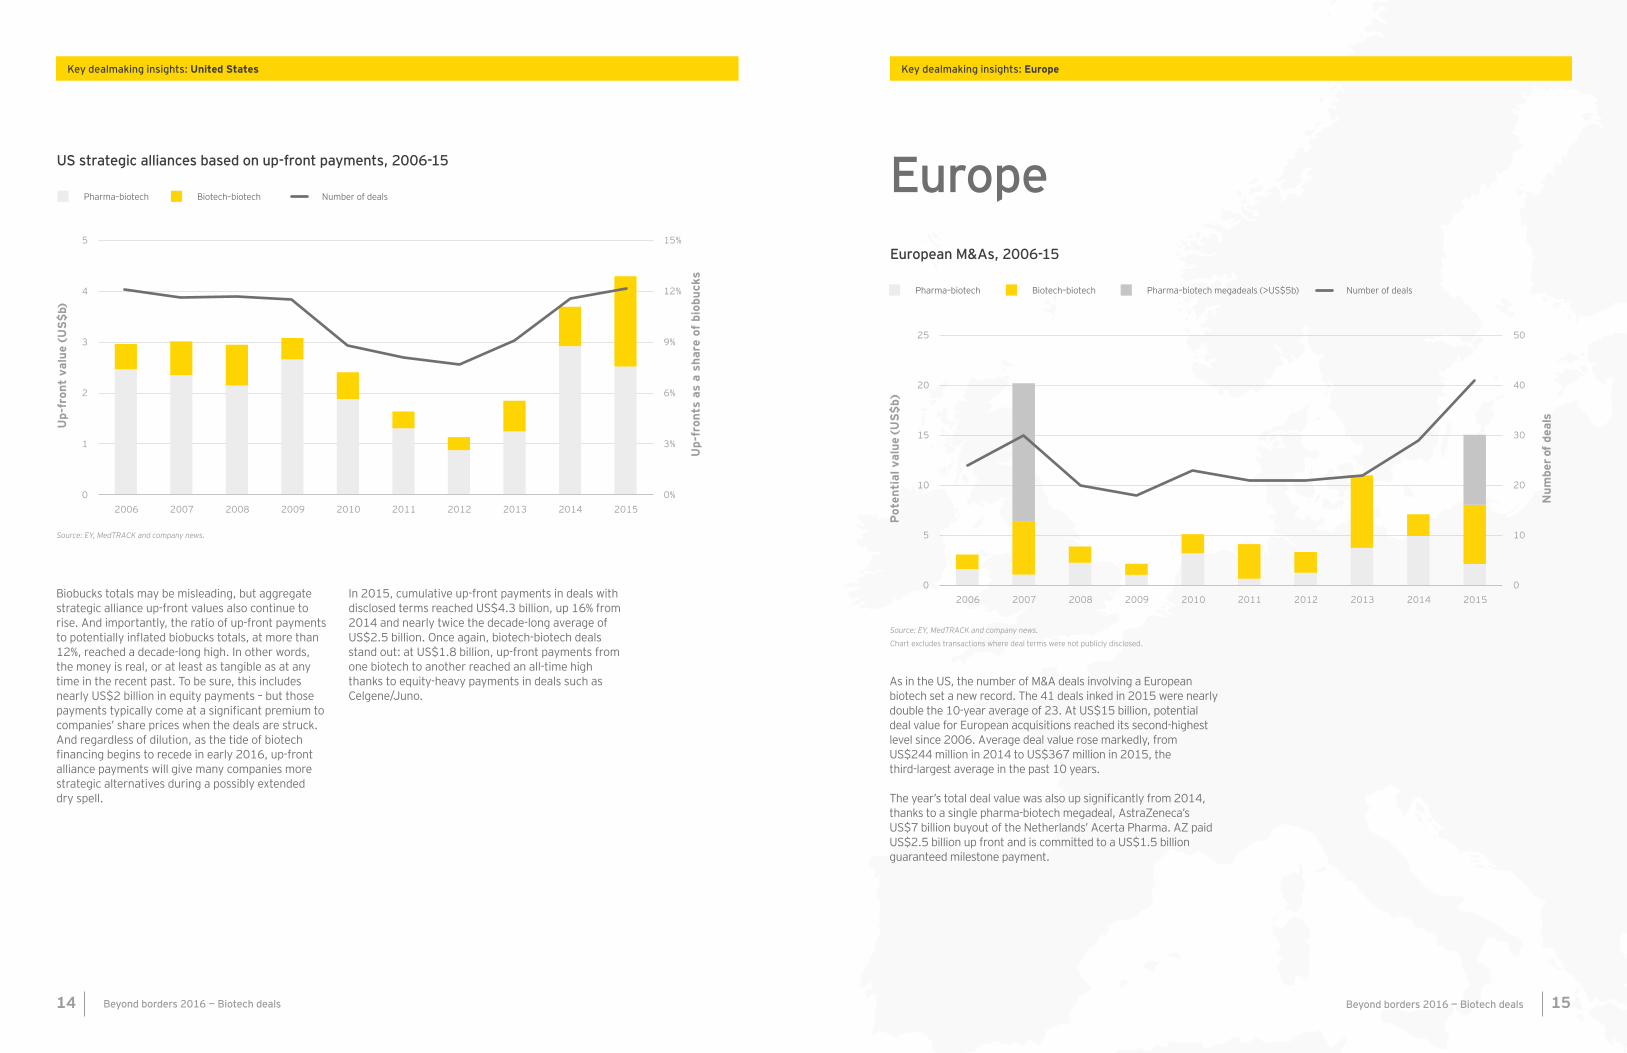
Biobucks totals may be misleading, but aggregate strategic alliance up-front values also continue to rise. And importantly, the ratio of up-front payments to potentially inflated biobucks totals, at more than 12%, reached a decade-long high. In other words, the money is real, or at least as tangible as at any time in the recent past. To be sure, this includes nearly US$2 billion in equity payments – but those payments typically come at a significant premium to companies’ share prices when the deals are struck. And regardless of dilution, as the tide of biotech financing begins to recede in early 2016, up-front alliance payments will give many companies more strategic alternatives during a possibly extended dry spell.
In 2015, cumulative up-front payments in deals with disclosed terms reached US$4.3 billion, up 16% from 2014 and nearly twice the decade-long average of US$2.5 billion. Once again, biotech-biotech deals stand out: at US$1.8 billion, up-front payments from one biotech to another reached an all-time high thanks to equity-heavy payments in deals such as Celgene/Juno.
US strategic alliances based on up-front payments, 2006-15
Source: EY, MedTRACK and company news.
0%
3%
6%
9%
12%
15%
0
1
2
3
4
5
2006 2007 2008 2009 2010 2011 2012 2013 2014 2015
Up-
fron
ts a
s a
shar
e of
bio
buck
s
Up-
fron
t va
lue
(US
$b)
Pharma–biotech Biotech–biotech Number of deals
As in the US, the number of M&A deals involving a European biotech set a new record. The 41 deals inked in 2015 were nearly double the 10-year average of 23. At US$15 billion, potential deal value for European acquisitions reached its second-highest level since 2006. Average deal value rose markedly, from US$244 million in 2014 to US$367 million in 2015, the third-largest average in the past 10 years.
The year’s total deal value was also up significantly from 2014, thanks to a single pharma-biotech megadeal, AstraZeneca’s US$7 billion buyout of the Netherlands’ Acerta Pharma. AZ paid US$2.5 billion up front and is committed to a US$1.5 billion guaranteed milestone payment.
Europe
Key dealmaking insights: Europe
0
10
20
30
40
50
0
5
10
15
20
25
2006 2007 2008 2009 2010 2011 2012 2013 2014 2015
Num
ber o
f de
als
Pot
enti
al v
alue
(US
$b)
European M&As, 2006-15
Biotech–biotechPharma–biotech Number of dealsPharma–biotech megadeals (>US$5b)
Source: EY, MedTRACK and company news.
Chart excludes transactions where deal terms were not publicly disclosed.
Key dealmaking insights: United States
15Beyond borders 2016 — Biotech deals14 Beyond borders 2016 — Biotech deals
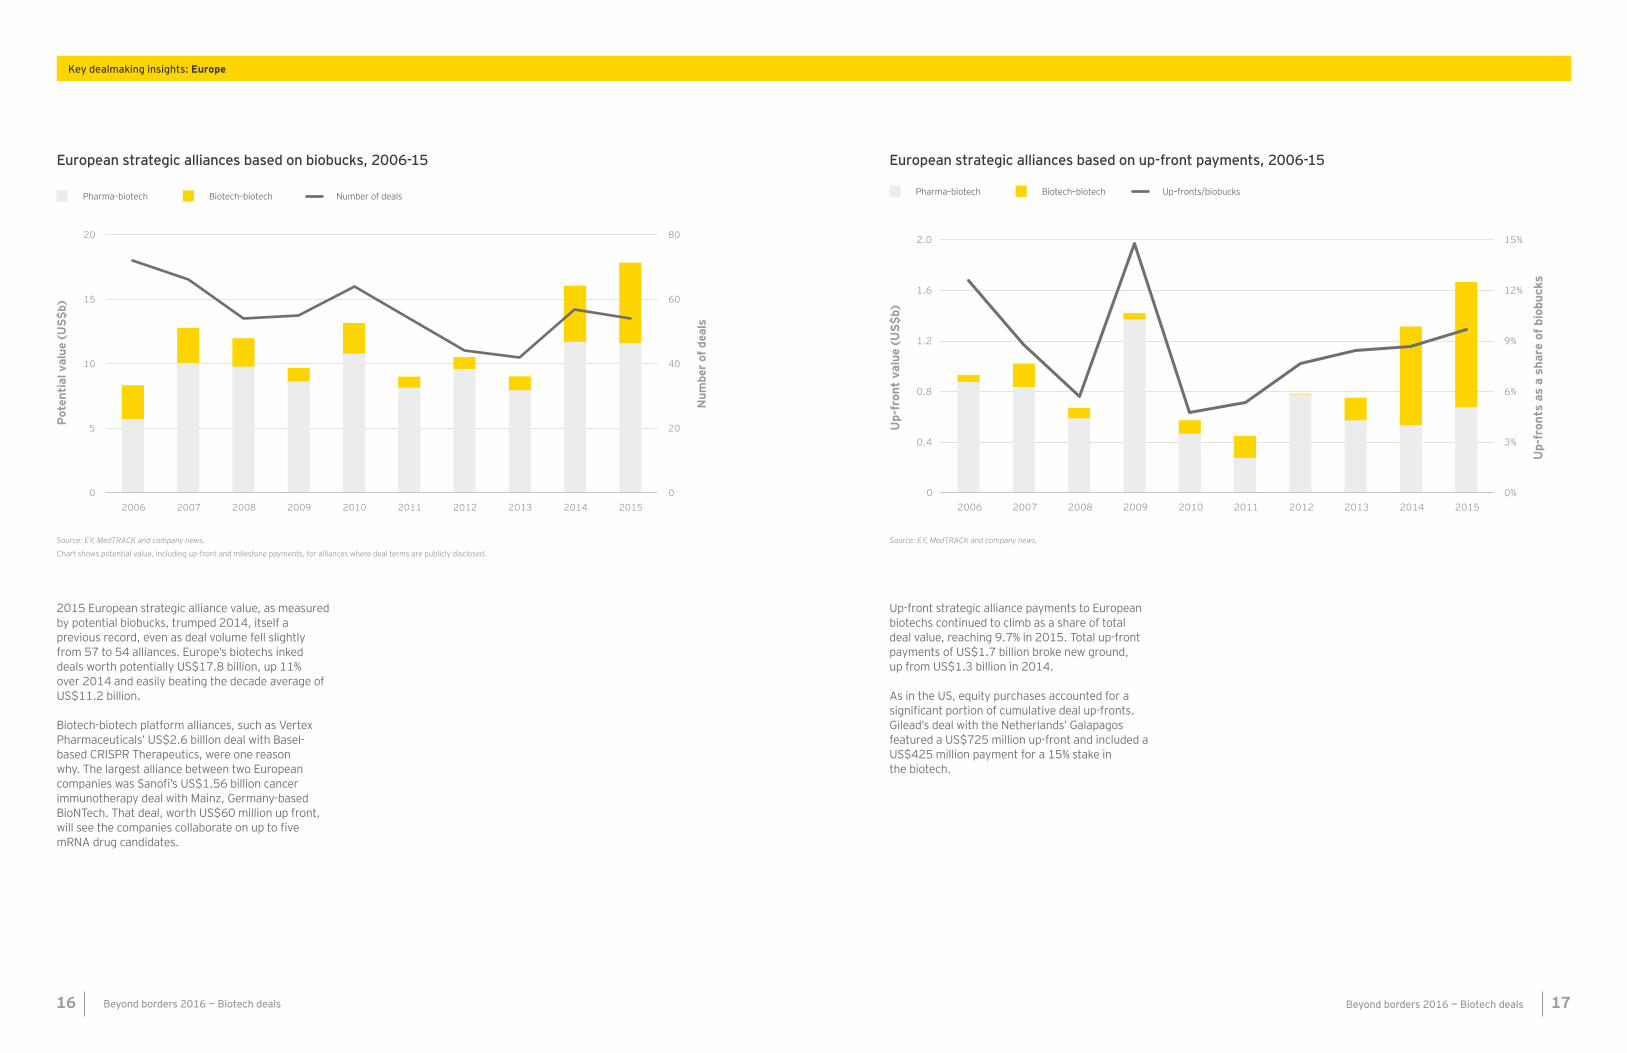
European strategic alliances based on biobucks, 2006-15
Biotech–biotechPharma–biotech Number of deals
Source: EY, MedTRACK and company news.
Chart shows potential value, including up-front and milestone payments, for alliances where deal terms are publicly disclosed.
2015 European strategic alliance value, as measured by potential biobucks, trumped 2014, itself a previous record, even as deal volume fell slightly from 57 to 54 alliances. Europe’s biotechs inked deals worth potentially US$17.8 billion, up 11% over 2014 and easily beating the decade average of US$11.2 billion.
Biotech-biotech platform alliances, such as Vertex Pharmaceuticals’ US$2.6 billion deal with Basel-based CRISPR Therapeutics, were one reason why. The largest alliance between two European companies was Sanofi’s US$1.56 billion cancer immunotherapy deal with Mainz, Germany-based BioNTech. That deal, worth US$60 million up front, will see the companies collaborate on up to five mRNA drug candidates.
Up-front strategic alliance payments to European biotechs continued to climb as a share of total deal value, reaching 9.7% in 2015. Total up-front payments of US$1.7 billion broke new ground, up from US$1.3 billion in 2014.
As in the US, equity purchases accounted for a significant portion of cumulative deal up-fronts. Gilead’s deal with the Netherlands’ Galapagos featured a US$725 million up-front and included a US$425 million payment for a 15% stake in the biotech.
European strategic alliances based on up-front payments, 2006-15
Biotech–biotechPharma–biotech Up–fronts/biobucks
Source: EY, MedTRACK and company news.
Key dealmaking insights: Europe
17Beyond borders 2016 — Biotech deals16 Beyond borders 2016 — Biotech deals
Data exhibit index
Figurentents
US and European M&As, 2006-15
US and European strategic alliances based on biobucks, 2006-15
Big biobucks alliances, 2015
US and European strategic alliances based on up-front payments, 2006-15
Alliances with big up-front payments, 2015
Selected M&As, 2015
M&As with big earnouts, 2015
US M&As, 2006–15
US strategic alliances based on biobucks, 2006-15
US strategic alliances based on up-front payments, 2006-15
European M&As, 2006-15
European strategic alliances based on biobucks, 2006-15
European strategic alliances based on up-front payments, 2006-15
Page
6
7
7
8
9
10
11
12
13
14
15
16
17
Placeholder for the Financing report
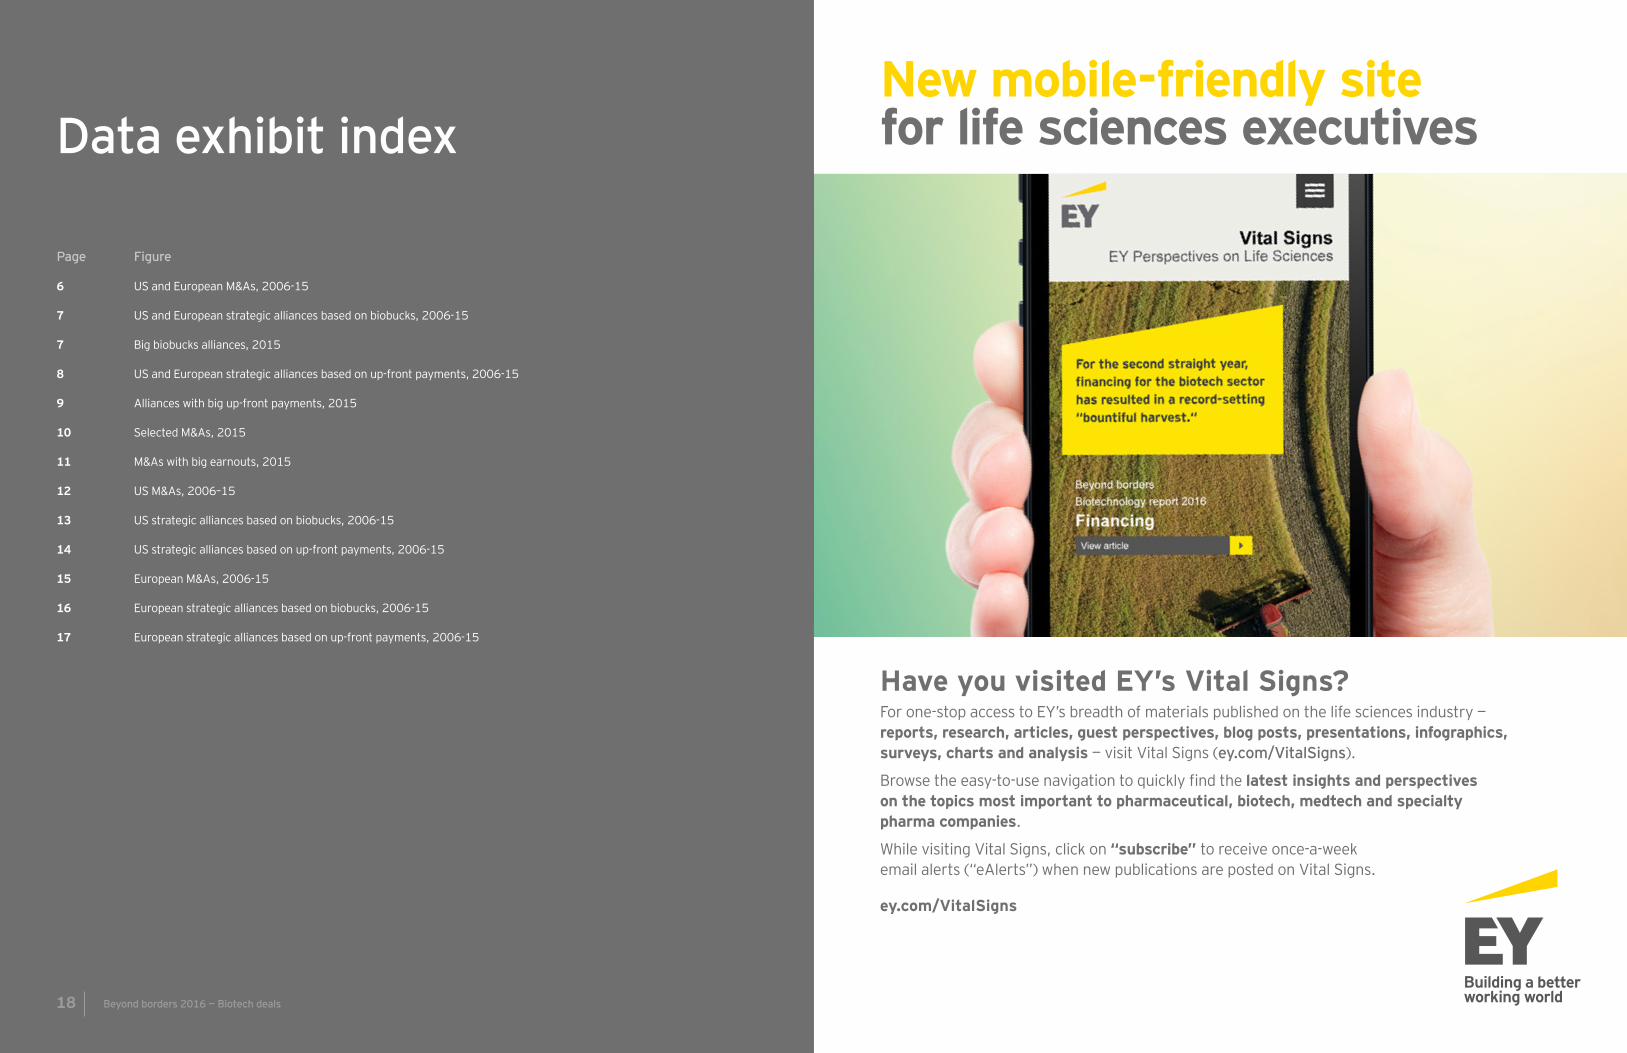
Have you visited EY’s Vital Signs? For one-stop access to EY’s breadth of materials published on the life sciences industry — reports, research, articles, guest perspectives, blog posts, presentations, infographics, surveys, charts and analysis — visit Vital Signs (ey.com/VitalSigns).
Browse the easy-to-use navigation to quickly find the latest insights and perspectives on the topics most important to pharmaceutical, biotech, medtech and specialty pharma companies.
While visiting Vital Signs, click on “subscribe” to receive once-a-week email alerts (“eAlerts”) when new publications are posted on Vital Signs.
ey.com/VitalSigns
New mobile-friendly site for life sciences executives
19Beyond borders 2016 — Biotech deals18 Beyond borders 2016 — Biotech deals
EY | Assurance | Tax | Transactions | Advisory
About EY EY is a global leader in assurance, tax, transaction and advisory services. The insights and quality services we deliver help build trust and confidence in the capital markets and in economies the world over. We develop outstanding leaders who team to deliver on our promises to all of our stakeholders. In so doing, we play a critical role in building a better working world for our people, for our clients and for our communities.
EY refers to the global organization, and may refer to one or more, of the member firms of Ernst & Young Global Limited, each of which is a separate legal entity. Ernst & Young Global Limited, a UK company limited by guarantee, does not provide services to clients. For more information about our organization, please visit ey.com.
How EY’s Global Life Sciences Sector can help your business
Life sciences companies — from emerging start-ups to multinational enterprises — face new challenges in a rapidly changing health care ecosystem. Payers and regulators are increasing scrutiny and accelerating the transition to value and outcomes. Big data and patient-empowering technologies are driving new approaches and enabling transparency and consumerism. Players from other sectors are entering health care, making collaborations increasingly complex. These trends challenge every aspect of the life sciences business model, from R&D to marketing. Our Global Life Sciences Sector brings together a worldwide network — more than 7,000 sector-focused assurance, tax, transaction and advisory professionals — to anticipate trends, identify their implications and develop points of view on responding to critical issues. We can help you navigate your way forward and achieve success in the new ecosystem.
© 2016 EYGM Limited. All Rights Reserved.
EYG No: 01156-164GBL
ED None.
This material has been prepared for general informational purposes only and is not intended to be relied upon as accounting, tax or other professional advice. Please refer to your advisors for specific advice.
ey.com
For more timely insights on the key business issues affecting life sciences companies, please go to ey.com/VitalSigns. You can also visit ey.com/lifesciences or email [email protected] for more information on our services. To connect with us on Twitter, follow @EY_LifeSciences.
ey.com/lifesciences ey.com/VitalSigns ey.com/beyondborders/financing