best buy equity valuation and...
TRANSCRIPT

Best Buy Equity Valuation and Analysis Valued at 1 November, 2006
M.B.P. Analysts Richard Arce: [email protected]
Chris Ashcraft: [email protected] Davies Crasta: [email protected]
Kyle Lang: [email protected] Brandon Reyes: [email protected]
Ryan Roskey: [email protected]

1
Table of Contents Executive Summary……………..2 Business & Industry Analysis………………………….….6 Accounting Analysis……………17 Ratio Analysis & Forecast Financials…………………………32 Valuation Analysis………………60 Appendices Appendix 1……………………….75 Appendix 2……………………….76 Appendix 3……………………….77 Appendix 4……………………….82 Appendix 5……………………….87 Appendix 6……………………….95 Appendix 7……………………….96 Appendix 8……………………...101 Appendix 9……………………...106 References……………………...107

2
Executive Summary
Investment Recommendation: Overvalued, Sell 11/1/06
BBY – NYSE $54.02 52 week range $42.75 – 59.50 Revenue (2005) $30,848,000,000 Market Capitalization $25.5 Bil Shares Outstanding 492,000,000 Dividend Yield .9% 3-month Avg Daily Trading Volume 1,186,500 Percent Institutional Ownership 90.29% Book Value Per Share (mrq) $2.84 ROE 24.30% ROA 10.85% Est. 5 year EPS Growth Rate 11.30% Cost of Capital Est. R2 Beta Ke Ke Estimated 12.46% 5-year .215 2.28 12.45% 1-Year .094 .519 6.10% 10-Year .1545 1.36 9.20% 3-month .08 .52 5.98% Published 1.04 Kd BBY: 5.16% Revised: 5.20% WACC BBY: 10.64% Revised: 10.80% Altman Z-Score BBY: 3.70 Revised: 2.99
EPS Forecast FYE 10/1 2005(A) 2006(E) 2007(E) 2008(E) EPS 2.01 2.44 2.88 2.98 Ratio Comparison BBY CC RSH Trailing P/E 100.35 76.66 9.48 Forward P/E 76.75 29.91 23.38 M/B 23.43 2.19 4.81 Valuation Estimates Actual Price (as of 11/1/06) $54.02 Ratio Based Valuations P/E Trailing $25.89 P/E Forward $18.07 Enterprise Value $18.95 M/B $4.87 Intrinsic Valuations Actual Revised Discounted Dividends $31.90 $17.98 Free Cash Flows $4.58 $2.41 Residual Income $22.41 $16.97 LR ROE ($3.66) ($5.30) Abnormal Earnings Growth $25.76 $18.55

3
Recommendation – Overvalued Firm
Company, Industry Overview and Analysis
Best Buy is the industry leader in sales, and online sales for the consumer
electronics industry. Best Buy originally started as, Sound of Music inc. in 1966,
however in 1983 they changed their name to Best Buy. As electronics sales have
increased consistently over the years, the consumer electronics industry has benefited
which also directly rewarded Best Buy. The other key players in the industry are Circuit
City and RadioShack. Wal-Mart directly affects the consumer electronics industry
because of their size, and their ability to undercut prices and have a steady supply of
products on hand at all times of the year. We note that Wal Mart does have a strong
influence over the number of sales for the three major competitors and the prices at
which their products are sold. Creating a competitive advantage in this industry is
clearly derived from the application of the cost leadership strategy which means tight
cost control systems, and low costs exerted on research and development. Best Buy is
currently utilizing a strategy in which they are trying to differentiate themselves from
the rest of the industry using the customer end-to-end service and customer centricity.
Accounting Analysis:
A company’s 10-k report that is released at the end of each fiscal year exhibits
vital information about the company which can be used in the valuation process. The
10-K contains the balance sheet, the income statement, and the statement of cash
flows; all these statements are analyzed through the use of screening ratios which test
the consistency and transparency of the reporting. Besides the ratios, a thorough
reading through the 10-K, should disclose clearly the operations of the company,
upcoming projects, and any other binding contracts which could result in material gains
or losses for the company. Upon completing computation of the screening ratios, we
noticed many inconsistencies. Upon completing a thorough reading of the 10-K’s for
five years we all concluded that their quality of disclosure and transparency are terrible.
Another section of the accounting analysis is looking for potential distortions in their

4
accounting methods. While studying the 10-K we found a $1.5 billion off-balance sheet
transaction, which is created by Best Buy leasing a majority of their stores for periods
ranging from 15-30 years. However, they classify the leases as an operating lease
instead of a capital lease. Including this $1.5 billion in our analysis creates two separate
sets of forecast financials one with the $1.5 billion and one with what Best Buy
discloses. When seeking information about specific aspects of the company, the
structure within the 10-K creates a great amount of confusion unambiguously leading
towards a poor quality of disclosure. Any individual lacking a background in finance
would be unable to obtain necessary information in a timely manner, due to the lack of
inconsistent structure.
Financial Ratio Analysis:
Financial ratio analysis consists of ratios subdivided into three categories:
liquidity, profitability, and capital structure ratios. These ratios are helpful in
determining the standing of the company in different areas when compared to their
major competitors. There are seven liquidity ratios, which when evaluated as a group
determines a company’s financial standing and their ability to pay back current debts.
These ratios are indicative of the health of the cash to cash cycle by way of inventory
turnover, day’s supply of inventory, receivables collection and day’s sales outstanding.
Profitability ratios take a look at another area of the company. When computed
correctly, these ratios inform one about the historical profitability of a company, using
the numbers derived directly from their balance sheets and income statements. Capital
structure ratios take a look into the balance sheet, defining the financing used to
acquire assets. We first look into the credit risk of the company with the debt to equity
ratio determining their ability to repay interest and debt requirements.
Forecasting financials for a consumer electronics retailer can prove to be
challenging due to the nature of the industry’s continuously changing nature of sales
and cost structures. There are many assumptions made in trying to predict the various
lines in financial statements; these assumptions were not held steady for the entire 10
years of forecasts. There are fluctuations based on the continuous changing nature of

5
the industry. When looking at our forecasts you will notice two sets of financials,
created because of the inadequate accounting procedure applied for their leased
buildings.
Intrinsic valuations
Fundamental to every intrinsic valuation model are the Weighted Average Cost of
Capital (WACC), cost of equity, cost of debt, and a growth rate. Cost of equity and
WACC have to be calculated by way of regressions and simple weighted averages for
cost of debt. There are five different valuation models: discounted dividends, residual
income, long run return on equity, free cash flow, and abnormal earnings growth. Each
of the different intrinsic valuation methods has a varying degree of explanatory power
when dealing with the stock price. Discounted dividends model has an explanatory
power of up to ten percent; free cash flows 5-40 percent, AEG 30-60 percent, RI 35-90
percent. The valuation models were run twice, once with Best Buy’s numbers and a
revised set of numbers that included the $1.5 Billion accounting distortion. These two
sets of valuations netted the following results: Discounted Dividends, Best Buy: $4.58,
Revised: $2.41; Free Cash Flows, Best Buy: $31.90, Revised: $17.98; Residual Income,
Best Buy: $22.41, Revised: $16.97; Long Run ROE, Best Buy: -$3.66, Revised: -$5.30;
and Abnormal Earnings Growth, Best Buy: $25.76, Revised: $18.55. The Altman Z-
score is used to determine the credit worthiness of a company. A score of 1.8 or below
makes you a high credit risk, while a score of 2.67 or above establishes you as a credit
worthy company. Without accounting for the distortion, in 2005 Best Buy had a Z-score
of 3.70, while with the revised accounting procedures the Z-score rose to 4.56.

6
Business & Industry Analysis Company Overview
Best Buy has been in business since 1966 when they began as Sound of Music
Inc., and changed their name to Best Buy in 1983. They are a specialty retailer of
consumer electronics, home-office products, entertainment software, appliances and
related services. This industry is a large and rapidly growing industry which neared
sales of $100 billion in 2004. Best Buy stores are located in forty nine states and five
Canadian provinces. The company also operates approximately 941 retail stores
internationally in 2006. Best Buy has opened at least 60 stores per year in the United
States since 2001 while closing only one. This shows that the company has been
growing consistently to meet the demands of its growing customer base.
A major factor driving Best Buy’s growth recently has been the sales of flat panel
televisions. Due to the fact that retailers in this industry sell similar products it creates
price wars forcing Best Buy to become a cost leader to further growth. An integral
differentiator for Best Buy from its competitors is the firm’s commitment to superior
customer service.
Best Buy’s twenty largest suppliers provide over one half of the products sold in
the store, so the loss of one of these suppliers would be a major setback to revenues.
Consumer electronics products provide the largest percentage of the firm’s revenue
followed closely by home office products in the United States. Looking at Best Buy’s
international segment, a majority of their sales comes from consumer electronics
products which provide over 95% of the firm’s international revenue.
2001 2002 2003 2004 2005 Assets 4840 7367 7663 8652 10294 Sales 15327 17711 20946 24547 27443 Stock Price 71.39 27.68 62 56.38 48.24
*assets and sales in millions

7
Five Forces Model
Rivalry Among Existing Firms
In most industries, especially highly competitive ones, rivalry among existing
firms is a key component in the firm’s ability to create revenue. If rivalry is especially
intense this will continually decrease profit margins.
Industry Growth
The growth of the industry shows how a firm can gain market share. With a
strong growth industry firms are not forced to take others’ market share in order to
grow. Best Buy is currently in a steady growth industry. Although the industry is
becoming more competitive, the demand for such products like high end TVs is
expected to grow as much as 36% from last year’s sales, according to the Consumer
Electronics Association. The industry which is cyclical can be heavily influenced by
consumer spending but demand for consumer electronics continues to grow. Although
Best Buy will be able to capture some growth from the increase in demand, most of the
growth that Best Buy could experience will come from competing on customer service.
This includes installation and support through Geek Squad, store placement and
environment, product selection, financing, and low pricing models. The consumer
electronics industry will continually grow at a fairly high rate.
Concentration and Balance of Competitors
Concentration and balance of competitors determines the amount of price
competition in an industry. The industry is saturated with superstores such as Circuit
City, Radio Shack, and even Wal-Mart. Best Buy has to compete on a value pricing
model in order to continue its growth trend. Customers will look among competitors for
the lowest priced product and buy from whoever has the best deal. In order to build
store loyalty Best Buy is implementing a customer service model by offering services
such as computer repair and home theater installation. Wal-Mart has become a
competitor by selling HDTV sets at bargain prices but they do not offer the “end-to-end”
services that Best Buy offers. Concentration of competitors is also growing because of

8
internet retailers. Although Best Buy has a “brick and mortar” website, competitors
such as Amazon.com are able to offer the same products close to the same price. With
all these competitors we conclude that the concentration on the market is moderately
high. Best Buy is in a highly competitive market therefore driving firms into price
competition.
Degree of Differentiation and Switching Cost
The level of product differentiation in an industry determines the consumer
ability or willingness to switch between firms. In the Electronic Retail industry there is
very little product differentiation among competitors. Most retailers sell the same
brands and models which cause the companies to compete on pricing. This allows
switching cost to be very low allowing consumers to shop on the basis of price. In
order to differentiate between its competitors Best Buy tries to provide customer
services, quality store locations and layout, and knowledgeable staff in order to create
the effect of high switching cost. Also Best Buy is converting many of its stores to the
customer centricity model. Best Buy classifies the individual stores’ major demographic
and adjust products and services accordingly to cater to that store’s major
demographic. This industry consists of very little product differentiation which allows
the customer to switch retailers solely on the basis of price.
Ratio of Fixed to Variable Costs
The ratio of fixed to variable cost has an effect on a firm’s product pricing. Best
Buy stores are financed though 20-year off-balance sheet operating leases.
Domestically Best Buy has over 750 retail stores and over 6,000,000 square feet of
warehouse space. In order to survive, players in the industry must turn over large
amounts of products for fixed cost to cover variable cost. Best Buy is the leader in
being able to utilize its fixed cost by turning over its inventory two times more a year
than it closet competitor, Circuit City.
9
Exit Barriers and Excess Capacity
There are large exit barriers related to the electronic retail industry. This allows
companies such as Best Buy the ability to squeeze competition out of the market.
There are few direct competitors in the industry; because of this many have large
economies of scale. This puts small players at a disadvantage because they are not
able to obtain prices larger firms receive from suppliers. There are so many retail
stores between Best Buy and its competitors that it creates more supply than demand.
This increases the exit barriers based upon the difficulty of being able to use resources
in other enterprises. In order to overcome this Best Buy most follow a value pricing
model and provide superior customer service. In the retail electronics industry exit
barriers and excess capacity are high.
Threat of New Entrants
Economies of Scale
Economies of scale are important in determining business strategy when entering
a new industry. In an industry that has high economies of scale a new entrant must
utilize a large amount of capital to try to compete with established firms. In order to
compete in the electronic retail industry you must have the power to bargain with
suppliers. In order to sell large quantities of product a company must posses large
amounts of assets in their retail store space. This makes it difficult to enter in on the
market and compete at the same price level as Best Buy and Circuit City. The majority
of long term assets listed on Best Buy’s balance sheet are accumulated in the “Property,
Plant, and Equipment” section. Another restriction on new entrants is brand
recognition. Customer services such as Geek Squad and Magnolia Home Theaters can
be associated with the Best Buy brand. Even if a new entrant was able to compete on
prices it might also be stretched to offer the services that Best Buy can. The only facet
that makes it easy to enter into the market is the internet. This allows sellers to avoid
investing in costly retail locations which in turn allows for competitive pricing. The only
drawback is that customers cannot see the tangible product and compare them to other

10
working models. The combination of cost of assets and offering tangible services
cause the economies of scale to be moderate.
First Mover Advantage
In an industry driven by low price competition it is extremely hard to generate a
first mover advantage. Best Buy is currently trying to create a first mover advantage by
converting many of their home theater departments into the “Magnolia Home Theater
Store.” By doing this they are creating a way for customers to receive a complete
home theater set up through Best Buy. This includes such services as high definition
comparisons to actually installing your home theater. Other services they are the first
to offer are computer repair services known as Geek Squad. Circuit City is still in the
process of trying to create services that would compete with these two examples.
Although customer service will increase customer switching cost most of the industry
growth comes from low prices. Because of this the threat of first mover advantage is a
low risk.
Access to Channels of Distribution and Relationships
It is absolutely necessary to keep your cost low by becoming efficient in your
operations. In an industry that is driven by price there is a necessity of creating
efficient distribution between suppliers, warehouse, stores, and ultimately customers.
It is difficult to create a relationship where the manufacturer’s of products that will
effectively fulfill inventory orders and keep prices extremely low. You must have large
economy of scale thus creating a difficult environment for new entrants to enter the
market. Best Buy is able to gain channels by having a large contract with many of the
manufacturer’s to place products throughout all of Best Buy stores. Also in order to
continue good relationships with manufacturers Best Buy will guarantee certain product
shelf placement and product highlighting in Best Buy advertisement.
11
Legal Barriers
In the retailing industry companies do not have many legal barriers that prohibit
them from entering the market. The only barriers that exist when selling electronic
products are insurance and liability cost of having consumers inside a retail location.
Legal barriers such as patents or licensing regulations do not exist. Thus the lack of
legal barriers creates a high risk of entrants into the market.
Threat of Substitute Products
The electronic retail industry is one that competes on basis of price. Best Buy
and all of its competitors carry the same brands with vary little differentiation in product
line. The consumer is willing to substitute their electronics based on price. Even if the
consumer is loyal to a certain brand, more than likely, that consumer can shop between
competitors to find the best price. In order for Best Buy to keep customers from
substituting products they must offer superior services along with their products. Best
Buy is able to do this by offering such services as Geek Squad and end-to-end home
theater solutions from the Magnolia store brand. Jim Muehlbauer, Senior VP of Finance,
commented about this in Best Buy’s conference call on 9/12/06. “Our differentiation
strategy hinges on the successful interactions of employees with customers, and we are
not cutting back on that relationship. The important part of the customer experience is
our ability to offer end-to-end solutions, which is why we continue to invest in services.”
The threat of substitute products in the industry is relatively high. Without retailers
offering superior services and knowledgeable staff customers are willing to substitute
products.
Bargaining Power of Buyers
Electronic retailers compete heavily on price. Best Buy is the largest electronic
retailer which allows a strong position in bargaining with its suppliers to keep its prices
down. It must do this in order to compete with the high price sensitivity and moderate
bargaining power of its buyers. Customers in this industry shop around for the best
price possible. This also increases the bargaining power of the buyer because switching

12
cost is low and the availability of alternative products is high. One thing that keeps
buyer bargaining power moderate is that there is no single buyer with a large
percentage of sales. If Best Buy loses one customer it will not hurt the bottom line. In
order to combat price sensitivity and product switching Best Buy offers a large array of
price and quality within every category of product it sells. Also Best Buy continually
strives to make its service and warranties an intangible benefit that will decrease the
bargaining power of its buyers. The factors we considered keep the bargaining power
of buyers a low threat.
Bargaining Power of Suppliers
In order to stay competitive in the electronic industry, companies must be able
to receive low prices from there suppliers. The inability to do so will cause a loss in
customers, based on their price sensitivity. Since Best Buy is the largest electronics
retailer it has power over the suppliers to provide products at a competitive price. If
the suppliers were not able to gain an order from Best Buy then the supplier’s bottom
line would be adversely affected. Even though this is true customers come to expect a
certain product brand name, image, or quality. This gives suppliers an edge in
bargaining power because consumers do recognize quality with a certain brand. In
order for Best Buy to receive the benefits of both price and quality it must sustain a
favorable relationship with its suppliers. We conclude that the threat of supplier’s
bargaining power is moderate.
Competitive Advantage Analysis
Classifying Industry
The Consumer Electronics and Appliance Retail Industry have become
increasingly competitive over the last few years. Best Buy leads the industry in sales
over the last year followed by Wal-Mart, Circuit City, Dell, and Radio Shack. While Best
Buy has been in a pricing war with its competitors, its stated goal is to differentiate
itself from its competition by “treating each customer as a unique individual, meeting
their needs with end-to-end solutions, and engaging and energizing our employees to

13
serve them, while maximizing overall profitability.” By looking at numerous competitors
and evaluating the differences in approaches, we will be able to evaluate the firm more
accurately. We will look into the way industries managers choose to approach the
continuous changes in the market place and see if Best Buy stays ahead of the field or
lag behind competitors in innovation.
Key Success Factors
Best Buy has historically adapted well to changes in technology and the market
place. The store first began as an audio components retailer with the introduction of the
videocassette recorder in the early 1980’s, and expanded into video products. This
expansionary attitude has been apparent throughout its history. Today the company
continues to expand into new territories. In 2003 they acquired Geek Squad, Inc. to
provide residential and commercial computer support services, as well as give its
customers technical support services. “In 1989, we dramatically changed our method of
retailing by introducing a self-service, noncommissioned, discount-style store concept
designed to give the customer more control over the purchasing process.” (2006 10-K
pg.6) Best Buy started to differentiate itself from its competitors in 2005 by focusing on
a five part plan that is based on “Customer Centricity”. The first part of this
differentiation model is based on opening and converting stores to the customer
centricity store model. These stores now account for 40% of all stores. Second, Best
Buy has expanded its customer service by adding the Geek Squad and bringing its
home theater installation back after being outsourced. The third piece is expanding
individualized marketing through its Reward Zone program that has now reached seven
million members. The Reward Zone program allows Best Buy to track the purchasing
patterns of its most loyal customers. The fourth part of the plan involves reducing
employee turnover which leads to an increase in customer service. The final piece of
the five part plan is to improve their information technology systems and to supply
chains over the next three years.
Circuit City is a main competitor of Best Buy and has also gone through many
changes over the years. Circuit City is an older company that has gone through similar

14
changes as Best Buy. They too do not have commissioned employees. One difference in
the stores that can be seen from the financials is their main focus. Best Buy focuses on
the in-store experiences with video-games you can play, and displays offering
demonstrations of products. Circuit City has changed it strategy to the Internet to give
its customers an easier way of buying products on-line but without waiting for it. Prior
to the 2005 Christmas season they created the 24/24 pickup guarantee. This allows
customers to shop for products at home and drive to the store and pick it up. On-line
customers no longer have to wait for their products to be shipped.
Best Buy into the Future
Over the next year Best Buy will continue to try to differentiate itself from the
competition through several means. They plan on opening up approximately 90 new
stores which would bring their national total to 832 stores, considerably more than
Circuit City’s 626 locations. They also plan on expanding operations internationally.
Best Buy currently operates both Future Shop and Best Buy stores in Canada and is
looking to begin opening stores in China this year. They will also be looking to improve
productivity and would like to enhance their ability to completely solve their customers’
problems.
Growth Sustainability
Sustaining a competitive advantage in a fast growing industry will become
difficult. As a firm leader in the consumer electronics industry, Best Buy has over the
past 15 years remained the innovative industry leader in customer service, inventory
systems, and suppliers. To continue to capture growth Best Buy purchased Magnolia
Hi-Fi retail stores in 2001. By offering primarily high end consumer electronics Best Buy
has helped itself stay a leader in the consumer electronics industry. In 2002 when the
industry was lagging, due to the economic recession in the United States, Best Buy’s
management focused on controlling debt and interest costs, by locking in interest rates
on their loans. Continuing their growth as an international leader, Best Buy acquired
part of Canadian consumer-electronic giant, Future-shop. Also with the addition of

15
Geek Squad it will allow Best Buy to continue their differentiation strategy by providing
a full range of computer repair services.
After careful inspection of a subsidiary, Musicland, management in 2002, decided
to sell this branch of the company due to lagging sales and unmet objectives at time of
acquisition. Musicland which is a retail store located in malls across the United States,
sells music CD’s, DVD’s and other entertainment products. Growth with number of
stores has been a significant aspect of Best Buy staying a leader in this particular
industry. Solely in the past five years Best Buy has opened over 320 stores, all with the
end-to-end management focus, which entails total customer satisfaction, and customer
centricity. This growth in number of stores shows Best Buy its ability to grow and stay
the leader in the industry with sales volumes, number of stores, and customer
satisfaction. As mentioned earlier, being in an industry that primarily competes on cost,
staying a leader needs innovation in various aspects of the business. For Best Buy, this
innovation comes not only through international and national acquisitions, but from the
floor of their stores. From 2002 onward, much of managements focus was to create an
environment for the customers that will differentiate its self from other competitors.
This model management aptly titled, Customer Centricity Strategy, revolves around
complete customer satisfaction. Customer centricity has as much of a focus on the
customers as it does on the employees that provide services for the customer. Part of
customer centricity strategy was focused on restructuring and reengineering floor
employees’ pay scales and training. Having emphasized the necessity and the
significance of having satisfied customers, Best Buy focused on training even floor
employees, and this paid off in the 2005 fiscal year, which saw a reduction of 15% in
employee turnover. The acquisition of Geek Squad and an outsourcing company that
installed home theater systems was also an application of the customer centricity
strategy.
Best Buy is opening a new corporate global sourcing office in Shanghai, China,
which focuses on finding private-label suppliers and other manufacturers who produce
goods cheaper than American manufacturers. Increasing efficiency through a growing
number of distribution centers all around the country is another way Best Buy is

16
increasing efficiency and decreasing cost, helping maintain a competitive advantage,
especially over Circuit City. There are no contracts that exist with Best Buy and their
major suppliers. However Best Buy has disclosed in their financial statements
consistently that they foresee no problems with supply disruptions from their major
suppliers. Their major suppliers are companies such as: Gateway, Hewlett-Packard,
Sony, Toshiba, and Panasonic, none of which are locked in with a contract. Part of their
sustained advantage that has lasted for this period, and will continue is related to their
bargaining power. Best Buy has invested an extraordinary amount in creating brand
loyalty, and brand recognition. In doing so, large and small suppliers alike continue to
want a presence in Best Buy stores.
With a reengineering in line for upcoming years, that includes updating inventory
systems, logistics and information technology systems within the company, Best Buy is
locking their position as not only a national leader, but a global leader, in the consumer
electronics industry.

17
Accounting Analysis Key Accounting Policies:
A goal of accounting policy analysis is to see if the firm’s accounting practices
capture, current and prospective financial actions of the company. Best Buy is in the
consumer electronic retail industry, which necessitates growth in number of stores, cost
effectiveness, and enhanced Customer Centricity (end-to-end customer service).
Success factors that are accounted for by Best Buy include; advertising/marketing
expense, employee training (due to their emphasis on customer centricity), sustaining
low costs through finding low cost suppliers and keeping the current low cost suppliers,
and expanding their number of stores.
Estimates are used by Best Buy’s management team for; lease holdings (operating
leases), buildings, fixtures/equipment, and inventory. Inventory is managed by ways of
average cost or lower of cost, which is how another major competitor, Circuit City
accounts for inventory. Their inventory account for the past five years has steadied in
between $2.8 billion - $2.3 billion, inventory levels, have steadily increased in the past
five years, especially due to the drastic increase in technological advancements in the
consumer electronics sector. Radio Shack has remained the steadiest with its
inventories; the inventories are valued at weighted average cost.
Inventory for Five Years
$0.00$500.00
$1,000.00$1,500.00$2,000.00$2,500.00$3,000.00$3,500.00$4,000.00
2001 2002 2003 2004 2005
Years
Mill
ions Best Buy
Circuit CityRadioShack
18
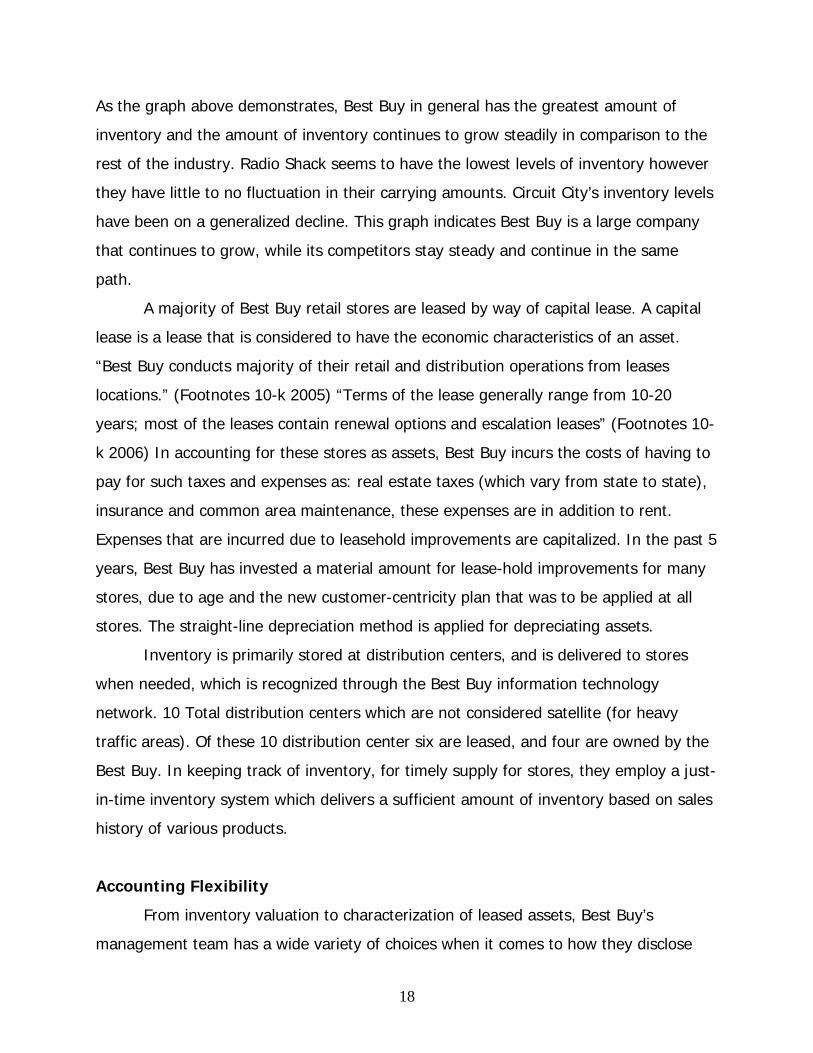
As the graph above demonstrates, Best Buy in general has the greatest amount of
inventory and the amount of inventory continues to grow steadily in comparison to the
rest of the industry. Radio Shack seems to have the lowest levels of inventory however
they have little to no fluctuation in their carrying amounts. Circuit City’s inventory levels
have been on a generalized decline. This graph indicates Best Buy is a large company
that continues to grow, while its competitors stay steady and continue in the same
path.
A majority of Best Buy retail stores are leased by way of capital lease. A capital
lease is a lease that is considered to have the economic characteristics of an asset.
“Best Buy conducts majority of their retail and distribution operations from leases
locations.” (Footnotes 10-k 2005) “Terms of the lease generally range from 10-20
years; most of the leases contain renewal options and escalation leases” (Footnotes 10-
k 2006) In accounting for these stores as assets, Best Buy incurs the costs of having to
pay for such taxes and expenses as: real estate taxes (which vary from state to state),
insurance and common area maintenance, these expenses are in addition to rent.
Expenses that are incurred due to leasehold improvements are capitalized. In the past 5
years, Best Buy has invested a material amount for lease-hold improvements for many
stores, due to age and the new customer-centricity plan that was to be applied at all
stores. The straight-line depreciation method is applied for depreciating assets.
Inventory is primarily stored at distribution centers, and is delivered to stores
when needed, which is recognized through the Best Buy information technology
network. 10 Total distribution centers which are not considered satellite (for heavy
traffic areas). Of these 10 distribution center six are leased, and four are owned by the
Best Buy. In keeping track of inventory, for timely supply for stores, they employ a just-
in-time inventory system which delivers a sufficient amount of inventory based on sales
history of various products.
Accounting Flexibility
From inventory valuation to characterization of leased assets, Best Buy’s
management team has a wide variety of choices when it comes to how they disclose

19
this information in their financial reports. Managers in most retail companies have a
choice as to how they valuate their inventory. Best Buy chooses to use the average cost
method instead of LIFO or FIFO. If circumstances arise where they need to lower their
expenses, they could switch to a FIFO method to accomplish this, or vice-versa,
increase economic expenses so to avoid taxes; they may have the desire to switch to
LIFO. Best Buy has reported operating leases in an inadequate manner, due to the
possibility that there is an un-necessary flexibility that is available to decrease liabilities.
Self-Insured Liabilities, which cover Best Buy from certain losses related to
health, workers’ compensation, and general liability claims is an area that Best Buy uses
estimates in. This in turn gives Best Buy yet another area where managers have quite a
wide-ranging spectrum when reporting numbers. In the 2006 10-K management had
stated, “a 10% change in our self-insured liabilities on February 26, 2004 would have
affected net earnings by approximately $6,000,000 for fiscal year ended February 26,
2006.”(10-K 2006) Again, managers have the ability to change their expenses and alter
earnings. As visible a $6 million dollar decrease in net revenue, will affect the
performance of Best Buy’s stock, hence net profit is the bottom line that affects stock
performance, and it is clamorous for managers to ensure that insured liability estimates
stay low.
Musicland was acquired by Best Buy in 2001 and sold in 2003. This allowed us to
examine their use of goodwill impairments. On March 3, 2002 they adopted SFAS
no.142, a new accounting principle allowing firms to determine their own impairments.
Upon reevaluation at the end of each year, it is management’s discretion and allows
them to determine how much goodwill to write off on their own terms, instead of
having them use straight line depreciation over a longer period of time, which in most
cases would have been inaccurate. When Musicland was sold, they were able to
determine the amount of goodwill they could write-off. Also during the time of the sale,
managers had other estimating decisions to make. Costs Associated with exit activities
include termination of a lease, employee termination benefits, and other moving costs.
Musicland was sold for an operating loss $441 million dollars in 2003.

20
Operating leases which decrease liability and increase expense, are essential for
corporations who have debt covenants to keep. However in the case of Best Buy
operating leases which are between 15-30 years should be capitalized, because those
buildings are essentially assets for that period of time. If Best Buy were to capitalize
these operating leases, it would create a total liability of $3.4 billion. Circuit City has
operating lease obligations of $2.65 billion which is a difference of $750 million. Given
the far ranging difference between capital leases and operating leases, Best Buy is
exercising aggressive use of accounting standards.
Capitalization of Circuit City’s Operating Lease Obligations:
Operating
Leases Capital Leases
year 6.03% PV PV 03 $1,726.00 0.8389 $1,447.95 $339.19 0.8389 $284.55 04 $1,768.00 0.7912 $1,398.84 $337.00 0.7912 $266.63 05 $1,798.00 0.7462 $1,341.67 $335.25 0.7462 $250.16 06 $1,807.00 0.7038 $1,271.70 $332.63 0.7038 $234.09 07 $1,853.00 0.6637 $1,229.91 $326.48 0.6637 $216.70 08 $733.33 0.6260 $459.06 $208.75 0.6260 $130.68 09 $733.33 0.5904 $432.95 $208.75 0.5904 $123.24 10 $733.33 0.5568 $408.33 $208.75 0.5568 $116.24 11 $733.33 0.5252 $385.11 $208.75 0.5252 $109.63 12 $733.33 0.4953 $363.21 $208.75 0.4953 $103.39 13 $733.33 0.4671 $342.55 $208.75 0.4671 $97.51 14 $733.33 0.4406 $323.07 $208.75 0.4406 $91.97 15 $733.33 0.4155 $304.70 $208.75 0.4155 $86.74 16 $733.33 0.3919 $287.37 $208.75 0.3919 $81.80 17 $733.33 0.3696 $271.03 $208.75 0.3696 $77.15 18 $733.33 0.3486 $255.61 $208.75 0.3486 $72.76 19 $733.33 0.3287 $241.08 $208.75 0.3287 $68.62 20 $733.33 0.3100 $227.37 $208.75 0.3100 $64.72 21 $733.33 0.2924 $214.43 $208.75 0.2924 $61.04 22 $733.33 0.2758 $202.24 $208.75 0.2758 $57.57 23 $733.33 0.2601 $190.74 $208.75 0.2601 $54.30 $11,598.91 $2,649.49 Actual $11,598.91 Check $11,598.00 Diff -$0.91
The two charts, above and below, show the capitalization of Best Buy and Circuit City’s
operating leases. The discount rate, 6.03%, is about the industry standard for
consumer electronics retail. Both companies are potentially hiding liabilities of $2.65

21
Billion and $3.37 Billion dollars respectively this would have a great change on their
ratio’s and earnings statements if they used capital leases instead of operating leases.
In the undoing accounting distortion section we will discuss further into detail Best
Buy’s aggressive discount rate (11%) and its understating of expenses related to
operating leases ($1.5B).
Capitalization of Best Buy’s Operating Lease Obligations:
Operating
Leases Capital Leases
year 6.03% PV PV 03 $3,000.00 0.8389 $2,516.72 $602.00 0.8389 $505.02 04 $3,000.00 0.7912 $2,373.59 $593.50 0.7912 $469.58 05 $3,000.00 0.7462 $2,238.60 $593.50 0.7462 $442.87 06 $1,330.00 0.7038 $936.01 $353.00 0.7038 $248.43 07 $1,330.00 0.6637 $882.78 $353.00 0.6637 $234.30 08 $1,330.00 0.6260 $832.57 $353.00 0.6260 $220.98 09 $700.00 0.5904 $413.28 $205.30 0.5904 $121.21 10 $700.00 0.5568 $389.77 $205.30 0.5568 $114.31 11 $700.00 0.5252 $367.61 $205.30 0.5252 $107.81 12 $700.00 0.4953 $346.70 $205.30 0.4953 $101.68 13 $700.00 0.4671 $326.98 $205.30 0.4671 $95.90 14 $700.00 0.4406 $308.39 $205.30 0.4406 $90.45 15 $700.00 0.4155 $290.85 $205.30 0.4155 $85.30 16 $700.00 0.3919 $274.31 $205.30 0.3919 $80.45 17 $700.00 0.3696 $258.71 $205.30 0.3696 $75.88 18 $700.00 0.3486 $243.99 $205.30 0.3486 $71.56 19 $700.00 0.3287 $230.12 $205.30 0.3287 $67.49 20 $700.00 0.3100 $217.03 $205.30 0.3100 $63.65 21 $700.00 0.2924 $204.69 $205.30 0.2924 $60.03 22 $700.00 0.2758 $193.05 $205.30 0.2758 $56.62 23 $700.00 0.2601 $182.07 $205.30 0.2601 $53.40 $14,027.81 $3,366.91
Best Buy has been given a good amount of accounting flexibility. All decisions
mentioned are accepted and governed to some extent by the FASB and GAAP policies.
Each company has the ability to choose how they disclose their information to best fit
their company structure.
Accounting Strategy
Best Buy’s two major competitors, Circuit City and Radio Shack, both show similar
accounting numbers and practices to that of Best Buy. Circuit City for instance states

22
that “it differentiates itself from competitors by offering a high level of customer
service; offering competitive prices; providing complete product and service
assortments; and providing consumers the option of multi-channel shopping.” (Circuit
City 10-K 2006). Radio Shack also states that “Management believes we have three
primary factors differentiating us from our competition. First is our extensive physical
retail presence...Second, our specially trained sales staff... Third is our ability to
accelerate the adoption rate of new technologies.” (Radio Shack 10-K 2006). The goals
of the largest firms in the consumer electronics industry is to become differentiated
from one another as the information above shows. This is important because we can
now expect all three companies to report accounting items in a similar fashion.
The financial statement ratio analysis has lead to an overwhelming conclusion
that Best Buy uses aggressive accounting. The industry as a whole uses fairly
aggressive accounting practices but Best Buy tends to stretch the bounds of GAAP.
An item, which we have to pay special attention to, is pension expense,
especially when individual contributions are matched by the company. Taking into
consideration that human capital is of great necessity when in the consumer electronics
retail industry, it is imperative for a company to keep its employees at all levels
satisfied, especially those directly associated with store management and customers.
Pension costs can become a significant cost to companies and hence is an area in
accounting strategy that will be focused upon. Historically it has been acknowledged
that companies do not contribute the necessary amounts of funds at the correct times,
this is done in attempt to lower costs and hence increase net income. This leads to
increasing expenses in forthcoming years, which necessitates higher pension payments
to catch up on lost payments. Again, this creates much room for manipulation for the
company on its financial statements, if a large writes down is expected a greater
financial write down might be taken.
Pension expense across the industry has been fairly standard with increasing
amounts from the companies in the consumer electronics retail industry. For Best Buy
the pension costs have been increasing steadily since 2001 with a little bit of a large
jump from 2001-2002, this shows the company has been making

23
Pension Expense
0
5
10
15
20
25
2001 2002 2003 2004 2005
Years
Out
put Circuit City
Radio ShackBest Buy
timely payments in general so there will be no unexpected drastic decreases in revenue
at random future time. The graph below displays the cost for Best Buy and its nearest
competitors; in general cost has increased steadily for pension expenses. With Radio
Shack the payments have been on the lower end, taking into consideration that Radio
Shack does not have as many employees within their company in comparison to Best
Buy.
Quality of Disclosure:
Disclosure quality, which entails footnotes and management discussion current
activities and the economic future of the company are an important supplement to the
10-K financial statement package. Since management has control over disclosure it is
significant to evaluate disclosure in comparison to other major players in the industry.
Disclosure should assist with increased transparency and understandability of the
financial reports. In an industry that permits itself to aggressive accounting practices
one can safely state the Best Buy leads the pack in aggressive accounting.
A majority of shareholders do not have a great working knowledge of accounting
or accounting vocabulary and hence the management discussion and analysis is not
obligated in anyway to disclose in depth accounting practices. A financially/accounting
literate individual should consult the 10-k for proper information that is regulated by the
SEC instead of the unregulated annual report, which is submitted by the company to

24
the stockholders. This report grossly omits the true financial standing of the company,
and greatly misrepresents without appropriate information (balance sheet, income
statement…etc) the well being of the company, to increase investor confidence to
continue holding shares in Best Buy.
Aggressive accounting practices create a best case scenario which in turn leads
to inadequate disclosure. Some practices which we found to be aggressive were; the
discount rate used for future operating leases, stock options, consolidating reward zone
points into accrued liabilities, improper aggregation of accrued liabilities, and hidden
expenses within operating lease valuation.
Regarding footnote disclosure, in a general sense the footnotes are acceptable in
regards to the information they contain. The industry norm is to explain, in a mediocre
manner, in the footnotes what is occurring within the financial statements and other off
balance sheet transactions. While the industry norm does not go above and beyond the
necessary information it is adequate in helping to identify potential inconsistencies, and
hidden transactions.
In respect to revealing potential bad news for all aspects of operations, the
business norm seems to steer away from reporting or disclosing such damaging news.
However Best Buy and the consumer electronics industry in the past five years has
maneuvered their way out of any disclosure which may be damaging to the company or
companies and their ability to attract a greater number of investors.
A major problem we found with Best Buy’s accounting was that the Balance
Sheet does not balance for any of the past five fiscal years. This is not unusual but the
deficits exceeded $500 million and at one point actually topped $1.2 Billion. This makes
the valuation of the company exceedingly difficult because it seems as if Best Buy is
trying to portray their company in the best possible light given Generally Accepted
Accounting Practices.
The disclosures of Best Buy are in general inadequate when performing a
valuation. Each and every piece of information required for performing a satisfactory
valuation is exceedingly difficult to find. It should be noted that as the entire project

25
came close to its end we became increasingly unhappy with Best Buy’s accounting
disclosure.
As visible from the information provided above, it is evident that disclosure does
help supplement a large sum of information coupled with the financials; this proves to
create an environment by the management team to gloss the real financial and
economic standing. We find that Best Buy’s disclosure is at best marginal, because of
this we feel it is only right to hold their poor disclosure against them when our final
valuation is complete.
Screening Ratio Analysis
Radio Shack 2001 2002 2003 2004 2005sales/cash from sales 1.06 1.04 1.04 1.05 1.06sales/net accounts receivable 17.28 22.21 25.50 20.09 16.42Sales/inventory 5.03 4.71 6.07 4.82 5.27Sales/assets 2.13 2.05 2.07 1.24 2.31cffo/oi 2.16 1.23 1.34 0.63 1.04cffo/noa 1.86 1.24 1.27 0.54 0.76 Circuit City 2001 2002 2003 2004 2005Sales/cash from sales 1.06 1.01 1.02 1.02 1.02Sales/net accounts rec 60.56 71.62 63.99 45.40 52.51Sales/inventory 7.79 7.13 6.50 7.19 6.83cffo/noa -0.26 1.17 0.62 Best Buy 2001 2002 2003 2004 2005Sales/cash from sales 0.87 0.86 0.87 0.91 0.90sales/net accounts receivable 80.37 80.14 67.13 71.57 73.18Sales/inventory 12.84 9.45 10.24 9.42 9.63Sales/assets 3.14 2.40 2.73 2.84 2.67cffo/oi 1.32 1.74 0.66 1.08 1.28cffo/noa 0.63 .99 0.38 0.76 0.92
The following is a discussion of Best Buy, Circuit City and Radio Shacks’ key
financial screening ratios. The Net Sales/Unearned Revenue, Net Sales/Warranty

26
Liabilities, Total Accruals/Change in Sales, pension expense/SG&A, other employment
expenses/SG&A ratios are left incomplete because of an inadequate amount of
information, this information couldn’t be found in the companies respective 10-K’s.
Sales/Cash from Sales
0.96
0.98
1
1.02
1.04
1.06
1.08
2001 2002 2003 2004 2005
year
outp
ut Radio ShackCircuit CityBest Buy
Sales/Cash from sales ratio may assist one in understanding the actual amount
of cash that was collected from sales in comparison to sales. The smaller output
number designates that the company collects majority of its sales cash and hence
decreases the amount of allowance for doubtful accounts in accounts receivable. Here
the industry is pretty tightly packed and shows that Best Buy does a descent job at
collecting cash, and have stayed steady over time. Competitors fall short of best buy in
this category for the most part. Circuit city has recently improved in the ratio and have
even surpassed Best Buy in 2005. The ideal ratio would obviously be an even one,
indicating you are collecting cash for all of your sales. This would eliminate the risk
associated with accounts receivable.

27
Sales/Net Accounts Receivable
0102030405060708090
2001 2002 2003 2004 2005
Years
Out
put RadioShack
Circuit CityBest Buy
In case of this ratio, again one would like to have a higher ratio output. When
providing goods or services collecting cash is the most secure manner for a business to
ensure payment for the goods/services provided. With accounts receivable there is
always the excess liability that comes with uncollectible accounts, hence in this case
one would prefer a larger output for the ratio. In Best Buy’s case in this ratio one can
see that they lead the industry in their cash collections from their receivables keeping
their receivables low, and decreasing uncollectible liabilities.
Sales/Inventory
0246
8101214
2001 2002 2003 2004 2005
Years
Out
put RadioShack
Circuit CityBest Buy
As visible from this chart again, Best Buy is leading the industry in their ability to
move inventory out of their distribution stores. In a technological industry, such as the
consumer electronics industry, it is essential that companies be able to move inventory
with sales, and manage inventory stocks well. Best Buy seems to have found a median,
in which they have sufficient inventory to be the industry leader, yet not carry an
excess for it to be a liability or an insufficient amount which would impair sales.

28
Sales/Assets
00.5
11.5
22.5
33.5
2001 2002 2003 2004 2005
Year
Out
put RadioShack
Best BuyCircuit City
Circuit City and Best Buy remain relatively close in this ratio output, with Radio
Shack staying somewhat close. However in this industry the norm is to have operating
leases as opposed to capital leases, where items appear as assets. This is a possible
explanation for why the industry average is relatively high. Best Buy has a greater
number of stores than the other two competitors. This in turn may justify why their
sales are higher than the other two competitors.
CFFO/NOA
-0.5
0
0.5
1
1.5
2
2001 2002 2003 2004 2005
Year
Out
put RadioShack
Circuit CityBest Buy
CFFO/NOA is a way to measure the return a company is receiving from its
operating assets, in terms of cash flow from operations. Best Buy is not investing a
larger amount in operating assets to create a greater cash flow from operating
activities.

29
CFFO/OI
0
0.5
1
1.5
2
2.5
2001 2002 2003 2004 2005
Year
Out
put
RadioShackBest Buy
This ratio presents the amount of cash flow from operations which in turn are
explained by operating income. The lower the output number, the better because it
exhibits that more cash flows are coming from direct activities instead of investing for
financing activities. The current trend in the industry is toward a decrease in this ratio
which means that more of Best Buy’s Cash Flows from Operations can be explained by
its Operating Income.
Potential Red Flags
When working on financial valuation of a company, a certain amount of energy
and time has to be spent on identifying information within the statements that could
lead to a potential pitfall. When reading through and obtaining information from the
financial statements, one statement which caught our attention was, “Operating lease
obligations do not include payments to landlords covering real estate taxes and
common area maintenance. These charges, if included, would increase total operating
lease obligations by $1.5 Billion, as of February 25, 2006.” (10-K 2006, pg.43)
$1.5 Billion being a material amount can and does affect many parts of the
company’s statements, including, income, and liabilities, expenses and owners equity.
In 2006 Ernst & Young LLC was released by Best Buy from their duties of
auditing and Deloitte & Touche were hired as the independent auditors.
Discount rates play an enormous role, in providing accurate figures when a
present value is given. When dealing with operating leases, Best Buy used a discount
rate of about 11% which is almost double the industry standard which hovers around

30
6%. This in turn shows a large decrease in their liabilities. The discount rate is
determined by historical experience, current trends and other factors, that management
believe to be relevant at the time statements are prepared.
While conducting our ratio analysis we did not find any outstanding or strange
ratios. This has lead the us to believe that any major discrepancies that can be found
for these companies come from shaving numbers, increasing their discount rates, and
neglecting to place certain liabilities on their balance sheets.
Undo Accounting Distortions
As was discussed in the Accounting Flexibility Section and above in the Red Flag
Section Best Buy used a Discount Rate of 11% for estimating operating leases as capital
leases and they did not include $1.5 Billion worth of additional lease expenses. The
table below shows Best Buy’s capitalized leases after undoing these two accounting
distortions.
Corrected PV Original PV $757.66 0.8389 $635.60 $602.00 0.8389 $505.02 $742.80 0.7912 $587.70 $593.50 0.7912 $469.58 $742.80 0.7462 $554.28 $593.50 0.7462 $442.87 $440.73 0.7038 $310.17 $353.00 0.7038 $248.43 $440.73 0.6637 $292.53 $353.00 0.6637 $234.30 $440.73 0.6260 $275.89 $353.00 0.6260 $220.98 $527.51 0.5904 $311.44 $205.30 0.5904 $121.21 $527.51 0.5568 $293.73 $205.30 0.5568 $114.31 $527.51 0.5252 $277.02 $205.30 0.5252 $107.81 $527.51 0.4953 $261.27 $205.30 0.4953 $101.68 $527.51 0.4671 $246.41 $205.30 0.4671 $95.90 $527.51 0.4406 $232.40 $205.30 0.4406 $90.45 $527.51 0.4155 $219.18 $205.30 0.4155 $85.30 $527.51 0.3919 $206.71 $205.30 0.3919 $80.45 $527.51 0.3696 $194.96 $205.30 0.3696 $75.88 $527.51 0.3486 $183.87 $205.30 0.3486 $71.56 $527.51 0.3287 $173.41 $205.30 0.3287 $67.49 $527.51 0.3100 $163.55 $205.30 0.3100 $63.65 $527.51 0.2924 $154.25 $205.30 0.2924 $60.03 $527.51 0.2758 $145.48 $205.30 0.2758 $56.62 $527.51 0.2601 $137.20 $205.30 0.2601 $53.40
$5,857.06 $3,366.91 As can be seen in these tables the adjusted capitalized lease for Best Buy shows a
difference of almost $2.5 Billion. This shows that Best Buy’s liabilities on the balance
sheet are grossly understated.

31
After discounting the $1.5 billion and incorporating it into the operating lease
obligation, with an appropriate discount rate the difference on a yearly basis, between
the stated and the adjusted is substantial. This restatement shows that Best Buy defers
a large amount of its lease obligations out into the future.
BBY $5,928.00 $602.00 $1,187.00 $1,059.00 $3,080.00 Operating Lease Obligation Total <1YR 1-3 YRS 3-5 YRS >5 YRS
Adjusted $7,428.00 $757.66 $1,485.60 $1,322.18 $3,862.56 Difference ($1,500.00) ($155.66) ($298.60) ($263.18) ($782.56)
All Values In Millions
Debt to capitalization ratio also did have a significant problem, because of the
11% discount rate used, which decreases debt significantly and also understated
capital. Below is a chart which compares the reported and restated values with a
discount rate which is 6%, or the industry average.
BBY Revised Debt 596 596 Capitalized Operating Lease Obligation 4413 6332 Total Debt 5009 6928 Debt 596 596 Capitalized Operating Lease Obligation 4413 6332 Total Stockholder Equity 5257 5257 Adjusted Capitalization 10266 12185 Adjusted Debt-to-Capitalization Ratio 49% 57% BBY was using an 11% discount rate for 20 years. We revalued the ratio using a 6% discount rate over 20 years.
This table shows that there is about an 8% difference in the restated ratios. This
restatement indicates just how much a company can play with numbers and remain
within GAAP while reducing liabilities and puffing up ratios and assets.

32
Ratios Analysis and Forecast Financials Another aspect of a company valuation report entails computing a set of financial
ratios and interpreting these ratios and their respective meaning for the standing of a
company. Ratios also help create a relatively fair level for comparison between a
company and its competitors since the numbers obtained give an industry benchmark.
Coupled with ratio analysis, financial forecasting is an educated estimate based on
historical information about the future performance of a company. Financial forecasting
is primarily done through stating future balance sheets, income statements and
statement of cash flows. There are three major categories into which these ratios are
divided: liquidity analysis, profitability analysis, and capital structure analysis. These
ratios will assist us in creating an industry comparison of Best Buy’s strategy and its
effectiveness or lack-there-of.
Trend (Time Series) Analysis/Cross Sectional Analysis:
The first category of ratios we are going to discuss will deal with liquidity. Having
computed these ratios for five years, we are going to elaborate on trends and the
possibilities that are triggering these trends. Liquidity ratios give a measure of a
company’s ability to pay back their short term financial obligations; they are also
indicators of a firm’s ability to generate cash flow. The first ratio that will be discussed
is the current ratio. The current ratio is a value that is calculated by dividing current
assets by current liabilities; both of these numbers are found on the balance sheet.
Current Ratio= current assets/current liabilities
2001 2002 2003 2004 2005
Best Buy 1.08 1.24 1.28 1.27 1.39
Circuit City 2.2 2.23 3.09 2.57 2.12
RadioShack 2.08 2.07 1.94 1.85 1.65
When interpreting this current ratio one must realize the output produced by the
calculation may be stated as: for each dollar of liabilities, there exists a certain amount
of current assets. Current assets are labeled as such because they are easily converted

33
to cash if necessary and are made up of accounts receivables, inventory, marketable
securities, pre-paid expenses followed by cash and cash equivalents. The higher the
current ratio the more liquid a company is, ensuring their ability to meet short term
financial obligations when time comes due. A current ratio well above industry
standard is a sign of inefficiency, indicating that the assets are not being utilized
efficiently. Best Buy’s current ratio output shows signs of efficient use of current assets
throughout the five years for which they were calculated. This indicates that Best Buy
appropriately uses their current assets and they do not have an excess of assets that
are not being employed or being turned over. A flaw in calculation of the current ratio is
its inclusion of inventory, which usually stays in current assets for a period of 6 weeks,
which in turn causes the ratio to increase, showing profligacy which does not portray
reality. Best Buy does not have an excess of any of the components which create
current assets, which again is indicative of intelligent management core, employing all
assets for the benefit of the company.
Current Ratio
0.000.501.001.502.002.503.003.50
2001 2002 2003 2004 2005
Years
Out
put
BBY
CC
RSH
Average
Above is a cross sectional analysis graph which shows the industry average, and
compares it to Best Buy, Circuit City, and RadioShack. As the chart designates Circuit
City has the highest current ratio, which mathematically equates to their current
liabilities being much lower than to those of Best Buy. Their current assets are almost
as large as those of Best Buy which in-turn creates a high current ratio. This indicates
the existence of an excess of current assets that could be utilized more efficiently
elsewhere. RadioShack, like Circuit City, consistently stays above the industry average.
This again proves that for each dollar of current liabilities they have an excess number

34
of current assets, which could be used to provide investment/financing income.
Inventory turnover inefficiency is another possibility which could cause a drastic
increase in the current assets number.
Quick Ratio: cash + accounts receivables + securities/current liabilities
2001 2002 2003 2004 2005
Best Buy .39 .58 .59 .66 .75
Circuit City .69 1.10 .99 1.21 .98
RadioShack .82 .79 .95 .71 .54
Best Buy’s quick ratio has been increasing over the past five years which
indicates an accumulation of quick assets and a minor decrease in current liabilities. A
high quick ratio indicates inefficiency in use of current assets which could be used for
other purposes in the business. The chart above shows Best Buy’s quick ratio increased
$.07 from 2003-2004 and $.09 from 2004-2005, an explanation for this modest increase
is greater investment in market securities for both years 2004 and 2005 which increases
the numerator thus increasing the output. Although current liabilities grew the amount
was not as large as the increase in quick assets, which contributed to the increase in
the ratio output.
Quick Ratio
0.000.200.400.600.801.001.201.40
2001 2002 2003 2004 2005
Years
Out
put
BBY
CC
RSH
Average
The graph above depicts the industry trend and creates a ground for comparison
between the industry and Best Buy’s performance. As visible from the chart, Circuit
City has the highest ratios for each year after 2001. This indicates that their current
liabilities are escalating faster than their quick assets. Circuit City has a range of $.52
from 2001-2005 which increases and decreases. RadioShack, a company with a fair
amount of fluctuation in their quick ratio comparison, creates inconsistency and

35
unpredictability in their future numbers. With a range of $.41 for their five year trend it
is clear that there is a great amount of fluctuation in their levels of both quick assets
and their current liabilities. Best Buy maintains a healthy level of quick assets in
comparison to their current liabilities, demonstrating relatively healthy management of
assets; again proving their ability to stay below the industry average for all five years.
Inventory Turnover ratio: Cost of goods sold/Inventory
2001 2002 2003 2004 2005
Best Buy 6.94 8.09 7.82 7.16 7.34
Circuit City 4.46 5.82 5.42 4.99 5.41
RadioShack 2.30 2.40 3.04 2.40 2.80
Days Supply of inventory: 365/Inventory Turn Over
2001 2002 2003 2004 2005
Best Buy 52.57 45.12 46.68 50.95 49.70
Circuit City 81.89 62.73 67.29 73.12 67.42
RadioShack 158.70 152.08 119.97 152.27 130.14
As stated above in the consumer electronics industry (retail sector) the lower the
ratio the better. In both ratio outputs, Best Buy sets the industry model with a good
turnover ratio which creates a strong day’s supply of inventory. Best Buy’s ability to use
their inventory control systems effectively helps keep inventory costs low, and reduces
stuffing especially for inventory. Best Buy’s average inventory turnover for the five
years is at 7.47; again this number states that the inventory was cleared out and re-
ordered about 7.5 times a year in five years. This number also indicates that Best Buy
has strong number of sales throughout the year; obviously the fourth quarter will have
a greater number of sales, however there are a steady number of sales throughout the
year. Along the same lines Best Buy’s days supply of inventory is also is relatively low,
except for the 2001 fiscal year, which again was expected because of the hit the U.S.
economy took. From there the numbers stayed below that high of about 52 days, yet
again indicating efficient inventory management on part of Best Buy. Best Buy also had
a trend of increasing inventory level from 2001-2005 taking inventory levels from $1.7
Billion to $ 2.8 Billion in five years, which is a substantial increase, however even with

36
that strong increase, Best Buy managed to keep their inventory turnover and their days
supply of inventory at competitive levels for the retail industry in general.
Inventory Turnover
0.00
2.00
4.00
6.00
8.00
10.00
2001 2002 2003 2004 2005
Years
Out
put
BBY
CC
RSH
Average
The graph above shows the number of inventory turnovers per year. Best Buy’s
numbers for all five years have placed them well above the industry average and their
two main competitors for inventory turnover. Circuit City manages to stay above the
industry average too, however is not nearly as competitive in their ability to turn
inventory over. In comparison Circuit City inventory levels have also grown over the
past five years, however they have not had as rapid a growth rate as that of Best Buy.
RadioShack, because of their strategy, tends not to even come close to turning
inventory as swiftly as the other two competitors. RadioShack tends to have many
products that are part of the consumer electronics industry, which might not be
available at Circuit City or Best Buy, such as input jacks and add cables. Due to its
ability to turnover inventory, one can imply that Best Buy purchases/orders a significant
amount of inventory when necessary, this intern creates a certain bargaining power
that Best Buy has over it suppliers because of their brand recognition and their
presence in the consumer electronics industry. Inventory turnover also has a direct
impact on the working capital and the “money merry-go-round” of a company. The
faster inventory is transferred out due to sales the shorter the cash to cash cycle, since
money would not be tied up in inventory.

37
Days Supply of Inventory
0.00
50.00
100.00
150.00
200.00
2001 2002 2003 2004 2005
Years
Out
put
BBY
CC
RSH
Average
Best Buy sets the standard in the industry for inventory turnover ratio, which is a
measure of how fast or how often they restock their inventory. The day’s supply of
inventory tells you the number of day’s inventory that is ordered stays on hand, until a
new batch of inventory is ordered and restocked. The industry average is extracted
higher because of RadioShack’s DSI which is the highest in the industry. Circuit City has
a set of slightly competitive numbers when it comes to DSI in comparison to Best Buy.
Again this can be equated to healthy sales on a quarterly basis for Best Buy, in
comparison to RadioShack. As mentioned above Best Buy’s inventory levels have
increased by $1.1 billion over the past five years, and yet they have managed to move
their inventory an average of 49.00 days for the past five years. As stated above if
inventory turnover is fast, the days supply of inventory is lower, which indicates their
inventory is selling and not being stored inefficiently. A current ratio that is too high is a
sign of inefficiency. With most companies you can compare the current ratio and quick
ratio to inventory turnover, this comparison will tell you if inventory is the cause of a
major variation. If a company is capable of expelling inventory quickly then a current
ratio that is higher should not be an excessive concern because inventory is part of
current assets, and tends to be a high percentage of current assets. However, if they
have a high inventory turnover and a low day’s supply of inventory one can be assured
during normal economic conditions, those inventories will sell creating profits for the
company.

38
Receivables Turnover: Sales/Accounts Receivables
2001 2002 2003 2004 2005
Best Buy 73.33 88.67 67.13 71.57 73.18
Circuit City 17.63 45.11 46.77 64.01 60.53
RadioShack 17.30 22.22 25.55 20.09 16.24
Days sales outstanding: 365/receivables turnover
2001 2002 2003 2004 2005
Best Buy 4.98 4.12 5.44 5.10 4.99
Circuit City 20.70 8.09 7.80 5.70 6.03
RadioShack 21.09 16.43 14.29 18.17 22.47
Much like the inventory turnover and DSI ratios the receivables ratios are a
measure of the number of times receivables are collected on yearly basis for the
turnover and the DSO (Days Sales Outstanding) is a specific day measure of the
number of days receivables are collected. Receivables are a part of the current assets
section in the balance sheet of a company which means that they are considered to be
relatively liquid. The DSO ratio is more valuable the lower it is which means the
company has limited worries for bad debt expense from uncollectible accounts. For
inventory turnover Best Buy again is a distant leader, showing that they collect their
receivables more often then either of the two competitors. The drastic drop from 2002
to 2003 for receivables turnover for Best Buy is due in large part to uncollected
receivables from a subsidiary, Musicland, which was sold that year for a loss of $500
million. Preceding 2003 however Best Buy’s receivables turnover has been on the rise,
demonstrating their ability to collect receivables quickly.
Since there is a direct inverse relationship between receivables turnover and
DSO, one can instinctively come to the conclusion that Best Buy will also have the
lowest DSO since they have the highest receivables turnover ratio. Again this ratio
states that Best Buy collects their receivables on an average of every 4.93 days for the
past five years. Since receivables is part of the “money merry-go-round” this indicates
that there is a insignificant amount of time between when the sale is made and when
the receivable is collected, which is great for the business because their cash from
operations is on hand faster.
39
Receviables Turnover
0.00
20.00
40.00
60.00
80.00
100.00
2001 2002 2003 2004 2005
Years
Out
put
BBY
CC
RSH
Average
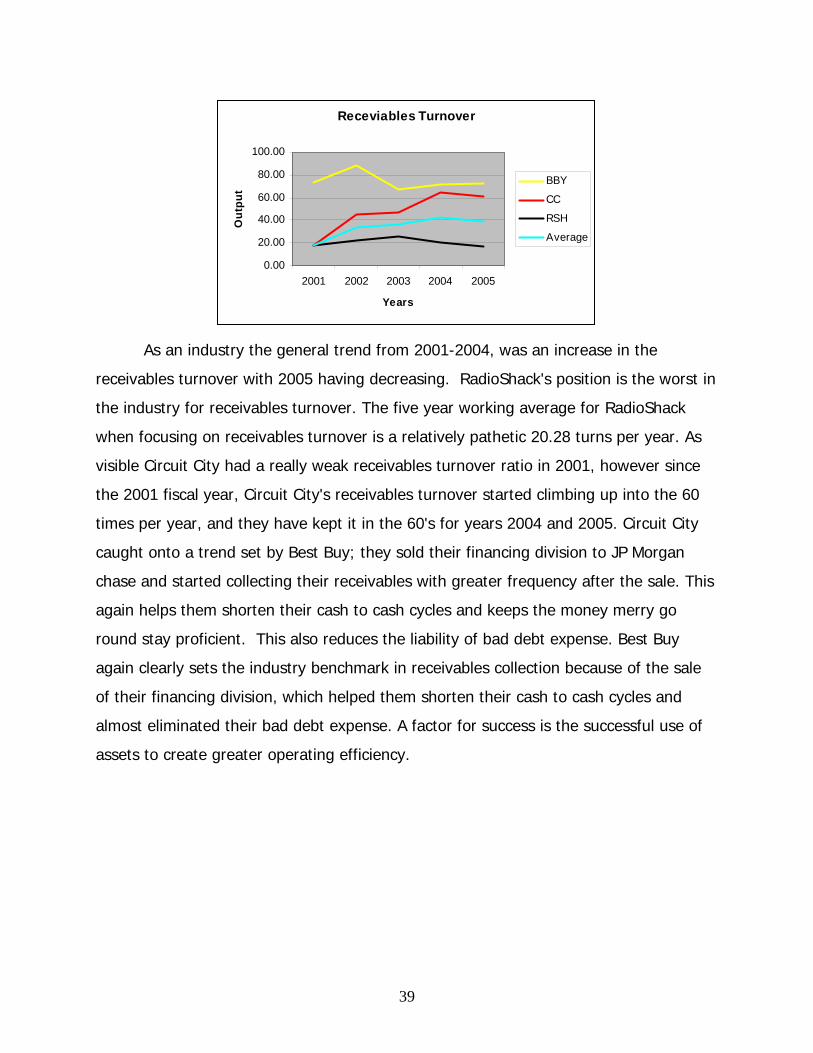
As an industry the general trend from 2001-2004, was an increase in the
receivables turnover with 2005 having decreasing. RadioShack's position is the worst in
the industry for receivables turnover. The five year working average for RadioShack
when focusing on receivables turnover is a relatively pathetic 20.28 turns per year. As
visible Circuit City had a really weak receivables turnover ratio in 2001, however since
the 2001 fiscal year, Circuit City's receivables turnover started climbing up into the 60
times per year, and they have kept it in the 60's for years 2004 and 2005. Circuit City
caught onto a trend set by Best Buy; they sold their financing division to JP Morgan
chase and started collecting their receivables with greater frequency after the sale. This
again helps them shorten their cash to cash cycles and keeps the money merry go
round stay proficient. This also reduces the liability of bad debt expense. Best Buy
again clearly sets the industry benchmark in receivables collection because of the sale
of their financing division, which helped them shorten their cash to cash cycles and
almost eliminated their bad debt expense. A factor for success is the successful use of
assets to create greater operating efficiency.

40
Days Sales Outstanding
0.00
5.00
10.00
15.00
20.00
25.00
2001 2002 2003 2004 2005
Years
Out
put
BBY
CC
RSH
Average
Days sales outstanding (DSO) is a measure related to the inventory turnover
ratio. The days sales outstanding output lets one know how many times a year the
receivables account is collected, it is imperative because cash is very significant to the
operation of a business and the sooner you can collect cash and decrease the
investment from outside the working capital. As visible from the graph the industry
average is on the general in decline, with a little bit of a raise in DSO for 2005.
RadioShack again, is the industry worst with their DSO, having a DSO that hovers
around 21, again indicating that cash is collected approximately about once every 21
days. Circuit City started with a relatively high DSO but managed to decrease their DSO
extensively, this was done through a sale of their finance division to Chase bank, which
manages their credit card accounts. Hence all sales made on account are collected
within 1 week, in comparison to the 2001 fiscal year at which it was about 20 days.
Since RadioShack manages its own credit line, it is evident that they are not as efficient
as Circuit City or Best Buy in their DSO. As mentioned earlier this entails that their cash-
to-cash cycle is a significantly larger than those of Best Buy and Circuit City. Best Buy
set the example for Circuit City to follow in selling their credit division hence helping
their ability to collect receivables sooner. Again the faster a company is capable of
collecting receivables the more liquid they are because they have cash coming is
sooner.

41
Working capital turnover: Sales/ (Current assets – current liabilities)
2001 2002 2003 2004 2005
Best Buy 71.62 21.90 19.50 20.07 14.12
Circuit City 5.14 5.25 5.77 6.89 8.65
RadioShack 5.38 5.21 5.75 5.92 7.93
As visible from the table above, Best Buy has had a significant decrease since
2001 in working capital turnover. Working capital turnover is a measure of the ability of
a dollar of working capital to create sales. A high working capital turnover number is
desirable because it is indicative of high sales revenue for every dollar of working
capital. Best Buy has the highest ratio in the industry by far, however the number has
been decreasing in general since 2001. For the year 2005, Best Buy had increased
short term liabilities which lead to a decrease in their working capital turnover for that
particular year. Even though the ratio from 2001 is low we still found an average for
the years from 2002-2005 of 18.9 which is a decent standard for Best Buy. The 18.9
ratio illustrates that for each dollar in the working capital there are $18.90 of sales that
are created because of it.
Working Capital Turnover
0.0010.0020.0030.0040.0050.0060.0070.0080.00
2001 2002 2003 2004 2005
Years
Out
put
BBY
CC
RSH
Average
In the graph above there is an obvious outlier, which is Best Buy’s Working
Capital Turnover for the year 2001. The Working Capital Turnover of 71 was a great
ratio, but it wasn’t duplicated and is considered an outlier. A higher working capital
turnover indicates that for a certain amount of working capital there are a certain
number of sales that are generated. The industry average throughout the five years is
relatively low with a sudden jump of about 2 from 2004-2005, due to an increase in
sales for the industry as a whole. Best Buy is by far the most efficient in their use of

42
working capital for the generation of sales in the industry. In order for the working
capital ratio to increase, the working capital number should decrease (decrease current
assets, or increase current liabilities), or the sales number should increase. The industry
as a whole has experienced a general increase in sales, as a result of this working
capital turnover across the industry has increased. With a new focus and a customer
centricity approach to the industry Best Buy has had to increase their investment in
current assets which decreased the ratio.
Liquidity Analysis 2001 2002 2003 2004 2005 Opinion
Current Ratio 1.08 1.24 1.28 1.27 1.39 Positive
Quick Ratio 0.39 0.58 0.59 0.66 0.75 Positive
Inventory Turnover 6.94 8.09 7.82 7.16 7.34 Steady
Days Supply of Inventory 52.57 45.12 46.68 50.95 49.70 Neutral
Receivable Turnover 73.33 88.67 67.13 71.57 73.18 Slightly
Negative
Days Supply of Inventory 4.98 4.12 5.44 5.10 4.99 Steady
Working Capital Turnover 71.62 21.90 19.50 20.07 14.12 Positive
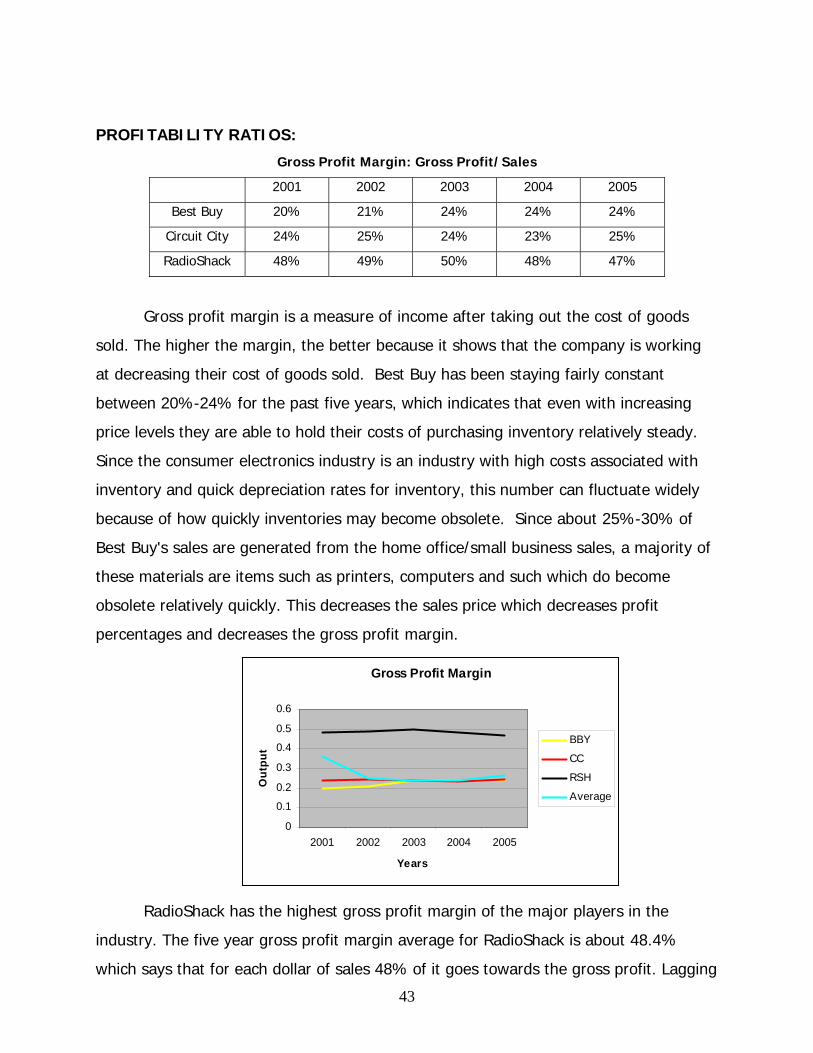
43
PROFITABILITY RATIOS:
Gross Profit Margin: Gross Profit/Sales
2001 2002 2003 2004 2005
Best Buy 20% 21% 24% 24% 24%
Circuit City 24% 25% 24% 23% 25%
RadioShack 48% 49% 50% 48% 47%
Gross profit margin is a measure of income after taking out the cost of goods
sold. The higher the margin, the better because it shows that the company is working
at decreasing their cost of goods sold. Best Buy has been staying fairly constant
between 20%-24% for the past five years, which indicates that even with increasing
price levels they are able to hold their costs of purchasing inventory relatively steady.
Since the consumer electronics industry is an industry with high costs associated with
inventory and quick depreciation rates for inventory, this number can fluctuate widely
because of how quickly inventories may become obsolete. Since about 25%-30% of
Best Buy's sales are generated from the home office/small business sales, a majority of
these materials are items such as printers, computers and such which do become
obsolete relatively quickly. This decreases the sales price which decreases profit
percentages and decreases the gross profit margin.
Gross Profit Margin
0
0.1
0.2
0.3
0.4
0.5
0.6
2001 2002 2003 2004 2005
Years
Out
put
BBY
CC
RSH
Average
RadioShack has the highest gross profit margin of the major players in the
industry. The five year gross profit margin average for RadioShack is about 48.4%
which says that for each dollar of sales 48% of it goes towards the gross profit. Lagging

44
behind in a distant second is Circuit City, who averages about 25% gross profit margin
for the five year average, which is almost half of RadioShack profit margin. A high gross
profit margin exists either due to high number of sales dollar or a relatively low number
for cost of goods sold, which is what is subtracted from sales to get gross profit. In
case of RadioShack this high profit margin exists because of a lower cost of goods sold
account, because of the type of products within the consumer electronics industry that
RadioShack sells. Circuit City and Best Buy have a close gross profit margin percentage
which is likely because they sell a similar product line of goods, in which there is a high
cost of goods sold.
Operating expense Margin: operating expense/sales
2001 2002 2003 2004 2005
Best Buy 16% 16% 20% 20% 16%
Circuit City 23% 23% 23% 23% 24%
RadioShack 93% 90% 89% 88% 93%
Operating expense margin is a measure of the amount of expense endured when
there is a dollar of sale. This number should be a lower number because it shows the
company's management is working on controlling costs to increase profits. Typically
operating expenses are expenses that can not be associated with running a business
but are not applicable directly to the product line of goods and services being offered.
Best Buy's operating expense margin held steady for the years 2001-2002 at 16%
indicating healthy control of costs. However in 2003, 2004 the number increased to
20% indicating a rise in the cost of operations, but in 2005 the number decreased back
to 2005. This decrease occurred because of a decrease in administrative costs which
directly reduces operating expense. Also there have been drastic increases in sales,
which is also what occurred from 2004-2005 which when the denominator is large the
output will be lower. Since sales did increase by around 15% from 2004-2005 it is
understandable that there was such a strong decrease in the operating expense margin.

45
Operating Expense
0.00
0.20
0.40
0.60
0.80
1.00
2001 2002 2003 2004 2005
Years
Out
put
BBY
CC
RSH
Average
The industry as a whole has a relatively high operating expense margin, because
of RadioShack, who has the highest margin level. As stated above, the operating
expense margin measures the percentage amount of each sales dollar that goes toward
operating expenses. RadioShack’s five year average is about 91% which is high. This
typically proves that their selling, general and administrative costs are too high which
directly causes the net income level to be drastically lower. Circuit City and Best Buy
have levels which are much lower that that of RadioShack and the industry average.
Circuit City’s output is a bit higher in comparison to Best Buy’s but nonetheless a
competitive number indicating, that the management team at Circuit City does a
commendable job of controlling costs for the company. Best Buy again leads the
industry in the operating expense margin section, the average for the past five years for
Best Buy is about 17.7%. Since only 17.7% of each sales dollar for Best Buy is used for
covering operating expenses this leaves a larger percentage of revenue to flow down to
the net income. The net income is directly affected by a company’s operating expense
margin, and the lower the margin ratio the higher the net income.
Net Profit Margin: Net Income/Sales
2001 2002 2003 2004 2005
Best Buy 3% 3% .5% 3% 4%
Circuit City 1.6% 2.3% .8% -.9% .6%
RadioShack 3% 6% 6% 7% 5%
In a competitive consumer electronics industry, Best Buy manages to have a
steady percentage for the net profit margin. The consumer electronic industry is very

46
competitive and profit margins are low. Best Buy manages to hover at about 3%, a
number which states that only $.03 on every sales dollar makes it to Net Income. In
2003 Net Profit Margin was drastically affected by the sale of Musicland; however they
did manage to rebound quite well.
Net Profit Margin
-0.02
0.00
0.02
0.04
0.06
0.08
2001 2002 2003 2004 2005
Years
Out
put
BBY
CC
RSH
Average
RadioShack manages to have the highest net profit margin in the industry,
however when one looks at their operating margin, which hovers around 91%, it seems
to imply that they have no other costs and the other 7%-9% manage to flow through
directly to their net income. Circuit City has struggled with keeping a healthy net profit
margin, which has been decreasing since 2002 with a slight increase from the years of
04-05. The negative margin in 2004 was a result of slow sales year for Circuit City,
which affected their net income drastically. The whole industry was slower that year
however, RadioShack managed to increase their margin. Best Buy manages to remain
steady at 3.5% for all three years, with 2003 being an outlier because of the loss
incurred from the sale of Musicland.
Asset Turnover: Sales/total assets
2001 2002 2003 2004 2005
Best Buy 3.14 2.40 2.56 2.69 2.55
Circuit City 2.67 2.10 2.62 2.64 2.76
RadioShack 2.13 2.05 2.07 1.92 2.30
The asset turnover ratio is a measure of the efficiency of asset use in generating
sales. Since this is an industry with relatively lower margins the asset turnover number
will be lower, the asset base will tend to be a little larger, primarily because of inventory

47
and property plant and equipment. For the consumer electronics industry, Best Buy has
a sound asset turnover with an average of 2.67. A number which states that for each
dollar of assets the company holds, it generates a return of $2.67 in sales. The cause of
the higher number in 2001 was a lower level of assets that Best Buy had kept on hand
because of the economic recession of 2001. However, after 2002 the number leveled
off at about 2.5, indicating a healthy return. The increase in the 2005 number is directly
associated with an increase in the current assets section of total assets, Best Buy had
transferred from cash to investments in short term marketable securities and also
increased inventory levels. The increase in the short term investments account, does
not generate sales, however does have returns, which can be seen in the statement of
cash flows under the cash flows from investing activities section.
Asset Turnover
1.50
2.00
2.50
3.00
3.50
2001 2002 2003 2004 2005
Years
Out
put
BBY
CC
RSH
Average
The industry asset turnover ratio stays relatively close over the five years we
compared. Best Buy and Circuit City are the industry leaders, staying very close in their
asset turnover, which indicates both of the firms efficiently use their assets to create
sales. RadioShack still has a competitive turnover output which falls below the industry
standard. This ratio can be changed depending on the level of sales and assets; if the
assets are too high and sales are not competitive the turnover output number will be
relatively low. If there is a higher sales number with a lower asset number, the
turnover number will be high. In the case of this industry the sales are strong and
continue to grow from year to year with the asset base also increasing. The increase in
assets is not as drastic as sales which hurt the turnover ratio by lowering. The
consumer electronics industry is an industry in which balance between assets, sales and
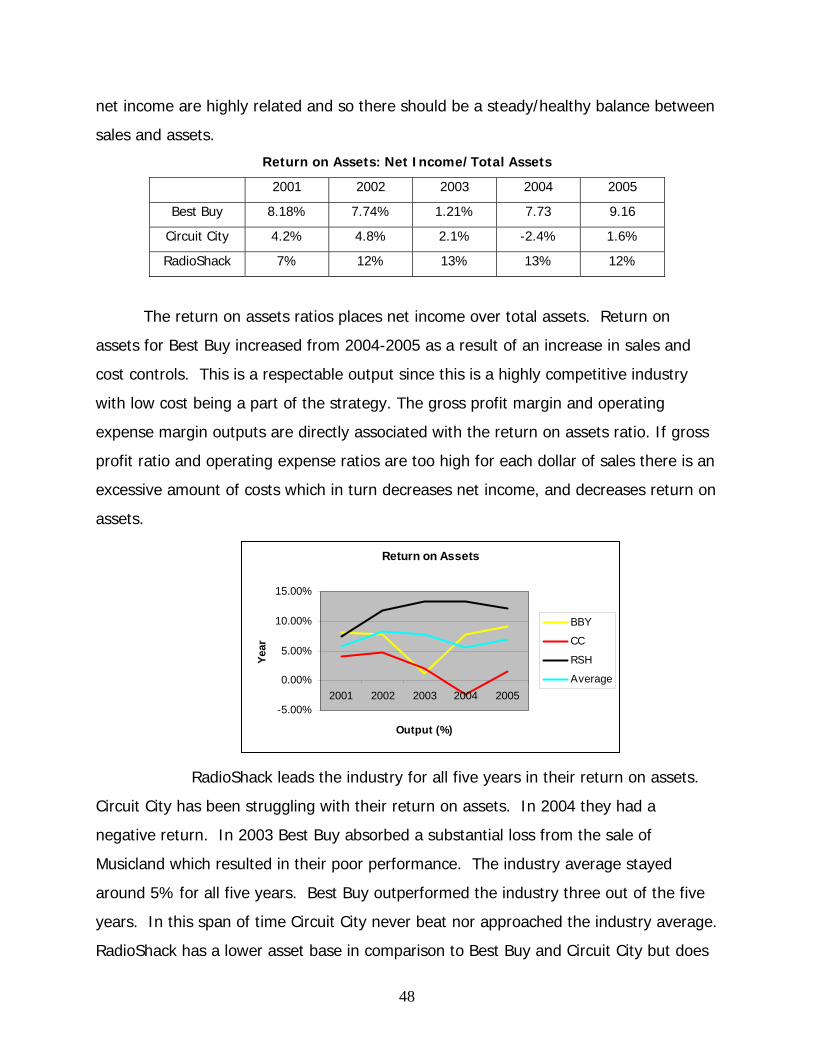
48
net income are highly related and so there should be a steady/healthy balance between
sales and assets.
Return on Assets: Net Income/Total Assets
2001 2002 2003 2004 2005
Best Buy 8.18% 7.74% 1.21% 7.73 9.16
Circuit City 4.2% 4.8% 2.1% -2.4% 1.6%
RadioShack 7% 12% 13% 13% 12%
The return on assets ratios places net income over total assets. Return on
assets for Best Buy increased from 2004-2005 as a result of an increase in sales and
cost controls. This is a respectable output since this is a highly competitive industry
with low cost being a part of the strategy. The gross profit margin and operating
expense margin outputs are directly associated with the return on assets ratio. If gross
profit ratio and operating expense ratios are too high for each dollar of sales there is an
excessive amount of costs which in turn decreases net income, and decreases return on
assets.
Return on Assets
-5.00%
0.00%
5.00%
10.00%
15.00%
2001 2002 2003 2004 2005
Output (%)
Year
BBY
CC
RSH
Average
RadioShack leads the industry for all five years in their return on assets.
Circuit City has been struggling with their return on assets. In 2004 they had a
negative return. In 2003 Best Buy absorbed a substantial loss from the sale of
Musicland which resulted in their poor performance. The industry average stayed
around 5% for all five years. Best Buy outperformed the industry three out of the five
years. In this span of time Circuit City never beat nor approached the industry average.
RadioShack has a lower asset base in comparison to Best Buy and Circuit City but does

49
have strong income numbers, which gives them the strength to lead the industry in
asset return.
Return on Equity: Net Income/Owner’s Equity
2001 2002 2003 2004 2005
Best Buy 21.73% 22.61% 3.63% 20.60% 22.12%
Circuit City 6.83% 7.97% 3.45% -4.00% 2.97%
RadioShack 21.42% 36.18% 36.57% 36.57% 45.35%
A measure of a company’s ability to provide returns on equity funding, is the
return on equity ratio. This particular ratio indicates that for a dollar of owners equity
there is about 22% return on that dollar. Best Buy’s ROE has fluctuated over the past
five years. In 2003 ROE dropped drastically (see Musicland) but they returned to their
previous ROE in 2004 and 2005. Holding equity relatively steady and increasing net
income was the primary source of the increase in the ROE for the past two successive
years.
Return on Equity
-10.00%
0.00%
10.00%
20.00%
30.00%
40.00%
50.00%
2001 2002 2003 2004 2005
Years
Out
put (
perc
enta
ge)
BBY
CC
RSH
Average
In the cross sectional analysis graph above, RadioShack is outperforming the rest of
the industry in ROE. Again their equity base is smaller in comparison to those of Best
Buy and Circuit City but their management of income is strong, which increased their
ROE in comparison to the industry. Circuit City remained below the industry average
for all five years because of their inability to generate superior sales. Best Buy, with the
exception of 2003, is holding strong with their ROE averaging about $.20 per dollar of
equity. Best Buy has managed to stay competitive with the industry for four of the five
years.

50
SGR 2001 2002 2003 2004 2005 Best Buy 57.72% 66.07% 10.86% 44.60% 45.76%
The table above shows the Sustainable Growth Rate for Best Buy over the last
five years. We’ve found that the Sustainable Growth Rate for Best is unattainable and
is inflated because of Best Buy’s high Debt to Equity ratio. We project Best Buy’s
growth to be 15% over the next four years followed by 11% growth in the three years
following that. The reason for such a nice growth rate is that the consumer electronics
industry is experiencing a bit of boom with its flat panel television sales, and this boom
should continue for the next four to six years.
Profitability Analysis
2001 2002 2003 2004 2005 Opinion
Gross Profit Margin 20% 21% 24% 24% 24% Positive
Operating Expense Margin 16% 16% 20% 20% 16% Positive
Net Profit Margin 3% 3% .47% 3% 4% Neutral
Asset Turnover 3.14 2.40 2.56 2.69 2.55 Negative
Return On Assets 8.18% 7.74% 1.21% 7.73% 9.16% Slightly Positive
Return On Equity 21.73% 22.61% 3.63% 20.60% 22.12% Slightly
Positive
Capital Structure Ratios:
There are primarily two ways for a company to obtain resources to grow, internal
or external financing. Internal financing entails using retained earnings to help expand
their operations, typically these funds come from income generated from operations by
the company. With external financing there are two additional forms of cash flow,
equity financing and debt financing. A company may obtain financing through debt,

51
which could involve issuing bonds or through obtaining loans. These transaction
amounts appear on the balance sheet under the liabilities section, typically classified as
long term liabilities specifically bonds payable, and notes payables.
The first ratio we will discuss will be the debt to equity ratio. It is a measure of how
much equity exists within the company for each dollar of debt the company has
incurred.
Debt to equity ratio: total liabilities/ total owners equity
2001 2002 2003 2004 2005
Best Buy 1.66 1.92 1.99 1.67 1.41
Circuit City .53 .66 .62 .68 .85
RadioShack 1.89 2.06 1.92 1.73 2.75
Best Buy averages about a 1.75 debt to equity ratio. This ratio indicates that for
every dollar of equity they have $1.75 of liability financing. Best Buy reduces their
overall debt to equity ratio by not capitalizing their operating leases which leads to a
lower ratio. A decreasing trend in the Debt to Equity ratio indicates that Best Buy is
trying to reduce liabilities in comparison to Owners Equity. Because of Best Buy’s size
they have the ability to borrow greater amounts of cash and finance more of their
activities through loans. Best Buy has shown strong growth and to sustain that growth
some debt financing is necessary but creditors don’t seem to believe there is a threat
for default.
Debt to Equity
0.00
0.50
1.00
1.50
2.00
2.50
3.00
2001 2002 2003 2004 2005
Years
Out
put
BBY
CC
RSH
Average

52
Circuit City has the lowest average Debt to Equity ratio which indicates that they
are financing their growth mostly through the issuance of stocks and bonds. Circuit
City should be able to borrow money at a pretty low rate due mostly to their low ratio
which indicates a low credit risk. Radio Shack is clearly the most leveraged of Best
Buy’s competitors and should be working toward lowering their Debt to Equity ration
through more internal growth because any financing they might attain could have a
very large interest rate attached.
Times Interest Earned: Operating Income/ interest expense
2001 2002 2003 2004 2005
Best Buy 87.29 42.86 33.67 40.75 32.77
Circuit City 14.45 61.64 19.72 3.62 54.06
RadioShack 5.74 9.79 13.24 18.31 7.23
Times Interest Earned is obtained by dividing Operating Income by Interest
Expense. This ratio is used when determining a companies’ ability to repay its interest
on borrowed money. Best Buy’s ability to repay its interest has decreased from 2001-
2005. This is due mostly to its increased leverage.
Times interest earned
-60.00-40.00-20.00
0.0020.0040.0060.0080.00
100.00
2001 2002 2003 2004 2005
Years
Out
put
BBY
CC
RSH
Average
Circuit City’s ability to repay interest has fluctuated greatly over the span of our
analysis. Their ability to repay debt has shown great fluctuations because of their
Operating Expense increases and decreases. RadioShack confirms the fact that they
are overleveraged with a Times Interest Earned ratio of 7.23 which is the lowest in the
industry. RadioShack has created most of its growth over the last few years by
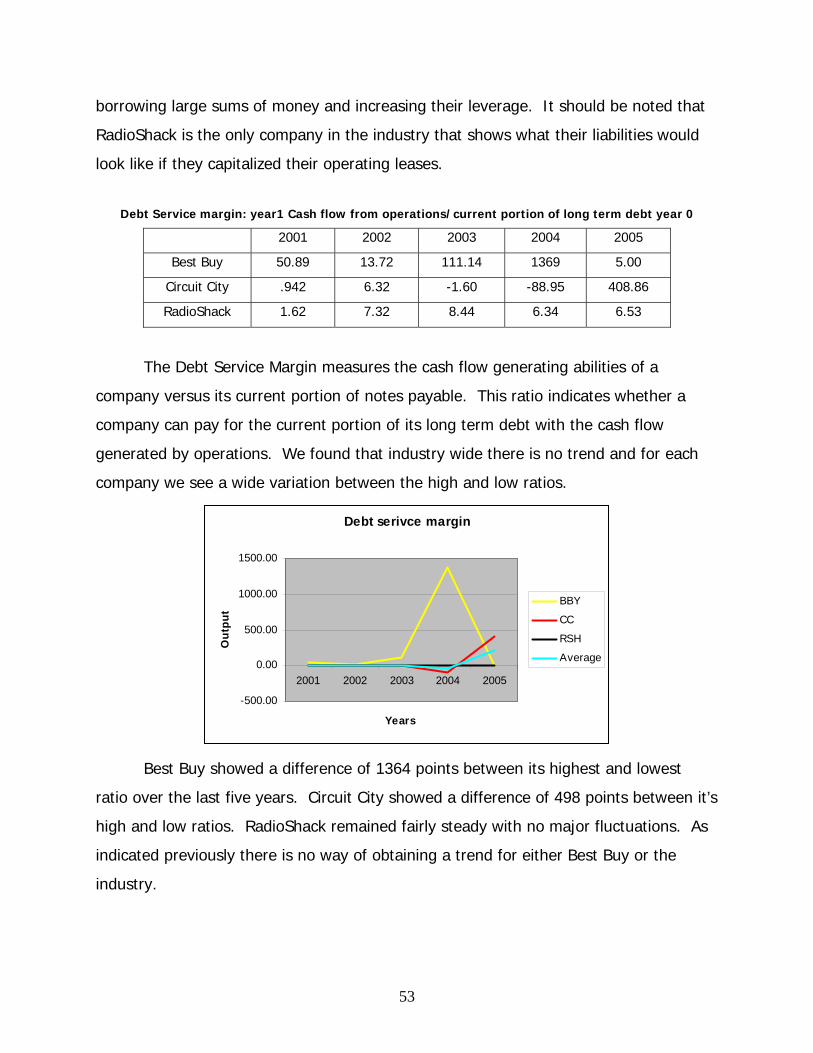
53
borrowing large sums of money and increasing their leverage. It should be noted that
RadioShack is the only company in the industry that shows what their liabilities would
look like if they capitalized their operating leases.
Debt Service margin: year1 Cash flow from operations/current portion of long term debt year 0
2001 2002 2003 2004 2005
Best Buy 50.89 13.72 111.14 1369 5.00
Circuit City .942 6.32 -1.60 -88.95 408.86
RadioShack 1.62 7.32 8.44 6.34 6.53
The Debt Service Margin measures the cash flow generating abilities of a
company versus its current portion of notes payable. This ratio indicates whether a
company can pay for the current portion of its long term debt with the cash flow
generated by operations. We found that industry wide there is no trend and for each
company we see a wide variation between the high and low ratios.
Debt serivce margin
-500.00
0.00
500.00
1000.00
1500.00
2001 2002 2003 2004 2005
Years
Out
put
BBY
CC
RSH
Average
Best Buy showed a difference of 1364 points between its highest and lowest
ratio over the last five years. Circuit City showed a difference of 498 points between it’s
high and low ratios. RadioShack remained fairly steady with no major fluctuations. As
indicated previously there is no way of obtaining a trend for either Best Buy or the
industry.

54
Capital Structure 2001 2002 2003 2004 2005 Opinion
Debt To Equity 1.66 1.92 1.99 1.67 1.41 Neutral
Times Interest Earned 87.29 42.86 33.67 40.75 32.77 Positive
Debt Service Margin 50.89 13.72 111.14 1369.00 5.00 No
Trend
Ratio Analysis with inclusion of $1.5 Billion as Capital Lease:
With the inclusion of the $1.5 billion as a capital lease there would be differences
amongst some of the ratios, not all ratios will be affected. The main ratios that will be
affected are the current ratio; the quick ratio, the Debt to Equity ratio, and the Debt to
Service Margin are the only ratios that will change.
Current Ratio with $1.5B
0.000.501.001.502.002.503.003.50
2001 2002 2003 2004 2005
Years
Out
put
BBY
CC
RSH
Average
As understandable the current ratio does decrease for the 2004 and 2005 fiscal
years, in which the capital lease is entered into the balance sheet and does directly
affect the current assets because it decreases the cash account and increases the
current liability account because of the current portion of long term debt. It also affects
the long term liabilities by way of the long term capital lease liability. However this does
not affect any ratios, and was inserted for knowledge sake.

55
Quick Ratio with $1.5B
0.000.200.400.600.801.001.201.40
2001 2002 2003 2004 2005
Years
Out
put
BBY
CC
RSH
Average
The quick ratio does see a small drop as well in the 2004 and 2005 years. This
ratio drops because the cash account which does have a somewhat strong influence on
that quick assets as a total decreases because of payments for the capital lease which
occur in 2004 and 2005. The debt to equity ratio increases by a small amount in the
2005 year from 1.41 to 1.47 because the amount of total debt does increase whereas
the amount of equity did hold steady for that year. Another ratio that is affected by the
accounting is the debt to service margin ratio.
Debt To Equity
0.00
0.50
1.00
1.50
2.00
2.50
3.00
2001 2002 2003 2004 2005
Year
Out
put
BBY
CC
RSH
Average
The Debt to Equity Ratio increases with the addition of the $1.5 Billion by 4.5%
from 1.41 to 1.47. This increase points to Best Buy’s reduction of debt to equity ratio
by not capitalizing their operating leases which leads to a lower ratio. A decreasing
trend in the Debt to Equity ratio indicates that Best Buy is trying to reduce liabilities in

56
comparison to Owners Equity. Because of Best Buy’s size they have the ability to
borrow greater amounts of cash and finance more of their activities through loans.
Debt serivce margin
-500.00
0.00
500.00
1000.00
1500.00
2001 2002 2003 2004 2005
Years
Out
put
BBY
CC
RSH
Average
The ratio made up by dividing the current portion of long term debt divided into
the cash flow from operations. With the addition of the capital lease the CFFO increases
because depreciation increases and is added back in to create the CFFO number.
However the current portion of the long-term debt does not change because the
payments for each subsequent year are included into the notes payable section which
does not affect this ratio.
Financial Statement Forecast Methodology
Income Statement with Best Buy Information
In preparing an accurate forecast, we first searched for trends over the past five
years of Best Buy’s financials. We projected that net sales will increase 15% from 2007-
2010, then 11% from 2011-2013, and then 7% growth from 2014-2017. We could not
use Internal Growth Rates to support our growth because we do not believe the
company will grow at twenty percent per year. We instead based our progression of
decreasing growth for Best Buy based on the comparison of patterns noticed in both
the past PC market boom to the current flat panel television market. Recent growth for
the company has been driven by flat panel sales and we believe the market for these
goods will gradually become saturated over the next ten years, much the same way the
PC industry behaved. For the remainder of the income statement forecasts we used a

57
five year average (excluding outliers) to complete our forecast and used those
percentages to obtain our bottom line.
Balance Sheet with Best Buy Information
The balance sheet forecast was done in the same method as the majority of our
income statement. We took a five year average and used those rates over the entire
ten year forecast. We computed our total assets forecast by taking an average of the
previous five years net sales divided by total assets which came to 36.9%. We
multiplied each year’s net sales by this percentage and established our ten year
forecast. Once we were able to forecast out total assets we then based all current and
non-current assets (excluding cash and equivalents) as percentages of total assets.
Liabilities and Debt were again handled in much the same manner. We took five year
averages compared to total assets to arrive at our ten year forecasts. Total current
liabilities were averaged to be 50.25% of total assets over the last 5 years and were
used to obtain our forecast. Our total debt was calculated to be 8.5% of total assets,
and total liabilities were found to be 60.64% of total assets. Statement of Cash Flows
Statement of Cash Flows with Best Buy Information
In order to forecast the items on the statement of cash flows we started with
their average over the past five years. From there we grew that number at the same
rate as net sales which were grown at 15% from 2008 – 2010, 11% from 2011 – 2013,
and 7% from 2014 – 2016. For example we took the average of depreciation over the
past five years which was 403.20. We grew that number at 15% for three years which
came out to 613.22. From there we grew it at 11% for the next three years which was
838.65. That number was grown by 7% for the remaining three years which gave us
1027.39. We looked at and tried to forecast only the major items which were
depreciation, deferred taxes, changes in working capital, and capital expenditures. We
weren’t able to forecast many of the items on the statement of cash flows because
there was no apparent trend.
58
Income Statement Revised
After the accounting distortion was corrected, it directly affected the interest
expense. We estimated a reasonable interest rate of 5.4% on this capital lease, for the
buildings covered under the lease. This increased the interest expense line item on the
income statement which directly decreases net income amounts. This increase in
interest expense will affect the subsequent year’s forecasts directly affecting the net
income lines for each year. When compared to the original forecasts with given Best
Buy information, the net income lines from 2005 on are lower. However with the
capitalized lease, we did decrease the operating expenses, since the building is now an
asset as opposed to an operating lease item.
Balance Sheet Revised
With the restatement of the $1.5 billion as a capital lease, there are quite a few
accounts within the balance sheet that are affected, which directly affect the total
assets, and total liabilities and owners equity. When paying for the lease, we deducted
the cash account from the current assets which does deduct the total on the total asset
account. It also increased the capital lease assets which are part of the long term
assets, again increasing the total assets accounts. All accounts that hamper the assets
also have an equal weight on some liability or owners equity account. The liability
accounts that were affected were both in the short term and long term liability
accounts. The short term liability account that was affected was the notes
payable/short term debt account which was increased in 2005 and each year after that.
The long term liability account that was increased was the capital lease obligations
account, which was increased by $ 1.344.84 billion in 2005 and was reduced
(depreciated) each year after that. Overall the total assets and liabilities increased in
equal amounts and the appropriate accounts were increased.
Statement of Cash Flows Revised
Only two line items changed on the Statement of Cash Flows from the restating
of the $1.5 Billion accounting distortion. The first line item to change was the Net

59
Income which came from the Income Statement and was discussed above. The other
change is an increase each year in the depreciation of assets. The decrease in Net
Income each year is partially offset each year by the increase in the depreciation rate.
The Cash Flow from Operations start off higher in 2006 than in Best Buy’s
version but the Cash Flow’s from Operations grow slower for the revised version so by
the end of the forecast Best Buy’s numbers are higher than the revised. This is due to
the offsetting changes that the $1.5 Billion caused.
Analysis and Forecasting Conclusion
Now that we have forecasted the financials of Best Buy, we believe that they will
continue to grow at a fast rate for a few more years then sales will flatten out. In an
industry that is dominated by trends it is hard to predict when a boom will start or end.
We believe that Best Buy has positioned itself to grow rapidly over the next few years
and is in an industry that is suitable for rapid expansion. A large portion of the sales
growth will be driven by the flat panel television market but it won’t be the sole driver
of sales in Best Buy’s expansion since they will be opening many new locations and
have recently signed a deal to sell Apple Computers.
A major weakness in our analysis is that we do not know when the current cycle
of growth will end and how much of a slowdown will be caused. The consumer
electronic retail industry is very cyclical and fickle. Any industry that is driven by
technology will always find a new star to carry on the mantle of success and drive
revenues higher.

60
Valuations Analysis Cost of Capital
There are several models that have been developed in the area of finance that
derive prices that compare to the current market price of the share. In order to
calculate outputs for these models, consistent inputs are necessary such as the cost of
equity, the cost of debt and the Weighted Average Cost of Capital (WACC).
Computations are necessary for the cost of equity and the cost of debt.
Regressions using historical stock prices for 12, 24, 36, 48 and 60 months, were run
with the monthly market return of the S&P 500 for those respective months with a risk
free rate. In this case the risk free rate used was the 5 year Treasury bond, which we
thought was appropriate because it had the highest explanatory power (adjusted r
squared) in comparison to the other alternatives. When the regressions were complete,
a beta was obtained based on the highest r squared output. The beta we selected had
a value of 2.28 and an adjusted r squared of 21.50%, which was the highest of all the
explanatory models. After having a definitive beta, it was carried over into the CAPM
model, to obtain a clear value for the cost of equity. The cost of equity is an integral
number for the firm, because it is considered to be the rate of return that keeps
investors require for their investments. When a potential project is under consideration,
the cost of equity is used as the discount rate. Even a zero net present value project
will be accepted because it meets investors return standards.
Ke = .0433 + 2.28(.0357)
The calculation of cost of debt was relatively simple and less involved in
comparison to finding beta. All information needed was found on the balance sheet or
in the management discussion and notes. Steps used for calculating the cost of debt
were getting a total of current and long term liabilities, followed by getting a weighted
average, and multiplying each item by its respective interest rate.

61
Total Kd Total Liabilities (Before Correction) 6607 5.16% Total Liabilities (After Correction) 8107 5.195%
Weighted Average Cost of Capital (WACC) has two possible outcomes, one
before tax and the other after tax. The after tax version is the number that was used in
all our calculations because, it is a more accurate representation of the cost of capital
because it takes into account the net tax effect since Best Buy pays taxes on their
revenues. In the case of this particular project there are two WACC values because of,
an accounting distortion, one valuation with the inappropriate accounting standards,
and one that was calculated as it appears on Best Buy’s financials.
WACC = Ve/Vf (Ke) + Vd/Vf (Kd)(1-Tax rate)
Before Correction=23202/29808 (.1246) + 6607/29808 (.0516)(1-.35)=10.64%
After Correction=23202/31309(.1246) + 8107/31309(.05195)(1-.35)=10.8%
Above is the formula for calculating WACC as evident when the accounting distortion is
capitalized it will change the value of debt, hence changing the WACC. The value of
WACC without the correction is 10.64% whereas with the correction the WACC is
10.8% which occurs because there is increased debt for Best Buy.
Comparables Valuations
In order to obtain a share price using the method of comparables you get an
industry average excluding zeros and negatives. The method of comparables does not
give you an accurate price per share because it takes the industry average using
companies that may not be equivalent with the company to be valued. This will skew
your price per share because the factors affecting other companies’ averages may not
be affecting the company being evaluated. The method of comparables does not give
you an accurate valuation but it is useful because it is quick and easy. In calculating
the industry average we did not include Best Buy in the average calculation.

62
Method of Comparables
PPS EPS BPS DPS
BBY 52.04 2.33 10.68 .26
CC 24.53 .79 11.19 .07
RSH 17.07 1.41 n/a .25
Trailing Price/Earnings:
BBY 25.89 Industry 43.07 CC 76.66 BBY EPS 2.33 RSH 9.48
EST Share
Price $100.35
The Trailing P/E estimates the price to be $100.35. This makes Best Buy
undervalued at a current share price of $54.02. We found these results by taking the
price per share for that period and dividing by the Earnings per Share from the last
period. Next you take the industry average and multiply it by Best Buy’s Earnings per
Share (EPS) to derive the estimated price per share.
Forward Price/Earnings:
BBY 18.07 Industry 26.65 CC 29.91 BBY EPS 2.88 RSH 23.38
EST Share
Price $76.75
The Forward P/E estimates the price to be $76.75. This makes Best Buy
undervalued at a current share price of $54.02. We found these results by taking the
price per share for that period and dividing by the projected Earnings per Share for the
next period. Next you take the industry average and multiply it by Best Buy’s Earnings
per Share to derive the estimated price per share.

63
Market/Book:
BBY 4.87 Industry 2.19 CC 2.19 BBY BPS 10.68 RSH n/a
EST Share
Price $23.43
The Market/Book ratio estimates the price to be $23.43. This makes Best Buy
current share price overvalued at $54.02. Radio Shack has not come out with their
2006 10-K so we are unable to estimate Radio Shack’s book value of equity. To derive
these values we divided the price per share by the book value of equity per share. Next
we took Best Buy’s book value of equity per share and multiplied it by the industry
average to find the estimated share price.
Dividend/Price:
BBY .005 Industry .009 CC .003 BBY DPS .26 RSH .015
EST Share
Price $29.72
The Dividend/Price ratio estimates the price to be $29.72. This makes Best Buy
current share price overvalued at $54.02. To find the share price we divided dividends
per share by price per share to find the industry average. To get the price per share
we divided Best Buy’s dividends per share by the industry average to find the estimated
share price.
P.E.G Ratio:
BBY 26.56 Industry 9.95 CC -66.24 BBY EPS 2.33 RSH 9.95 Growth Rate 15.92%
EST Share
Price $19.49

64
The P.E.G ratio estimates the price to be $19.49. This makes Best Buy current
share price overvalued at $54.02. We found the share price by taking the P/E ratio and
dividing it by 1 minus the EPS growth rate. Then to get the estimated share price we
multiply the industry average by 1 minus the EPS growth time Best Buy’s EPS.
Intrinsic Valuation Methods:
Discounted Dividends Model
The first model that will be discussed is the Discounted Dividends Model. The
cost of equity is the discount rate that is used and the growth rate of the dividends is
subtracted from the discount rate in the denominator. The dividend stream that is
forecasted in our financials is what is used for the next ten years, and each of these
values was discounted back with the appropriate present value factor for each year. For
the tenth year we created a perpetuity value, because within this model we assume
that dividends will continue indefinitely and this perpetuity is also discounted back to
present value.
Overvalued (>90%) $48.62 Undervalued (<110%)$59.42
Above is the sensitivity analysis which shows what type of price would be created
when either the cost of equity or the growth rate are manipulated. Incase the cost of
equity or the growth rate are wrong, it provides a way to show variation within our
estimations by having a wide variance between our calculated cost of equity and other
values around it. As visible from the above sensitivity analysis it is obvious that the
Dividend Discount Model does not have that much of explanatory power for the market
price that is derived from the forecasting of dividends.

65
Discounted Dividends Model Revised
With the correction to the accounting error, there is a direct implication towards
the dividend pay out from the firm. Since the real meaning of the valuation is based on
the dividend payout on a yearly basis, it is clear that the effect will be felt throughout
the entire discounted dividend model. The dividend payout ratio decreased in
comparison to the original unrevised number, which directly decreased the value
derived for this valuation.
Overvalued (>90%) $48.62 Undervalued (<110%)$59.42
The only difference with this sensitivity analysis in comparison to the sensitivity
analysis above is that these numbers are computed using the revised accounting
standards that were applied by this group. Even with these new accounting standards it
is clearly evident that Best Buy is over valued. However before any conclusions are
drawn, it is imperative to recall as stated above that the explanatory power for the
discounted dividends is the weakest of all the intrinsic valuation models.
Discounted Free Cash Flows
The discount rate that is used in this model, unlike the previous Discounted
Dividends Model, is the WACC. The WACC, as mentioned above, before the correction is
10.64%. As the name implies the free cash flows are calculated by subtracting the
cash flow from investment from the cash flow from operations (CFFO-CFFI). This
subtraction is carried for nine of the forecasted years and discounted by 1/(1+WACC)t,
where t is the year number in the forecast. The next calculation is the perpetuity which
is also discounted back to the present date. Upon the completion of these listed
computations, the sum of all the present values is taken and added to the present value
of the firm which will enable us to find the value of the firm. The value of the debt is

66
extracted directly from the 10-K of the company. Next subtract the value of debt from
the value of the firm to get the value of equity. The value of equity is then divided by
the number of shares outstanding to get it to a per share basis.
Overvalued (>90%) $48.62 Undervalued (<110%)$59.42
The sensitivity analysis for the discounted free cash flows with the normal set of
numbers shows that the discounted free cash flows is better at explaining the current
market prices that Best Buy’s stock is trading at. With the FCF model there is an
explanatory power that ranges from 5%-40%. As visible with a higher WACC there is a
decreasing market price that is computed as the output. With an increasing growth rate
and the WACC held constant it is evident again that the computed price increases. The
closest price to the observed price of Best Buy on November 1, 2006 $54.02 occurs
through the sensitivity analysis when the WACC is at a value of 8% and the growth rate
is at between 0% and 1%.
Discounted Free Cash Flows Revised
With the differences in the WACC created by the accounting revisions the WACC
changes to 10.8%. With the difference in the WACC there will a visible amount of
variation because of the discount factor. However with the new CFFO numbers there
will be another deviation between the previous discounted free cash flows model and
the current one. With this variance there will be a somewhat drastic difference in the
final outcomes for the price.

67
There appears to be no clear trend between the difference in the sensitivity
analysis computed with the revised set of numbers and those with their original set of
numbers. The computed numbers are not necessarily smaller than the previous
analysis’ valuation. The only clear trend that we can be sure of is that with an
increasing cost of capital (WACC) and a constant growth rate, the prices keep
decreasing when going left (following the path of the trend described).
Abnormal Earnings Growth
This intrinsic valuation method is also heavily based on the dividends paid out
and the expected earning per share. The core dividend per share is multiplied by the Ke,
and added to the earning per share for the next year. The core earning per share is
then multiplied by (1+ Ke), at which time a determination is made as to whether the
company has created, maintained or destroyed value. In order the maintain value the
difference between cumulative dividends earning and normal earnings should be zero.
If value is destroyed then the value attained after subtraction is negative. If value is
created by the firm the difference between these numbers is positive.
Overvalued (>90%) $48.62 Undervalued (<110%)$59.42
Unlike the FCF model for the AEG, the cost of equity is again used in the
discount factor instead of the WACC. With this sensitivity analysis one can see the
closest price obtained with the cost of equity of 12.46% was at the growth rate of .05.
The price at that point was $25.97 with that cost of equity. However with a lower cost
of equity the denominator decreases which increased the price derived from the model.
When you look at the prices for lower costs of equity you will notice the higher
numbers.

68
Abnormal Earnings Growth Revised
With the correction of the accounting distortion, there was a direct effect to the
dividends per share and the company’s earning per share; effectively decreasing both
values because of increased expenses on the income statement and increased liabilities
and depreciation on the balance sheet. The values with the proper accounting
procedures in place will decrease the EPS and the DPS which overall will decrease the
value of the outputs given.
Overvalued (>90%) $48.62 Undervalued (<110%)$59.42
There is a difference between the revised model for the AEG and the normal
model. Even though there are similar numbers used for the cost of capital and the
growth rate the dividends per share and the earnings per share create a difference.
Both of the DPS and the EPS are lower in the revised model than in the original model.
When calculated this gives us numbers that are less than the sensitivity analysis above.
If we had a cost of equity around 8% then we would state that the stock price for the
Best Buy was overpriced. However, with a greater cost of equity at around 12.5% it is
evident that Best Buy is severely overvalued. The growth rate changes do not
drastically affect the model with the cost of equity being held constant.
Residual Income
Like the discounted dividends model and the abnormal earnings growth model,
the Residual Income model uses the cost of capital as it is discount rate when present
values are needed. In the residual income valuation the formula expressed in words
reads: the book value of equity is added to the net income, followed by a subtracting
out of the dividends paid which is provides an ending value of equity for that year. The
ending value of equity for the previous year carries over and becomes the beginning
book value of equity for the next year. Next comes the calculation of the Normal income

69
which is done by multiplying the beginning book value of equity by the discount rate.
The residual income is calculated from using having the net income above and
subtracting it from the normal income. From there we derive a value for the perpetuity
created from the 10th year’s residual income, which is then carried out forever and
discounted back to the current year’s price with the present value factor.
Overvalued (>90%) $48.62 Undervalued (<110%)$59.42
With the cost of equity we calculated the closest price to the stock price on
November 1st, is with a growth rate of 0. Especially with decreases in the cost of equity,
we see the price calculated increases dramatically; however with the increase in the
growth rate with a smaller cost of equity; the numbers turn out to be negative because
there is a negative value in the denominator of the model. Hence when the positive
numerator is divided by a negative denominator, a negative result is obtained.
Residual Income Revised
When computing the respective values for the residual income model with a
correction for an accounting distortion the valuation changes drastically. When
calculating residual income with the revised numbers the residual income is actually
positive because when the normal earnings are subtracted from the earnings per share
the number generated is smaller. The EPS with the revised numbers are smaller than
the numbers taken directly from Best Buy’s financials. With a small residual income
number the discounted value for the current year is obviously smaller, which directly
leads to a smaller estimated price per share. This again points to the fact that Best
Buy’s stock is overvalued.
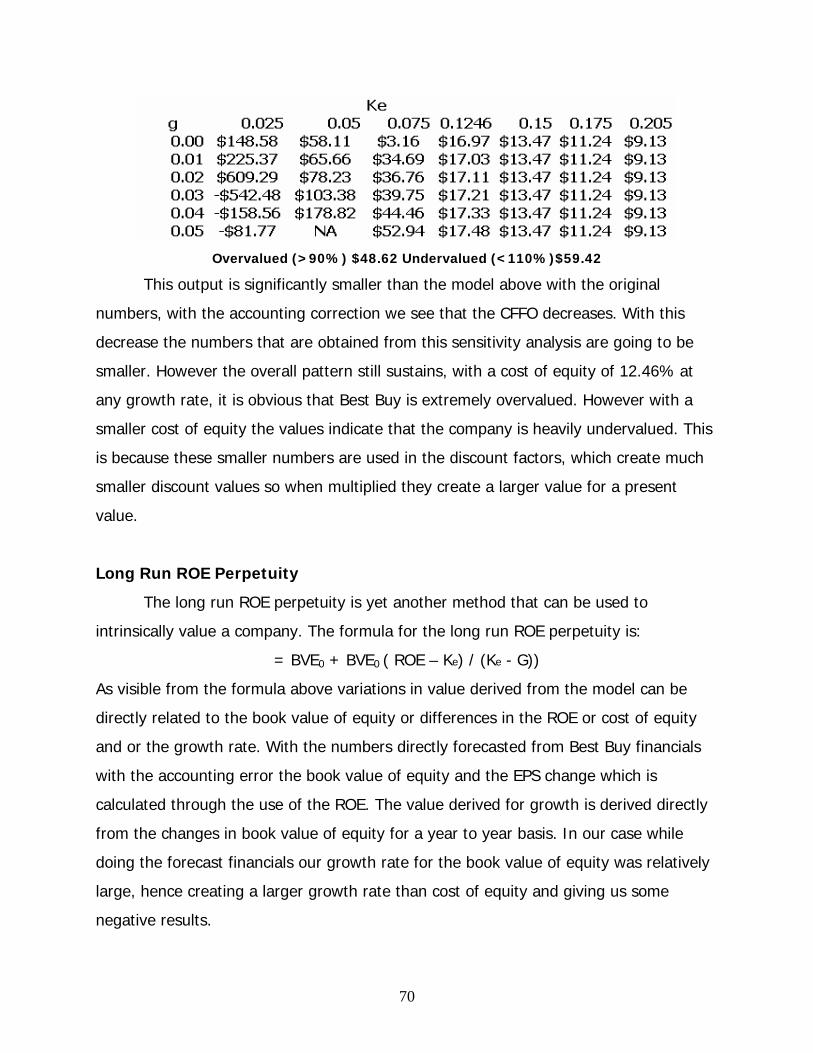
70
Overvalued (>90%) $48.62 Undervalued (<110%)$59.42
This output is significantly smaller than the model above with the original
numbers, with the accounting correction we see that the CFFO decreases. With this
decrease the numbers that are obtained from this sensitivity analysis are going to be
smaller. However the overall pattern still sustains, with a cost of equity of 12.46% at
any growth rate, it is obvious that Best Buy is extremely overvalued. However with a
smaller cost of equity the values indicate that the company is heavily undervalued. This
is because these smaller numbers are used in the discount factors, which create much
smaller discount values so when multiplied they create a larger value for a present
value.
Long Run ROE Perpetuity
The long run ROE perpetuity is yet another method that can be used to
intrinsically value a company. The formula for the long run ROE perpetuity is:
= BVE0 + BVE0 ( ROE – Ke) / (Ke - G))
As visible from the formula above variations in value derived from the model can be
directly related to the book value of equity or differences in the ROE or cost of equity
and or the growth rate. With the numbers directly forecasted from Best Buy financials
with the accounting error the book value of equity and the EPS change which is
calculated through the use of the ROE. The value derived for growth is derived directly
from the changes in book value of equity for a year to year basis. In our case while
doing the forecast financials our growth rate for the book value of equity was relatively
large, hence creating a larger growth rate than cost of equity and giving us some
negative results.

71
Overvalued (>90%) $48.62 Undervalued (<110%)$59.42
The long run return on equity perpetuity can be manipulated with three
variables, those being the cost of equity, the growth rate, and the average return on
equity. Due to the many ways there are to value the company we performed three
sensitivity analyses. In each of them there is a variation between the cost of equity, the
growth rate or the average return on equity. The first two are primarily negative
because if the growth rate is lower than the cost of equity this again creates a negative
denominator which will return a value that is negative. Or the numerator is negative
with the cost of equity being greater than the return on assets which again will create a
negative output, unless the denominator is negative as well.
Long Run ROE Perpetuity Revised
As with all the revised intrinsic valuations above, all numbers derived from our
set of forecast financials with the revised numbers creates a lower number for book
value of equity for each passing year. With these lower numbers for the book value of
equity, even the growth rate changes making it smaller. Due to the decrease in the
book value of equity and the direct decrease in the growth rate, the return on equity to

72
decreases. With this decrease in the return on equity it is possible to attain a higher
value for the intrinsic value of the stock.
Overvalued (>90%) $48.62 Undervalued (<110%)$59.42
As listed above the any of the three variables can be manipulated when
conducting sensitivity analysis. Depending on the changes in either of the variables
whether it be the return on equity, the cost of equity or the growth rate, all have a
distinct impact on the output of the number. This model will have large fluctuations
whenever one of the three factors is manipulated to give an accurate calculation for the
appropriate numbers.
Altman Z- Score Credit analysis
The Altman Z-score is an original method that has been extensively used by
major financial institutions and investment houses to evaluate the credit worthiness of
companies. The formula consists of weights given to items that are directly extracted
from the either the balance sheet or the income statement. The formula for the Z-Score
is listed below:

73
Z-Score = 1.2(Working Capital/Total Assets) + 1.4(Retained Earnings/Total Assets) +
3.3(Earnings before Interest and Taxes/Total Assets) + .6(Market Value of Equity/Book
Value of Debt) + 1.0(Sales/Total Assets)
As the formula above indicates, there are weights assigned to the various ratios
that will be calculated with the respective numbers. The highest weight of, 3.3 is given
to the ratio of EBIT/Total Assets, which is a measure of how much operating income is
being generated by the total assets. This is an example of where the numbers come
from; the EBIT comes from the income statement where as the total assets from the
balance sheet.
The Z-scores for Best Buy without the revision made to the accounting error is
3.7. This high number is indicative of very healthy credit ability for Best Buy. Companies
are thought of as being credit worthy as long as the score is above 2.6. As understood
the cost of debt is directly related to the z-score calculated by financial institutions,
because a score lower than 1.6 indicates unhealthy credit standing. A score ranging
from 1.6 - 2.8 indicates a company with some credit problems; hence any loans granted
will be given at a higher interest premium. After the accounting revision the z-score
decreased substantially to 2.99, which is still a healthy number.
Overall the credit rating of Best Buy even when looking at the revised number is
a relatively strong number, enabling them to attain debt/loans at a relatively cheap
rate.
Valuation Conclusion:
After using numerous models to calculate the value for Best Buy we can
confidently say the company is overvalued. All of our models showed different degrees
of Best Buy being overvalued. We found misleading accounting methods which altered
our valuations. To deal with this we ran two separate valuation models, one with the
given information, and one with the revised financials. The model which gave the
lowest value for the company was the Dividends Discount Model, which found the value
for the company to be $4.58. The model showing the highest value for the company
was the Free Cash Flows Model. It gave a value of $47.35. After revising our

74
statements to account for the deceptive disclosure the new valuation numbers were
$2.41 in the Discounting Dividend model and $31.21 for the Free Cash Flows. This
shows that the failure to disclose their capital leases did in fact lower their share value.
Because the value given by the Discounted Dividends model is entirely too low we have
rejected it as a true representation of the value. The other models we used were the
Abnormal Earnings Growth which found the value to be $25.76, and $19.21 with the
revisions. The Residual Income model gave a similar value of $22.41, and $16.97. The
final valuation method we used was the Long Run Return on Equity model which gave
us numbers that were once again too low to consider as truth. It derived the value of
the company at $7.72, and $8.12 with the revisions. We can confidently say that the
true value of Best Buy Stock is definitely under $54.02. This is even more apparent
when we take into consideration the misleading accounting procedures performed by
Best Buy. It takes the value of the company even lower. We found that the unrevised
average stock value for Best Buy is $27.69 after disregarding the Long ROE and
Discounted Dividends. With the revised numbers the Best Buy average value for stock
was $18.99 which is clearly indicative of the additional $1.5 Billion of capitalized leases.
We can therefore positively assess the firm as over valued.

75
Appendix 1 – Screening Ratios
Sales/Cash from Sales
BBY CC RSH 2001 0.87 1.06 1.06 2002 0.86 1.01 1.05 2003 0.87 1.02 1.04 2004 0.91 1.02 1.05 2005 0.90 1.02 1.07 Sales/Net Accounts Receivable
BBY CC RSH 2001 80.37 60.56 17.28 2002 80.14 71.62 22.21 2003 67.13 63.99 25.49 2004 71.57 45.4 20.09 2005 73.18 52.51 16.42
sales/inventory BBY CC RSH
2001 12.84 7.79 5.03 2002 9.45 7.13 4.71 2003 10.24 6.50 6.07 2004 9.42 7.19 4.82 2005 9.63 6.83 5.27
sales/assets BBY CC RSH 2001 3.14 NA 2.13 2002 2.40 NA 2.05 2003 2.73 NA 2.07 2004 2.84 NA 1.24 2005 2.67 NA 2.31
cffo/oi BBY CC RSH 2001 1.32 NA 2.16 2002 1.74 NA 1.23 2003 0.66 NA 1.35 2004 1.08 NA 0.63 2005 1.28 NA 1.04
cffo/noa BBY CC RSH 2001 0.63 NA 1.86 2002 0.99 NA 1.24 2003 0.38 -0.26 1.27 2004 0.76 1.19 0.54 2005 0.92 0.62 0.76

76
Appendix 2 – Core Financial Ratios

77
Appendix 3 – Pro Forma Financial Statements
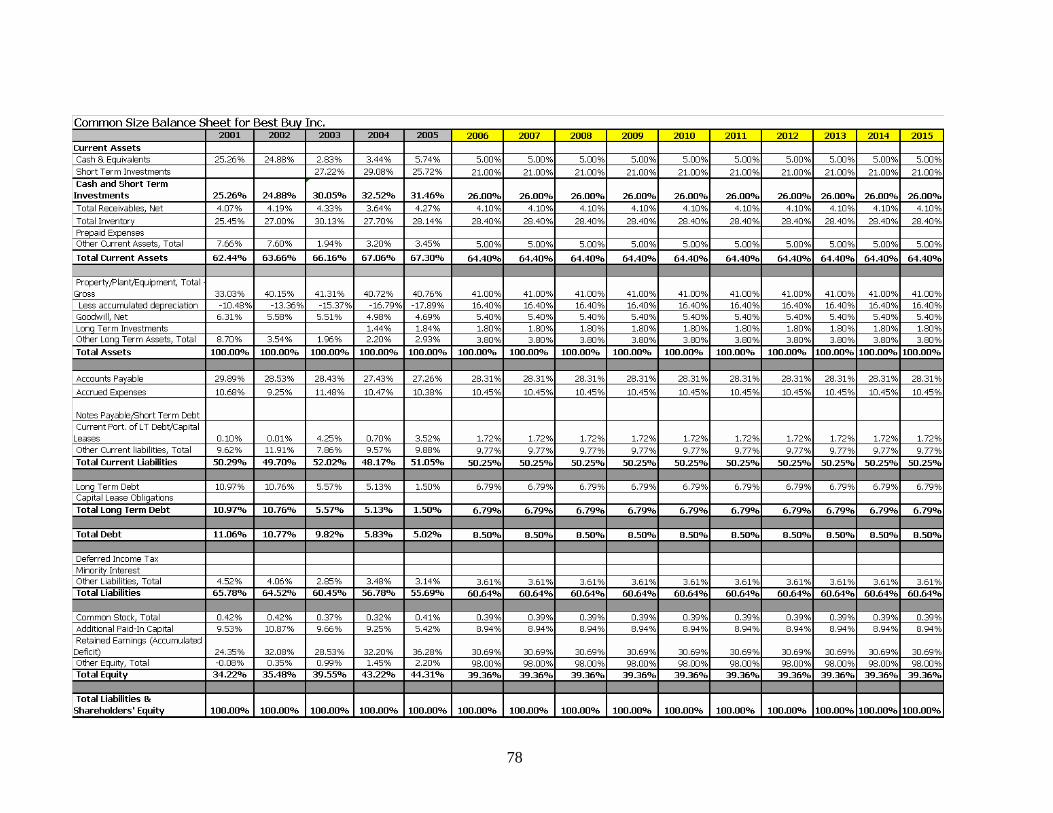
78

79

80

81

82
Appendix 4 – Pro Forma Financial Statements (Revised)

83

84

85

86
Revised

87
Appendix 5 – Cost of Capital

88
3 Month Regression

89
1 Year Regression

90
5 Year Regression

91
10 Year Regression

92

93
Weighted Average Cost of Debt (Unrevised)
Weighted Average Cost of Debt (Revised)

94
Weighted Average Cost of Capital (Unrevised)
Weighted Average Cost of Capital (Revised)
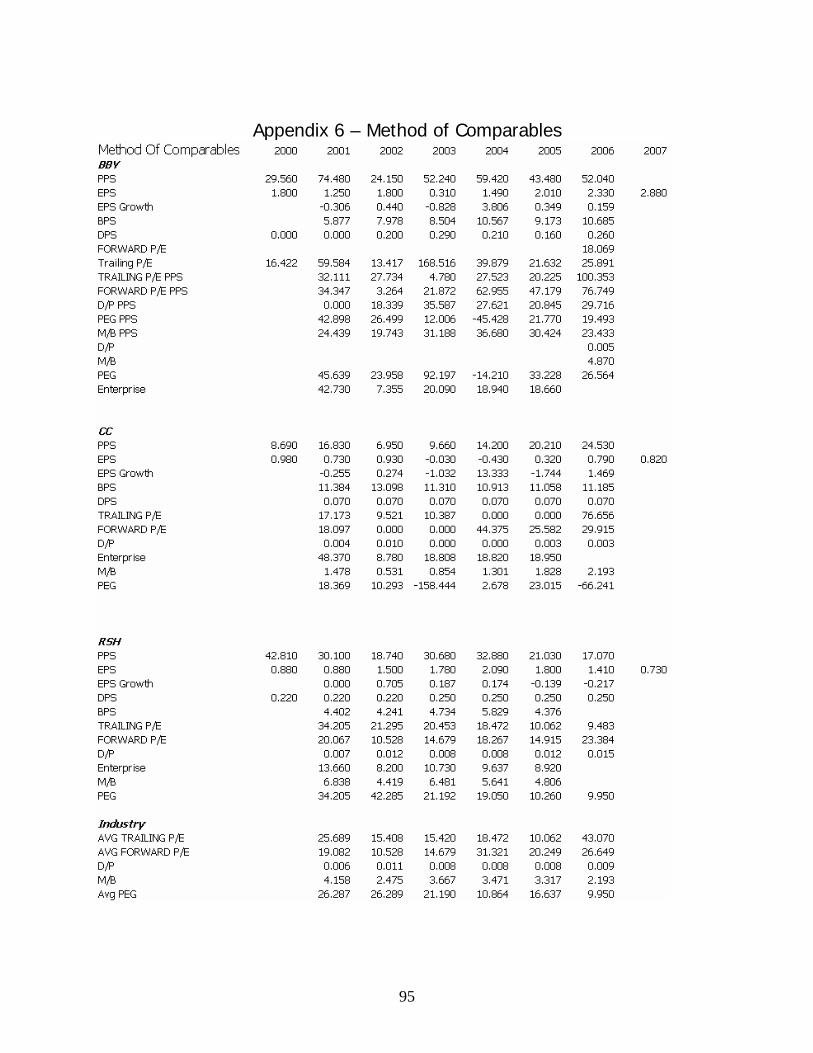
95
Appendix 6 – Method of Comparables

96
Appendix 7 – Valuation Models (Unrevised)
Discounted Dividends (Unrevised)

97
Free Cash Flows (Unrevised)

98
Residual Income (Unrevised)
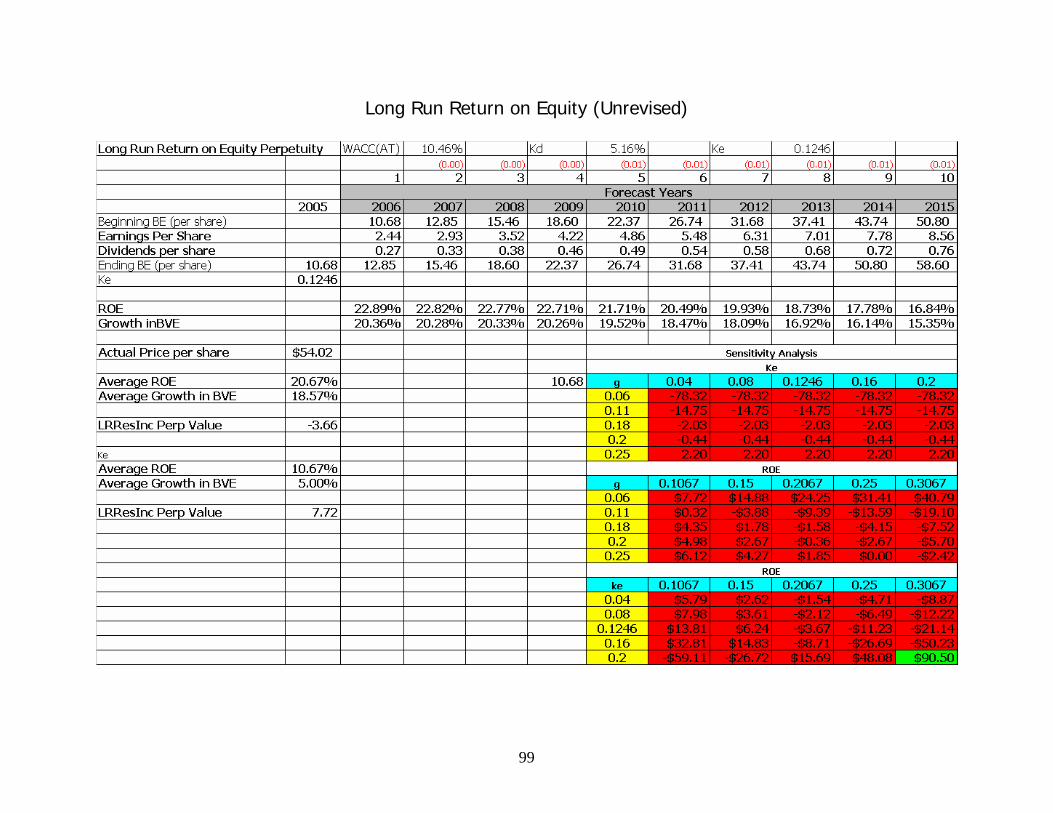
99
Long Run Return on Equity (Unrevised)

100
Abnormal Earnings Growth (Unrevised)

101
Appendix 8 – Valuation Models (Revised)
Discounted Dividends (Revised)

102
Free Cash Flows (Revised)
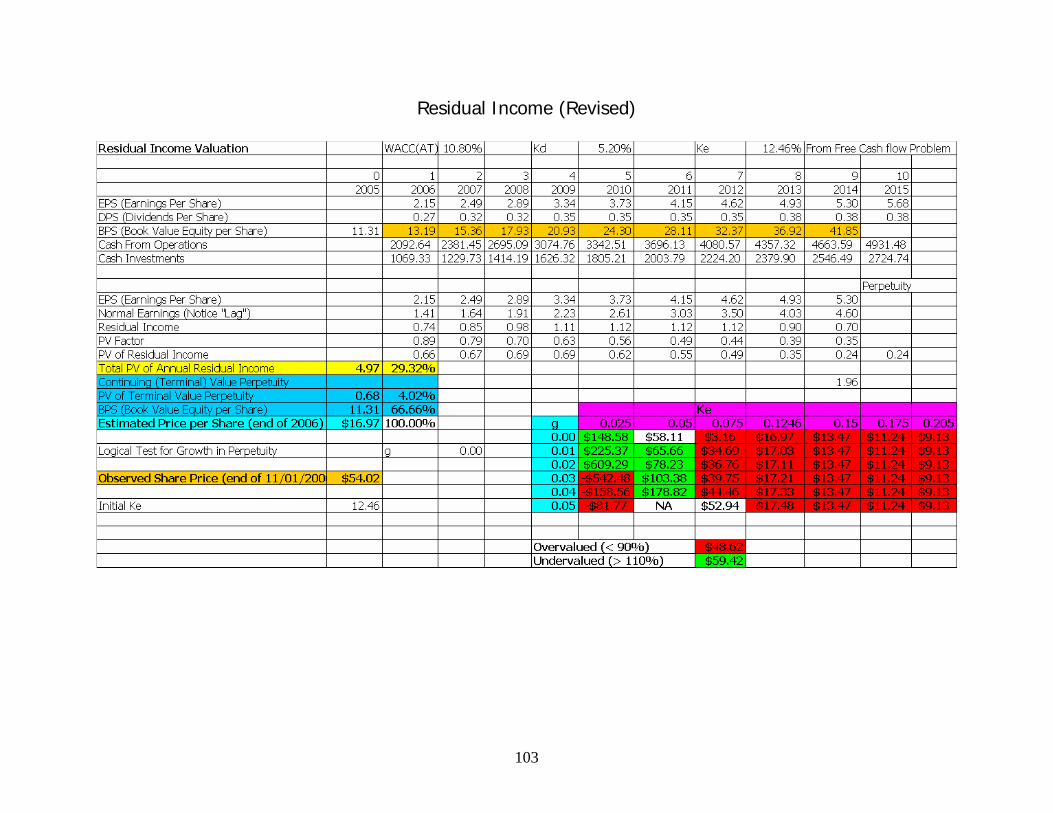
103
Residual Income (Revised)

104
Long Run Return on Equity Perpetuity (Revised)
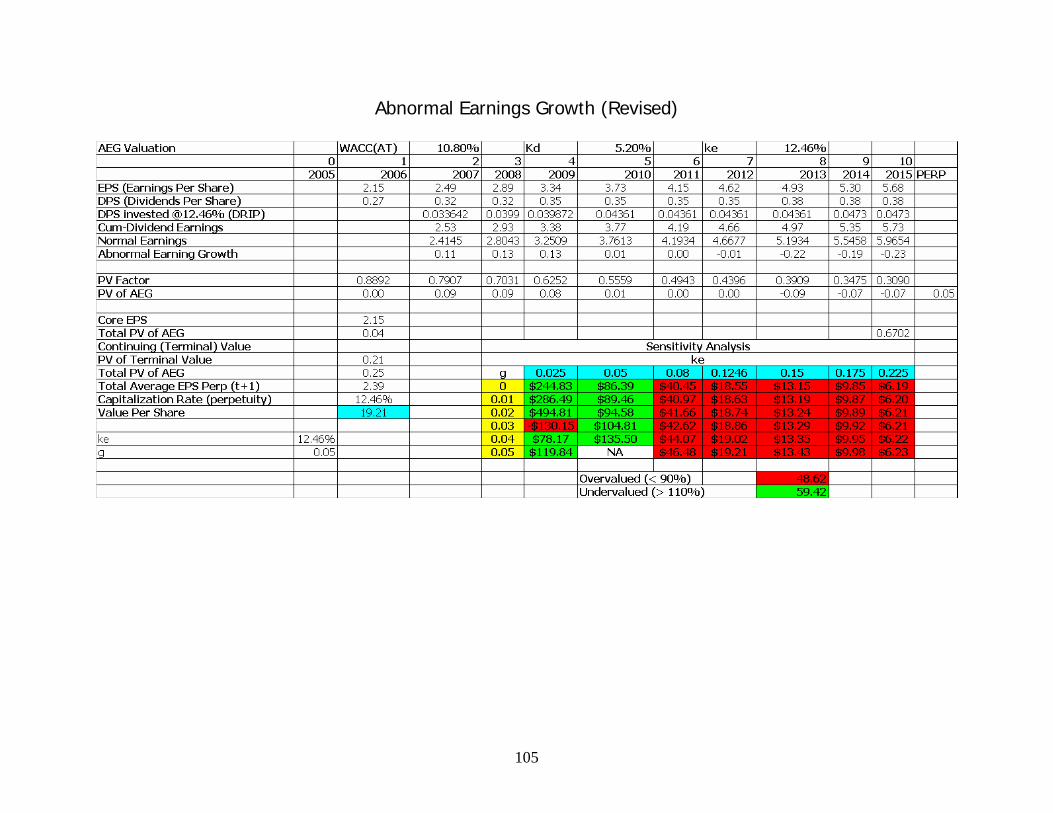
105
Abnormal Earnings Growth (Revised)

106
Appendix 9 – Altman Z-Score
Unrevised
Revised
Z-Score = 1.2(Working Capital/Total Assets)+1.4(Retained Earnings/Total Assets)+ 3.3 (Earnings Before Interest and Taxes/Total Assets) + 0.6(Market Value of Equity/Book Value of Liabilities) +
1(Sales/Total Assets)

107
References
1.) Best Buy Website: www.bestbuy.com
2.) Circuit City Website: www.circuitcity.com
3.) Radio Shack Website: www.radioshack.com
4.) Wal Mart Website: www.walmart.com
5.) Yahoo Finance: www.finance.yahoo.com
6.) Google Finance: www.finance.google.com
7.) Palepu, Healy and Bernard, Business Analysis and Valuation (Ohio: Thomson-Southwestern, 3rd Edition, 2004)
8.) Best Buy 2nd Quarter Fiscal Year 2007 (Qtr End 08/26/06) Earnings Call
Transcript (BBY): http://retail.seekingalpha.com/article/16754
9.) Edgar Scan, PWC: http://edgarscan.pwcglobal.com
10.) St. Louis Federal Reserve Interest Rate Data: http://research.stlouisfed.org/fred2/categories/22
Excelsior!