berkeley economic review presents
TRANSCRIPT

Issue 1
IN THIS ISSUEThe Explosive Growth of E-Sports • The Economics of Child Marriage • Professor Interviews • More
Berkeley Economic Review presents

Managing EditorsJoseph Hernandez
Margaret Chen
EditorsAnastasia Pyrinis*
Simon Zhu*
Alessandro Ortenblad
Alex Cheng
Dana Wu
Matthew McBride
Renuka Garg
Sofi a Guo
Yechan Shin
Department heads*
Mission Statement: In Berkeley Economic Review we envision a platform for the recognition of quality undergraduate research and writing. Our organization exists to provide a forum for students to voice their views on current economic
issues and ultimately to foster a community of aspiring economists.
Disclaimer: The views published in this journal are those of the individual authors or speakers and do not necessarily re lect the position or policy of Berkeley Economic Review staff, the Undergraduate Economics Association, the UC
Berkeley Economics Department and faculty, or the University of California, Berkeley in general.
Staff WritersAriana Jessa
Arsh Vishen
Joseph Ng
Katherine Blesie
Odysseus Pyrinis
Parmita Das
Seth Bertolucci
Vassilisa Rubtsova
Layout & Design Editors*Katherine Sheng
Jaeun Park
Danny Chandraheshdran
Matthew McBride
Kailin Li
Staff

Table of Contents4 •
Growth and Currency in Argentina: It’s Complicated
8 •
Th e Explosive Growth of E-Sports
12 •
Joblessness: Th e Eff ects of Technology on U.S. Jobs
14 •
Th e Clean Energy Conundrum
18 •
Th e Economics of Child Marriage
• 6
Rethinking Microfi nance
• 10
Professor Interviews
• 13
America’s Trade Frustrations: Could the Trump Presidency be Nailed by its own Steel Tariff s?
• 16
Standing on the Shoulders of Children
Dear Readers,Berkeley Economic Review has the pleasure to present the inaugural issue of our staff-run magazine, Equilibrium. Following the BER mission statement, this magazine represents a continuation of our efforts to promote undergraduate writing on economics from diverse
perspectives. Within these pages you will ind the best of our semester-long works, as well as the product of many Slack chats and long nights at Evans Hall. We hope you enjoy.
— BER Staff

Economic Analysis of the Phenomenon of Child Marriage
Child marriage is defi ned as marriage taking place before the age of 18. It is deeply entrenched in many communities, so much so that 41,000 girls are married off every day.
According to Human Rights Watch, global data shows that girls from the poorest 20 percent of families are twice as likely to marry before the age of 18 as girls from the richest 20 percent of families. Th is stems from the traditional perception that girls are fi nancial burdens rather than potential wage earners. Families living in poverty with several children use child marriage as a way to reduce their economic burden. To them, one fewer daughter means one fewer person to feed, clothe, and educate. Families oft en use child marriage as a strategy to evade food insecurity. Girls are even used as a substitute for money to off set debts and settle confl icts. In cultures where the bride’s family is expected to pay a dowry, early marriage equates to a lower bride price. In cultures where the groom’s family pays the dowry in exchange for the bride, younger girls fetch a higher price. Th e families that cannot aff ord to raise their daughters may perceive child marriage as the next best alternative and a source of income.
Poverty cements the practice of child marriage. More than half the girls from the poorest families in developing countries are married as children. Families, and oft en the girls themselves, view marriage as a means to secure their future. Th e incidence of child marriage increases aft er humanitarian crises like wars and natural disasters, as families faced with poverty and violence use the practice as a coping mechanism. In fact, nine out of the ten countries with the highest rates of child marriage can be classifi ed as fragile states—developing countries with weak state capacities that are unable to protect their vulnerable citizens.
Peter Leesona and Paola Suarez’s paper “Child Brides” in the Journal of Economic Behavior & Organization attributes the creation of the conditions that perpetuate child marriage in impoverished societies to parental preference for sons over daughters. Due to a son preference, couples invest fewer resources in caring for their young daughters, so more
males survive to traditional marriage age than females. Additionally, to aff ord to care for the sons they want, some parents dispose of their undesired daughters by marrying them off prematurely. Th is leads to a sex ratio imbalance, causing some men to turn to younger girls to fi nd a bride. Th e article analyzes data from India to support its theory.
Economic Impacts of Child Marriage
Child marriage disproportionately aff ects girls; it is a leading cause of school dropouts for adolescent girls. Every year of marriage before 18 reduces the likelihood of completion of secondary school by 4 to 6 percentage points. Child marriage and the associated school dropout rates hamper
the girls’ chances of earning better wages by 9 percent over their lifetimes. Female victims oft en live in
poverty, hold jobs less frequently, and are less productive. Child marriage reduces their
ability to acquire economic resources and perpetuates their oppression. Th ey have less decision-making and bargaining power in their households and face a higher risk of domestic and intimate partner violence. A direct consequence of child marriage is early childbirths, which contributes to high maternal
mortality. Male victims of child marriage may drop out of school early and accept
low-paying jobs to support the newly-formed family.
Child marriage engenders high fertility, which yields
large costs for families and reduces their standard of living. Having more children reduces a household’s ability to pay for food, education, and healthcare. Th e alternative to child marriage is having an education, so the opportunity cost deprives households of a potential source of income. Child marriage is estimated to cost economies at least 1.7 percent of their GDP. It increases total fertility of women by 17 percent, which hurts developing countries battling high population growth. Th e elevated fertility rates pose signifi cant costs to national economies through demands for basic services by ever-increasing populations. It delays the demographic dividend that can come from reduced fertility and investments in education. Th e associated cost to the global economy is trillions of dollars in purchasing power parity betweem now and 2030. Child marriage disrupts the accumulation of human capital due to its associated school dropouts, withdrawal from labor
The Economics of Child Marriageby Parmita Das
4

funding by donors and governments towards delaying the age of marriage.
Economic Approaches to Ending Child Marriage Bangladeshi international development organization BRAC tackles the practice of child marriage by introducing economic incentives. Th e NGO teaches fi nancial literacy, entrepreneurship, and banking practices to girls, which allows them to contribute to their households and increase their agency.
Th e University of Kent developed an overlapping generational model of the marriage market in developing countries by mapping a desirable female attribute whose value decreases with time spent on the marriage market, such that age signals quality. Th is model demonstrates that, in the absence of intervention, young potential brides have an incentive to accept an off er of marriage sooner than later. Using their model, they showed how large-scale interventions like providing parents incentives to delay their child’s marriage, providing girls new opportunities to acquire skills, and providing alternatives to the traditional path of early marriage can be eff ective. Some adolescent girls can then turn down marriage to pursue other opportunities or utilize their higher bargaining power to negotiate more favorable marriage off ers so it becomes more diffi cult for men to prey on young, uneducated brides.
Conclusion
Th e eradication of child marriage has been recognized as a priority by its inclusion in the Sustainable Development Goals. Child marriage perpetuates the cycle of poverty by cutting short girls’ education and limiting their opportunities for employment. It is an example of how a social problem is propagated by fi nancial concerns and, as such, interventions should aim to establish the economic benefi ts of ending the practice. ■
markets, and adverse eff ects on the health of young girls. It perpetuates extreme poverty and hinders eff orts to achieve economic growth and equity.
Economic Case for Ending Child Marriage
Ending the practice of child marriage would lead to better prospects for young girls: improved educational attainment, fewer children, increased lifetime expected earnings, improved household incomes, reduced incidence of intimate partner violence, and more decision-making power.
Allowing girls access to higher education changes the prospects of households and the economy for the better. Enabling girls to receive more education increases the likelihood that their children will be educated, thereby improving the human capital of the future labor force of the economy.
Curbing high population growth rates in developing countries would boost economic growth and contribute towards economic stability, saving the global economy $566 billion dollars by 2030. Governments would enjoy budget savings by foregoing the cost of providing basic education, healthcare, and other social services to a rising population. Lower population growth would save governments 5 percent or more of their education budget by 2030. Th e benefi ts would be felt strongly by poorer segments of the population and lead to an alleviation of poverty. A 10 percent decrease in child marriages would result in a 76 percent decrease in the maternal mortality rate. Th e estimated annual benefi ts for lower under-fi ve mortality and malnutrition is $98 billion by 2030.
Th e World Bank and International Center for Research on Women (ICRW) carried out a three-year research project titled “Th e Economic Impacts of Child Marriage,” which concluded that ending the practice could save the global economy trillions of dollars by 2030. Th ey believe that understanding the economic benefi ts would increase the
“Families often use child marriage as a strategy to evade food insecurity. Girls are even used as a substitute for
money to off set debts and settle confl icts.”
5

currency means more competitive exports, which will boost output.” Exactly. Th is is what we want to test. For some more recent historical context, Argentina over the past 10 years has continued to struggle with foreign debt and currency volatility. Aft er the worst economic crisis in the nation’s history from 1998 to 2002, Argentina began to prosper again during the fi rst few years of President Nestor Kirchner’s administration. Since the country defaulted on its debt in 2001, Argentina has had to borrow at relatively high interest rates. Adding to the mix, expensive government subsidies and other spending instituted under Kirchner and later his wife, President Cristina Kirchner, caused government debt to increase again around 2010. Since the 2015 election of President Mauricio Macri, the debt has only continued to increase. Th e US dollar has also strengthened as the Federal Reserve raises rates. As a result, Argentina’s dollar-denominated loans have become almost impossible to repay. Just months ago, the IMF stepped in and loaned Argentina $50 billion to help repay its most pressing debts. To make matters worse, the nation is currently in yet another severe recession. All this raises the question: is there a positive relationship between changes in the country’s currency and GDP growth? Or does economic orthodoxy hold? To answer this, we use daily currency data on the Argentine peso from the Central Bank of Argentina and data on GDP
There’s almost no place that baffl es economists more than Argentina. Th e South American nation began the 20th century among the wealthiest in the world, growing hugely prosperous from their commodities trade with Europe. Yet, since then, the nation has suff ered a near constant decline. It is the lone wealthy nation from the turn of the 20th century that is not still comparatively wealthy today. One big reason for Argentina’s decline is currency instability. Since 1973 alone, there have been three national currencies: the peso, the austral, and then a reconstituted peso. Poor fi scal policies have oft en stoked massive infl ation that has placed serious downward pressure on Argentine currency. Th ese currency depreciations in turn make foreign debt near impossible to repay, causing further devaluations which can ultimately result in economic collapse. Currency crises like this occurred in 1982 and 2001, and both have resulted in severe economic depressions. Since Argentina’s mass currency depreciations have historically preceded economic crises, one wonders if perhaps changes in the value of the currency positively correlates with GDP growth—if the currency goes up, then does GDP also go up? Th is turns out to be a complicated question. If you’re still reading at this point you must be an econ geek, and you might think, “But wait! Economic orthodoxy says that when the currency depreciates, GDP will increase. Cheaper
Growth and Currency in ArgentinaGrowth and Currency in ArgentinaIt’s Complicated
6
by Seth Bertolucci
Source: Federal Reserve Economic Data (FRED), St. Louis Federal Reserve
7
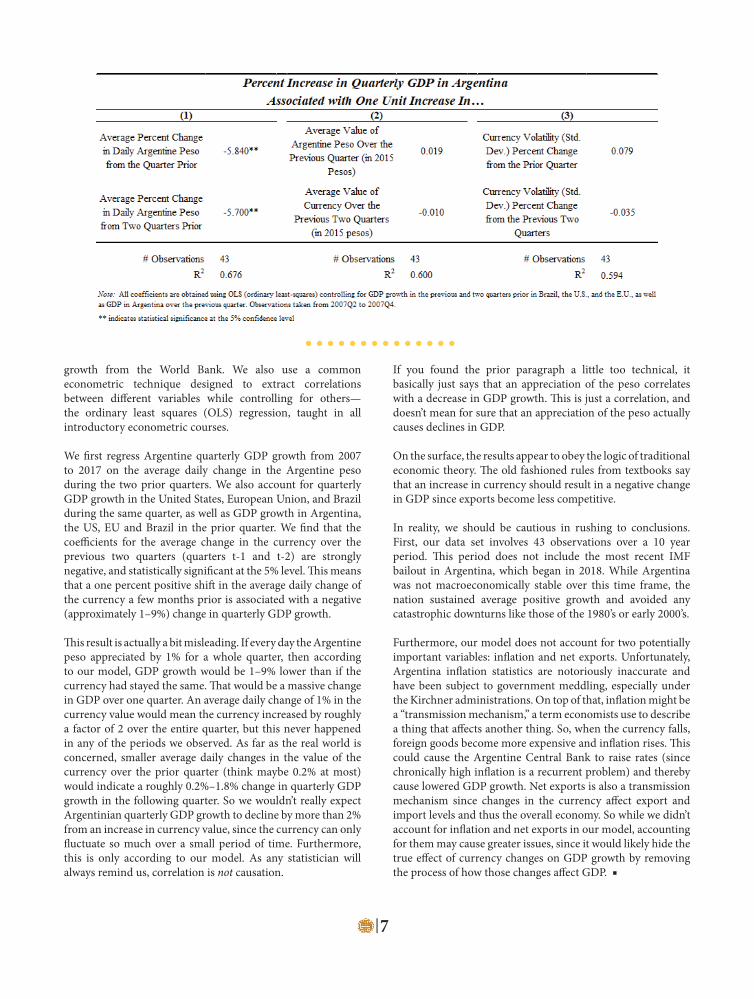
growth from the World Bank. We also use a common econometric technique designed to extract correlations between diff erent variables while controlling for others—the ordinary least squares (OLS) regression, taught in all introductory econometric courses.
We fi rst regress Argentine quarterly GDP growth from 2007 to 2017 on the average daily change in the Argentine peso during the two prior quarters. We also account for quarterly GDP growth in the United States, European Union, and Brazil during the same quarter, as well as GDP growth in Argentina, the US, EU and Brazil in the prior quarter. We fi nd that the coeffi cients for the average change in the currency over the previous two quarters (quarters t-1 and t-2) are strongly negative, and statistically signifi cant at the 5% level. Th is means that a one percent positive shift in the average daily change of the currency a few months prior is associated with a negative (approximately 1–9%) change in quarterly GDP growth.
Th is result is actually a bit misleading. If every day the Argentine peso appreciated by 1% for a whole quarter, then according to our model, GDP growth would be 1–9% lower than if the currency had stayed the same. Th at would be a massive change in GDP over one quarter. An average daily change of 1% in the currency value would mean the currency increased by roughly a factor of 2 over the entire quarter, but this never happened in any of the periods we observed. As far as the real world is concerned, smaller average daily changes in the value of the currency over the prior quarter (think maybe 0.2% at most) would indicate a roughly 0.2%–1.8% change in quarterly GDP growth in the following quarter. So we wouldn’t really expect Argentinian quarterly GDP growth to decline by more than 2% from an increase in currency value, since the currency can only fl uctuate so much over a small period of time. Furthermore, this is only according to our model. As any statistician will always remind us, correlation is not causation.
If you found the prior paragraph a little too technical, it basically just says that an appreciation of the peso correlates with a decrease in GDP growth. Th is is just a correlation, and doesn’t mean for sure that an appreciation of the peso actually causes declines in GDP.
On the surface, the results appear to obey the logic of traditional economic theory. Th e old fashioned rules from textbooks say that an increase in currency should result in a negative change in GDP since exports become less competitive.
In reality, we should be cautious in rushing to conclusions. First, our data set involves 43 observations over a 10 year period. Th is period does not include the most recent IMF bailout in Argentina, which began in 2018. While Argentina was not macroeconomically stable over this time frame, the nation sustained average positive growth and avoided any catastrophic downturns like those of the 1980’s or early 2000’s.
Furthermore, our model does not account for two potentially important variables: infl ation and net exports. Unfortunately, Argentina infl ation statistics are notoriously inaccurate and have been subject to government meddling, especially under the Kirchner administrations. On top of that, infl ation might be a “transmission mechanism,” a term economists use to describe a thing that aff ects another thing. So, when the currency falls, foreign goods become more expensive and infl ation rises. Th is could cause the Argentine Central Bank to raise rates (since chronically high infl ation is a recurrent problem) and thereby cause lowered GDP growth. Net exports is also a transmission mechanism since changes in the currency aff ect export and import levels and thus the overall economy. So while we didn’t account for infl ation and net exports in our model, accounting for them may cause greater issues, since it would likely hide the true eff ect of currency changes on GDP growth by removing the process of how those changes aff ect GDP. ■

in their businesses, building their credit, and making them self suffi cient; and strengthen the overall economy of the country. In theory, microfi nance could produce tangible results because it invests in an impoverished region. However, as the model of microfi nance is being implemented throughout the world, many drawbacks continue to be overlooked and consequently hinder the success of microfi nance and the poor populations it seeks to serve.
Microfi nance is not the cure-all for worldwide poverty that international organizations, fi nancial institutions, and countries have claimed it to be. Microfi nance is not designed to end the cycle of poverty. Th e microfi nance system is rooted in the idea that, by funding a plethora of impoverished entrepreneurs, within a few years borrowers will create large businesses that stimulate the economy and help their communities rise out of poverty. Unfortunately it does not always work that way. Not everyone seeking microloans and credit has the next big idea that will drive their country into becoming a major global player, which means that with most microloans, the returns will not be signifi cant on a global scale. Even if the focus is shift ed on just borrowers’ villages or communities, the borrower is likely part of an oversaturated industry in their
In October of 1983, Muhammad Yunus founded the Grameen Bank and pioneered the microfi nance and microcredit movement. Grameen Bank served the impoverished population in Bangladesh by off ering small loans to small businesses. Th e microfi nance model was hailed a success and Yunus, along with Grameen Bank, received the Nobel Peace Prize in 2006 for his work in reducing poverty and stimulating economic growth. Since then, the microfi nance model has become a widely popular solution to stimulating growth in developing countries and has been implemented in hundreds of developing countries and even in some developed countries.
Microfi nancing has simply reinvented the wheel. Typically, the poor in developing countries and some developed countries have no way to receive formal loans or credit from big banks because they are deemed too risky. As a result, the poor will borrow from informal lenders, receive loans from informal organizations, and engage in an informal economy. Microfi nance serves as a means to formalize these transactions for the poor and include them in the formal economy, comprised of the established economic institutions and markets regulated by the governments of their countries. Th is is meant to do two things: bring people out of poverty by investing
Rethinking Microfi nance
8
by Vassilisa Rubtsova
PETER HADEN, MICROFINANCE IN INDIA SERIESPETER HADEN, MICROFINANCE IN INDIA SERIES

village and community. Th us fi nancing the borrower and their neighbor just perpetuates unprofi table competition in an industry that already does not yield immense profi ts.
As microfi nance institutions grow in size and capacity, microfi nance institutions and the international community ought to reconsider the microfi nance model. In the status quo, the microfi nance system has failed to deliver large scale results. While over 500 million people have engaged in the microfi nance system in its decades-long existence, it has yet to revitalize any country’s economy. Even in Bangladesh, where microfi nance and microcredit have largely been recognized as successful means to reduce poverty, it is still a prevailing problem decades later. Naturally, there are other factors that play a role in poverty rates including war, natural disasters, and political turmoil, among other contributors. However, aside from these factors, a number of studies, including that of the United Kingdom’s Department for International Development, indicate that there is “no clear evidence” of the positive impacts of microfi nance. Th is means that microfi nance has not only failed to deliver signifi cant reduction of poverty and economic growth but it has also produced negative impacts on the poor.
Studying microfi nance in countries such as Mexico, South Africa and Bangladesh, it is evident that microfi nance has not lived up to expectations. Although microfi nance is intended to be a viable fi nancial opportunity for the poor, the interest rates create a very signifi cant problem for achieving fi nancial prosperity. First, there is no standard for interest rates for the poor. Th ere is no enforced system that ensures that microfi nance institutions have low interest rates in place that do not create an even greater burden on the poor, creating a cycle of debt and unpaid loans. Microfi nance institutions are oft en private companies, which means that their incentives are not based on alleviating poverty, but rather are profi t driven. Hence, their interest rates are not aimed towards helping borrowers. Some microfi nance institutions have annual interest rates ranging between 2% and 4%, while other have rates between 30% and 60%. In one extreme case, the
Banco Compartamos in Mexico, the Center for Global Development calculates annual interest rates to be almost 200%. Microfi nance institutions’ adoption of credit and loan practices as they are done in the formal economy does not help the poor. It simply further perpetuates poverty. Many microloan and credit recipients are not likely to be able to pay off the loan in a timely manner, so they fi nd themselves in an even worse place when their interest accumulates. In the case of South Africa, people oft en do not use microloans to fi nance businesses, but rather they use them to simply make ends meet. In fact, Jason Hickel of the London School of Economics points out that in South Africa, microfi nance has failed because 94% of the loans people recieve are used to pay for basic needs rather than generate a profi t to pay off the loans and sustain themselves. Looking at Bangladesh, studies point to serious problems
with overborrowing and lack of repayment. Rather than microfi nance stimulating independence and economic prosperity, it has created a culture of dependence, which
has only increased people’s debt and made class mobility a real challenge.
Microfi nance can only become the silver bullet the international community hoped it would be if microfi nance is re-examined, re-evaluated, and revised. Th is could include changing what the system looks like and possibly partnering the system with other practices of poverty reduction. Th ese practices could include direct cash transfers, implemented in countries such as Namibia, Indonesia, and South Africa, or creating jobs through expanding sectors such as the services, technology, and agriculture sector. Th ese alternatives have proven eff ective in combating poverty and protecting labor rights in countries such as India and China.
Microfi nance is just Band-Aid solution because it does not challenge the players in power and institutions that create conditions of extreme poverty in the fi rst place. It arguably off ers small-scale relief but fails to create long lasting change because it simply regurgitates a formal economy with all of its drawbacks that is palatable for the poor, where their personal economic growth and wellbeing are limited and conditional. ■
g or
here
9

“Fortnite tutors are a thing,” the headline from USA Today reads. “And yes, parents are paying them.”
Esports, already boasting millions of fans and almost a billion dollars in revenue, only promise to keep growing. Th e term refers to organized, competitive video game playing, featuring the likes of Dota 2, Counter-Strike: Global Off ensive, Fortnite, League of Legends, and Overwatch. And it is no longer just a fringe hobby, as it might once have seemed. Esports are projected to reach an audience of over 380 million viewers by the end of this year, generating an industry-wide $1.4 billion by 2020.
Where does this money go? Esports, like traditional sports, have fans as well as other stakeholders: players, teams, and the game developers themselves. In this article, we take a look at how each of these parties makes money—and what the future might hold.
Th e Players.First, the players. Th eir most high-profi le sources of income are tournaments, in which they compete for a cash prize—and the numbers are enormous. Kuro Salehi Takhasomi, a German professional Dota 2 player, has raked in over $4 million in tournament prizes, with over $2 million from a single tournament in 2017. Th at year, $112 million of prize money was awarded, and for the 2018–19 season, video game maker Epic Games has promised $100 million in prize money for Fortnite tournaments alone.
But while winning tournaments might be the most glamorous way to earn money, it is not a particularly consistent revenue source. Instead, many players have turned to an online platform called Twitch to livestream their games. Viewers can subscribe to a stream for only $4.99 a month, and the streamer gets half of that. With only 4,000 subscribers, that is about $120,000 a year—and the
top streamers make much more. Some are reported to earn over $100,000 a month.
It is an enormous sum of money, but it is not all. Streamers can upload their recorded streams to YouTube, generating more revenue through views on that platform. Many streamers also have loyal fans who are willing to simply donate money; for top streamers, that brings in up to $5,000 a day. On top of all this, streamers can also partner with various brands to promote their products on their channels—sharing links to certain products on Amazon, for example.
Th e best esports players are signed to teams, much like professional
football or basketball players, and that represent yet another source of income. According to Forbes, “Th e average starting North America League of Legends Championship Series (NALCS)
player salary is now over $320,000” (comparable to Major
League Soccer athletes!). Teams are even starting to off er other benefi ts like
health insurance and 401(k)s.
Th e Teams.To understand how esports teams make money, it is easiest to contrast them with traditional sports teams—and the diff erences are easy to see. While traditional sports teams have massive stadiums and (generally) regional fanbases, esports are streamed online, so fanbases are not as localized. As a result, while traditional sports teams can generate revenue by selling tickets and concessions to fans coming to their home stadiums, esports teams generally cannot tap into that revenue stream.
Similarly, traditional sports teams frequently own broadcasting rights to their games, while esports teams largely do not enjoy that luxury. For instance, in 2011, the Los Angeles Lakers (a professional basketball team) signed a 20-year contract with Time Warner Cable for local
t t k h S
le are
h
ed
C
health
by Joseph Ng
JAEUN PARK
10
television rights; the deal totaled $4 billion—an average of $200 million a year. Meanwhile, in esports, teams have far less leverage. In 2016, Riot Games (the developer for League of Legends) declined the petition of a number of esports teams for revenue sharing and broadcasting rights.
Instead, esports teams generate the vast majority of their money through sponsorship deals; estimates vary from 40% to around 95% of team revenue. Research fi rm Newzoo estimates that in 2018, $353.3 million was generated in the esports industry through sponsorship deals (with the caveat that not all of this necessarily went to teams). One problem with such one-sided revenue is that esports is such a rapidly changing industry. Games and teams can easily fade from popularity, causing their value to sponsoring companies to decrease—along with any associated sponsorship deals.
Th e future for esports teams, however, looks bright, as the rising trend of esports viewership has attracted millions in capital. Merchandise such as branded shirts and mouse pads already bring in revenue for teams, and new opportunities keep opening up. Team-customized digital skins (diff erent visual appearances for on-screen characters), for instance, pose a potential source of revenue. So do esports-specifi c arenas, which could drive ticket sales, sponsorships, and ad revenue. Some of these arenas are already in the works.
All this potential for future growth, on top of the sheer amount of capital already invested in the industry, has given esports teams sky-high valuations. Many have estimated valuations of $100–$200 million—and that number is likely to rise.
Th e Players.As noted earlier, some of the biggest game developers hold tournaments for their games, with a cash prize paid to the winner. Th ough expensive to host, these tournaments generate publicity for the games, and at least some of the costs can be off set via ticket sales, sponsorships, and advertisements.
Plus, the game developers own broadcasting rights; especially for lager tournaments, these rights can be worth a signifi cant amount. In 2016, BAMTech (a streaming company owned by Major League Baseball and Disney) inked a deal with Riot Games for streaming rights through 2023, worth at least $300 million. Similarly, in 2018, Activision Blizzard (maker of Overwatch) sold broadcasting and streaming rights for its second season of
the Overwatch League to three well-established companies (ESPN, ABC, and Disney), indicating esports’ growing mainstream appeal.
Perhaps the most interesting feature of game revenue for these developers is the rise of microtransactions (small in-game purchases), such as skins. Take Fortnite for example. As a free-to-play game, all its revenue is made through in-game transactions. In February 2018, the game brought in $126 million, mostly through in-app visual eff ect items. In April, it generated $296 million, and in May, monthly revenue hit $318 million. As of July, annual revenue was on track to hit $2 billion.
One interesting point to note is that, like pharmaceutical companies, game developers have enormous research and development costs. Much like the few drugs that pass regulatory approval and make it to market, very few games actually explode in popularity. Game developers must create a number of games and hope that at least one can hit it big, bringing in enough revenue to generate a profi t aft er subtracting the costs for developing the others. Unfortunately for developers, the cost of making games is growing. Electronic Arts, for example, noted in its 10-K fi ling for fi scal year 2018 that research and development costs had risen to $1.3 billion, up 10% from the previous year.
Th e Takeaway.It is clear that esports has a promising future, both in the US and abroad.
Game developers are investing more and more money into trying to create the next big hit. Media broadcasters are willing to spend big to secure streaming and broadcasting rights. Gamers are generating billions through in-game purchases, and players and teams are earning millions.
Esports is a growing trend, and it should not be ignored. Who knows? It might even become the next Olympic sport. ■
11
cal arch
ugs that to market,
in popularity. a number of games
can hit it big, bringing in nerate a profi t aft er subtracting
veloping the others. Unfortunately pers, the
of making mes is growing.
Electronic Arts, for example,
oted in its K fi ling for
year 2018 research and ment costs had risen
on, up 10% from the r
y.has a promising future, both i
g more andhit.
JAEUN PARK

12
Daniel Acland
Cihan Tugal
Dmitry Taubinsky
Acland: If you study behavioral economics, you can’t escape the suspicion that people are making mistakes that are making them less happy. If you study public health, you know for sure that people are making mistakes that make them less happy. Th at puts you straight into the domain of trying to fi gure out what policy interventions would actually change people’s’ behavior, which turns out to incredibly hard. … Most of the policy proposed in order to change public behavior does not work, and if they work in the short term they do not have persistent eff ects. … in the domain of public health, and in the domain of consumer fi nance … Most of what’s left in terms of the big policy changes is people’s’ behavior. We’ve got all the science we need on HIV—what we need is for people to get tested and wear condoms. And they don’t. And the same percentage of them don’t year aft er year aft er year.
Interviewer: What trajectory do you see neoliberalism taking in the United States during Trump’s presidency and aft er?
Tugal: We think the [neoliberal] crisis is over but the eff ects are everywhere. Th e 2008 crisis eff ects are still here … If you look at [wealth] inequality, if you look at people who are not looking for work versus the bare rate of unemployment then we’re still in the middle of the crisis. It is neoliberalism that brought us this crisis so you can’t carry on these [neoliberal] policies without destroying the country. Th is is what both parties are sort of aware of but they have no alternative … Th ey don’t know what to replace neoliberalism with … Th at’s where I think both economics as a discipline and economics of sociology will have to weigh in to map out new versions of what a post neoliberal and post New Deal economy would look like.
Interviewer: What open questions are there in public economics and behavioral economics?
Taubinsky: Well, the really big challenge in this area is, how do we fi gure out how socially benefi cial a policy really is, once we get away from the assumption that people’s choices reveal what they really want? ... If you
assume that people always choose what they want, then you have a very immediate link from a data set of people’s choices to what’s actually good for them, and therefore to the social welfare eff ects of various policies. Unfortunately, people’s choices don’t always reveal what they really want. For example, a very
basic and real psychological consideration is that people might get confused by taxes that are complex … or people might over-consume unhealthy foods because of limited self-control or incorrect beliefs.
Full interviews available at econreview.berkeley.edu
Interviewer: Do you see some analogies, or some fundamental diff erences between a soda tax and carbon tax?
Taubinsky: Th at core principle of trying to bring demand more in line with what is socially optimal through taxation runs through all of these kinds of studies. Carbon taxes is one example; soda taxes is another example... People might be under-purchasing energy-effi cient appliances as compared to less energy-effi cient appliances if people don’t take into account the benefi ts of using something that’s energy-effi cient, if they don’t fully internalize the impact on the environment. … Th e complexity of these kinds of policies is that many of these taxes or subsidies end up being regressive. Th ey aff ect low-income people and higher-income people in diff erent ways, so you have to pit that Pigouvian principle against other types of considerations, like collecting tax revenue in a fair way that doesn’t overburden lower-income families.
12
Assistant ProfessorGoldman School of Public Policy
Professor Interviews
ProfessorDepartment of Sociology
Assistant ProfessorDepartment of Economics

13
JoblessnessThe Effects of Technology on U.S. Jobs
The United States’s history has been emblemized by powerful people preaching the importance of working hard and staying busy. Our late president Th eodore Roosevelt once remarked that he’d rather risk wearing out than rusting out. Yet millions of people today fi nd themselves at odds with this once uncompromised ideal of a steady, nine-to-fi ve job that, for the baby-boomer generation, was all but guaranteed. Th e numbers speak for themselves, especially data from the manufacturing industry, a sector of the economy that is particularly useful to analyze because of the huge chunk that it has, historically, taken up of the U.S.’s economic pie. In the past 20 years, the number of manufacturing jobs in the United States has dropped by almost 30%. Between 2000 and 2017 employment in manufacturing fell by 5.5 million jobs. Perhaps more surprisingly, the percentage of prime-age men who have no job and aren’t looking for a job has doubled since the 1970s—a statistic that suggests that our employment crisis is not just material in nature but psychological, as well.
Most economists agree that one of the top leading propagators of this loss of U.S. jobs is the exponential growth of the use of technology in industry to increase effi ciency and output. Economists have been nervous about technology’s eff ect on jobs for years—almost 100 years ago, in 1929, John Keynes warned that rapid technological change would reduce the demand for labor and lead to astounding rates of unemployment. Increasingly we see jobs that were once performed by humans being done by machines—cashiers have become “self-checkouts,” factory workers have been replaced in some cases by robots, and cars have begun to drive themselves. It’s true that technology makes jobs too—yet perhaps not at the rate that proponents of automation have advertised. About 90 per cent of workers today are employed in jobs that existed 100 years ago, and only 5 percent of the jobs created in the 20-year period between 1993 and 2013 came from high tech sectors. Researchers at Oxford University have predicted that, twenty years from now, machines may be able to perform half of all American jobs. But the repercussions that America faces as a result of the decline in manufacturing run deeper than just unemployment—in many of the areas that were once
hubs of industry we now observe a surge of opioid use and opioid-related deaths.
But technology isn’t the only threat impinging on U.S. employment. In the realm of manufacturing, recent economic analysis has shown that trade defi cits might actually shoulder much of the blame for manufacturing job loss. Th e Census Bureau reported in 2015 that the U.S. has run a goods trade defi cit in every year since 1974, and with more than 75% of U.S. traded goods being manufactured goods, it’s manufacturing jobs that are taking the hit.
An interesting sub-group of scholars and economists has surfaced in the past ten years, which argues that the ends of jobs, for lack of a better phrase, might not actually be a bad thing. One such thinker, Peter Frase, says that we are confl ating the way in which we earn income with the activities that give our life meaning. Frase, along with a select few, actually encourage the end of labor. Benjamin Hunnicutt, a historian at the University of Iowa, believes that America has an irrational belief in work for work’s sake. “Purpose, meaning, identity, fulfi llment, creativity, autonomy—all these things that positive psychology has shown us to be necessary for well-being are absent in the average job.” Th is may all very well be true—but people need to eat, don’t they? Most jobless people today aren’t relishing in their newfound freedom to do meaningful, creative things—they are worrying about where their next meal will come from, and how they will their bills. Automation poses serious risks towards the livelihood of many of millions of American workers (and workers worldwide). Th e four most common jobs in America today—salespersons, cashiers, offi ce clerks, and food servers—are all jobs that are at risk of being replaced completely by automation. McKinsey Global Briefi ng, in a 2017 executive briefi ng, proposed several potential steps to take in our increasingly digitized and automated world. Th ese include a universal basic income, an evolved education system to improve STEM learning in young children, and policy changes aimed at incentivizing corporations to treat human capital like they would any other capital. ■
by Katherine Blesie

14
You’ve heard it before—economists all over the world have lambasted the President’s tariff initiatives. In fact, out of 60 economists surveyed by Reuters, not one believed that the tariff s would benefi t the U.S. economy in the long run. Th e negative impacts of the tariff s have already begun to impact the country. By analyzing how the tariff s interplay with macroeconomic conditions—infl ation and wage growth—we can make some conjectures as to the eff ect of the tariff s on the Trump constituency and therefore on President Trump’s 2020 presidential run.
Let’s examine Mid-Continent Nail, the largest steel nail manufacturer in the country. While its blue-collar employees are based in Missouri—deep in the heart of Trump territory—Mid-Continent operates under Mexican ownership and imports its steel from Mexico. Th erefore, its production material is subject to Trump’s 25% steel tariff . As a result, Mid-Continent’s input costs have risen dramatically, and the company’s prospects—including the job security of its American workers—are shaky.
Th ere is something to be said about the short-run costs faced by the losers of free trade, many of whom are blue-collar workers and largely turn out for the GOP during elections. By making
foreign imports relatively more expensive compared to American goods, tariff s can help prevent the decline of industries harmed by trade. While supporters of free trade may argue that the former employees of declining industries will hopefully be retrained and readapted to diff erent industries in the long run, the pain felt from trade in the short-run cannot be denied.
As it turns out, the tariff issue is not as black-and-white as economists may make it seem. Yes, particularly on a macro-level, tariff s tend to do more harm than good in the long run as complete specialization will not occur, causing the economy to be less effi cient than it could be under free trade. Th ere is another signifi cant eff ect of tariff s that does not seem to be covered enough, and is instead left in the shadows of eye-catching headlines like that of Mid-Continent Nail.
Adam Smith, a graduate student in the Economics department at UC Berkeley, explains: “Everyone seems to know what infl ation is, but few people actually know how it happens, how to handle it, and how it can have both positive and negative eff ects on the economy and wages… Unemployment is at one of its lowest points in recent history. Because the supply of unemployed workers is so low, fi rms must off er increasingly higher wages to their employees. Now, these workers have more money to spend, bidding up the prices of goods and therefore adding to the infl ationary pressure caused by the tariff s. We should also take into account the recent tax reform. It is my hope that it will incentivize businesses to spend more on investment goods, putting upward pressure on wages for blue-collar workers in the short-run, and expanding the potential of our economy to produce goods and services in the long-run.”
Now, here comes the big question: in the short run—before our economy has the chance to expand signifi cantly and before the end of the 2020 election—will the rise in wages of workers be eroded by the rise in prices from tariff s? In other words, will wage growth be wiped out by infl ation?
Th e future is daunting. Th is past summer, infl ation hit a six-year-high, partially attributed to a jump in the cost of energy. Overall, a 2.9% cost of living increase outpaced a 2.7% in wages for the year; the growth of
14
AMERICA’s Trade Frustrations:Could the Trump Presidency be

15
by Arsh Vishen
Nailed By Its Own Steel Tariffs?
real average hourly earnings (accounting for infl ation) was in fact negative recently. As the Bureau of Labor Statistics reported, people are paying more for housing, healthcare, and automobile insurance. With new tariff s potentially on the way, the cost of living may increase even further.
We must wait and see how the economic future will aff ect the Trump constituency and, come 2020, his presidency. Having promised middle America and manufacturing workers higher wages during his 2016 campaign, infl ationary pressure from his own policies could make keeping his promises more diffi cult. Even more dangerous for the Trump presidency, if a signifi cant number of U.S. manufacturers are in the same situation as Mid-Continent Nail, many blue-collar workers will be hurt by Trump’s policy through potential layoff s. America’s “forgotten” may remember how, despite constantly seeing news about the booming economy and falling unemployment rates, their manufacturing jobs vanished. ■
Source: Th e Washington Post
15
SSGT C.W. ALLEN

16
tons in 2015. Most of the carbon dioxide emissions from California are from petroleum, 64% or 234 million metric tons of carbon dioxide, rather than coal, which accounts for only 1% or 3 million metric tons of California’s emissions.
Given the best-case scenario in which California is able to switch all of their electricity generation to renewable sources, California would no longer be contributing to the emissions of energy-related carbon dioxide. Th is would result in a reduction of approximately 370 million metric tons of carbon dioxide emissions. Th ough in appearance this best case scenario appears as a signifi cant amount, its large-scale eff ect is negligible considering that in 2017, the total US energy-related carbon dioxide emissions was estimated at 5.14 billion metric tons.
Despite the decrease in carbon emissions that would result should California succeed in generating all of its electricity from renewable energy sources by 2045, there are opponents to this goal who highlight the downsides of pursuing such a large-scale makeover of California’s power grid. In 2015, California produced approximately 44% of its electricity using coal, oil and natural gas. Additionally, another 30% of California’s electricity consumption in 2015 was from out-of-state sources. Th e proportion of electricity that California imports from other states has only increased. In 2010, California imported 25% of the energy it consumed. In 2017, California imported 33% of the energy it consumed. To achieve 100% renewable energy reliance, California would have to reverse this trend of increasingly importing electricity from surrounding states and become fully self-sustained in terms of electricity production and consumption. Th is goal is more easily said than done, especially considering that current renewable energy sources and the technology that taps into these renewable reservoirs of energy cannot achieve the energy production density or consistency of fossil fuel power stations.
What are the implications of building up the renewable energy power sources and abandoning almost half of the state’s current electrical generation infrastructure? It follows the argument used by Bill Brough and his warning about increasing electricity rates that consumers will face. Th e Energy Information Administration (EIA) has published data estimating the overnight capital cost and operational cost for diff erent power plants. Th e overnight cost represents the cost of building that powerplant overnight. As of November 2016, onshore wind farms had an overnight capital cost of $1,877 per kilowatt (kW) and solar farms had an overnight capital cost of around $2,600 per kW. Likewise, onshore wind farms had an operational cost of $39.70 per kW-yr and solar farms had an operational
Just as the Trump administration and the EPA are relaxing environmental regulations, California, under the leadership of Governor Jerry Brown, is actively pursuing a policy aiming for cleaner energy. In a bold move in defi ance of the Trump administration, Governor Brown signed a bill in September 2018 that set the goal for California to be sustained solely on renewable energy by 2045. According to this bill, California should be generating 60% of its energy using wind, solar and other renewable energy resources by 2030. While this is not a mandate, and thus there is no penalty if this goal is not reached by the specifi ed dates, the goal of this bill is for California to achieve carbon neutrality by 2045. However, the feasibility of this new environmental initiative along with its cost implications are the underlying topics that will either support or undermine this goal.
Opponents to Governor Brown’s position of radically altering California’s energy sources raise economically centered concerns regarding the price of electricity. If California were to accomplish its goal of solely relying on renewable energy sources, the price of electricity in the state will skyrocket. Th is negative eff ect was cautioned by Bill Brough, a Republican assemblyman from Orange County—“One fact you cannot dispute: this does increase the cost … You cannot dispute that this is going to be passed on to the ratepayers.” It is not diffi cult to understand why a price increase in the electricity rate paid by consumers would be a side-eff ect of generating all of the state’s electricity from renewable energy sources. But let us fi rst consider the positive outcomes associated with Governor Brown’s goal.
Given this political climate, political fi gures such as Governor Brown see it only necessary that states individually take matters into their own hands and continue the push towards greater renewable energy source reliance. Should the Governor’s goal be realized and California is capable of producing all of its energy from renewable sources by 2045, the annual output of carbon dioxide in the United States would be signifi cantly decreased. Demonstrated in the diagram below, California is the second highest emitter of carbon dioxide behind Texas at around 360 million metric
The Clean Energy ConundrumHow Brown’s Goal for a Renewable California by 2045 Comes at a CostHow Brown’s Goal for a Renewable California by 2045 Comes at a Costby Odysseus Pyrinis
17
businesses would be less inclined to hire more employees that would in turn utilize more electricity in the offi ce. Th e cycle is circular until a new equilibrium is reached.
Nevertheless, some proponents for the Governor’s plan have suggested that a means of controlling the rise of electricity prices is to create a regional power grid in which neighboring states would be able to more easily share their electricity with California and likewise, California share their electricity with regional states. Governor Brown is pushing hard for such a plan to be realized; however, even the Governor faces opposition from his own side. Environmentalists supporting the switch to renewable energy sources away from fossil fuels are not supportive of the idea for a regional power grid. Th ey do not believe it is right for California to freely use electricity from other states that was generated using fossil fuels. However, even Governor Brown recognizes the danger of not pushing forward with this plan, stating that “those who don’t want it are going to be foisting very high prices on California, and I think there will be resistance to that …”
Th e plan to regionalize California’s power stems from the idea of creating a single authority that will manage most, or all, of the Western states’ power grids. Currently, California’s power grid is managed by the California Independent System Operator which oversees the market in which companies buy and sell power. It is estimated that California moving under a single regional manager would save consumers as much as $1.5 billion a year. Th e regional manager would lead to greater effi ciency in managing the sources of electricity in the western grids. Under the current system, lacking a single regional manager, California has to pay other states to use its electricity during times when wind or solar farms produce too much electricity and risk causing a blackout. Under the single regional manager, the sharing of electricity across states would be more effi ciently managed and would not incur an extra cost for California.Governor Brown has been attempting to push a bill through the state legislature to approve a central regional manager for California’s power grid; however, the Governor has been continually faced with opposition, simply because state legislators believe that such a system would encourage the use of fossil fuels rather than continue the transition to greater dependence on renewable energy sources. Should the regionalized power system not be implemented, but California continues to pursue the 2045 goal of 100% energy reliance on renewable energy sources, it can be expected that the consumers of electricity in California will be seeing larger bills. In the end, since the goal set by Governor Brown is not a hard mandate and there are no consequences for failing to reach it, it is entirely possible that California will not achieve its dream of signifi cantly greater reliance on renewable energy sources as individual energy fi rms fail to build the necessary infrastructure to initiate the transition. ■
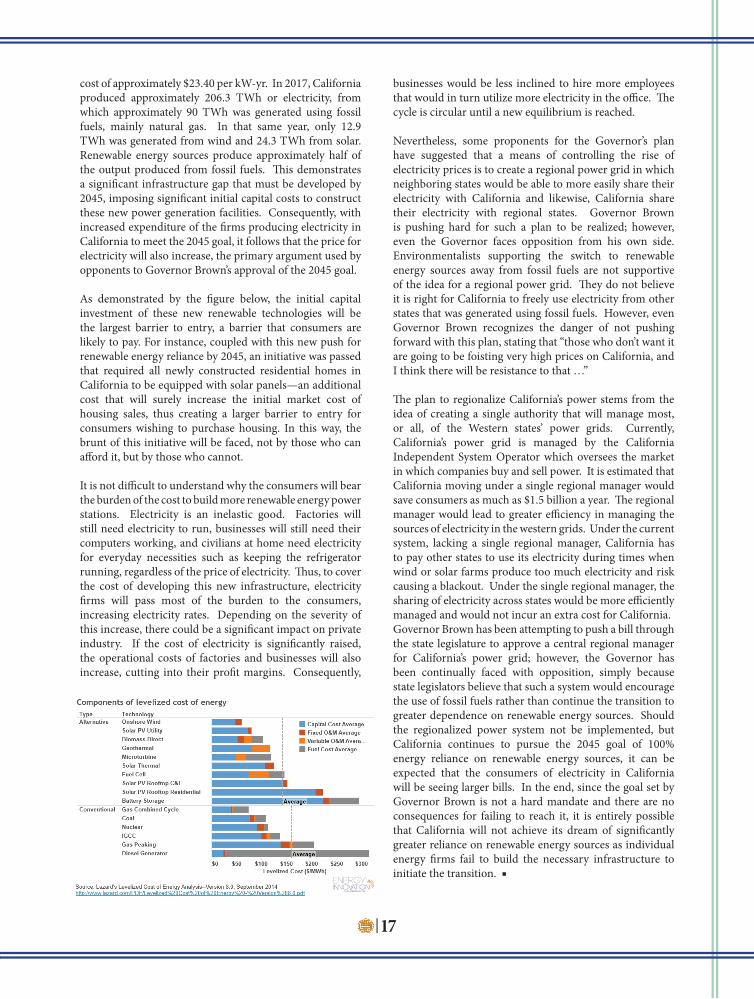
cost of approximately $23.40 per kW-yr. In 2017, California produced approximately 206.3 TWh or electricity, from which approximately 90 TWh was generated using fossil fuels, mainly natural gas. In that same year, only 12.9 TWh was generated from wind and 24.3 TWh from solar. Renewable energy sources produce approximately half of the output produced from fossil fuels. Th is demonstrates a signifi cant infrastructure gap that must be developed by 2045, imposing signifi cant initial capital costs to construct these new power generation facilities. Consequently, with increased expenditure of the fi rms producing electricity in California to meet the 2045 goal, it follows that the price for electricity will also increase, the primary argument used by opponents to Governor Brown’s approval of the 2045 goal.
As demonstrated by the fi gure below, the initial capital investment of these new renewable technologies will be the largest barrier to entry, a barrier that consumers are likely to pay. For instance, coupled with this new push for renewable energy reliance by 2045, an initiative was passed that required all newly constructed residential homes in California to be equipped with solar panels—an additional cost that will surely increase the initial market cost of housing sales, thus creating a larger barrier to entry for consumers wishing to purchase housing. In this way, the brunt of this initiative will be faced, not by those who can aff ord it, but by those who cannot.
It is not diffi cult to understand why the consumers will bear the burden of the cost to build more renewable energy power stations. Electricity is an inelastic good. Factories will still need electricity to run, businesses will still need their computers working, and civilians at home need electricity for everyday necessities such as keeping the refrigerator running, regardless of the price of electricity. Th us, to cover the cost of developing this new infrastructure, electricity fi rms will pass most of the burden to the consumers, increasing electricity rates. Depending on the severity of this increase, there could be a signifi cant impact on private industry. If the cost of electricity is signifi cantly raised, the operational costs of factories and businesses will also increase, cutting into their profi t margins. Consequently,

18
Child labour is oft en a term we see smeared across a sensational news piece, denouncing governments for infringing on human rights. Yet, despite the moral objections, it is still common practice in many countries today. Some argue that the practice enhances economic growth. If society chooses to stand on the shoulders of children in the name of economic growth, there must be overwhelming material benefi ts for the wider society. However, this is not the case, as child labour actively detracts from economic development. Th is, compounded with human rights concerns, makes it clear that child labor must abolished.
Child labour is defi ned by the International Labour Organization (ILO) as the work of an individual under the age of 14 that detracts or acts as a substitute for education. In practice this looks like children working in factories, likely in low-skilled manufacturing jobs. Th e main arguments for child labour in developing economies try to spin the practice as an opportunity for children to “grow.” Th is is backed by the theory that it allows younger individuals to support their families and gain work experience before they transition into the workforce. In theory, this makes society at a production level more eff ective, while also breaking the poverty cycle. However, this is far from reality. In fact, child labour inhibits skill development and limits the expansion of local labour markets, eff ectively stunting economic growth. In Egypt, for example, researcher Jackline Wahba shows that the children of child laborers are likelier to become child laborers themselves. Th is already demonstrates that in the long term, child labour does not bring people out of poverty; it reinforces it.
Th e work the child does, given the scarcity of their time and energy, inevitably ends up stifl ing both their physical and
intellectual development. Th is limits the child’s ability to cultivate skills that will help them get a higher paying job with better working conditions. What this inevitably leads to is a lack of social mobility that comes only with education and skills training, which perpetuates intergenerational child labour. Th is has implications beyond the child’s future family, as a large demographic of low-skilled workers in the labour force prevents development of economies that rely on resource and manufacturing industries into one which is more profi table, where higher skilled and more service-based industry is relied upon. Th is is essential to development, and cannot occur in a system that endorses child labour.
Th e infl ux of labor, especially young and impressionable kids, drives wages down, because there are more individuals willing to work at a given wage, and this increased competition for jobs drives down wages. Some children work 12-hour days for 20 cents per day, which is signifi cantly less money than their adult counterparts are paid, and companies will be incentivized to hire youth because of this. Th is then perpetuates its own cycle: child labour leads to lower wages, which leads to the need of families to get their children employed. Parents who earn wages under the poverty line are most likely to send their children to work. Th e abundance of unskilled workers creates a society that complements technology that does not required skilled management. Th is is because low-skilled workers cannot become specialized due to their lack of education, which limits the effi ciency needed to create more high-skilled, technologically intensive industries. Th e more child labour there is, the more unskilled industry is perpetuated in an economy, which results in lower demand for countries to adopt technologies that utilize high-skilled labour. For example, researchers Richard Hornbeck and Suresh Naidu showed that the American South’s reliance on exploited low-skilled labor, largely from African-Americans, delayed agricultural development in the region. Th is demonstrates that a reliance on low-skilled labour, slows down economic progress. Because of child labour, human capital cannot accumulate, stunting a country’s development.
Developing economies would benefi t greatly from strictly regulating the practice of child labour in their country. Th e ramifi cations that inhibiting youth development has on intergenerational poverty, and the development of industry, far outweigh marginal benefi ts that can be gained from child labour. Standing on the shoulders of children is not only an abhorrent practice, but also one that inhibits societal growth and economic development in its totality. ■
Standing on the Shoulders of ChildrenThe Economic Case Against Child Labor
“Th e work the child does, given the scarcity of their time and energy, inevitably ends up stifl ing both their physical and intellectual
development.”
by Ariana Jessa

Published Undergraduate Research
Every semester, Berkeley Economic Review’s peer review team selects outstanding undergraduate research papers from all over the world to publish in our journal. Below are abstracts and summaries from papers we have published in the Fall 2018 cycle.
We accept submissions within and outside of Berkeley year-round. Read the full journal at econreview.berkeley.edu.
“Th e Sino-African Relationship: An Empirical Study of the Eff ect of Chinese Foreign Direct Investment on Illicit Financial Flows in Africa”
Foreign Direct Investment (FDI) in the African continent, particularly Chinese-led investment, has been criticized in recent years for lacking adequate regulatory frameworks and enabling high-level corruption. Th is is an alarming criticism given that Beijing is today a major provider of FDI capital in Africa, and at the same time, African countries are estimated to collectively lose US$30 to US$60 billion to illicit fi nancial fl ows (IFFs) every year. However, there is little systematic evidence to support these criticisms and determine whether anecdotal evidence refl ects the true eff ect of Beijing’s investments. Th is study aims to address that gap by providing causal estimates of the eff ect of Chinese FDI on illicit fi nancial fl ows (IFFs) in recipient African countries. We use an instrumental variable strategy that exploits variation in FDI volumes due to two factors, exogenous variation in Chinese steel production and the cross-sectional variation in a country’s likelihood of dealing with Chinese fi rms. We fi nd that a $1 increase in Chinese FDI increases the volume of illicit fi nancial fl ows by $3.72, a result that is statistically signifi cant. Conversely, we fi nd no evidence of FDI triggering the fi rst onset of illicit fi nancial activity; instead, FDI appears to exacerbate existing volumes of IFFs. Our fi ndings also suggest that the eff ects of FDI are most pronounced in the year in which it is received.
Fatima Ezzahra Daif, Yale-NUS College Class of 2018
“Time-Discipline and Southern Railroads, Increased Watch Availability Raising Labor Costs”[...] An analysis of post-Civil War railroad expenses for a railroad operating in the reconstructing American south from 1866 to 1886 indicates that the increased availability of watches raised labor costs for fi rms due to certain workers developing an innate sense of time-discipline, which enhanced their bargaining power and may have resulted in higher wages. Applying a quasi-experimental design allows for the evaluation of two hypotheses to support this thesis:
• Th e labor cost to the railroad for employees working with an indirect connection to clock-time increased at positive, statistically signifi cant rate with respect to higher levels of watch availability.
• Th e labor costs to railroads for employees working with either direct or nonexistent connections to clock-time did not increase at positive, statistically signifi cant rate with respect to higher levels of watch availability.
[...] A corresponding qualitative assessment of primary source documents identifi ed exogenous societal factors that were incorporated into a regression analysis to account for confounding eff ects. Th e coeffi cient results show labor costs increasing in response to technological change[.]
David Abraham, University of Chicago Class of 2018
“Real Exchange Rate Volatility and Economic Growth: A Panel Data Investigation”Th e study aims to investigate the impact of Real Eff ective Exchange Rate (REER) volatility on economic growth for a set of 33 developed and developing economies, using panel dataset ranging from 1970 to 2016. Stemming from a precise measure for exchange rate volatility, results of various Fixed Eff ects and System GMM models suggest that increased (decreased) REER volatility, controlling for trade and misalignment and contingent on diverse model specifi cations, leads to a negative (positive) eff ect on economic growth for developing countries. A relationship cannot be ascertained for developed countries. In addition, a signifi cant impact of the REER level and its interaction with volatility is found, while neither a signifi cant interaction of volatility with trade nor terms of trade shocks is found.
Federico Pessina, University of Warwick Class of 2018

Th ank you for reading Berkeley Economic Review’s
For more content, please visit us at econreview.berkeley.edu