benefits: the underutilized reward · differentiate yourself against competitors/peers, have the...
TRANSCRIPT

BENEFITS: THE UNDERUTILIZED REWARDEFFECTIVE BENEFIT PROGRAMS FOR A POSITIVE EMPLOYEE EXPERIENCE
Across all markets, an increasing number of employees are currently considering leaving their organizations. Satisfaction with pay and benefits is down. This is attributed to a number of factors (both financial and nonfinancial):
• Eroding loyalty and growing apathy – the employer/employee relationship has been damaged
• Shifting views on benefits among employees, with increasingly negative results around the perception of the quality of benefits compared with those offered by other organizations1
Even though benefits make up an increasingly significant component of the overall compensation package throughout the Asia Pacific region, with at least 35% of employers spending more than 6% of payroll per year on health benefits,2 many companies have not yet taken steps to incorporate benefits into the strategic part of their overall workforce plans. Most companies offer benefits simply because they have become an expectation of employment, and they fail to leverage existing benefit investments to create a program that can serve as a key competitive differentiator.
Improving transparency at the employee level to showcase supplementary benefit programs, their competitive position, the value delivered to varying employee profiles and the organization’s investment on benefits can drive appreciation and satisfaction among employees.
Of course, in order to succeed, employers must include a market-competitive benefit package that has the following bare essentials:
•Itaddressesemployees’healthandwellnessrequirementsandencouragesconsumerism.
•Itoffersthebiggestvaluetodifferentemployeeprofileswithinanorganization.
However, the intricacy and variation of benefit plan designs make it a seemingly impossible task to compare one’s benefits policy against other companies’ policies.
How can this process be achieved?
Most companies offer benefits simply because they have become an expectation of employment, and they fail to leverage existing benefit investments to create a program that can serve as a key competitive differentiator.
ABOUT THE AUTHORSLiana Attard is the Regional Benefits Management Leader for Mercer Marsh Benefits in the Asia Pacific region. She can be reached at +65 6398 2543 [email protected].
Godelieve Kroonenberg is the Benefits Leader for Mercer’s Information Product Solutions business in the Asia Pacific region. She can be reached at +65 6398 2630 or [email protected].
1 Mercer’s What’s WorkingTM 2011 Survey2 Mercer and Marsh Asia Pacific Total Health and Choice in Benefits 2011 Survey, available at www.mercer.com/TotalHealthChoice
2
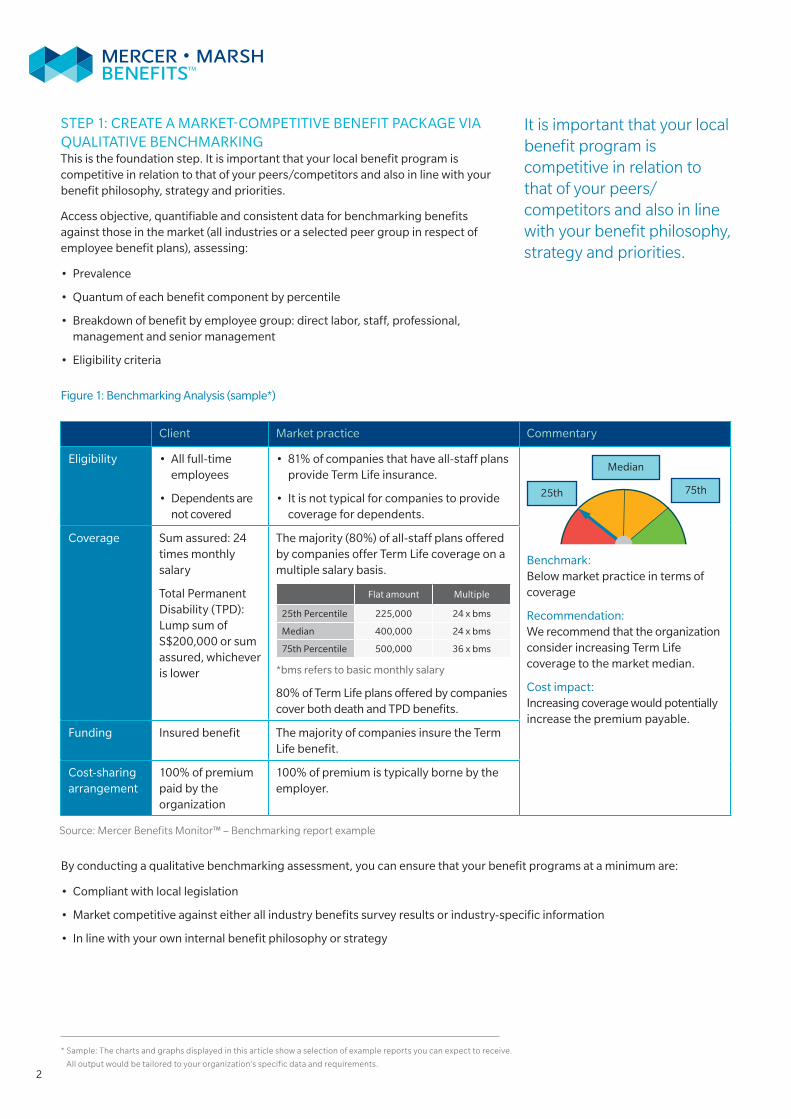
STEP 1: CrEATE A MArkET-COMPETITIvE bEnEfIT PACkAgE vIA quAlITATIvE bEnCHMArkIngThis is the foundation step. It is important that your local benefit program is competitive in relation to that of your peers/competitors and also in line with your benefit philosophy, strategy and priorities.
Access objective, quantifiable and consistent data for benchmarking benefits against those in the market (all industries or a selected peer group in respect of employee benefit plans), assessing:
• Prevalence
• quantum of each benefit component by percentile
• breakdown of benefit by employee group: direct labor, staff, professional, management and senior management
• Eligibility criteria
figure 1: benchmarking Analysis (sample*)
Source: Mercer Benefits Monitor™ – Benchmarking report example
Client Market practice Commentary
Eligibility • All full-time employees
• Dependents are not covered
• 81% of companies that have all-staff plans provide Term life insurance.
• It is not typical for companies to provide coverage for dependents.
benchmark:below market practice in terms of coverage
recommendation:We recommend that the organization consider increasing Term life coverage to the market median.
Cost impact:Increasing coverage would potentially increase the premium payable.
Coverage Sum assured: 24 times monthly salary
Total Permanent Disability (TPD): lump sum of S$200,000 or sum assured, whichever is lower
The majority (80%) of all-staff plans offered by companies offer Term life coverage on a multiple salary basis.
flat amount Multiple
25th Percentile 225,000 24 x bms
Median 400,000 24 x bms
75th Percentile 500,000 36 x bms
*bms refers to basic monthly salary
80% of Term life plans offered by companies cover both death and TPD benefits.
funding Insured benefit The majority of companies insure the Term life benefit.
Cost-sharing arrangement
100% of premium paid by the organization
100% of premium is typically borne by the employer.
by conducting a qualitative benchmarking assessment, you can ensure that your benefit programs at a minimum are:
• Compliant with local legislation
• Market competitive against either all industry benefits survey results or industry-specific information
• In line with your own internal benefit philosophy or strategy
It is important that your local benefit program is competitive in relation to that of your peers/competitors and also in line with your benefit philosophy, strategy and priorities.
Median
25th 75th
* Sample: The charts and graphs displayed in this article show a selection of example reports you can expect to receive.
All output would be tailored to your organization’s specific data and requirements.

3
STEP 2: IDEnTIfy bEnEfIT PlAn COST DrIvErS AnD uTIlIzATIOn TrEnDS vIA A DEEP-DIvE AnAlySIS Of ClAIMSA benefit claims experience study can be a real eye opener. by gaining an understanding of how employees use their benefit plans, you can gain insight into the following:
• The benefits employees need/value most
• Medical plan reimbursement ratios, which signal whether benefit levels are adequate
• Cost drivers, in terms of what/where/who is driving the claims – that is, which benefits, employees versus dependents, private versus government hospitals, males versus females, etc.
figure 2: Cost Drivers and benefit Adequacy ratio (sample*)
A benefit claims experience study can be a real eye opener. By gaining an understanding of how employees use their benefit plans, you can gain insight into … benefits employees need/value most … medical plan reimbursement ratios … [claims] cost drivers … [and] employee health risks.
Claims AnalysisOutpatient Claims Analysis (by Claimant): gP vs. SP vs. TCM
Source: Mercer claims analysis
GP = general practitioner; SP = specialist practitioner; TCM = traditional Chinese medicine

4
Diagnostic AnalysisInpatient – Diagnosis groups (by number of Cases)
Source: Mercer proprietary data – diagnostic analysis
Employees
Pre
gn
ancy
, ch
ildb
irth
an
d th
e p
uer
per
ium
Cer
tain
infe
ctio
us
and
par
asit
ic d
isea
ses
Dis
ease
s of
the
dig
esti
ve s
yste
m
Dis
ease
s of
the
resp
irat
ory
syst
em
Dis
ease
s of
the
gen
itou
rin
ary
syst
em
Dis
ease
s of
the
circ
ula
tory
sys
tem
Neo
pla
sms
Inju
ry, p
oiso
nin
g a
nd
cer
tain
oth
er c
onse
qu
ence
sof
ext
ern
al c
ause
s
Dis
ease
s of
the
mu
scu
losk
elet
al s
yste
m a
nd
con
nec
tive
tiss
ue
End
ocri
ne,
nu
trit
ion
al a
nd
met
abol
ic d
isea
ses
No. of claims (2009−2010)
No. of claims (2010−2011) Amount paid (2010−2011)
Amount paid (2009−2010)
0
5,000
10,000
15,000
20,000
USD
500
1,000
1,500
• Health risks among your employees, such as top diagnoses/ailments, and potential actions to address these issues/findings
figure 3: Health risks Analysis Example (sample*)
Dependents
0
5,000
10,000
15,000
20,000
USD
500
Dis
ease
s of
the
skin
an
d s
ub
cuta
neo
us
tiss
ue
Cer
tain
infe
ctio
us
and
par
asit
ic d
isea
ses
Dis
ease
s of
the
dig
esti
ve s
yste
m
Dis
ease
s of
the
resp
irat
ory
syst
em
Dis
ease
s of
the
gen
itou
rin
ary
syst
em
Dis
ease
s of
the
circ
ula
tory
sys
tem
Neo
pla
sms
Inju
ry, p
oiso
nin
g a
nd
cer
tain
oth
er c
onse
qu
ence
sof
ext
ern
al c
ause
s
Dis
ease
s of
the
mu
scu
losk
elet
al s
yste
m a
nd
con
nec
tive
tiss
ue
End
ocri
ne,
nu
trit
ion
al a
nd
met
abol
ic d
isea
ses
1,000
No. of claims (2009−2010)
No. of claims (2010−2011) Amount paid (2010−2011)
Amount paid (2009−2010)
1,500
It is critical then to couple the findings from this claims analysis with the benchmarking qualitative analysis from step 1 to shape your benefit plan design to promote consumerism, help address cost drivers to ensure that your benefit program continues to be sustainable, and implement targeted, well-managed benefits programs (for example, avoid wasting money on wellness programs that are not specifically addressing your cost or health drivers or are not going to be of value to employees).

5
STEP 3: DrIvE vAluE AnD EMPlOyEE APPrECIATIOn Of bEnEfITS vIA bEnEfITS vAluATIOn ASSESSMEnTIt is critical that employees understand the value of the benefits they receive, as opposed to the actual cost of the benefits, which can vary according to plan design, demographics of the group, negotiated premium rates with the insurer and other factors. ultimately, the amount of money an employer spends on a benefit is not relevant or even visible to an employee. It is the benefits value an employee would evaluate when looking at a job offer.
The question is how to demonstrate this value to the employee. Adding to the level of complexity are the different employee profiles (employee level, gender, age, marital status, children, etc.) within an organization that would make it tougher to identify how companies allocate their benefits budget. To illustrate, a benefits plan with heavier weight on vehicle policies and less on retirement may be of more value to a company of generation y employees as compared to a company with a more senior demographic. Similarly, medical policies that include dependent coverage would be more of higher value for a married employee with children than a single employee.
To get better insight into the value of a benefits program for the entire workforce, companies can conduct a benchmark analysis to determine the dollar amount each employee would have to pay if he or she were to reproduce the employer-provided benefit and compare this value against their competitors. This diagnostic process is termed benefits valuation Analysis (bvA).
figure 4: Comparing your benefits Plan values Against Those of a Peer group (sample*)
It is critical that employees understand the value of the benefits they receive, as opposed to the actual cost of the benefits, which can vary according to plan design, demographics of the group, negotiated premium rates with the insurer and other factors.
0
3,000
6,000
9,000
12,000
15,000 RetirementInsuranceMedicalTime loss
Flexible benefitsCars
Lower quartile
Median
Upper quartile
Total benefits
rank: 8
% Median: 2%
uSD
Emp
loye
r f
Emp
loye
r A
Emp
loye
r g
Emp
loye
r C
Emp
loye
r D
Emp
loye
r b
Emp
loye
r H
your
org
aniz
atio
n
Emp
loye
r I
Source: Benefits Valuation Analysis™

6
In SuMMAryApplying a three-step process to setting up an effective benefit program will help ensure that you are better equipped to differentiate yourself against competitors/peers, have the necessary information to communicate to employees the value of your benefits, and help ensure that your benefits program meets employees’ needs. This approach can be a powerful tool in retaining key talent in a region where the engines of the job market are only just warming up.
figure 5: Aggregate values of benefits Spend Across Different Employee Profiles (sample*)
Source: Mercer Benefits Valuation Analysis™
your Organization Employee Profiles
70,000
65,000
60,000
55,000
50,000
45,000
40,000
35,000
30,000
25,000
20,000
15,000
10,000
5,000
0Single Married Married with
childrenSingle Married Married with
children
uSD
Total benefits lower quartile Median upper quartile
-
-
-
-
-
-
-
-
-
-
-
-
-
-
by conducting this analysis, companies can easily see how specific benefits elements, or the benefit plan in its entirety, stack up against those of other companies (see figure 4). An additional advantage of such an analysis is the ability to also demonstrate equity among the different employee groups (see figure 5).
understanding how money is being allocated to benefits items among the various employee profiles and what a valuable benefits package would mean to employees assists organizations justify decisions on changes to plan design. This enables companies to better position and align their benefits package with their employer value proposition and the corporate brand.
Understanding how money is being allocated to benefits items among the various employee profiles … enables companies to better position and align their benefits package with their value proposition.

7
Applying a three-step process to setting up an effective benefit program … can be a powerful tool in retaining key talent in a region where the engines of the job market are only just warming up.

Copyright 2012 Marsh Inc. All rights reserved. 11144-Hb-240912
AbOuT MErCEr MArSH bEnEfITSMercer Marsh benefits provides clients with a single source for managing the costs, people risks and complexities of employee benefits. The network is a combination of Mercer and Marsh local offices around the world, plus country correspondents who have been selected based on specific criteria. Our benefits experts, located in 135 countries and servicing clients in more than 150 countries, are deeply knowledgeable about their local markets. Through our locally established businesses, we have a unique common platform that allows us to serve clients with global consistency and locally unique solutions.
visit our website at www.mercer-marsh-benefits.com
IMPOrTAnT nOTICE: This document does not constitute or form part of any offer or solicitation or invitation to sell by either Marsh or Mercer to provide any regulated services or products in any country in which either Marsh or Mercer has not been authorized or licensed to provide such regulated services or products. you accept this document on the understanding that it does not form the basis of any contract.
The availability, nature and provider of any services or products, as described herein, and applicable terms and conditions may therefore vary in certain countries as a result of applicable legal and regulatory restrictions and requirements.
Please consult your Marsh or Mercer consultants regarding any restrictions that may be applicable to the ability of Marsh or Mercer to provide regulated services or products to you in your country.