benazir income support...
TRANSCRIPT

June 2016
Benazir Income Support ProgrammeFinal Impact Evaluation Report
Iftikhar Cheema, Simon Hunt, Sarah Javeed, Tanya Lone, Sean O’Leary

Benazir Income Support Programme: Final Impact Evaluation Report
This assessment is being carried out by Oxford Policy Management. The project manager is Sean O’Leary.The remaining team members are Shafique Arif, Iftikhar Cheema, Sarah Javeed and Tanya Lone For furtherinformation contact Sean O’Leary [[email protected]]
The contact point for the client is Dr Shujaat Farooq [[email protected]]
Oxford Policy Management Limited Level 3, Clarendon House Tel +44 (0) 1865 207 30052 Cornmarket St Fax +44 (0) 1865 207 301Oxford OX1 3HJ Email [email protected]
Registered in England: 3122495 United Kingdom Website www.opml.co.uk
© Oxford Policy Management i
Preface

Benazir Income Support Programme: Final Impact Evaluation Report
© Oxford Policy Management ii
Executive summaryThis report presents the findings from the quantitative and qualitative research conducted forthe 3rd round of the impact evaluation of the Benazir Income Support Programme (BISP). Itspurpose is to provide an analysis of the impact of the BISP five years after the programme wasinitiated.
The impact evaluation has both a quantitative and qualitative component and this research isbased on a set of fieldwork that was conducted in the period February to May 2016.
The evaluation is based on a mixed methods approach. The core of the evaluation is based on ahousehold survey targeted at beneficiary households and a sub-set of non-beneficiary householdswith BISP poverty scores just above the programme’s eligibility threshold, which will providestatistically robust estimates of impact of the BISP on its beneficiaries. This is combined with aqualitative research component that will provide a broader understanding of the context in whichthe programme is operating and inform an understanding of potential impacts that are difficult tocover comprehensively and sensitively using only a quantitative survey, as well as providing morenuanced data to help explain the quantitative findings.
Structure of the report
The report is structured in five parts. Part A provides a background to the BISP as well as adescription of the methods used for evaluation. Part B provides an analysis of the experience ofBISP beneficiaries in terms of how they receive the cash transfer. Part C provides a trend analysisof key characteristics of all BISP beneficiaries in the evaluation sample. Part D presents the impactevaluation results for the third round, focussing on the evaluation treatment and control groupsrelevant for the Regression Discontinuity analysis. Part E offers concluding thoughts.
Benazir Income Support Programme
The BISP is the main social assistance programme in Pakistan and one of the largest in SouthAsia, serving 5.29 million beneficiaries. The Government of Pakistan launched the BISP in 2008 asits flagship national social safety net initiative, in recognition that the existing instruments (PakistanBait-ul-Mal and Zakat) had limited coverage and were poorly targeted.
The BISP was launched with two main objectives: to cushion the adverse impact of the food,fuel and financial crisis on the poor; and a longer term objective of providing a minimumincome support package to the poorest and to those most vulnerable to future shocks.
The programme provides eligible families with unconditional cash transfers (UCT), originally set ata monthly value of PKR 1,000, raised to PKR 1,200 in July 2013, PKR 1,500 in July 2014 and PKR1,566 in July 2015. The transfer is delivered quarterly, with the vast majority of beneficiariesreceiving cash through the BISP Debit Card.
By providing access to Computerised National Identity Cards (CNIC) and making BISP paymentsto the female head of beneficiary households the BISP made explicit the goal of theempowerment of women, which is complemented by the creation of BISP BeneficiaryCommittees (BBC) that provide a forum for beneficiaries.
The programme established a National Socio-Economic Registry (NSER) through the use ofan objective targeting system, with households targeted based on a Proxy Means Test (PMT)that attempts to provide an objective estimation of the level of income and welfare in all households

Benazir Income Support Programme: Final Impact Evaluation Report
© Oxford Policy Management iii
in Pakistan and is summarised by the BISP poverty score. The NSER is now a database of morethan 27 million households across Pakistan. The cash transfer is targeted at the poorest 25% ofthe population with a specific eligibility threshold set on the BISP poverty score to assignhouseholds as eligible for the BISP cash transfer.
The evaluation
The BISP includes an evaluation component and the Government of Pakistan hascontracted Oxford Policy Management (OPM) to undertake a rigorous evaluation ofprogramme impact. The evaluation component will help to determine the effectiveness of theprogramme in delivering its broad aims. The evaluation component will also help to informstakeholders of the programme’s performance and enable lessons to be drawn to improve futurepractice and policy.
The evaluation gathers and presents data on the targeting and operational effectiveness of theBISP as well as on the following potential impacts:
Key intended impacts Increased consumption expenditure and poverty reduction; Women’s empowerment; Increased household and child nutrition security; and Increased asset retention and accumulation.
Secondary impacts Increased household investment in health and education; Changes to household livelihood strategies
Evaluation methods
The evaluation adopts a mixed methods approach to provide an assessment of the impactof the BISP on its beneficiaries across a range of impact areas and indicators that wereidentified collaboratively with the BISP and its key stakeholders.
The core of the evaluation is based on a large scale household survey across the four evaluationprovinces; Punjab, Sindh, Khyber Pakhtunkhwa and Balochistan. The quantitative study iscomplemented by qualitative research to provide contextual information as well as toprovide some insight into potential impacts that are less easily quantifiable.
The impact evaluation results presented in this report are based on a comparison betweena set of treatment households against a set of control households. Treatment households aredefined as households who have been identified as beneficiaries of the programme. Controlhouseholds are defined as non-beneficiaries of the programme, but who have BISP poverty scoresthat are just above the programme’s eligibility threshold.
The quantitative estimates of impact are determined by the quasi-experimental RegressionDiscontinuity (RD) design. Essentially this requires the comparison of treatment and controlhouseholds who have BISP poverty scores in the very close neighbourhood of the BISP eligibilitythreshold. It can be assumed that households who have very similar poverty scores but lie oneither side of the BISP eligibility threshold will make good comparator households on which to basethe evaluation.

Benazir Income Support Programme: Final Impact Evaluation Report
© Oxford Policy Management iv
A brief description of the method can be found in Section 2.2, whilst full details of the method, itsassumptions and their implications can be found in Annex A
Experience of beneficiaries with the transfer
Beneficiaries are expected to receive a total of PKR 18,800 annually in quarterly instalments. Inour evaluation sample beneficiaries self-reported that 87% of beneficiaries received at least threeof the four expected payments, receiving on average PKR 13,906 in the 12 months preceding thesurvey.
Beneficiaries reported that the direct costs of collecting the transfer remain relatively low,amounting to just 2% of the value of the quarterly transfer, with beneficiaries taking on average justover half an hour to reach a collection point. However, almost 20% of beneficiaries reported thatthey could not withdraw cash on their first attempt leading to them making multiple trips. Themain reasons cited for this phenomenon were long queues or a lack of funds at the collection point.
Some beneficiaries reported indirect costs of collecting the transfer, with 18% of beneficiariesreporting that they had to unwillingly pay a “fee” to collect the transfer. Results from thequantitative survey suggested that this was usually to guards or staff at the collection point.
Despite only a third of beneficiary women reporting that they collected their transfer themselves,over three quarters reported that they retained control over how the BISP cash transfer wasspent. Qualitative research indicates that men and women in BISP households are accepting the“woman focussed” nature of the BISP.
Profile of a beneficiary household
Given that the estimates of impact are based on a regression discontinuity that focusses only onhouseholds in close proximity of the BISP poverty score eligibility threshold, we present in Section4 a short profile of a beneficiary household. The purpose of this section is to provide the readerwith a snapshot of the current situation of a beneficiary household and should not be used todetermine the impact of the BISP on key impact indicators.
We find that high proportions of beneficiary households are poor or remain vulnerable to povertywhether assessed from a monetary poverty perspective or a multi-dimensional povertyperspective. We assess the deprivations that the average beneficiary household faces, and findhigh deprivations against a range of dimensions, including:
- Education: just 69% of boys and 59% of girls aged 5-12 years old were currently attendingschool at the time of the survey;
- Nutrition: we find severe rates of malnutrition amongst infants and young children aged 0-59 months, with levels of wasting and stunting that are at emergency levels;
- Access to safe drinking water and sanitation: we find high levels of deprivations interms of water and sanitation, with 38% of beneficiaries lacking access to improved toiletsand 17% lacking access to safe drinking water; and
- Housing conditions: we find large deprivations on indicators relating to the condition ofthe house with 63% of households having earth floors and 71% using cooking fuels that areassociated with harmful health effects.

Benazir Income Support Programme: Final Impact Evaluation Report
© Oxford Policy Management v
Poverty and consumption expenditure
The BISP has continued to have an effect on increasing per adult equivalent monthly level ofconsumption expenditure of BISP beneficiary households, with this round of research reportingan increase of PKR 187.
The Government of Pakistan has adopted in May 2016 a new approach to calculating the povertyline in Pakistan, changing from a Food Energy Intake (FEI) approach to a Cost of Basic Needs(CBN) approach. This change combined with a recalibration of the basic basket of consumptionneeds has increased the poverty line by 33%.
The impact on poverty depends on which poverty line is used as a reference. Using the FEIpoverty line the BISP reduces the poverty rate by 7 percentage points but has only a weak impacton the poverty gap. Using the CBN poverty line as a reference we find that the BISP is associatedwith a reduction in the poverty gap by 3 percentage points, but does not have a statisticallysignificant impact on the poverty rate.
This finding results from the large increase in the poverty line resulting from the adoption of theCBN methodology. With the CBN poverty line the average poverty gap is PKR 496, with theaverage per adult equivalent monthly value of the transfer of PKR 270 insufficient to pushsignificant numbers of beneficiaries above the poverty line when poverty is referenced in this way.
Food consumption and nutrition
We find some evidence that the BISP is leading to an increase in per adult equivalentmonthly food consumption (PKR 69), driven by high quality protein which can be expected tolead to significant improvements in the quality of diet.
In terms of child nutrition we find that the BISP has led to a reduction in the proportion of girls, butnot boys, that are wasted. However, we continue to observe levels of wasting and stunting thatthe World Health Organisation would classify as signifying an on-going crisis in terms ofchild malnutrition.
Living standards
The beneficiary profile notes significant deprivations against indicators of living standards amongstthe average BISP beneficiary household. However, we find that BISP has led to a decrease inthese deprivations particularly in terms of the quality of flooring in their households and thequality of cooking fuel used.
Women’s empowerment
We observe that the BISP has continued to influence a change in the way women are viewed inthe household and in the community with most beneficiary women noting that they are nowgiven an elevated status within the household as a direct result of the BISP.
For the first time we see a statistically significant effect on the mobility of beneficiary women,with more women being allowed to freely travel to various locales in their community alone. Thequalitative research notes a direct relationship between increased acceptance of mobility and thecollection of the transfer from BISP collection points, and further suggests the increasedindependence of beneficiary women may be extending to other women in their communities.

Benazir Income Support Programme: Final Impact Evaluation Report
© Oxford Policy Management vi
We find that the BISP is related to increasing proportions of beneficiary women voting, withthis result related to a variety of factors including the need for a Computerised National IdentityCard (CNIC) to access the transfer.
Livelihoods
We continue to observe a change in the livelihood strategies adopted by beneficiaries. We find thatthe BISP has contributed to an overall reduction in the dependence of beneficiaryhouseholds on casual labour as the main source of income.
This finding is driven by the finding that the BISP has resulted in a reduction in the proportionof men engaged in casual labour, with an associated increase in the proportion of men engagedin agricultural activities including caring for livestock. Simultaneously we observe that the BISP hasresulted in a reduction in the proportion of women engaged in unpaid family labour, andwhilst there is no clear evidence of what women are replacing this activity with, we find noevidence that they are stopping economically productive activities.
In line with the finding that increased proportion of men engaging with agricultural activitiesincluding caring for livestock, we find that the BISP has resulted in an increase in theproportion of beneficiary households that own small livestock including sheep and goats.
Potentially supporting this purchase of small livestock we find improving financial access amongbeneficiary households, with the BISP leading to an increase in the proportion of beneficiarieswith savings with the increase in savings being driven by an increase in formal savings.
Furthermore the qualitative research finds that women are reporting that they are beginning tomore carefully plan how they use the BISP cash transfer, indicating that at the beginning of theprogramme they used to “binge” on the transfer, but that this habit was changing as they got usedto receiving the cash.
Education
We do not find that the BISP cash transfer increases the proportion of beneficiary childrenattending school. Whilst beneficiaries recognise the importance of education in terms of securingbetter life outcomes for their children we find that the cost of education remains a significant barrierto access.

Benazir Income Support Programme: Final Impact Evaluation Report
© Oxford Policy Management vii
Table of contents
Preface iExecutive summary ii
Structure of the report iiBenazir Income Support Programme iiThe evaluation iiiEvaluation methods iiiExperience of beneficiaries with the transfer ivProfile of a beneficiary household ivPoverty and consumption expenditure vFood consumption and nutrition vLiving standards vWomen’s empowerment vLivelihoods viEducation vi
List of tables and figures ixList of abbreviations xiPart A: Background and Methods 11 Introduction 2
1.1 Overview of the BISP 21.2 Cash transfers: a conceptual framework 31.3 Overview of the evaluation 51.4 Structure of this report 6
2 Evaluation methods 72.1 Key measures of impact 72.2 Quantitative evaluation methods 82.3 Evaluation sample size and sampling strategy 102.4 Note on the interpretation of impact estimates tables 112.5 Qualitative research methods 12
Part B: Experience of receiving the transfer 163 BISP beneficiary experience 17
3.1 Frequency and value of payments 173.2 User costs related to the payment mechanism 233.3 Satisfaction with the payment mechanism 263.4 Control over BISP cash transfer 273.5 Use of the BISP cash transfer 29
Part C: Profile of a beneficiary household 314 Beneficiary profile 32
4.1 High rates of poverty 324.2 Poverty as a multi-dimensional concept 334.3 Beneficiaries face multi-dimensional deprivations 354.4 Main source of household income 40

Benazir Income Support Programme: Final Impact Evaluation Report
© Oxford Policy Management viii
Part D: Final impact evaluation results 425 Poverty, nutrition and material welfare 43
5.1 Household consumption expenditure and poverty 435.2 Non-food consumption expenditure 475.3 Food consumption expenditure 485.4 Child nutrition 505.5 Household assets 515.6 Living standards 52
6 Women’s empowerment 546.1 Access to resources 556.2 Agency 576.3 Achievements 58
7 Livelihoods 607.1 Main livelihood strategies 607.2 Labour participation 617.3 Livestock ownership 637.4 Access to finance 64
8 Access to education 67Part E: Conclusion 729 Conclusion 73
Mitigating poverty 73Using the BISP transfer in new ways 73Child nutrition remains a worry 74Contribution to changing livelihoods 74Unconditional cash does not impact education 74Building on impact observed in previous evaluation rounds 75
References 76Annex A Impact evaluation methods: technical appendix 80
A.1 Sensitivity testing 80A.2 Assumptions of RD 80A.3 Fuzzy regression discontinuity 83
Annex B RD sensitivity tables: technical appendix 84Annex C Consumption expenditure and poverty: technical appendix 89
C.1 Regional and intra-survey temporal price deflator 90C.2 Poverty line 90
Annex D Sampling: technical appendix 91Annex E Multi-dimensional poverty: technical appendix 93Annex F Local Average Treatment Effect 96Annex G Districts visited for quantitative survey 98

Benazir Income Support Programme: Final Impact Evaluation Report
© Oxford Policy Management ix
List of tables and figuresFigure 1 BISP theory of change ...................................................................................................... 4Figure 2 Graphical representation of Regression Discontinuity ....................................................... 9Figure 3 Number of transfers received per beneficiary in last 12 months ...................................... 18Figure 4 Value of the transfer received per beneficiary in last 12 months (self-reported)............... 19Figure 5 Amount received per beneficiary in last 12 months (BISP MIS)....................................... 20Figure 6 Per adult equivalent monthly value of transfer per household ......................................... 21Figure 7 Transfer as a proportion of per adult equivalent monthly consumption expenditure ........ 22Figure 8 Per adult equivalent value of transfer as proportion of consumption expenditure ............ 23Figure 9 Reasons for not collecting last transfer on first attempt ................................................... 25Figure 10 Who are fees paid to? ................................................................................................... 26Figure 11 Satisfaction with the way in which cash is collected ...................................................... 27Figure 12 Who in the household collects the transfer?.................................................................. 28Figure 13 Who decides how to use BISP cash?............................................................................ 29Figure 14 Poverty rates of BISP beneficiaries ............................................................................... 33Figure 15 Proportion of BISP beneficiary households who are multi-dimensionally poor............... 35Figure 16 BISP beneficiary deprivation per indicator..................................................................... 36Figure 17 School enrolment for children aged 5-12 year olds ....................................................... 37Figure 18 Malnutrition rates for children aged 0-59 months........................................................... 38Figure 19 Rates of diarrhoea and immunisation amongst children younger than 5 years.............. 39Figure 20 Main source of income.................................................................................................. 40Figure 21 Per adult equivalent value of consumption expenditure................................................. 46Figure 22 Food consumption score............................................................................................... 49Figure 23 Education levels of beneficiary women.......................................................................... 56Figure 24 Reasons for not attending school .................................................................................. 69Figure 25 Education expenditure as a proportion of GDP ............................................................. 70Figure 26 Density of BISP poverty score at eligibility threshold (matched MIS scores) ................. 81Figure 27 Discontinuity in probability of treatment ......................................................................... 82Figure 28 Construction of the BISP MPI........................................................................................ 93
Table 1 Key impact areas and indicators ........................................................................................ 7Table 2 Total evaluation sample size ............................................................................................ 11Table 3 Interpretation of impact estimate tables............................................................................ 11Table 4 Research districts............................................................................................................. 12Table 5 Tools used per district ...................................................................................................... 13Table 6 Costs associated with collecting transfer .......................................................................... 23Table 7 Reported use of the BISP cash transfer ........................................................................... 30Table 8 Household consumption expenditure and poverty: impact estimates................................ 44Table 9 Non-food consumption: impact estimates......................................................................... 47Table 10 Food consumption: impact estimates ............................................................................. 48Table 11 Child nutrition: impact estimates..................................................................................... 50Table 12 Child immunisation and diarrhoea: impact estimates...................................................... 51Table 13 Asset ownership: impact estimates ................................................................................ 52Table 14 Deprivations on living standards: impact estimates ........................................................ 53Table 15 Women’s access to money: impact estimates ................................................................ 55Table 16 Women voting: impact estimates.................................................................................... 57Table 17 Female mobility: impact estimates.................................................................................. 58Table 18 Household main livelihood source: impact estimates...................................................... 61Table 19 Labour participation: impact estimates ........................................................................... 62Table 20 Livestock: impact estimates............................................................................................ 64Table 21 Financial access: Impact Estimates................................................................................ 65Table 22 Education: Impact Estimates .......................................................................................... 68Table 23 Household consumption expenditure and poverty: RD sensitivity tables ........................ 84Table 24 Non-food consumption expenditure: RD sensitivity tables .............................................. 84Table 25 Food consumption expenditure: RD sensitivity tables..................................................... 85

Benazir Income Support Programme: Final Impact Evaluation Report
© Oxford Policy Management x
Table 26 Asset ownership: RD sensitivity tables ........................................................................... 85Table 27 Deprivations in living standards: RD sensitivity tables .................................................... 85Table 28 Women’s access to money: RD sensitivity tables........................................................... 86Table 29 Deprivations in living standards: RD sensitivity tables .................................................... 86Table 30 Women voting: RD sensitivity tables .............................................................................. 86Table 31 Female mobility: RD sensitivity tables ............................................................................ 86Table 32 Household main livelihood source: RD sensitivity tables ................................................ 87Table 33 Labour participation: RD sensitivity tables ...................................................................... 87Table 34 Livestock ownership: RD sensitivity tables ..................................................................... 87Table 35 Savings: RD sensitivity tables ........................................................................................ 88Table 36 Education: RD sensitivity tables ..................................................................................... 88Table 37 Total evaluation sample size .......................................................................................... 91Table 38 Dimensions of MPI poverty............................................................................................. 94Table 39 Household characteristics by BISP poverty score .......................................................... 96Table 40 Districts visited for quantitative survey household sample size....................................... 98
Box 1 Multi-dimensional poverty index 34

Benazir Income Support Programme: Final Impact Evaluation Report
© Oxford Policy Management xi
List of abbreviationsBISP Benazir Income Support Programme
CBN Cost of Basic Needs
CCT Conditional Cash Transfer
CNIC Computerised National Identity Card
FCS Food Consumption Score
FEI Food Energy Intake
LATE Local Average Treatment Effect
MDE Minimum Detectable Effect
MDGs Millennium Development Goals
MGRS Multicentre Growth Reference Study
MNA Member of the National Assembly
OPM Oxford Policy Management
PMT Proxy Means Test
PPS Probability Proportional to Size
PSLM Pakistan Social and Living Standards Measurement Survey
PRSP Poverty Reduction Strategy Paper
PSM Propensity Score Matching
PSU Primary Sampling Unit
RD Regression Discontinuity
SRS Simple Random Sampling
UCT Unconditional Cash Transfer
WHO World Health Organisation

Benazir Income Support Programme: Final Impact Evaluation Report
© Oxford Policy Management 1
Part A: Background and Methods

Benazir Income Support Programme: Final Impact Evaluation Report
© Oxford Policy Management 2
1 IntroductionThis report represents the findings from the quantitative and qualitative evaluation conducted forthe third and final follow-up round of the independent impact evaluation of the Benazir IncomeSupport Programme (BISP). Its purpose is to provide an analysis of the impact of the BISP on itsbeneficiaries in the 5 year period since the inception of the programme in its current form.
The impact evaluation has both quantitative and qualitative components and the research in thisreport reflects the findings from the final round of field work undertaken in February – May 2016.
The evaluation is based on a household survey. The survey is targeted at beneficiary householdsand a sub-set of non-beneficiary households. Sampled non-beneficiary households have BISPpoverty scores just above the eligibility threshold. The quantitative household survey is combinedwith qualitative research that provides a broader understanding of the context in which theprogramme is operating and enables an assessment of impacts that are difficult to sufficientlyanalyse using only a quantitative survey.
1.1 Overview of the BISP
The BISP was launched in 2008 as the Government of Pakistan’s (GoP) main national socialsafety net programme and is the largest and most systematic social protection initiative to belaunched in Pakistan. The immediate objective of the programme in 2008 was to cushion thenegative effects of the food, fuel and financial crises on the poor, but its longer termobjectives are to provide a minimum income package to the poor and to protect thevulnerable population against chronic and transient poverty.
The BISP cash transfer is targeted using a Proxy Means Test (PMT). A PMT provides anobjective method of approximating a household’s level of welfare and poverty using a sub-set ofindicators correlated with measures of monetary welfare. This is combined into a unique index toidentify poor and non-poor households.
Armed with this PMT the GoP conducted a national poverty census which attempted to visit everyhousehold in Pakistan to implement the BISP poverty scorecard and assign each household with apoverty score. An eligibility threshold was set to target the poorest 20% of households in Pakistan.Households with a PMT score below this threshold containing at least one ever-marriedwoman in possession of a valid Computerised National Identify Card (CNIC) were deemedeligible for the BISP.
The programme provides eligible families with an unconditional cash transfer (UCT). Recognisingthe goal of promoting women’s empowerment the transfer is paid directly to the female head ofthe family, where the female head is defined as every ever-married woman in the household inpossession of a valid CNIC.
The value of the cash transfer has increased steadily throughout the lifetime of the BISP cashtransfer. Originally the BISP had a monthly value of PKR 1,000. This increased to PKR 1,200 witheffect from July 2013, and then increased further to its current monthly value of PKR 1,500 witheffect from July 2014.
Beneficiaries are paid in quarterly transfers of PKR 4,500, with the vast majority of BISPbeneficiaries receiving their payments through the BISP Debit Card, a magstripe card that can beused in any ATM in Pakistan or at any of the network of Point of Sale (POS) machines maintainedby banking agents. A small portion of BISP beneficiaries, particularly those in remote communities

Benazir Income Support Programme: Final Impact Evaluation Report
© Oxford Policy Management 3
with limited financial system access, continue to receive the transfer via money orders delivereddirectly to the doorstep by Pakistan Post.
1.1.1 Waseela-e-Taleem
In addition to the main unconditional cash transfer component, the BISP also implements a rangeof complementary programmes. This includes the Waseela-e-Taleem (WET) programme aconditional cash transfer (CCT) programme for education. The 2016 round of researchincluded an evaluation of the WET programme, focussed on the impact of the WET on access of 5– 12 year old children. These findings are presented in an accompanying report.
The WET programme provides a top up cash transfer of PKR 750 in each quarter per eligible childin the household, with no upper limit on the number of children per household who are eligible forthe programme. Receipt of the WET transfer is conditional on maintaining a minimum 70%attendance rate that is monitored on a quarterly basis, and children will be removed from theprogramme if they fail to fulfil the attendance conditions in three consecutive quarters.
1.2 Cash transfers: a conceptual framework
The theory of change supporting the two main objectives of the BISP is presented in Figure 1below. In the short term, through the provision of a regular and supplementary cash income, BISPwould support basic consumption needs, and protect households from fluctuations in prices ofnecessities.
In the longer term BISP payments would allow beneficiary households at their own discretion tomake ‘desirable’ investments in nutrition, education, health, productive assets, among others.These investments in human and physical capital in turn would be expected to support poorhouseholds to permanently graduate out of poverty. There is an ever growing body of evidence onthe effectiveness of UCTs in addressing not only poverty mitigation but also long-term povertyreduction and human development goals (such as increased school enrolment, child nutrition andwomen’s empowerment)1.
1 Hanlon, Barrientos and Hulme (2010) provide a useful summary of the evidence of impact of unconditional cashtransfers

Benazir Income Support Programme: Final Impact Evaluation Report
© Oxford Policy Management 4
Figure 1 BISP theory of change2
However, the ability of an unconditional cash transfer such as the BISP to move beyond povertymitigation to achieve long-term poverty reduction and human development goals depends cruciallyon a range of contextual, design and implementation features (adapted from DFID, 2011):
Value of the transfer relative to the initial incidence and depth of poverty. To enablehouseholds to use the transfer for anything more than poverty mitigation it must be ofsufficient value that allows them to not only meet their basic subsistence needs but also toleave some left over for savings and for investment in human and productive capital.
Targeting effectiveness in terms of how successful the transfer is in actually identifyingthe poorest and most vulnerable. Impact on poverty and human development will be dilutedif there is significant leakage to non-poor households.
Duration and trust in the programme. The cash transfer should be delivered for sufficienttime for households to make the step-wise changes needed for a permanent graduationfrom poverty. In addition, the programme should be sufficiently well implemented such thathouseholds can trust in a regular and reliable transfer and allow them to incorporate it intothe planning of their household budget and their planning of future investments.
Functioning public services and complementary interventions in which householdscan invest. Even if households are knowledgeable of the returns to investment in humancapital such as education, a cash transfer can have only limited impact if beneficiaries donot have access to functioning public services or other interventions complementary topoverty reduction. This emphasises that a cash transfer such as the BISP is not a ‘magicbullet’ for poverty reduction and human development, but must be considered as one pillarof a broader set of services provided to a population.
2 Adapted by authors from DSD, SASSA and UNICEF(2012) and DFID (2012)

Benazir Income Support Programme: Final Impact Evaluation Report
© Oxford Policy Management 5
Functioning markets including for financial services, labour, assets and productionoutputs. Beneficiary households may be expected to leverage a cash transfer to makestepwise changes that allow their level poverty to be diminished and eventually eliminated.However, this is crucially dependent on such households having access to functioningmarkets that enable the opportunity to save, borrow, work and sell home-production,amongst others. Key market failures will prevent households from diversifying intopotentially higher return activities and graduating out of poverty.
This evaluation will provide some understanding of the impact of the BISP as well as thepotential influence of contextual, design and implementation factors that drive or hinder thisimpact.
1.3 Overview of the evaluation
The BISP includes an evaluation component and the GoP has contracted Oxford PolicyManagement (OPM) to undertake a rigorous evaluation of the programme’s impact. The evaluationcomponent will help to determine the relevance and effectiveness of the programme in deliveringits broad aims of cushioning the negative effects of recent economic crises as well as protectingPakistan’s vulnerable population from chronic and transient poverty. The evaluation component willalso help to inform stakeholders of the programme’s performance and enable lessons to be drawnto improve future practice and policy.
To provide context to the estimates of programme impact, the evaluation gathers data on thebeneficiary experience with the programme operations including community perception oftargeting, the beneficiary experience with payments mechanism and user costs of accessing thepayments.
The core of the report is focused on determining BISP programme impact on the following:
Key intended impacts Increased consumption expenditure and poverty reduction; Women’s empowerment; Increased household food consumption and child nutrition; and Increased asset retention and accumulation.
Secondary impacts Increased household investment in health and education; Decreased vulnerability to shocks; Changes to informal inter-household transfers; and Changes to household livelihood strategies
In order to assess these impacts, the evaluation collects quantitative and qualitative information ona range of key indicators and supporting data. The impact analysis is conducted using a mixedmethods approach, combining qualitative research with a quasi-experimental quantitative surveydesign.
The quantitative survey is implemented in 458 clusters (villages & neighbourhoods) across 90districts of the four evaluation provinces: Punjab, Sindh, Khyber Pakhtunkhwa and Balochistan. Forthe final evaluation survey, a new sample of households was drawn directly from the BISP MIS inorder to better target the sample of beneficiary and non-beneficiary households that could be usedfor the quasi-experimental Regression Discontinuity approach described in Section 2.

Benazir Income Support Programme: Final Impact Evaluation Report
© Oxford Policy Management 6
In total a randomly selected sample of 9,317 households were interviewed, of which 5,300 areBISP beneficiary households. The fieldwork for the final quantitative round of fieldwork wasconducted in the period February – April 2016.
Qualitative research has taken place in twelve districts in each round of study, purposively selectedfrom the four evaluation provinces to provide a range of different contexts. Data collection for thefinal follow-up round of qualitative research was conducted in March and April of 2016.
The measure of programme impact presented in this report derives from a comparison ofbeneficiary households with BISP poverty scores in close proximity to the eligibility threshold score,with a set of non-beneficiary households with BISP poverty scores with the same proximity to theeligibility threshold score. The situation of these households is compared using the quasi-experimental approach known as a Regression Discontinuity (RD) Design.
1.4 Structure of this report
This report is structured as follows:
Part A includes Section 2 which describes the evaluation methodology.
Part B includes Section 3 which presents an analysis of the BISP beneficiary experience withreceiving the BISP cash transfer.
Part C includes Section 4 which presents a profile of beneficiary households based on allbeneficiary households in the same and not just those who are used for the RegressionDiscontinuity Impact Estimates presented later I n this report.
Part D presents in the impact evaluation results Section 5 analyses the impact of the BISP onpoverty, household food and non-food consumption, child nutrition, household assets anddeprivations on living standards. Section 6 provides a discussion of the impact of the BISP onwomen’s empowerment. Section 7 provides an analysis of the impact of the BISP on thelivelihoods adopted by beneficiary households. Section 8 considers the impact on education.
A technical annexure is provided detailing the evaluation methodology.

Benazir Income Support Programme: Final Impact Evaluation Report
© Oxford Policy Management 7
2 Evaluation methodsThis evaluation adopts a mixed method approach to provide an assessment of the impact of theBISP on its beneficiaries across a range of impact areas and their indicators. These indicators andareas of impact as well as the particular methods employed in the evaluation were identified incoordination with BISP and its stakeholders during the inception phase of the evaluation. Below webriefly summarise the key research questions and areas of impact, the quantitative evaluationmethods as well as the qualitative assessment of impact.
The quantitative impact assessment will compare a set of treatment households against a set ofcontrol households to measure the impact of the BISP cash transfer on beneficiary householdsover a range of indicators described in Table 1.
Treatment households are defined as households who have been identified as beneficiaries of theprogramme. Control households are defined as non-beneficiary households but who have povertyscores as determined by the BISP poverty scorecard that are just above the programme’s eligibilitythreshold.
2.1 Key measures of impact
The evaluation measures a range of quantitative indicators across a number of different impactareas, which are detailed in Table 1 along with a description of the hypothesis behind which theBISP cash transfer can feasibly induce an impact.
Table 1 Key impact areas and indicators
Area ofimpact Hypothesis Quantitative indicators
Key intended impact
Consumptionexpenditureand poverty(Section 5)
BISP programme will reduce the rateof poverty amongst beneficiaryhouseholds, by directlysupplementing monthly householdincome
Proportion of beneficiary households below the poverty line Per adult equivalent consumption expenditure
Women’sempowerment(Section 6)
A transfer targeted directly at womenwill increase their agency in variousdomains including: control overhousehold resources, engagement inpublic life, role in household decisionmaking
Percentage of female beneficiaries who retain control over thetransfer
Percentage of women working outside the home Women’s participation in choices relating to household, both
relating to short- and long-term decisions.
Householdconsumptionand childnutrition(Section 5)
Regular and reliable payments willimprove access to food bysupplementing household incomes,tackling one of the pillars of foodinsecurity3.
Per adult equivalent food consumption expenditure Child anthropometry
Assetretention andaccumulation(Section 5.5)
Beyond being used for currentconsumption households will be ableto save some portion of the transferand use it for asset accumulation
Ownership of livestock Ownership of productive household assets
Secondary impacts
Investment ineducation(Section 8)
A direct cash transfer will alleviate theeconomic constraints to the access ofhealth and education services
Primary school enrolment rate
3 This recognises that the BISP cannot address all root causes of food insecurity including the stability of food supply, theavailability of food and the way in which food is utilised.

Benazir Income Support Programme: Final Impact Evaluation Report
© Oxford Policy Management 8
Area ofimpact Hypothesis Quantitative indicators
Livelihoodstrategies(Section 7)
BISP will provide households theopportunity to explore alternativelivelihood strategies and reduce theirdependence on risky options
Proportion of working age population economically active Proportion of economically active population by employment
status
2.2 Quantitative evaluation methods
A key challenge for any impact evaluation is the identification of a suitable counterfactual orcontrol group against which to compare impact of a programme on beneficiary households or thetreatment group. A valid control group should satisfy three conditions, Gertler et. al. (2011):
The treatment and control group should share on average the same characteristics;
Treatment and control groups should react to the programme in the same way if it wasindeed offered to both groups; and
Treatment and control groups should not be differentially exposed to other interventionsduring the period of the evaluation.
The quantitative evaluation employs the Regression Discontinuity (RD) design to meet thischallenge. It exploits one of the key design features of the BISP, its beneficiary targeting throughthe BISP poverty scorecard, to achieve this. BISP beneficiaries have their programme eligibilitydetermined by the BISP poverty score such that treatment will be offered only to households with ascore of 16.17 or less. Households with a BISP poverty score above 16.17 are ineligible.
Under the assumption of a continuous relationship between the eligibility score (BISP povertyscore) and the outcome variable we exploit the eligibility cut-off to define valid treatment andcontrol groups. Figure 2 graphically presents the logic behind this approach. We comparehouseholds just below the eligibility threshold (treatment households) with households justabove the eligibility threshold (control).
For indicators on which the BISP does not have an impact we would expect no difference in theoutcome indicator of interest between treatment and control households. In terms of the RDapproach, for such outcome indicators we would find no discontinuity in the outcome variable atthe eligibility threshold.
Alternatively, for indicators on which the BISP has an impact and assuming that only householdsbelow the eligibility threshold receive the transfer, we would expect to find a discontinuity in theoutcome variable at the eligibility threshold. Such a discontinuity, should it be statisticallysignificant, will represent the impact of the BISP cash transfer on that outcome variable.
A full description of the RD approach and various tests of the validity of the approach for thisevaluation can be found in the annexure.

Benazir Income Support Programme: Final Impact Evaluation Report
© Oxford Policy Management 9
Figure 2 Graphical representation of Regression Discontinuity
2.2.1 ‘Fuzzy’ RD design
The discussion above assumes that a ‘sharp’ RD is possible, which means that actual treatmentstatus should perfectly match the eligibility of a household, i.e. a household that is determined aseligible for the BISP should actually become a beneficiary and a household that is determined asineligible for the BISP should not.
However, we find in our sample that this is not the case. For example, in some cases programmerules stipulate it is possible to become a beneficiary with a higher eligibility cut-off score, such as inthe case of a disability. We therefore implement the Fuzzy RD (FRD) approach, where thetreatment effect can be recovered by dividing the jump in the relationship between the outcomevariable of interest and the BISP poverty score, by the jump in the relationship between thetreatment status and the BISP poverty score. FRD will provide an unbiased estimate of the localaverage treatment effect (LATE). Full technical details of this approach can be found in theannexure.
2.2.2 RD provides a Local Average Treatment Effect
Given that the RD approach analyses only households in very close proximity to the eligibilitythreshold its estimate of impact is a Local Average Treatment Effect (LATE). This means thatwhilst the RD approach has strong internal validity4, in that it provides robust estimates of impactfor the set of households on which it is implemented it has weaker external validity, in terms of itsapplicability to households further away from the eligibility threshold.
4 The annexure presents and tests the assumptions of the RD approach to demonstrate this.
Out
com
e in
dica
tor o
f int
eres
t
11.17 16.17 21.17BISP Poverty Score
(A) No Impact
Out
com
e in
dica
tor o
f int
eres
t11.17 16.17 21.17
BISP Poverty Score
(B) Impact
Notes: **Graphics presented her are for explanatory purposes onlyGraphics represent a sharp discontinuity which tend to underestimate the true fuzzy discontinuity estimates of impact reported in impact tablesRD treatment households to the left of the eligibility cut-off, RD control household to the right of eligibility cut-off
Graphical representation of RD(Sharp): **

Benazir Income Support Programme: Final Impact Evaluation Report
© Oxford Policy Management 10
In essence we might expect that beneficiary households that are very close to the eligibilitythreshold are somehow different from beneficiary households at lower ranges of the BISP povertyscore. This expectation and its implications are explored in Annex F.
2.3 Evaluation sample size and sampling strategy
In order to implement the RD approach a complex multi-stage sampling strategy was required toidentify our treatment and control groups. A number of contextual factors at the time of the baselinesurvey influenced the sampling strategy. Primary amongst these was the requirement to conductthe baseline survey before any payments had been made to BISP beneficiaries.
At the time of the baseline survey the BISP poverty census was still on-going. Under idealcircumstances the evaluation would have waited for the poverty census to complete and sampletreatment and control households directly from this census. However, implementation of thepoverty census was not synchronised across evaluation provinces with the implication thatpayments would begin in some districts before the census had been completed in others5.
This meant that evaluation households were identified separately as potential treatment andcontrol households based on a household listing exercise conducted in evaluation communities byOPM prior to the BISP baseline evaluation survey. In this household listing exercise an exactreplica of the BISP poverty scorecard was delivered to all households in evaluation communities toapproximate as closely as possible their actual BISP poverty score (as determined by the BISPpoverty census) and assign them to treatment and control groups.
The consequence of this approach meant that when evaluation households were matched to theBISP Management Information System (MIS) via the number on the Computerised NationalIdentity Card (CNIC) to identify their actual poverty score, not all households in the originalevaluation sample were in the appropriate BISP poverty score range for the RD analysis.
To bolster the sample size of households in the appropriate RD analysis range, a re-samplingexercise was conducted in 2016 for the final round of the evaluation survey to draw new treatmentand control households for interview in existing research communities. The total sample size forthe final round of evaluation of this independent evaluation is presented in Table 2
Table 2 presents the final sample size of 9,139 households that have been interviewed for thefinal round of evaluation. The sample is split between a total of 5,212 beneficiary households and3,927 non-beneficiary households. Of all beneficiary households 3,935 households are within theappropriate poverty score range for the RD analysis.
A full description of the sampling strategy adopted to draw this updated sample can be found inAnnex D and a list of all districts that were visited for the quantitative survey can be found in AnnexG.
5 The idea of a rolling baseline that would follow the delivery was tabled during the inception phase. However, this wouldhave required a detailed and confirmed workplan of the poverty census rollout, which was not possible given that thecensus was implemented by multiple third party implementers.

Benazir Income Support Programme: Final Impact Evaluation Report
© Oxford Policy Management 11
Table 2 Total evaluation sample size
Total beneficiariesBeneficiaries in RDrange
Non-beneficiaries Total households
Punjab 1,714 1,526 1,572 3,286
Sindh 1,860 1,191 1,147 3,007
KhyberPakhtunkhwa
1,286 948 889 2,175
Balochistan 352 2706 352 671
Total 5,212 3,935 3,927 9,139
Source: BISP impact evaluation survey 2016. Notes: BISP poverty score full range: 0 - 100
2.4 Note on the interpretation of impact estimates tables
We present our estimates of BISP impact in Sections 5 to Section 8. The estimates of impact arepresented using the same format as illustrated by Table 3 below. The following estimates arepresented:
(1) Mean values of the outcome indicator for treatment and control groups within the relevantRD bandwidth. These estimates have been weighted using a kernel weight which giveshigher weight to observations closest to the BISP eligibility cut-off.
(2) Sample sizes for treatment and control groups within the relevant RD bandwidth
(3) The RD difference-in-discontinuity estimate which provides the measure of BISP impact onkey impact indicators.
Table 3 Interpretation of impact estimate tablesControl Group Treatment Group
RDD impactestimate(3)
Mean(1) N(2) Mean(1) N(2)
Outcomeindicator
RD weighted valuefor control group
RD control groupsample size (sizewithin relevant RDbandwidth)
RD weighted valuefor treatment group
RD treatment groupsample size (sizewithin relevant RDbandwidth)
RegressionDiscontinuity impactestimate conductedon householdswithin RDbandwidth
Source: BISP impact evaluation survey 2016. Notes: (1) Asterisks (*) indicate that an estimate is significantly different to the relevanttreatment comparator: *** = 99%, ** = 95%, *=90%. (2) Point estimates are weighted using triangular weights (3) Sample sizes arebased on the sample size of treatment or control households within +/- 5 points of the eligibility threshold
6 Due to the small size of beneficiary households in Balochistan who are in the RD treatment bandwidth, caution shouldbe taken in interpreting the results of impact for households in Balochistan. A small treatment group sample size mightmean that we mistakenly report that there is no evidence of impact, when in actuality there is.

Benazir Income Support Programme: Final Impact Evaluation Report
© Oxford Policy Management 12
We also use stars (*) to present the statistical significance of a particular result. These can beapplied to third, sixth, eighth and ninth columns. Three stars (***) will indicate a 99% level ofsignificance in a particular estimate. This would mean that we are 99% sure that an observeddifference in our sample (whether it is a change in an indicator over time or an estimate of impact)would actually be observed in reality (i.e. we are 99% sure that the estimate is not a false positive).
Therefore, if an estimate of programme impact (column 8) on a particular outcome indicator is nothighlighted by a star (*) then the BISP does not have a statistically significant impact on thatoutcome indicator.
2.4.1.1 Reporting means in impact tables
In all tables that include estimates of impact we report the sample means for both the control groupand the treatment group. These are presented to provide a situational analysis of the current statusagainst key indicators for both groups. However, caution should be taken in the analysis of meansand their comparison to the final reported RD estimate of impact.
Consider Panel B in Figure 2 above. It is clear that in this case the BISP has had a positive impacton the outcome indicator of interest, demonstrated by the positive discontinuity at the eligibilitythreshold. Despite this it is also clear that the overall mean of the outcome indicator is lower for thetreatment group (those with a BISP poverty score less than 16.17) than for the control group (thosewith a BISP poverty score of more than 16.17).
2.5 Qualitative research methods
2.5.1 Location sampling
The research focuses on 8 districts across four provinces, with two communities selected in eachdistrict. These were purposively selected. Three districts were WeT 2012 pilot districts: Noshki(Balochistan), Karachi (Sindh) and Malakand Protected Area (KPK). The remaining five districtsare amongst those where WeT was scaled up in 2015.
Table 4 Research districts
Province District
PunjabKhushab
Bahawalnagar
BalochistanNoshki*
Ziarat
KPMalakand Protected Area*
Charsadda
SindhKarachi South*
Sukkhur

Benazir Income Support Programme: Final Impact Evaluation Report
© Oxford Policy Management 13
*WET pilot districts (2012)
All sixteen communities were those where the programme had started during its inception yearsfrom 2008 to 2010 (14 communities), with two (one in Sukkhur and one in Khushab) where the roll-out was during 2011-12. With the exception of the latter two areas, two or more rounds of selectionhad been conducted with the latest disbursement in 2015-16 in the selected villages.
Waseela e Taleem is operational in twelve of the selected communities; while not in two villages ofZiarat (one in Bahawalnagar and other in Sukkhur).
2.5.2 Respondent sampling
The respondents for individual interviews were randomly sampled from BISP beneficiary lists forthe selected districts, focusing on beneficiaries who received BISP from 2009-12. FGDparticipants were selected with the help of community key informant and snowballing, with themain criteria of covering various geographical localities of the community including any multi-ethnic/religious characteristics in the area. In regard to non-beneficiary respondents, we focusedon people with similar socio-economic profiles as BISP beneficiaries (using community knowledgefor initial identification, followed by screening by the field teams).
Table 5 Tools used per district
District
(2communities)
Type of tools Respondent Number of tools
Household In-depth Beneficiaryhousehold
- 3 men
- 3 women
FGD Non-beneficiarymen and women
- 1 male FGDs
- 1 female FGDs
FGD Beneficiary menand women
- 1 men
- 1 women
Community keyinformant interviews
Communityinflue2tial
- 1 man
- 1 woman
A total of 48 beneficiary IDIs, 32 community FGDs and 16 KIIs will be conducted in the eightselected research districts.
2.5.3 Research tools
The research used a (semi) contextual inquiry approach using BISP as the context and its role inchanges over time. Data was gathered at three levels that is community key informant interviewsfor an overview of the community, focus group discussions with beneficiary and non-beneficiarymen and women for a community perspective on well-being and changes over-time and directedone-on-one interviews to gather information and understand the household members’ attitudes and

Benazir Income Support Programme: Final Impact Evaluation Report
© Oxford Policy Management 14
behaviour around consumption patterns, education of children and assets accumulation whileeconomic mobility and women’s empowerment will be cross-cutting themes.
Tools used for data gathering were as follows.
Data was collected using Focus Group Discussions (FGDs), Key Informant Interviews (KIIs) andIn-depth interviews (IDIs) as well as selected participatory tools focusing on specific areas of theresearch.
1. Key informant interviews
KIIs were carried out with one male and one female community member who had good generalknowledge about the community. This included the community pesh imam, school teacher, socialor political activist, Landlord/owner, LHW, LHV, TBA or any other person who understood the areaand could provide information. Key respondents were mainly asked about changes in, and theimpact of BISP (if any) on the social and economic conditions of the community; poverty status ofbeneficiary households; and gender-specific roles and responsibilities.
2. Focus group discussions
FGDs were conducted with both men and women to gather community level data from BISPbeneficiary and non-beneficiary households regarding the
Impact of BISP on household nutrition, education and health status; Risk-coping mechanisms and economic security; Gender roles and responsibilities; Decision making in context of household expenditure, education, health livelihood; and Collection of BISP transfer
3. Empowerment Ranking Exercise
A participatory tool was designed to analyse women’s experiences and perceptions of the factorsthat enable them to express their human agency. This exercise was undertaken with women fromboth beneficiary and non-beneficiary households. The ranking exercise encouraged femalerespondents to identify, discuss and list various activities/functions at the household level thatframe power relations and their capacity to make strategic choices, and to rank them according totheir importance. Respondents were also asked to relate the contribution (if any) of BISP to thechanges they identified.
4. Livelihood Matrix
The livelihood matrix was conducted with beneficiary and non-beneficiary men to assess thevarious sources of livelihoods in the area; community preferences for certain type of work andreasons for it; remunerations rates; changes in livelihood trends; and factors that have influencedthese changes including any direct or indirect impact of BISP cash transfer on communitylivelihoods.
5. In-depth interviews
In-depth interviews were carried out with BISP beneficiary women and men according to educationlevels7 of the respondents to assess whether education was a key determinant in women’s
7 Given the low educational attainment of BISP beneficiary women (on average), ‘high education’ represents womencompleting primary education and ‘low education’ represents women with no formal education.

Benazir Income Support Programme: Final Impact Evaluation Report
© Oxford Policy Management 15
empowerment (to test ‘agency’) and their attitudes and perceptions relating to genderempowerment. These interviews also gathered data on operational effectiveness of BISP. IDIswere also carried out with female respondents belonging to vulnerable households to uncoverpotential differences in findings for women headed or minority households.
2.5.4 Qualitative research focus
In order to analyse progress towards socioeconomic improvement, the research qualitativelyexplores BISP outcomes in the following indicator areas:
Household consumption- Women and children’s diet (food quality and quantity) and beneficiaries’ ability to purchase
and store food for future use;- Beneficiary access to basic utilities (water, electricity, fuel) and transport; and- Purchase of household goods (e.g. clothes and shoes)
Education- School enrolment and retention (focusing particularly on the girl child), and associated
change in parental beliefs and practices
Asset accumulation/ economic mobility- Livelihoods - change or expansion of income-generating activities;- Investment in productive assets (e.g. livestock, poultry, sewing machine);- Purchases that increase socio-economic status (e.g. bicycle, motorbike, etc.); and- Savings, loans and participation in insurance schemes
Women’s empowerment:- Women’s decision making and control over BISP cash; and- Change in female beneficiary mobility, confidence, self-esteem, decision making,
interpersonal relations, etc.

Benazir Income Support Programme: Final Impact Evaluation Report
© Oxford Policy Management 16
Part B: Experience of receiving the transfer

Benazir Income Support Programme: Final Impact Evaluation Report
© Oxford Policy Management 17
3 BISP beneficiary experience
In this section we report on the experience of beneficiaries with the transfer looking at thefrequency and value of payments, the costs associated with collecting the transfer and whomakes decision over how the transfer is used. The key findings are:
- Beneficiaries are expected to receive quarterly payments, for a total of PKR 18,800 peryear
- In the 12 months preceding the survey, 87% of beneficiaries received at least 3 of the 4expected payments
- Beneficiaries reported receiving on average a total of PKR 13,906 in the 12 monthspreceding the survey
- Direct costs of travel to the collection point are relatively low, amounting to 2% of thetotal value of the transfer
- Some beneficiaries reported having to unwillingly pay a “fee” to collect the transfer(18%), though this phenomenon is most prevalent in Sindh (33%)
- The majority of beneficiaries retain control over how the BISP cash transfer is normallyspent, even when it is collected by another household member
3.1 Frequency and value of payments
The value of the BISP transfer has steadily increased over the lifecycle of the BISP programme. Atthe inception of the BISP, the planned value of the transfer per beneficiary was PKR 1,000 permonth. This increased to PKR 1,200 per month with effect from the 1st of July 2013 and thenfurther increased to PKR 1,500 per month with effect from the 1st of July 2014.
Thus the relevant planned value of the transfer to be considered for reference in this evaluationreport in PKR 1,500 per month, for a total annual value of PKR 18,000.
3.1.1 Number of transfers received in the last 12 months per beneficiary
The BISP cash transfer has been designed to provide income support to poor and vulnerablehouseholds in a frequent and predictable manner. The frequency and predictability of the BISPcash transfer is important as this facilitates consumption smoothing, planning of expendituresand moderate risk-taking in anticipation of future rewards. (Daidone et. al., 2015).
BISP payments are made quarterly and each beneficiary is expected to receive a total of 4payments in an annual cycle. In the evaluation survey each beneficiary within a household wasasked how many payments she personally received in the last 12 months. Given that the timing ofthe evaluation survey (February 2016 – April 2016) may not precisely coincide with actual paymentdays we consider payments to be regular and in full if beneficiaries reported receiving atleast three payments in a 12 month cycle.

Benazir Income Support Programme: Final Impact Evaluation Report
© Oxford Policy Management 18
Figure 3 Number of transfers received per beneficiary in last 12 months
Figure 3 reports that on 87% of beneficiaries in the evaluation sample received at least threepayments in the last 12 months, using data that is self-reported by the beneficiaries. This finding isconsistent with those presented in the BISP Second Impact Evaluation Report (OPM, 2015) anddemonstrates that the BISP is continuing to make consistent payments to the vast majority of itsbeneficiaries.
There is, however, regional variation in this finding. In particular just 71% of beneficiaries inBalochistan had received at least three payments in the last 12 months. Beneficiaries inBalochistan were also the most likely to have reported not receiving a single payment in the last 12months. 12% of Balochi beneficiaries reported this to be the case, compared to a sample averageof 5%. This finding may be related to the lower reach of banking facilities in the province and thegreater distance of beneficiaries to those facilities (see Table 6 below).
3.1.2 Value of the transfer received in the last 12 months
Over the reference period of the 2016 survey each BISP beneficiary was expected to havereceived PKR 18,000 in an annual cycle spread evenly over four payments. However, asdiscussed above, the timing of the 2016 evaluation survey and its 12 month recall period may notprecisely coincide with the BISP payment schedule. Thus one would expect each beneficiary tohave received at least three quarterly payments for a total of PKR 13,500.
44
33
13
9
29
64
53
24
67
72
28
43
17
12
33
54
9
5
0
100
Perc
enta
ge o
f ben
efic
iarie
s
Punjab Sindh KP Balochistan Pakistan
Source: BISP Impact Evaluation Survey 2016
Beneficiaries are expected to have received one transfer per quarter in last 12 months
Number of transfers received in last 12 months (self-reported)
Four payments
Three payments
One or two payments
No payments

Benazir Income Support Programme: Final Impact Evaluation Report
© Oxford Policy Management 19
Figure 4 Value of the transfer received per beneficiary in last 12 months (self-reported)
Figure 4 demonstrates that in the 12 months preceding the 2016 evaluation survey on averagebeneficiaries had received PKR 13,906 or 77% of the PKR 18,000 that a beneficiary wouldexpect to receive in a 12 month period based on self-reported receipt of the transfer. This findingis in line with beneficiaries receiving at least 3 of the quarterly payments.
Balochistan continues to perform more poorly than other provinces, with beneficiaries inBalochistan receiving just PKR 12,387 or 69% of the expected transfer in the 12 monthspreceding the 2016 survey. This finding is consistent with Balochi beneficiaries receiving fewertransfers in a given 12 month cycle (Figure 3) than beneficiaries in other provinces.
To validate our findings from the self-reported data we confirmed our findings by using the recordsof payments made to beneficiaries accounts that is housed in the BISP MIS. These findings arepresented in Figure 5. We find that the BISP MIS reports very similar results to the self-reporteddata, indicating that on average beneficiaries received PKR 14,186 or 78% of the total value of thetransfer in the last 12 months. We also find that BISP MIS indicates that Balochistan performs theworst with beneficiaries receiving just PKR 12,308 or 68% of the transfer.
13533
4467
14373
3627
14076
3924
12387
5613
13906
4094
Punjab Sindh KP Balochistan Pakistan
Source: BISP Impact Evaluation Survey 2016
Beneficiaries are expected to have received PKR 18,000 in the last 12 months
Amount received per beneficiary in last 12 months (self-reported)
Amount received by beneficiary in last 12 months
Including expected amount not received in last 12 months

Benazir Income Support Programme: Final Impact Evaluation Report
© Oxford Policy Management 20
Figure 5 Amount received per beneficiary in last 12 months (BISP MIS)
3.1.3 Per adult equivalent value of the transfer per household
In the context of addressing the impact of the BISP cash transfer on key impact indicators (aspresented in Part C of this report) it is useful to consider the per adult equivalent monthly valueof the transfer8, which will give the reader a better idea of the additional resource provided by theBISP per member of the household.
Furthermore it is useful to consider that the direct beneficiary of the BISP cash transfer are femalefamily heads9 rather than at the household as a whole. Given that it is common for there to bemultiple families living in one household it is possible for more than one BISP beneficiary to liveunder the same roof. 10% of BISP beneficiary households had more than one BISP beneficiary,with an average of 1.11 beneficiaries living per household.
8 Per adult equivalent values gives the total number of adult equivalent members of the household. It does this byapplying a weight of 0.8 to household members under the age of 18 and a weight of 1 to all household members 18years and older and taking the sum9 i.e. ever married women in the household
14900
3100
13240
4760
15058
2942
12308
5692
14186
3814
Punjab Sindh KP Balochistan Pakistan
Source: BISP MIS
Beneficiaries are expected to have received PKR 18,000 in the last 12 months
Amount received per beneficiary in last 12 months (BISP MIS)
Amount received by beneficiary in last 12 months
Including expected amount not received in last 12 months

Benazir Income Support Programme: Final Impact Evaluation Report
© Oxford Policy Management 21
Figure 6 Per adult equivalent monthly value of transfer per household
Figure 6 reports that the average per adult equivalent monthly value of the transfer receivedwas PKR 187, though this would have been a total of PKR 257 if beneficiaries had received the fullvalue of the BISP cash transfer in the last 12 months.
Unsurprisingly beneficiaries in Balochistan received the lowest per adult equivalent monthly valueat just PKR 141, a direct consequence of having received the fewest number of transfers.However, even if beneficiaries in Balochistan had received the full complement of the BISP cashtransfer in the last 12 months, they would have still had the lowest per adult equivalent monthlyvalue at PKR 240, compared to the national average of PKR 257, as households in Balochistantend to be larger on average.
Figure 7 provides some context in terms of the importance that the BISP cash transfer might playin a household’s monthly budget. For the average BISP beneficiary in the evaluation sample, theBISP transfer actually received in the last 12 months is equivalent to just 6.6% of theaverage per adult equivalent monthly value of consumption expenditure. If the full value ofthe transfer had been received this value would have been 8.9% of per adult equivalent monthlyconsumption expenditure.
183
83
193
61
197
58
141
99
187
70
0
50
100
150
200
250
Paki
stan
Rup
ees
Punjab Sindh KP Balochistan Pakistan
Source: BISP Impact Evaluation Survey 2016
Per adult equiv. monthly value of transfer per household (self-reported)
Per adult equiv. value received monthly
Including expected per adult equiv. amountnot received

Benazir Income Support Programme: Final Impact Evaluation Report
© Oxford Policy Management 22
Figure 7 Transfer as a proportion of per adult equivalent monthly consumptionexpenditure10
Davis (2014) makes a comparison of 11 cash transfers globally, which are represented in Figure 8below, and notes that transfers that make up at least 20% of per adult equivalent consumptionexpenditure tend to be more likely to have more widespread impacts, including on productiveactivities and human capital investments (such as education). Further, cash transfers with valuesbelow this threshold tend to have more selected impacts focussed on poverty.
10 This is based on current per adult equivalent consumption. OPM (2015) reported that the value of the transfer (ifreceived in full) made up 11% of per adult equivalent consumption expenditure. This analysis is not repeated here giventhe changes to the sample (see Section 2.3) which means that there is no baseline information for the majority of theevaluation sample
6.2
2.7
6.7
1.9
7.1
2.0
5.9
3.9
6.6
2.3
0
2
4
6
8
10
Prop
ortio
n
Punjab Sindh KP Balochistan Pakistan
Source: BISP Impact Evaluation Survey 2016
Transfer as a proportion of per adult equiv. monthly consumption expenditure
Amount recieved as a proportion of per adult equiv. monthly consumption expenditure
Including expected amountnot received

Benazir Income Support Programme: Final Impact Evaluation Report
© Oxford Policy Management 23
Figure 8 Per adult equivalent value of transfer as proportion of consumption expenditure
3.2 User costs related to the payment mechanism
Under the original design of the programme, BISP beneficiaries were paid money orders throughthe Pakistan Post, who delivered the cash transfer to the beneficiaries’ doorsteps. Since 2013,however, this mode of payment has been phased out and replaced with the BISP Debit Card. Thevast majority of cash transfers are now received in this manner (93% of beneficiaries in theevaluation sample).
Beneficiaries who use the BISP Debit Card can withdraw their cash transfer at any ATM inPakistan. To further facilitate access to the transfer, the banks also provide branchless bankingservices, allowing BISP beneficiaries to withdraw their transfers from Point of Sale (POS)machines with a registered network of banking agents. The BISP Debit Card is managed by sixpartner banks11.
Table 6 Costs associated with collecting transfer
Punjab SindhKhyberPakhtunkhwa
Balochistan Pakistan
Time taken to travel tocollection point per trip(minutes)
32 34 31 45 33
Cost of travel to collectionpoint per trip, includingmultiple trips (PKR)
79 120 74 147 96
11 United Bank Limited, Habib Bank Limited, Bank Alfalah, Tameer Microfinance Bank, Summit Bank and Sindh Bank
Selected impacts
Widespread impacts
0 10 20 30
Malawi (SCT)Zambia (MCP)Zambia (CGP)
Zimbabwe (HSCT)Ghana Leap (current)
Mexico (PROGRESA)Lesotho (CGP)
South Africa (CSG)Kenya (CT-OVA)Pakistan (BISP)
BurkinaGhana LEAP (old)
Source: BISP Impact Evaluation Survey, PTOP project
Per adult equiv. value of transfer as proportion of consumption expenditure

Benazir Income Support Programme: Final Impact Evaluation Report
© Oxford Policy Management 24
Proportion of beneficiarieswho could not withdrewcash on their first attempt
24 17 15 9 18
Proportion of beneficiariesreporting paying a “fee” toreceive the transfer
7 33 13 15 18
Average “fee” paid bythose who reported payinga fee (PKR)
153 219 122 204 192
Source: BISP Impact Evaluation Survey (2016)
3.2.1 Cost of transport
Table 6 provides details of the types of user costs associated with collecting the BISP cashtransfer. This includes time and cost to collect the transfer, the proportion of beneficiaries whomanaged to collect the transfer on the first attempt, as well as the amount of “fees” thatbeneficiaries unwillingly had to pay in order to collect the transfer – an indication of local levelleakage of the transfer.
Across all provinces Table 6 suggests that there are sufficient collection points to serve needs,with the average time taken to travel at just 33 minutes. There is not much variation across theprovinces, although beneficiaries in Balochistan had slightly further to travel, taking on average 45minutes to reach a collection point.
The direct transport costs of collecting the transfer also seemed relatively low, with beneficiariesspending on average PKR 96 or 2% of the quarterly value of the transfer on transport tocollect the transfer. This cost was highest in Balochistan, reflecting the longer travel distancesrequired to reach a collection point.
However, despite the success on aggregate some communities in more remote regions were notwell served by ATM infrastructure. For example beneficiaries in Ziarat, Balochistan, noted thatthere were no functioning ATMs close to their communities. As such they were forced to travel tothe capital of Balochistan, Quetta. This travel was extremely costly in relation to the size of thequarterly transfer.
“There are no functional ATMs in ZIarat, so we have to collect BISP money from Quetta, which isvery difficult for women because of travelling and also because they cannot travel alone so it does
not make sense to go to Quetta accompanied by some other male from the family just to collectmoney. The standard travelling cost is also PKR 1,500 to and from Quetta to the village which
takes away a substantive amount of the cash”. (Woman IDI, District Ziarat, Balochistan)
3.2.2 Some beneficiaries making multiple trips to collect the cash transfer
Despite this not every beneficiary was successful in collecting payments on their first attempt. Onaverage 18% of beneficiaries could not withdraw cash on their first attempt. This issue ismost severe in Punjab, where 24% of beneficiaries needed to make multiple trips, whilst just 9% ofbeneficiaries in Balochistan reported making multiple trips.

Benazir Income Support Programme: Final Impact Evaluation Report
© Oxford Policy Management 25
Figure 9 Reasons for not collecting last transfer on first attempt
Figure 9 points at two main, related, reasons as to why beneficiaries needed to make multiple trips.47% reported long queues and 30% reported lack of funds at the collection point as the mainreason why they could not collect the transfer on their first trip. This likely reflects a large number ofbeneficiaries converging on the collection points when the quarterly payments are made availablein beneficiaries’ accounts. BISP might therefore consider staggering the release of payments toensure that collection points are not overwhelmed, though this would need to be accompanied byadequate communication so that individual beneficiaries were aware of when payments were beingmade into their accounts.
3.2.3 Local level leakage
Table 6 reports that 18% of beneficiaries had unwillingly paid a fee to receive their transferacross Pakistan. There is, however, significant regional variation in this phenomenon with a thirdof beneficiaries in Sindh reporting having to pay a fee to collect the last transfer.
For those who had to pay fees, the average fee paid for the last transfer that was collectedwas PKR 192. This amounts to 4% of the value of the quarterly transfer demonstrating that, whilstclearly an inconvenience for some beneficiaries, it is rather low level local leakage.
Figure 10 demonstrates that the majority of fees are being paid to either guards or other staffmembers at banks, with 64% of beneficiaries who had paid a fee reporting this to be the case.However, the qualitative research noted that this type of local level leakage was falling as women(or their proxies) became more comfortable with using the ATMs, and still maintained that the ATMsystem was more transparent than, and thus preferred to, the previous mechanism whereby thecash was delivered by the Pakistan Post.
43
38
6
13
53
14
27
6
49
35
10
7
35
48
4
13
47
30
14
9
0
20
40
60
80
100
Prop
ortio
n
Punjab Sindh KP Balochistan Pakistan
Source: BISP Impact Evaluation Survey 2016
Reasons given for not collecting transfer on first attempt
Queue was too long at collection
No funds at colleciton point
Collection point closed
Other

Benazir Income Support Programme: Final Impact Evaluation Report
© Oxford Policy Management 26
Figure 10 Who are fees paid to?
3.3 Satisfaction with the payment mechanism
Figure 11 reports a high level overall of satisfaction with the way in which beneficiaries collect theirtransfer. Overall 96% of beneficiaries reported that they were very satisfied or somewhat satisfiedwith their experience in how they collected the cash transfer. The findings are consistent acrossthe provinces with beneficiaries reporting high levels of satisfaction across each of the fourprovinces.
20
45
10
25
80
83
10
43
48
18
59
26
15
64
21
3
12
0
20
40
60
80
100
Prop
ortio
n
Punjab Sindh KP Balochistan Pakistan
Source: BISP Impact Evaluation Survey 2016
Who beneficiaries unwillingly pay fee to
Guard or Staff at Bank
Sales assistant (at POS)
Would rather not say
Other

Benazir Income Support Programme: Final Impact Evaluation Report
© Oxford Policy Management 27
Figure 11 Satisfaction with the way in which cash is collected
3.4 Control over BISP cash transfer
The BISP beneficiary is any ever-married female in a household determined as eligible for theBISP cash transfer. Embedded in the programme’s theory of change is the goal to promotewomen’s empowerment through providing the cash transfer to female beneficiaries.
In terms of who it is within the household who actually collects the transfer, we find compellingevidence that this is viewed as a shared responsibility within the household, with just a third ofbeneficiary women reporting that they normally collect the transfer personally. The qualitativeresearch indicates that this was perceived as a major benefit of the BISP Debit Cardmechanism, with the majority of women in both IDIs and FGDs saying that they preferredATMs more because anyone could collect the money as was convenient at the time.
80 17 4
79 20 1
90 10 1
80 17 4
72 21 7
0 20 40 60 80 100Proportion
Pakistan
Balochistan
KP
Sindh
Punjab
Source: BISP Impact Evaluation Survey (2016)
Proportion of beneficiaries satisfied with how they receive transfer
Very satisfied Somewhat Satisfied Unsatisfied

Benazir Income Support Programme: Final Impact Evaluation Report
© Oxford Policy Management 28
Figure 12 Who in the household collects the transfer?
However, there was some regional variation in this finding. In Balochistan in particular just 5% ofwomen reported that they had collected the last transfer themselves. This finding is likely related tothe less comprehensive coverage of ATMs and PoS devices in the province.
In order for the cash transfer to impact upon women’s empowerment, however, women must notonly be the intended beneficiaries but also retain control over how the cash is spent in practice.Despite the finding that just a third of BISP beneficiaries collect the transfer themselves, Figure 13reports that the vast majority of women beneficiaries across Pakistan retain this control, with 76%of female beneficiaries saying that they are the ones who decide how the transfer is spent.We do not find that there is significant variation across the provinces, although marginally fewerbeneficiaries in Balochistan report that they retain control over the transfer (72%).
56
22
22
22
32
47
30
37
34
5
68
27
33
32
35
0
20
40
60
80
100
Prop
ortio
n
Punjab Sindh KP Balochistan Pakistan
Source: BISP Impact Evaluation Survey 2016
Who normally collects the transfer?
Beneficiary herself
Household head
Other

Benazir Income Support Programme: Final Impact Evaluation Report
© Oxford Policy Management 29
Figure 13 Who decides how to use BISP cash?
The qualitative research noted that the BISP has over time brought a change in the status ofwomen and their decision making powers in the household. Gradually BISP is perceived byhusbands and sons as support which is received through women, and should therefore bycontrolled by the beneficiary. In 38 out of 48 in-depth interviews both male and femalerespondents said that it should be the beneficiary herself that should control cash received fromBISP and decide how it would be used.
“We take joint decisions about where household money including BISP would be spent. Of courseboth of us know what the needs of the family are and we spend accordingly. However, my wife
plays a decisive role [deciding on the] BISP amount and keeps it herself. I don’t interfere becausethis is her money and I know that she will use it for family benefit”. (Male IDI, District Khushab,
Punjab
3.5 Use of the BISP cash transfer
Table 7 reports the proportion of beneficiaries who reported at least some expenditure on a rangeof items out of the BISP cash transfer, no matter how small the amount. As might be expected, andin line with the immediate goal of the BISP to cushion the negative effects of food price inflation onthe poor, the majority of BISP beneficiaries report expenditure on Food, with 80% of beneficiariesreporting at least some expenditure on this item.
Other common expenditure items reported by beneficiaries included on health care, for which 55%of beneficiaries reported at least some expenditure and clothing, for which 48% of beneficiariesreported some expenditure.
77
10
13
76
11
13
78
13
9
72
19
9
76
12
12
0
20
40
60
80
100
Prop
ortio
n
Punjab Sindh KP Balochistan Pakistan
Source: BISP Impact Evaluation Survey 2016
Who decides how to use BISP cash?
Beneficiary herself
Household head
Other

Benazir Income Support Programme: Final Impact Evaluation Report
© Oxford Policy Management 30
Table 7 Reported use of the BISP cash transfer
Pakistan Punjab Sindh KP Balochistan
% of households whoreported at least someexpenditure on…
Food 80 76 83 83 73Education 16 22 8 18 23Health 55 46 62 60 67Clothing 48 47 61 36 29Loan 13 10 11 20 9Saving 0 0 0 0 4Investment 0 0 0 0 0
Source: BISP Impact Evaluation Survey 2016

Benazir Income Support Programme: Final Impact Evaluation Report
© Oxford Policy Management 31
Part C: Profile of a beneficiary household

Benazir Income Support Programme: Final Impact Evaluation Report
© Oxford Policy Management 32
4 Beneficiary profile
In this section we provide a short profile of a BISP beneficiary. This will be drawn from allbeneficiary households in our sample and not just those in the RD evaluation sample explored inthe sections that follow. The key findings are:
- We find high rates of poverty, whether this is measured using monetary of multi-dimensional methods
- BISP beneficiaries face a wide range of deprivations beyond monetary poverty that arerelated to education, health and living standards
- High rates of primary aged children remain out of school, particularly for girls for whomonly 41% are currently attending school
- Child malnutrition rates continue at levels that are indicative of what the World HealthOrganisation would term a nutrition crisis
The purpose of this section is to provide a concise situational analysis of all beneficiaryhouseholds in the sample, including BISP beneficiary households not in the RD treatmentsample.
This will provide the reader with a snapshot of the experiences of the average beneficiary, giventhat the following sections focus on the impact of the BISP on beneficiaries within the evaluationRD bandwidth (i.e. those closest to the BISP poverty eligibility score).
4.1 High rates of poverty
The Government of Pakistan has recently updated the official poverty line (expressed in monthlyper adult equivalent consumption expenditure). Under the previous methodology, Food EnergyIntake (FEI), the poverty line indexed to this survey was PKR 2,400. The updated methodology,Cost of Basic Needs (CBN), has delivered a poverty line that has increased by 33% to PKR3,244. Full details of the approach of each methodology are provided in Section 5.1.1.
For an unconditional cash transfer to have an impact on poverty it must be sufficiently welltargeted that it actually provides for households that are amongst the poorest and mostvulnerable. By either measure of poverty line, the rates of poverty amongst BISP beneficiaryhouseholds are high.
Focussing on the CBN poverty line we find that 91% of BISP beneficiaries were either ultra-poor, poor or vulnerable to being poor in 2016, with the remainder defined as quasi non-poor asdefined by the Pakistan Bureau of Statistics12.
The high rates of poverty or vulnerability to poverty exhibited by BISP beneficiary populationreflects a programme that is well targeted and well placed to address the needs of the poor byproviding households with a minimum income package.
12 Ultra poor: those less than 75% of the poverty line. Poor: those between 75% and 100% of the poverty line.Vulnerable: those between 100% and 125% of the poverty line. Quasi non-poor: those between 125% and 200% of thepoverty line. Non-poor: those at more than 200% of the poverty line.

Benazir Income Support Programme: Final Impact Evaluation Report
© Oxford Policy Management 33
Figure 14 Poverty rates of BISP beneficiaries
We consider those who are vulnerable to poverty in this analysis to recognise the cyclical nature ofpoverty. There is a strong body of evidence that suggests that those who are just above thepoverty line, may only be there temporarily, and may well slip back below the poverty line as theyare exposed to income shocks, productivity shocks or other household shocks.
Overall there the group of BISP beneficiary households with a poverty score of less than 11.17have similar rates of poverty to all BISP beneficiaries in our evaluation sample, with 93% deemedto be poor or vulnerable to poverty referenced against the CBN poverty line. However, more ofsuch households were classified as ultra-poor at 49% as compared to just 39% in the full sample ofBISP beneficiaries.
4.2 Poverty as a multi-dimensional concept
Whilst the monetary based measures of poverty provide a useful overview into the situation of aBISP beneficiary household, multi-dimensional measures of poverty such as the Multi-dimensional Poverty Index (MPI) can provide rich insights for poverty policy.
The MPI recognises that monetary based poverty is just one type of deprivation thathouseholds face, with the MPI revealing the combination of various deprivations that afflict ahousehold at the same time across three dimensions: education; health; and living standardseach measured by different indicators reported in Box 1 below13. The MPI is particularly useful as itenables the reader to quickly understand both whether or not a household faces poverty but also todetermine which particular deprivations are driving this poverty.
13 Calculation of the MPI is based on the Oxford Poverty and Human Development Initiative Methodology and details areprovided in Annex E
16
34
24
24
2
11
28
28
30
3
0
20
40
60
80
100
Bens with poverty score < 11.17 All beneficiaries
FEI poverty line
49
31
13
60
39
35
17
90
0
20
40
60
80
100
Bens with poverty score < 11.17 All beneficiaries
CBN poverty line
Source: BISP Impact Evaluation Survey (2016)
Poverty rates of BISP Beneficiaries
Ultra poor Poor Vulnerable Quasi non-poor Non-Poor

Benazir Income Support Programme: Final Impact Evaluation Report
© Oxford Policy Management 34
Box 1 Multi-dimensional poverty index
The MPI presented in this report has 3 dimensions, (education, health and living standards) and 11 indicators.Each dimension is equally weighted in the construction of the MPI. The dimensions, indicators and the criteria to beconsidered deprived are presented below, and a household is considered multi-dimensionally poor if it isdeprived in at least one third of the weighted indicators:
1. Education (each indicator weighted equally at (1/6)a. Years of schooling: deprived if no household member has completed 5 years of schoolingb. Child school attendance: deprived if any school aged child is out of school in Grades 1 to 8
2. Heath (each indicator weighted equally at 1/9)a. Child vaccinations: deprived if any child aged 20-59 months is not vaccinated for DPT or measlesb. Child nutrition: deprived if any child aged 0-59 months is malnourishedc. Household nutrition: deprived if the household does not have acceptable food consumption14
3. Living standards (each indicator weighted equally at (1/18)a. Electricity: deprived if a household does not have electricityb. Sanitation: deprived if access to toilet does not meet MDG standardc. Drinking water: deprived if drinking water does not meet MDG standardd. Flooring: deprived if the floor is dirt, sand or dunge. Cooking fuel: deprived if household cooks with wood or charcoalf. Assets: deprived if household does not own more than one of : TV, bike, motorbike, refrigerator or
radio and does not own a car
Figure 15 reports that 65% of BISP beneficiary households were MPI poor or vulnerable to MPIpoverty in 2016. The rate of MPI poverty amongst the sub-group of beneficiary households with apoverty score of 11.17 or less is higher at 80%.
This demonstrates that BISP beneficiary households are poor not only in a monetary sense, butthat they continue to face deprivations on a wide variety of dimensions, each of which is discussedin further detail below. Dissecting the MPI by each of its dimensions will allow the reader to gain aninsight as to whether the high rates of monetary poverty (see Figure 14) have translated intodeprivations against the three dimensions of multi-dimensional poverty: education, health andliving standards.
14 As measured by the World Food Programme Food Consumption Score (WFP, 2008)

Benazir Income Support Programme: Final Impact Evaluation Report
© Oxford Policy Management 35
Figure 15 Proportion of BISP beneficiary households who are multi-dimensionally poor
4.3 Beneficiaries face multi-dimensional deprivations
In this section we discuss the various deprivations that are faced by BISP beneficiary households.These are presented in Figure 16 below, which reports the proportion of BISP beneficiaryhouseholds that are deprived in each indicator. For reference the definition of what it is to bedeprived against each indicator is provided in Box 1 above.
32
32
16
20
19
26
20
35
0
20
40
60
80
100
% o
f hou
seho
lds
Bens with poverty score < 11.17 All beneficiaries
Source: BISP Impact Evaluation Survey (2016)
Distribution of BISP beneficiary households by MPI poverty category
Severely MPI poor
MPI poor
Vulnerable to MPI poor
Not mpi poor

Benazir Income Support Programme: Final Impact Evaluation Report
© Oxford Policy Management 36
Figure 16 BISP beneficiary deprivation per indicator
4.3.1 Deprivations in education
The accumulation of human capital is one of the most significant factors that can help break thetransmission of inter-generational poverty and there are well-discussed links between higherlearning outcomes and lifetime outcomes. However, children from poorer households can findthemselves stuck in a vicious cycle: the poor are the most likely to be excluded from schooling;more likely to face higher opportunity costs of education; this in turn affects the opportunitiesavailable to such children when they enter the labour market.
Figure 16 demonstrates that BISP households are significantly deprived against the two indicatorsmeasuring the education dimension of multi-dimensional poverty. We find that 18% of BISPhouseholds do not contain a single member who has completed primary school, anindication of the type of labour market opportunities that may be inaccessible to this group ofhouseholds.
Furthermore school attendance is a significant driver of multi-dimensional poverty with almost ofhalf of BISP beneficiary households containing at least one child who is not attending school in2016.
That access to school is of concern is reinforced by the findings presented in Figure 17, whichdemonstrates that only 69% of primary aged boys and just 59% of primary aged girls werecurrently attending school at the time of the 2016 evaluation survey. As would be expected inthe sub-group of beneficiary households with poverty scores less than 11.17 fewer children areattending school: 59% of primary aged boys and just 47% of primary aged girls.
7463
8371
7963
1917
5238
106
79
2519
1813
6247
2518
0% 10% 20% 30% 40% 50% 60% 70% 80%
Livi
ng S
tand
ards
Hea
lthEd
ucat
ion
Assets
Cooking Fuel
Flooring
Drinking water
Sanitation
Electricity
Household food consumption
Child nutrition
Child immunisation
School attendance
Years of schooling
Source: BISP Impact Evaluation Surveys (2016)
Proportion of BISP beneficiary households deprived on each MPI indicator
All beneficiaries Bens with poverty score<11.17

Benazir Income Support Programme: Final Impact Evaluation Report
© Oxford Policy Management 37
Figure 17 School enrolment for children aged 5-12 year olds
The impact of the BISP on education attendance as well as the observed gender gap in educationis discussed in Section 8. This section also discusses that access to education is not merely drivenby demand by also by the available supply of education to those demanding it.
4.3.2 Deprivations in health
In terms of health, child nutrition is a particularlyimportant driver of observed rates of MPI poverty, withalmost a fifth of households containing amalnourished child aged 0-59.
Infant and child nutrition security relates critically to thelonger term goals of the BISP in terms of protecting avulnerable population from chronic poverty. There is astrong body of literature that indicates that poor infantand child nutrition is an important driver of the inter-generational transmission of poverty. Under-nourished children perform worse in school and drop out
earlier (Glewwe et. al. (2002), Grantham-McGregor et. al. (2007), Walker et. al. (2005)), whilstlower school achievement is linked with lower lifetime earnings (Duflo (2001)).
The extent of the challenge faced by BISP beneficiary households in this indicator is demonstratedby Figure 18. The rate of stunting for children aged 0-59 months is at 46%, with stuntingindicating long-term malnutrition, meaning that over the course of a child’s life they have not hadexposure to sufficient quantities of protein, energy and micro-nutrients or have been exposed tofrequent episodes of infection or disease.
59
47
6959
0
20
40
60
80
Prop
ortio
n
Bens with poverty score < 11.17 All beneficiaires
Source: BISP Impact Evaluation Survey (2016)
Proportion children in beneficiary households currently attending school (5-12 year olds)
Male
Female
Measures of infant and child nutrition
Wasting: identifies current under-nutrition.Causes include adequate current food
intake, incorrect feeding practices, diseaseand infection.
Stunting: identifies past or present chronicnutrition. Causes include long-term factors
including chronic insufficient protein, energyand micro-nutrients, frequent infection ordisease, sustained inappropriate feeding
practices.

Benazir Income Support Programme: Final Impact Evaluation Report
© Oxford Policy Management 38
This rate of stunting is 16 percentage points above the threshold that the WHO woulddescribe as a crisis15 for the prevalence of stunting in a population.
Figure 18 Malnutrition rates for children aged 0-59 months
Given the role that child nutrition plays in the inter-generational transmission of poverty, the highrates of child malnutrition might be taken into account in the design of future programmescomplementary to the BISP. Increasingly, social protection programmes and policies around theworld are including components relevant to food security, health, education, gender and WASH toimprove the overall well-being and nutrition of beneficiaries (FAO, 2015).
Such interventions could include those that are costly to implement such as conditional cashtransfers that are focussed on child health. For example Oportunidades included a conditionalcomponent targeted at child health that provided support to access of services such as pre-natalcare, health check-ups and nutritional supplements (Fernald et. al., 2008).
On the other hand less costly but effective interventions could be implemented in conjunction withan unconditional cash transfer programme such as the BISP. Behavioural change messaging thatcan be delivered to beneficiary women via the medium of SMS has been shown to have positiveimpacts on child and maternal health. The Maternal Health (Nutrition) programme in Tanzaniaused mobile technology to disseminate information (via SMS) on the importance of maternalnutrition and specific recommendations such as eating protein and iron rich foods (Viljoen andSowah, 2015).
Child nutrition is related to a number of factors that are captured by the MPI. We report these inFigure 19, including child immunisation with 14% of children under the age of 5 years not beingfully immunised against DPT or measles. Furthermore, Figure 16 reports high rates of deprivation
15 The WHO classification for the degree of malnutrition within a population of children aged 0-59 months. Rates ofwasting higher than 15% and rates of stunting higher than 30% are considered to be very high, indicating a child nutritioncrisis, World Bank (2008).
52
19
46
18
Wasting crisis
Stunting crisis
0
10%
20%
40%
50%
Bens with poverty score < 11.17 All beneficiaires
Source: BISP Impact Evaluation Survey (2016)Note: Stunting and Wasting Crisis refers threshold level of malnutrition in a population to be at crisis by WHO
Proportion children in beneficiary households malnourished (0-59 months)
Stunting
Wasting

Benazir Income Support Programme: Final Impact Evaluation Report
© Oxford Policy Management 39
against the sanitation and drinking water deprivations which are discussed further below. Thesedirectly relate to child health, with Figure 19 reporting relatively high proportions of children (27%)in beneficiary households that had experienced an episode of diarrhoea in the last 30 days.
Figure 19 Rates of diarrhoea and immunisation amongst children younger than 5 years
The impact of the BISP on child nutrition is discussed in Section 5.4.
4.3.3 Deprivations in living standards
We find that significant proportions of BISP beneficiaries did not have access to improved toiletswith Figure 16 reporting that 38% of BISP beneficiaries were deprived in terms of sanitation.There are substantial linkages between this indicator and other deprivations faced by BISPbeneficiaries, particularly to child health. This situation is exacerbated by the 17% of BISPbeneficiaries that do not have access to safe drinking water.
UNICEF (2013) notes that repeated episodes of diarrhoea and intestinal infestation can impedenutrient absorption and diminish appetite, resulting in stunting and other forms of undernutrition.Guerrant et. al. (2008) proposes that improving the water, sanitation and hygiene can promotehealth environments and reduce the prevalence of infectious diseases. Key interventions (ifimplemented at scale) that could help to reduce undernutrition in combination with nutritionfocussed interventions discussed above include: immunisation, improving sanitation by creatingenvironments free of open defecation, hand washing with soap, access to clean drinking water anduse of oral rehydration and therapeutic zinc to treat diarrhoea.
Flooring reflects the quality of housing in which beneficiary households live, with a householdbeing deprived in this indicator if the floor of the household is made of earth. 63% of beneficiariesare deprived in this indicator, providing a rudimentary indication of the poor quality of housingaffordable to them. The large deprivations with respect to cooking fuel are also indicative of the
28
67
27
76
0
20
40
60
80
Bens with poverty score < 11.17 All beneficiaires
Source: BISP Impact Evaluation Survey (2016)Note: Stunting and Wasting Crisis refers threshold level of malnutrition in a population to be at crisis by WHO
Proportion children in beneficiary households who... (0-59 months)
Child had diarrhoea in last 30 days
Child fully vaccinated

Benazir Income Support Programme: Final Impact Evaluation Report
© Oxford Policy Management 40
poor quality of housing. Furthermore, chronic conditions in children, like asthma, can result fromexposure to unsafe cooking fuels (WHO, 2006).
The impact of the BISP on living standards and material welfare is discussed in Section 5.6.
4.4 Main source of household income
BISP beneficiary households are characterised has having dependence on casual labour, with44% of BISP beneficiaries reporting that this was their main source of income. Furthermore for24% of BISP households this was the only source of income available to the household.
Dependence on casual labour is commonly associated with those towards the bottom of theincome distribution (ILO, 2013). Casual labour is often indicative of poor job quality, low wagesas well as being vulnerable to cyclical and seasonal shifts. We also find that this dependenceis common across both the average beneficiary household as well as the sub-group of beneficiaryhouseholds with a poverty score less than 11.17.
The qualitative research also indicated that communities in Pakistan themselves viewed casuallabour as being associated with poor households.
“Poor are those households who have difficulty in fulfilling 3 meals a day. In our communityhouseholds are dependent on daily wages with most men working as unskilled manual labourers in
either the fields or nearby localities. During harvesting season, women and children also work incrop picking and cleaning activities. In most households if there is no work then there is no food
that day”. (Policeman, Community Key Informant, District Sukkur, Sindh)
Figure 20 Main source of income
44
14
12
8
7763
44
18
8
8
7644
0
20
40
60
80
100
Prop
ortio
n
Bens with poverty score < 11.17 All beneficiaires
Source: BISP Impact Evaluation Survey (2016)
Proportion of beneficiary households by main source of income
Salary
Casual labour
Trading
Cash crop production
Food crop production
Remittances
Small business
Others

Benazir Income Support Programme: Final Impact Evaluation Report
© Oxford Policy Management 41

Benazir Income Support Programme: Final Impact Evaluation Report
© Oxford Policy Management 42
Part D: Final impact evaluation results

Benazir Income Support Programme: Final Impact Evaluation Report
© Oxford Policy Management 43
5 Poverty, nutrition and material welfareIn this section we present findings related to consumption expenditure, poverty, nutrition andmaterial welfare. The key findings are:
- The BISP cash transfer has a positive and statistically significant impact on per adultequivalent monthly consumption expenditure of PKR 188
- The increase in consumption expenditure is mostly driven by increases in non-foodconsumption expenditure
- The adoption of an update poverty line by GoP means that the poverty line has increasedby 33% (PKR 804)
- BISP has a negative and statistically significant impact on the rate of poverty when usinga Food Energy Intake (FEI) poverty line but no impact on the poverty rate based on aCost of Basic Needs (CBN) poverty line
- Nonetheless for the CBN poverty line we find a statistically significant reduction in thepoverty gap
- The BISP has a positive and statistically significant impact on the ownership of somehousehold assets
Poverty and nutrition relate to the core objectives of the BISP, which was initially designed with theimmediate objective to cushion the negative effects of food inflation on the poor. Additionally,the programme has longer term objectives to provide a minimum income package to the poor toprotect vulnerable households in Pakistan against chronic and transient poverty.
5.1 Household consumption expenditure and poverty
5.1.1 Recent re-definition of the poverty line in Pakistan
Income is difficult to measure accurately and is subject to short-term volatility relating to theavailability of work and to seasonality. As a result it is standard for surveys in Pakistan such as thePakistan Living Standards Measurement Survey) to estimate consumption expenditure insteadwhich gives the monthly consumption expenditure per adult equivalent as the standardproxy for household welfare16.
Until very recently the poverty line in Pakistan was estimated using a Food Energy Intake (FEI)methodology, which calculates the total per adult equivalent consumption expenditure required tofor those households which are on the threshold of adequate caloric intake, which in Pakistan wasdefined as at least 2,350 calories daily per adult equivalent.
However, in May of 2016 a different approach to calculating the poverty line in Pakistan wasannounced, using a Cost of Basic Needs (CBN) methodology. This methodology differs from theFEI methodology in that it first estimates the cost of acquiring enough food for nutrition as per the
16 We follow the Pakistan Bureau of Statistics method for the calculation of per adult equivalent monthly consumptionexpenditure. Details of this are provided in Annex C.

Benazir Income Support Programme: Final Impact Evaluation Report
© Oxford Policy Management 44
FEI (2,350 calories daily per adult equivalent) and then adds on the cost of other essentials suchas clothing, education and shelter (see Annex III of the Economic Survey of Pakistan 2015/1617).
The implication for this evaluation is that the two methodologies deliver starkly different Rupeevalue poverty lines and hence estimates of poverty rates. The FEI methodology delivers a povertyline of PKR 2,440, whilst the CBN methodology delivers a poverty line of PKR 3,24418 an increasein the poverty line of PKR 804 (33%). To put this increase in perspective it represents over half ofthe monthly value of the transfer.
In this section we consider estimates of the poverty headcount ratio and the poverty gap derivedfrom both methodologies, and discuss the differences and similarities of both.
The result of this increase in the poverty line means that national levels of poverty for 2013/14 inthe entire population increase from 9% using the FEI methodology to 30% using the CBNmethodology (Government of Pakistan, 2016).
5.1.2 Household consumption expenditure
The BISP cash transfer can be spent in a variety of ways, including on consumption in thehousehold of food, expenditure on durable assets but also on debt repayment and savings. Interms of household consumption expenditure we find that the BISP has a statistically significantand positive impact on the value per adult equivalent monthly consumption expenditure ofPKR 187 (see Figure 6) amongst BISP beneficiary households in the RD treatment sample. Acrossthe provinces we find weak evidence of the BISP resulting in increased per adult equivalentconsumption expenditure in Punjab (PKR 199) and Khyber Pakhtunkhwa (PKR 275), but no impacton consumption expenditure in either Sindh or Balochistan.
In the case of Sindh, as we report in Section 7.4, we find that Sindh is the only province in whichthe BISP has a positive and statistically significant impact on the propensity to save, or thepropensity to save in formal institutions. Thus the lack of observed impact on consumptionexpenditure in Sindh may well derive from a diversion of a significant enough portion of the BISPtransfer to savings and away from immediate consumption.
Table 8 Household consumption expenditure and poverty: impact estimates19
Control Treatment RDD impactestimate
Mean N Mean N
Mean householdconsumptionexpenditure per adultequivalent (PKR)
Pakistan 3,177 3,927 3,064 3,935 188**Punjab 3,290 1,572 3,153 1,526 199 (NR)Sindh 3,184 1,147 3,158 1,191 64KP 3,117 889 2,932 948 275 (NR)Balochistan 2,757 319 2,607 270 505
Proportion ofpopulation belowpoverty line (FEIMethodology)
17 Government of Pakistan (2016)18 Adjusted for inflation and indexed to the evaluation survey period19 One can Section 2.4 for the proper interpretation of impact tables.

Benazir Income Support Programme: Final Impact Evaluation Report
© Oxford Policy Management 45
Control Treatment RDD impactestimate
Mean N Mean N
Pakistan 25.0 3,927 28.7 3,935 -6.7*Punjab 19.8 1,572 24.2 1,526 -0.4Sindh 25.3 1,147 26.5 1,191 -10.8KP 27.6 889 32.8 948 -10.0 (NR)Balochistan 43.3 319 49.3 270 -3.6
Poverty gap (%) (FEIMethodology)
Pakistan 4.3 3,927 4.8 3,935 -1.3 (NR)Punjab 3.2 1,572 3.5 1,526 -0.9Sindh 4.1 1,147 4.6 1,191 -2.1KP 4.7 889 5.5 948 -3.3**Balochistan 9.0 319 10.3 270 5.4
Proportion ofpopulation belowpoverty line (CBNMethodology)
Pakistan 59.2 3,927 64.2 3,935 -4.1Punjab 54.3 1,572 60.9 1,526 1.0Sindh 59.3 1,147 60.0 1,191 -2.4KP 62.5 889 70.6 948 -4.4Balochistan 73.4 319 78.5 270 -6.3
Poverty gap (%) CBNMethodology
Pakistan 13.7 3,927 15.3 3,935 -3.1**Punjab 11.6 1,572 13.4 1,526 -2.4 (NR)Sindh 13.7 1,147 14.4 1,191 -3.1KP 14.6 889 17.2 948 -5.1*Balochistan 21.5 319 24.2 270 -3.9
Source: BISP impact evaluation survey (2016). Notes: (1) Asterisks (*) indicate that an RD estimate is statisticallysignificant: *** p < .01; ** p < .05; * p < .10. (2) NR – Not Robust: suggests that there is weak evidence ofimpact, as whilst we do not find statistically significant impact at bandwidth of +/- 5 we do find statisticallysignificant impacts at other bandwidths (3) Samples sizes are given for bandwidth of +/- 5 points around the cut-off. (4) Point estimates are weighted using triangular weights based on a bandwidth of +/- 5 points aroundthreshold
5.1.3 Poverty
The impact of the BISP on the rate of povertyand the poverty gap depends on which povertyline (discussed above in Section 5.1.1 above) isused.
With the FEI poverty line used as a referencewe find that the current rate of poverty amongstBISP beneficiaries in the RD treatment group tobe 29%. Furthermore, we find that the BISPhas a negative and statistically significantimpact on the rate of poverty of -7 percentage points for beneficiaries in the RD treatmentgroup with weak evidence of a similar effect impact for beneficiaries in Khyber Pakhtunkhwa.However, with this poverty line as a reference we find only weak evidence of a reduction in thepoverty gap, with the poverty gap currently at 5% (PKR 122).
Poverty rate or the headcount ratio gives theproportion of a population below the povertyline
Poverty gap ratio is a measure of theintensity of poverty and is defined as theaverage gap in the population betweenconsumption expenditure and the poverty line.It is expressed as a proportion of the povertyline

Benazir Income Support Programme: Final Impact Evaluation Report
© Oxford Policy Management 46
Alternatively, when the CBN poverty line is used as a reference we find that the current rate ofpoverty amongst BISP beneficiaries in the RD treatment group is significantly higher at 64%,though with the CBN poverty line as a reference we do not find any impact of the BISP onthe poverty rate for beneficiaries in the RD treatment group.
However, with the CBN poverty line we find a negative and statistically significant impact onthe poverty gap of -3 percentage points for beneficiaries in the RD treatment group, with similareffects in Khyber Pakhtunkhwa and Punjab. Despite this the average poverty gap still remainssignificant for beneficiaries in the RD treatment group at 15% (PKR 496 per adult equivalent)
Figure 21 provides some useful insight as to why we see these differing results depending onwhich poverty line is used as a reference. It shows that whilst the top three quintiles have anaverage per adult equivalent consumption expenditure per month above the FEI poverty line, onlythe top quintile has an average per adult equivalent consumption expenditure above the CBNpoverty line.
Figure 21 Per adult equivalent value of consumption expenditure20
Given that the CBN methodology increases the poverty line by PKR 804 as compared to the FEImethodology, that the current average poverty gap for beneficiaries in the RD treatment sample isPKR 496 and that the per adult equivalent average household value of the transfer is just PKR 257(assuming the full value of the transfer is received, see Section 3.1.3) one can surmise that thevalue of the BISP cash transfer is not enough to push significant enough numbers of beneficiariesabove the CBN poverty line to have an impact on poverty when referenced in this way.
As a result, whilst we see that the BISP has clearly increased the welfare of households, in termsof increasing consumption expenditure, we do not find evidence of a reduction in the rate ofpoverty when the CBN poverty line is used a reference.
20 Measured for all beneficiaries in the sample and not just the RD treatment group
FEI poverty line
CBN poverty line
0
1,000
2,000
3,000
4,000
5,000
First Second Third Fourth Fifth Average of all beneficiaries
Source: BISP Impact Evaluation Survey 2016
Average value of per adult equivalent consumption expenditure by quintile (beneficiaries)
Per adult equiv. consumption expenditure (exc. transfer value)
Per adult equiv. value of transfer (assuming full value of transfer is consumed)

Benazir Income Support Programme: Final Impact Evaluation Report
© Oxford Policy Management 47
.
5.2 Non-food consumption expenditure
Table 9 suggests that the majority of the impact on per adult equivalent total consumptionexpenditure is driven by consumption of non-food items. We find that the BISP has a positive andstatistically significant impact on non-food consumption of PKR 112 for beneficiaries in theRD treatment sample.
As has been consistently observed throughout the course of this evaluation in the previous twoevaluation reports (OPM, 2014 and OPM, 2015) the main driver of this increase in non-foodconsumption expenditure is that the BISP has a positive and statistically significant impact onthe value of housing related expenditure for beneficiaries in the RD treatment sample.
This finding may well be explained by the way in which the cash transfer is delivered in quarterlypayments. Such a payment delivery in which beneficiaries receive quarterly payments of PKR4,500 may well facilitate expenditure on “lumpy” items.
Table 9 Non-food consumption: impact estimates
Control Treatment RDD impactestimate
Mean N Mean N
Mean household non-food consumptionexpenditure per adultequivalent (PKR)
1,520 3,927 1,460 3,935 112**
Mean household non-food consumptionexpenditure per adultequivalent on… (PKR)
Education 86 3,927 84 3,935 5Health 160 3,927 155 3,935 5Housing expenses 360 3,927 340 3,935 124***Transport 144 3,927 135 3,935 -22**Cleaning 129 3,927 126 3,935 8Apparel 196 3,927 191 3,935 12
Source: BISP impact evaluation survey (2016). Notes: (1) Asterisks (*) indicate that an RD estimate is statisticallysignificant: *** p < .01; ** p < .05; * p < .10. (2) NR – Not Robust: suggests that there is weak evidence ofimpact, as whilst we do not find statistically significant impact at bandwidth of +/- 5 we do find statisticallysignificant impacts at other bandwidths (3) Samples sizes are given for bandwidth of +/- 5 points around the cut-off. (4) Point estimates are weighted using triangular weights based on a bandwidth of +/- 5 points aroundthreshold
Table 9 also reports a negative and statistically significant impact on transport expenditure ofPKR 22 for beneficiaries in the RD treatment sample. This result does not imply that the BISP hasinduced a reduction in the amount of transport that a household consumes. Rather it is possiblethat the type of transport consumed has changed. As we report in Section 5.5 we find that theBISP has induced an increase in the ownership of bicycles, which might be sufficient to provide theresult that is shown in Table 9.

Benazir Income Support Programme: Final Impact Evaluation Report
© Oxford Policy Management 48
5.3 Food consumption expenditure
We find weak evidence that the BISP cash transfer is having a positive impact on the level ofper adult equivalent food consumption expenditure of PKR 67. As shown in Section 5.2 abovethis implies that the bulk of the impact on total per adult equivalent household consumptionexpenditure derives from an increase to non-food consumption expenditure.
Table 10 Food consumption: impact estimates
Control Treatment RDD impactestimate
Mean N Mean N
Mean household foodconsumptionexpenditure per adultequivalent (PKR)
1,657 3,927 1,604 3,935 68.7 (NR)
Mean household foodconsumptionexpenditure per adultequivalent on… (PKR)
Wheat 335 3,927 342 3,935 -6.3Maize 3 3,927 2 3,935 -0.5Rice 87 3,927 86 3,935 -14.3Vegetables 179 3,927 176 3,935 0.7Meat 87 3,927 83 3,935 23.2**Fish 14 3,927 13 3,935 8.1**Eggs 19 3,927 18 3,935 3.7Milk 358 3,927 345 3,935 4
Source: BISP impact evaluation survey (2016). Notes: (1) Asterisks (*) indicate that an RD estimate is statisticallysignificant: *** p < .01; ** p < .05; * p < .10. (2) NR – Not Robust: suggests that there is weak evidence ofimpact, as whilst we do not find statistically significant impact at bandwidth of +/- 5 we do find statisticallysignificant impacts at other bandwidths (3) Samples sizes are given for bandwidth of +/- 5 points around the cut-off. (4) Point estimates are weighted using triangular weights based on a bandwidth of +/- 5 points aroundthreshold
When the components of food consumption are considered we find that the BISP cash transfer hasa positive and statistically significant impact on the consumption of meat and fish by PKR23 and PKR 8 respectively for beneficiaries in the RD treatment group. This finding isencouraging as meat and fish are sources of the highest quality protein that when consumed, evenin the smallest of quantities, can lead to significant improvements in the quality of diet (WFP,2008).
Furthermore it is possible that this increase in the consumption of high protein meat and fish isassociated with the findings on reduced wasting presented in Section 5.4 below. For exampleKrebs et. al. (2011) find that the consumption of meat is associated improved child nutrition in fourstudy countries, including Pakistan.
To understand why the BISP might induce households to consume greater quantities of meat andfish, rather than staple foods such as wheat, maize or rice it is useful to consider Figure 22, whichpresents the profile of food consumption depending on the value of their Food ConsumptionScore (FCS)21. The food consumption score presents the quality and diversity of a household’sdiet by presenting a weighted total of the number of days particular food groups are consumed in
21 World Food Programme, (2008)http://documents.wfp.org/stellent/groups/public/documents/manual_guide_proced/wfp197216.pdf)

Benazir Income Support Programme: Final Impact Evaluation Report
© Oxford Policy Management 49
the household out of the last seven days. Each food group is weighted according to its nutritionalvalue. One can see from Figure 22 that as a household’s FCS increases the diversity of foods thatare eaten increases as well as the quality of that food consumed.
In the evaluation sample the average BISP beneficiary has a FCS of 54. At this score Figure 22illustrates that their consumption of basic foods, whether staples or vegetables is satisfied, thoughonly smaller quantities of higher quality foods (such as meat or fish) are consumed. Thus theobservation of impact of the BISP on consumption of meat and fish, and not on other foods is notsurprising, given that the average BISP household can already satisfy their consumption needs ofbasic goods such as staples or vegetables.
Figure 22 Food consumption score
The qualitative research supports these findings, with some beneficiaries reporting that they wereusing some portion of the BISP cash transfer to increase overall food consumption as well aspurchase higher quality food.
“When BISP amount comes we store food rations like wheat and pulses, so even if there is notwork for a few days, we have some food to go by with. Also now the quantity of food is more
because we have growing children in the house and they demand more food so we have started toeat thrice a day”. (Male IDI, District Noshki, Balochistan)
“I buy chicken and fruits when I go to collect the BISP cash. It is a special day for all of us becausechildren know that now their needs will be fulfilled”. (Female IDI, District Bhawalnagar, Punjab)
However, as seems to be suggested by the quantitative finding of only a weak finding on foodconsumption expenditure, the qualitative research suggests that the money is not enough for allbeneficiaries to fully meet the food needs of their families.
“When I collect the money then my children ask me for good food like chicken or rice otherwise weeat the same food as before that is roti and vegetables” (Female IDI, District Karachi, Sindh)
0
10
20
30
40
Cum
ulat
ive
cons
umpt
ion
(day
s)
0 10 20 30 40 50 60 70 80 90food consumption score
sugar milk meat & fish fruit vegetables staples
Source: BISP Impact Evaluation Survey 2016
Food Consumption

Benazir Income Support Programme: Final Impact Evaluation Report
© Oxford Policy Management 50
“BISP beneficiaries are better than us only for a week. Their happiness is only 4 to 5 days afterthey collect the BISP grant”. (Male Non-Beneficiary FGD, District Sukkur, Sindh)
5.4 Child nutrition
Infant and child nutrition is secured when the child not only has a received adequate breastfeedingand weaning, has been born to a healthy mother, has a sanitary environment, adequate healthservices and when heath carers have the knowledge and skills necessary to provide adequatecare for a healthy life for infants and toddlers in the household.
We have shown earlier in this report (see Section 4.3) that beneficiary households face significantdeprivations in some of these indicators. This provides the context for the findings presented inTable 11 that levels of wasting and stunting are at levels that would be classified by theWorld Health Organisation as signifying an on-going crisis in terms of child nutrition22.Rates of stunting above 30% and rates of wasting above 15% are classified as a child nutritioncrisis. Rates of stunting and wasting in the beneficiary RD treatment sample are at 44% and 18%,significantly above this crisis threshold.
However, we find that the BISP has had a negative and statistically significant impact on theproportion of girls in the RD treatment sample that are wasted. Wasting is a measurement ofacute (short-term) nutrition status.
Table 11 Child nutrition: impact estimates
Control Treatment RDD impactestimate
Mean N Mean N
Proportion of childrenwasted
All 17 2,216 18 2,098 -3Boys 20 1,136 20 1,137 4Girls 15 1,080 15 961 -11***
Proportion of childrenstunted
All 44 2,216 44 2,098 3Boys 45 1,136 46 1,137 2Girls 43 1,080 42 961 3
Proportion of childrenunderweight
All 31 2,216 32 2,098 -4Boys 33 1,136 34 1,137 -3Girls 28 1,080 31 961 -4
Source: BISP impact evaluation survey (2016). Notes: (1) Asterisks (*) indicate that an RD estimate is statisticallysignificant: *** p < .01; ** p < .05; * p < .10. (2) NR – Not Robust: suggests that there is weak evidence ofimpact, as whilst we do not find statistically significant impact at bandwidth of +/- 5 we do find statisticallysignificant impacts at other bandwidths (3) Samples sizes are given for bandwidth of +/- 5 points around the cut-off. (4) Point estimates are weighted using triangular weights based on a bandwidth of +/- 5 points aroundthreshold
22 The WHO classification for the degree of malnutrition within a population of children aged 0-59 months. Rates ofwasting higher than 15% and rates of stunting higher than 30% are considered to be very high, indicating a child nutritioncrisis, World Bank (2008).

Benazir Income Support Programme: Final Impact Evaluation Report
© Oxford Policy Management 51
The observation of impact on girls’ nutrition and no impact on boys’ nutrition is not unique tothe BISP. Most famously Duflo (2003) found in South Africa significant improvements in girls’wasted status in households where women were receiving a social cash transfer in the form of apension, whilst no impact was observed for boys. Manley et.al. (2012) explore this issue further ina meta-analysis of six studies which analyse the impact of cash transfers separately by gender(including Dulfo, 2003). The authors conclude that on average the nutrition impact of theseprogrammes to be higher for girls than boys under the age of 5.
Certainly, as Duflo (2003) notes there is more work to be done to understand the differencesbetween boys and girls, and in particular the apparent preference for girls’ nutrition among femaleBISP beneficiaries.
Given the close relationship between child nutrition and child health discussed in Section 4 above,we analyse whether or not the BISP has had an impact on child health indicators presented inTable 12. We find that the BISP does not have any impact on either the proportion of children whoare fully vaccinated, or the proportion of children who have had an episode of diarrhoea in the last30 days.
Table 12 Child immunisation and diarrhoea: impact estimates
Control Treatment RDD impactestimate
Mean N Mean N
Proportion of childrenfully immunised
All 73 2,216 73 2,098 -4Boys 74 1,136 73 1,137 -2Girls 72 1,080 74 961 -7
Proportion of childrenwho have experiencedan episode ofdiarrhoea in last 30days
All 23 2,216 25 2,098 -6Boys 23 1,136 26 1,137 6Girls 23 1,080 24 961 -4
Source: BISP impact evaluation survey (2016). Notes: (1) Asterisks (*) indicate that an RD estimate is statisticallysignificant: *** p < .01; ** p < .05; * p < .10. (2) NR – Not Robust: suggests that there is weak evidence ofimpact, as whilst we do not find statistically significant impact at bandwidth of +/- 5 we do find statisticallysignificant impacts at other bandwidths (3) Samples sizes are given for bandwidth of +/- 5 points around the cut-off. (4) Point estimates are weighted using triangular weights based on a bandwidth of +/- 5 points aroundthreshold
5.5 Household assets
In addition to spending income on consumption and child nutrition, BISP beneficiary householdsalso can spend money on the purchase of household assets. During the quantitative survey weasked households whether they own a range of different household assets, including thosepresented in Table 13.

Benazir Income Support Programme: Final Impact Evaluation Report
© Oxford Policy Management 52
Table 13 Asset ownership: impact estimates
Control Treatment RDD impactestimate
Mean N Mean N
Proportion ofhouseholds that own…
Fan 92 3,926 92 3,934 2Heater 6 3,926 5 3,934 4*Bicycle 23 3,926 23 3,934 7*Car 1 3,926 0 3,934 0Motorcycle 24 3,926 23 3,934 7TV 52 3,926 52 3,934 14***Radio 1 3,926 1 3,934 -1Sewing machine 40 3,926 40 3,934 3Cooking stove 33 3,926 31 3,934 12***Washing machine 41 3,926 41 3,934 13***
Source: BISP impact evaluation survey (2016). Notes: (1) Asterisks (*) indicate that an RD estimate is statisticallysignificant: *** p < .01; ** p < .05; * p < .10. (2) NR – Not Robust: suggests that there is weak evidence ofimpact, as whilst we do not find statistically significant impact at bandwidth of +/- 5 we do find statisticallysignificant impacts at other bandwidths (3) Samples sizes are given for bandwidth of +/- 5 points around the cut-off. (4) Point estimates are weighted using triangular weights based on a bandwidth of +/- 5 points aroundthreshold
We find that the BISP has had a positive and statistically significant effect on the proportionof households that own: a TV (14 percentage points); a bicycle (7 percentage points); acooking stove (12 percentage points); a washing machine (13 percentage points); and aheater (4 percentage points). The ownership of a bicycle in particular could be significant:bicycles are an important type of household asset as they are not only a means of transportation,but can also in some cases facilitate productive activities, in the sense that it both provides ahigher degree of mobility and as such easier access to both labour and product markets.
5.6 Living standards
Earlier in this report (see Section 4.2) we provided a profile of a BISP beneficiary household,describing the various deprivations that are faced in such households. We found that in terms ofliving standards BISP beneficiary households were particularly deprived on indicators related to thecondition of the household, including flooring, cooking fuel and household assets.
Table 14 reports the finding of the evaluation in terms of whether the BISP has had a positiveeffect on the living conditions experienced in BISP beneficiary households. Overall we report thatthe BISP has had a positive and statistically significant impact on the certain indicatorsrelevant to the quality of living standards as per the multi-dimensional poverty index describedin Section 4.2. In particularly the BISP has supported a reduction in deprivations such as forflooring in the household, for cooking fuel used in the household and for assets owned bythe household for BISP beneficiaries in the RD treatment sample.

Benazir Income Support Programme: Final Impact Evaluation Report
© Oxford Policy Management 53
Table 14 Deprivations on living standards: impact estimates
Control Treatment RDD impactestimate
Mean N Mean N
Proportion ofhouseholds that aredeprived on the MPIindicator…
Electricity 5 3,936 5 3,945 2Sanitation 32 3,936 33 3,945 8Flooring 54 3,936 57 3,945 -11**Water 17 3,936 17 3,945 2Cooking fuel 63 3,936 67 3,947 -19***Assets 60 3,936 63 3,947 -15***
Source: BISP impact evaluation survey (2016). Notes: (1) Asterisks (*) indicate that an RD estimate is statisticallysignificant: *** p < .01; ** p < .05; * p < .10. (2) NR – Not Robust: suggests that there is weak evidence ofimpact, as whilst we do not find statistically significant impact at bandwidth of +/- 5 we do find statisticallysignificant impacts at other bandwidths (3) Samples sizes are given for bandwidth of +/- 5 points around the cut-off. (4) Point estimates are weighted using triangular weights based on a bandwidth of +/- 5 points aroundthreshold
The qualitative research was strongly supportive of this finding and a notable 20 out of 48respondents reported that they had used the BISP cash transfer for infrastructure improvements intheir home, such as construction of latrines, kitchens, roof repairs and boundary walls. This is thefirst round of qualitative research for this evaluation where this has been noted by BISPbeneficiaries.
“I know two women in our village who have constructed latrines in their homes from BISP money.Before they used the fields but saved money from BISP and had a latrine constructed”. (Female
Beneficiary FGD, District Sukkhur, Sindh)
“I save a small amount whenever I receive BISP cash for annual home repairs and maintenance.We just buy the material and do the labour ourselves”. (Female IDI, District Karachi, Sindh)
“My mother in law and I are both BISP beneficiaries. So we planned and saved our BISP cash andthen upgraded our kitchen by tiling it and getting shelves and counters installed”. (Female
Beneficiary FGD, District Charsadda, Khyber Pakhtunkhwa)

Benazir Income Support Programme: Final Impact Evaluation Report
© Oxford Policy Management 54
6 Women’s empowerment
In this section we present the findings of the evaluation as related to women’s empowerment.The key findings are:
- Women appear to retain control over the BISP cash transfer
- We find evidence of beneficiaries being able to access small amounts of money moreeasily
- We report very low rates of literacy and education amongst beneficiaries on average
- We find evidence that beneficiaries are more involved in household decision making andthat this is associated with increased status
- We find evidence that the BISP has increased the proportion of women who vote in localor national elections
- We find evidence that BISP has led to an improvement in women’s mobility within theircommunities
A key design choice for the BISP is the assignment of the female head of the family as thedirect beneficiary of the programme. In addition to this the BISP has recently created 48,000BISP Beneficiary Committees in 32 districts to provide a forum for discussing issues such asnutrition, child health, education, family planning and adult literacy, as well as providing a platformfor mobilising beneficiary women.
This focus reflects a clear commitment to promoting the empowerment of women in Pakistan.However, it does not mean that it is a foregone conclusion that becoming a BISP beneficiary willlead to empowerment. For this to happen, the BISP must make an appreciable difference acrossthree dimensions (Kabeer, 1999):
- Access to resources: which include material resources in the more conventionaleconomic sense (including the cash itself), but also human (such as education) and social(such as networks) resources, which serve to enhance a woman’s ability to exercise herown choice;
- Agency: which refers the ability to define one’s goals and act upon them which issupported by a woman’s access to resources but can be constrained by opposition ofothers in the household or wider community. This is often operationalised as the ability of awoman to engage in decision making whether at the household level or more broadly; and
- Achievements: which relates to actually achieving the desired goals, often linked towelfare outcomes such as the education and nutrition of children.

Benazir Income Support Programme: Final Impact Evaluation Report
© Oxford Policy Management 55
6.1 Access to resources
6.1.1 Access to cash
A necessary precondition for the BISP to improve the access of women to resources is that sheactually retains control over the cash that is transferred in her name. We have demonstrated earlier(see Section 3.3) that this assumption holds for over three quarters of BISP beneficiaries, and thatfurther this holds even when the beneficiary does not actually collect the transfer herself.
“Mostly my husband collects BISP money from the ATM. But he gives it to me except a smallamount which he keeps himself. I decide where to spend the money and no one in the family
questions me on it”. (Female IDI, District Malakand, KP)
During the quantitative survey we asked women whether they could easily access various sums ofmoney in an emergency as a simple measure of whether or not the BISP would induce a change inaccess of women to financial resources. Table 15 reports these results, and we find thatsignificant portions of women still cannot access relatively small amounts of money, forexample just under half of beneficiary women in the RD treatment sample are unable to accessPKR 400 in an emergency.
Table 15 Women’s access to money: impact estimates
Control Treatment RDD impactestimate
Mean N Mean N
Proportion of womenwho report that theycan easily access in anemergency…
100 73 3,450 71 3,564 4200 62 3,450 61 3,564 8400 49 3,450 51 3,564 9600 40 3,450 43 3,564 17***800 36 3,450 37 3,564 16***1,000 34 3,450 35 3,564 15***
Source: BISP impact evaluation survey (2016). Notes: (1) Asterisks (*) indicate that an RD estimate is statisticallysignificant: *** p < .01; ** p < .05; * p < .10. (2) NR – Not Robust: suggests that there is weak evidence ofimpact, as whilst we do not find statistically significant impact at bandwidth of +/- 5 we do find statisticallysignificant impacts at other bandwidths (3) Samples sizes are given for bandwidth of +/- 5 points around the cut-off. (4) Point estimates are weighted using triangular weights based on a bandwidth of +/- 5 points aroundthreshold
Despite this, we find that the BISP has had a positive and statistically significant impact onthe proportion of women who can access cash in an emergency for larger sums of money thatthey were asked about. We do not find that the BISP has had an impact on access to relativelysmaller amounts of money, likely a reflection of the relatively easier access to these amounts byboth treatment and control units.
This finding is consistent with BISP beneficiaries retaining control over the BISP cash transfer thatis presented earlier in this report (see Section 3.3), and suggests that beneficiary women havegreater access to cash.

Benazir Income Support Programme: Final Impact Evaluation Report
© Oxford Policy Management 56
6.1.2 Access to other economic resources
In the section that follows (see Section 7) on livelihood opportunities, we find that whilst the rate ofparticipation in economic activities of women has not changed as a result of the BISP, theproportion of women that are engaged in unpaid family labour has fallen.
Whist the quantitative results does not offer an answer as to what type of work beneficiary womenare substituting into, the qualitative research suggests that some women may be engaging insome forms of self-employment. A common example of this was the purchase of a sewingmachine.
6.1.3 Access to human resources
Literacy and education can be tools for access to greater information, knowledge, skills andunderstanding (Aldred, 2013) and is an important resource in its own right. Furthermore, literacyand education can both support access to other resources or support the achievement of desiredoutcomes such as the proper nutrition of infant children.
Figure 23 Education levels of beneficiary women
Figure 23 clearly demonstrates the very low levels of literacy and education of beneficiarywomen. At the national level just 9% of beneficiary women are literate, whilst just 8% havecompleted primary school. There is variation across the provinces, with literacy and educationrates in Balochistan particularly poor.
9 910
7 8 7
45
98
Punjab Sindh KP Balochistan Pakistan
Source: BISP Impact Evaluation Survey 2016
Education levels of beneficiary women
Proportion of women who are literate
Proportion of women who have completed primary school

Benazir Income Support Programme: Final Impact Evaluation Report
© Oxford Policy Management 57
6.2 Agency
6.2.1 Household decision making
The majority of respondents to in-depth interviews indicated that female beneficiaries now play amore active role in decision making within the household including managing money, andthat the BISP had supported this change. This finding was most pronounced in KhyberPakhtunkhwa, followed by Punjab.
“In general, there is a more proactive role of women in in household decision making” (SchoolTeacher, Community Key Informant, District Khushab, Punjab)
“Women in our village don’t go out alone and usually men control the cash, but now after BISP mywife play a more decisive role and gradually she controls most of the household cash now. I am
happy because now I can focus more on my work”. (Male In-depth Interview, District Ziarat,Balochistan)
“My wife is much happier now after BISP, so we all are happy. She is more independent, takes herown decisions and manages children’s education expenses also. Our life is more organised now”.
(Male IDI, District Charsadda, Khyber Pakhtunkhwa)
The qualitative research suggests that the involvement in decision making has been accompaniedby an increase in the status of women both in the household, but also in the community.
“We are definitely respected more in the community after BISP and women’s status in general hasgone up because more people realise that women can also play a role in supporting the family”
(Female Beneficiary FGD, District Khushab, Punjab)
6.2.2 Participation in voting
Pakistan has historically had low political participation of women, with many women casting theirvotes based on the choice of their husbands and other male family members. However, one of thepreconditions to becoming a BISP beneficiary is that a woman must be in possession of a currentlyvalid Computerised National Identity Card (CNIC).
Table 16 Women voting: impact estimates
Control Treatment RDD impactestimate
Mean N Mean N
Proportion of womenreporting that theywould vote in everynational or localelection…
Pakistan 53 3,450 70 3,561 14***Punjab 59 1,419 77 1,410 11*Sindh 63 962 88 1,038 3*KPK 29 791 37 886 11*Balochistan 54 278 76 227 4*
Source: BISP impact evaluation survey (2016). Notes: (1) Asterisks (*) indicate that an RD estimate is statisticallysignificant: *** p < .01; ** p < .05; * p < .10. (2) NR – Not Robust: suggests that there is weak evidence ofimpact, as whilst we do not find statistically significant impact at bandwidth of +/- 5 we do find statisticallysignificant impacts at other bandwidths (3) Samples sizes are given for bandwidth of +/- 5 points around the cut-off. (4) Point estimates are weighted using triangular weights based on a bandwidth of +/- 5 points aroundthreshold

Benazir Income Support Programme: Final Impact Evaluation Report
© Oxford Policy Management 58
A CNIC is also required to vote in Pakistan. Whether it is through the channel of the BISP cash, theincreased women’s mobility that we demonstrate below (see Section 6.3.1) or the requirement tohave a CNIC to access the BISP Table 16 suggests that the BISP has had a positive andstatistically significant impact on the proportion of women reporting that they would alwaysvote, whether in a local or national election.
6.3 Achievements
6.3.1 Mobility of women
Social norms in Pakistan place a certain degree of restriction on the mobility of women. This canbe seen to some degree in Table 17, which reports whether or not a beneficiary is free to travelalone to various places in the community. Table 17 suggests that there is still a large degree ofrestriction on the mobility of beneficiary women, with only 26% able to go to a religious centrealone and 51% able to go to a friend’s home alone.
However, the qualitative research suggests that there is a link between the need to collect theBISP cash transfer at a BISP collection point, and the mobility of women.
“In the beginning, men in our village used to go to collect BISP money because they thoughtwomen would not be able to manage it on their own. Now in the last two to three years, women goin groups to the city to collect their money. It is something which we could not have imagined five
years ago. BISP has brought this change amongst both men and women”. (Male Beneficiary FGD,District Sukkhur, Sindh)
Table 17 Female mobility: impact estimates
Control Treatment RDD impactestimate
Mean N Mean N
Proportion of womenreporting that they canfreely visit alone…
Market 31 3,450 37 3,564 11**Health Centre 31 3,450 37 3,564 9**Friend’s house 44 3,450 51 3,564 3(NR)Religious centre 22 3,450 26 3,564 6*
Source: BISP impact evaluation survey (2016). Notes: (1) Asterisks (*) indicate that an RD estimate is statisticallysignificant: *** p < .01; ** p < .05; * p < .10. (2) NR – Not Robust: suggests that there is weak evidence ofimpact, as whilst we do not find statistically significant impact at bandwidth of +/- 5 we do find statisticallysignificant impacts at other bandwidths (3) Samples sizes are given for bandwidth of +/- 5 points around the cut-off. (4) Point estimates are weighted using triangular weights based on a bandwidth of +/- 5 points aroundthreshold
For BISP beneficiaries Table 17 suggest that this mobility extends beyond just the matter ofcollecting the transfer itself. We find that the BISP has had a positive and statisticallysignificant effect on the ability of women to travel alone to various locales in the community.
Furthermore, the qualitative research suggests that this phenomenon might have wider effects incommunities with significant numbers of beneficiaries.

Benazir Income Support Programme: Final Impact Evaluation Report
© Oxford Policy Management 59
“Now non-beneficiary women also go out more because they see BISP beneficiary women goingout more often to collect their money. There is more acceptability regarding female mobility”.
(School Teacher, Community Key Informant, District Khushab, Punjab)
6.3.2 Other achievements noted in this report
Here we summarise other outcomes that are noted in this report as they relate to gender,focussing on nutrition and education outcomes of girls.
- Nutrition outcomes: we find evidence that the BISP transfer has had an impact on thenutrition outcomes of girls but not boys aged 0-59 months (see Section 5.4). Furthermorewe note that this finding is consistent with the available literature which also finds apreference for girls nutrition when a transfer is targeted at a female beneficiary in thehousehold
- Education outcomes: the qualitative research indicates that many beneficiaries report thatthey place value on education, including the education of girls as well as boys (see Section8). Despite this we do not find that the BISP transfer has increased the proportion of girls orboys that are enrolled in school. Furthermore, we find that in some communities whenresources are scarce there is still a preference for the education of boys rather than girls.

Benazir Income Support Programme: Final Impact Evaluation Report
© Oxford Policy Management 60
7 Livelihoods
In this section we present the findings related to livelihoods, including the activities and assetsrequired to generate an income. The key findings are:
- Casual labour remains an important source of income, but BISP beneficiaries arereducing their reliance on this form of livelihood
- BISP transfer has led to a reduction in the proportion of men engaged in casual labour
- BISP transfer is related to an increase in the proportion of men engaged in agriculturalactivities or looking after livestock
- BISP transfer has led to a reduction in the proportion of women engaged in unpaid familyhelp
- There is evidence that the BISP is supporting the purchase of small livestock particularlysheep and goats
- There is evidence that the BISP is supporting an increase in savings, in particular formalsavings
A household’s livelihood depends on people’s strengths (assets or capital endowments) and howthey endeavour to convert these into positive livelihood outcomes. People have differentendowments of a range of assets to achieve positive livelihood outcomes, and no single categoryof assets is sufficient to yield all the many and varied livelihood outcomes that people seek23. Thisis particularly true for people whose access to any given category of assets can be limited.
Households have different endowments of a range of assets including: human capital; naturalcapital; financial capital; physical capital; and social capital. In this section we focus on thefollowing assets:
- Human capital: which represents the skills, knowledge, ability to labour and good healththat together enable people to pursue different livelihood strategies and achieve theirlivelihood objectives. We focus here on labour supply.
- Physical capital: comprises the basic infrastructure and resources to which householdshave access. We focus here on livestock.
- Financial capital: denotes the financial resources that people use to achieve theirlivelihood objectives. We focus here on the ability to save.
7.1 Main livelihood strategies
BISP beneficiary households were asked about what was their main source of income. We haveshown earlier (see Section 4.4) that many BISP households are still dependent on casual labour, asource of income that does not offer much in the way of job security and is particularly vulnerableto seasonal and economic variation.
23 DFID (1999)

Benazir Income Support Programme: Final Impact Evaluation Report
© Oxford Policy Management 61
Table 18 Household main livelihood source: impact estimates
Control Treatment RDD impactestimate
Mean N Mean N
Proportion ofhouseholds that derivemain source of incomefrom
Salary 22 3,934 20 3,942 2Casual labour 43 3,934 44 3,942 -8*Petty Trading 3 3,934 2 3,942 0Skilled trading 1 3,934 2 3,942 -1Cash cropproduction 4 3,934 3 3,942 3Food cropproduction 5 3,934 6 3,942 1Remittances 7 3,934 8 3,942 -2Small business 9 3,934 8 3,942 -2
Source: BISP impact evaluation survey (2016). Notes: (1) Asterisks (*) indicate that an RD estimate is statisticallysignificant: *** p < .01; ** p < .05; * p < .10. (2) NR – Not Robust: suggests that there is weak evidence ofimpact, as whilst we do not find statistically significant impact at bandwidth of +/- 5 we do find statisticallysignificant impacts at other bandwidths (3) Samples sizes are given for bandwidth of +/- 5 points around the cut-off. (4) Point estimates are weighted using triangular weights based on a bandwidth of +/- 5 points aroundthreshold
Table 18 reports the impact of the BISP on the main source of income for BISP beneficiaryhouseholds and we find that the BISP has a negative and statistically significant impact on theproportion of households who rely on casual labour as the main source of income forbeneficiaries in the RD treatment sample.
However, Table 18 does not indicate that the BISP has led to an appreciable increase in thereliance on any other single type of livelihood strategy. This may suggest that BISP beneficiariesare using the cash in different ways as they diversify their livelihoods away from casual labour. Inthe sub-section that follows we report the impact of the BISP for the livelihood strategies that areadopted by individuals who live in beneficiary households.
7.2 Labour participation
In addition to asking households about their main source of income, the BISP evaluation surveyexamined labour participation rates24. Table 19 reports these findings with the analysis focussedon adults of prime working age, defined as adults aged 18-49. Table 19 reports large genderdiscrepancies in participation in economic activities, with 78% of men in the RD treatmentsample economically active in 2016 as compared to a quarter of women.
A concern that is sometimes raised by policy makers about the implementation of an unconditionalcash transfer is that such programmes could have the tendency to discourage work. We find thatthe BISP has no impact on the proportion of adults engaged in economic activities, eithermale or female. This finding is consistent with Banerjee et. al. (2015) who examined results from
24 We define an adult to be economically active if she had worked at least one hour in the last preceding the interview, oreven if she didn’t work in the last week she had a job or ran an enterprise such as a shop, business, farm or serviceestablishment that she would return to

Benazir Income Support Programme: Final Impact Evaluation Report
© Oxford Policy Management 62
seven randomised control trials of government run cash transfers in six developing countries25,who found no systematic evidence that cash transfer programmes discourage work.
This finding is not surprising in the context of the BISP, given that the value of the BISP paymentsreceived in the 12 months prior to the evaluation survey make up only 7% of the per adultequivalent consumption expenditure.
Table 19 Labour participation: impact estimates
Control Treatment RDD impactestimate
Mean N Mean N
Proportion of workingage adults (18-49)engaged ineconomicallyproductive activities
Total 50 11,526 50 11,182 -2Male 79 5,542 78 5,215 1Female 23 5,984 25 5,967 -4
Proportion ofeconomically activeworking age men (18-49) who are engagedin…
Self-employed 17 4,395 15 4,083 -5Employee 22 4,395 22 4,083 6Unpaid family helper 4 4,395 4 4,083 3Casual labourer 45 4,395 47 4,083 -9**Own agriculture/livestock 5 4,395 5 4,083 3***Share-cropper 4 4,395 5 4,083 2*
Proportion ofeconomically activeworking age women(18-49) who areengaged in…
Self-employed 20 1,347 19 1,468 7Employee 19 1,347 17 1,468 2Unpaid family helper 9 1,347 10 1,468 -6***Casual labourer 40 1,347 39 1,468 -9Own-agriculture/livestock 2 1347 4 1468 2Share-cropper 1 1,347 2 1,468 -1
Source: BISP impact evaluation survey (2016). Notes: (1) Asterisks (*) indicate that an RD estimate is statisticallysignificant: *** p < .01; ** p < .05; * p < .10. (2) NR – Not Robust: suggests that there is weak evidence ofimpact, as whilst we do not find statistically significant impact at bandwidth of +/- 5 we do find statisticallysignificant impacts at other bandwidths (3) Samples sizes are given for bandwidth of +/- 5 points around the cut-off. (4) Point estimates are weighted using triangular weights based on a bandwidth of +/- 5 points aroundthreshold
However, we do find an impact on the type of labour that is being provided by members of BISPbeneficiary households. Consistent with the finding that overall dependence on casual labour hasfallen at the household (see above in Section 7.1) we find that BISP has had a negative andstatistically significant impact on the proportion of male members who are engaged in
25 Honduras, Indonesia, Morocco, Mexico, Nicaragua and the Philippines

Benazir Income Support Programme: Final Impact Evaluation Report
© Oxford Policy Management 63
casual labour in beneficiary households in the RD treatment sample. We do not find that therehas been a similar impact for women members of beneficiary households.
Simultaneously, Table 19 reports that male members are substituting their labour towards twotypes of agriculture: sharecropping26 and own agriculture which includes own cultivation andlivestock breeding. This is consistent with the findings presented in the sub-section that follows(see Section 7.3) which reports that the BISP has enabled some households to purchase smalllivestock.
For female members Table 19 reports that the biggest change has been that the BISP has had anegative and statistically significant impact on the proportion of women who are engaged inunpaid family help. This finding may be related to the increased sense of confidence expressedby women interviewed during the qualitative research as a result of BISP that is discussed in theprevious section (see Section 6).
Whilst the quantitative data presented Table 19 does not provide an insight into the types of labourthat women might be substituting into, the qualitative research found indications of a growing trendfor self-employment. For example, we have already mentioned the purchase of sewing machines,but there have been other types of self-employment reported including the setting up of small-scaletrading such as for flowers and fruit and vegetables.
“Some women have bought sewing machines from BISP money and earn some money by stitchingclothes at home. This amount helps in fulfilling household needs. These days the price of
everything is so high that any additional amount is a blessing”.
“Jinnah hospital is right next to our colony, so there is a high demand for flowers. Takingadvantage, two women in our community have started flower businesses and both are doing quite
well. Their entire lives have changed”. (Female beneficiary FGD, District Karachi, Sindh)
Other women reported that they had given their husbands part of their BISP money so that theycould start their own economic activities (though this finding was not substantiated in thequantitative data).
“Salim, a man in our neighbourhood, saved [money through] BISP through a [savings] committeeand bought a rickshaw from it. Now he earns between PKR 500 and 1,000 every day” (Social
Organiser, Community Key Informant, District Malakand, KP)
“My husband bought a vending cart from our BISP savings. He goes from street to street sellingpakoras and fries. From that he made enough money to set up a small tea khoka (kiosk). We pray
for Benazir each and every day that her help has enabled us to lead a more comfortable life”.(Female IDI, District Karachi, Sindh)
7.3 Livestock ownership
The qualitative research provided strong indications that BISP beneficiaries had been able to usesome part of the BISP cash transfer for the purchase of small livestock as an income generatinginvestment. Some examples included:
“I bought two goats from BISP savings and then sold them for double the price at Eid. The moneyfrom those was used for improving our house roof and I also bought a pedestal fan”. (Female IDI,
District Bahawalangar, Punjab)
26 A sharecropper is a tenant farmer who gives a part of each crop as rent

Benazir Income Support Programme: Final Impact Evaluation Report
© Oxford Policy Management 64
“My wife bought four small chicks from the bazaar and now we have seven grown up chicken. Wenot only eat eggs at home but also sell eggs in the village sometimes”. (Male Beneficiary FGD,
District Sukkhur, Sindh)
Table 20 Livestock: impact estimates
Control Treatment RDD impactestimate
Mean N Mean N
Proportion ofhouseholds that own…
Any livestock 40 3,935 40 3,943 3*Bull 3 3,935 3 3,943 2Cow 16 3,935 17 3,943 -2Buffalo 14 3,935 14 3,943 0Sheep 2 3,935 3 3,943 2*Goat 21 3,935 20 3,943 9**Poultry 10 3,935 11 3,943 0
Source: BISP impact evaluation survey (2016). Notes: (1) Asterisks (*) indicate that an RD estimate is statisticallysignificant: *** p < .01; ** p < .05; * p < .10. (2) NR – Not Robust: suggests that there is weak evidence ofimpact, as whilst we do not find statistically significant impact at bandwidth of +/- 5 we do find statisticallysignificant impacts at other bandwidths (3) Samples sizes are given for bandwidth of +/- 5 points around the cut-off. (4) Point estimates are weighted using triangular weights based on a bandwidth of +/- 5 points aroundthreshold
The quantitative data supports this finding, with Table 20 reporting that the BISP has had apositive and statistically significant impact on the proportion of households that owncertain types of small livestock including sheep and goats for beneficiary households in theRD treatment sample. This finding is significant given that livestock is both a productiveinvestment, but also a store of value in the context of households with low financial access (seeSection 7.4).
7.4 Access to finance
There is potential for BISP to have a significant impact on financial access, providing thatbeneficiaries have access to facilities that are appropriate in which to save. The majority of BISPbeneficiaries receive their transfers through the BISP Debit Card. CGAP (2013), in a reportdetailing qualitative research with various banks on their willingness to engage with BISPbeneficiaries, indicates that there is a willingness amongst the partner banks to transitionbeneficiaries to Level 0 branchless accounts which would enable beneficiaries to not only withdrawbut make deposits.
Savings enable households to cope with future household needs and unexpected shocks, as wellas enabling productive investments. Poor households often lack the access to a secure means ofsaving, contributing to them struggling to build up stores of welfare improving productive physicaland human capital. Table 21 reports that the level of financial access of BISP households remainslow, with just 18% of BISP beneficiary households.
However, Table 21 reports that the BISP has had a positive and statistically significant impacton the proportion who have some form of savings for beneficiary households in the RDtreatment sample. Furthermore Table 21 suggests that this impact on savings is concentrated informal savings: i.e. savings with a bank or a micro-finance group rather than savings in cash orwith families and friends.

Benazir Income Support Programme: Final Impact Evaluation Report
© Oxford Policy Management 65
Table 21 Financial access: Impact Estimates
Control Treatment RDD impactestimate
Mean N Mean N
Proportion ofhouseholds that have
Any savings 16 3,935 18 3,943 5***Formal savings 8 3,935 9 3,943 3**Informal savings 8 3,935 9 3,943 2Outstanding loans 29 3,935 32 3,943 7
Source: BISP impact evaluation survey (2016). Notes: (1) Asterisks (*) indicate that an RD estimate is statisticallysignificant: *** p < .01; ** p < .05; * p < .10. (2) NR – Not Robust: suggests that there is weak evidence ofimpact, as whilst we do not find statistically significant impact at bandwidth of +/- 5 we do find statisticallysignificant impacts at other bandwidths (3) Samples sizes are given for bandwidth of +/- 5 points around the cut-off. (4) Point estimates are weighted using triangular weights based on a bandwidth of +/- 5 points aroundthreshold
The qualitative research confirms that BISP beneficiaries are beginning to use the BISP cash forsavings and reports that savings are used in different ways.
“My mother in law and I are both BISP beneficiaries. So we planned and saved from our BISP cashand then upgraded our kitchen by tiling it and getting shelves and counters installed” (Female
Beneficiary FGD, District Charsadda, Khyber Pakhtunkhwa)
“I save a small amount whenever I receive BISP cash for annual home repairs and maintenance.We just buy the materials and do the labour ourselves” (Female IDI, District Karachi, Sindh)
“I started saving BISP amount for my daughter’s dowry five years back. At the time of hermarriage, I had prepared her entire dowry. I could not have managed it without BISP”. (Female IDI,
District Charsadda, Khyber Pakhtunkhwa)
Furthermore, the qualitative research suggested that there has been a change in the way BISPcash is being used in the household. Specifically, respondents were reporting that they wereusing the money more carefully than before and that they had started to more carefully manageand plan its expenditure, as compared to during the early years of the programme.
“Yes in the beginning when we started to receive BISP, we would spend it without really thinking.We would spend it on all things which we wanted to do or buy but could do so because we did not
have any money. But now we now when the money comes so plan out where we will spend it.Beneficiaries plan according to the timing of the BISP cash”. (Female Beneficiary FGD, District
Charsadda, Khyber Pakhtunkhwa)
“No, there is a change over time in the BISP impact and I think it is related to the way people areusing the money. Before there was a binge effect, which has gone down now and people use
money for education, health and other useful purposes”. (BBC member, Community Key Informant,District Karachi, Sindh)
That beneficiaries are expressing that they are changing the way they plan the use of the money islikely related to two factors: that the reliability and regularity of payments made by BISP hasimproved over the course of implementation; and that beneficiaries are beginning to trust theprogramme and therefore internalise the BISP cash as part of their household budget.
These two factors are likely to have contributed to findings that we see in other parts of this report.In other sections we see that the BISP has had a positive impact on the purchase of larger items

Benazir Income Support Programme: Final Impact Evaluation Report
© Oxford Policy Management 66
such as household assets (see Section 5.5), purchases of livestock (see Section 7.3) as well assupporting an increase in the proportion of beneficiaries with savings that is reported in thissection.
Table 21 also reports that the BISP does not have a statistically significant impact on theproportion of beneficiaries with an outstanding loan. Despite this relatively large proportions ofbeneficiaries in the RD treatment sample have an outstanding loan (almost a third), reflecting thevariation in incomes over the year for many beneficiaries who are reliant on casual labour.

Benazir Income Support Programme: Final Impact Evaluation Report
© Oxford Policy Management 67
8 Access to education
In this section we present the findings of the impact of the BISP on education. The key findingsare:
- There is some evidence from the qualitative research that some parents are using theBISP cash transfers to support education for their children
- Overall we do not find that the BISP has a statistically significant impact on schoolenrolment, either for boys or girls
- The cost of education remains high relative to the unconditional cash transfer componentof BISP
- We find some evidence of preferential investments for boys, particularly when finance ofeducation is a constraint
- Supply side factors are also important determinants of access to education, and thesecannot by addressed by an unconditional cash transfer
Education and the acquisition of skills are strongly influenced by both household factors and thewider environment including: the affordability of education; the access to and quality of education;and the market demand for labour.
There is a widely acknowledged link between low levels of education amongst children with poorparents and the persistence of poverty, with education in many countries correlating strongly withadult income and other markers of socio-economic status (Aldaz-Carroll and Moran, 2001). Thisobservation also appears pertinent in Pakistan where Afzal et. al. (2012) find that education andpoverty are inversely related, whilst Awan et. al. (2011) finds that education is negatively correlatedwith poverty status and that this correlation is stronger the higher the level of education.
Income poverty can lead to a cycle of lower education outcomes as poverty does not permit one tomake adequate investment in education and a low level of investment in education tends toaccentuate poverty of the individual (Thapa, 2013).
The qualitative research suggests that BISP beneficiaries continue to highlight theimportance education, including that for female education. The majority of respondents, bothbeneficiaries and non-beneficiaries reported that they wanted for their children to receive aneducation.
“People know that educating children is very important and everyone tries their best to send theirchildren to school including girls”. (Female Non-beneficiary FGD, District Ziarat, Balochistan)
“We know that it is equally important to send daughters to school as well, otherwise they will justend up like us” (Female Non-beneficiary FGD, District Charsadda, Khyber Pakhtunkhwa)
In some cases the qualitative research suggests that some beneficiaries are using the BISP cashtransfer to send their children to school.
“I am a widow and have seven children. Despite economic pressures, all my children go to schoolexcept my eldest son, who had to drop out of school after my husband died to start work as a

Benazir Income Support Programme: Final Impact Evaluation Report
© Oxford Policy Management 68
rickshaw driver. Two of my sons attend private schools, while one daughter and son go togovernment schools. I am only able to send my sons to private schools because of BISP”. (Female
IDI, District Karachi, South)
“BISP had definitely helped poor families in sending their children to school. Beneficiary womenspend their BISP grant for their children’s education needs. Sending children does not only mean
paying the school fee; there are a lot of other costs associated with sending children to schoolwhich can be very difficult for poor households to afford”. (Female Beneficiary FGD, District
Khushab, Punjab)
“From BISP money I manage to send my children to school which I otherwise would not have beenable to do without this cash. I basically keep aside BISP for this purpose” (Female IDI, District
Ziarat, Balochistan)
Table 22 Education: Impact Estimates
Control Treatment RDD impactestimate
Mean N Mean NProportion of childrenaged 5-9 years oldcurrently enrolled inschool
All children 64 3,945 65 4,695 6Male 67 2,069 69 2,492 10Female 61 1,876 61 2,203 1
Proportion of childrenaged 5-12 years oldcurrently enrolled inschool
All children 69 6,485 68 7,971 -3Male 72 3,455 73 4,194 2Female 65 3,030 63 3,777 -8
Source: BISP impact evaluation survey (2016). Notes: (1) Asterisks (*) indicate that an RD estimate isstatistically significant: *** p < .01; ** p < .05; * p < .10. (2) NR – Not Robust: suggests that there is weakevidence of impact, as whilst we do not find statistically significant impact at bandwidth of +/- 5 we dofind statistically significant impacts at other bandwidths (3) Samples sizes are given for bandwidth of +/-5 points around the cut-off. (4) Point estimates are weighted using triangular weights based on abandwidth of +/- 5 points around threshold
Despite some beneficiary households utilising the BISP cash transfer for education and a cleardesire for both boys and girls to be educated Table 22 reports that the BISP does not lead to astatistically significant increase in current school enrolment rates for children living in BISPbeneficiary households in the RD treatment sample on average. This result holds equally for boysand girls as well as across the 5-9 and 5-12 year-old age groups. In addition, Table 22 reports highproportions of children in the RD treatment sample, particularly girls, who are not currentlyattending school.
Value of the transfer and cost of educationFor an unconditional cash transfer such as the BISP to have an impact on schooling requires thatthe value of the transfer is sufficient to meet both basic household needs as well as thedirect and indirect cost of schooling. Figure 6 in Section 3.1.3 reveals that the per adultequivalent value of the transfer that was actually received in the last 12 months by BISPbeneficiaries in the last 12 months was PKR 187, or just 6.6% of total per adult equivalentconsumption expenditure.

Benazir Income Support Programme: Final Impact Evaluation Report
© Oxford Policy Management 69
Figure 24 demonstrates that the most common reason for not attending school is the expenseof education suggesting that the UCT component of the BISP has yet to alleviate this constrainton the demand for education for many children in BISP beneficiary households. Furthermore, wereport in Table 9 in Section 5.2 above that the BISP has not had a statistically significant impact onthe level of education expenditure in the household.
Figure 24 Reasons for not attending school
To understand why this is the case it is useful to consider cost of education relative to the value ofthe transfer provided. Pakistan Bureau of Statistics (2013) notes that the average monthlyexpenditure per pupil on education for children attending government schools in rural areas wasPKR 10627. This would account for 57% of the per adult equivalent value of the transfer that wasactually received in the last 12 months by BISP beneficiary households.
The complementary intervention, Waseela-e-Taleem Programme, a conditional cash transfer foreducation directly seeks to address this constraint by providing an additional top up of PKR 750per quarter per child aged 5-12 years old who is enrolled in school. We present the additionalimpact of this programme in a separate complementary report, where we find that this additionalprovision (combined with the conditions) is sufficient to increase child enrolment in school.
Some preference for boys’ educationIn some communities there was still a preference for sending boys rather than girls to school. Thiswas particularly true when financial pressures meant that not all children in the household could beeducated.
27 Expenditure includes on fees (admission, tuition, registration, examination, etc) as well as expenditure on uniforms,books and supplies, private tuition, transport, etc
36
35
10
6
6321
33
24
15
10
8
333
34
29
10
9
7
533
0
20
40
60
80
100
Male Female All
Source: BISP Impact Evaluation Survey 2016
Reasons for not attending school (5-12 years)
Too expensive
Too far away
Poor teaching / behaviour
Parents/elders did not approve
Child sick/handicapped
Child not willing
Education not useful
Other

Benazir Income Support Programme: Final Impact Evaluation Report
© Oxford Policy Management 70
“Education of boys and girls is equally important and people also realise this, but parents still havea preference for educating their sons especially in the case of limited finances”. (Teacher,
Community Key Informant, District Sukkur, Sindh)
This analysis seems to be supported by the quantitative data, where the non-approval of parentsor elders was a far more common reason for not attending school for girls (15%) as compared toboys (2%). However, one should be careful in the interpretation of this finding, in the sense of itbeing a simple value judgment on behalf of some parents on whether or not a girl should beeducated.
Aslam and Kingdon (2008) finds substantial evidence of a strong pro-male bias in the binarydecision of whether to spend anything on education amongst households in Pakistan. However,Aslam and Kingdon (2008) goes on to point out that whether this constitutes pure discrimination isopen for debate. Further evidence is required on the returns of education by gender to understandwhether gender bias in intra-household education is attributable to an investment motives, basedon gender differentials in labour market returns to education.
Public sector provision of educationThe success of an unconditional cash transfer such as the BISP in improving access to educationdepends crucially on the supply of education that can meet any increase in demand. It is welldocumented that Pakistan has historically allocated low levels of expenditure to the educationsector, with Figure 25 reporting that Pakistan has amongst the lowest level of educationexpenditure as a proportion of GDP in South Asia. This low level of spending has contributed toPakistan having amongst the lowest levels of adult literacy, highest rates of school drop-outs andlowest levels of primary school enrolment in South Asia (Human Development Report, 2013).
Figure 25 Education expenditure as a proportion of GDP
The Pakistan Education for All Report (GoP, 2015) notes that the low levels of spending has led toa range of supply side weaknesses in the Pakistan education system:
8.7
4.74.0
3.12.4 2.2 2.1
Regional Average
0
8
Maldives Nepal Bhutan India Pakistan Bangladesh Sri Lanka
Source: Thapa (2013)
Education expenditure as a % of GDP

Benazir Income Support Programme: Final Impact Evaluation Report
© Oxford Policy Management 71
- Shortage of schools especially for girls and in remote and far flung areas;- Shortage and high absenteeism of teachers;- A lack of qualified and trained teachers;- Missing facilities such as water, toilets and boundary walls; and- Weak supervision.
The qualitative research indicated that some beneficiaries indeed experienced supply sideconstraints to their access to education, particularly in the provision of education for girls.
“Sometimes schools are not accessible and parents cannot afford transport and so their childrenend up out of school” (Female Beneficiary FGD, District Ziarat, Balochistan)
“There is a primary school in the village where both boys and girls go. But after primary then only afew girls continue their education because the middle school is 3 to 4 km away and people don’twant their daughters to walk that far alone” (Teacher, Community Key Informant, District Sukkur,
Sindh)
An unconditional cash transfer, such as the BISP, in isolation cannot overcome such supply sideconstraints that would allow children in BISP beneficiary households to access education. Thishighlights the need for the BISP to be accompanied by complementary investments in educationboth to improve the quantity and quality of education if children in beneficiary households are tosee real improvements in their education outcomes.

Benazir Income Support Programme: Final Impact Evaluation Report
© Oxford Policy Management 72
Part E: Conclusion

Benazir Income Support Programme: Final Impact Evaluation Report
© Oxford Policy Management 73
9 ConclusionThis report represents the culmination of the independent impact evaluation of the BISP, andprovides the final set of findings as they relate to the implementation and potential impact onbeneficiaries. Quantitative and qualitative data have been collected and analysed that relate to theimpact 5 years after the BISP has initiated in its current form, in order to provide a comprehensiveand robust assessment of the impact of the programme. Impact is measured across a multitude ofdomains and we are now in a position to make a final set of conclusions as to where there is strongevidence of impact, where there is weak evidence of impact and where there is no evidence ofimpact.
Mitigating poverty
We find strong evidence that the BISP cash transfer has increased the welfare of BISPbeneficiary households at least in terms of increasing their consumption expenditure possibilities.This is to be expected given that the BISP provides households with an injection of cash additionalto their household income, but is not a foregone conclusion given that households may also sharethe transfer, save from the transfer or use it to pay down debt.
We also find strong evidence that the BISP cash transfer has reduced poverty, at least whenpoverty is measured using the poverty line that was relevant until May 2016. However, sinceMay 2016 the Government of Pakistan has re-defined the approach to measuring poverty whichhas resulted in the poverty line increasing by PKR 804 (33%). To put this increase into perspective,it represents over half of the total monthly value of the transfer.
The new poverty line has sufficiently increased relative to per adult equivalent value of the transfer(PKR 270), that we find no reduction in poverty when it is referenced in this way. Indeed after fiveyears of receiving support the average BISP beneficiary has a value of per adult equivalentconsumption expenditure that is PKR 456 below this newly calibrated poverty line, whilstbeing PKR 348 above the former poverty line.
The Government of Pakistan has made an implicit choice in its decision to increase the poverty linein this way: that the new poverty line represents what is now considered to be the basic minimumlevel of consumption expenditure that is sufficient to secure the necessities of life. The results ofthis evaluation suggest that, whilst the BISP cash transfer has certainly been welfare improving inmany dimensions, it is not of sufficient value to bring the average beneficiary to this newly definedminimum level of income that would allow them to secure the basic necessities of life.
Using the BISP transfer in new ways
A strong finding in the qualitative research indicated that women were beginning to think about theway in which they use the BISP cash transfer differently. Many women reported that at thebeginning of the programme they would binge on the money spending it quickly. However,overtime, as women have got used to receiving the transfer, its expenditure had becomemore planned.
This common observation is likely related to a series of results that are observed in this final roundof evaluation. This includes a series of larger investments being made, particularly in relation to thehomes of beneficiaries and we report strong evidence of a reduction in deprivations related toliving standards that include the quality of flooring in beneficiaries’ households and inimprovement in the quality of cooking fuel used.

Benazir Income Support Programme: Final Impact Evaluation Report
© Oxford Policy Management 74
Furthermore we report evidence that the BISP is enabling households to save, with thisincrease in the propensity to save being driven by formal savings. However, more could be done tosupport the financial access of BISP beneficiaries including the conversion of programme accountsthat would allow deposits as well as withdrawals.
Child nutrition remains a worry
Whilst we do find that the BISP has led to reductions in wasting in girls, the levels of childnutrition remain a concern, with levels of wasting and stunting that would represent anemergency as defined by the World Health Organisation. We do find some evidence of increasedfood consumption at household level. However, child nutrition outcomes are driven by more thanavailability of food, and are influenced by significant deprivations faced by beneficiary householdsparticularly in factors such as early childhood and maternal health care, immunisation, sanitationand access to clean drinking water.
The BISP is potentially a viable channel to address these child nutrition outcomes and couldpotentially emulate other social protection programmes that directly address the same issue, withexamples including conditional cash transfers for health or behavioural change messaging.
Contribution to changing livelihoods
The findings in this report suggest that the BISP has continued to make an appreciable differencein the types of livelihoods pursued by BISP beneficiaries. At the household level we find that theBISP has reduced the dependence of beneficiaries on casual labour. This is a positive findinggiven that casual labour is often associated with seasonal fluctuations, offering little in the way ofincome security.
This finding is driven by a reduction in the supply of casual labour by men within beneficiaryhouseholds, and an accompanying increase in the supply of labour by men in agricultural activitiesincluding managing livestock. This finding is supported by an increase in the proportion ofhouseholds that own small livestock such as sheep or goats.
We also report changes in the supply of female labour, with the BISP inducing a reduction in thesupply of unpaid family labour. This has not been accompanied by an overall reduction in thesupply of female labour. Whilst the quantitative results do not shed light on how women aresubstituting their labour, the qualitative research indicates that some women have begun toengage in self-employment of various kinds.
Unconditional cash does not impact education
Whilst many beneficiaries have expressed that they place considerable value on education, of bothboys and girls, we do not find that the BISP transfer has led to an increase in the proportion ofprimary aged children attending school.
The success of an unconditional cash transfer to have an impact on school enrolment depends ontwo factors: (1) the value of the transfer relative to the cost of schooling; and (2) the level ofeducation service delivery.
In this report we have noted that the level of the cash transfer is relatively low, comprising of justunder 10% of a households monthly budget. Additionally we report that the cost of educationremains one of the most significant barriers to accessing education.

Benazir Income Support Programme: Final Impact Evaluation Report
© Oxford Policy Management 75
Furthermore we note that Pakistan has allocated relatively low levels of expenditure to theeducation sector, compared to its closest regional neighbours. Furthermore the Government ofPakistan’s own Pakistan Education for All Report suggests that this has led to a range of supplyside weaknesses including a lack of qualified teachers and a shortage of schools, particularly forgirls.
These findings highlight the need for complementary interventions that address both demand andsupply side issues. Programmes such as the BISP’s own Waseela-e-Taleem programme will helpbeneficiaries to overcome financial barriers, whilst greater investment in education through sectorprogrammes such as those implemented the Chief Minister’s Road Map for Education in Punjabwill help to alleviate supply side barriers.
Building on impact observed in previous evaluation rounds
This report represents the final findings of the independent impact evaluation of the BISP. It followstwo previous impact evaluation reports – OPM (2013) and OPM (2014). As a set the reports tell aconsistent story of slowly building impact. In each round of evaluation it was observed that theBISP has contributed to the mitigation of poverty and the support of household incomes.
In each report we have observed that the BISP has supported a change in the livelihoodsstrategies adopted by beneficiary households and in particular a reduction in the reliance on casuallabour of male household members. However, for the first time in the 2016 evaluation report wesee that the BISP has reduced the proportion of households who rely on casual labour as theirmain source of income.
It is now 5 years since many BISP beneficiaries received their first transfer and for the first time weobserve that the BISP is supporting other changes, particularly as beneficiaries begin to better plantheir expenditure of the transfer. In particular the 2016 evaluation report notes for the first time thatthe BISP has supported an increase in savings and improvements in material welfare.
However, challenges remain that may be outside the scope of an unconditional transfer to tacklealone. In particular the BISP continues to not have an impact on either education or child nutrition,which, as we note above, will require additional investments to tackle.

Benazir Income Support Programme: Final Impact Evaluation Report
© Oxford Policy Management 76
ReferencesAkram, M. and Khan, F. (2007) Public Provision of Education and Government Spending in
Pakistan. PIDE Working Papers 2007:40Aldaz-Carroll, E. and Moran, R. (2001) Escaping the poverty trap in Latin America: the role of
family factors. Cuadernos de economia, Vol.38 No.114Alderman, H., Hoddinott, J. and Kinsey, B. (2003) Long-term consequences of early childhood
malnutrition. FCND Discussion Paper No. 168. IFPRIAslam, M. and Kingdon, G. (2008) Gender and household education expenditure in Pakistan.
Applied Economics Vol. 40, Issue 20, 2008Baird, S., Ferreira, F., Özler, B. and Woolcock, M. (2013) Relative effectiveness of conditional and
unconditional cash transfers for schooling outcomes in developing countries: A systematicreview. Campbell Systematic Reviews 2013:8
Bird, K. (2007) The intergenerational transmission of poverty: an overview. ODI working paper 286Birdsall, Nancy, Ruth Levine, and Amina Ibrahim. (2005) “Towards Universal Primary Education:
Investments, Incentives, And Institutions.” European Journal of Education 40, no. 3 (2005):337-349.
Bland, J.M. and Altman, D.G. (1994) Statistics Notes: Regression towards the mean”. BritishMedical Journal 1994;308:1499
Calonico, S., Cattaneo, M. D. and Titiunik, R. (2013) Robust nonparametric confidence intervals forregression discontinuity designs. University of Michigan, Department of Economics.
CGAP. (2013) An overview of the G2P payments sector in Pakistan. Consultative Group to Assistthe Poor
Chambers, R. and Conway, G. (1991) Sustainable rural livelihoods: practical concepts for the 21st
century. IDS Discussion Paper 296Coady, D., Grosh, M. and Hoddinott, J. (2004) Targeting of transfers in developing countries:
review of lessons and experience. IFPRI, World Bank.Cohen, J. (1992) A power primer. Psychological bulletin. Vol 112. No 1Cohen, J. (1998) Statistical power analysis for behavioural sciences. Hillside, NJ.CPAN (2013) Working out of chronic poverty: a policy guide. Chronic Poverty Advisory Network,
Policy Guide 4.Daidone, S., Pellerano, L., Handa, S. and Davis, B. (2015) Is Graduation from Social Safety Nets
Possible? Evidence from Sub-Saharan Africa. IDS Bulletin, 46: 93-102Davis, B (2014) The impact of social cash transfers on labour market outcomes: the evidence from
sub-Saharan Africa. International Seminar and Policy Forum, IPEA Headquarters, BrasiliaDel Ninno, C. and Lundberg, M. (2005) Treading water: the long-term impact of the 1998 flood on
nutrition in Bangladesh. Econ Hum Biol. 3, 67-96Dercon, S. and Hoddinott, J. (2003) Health, Shocks and Poverty Persistence. “Insurance against
poverty”. World Development Economics Research, United Nations UniversityDFID (2011) Cash transfers. Evidence Paper. Policy Division. Department for International
Development.Dorofeev, S. and Grant, P. (2006) Statistics for real life sample surveys: non-simple random
samples and weighted data. Cambridge University PressDuflo (2003). Grandmothers and granddaughters: old age pension and intra-household allocation
in South Africa. NBER Working Paper 8061

Benazir Income Support Programme: Final Impact Evaluation Report
© Oxford Policy Management 77
FAO. (2002) Food energy – methods of analysis and conversion factors. FAO food and nutritionpaper 77.
FAO. (2013) The State of Food Insecurity in the World. The multiple dimensions of food security.Food and Agricultural Organisation of the United Nations
FAO (2015) Nutrition and Social Protection. Food and Agriculture OrganisationGerber, A. and Green D. (2012) Field experiments: design, analysis and interpretation. W.W.
Norton and Company.Gertler, P.J., Martinez, S., Premand, P., Rawlings, L. and Vermeersch, C. (2011) “Impact
Evaluation in Practice” World BankGilligan, D., Hoddinott, J., Kumar, N. and Taffesse, A. (2009) An Impact Evaluation of Ethiopia’s
Productive Safety Nets Programme. International Food Policy Research InstituteGovernment of Pakistan (2013) Pakistan Economic Survey 2012/2013. Ministry of Finance,
Government of PakistanGovernment of Pakistan (2015) Pakistan Education for All. Review Report 2015. Ministry of
Education, Trainings and standards in Higher Education Academy of Educational Planning andManagement Islamabad
Government of Pakistan (2016) Pakistan Economic Survey 2015-2016. Ministry of Finance,Government of Pakistan
Grembi V., Nannicini T. and Troiano, U. (2013) Policy responses to fiscal restraints: a difference-in-discontinuities design. Working paper n.397. IGIER, Universita Boccconi
Guerrrant, R. et. al. (2008) Malnutrition as an enteric infectious disease with long-term effects onchild development
Hallman, K. (2000) Mother-father resource control, marriage payments and girl-boy health in ruralBangladesh. Food Consumption and Nutrition Division Discussion Paper 93. IFPRI.
Ibrahim, S. and Alkire S. (2007) Agency and empowerment: a proposal for internationallycomparable indicators. OPHI Working Paper Series.
IMF. (2010) Pakistan: Poverty Reduction Strategy Paper. International Monetary Fund CountryReport No. 10/183
Kabeer, N. (1999) Resources, agency, achievements: reflections on the measurement of women’sempowerment. Development and Change Vol. 30. Kish, L. (1965) Survey Sampling. New York.Wiley.
Kabeer, Naila. “Gender Equality And Women’s Empowerment: A Critical Analysis Of The ThirdMillennium Development Goal.” Gender & Development 13, no. 1 (2005): 13-24.
Kish, L. (1965) Survey Sampling. New York. Wiley.Krebs, N., Mazariegos, M., Tshefu, A., Bose, C., Sami, N., Chomba, E., Carlo, W., Goco, N.,
Kindem, M., Wright, L. and Hambidge, K. (2011) Meat consumption is associated with lessstunting among toddlers in four diverse low-income settings. Food Nutrition Bull. 2011September; 32(3): 185-191
Levine, Ruth, Cynthia Lloyd, Margaret Greene, and Caren Grown (2008). Girls count: a globalinvestment & action agenda. Washington, DC: Center for Global Development, 2008.
Manley, J., Gitter, S. Slavcheska, V. (2012) How effective are cash transfer programmes atimproving nutritional status? A rapid assessment of programmes’ effects on anthropometricoutcomes. London: EPPI-Centre, Social Science Research Unit, Institute of Education,University of London.
McCrary, J., (2007) Testing for manipulation of the running variable in the regression discontinuitydesign. Journal of Econometrics 142
Nayaran, D. (2002) Empowerment and poverty reduction: a sourcebook. World Bank

Benazir Income Support Programme: Final Impact Evaluation Report
© Oxford Policy Management 78
OPM (2011a) Benazir Income Support Programme: Baseline survey report. Oxford PolicyManagement
OPM (2011b) Evaluating implementation of Pakistan’s Citizen’s Damage CompensationProgramme Phase I. Final Report. Oxford Policy Management.
OPM (2014) Benazir Income Support Programme: First Follow-Up Impact Evaluation Report.Oxford Policy Management
OPM (2015) Benazir Income Support Programme: Second Follow-up Impact Evaluation Report.Oxford Policy Management
Pakistan Bureau of Statistics (June, 2013) Press release on inflation rate. Pakistan Bureau ofStatistics. Government of Pakistan.
Pakistan Bureau of Statistics (2013) PSLM 2011-12. Pakistan Social and Living StandardsMeasurement Survey (2011-12). National/Provincial. Government of Pakistan. StatisticsDivision. Pakistan Bureau of Statistics.
Pakistan Microfinance Network (2009) Access to finance survey. Pakistan Microfinance Network &FinMark Trust.
Quisumbing, A. and Maluccio, J. (2003) Resources at marriage and intra-household allocation:Evidence from Bangladesh, Ethiopia, Indonesia and South Africa. Oxford Bulletin of Economicsand Statistics 65 (3).
Rodriguez-Lianes, J., Ranjan-Dash, S., Degomme, O., Mukhopadhyay, A. and Guha-Sapir, D.(2011) Child malnutrition and recurrent flooding in rural eastern India: a community basedsurvey. British Medical Journal.
Schochet, P. (2008) Technical methods report. Statistical power for regression discontinuity designin education evaluations. Institute of Education Sciences. US Department of Education
Schultz, T. Paul. (2001) Why governments should invest more to educate girls. New Haven, CT:Economic Growth Center, Yale University, 2001.
Sen, Purna. (1999) “Enhancing Women’s Choices In Responding To Domestic Violence InCalcutta: A Comparison Of Employment And Education.” The European Journal ofDevelopment Research 11, no. 2 (1999): 65-86.
Siaens, C. (2008) Challenges for education in Sindh Pakistan: Key research findings on accessand quality. South Asia Human Development, World Bank
Smith, L. and Haddad, L. (2000) Explaining child malnutrition in developing countries: a cross-country analysis. Research report 111. IFPRI
Thapa, S. (2013) Relationship between Education and Poverty in Nepal” Economic Journal ofDevelopment Issues. Vol 14 & 16 No.1-2(2013) Combined Issue
Udry, C. (1994) Risk and Insurance in a Rural Credit Market: An empirical Investigation of NorthernNigeria. Review of Economic Studies, vol. 61(3), pp. 495– 526.
UNICEF (2013) “Improving Child Nutrition. The achievable imperative for global progress”
WFP (2008) Food Consumption Analysis: Calculation and use of the food consumption score infood security analysis. World Food Programme
World Bank (2008) Analysing health equity using household survey data. A guide to techniquesand their implementation. WBI learning resource series. World Bank
World Bank (2009) Pakistan: Priorities for Agriculture and Rural Development. World BankWorld Bank (2012) The Cash Dividend: The Rise of Cash Transfer Programmes in Sub-Saharan
Africa. Human Development, World BankWorld Bank (2013) Pakistan: towards an integrated national safety net system. Assisting poor and
vulnerable households. An analysis of Pakistan’s main cash transfer programme. World Bank

Benazir Income Support Programme: Final Impact Evaluation Report
© Oxford Policy Management 79

Benazir Income Support Programme: Final Impact Evaluation Report
© Oxford Policy Management 80
Annex A Impact evaluation methods: technical appendix
Regression Discontinuity (RD) can be used to estimate the causal effect of a treatment on one ormore outcomes of interest when the treatment is a deterministic function of an assignment variableand the threshold that determines the treatment is known. Under certain assumptions we can useobservations close to the eligibility threshold and work with them as if treatment around thisthreshold were random. In the close neighbourhood of the threshold we can then identify causalimpact of having receiving payments through the BISP on an outcome of interest (yi) by taking thedifference in outcomes for the treatment and control observations at the eligibility threshold.(1) − (0) = ( | , = 1, ) − ( | , = 0, )We will use a non-parametric approach to estimate the impact of the BISP on its beneficiaries. Thisinvolves estimating the differences in intercepts (i.e. the discontinuity) of two local polynomialestimators, one from each side of the eligibility threshold c0. Formally for a positive bandwidth h:
min − ( − ) −ℎThe key features of this approach are include the implementation of a local linear regression insome bandwidth h around the eligibility threshold. The estimation of impact is sensitive to thechoice of the bandwidth. Thus whilst in the main body of the report we present the results of justone bandwidth (+/- 5 points around the cut-off) we present the estimates of the discontinuityobserved with a variety of bandwidths. This is presented in Annex B.
A kernel weighting approach is also used, as determined by the kernel function K(.) such that thedata is weighted according to its distance from the cut-off point. We implement a triangular kernelweight which gives greater weight to data points closer to the cut-off than those further away, withthe weights falling off in a linear fashion.
A.1 Sensitivity testing
To be satisfied with the robustness of our findings we conduct the following sensitivity tests, theresults of which can be found in Annex B:
We test sensitivity of results to the choice of bandwidth. Results reported in the main reportare based on a bandwidth of +/- 5 points around the cut-off. In annex B we also reportestimates of the discontinuity at a variety of other bandwidths.
We test for discontinuities away from the eligibility threshold. If there is a discontinuity awayfrom the eligibility threshold this would suggest that some other factor is driving theobserved discontinuity at the eligibility threshold. In Annex B we report the estimate of thediscontinuity at a point ±1 away from the eligibility threshold.
We find that our results presented in the main report are robust to the sensitivity tests applied.
A.2 Assumptions of RD
RD will identify the combined causal impact of being treated by the BISP UCT on the outcomes ofinterest if the only source of discontinuity in the outcomes at the eligibility threshold is the

Benazir Income Support Programme: Final Impact Evaluation Report
© Oxford Policy Management 81
probability of receiving the BISP treatment. In order for this to hold we need to satisfy fiveassumptions, which are presented below:
Assumption 1: the assignment variable has a monotonic effect on the probability of being treatedfor everyone. Whilst this assumption cannot be tested directly we can be reasonably confident thatthe lower your poverty score the higher your probability of being targeted as eligible by the BISPand the higher your probability of receiving the BISP cash transfer.
Assumption 2: the gains from treatment must be a function of the assignment variable at theeligibility threshold. This assumption relates to worries about the ability of households tomanipulate the assignment score and increase their probability of being BISP eligible.
This can be formally tested, and Figure 26 presents the results of a test of a discontinuity in theBISP poverty score at the eligibility threshold following McCrary (2007) which tests whether themarginal density of the BISP poverty score is continuous across the eligibility threshold.
Figure 26 Density of BISP poverty score at eligibility threshold (matched MIS scores)28
The results of this test reports that there is no statistically significant jump in the marginal density atthe eligibility threshold Additional RD tables: Sensitivity Tests
Assumption 3: there must be a discontinuity in the probability of being treated by BISP around theeligibility threshold. This requires that the BISP is sufficiently well implemented such that those whoare determined to be eligible actually receive the BISP and those who are ineligible do not. Figure27 presents this analysis.
28 BISP poverty score normalised so that eligibility threshold = 0
0.1
.2.3
.4.5
-5 0 5Source: BISP Impact Evaluation Survey (2016)
Estimate of density at eligibility threshold

Benazir Income Support Programme: Final Impact Evaluation Report
© Oxford Policy Management 82
Whilst there is a statistically significant jump in the probability of treatment, there are some cross-overs – i.e. some ineligible households receive BISP payments and some eligible households aremissed by the programme and some eligible households do not receive the payment. Additionallysome households with scores greater than the 16.17 eligibility cut-off receive the transfer due toalternative rules for specific groups such as disabled family heads. Given that the treatment statusis only partially determined by the BISP poverty score we implement a fuzzy regressiondiscontinuity (FRD) as discussed in A.3 below.
Figure 27 Discontinuity in probability of treatment29
Assumption 4: the observables must be a continuous function of the assignment score at theeligibility threshold. In practice this assumption applies to both observable householdcharacteristics that might affect our outcome variables of interest and requires that at least atbaseline there is no discontinuity in observable characteristics and outcome variables at theeligibility threshold. If this assumption is violated we could not be sure whether any discontinuityobserved at follow-up represents false impact due to a pre-existing discontinuity in that outcomevariable, driven by a factor other than the BISP.
However, in the case of this round of the evaluation, this assumption cannot be directly tested asthe majority of the sample was freshly sampled for this round of the evaluation, meaning that forthe majority of the evaluation sample we do not have baseline values of household characteristics.However, we can be confident that this assumption is satisfied given that this assumption wasstrongly satisfied for the sub-set of households for which there is baseline information. Thisanalysis was provided in our previous follow-up reports, including for the 2nd follow-up impactevaluation report (OPM, 2015).
29 BISP poverty score normalised so that eligibility threshold = 0
0.2
.4.6
.81
-5 0 5Source: BISP Impact Evaluation Survey 2016. Estimate of discontinuity: -0.6. Std. error: .039
Discontinuity in probability of treatment

Benazir Income Support Programme: Final Impact Evaluation Report
© Oxford Policy Management 83
Assumption 5: unobservables must be a continuous function of the assignment score at theeligibility threshold. This assumption relates to concerns over the possibility of a discontinuity inunobservable variables (such as ability) that could affect the outcome variable of interest. If such adiscontinuity existed, then one could not be sure if a discontinuity in the outcome indicator ofinterest observed at follow-up is attributable to the BISP cash transfer or the unobservablevariable.
By nature of unobservable indicators it is not possible to test this assumption. However, given thatwe are confident that we have satisfied Assumption 4 at baseline it is likely that this assumption willalso hold.
A.3 Fuzzy regression discontinuity
As discussed above against Assumption 3 we find that BISP treatment is only partially determinedby the BISP poverty score, and we find that some eligible households are not beneficiaries of theprogramme and some ineligible households have become beneficiaries of the programme.
We therefore implement a Fuzzy Regression Discontinuity (FRD) design. In principal thetreatment effect is recovered by dividing the jump in the relationship between the outcome variableof interest and the BISP poverty score, by the jump in the relationship between treatment status toprovide an unbiased estimate.
The implementation of the FRD is conducted using two-stage least squares (2SLS). In the firststage we estimate the value of the treatment status, which is then used in place of actual treatmentstatus in the second stage where we estimate the impact of the BISP programme on the outcomevariable of interest.

Benazir Income Support Programme: Final Impact Evaluation Report
© Oxford Policy Management 84
Annex B RD sensitivity tables: technical appendix
Table 23 Household consumption expenditure and poverty: RD sensitivity tables
Estimate at bandwidth
2.5 3 3.5 4 4.5 5Mean household consumptionexpenditure per adultequivalent (PKR)
Pakistan 137.197 186.506* 215.058** 208.403** 199.802** 187.552**Punjab 343.927* 381.306** 304.051* 264.174 238.574 198.971Sindh -331.871 -174.5 -44.86 -15.952 23.71 64.158KP 218.695 288.516 382.634** 358.336** 320.448* 275.486Balochistan 739.611 746.92 736.2 677.8 619.1 505.94
Proportion of population belowpoverty line (FEI Methodology)
Pakistan -8.85* -8.702* -7.737* -6.86 -6.796* -6.651*Punjab -2.617 -6.01 -2.728 -1.728 -1.137 -.38Sindh -2.277 -5.266 -6.807 -7.005 -9.41 -10.838KP -16.471 -16.514* -17.112** -14.438* -12.257 -10.02Balochistan -4.0773 -3.8581 -4.1597 -3.7493 -3.676 -3.5654
Poverty gap (%) (FEIMethodology)
Pakistan -.021* -.018* -.013 -.013 -.013 -.013Punjab -.014 -.013 -.007 -.006 -.008 -.009Sindh -.006 -.013 -.014 -.014 -.017 -.021KP -.041* -.043** -.046** -.044** -.04** -.033**Balochistan .053 .058 .065 .065 .062 .054
Proportion of population belowpoverty line (CBNMethodology)
Pakistan -7.412 -7.743 -7.697 -6.066 -4.726 -4.131Punjab -14.514 -13.844 -8.7171 -4.382 -1.217 .962Sindh 8.229 4.534 -.019 .339 -1.135 -2.413KP -3.408 -5.758 -8.288 -6.956 -5.297 -4.401Balochistan -1.1324 -9.3637 -8.3932 -7.701 -7.14 -6.349
Poverty gap (%) CBNMethodology
Pakistan -.04** -.039** -.036** -.033** -.032** -.031**Punjab -.058** -.059** -.042* -.033 -.029 -.024Sindh .011 -.003 -.012 -.014 -.023 -.031KP -.05 -.059* -.073** -.069** -.061** -.051*Balochistan -.086 -.072 -.063 -.047 -.043 -.039
Source: BISP impact evaluation survey (2016). Notes: (1) Asterisks (*) indicate that an RD estimate is statisticallysignificant: *** p < .01; ** p < .05; * p < .10.
Table 24 Non-food consumption expenditure: RD sensitivity tables
Estimate at bandwidth
2.5 3 3.5 4 4.5 5Mean household non-foodconsumption expenditureper adult equivalent (PKR) 32.958 83.431 111.017* 114.85* 117.95** 118.848**Mean household non-foodconsumption expenditureper adult equivalent on…(PKR)
Education 10.234 15.685 14.155 6.509 3.22 4.942Health -34.931* -22.136 -6.523 1.777 5.918 4.906Housing expenses 114.523*** 131.403*** 130.417*** 132.431*** 130.908*** 123.514***Transport -37.934*** -34.641*** -30.736*** -27.369** -24.56** -21.93**Cleaning 9.645 10.043 9.2100 9.056 8.615 8.419

Benazir Income Support Programme: Final Impact Evaluation Report
© Oxford Policy Management 85
Estimate at bandwidth
2.5 3 3.5 4 4.5 5Apparel -1.673 3.121 10.563 12.24 11.761 11.969
Source: BISP impact evaluation survey (2016). Notes: (1) Asterisks (*) indicate that an RD estimate is statisticallysignificant: *** p < .01; ** p < .05; * p < .10.
Table 25 Food consumption expenditure: RD sensitivity tables
Estimate at bandwidth
2.5 3 3.5 4 4.5 5Mean household foodconsumption expenditure peradult equivalent (PKR) 104.239 103.075* 104.041* 93.553* 81.852 68.704Mean household foodconsumption expenditure peradult equivalent on… (PKR)
Wheat 12.236 -3.803 -8.42 -9.542 -9.052 -6.286Maize 1.811 1.213 .857 .05 -.348 -.5Rice -26.165** -20.055* -12.527 -9.5471 -11.313 -14.284Vegetables -7.889 -5.08 -4.58 -3.567 -1.049 .737Meat 26.923** 34.333*** 34.232*** 31.137*** 27.655*** 23.219**Fish 9.06 10.098** 10.105** 10.357** 9.794** 8.058**Eggs 4.605 5.351 4.505 3.892 3.947 3.719
Source: BISP impact evaluation survey (2016). Notes: (1) Asterisks (*) indicate that an RD estimate is statisticallysignificant: *** p < .01; ** p < .05; * p < .10.
Table 26 Asset ownership: RD sensitivity tables
Estimate at bandwidth
2.5 3 3.5 4 4.5 5Proportion of households thatown…
Fan -.026 -.008 -.005 0 .005 .017Heater .057* .071*** .077*** .067*** .057*** .042*Bicycle .119** .097** .08* .067 .066 .067*Car -.001 .001 .001 .001 0 .001Motorcycle .131 .116 .083 .074 .069 .065TV .192*** .216*** .193*** .167*** .149*** .143***Radio -.023 -.013 -.008 -.007 -.008 -.01
Source: BISP impact evaluation survey (2016). Notes: (1) Asterisks (*) indicate that an RD estimate is statisticallysignificant: *** p < .01; ** p < .05; * p < .10.
Table 27 Deprivations in living standards: RD sensitivity tables
Estimate at bandwidth
2.5 3 3.5 4 4.5 5Proportion of households thatare deprived against…
Electricity .07 .052 .041 .037 .032 .022Sanitation .087 .064 .076 .085 .091 .087Flooring -.132** -.167*** -.141*** -.121** -.117** -.119**Water -.009 .042 .06 .043 .033 .023Cooking fuel -.28*** -.304*** -.267*** -.239*** -.216*** -.193***Assets -.26*** -.257*** -.215*** -.18*** -.163*** -.153***
Source: BISP impact evaluation survey (2016). Notes: (1) Asterisks (*) indicate that an RD estimate is statisticallysignificant: *** p < .01; ** p < .05; * p < .10.

Benazir Income Support Programme: Final Impact Evaluation Report
© Oxford Policy Management 86
Table 28 Women’s access to money: RD sensitivity tables
Estimate at bandwidth
2.5 3 3.5 4 4.5 5Proportion of women whoreport that they can easilyaccess in an emergency…
100 9.78 8.817 6.931 5.448 4.447 4.179200 8.784 10.257 9.552 8.266 7.394 7.54400 10.205 10.935 9.583 9.305 8.351 8.636600 19.852** 20.45*** 18.645*** 18.991*** 17.687*** 17.409***800 18.459** 18.957*** 16.965*** 16.607*** 15.502*** 15.556***1,000 18.801** 18.014*** 15.939** 15.653** 14.685** 14.984***
Source: BISP impact evaluation survey (2016). Notes: (1) Asterisks (*) indicate that an RD estimate is statisticallysignificant: *** p < .01; ** p < .05; * p < .10.
Table 29 Deprivations in living standards: RD sensitivity tables
Estimate at bandwidth
2.5 3 3.5 4 4.5 5Proportion of women whoreport that they can easilyaccess in an emergency…
100 9.78 8.817 6.931 5.448 4.447 4.179200 8.784 10.257 9.552 8.266 7.394 7.54400 10.205 10.935 9.583 9.305 8.351 8.636600 19.852** 20.45*** 18.645*** 18.991*** 17.687*** 17.409***800 18.459** 18.957*** 16.965*** 16.607*** 15.502*** 15.556***1,000 18.801** 18.014*** 15.939** 15.653** 14.685** 14.984***
Source: BISP impact evaluation survey (2016). Notes: (1) Asterisks (*) indicate that an RD estimate is statisticallysignificant: *** p < .01; ** p < .05; * p < .10.
Table 30 Women voting: RD sensitivity tables
Estimate at bandwidth
2.5 3 3.5 4 4.5 5Proportion of women whoreport that they can easilyaccess in an emergency…
100 13.92** 11.233** 10.549** 11.378** 12.327*** 13.544***200 20.25** 17.905** 14.612* 12.395* 11.49* 10.969*400 -7.524 -6.025 -2.033* 1.606 2.607* 3.381*600 8.144 10.184* 10.73* 10.524* 10.573* 11.314*800 -5.198 -8.848 -7.371 -6.8424 -5.907 -3.872
Source: BISP impact evaluation survey (2016). Notes: (1) Asterisks (*) indicate that an RD estimate is statisticallysignificant: *** p < .01; ** p < .05; * p < .10.
Table 31 Female mobility: RD sensitivity tables
Estimate at bandwidth
2.5 3 3.5 4 4.5 5Proportion of women reportingthat they can freely visitalone…
Market 16.615*** 13.523** 10.562** 9.913** 10.536** 11.127**Health Centre 19.325*** 14.014*** 10.678** 9.712** 9.195** 8.881**Friend’s house 14.088** 8.737* 5.163* 3.695* 3.161 3.118Religious centre 15.944*** 11.984** 9.244** 7.839* 6.849* 5.857*
Source: BISP impact evaluation survey (2016). Notes: (1) Asterisks (*) indicate that an RD estimate is statisticallysignificant: *** p < .01; ** p < .05; * p < .10.
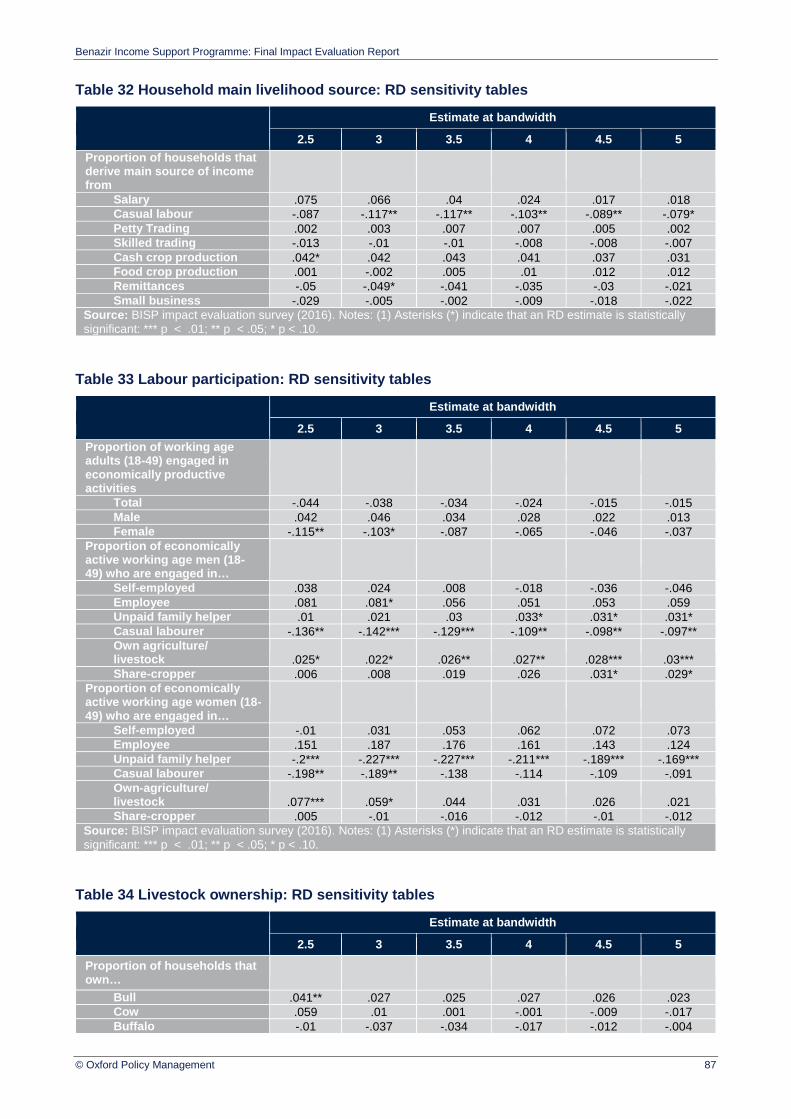
Benazir Income Support Programme: Final Impact Evaluation Report
© Oxford Policy Management 87
Table 32 Household main livelihood source: RD sensitivity tables
Estimate at bandwidth
2.5 3 3.5 4 4.5 5Proportion of households thatderive main source of incomefrom
Salary .075 .066 .04 .024 .017 .018Casual labour -.087 -.117** -.117** -.103** -.089** -.079*Petty Trading .002 .003 .007 .007 .005 .002Skilled trading -.013 -.01 -.01 -.008 -.008 -.007Cash crop production .042* .042 .043 .041 .037 .031Food crop production .001 -.002 .005 .01 .012 .012Remittances -.05 -.049* -.041 -.035 -.03 -.021Small business -.029 -.005 -.002 -.009 -.018 -.022
Source: BISP impact evaluation survey (2016). Notes: (1) Asterisks (*) indicate that an RD estimate is statisticallysignificant: *** p < .01; ** p < .05; * p < .10.
Table 33 Labour participation: RD sensitivity tables
Estimate at bandwidth
2.5 3 3.5 4 4.5 5Proportion of working ageadults (18-49) engaged ineconomically productiveactivities
Total -.044 -.038 -.034 -.024 -.015 -.015Male .042 .046 .034 .028 .022 .013Female -.115** -.103* -.087 -.065 -.046 -.037
Proportion of economicallyactive working age men (18-49) who are engaged in…
Self-employed .038 .024 .008 -.018 -.036 -.046Employee .081 .081* .056 .051 .053 .059Unpaid family helper .01 .021 .03 .033* .031* .031*Casual labourer -.136** -.142*** -.129*** -.109** -.098** -.097**Own agriculture/livestock .025* .022* .026** .027** .028*** .03***Share-cropper .006 .008 .019 .026 .031* .029*
Proportion of economicallyactive working age women (18-49) who are engaged in…
Self-employed -.01 .031 .053 .062 .072 .073Employee .151 .187 .176 .161 .143 .124Unpaid family helper -.2*** -.227*** -.227*** -.211*** -.189*** -.169***Casual labourer -.198** -.189** -.138 -.114 -.109 -.091Own-agriculture/livestock .077*** .059* .044 .031 .026 .021Share-cropper .005 -.01 -.016 -.012 -.01 -.012
Source: BISP impact evaluation survey (2016). Notes: (1) Asterisks (*) indicate that an RD estimate is statisticallysignificant: *** p < .01; ** p < .05; * p < .10.
Table 34 Livestock ownership: RD sensitivity tables
Estimate at bandwidth
2.5 3 3.5 4 4.5 5Proportion of households thatown…
Bull .041** .027 .025 .027 .026 .023Cow .059 .01 .001 -.001 -.009 -.017Buffalo -.01 -.037 -.034 -.017 -.012 -.004

Benazir Income Support Programme: Final Impact Evaluation Report
© Oxford Policy Management 88
Estimate at bandwidth
2.5 3 3.5 4 4.5 5Sheep .031 .028 .026 .028* .028* .025*Goat .091* .082* .103** .1** .097** .087**Poultry -.025 -.021 -.008 .001 .003 .003
Source: BISP impact evaluation survey (2016). Notes: (1) Asterisks (*) indicate that an RD estimate is statisticallysignificant: *** p < .01; ** p < .05; * p < .10.
Table 35 Savings: RD sensitivity tables
Estimate at bandwidth
2.5 3 3.5 4 4.5 5Proportion of households thathave
Any savings 6.356 8.173** 9.707** 9.977*** 9.421*** 9.022***Formal savings 1.531 3.006 4.728* 5.096* 4.851* 4.827*Informal savings .294 1.145 1.963 2.667 2.734 2.676
Source: BISP impact evaluation survey (2016). Notes: (1) Asterisks (*) indicate that an RD estimate is statisticallysignificant: *** p < .01; ** p < .05; * p < .10.
Table 36 Education: RD sensitivity tables
Estimate at bandwidth
2.5 3 3.5 4 4.5 5Proportion of children aged 5-9years old currently attendingschool
All children 3.701 6.072 6.573 4.401 4.021 5.731Male 10.635 13.402* 12.778* 10.062 9.25 9.744Female -5.184 -3.002 -1.122 -2.211 -1.92 1.456
Proportion of children aged 5-12years old currently attendingschool
All children -10.189** -6.721 -4.671 -6.091 -5.516 -3.125Male -4.127 -.844 .878 -.551 .159 1.737Female -16.72 -12.799 -10.482 -11.837 -11.354 -7.95
Source: BISP impact evaluation survey (2016). Notes: (1) Asterisks (*) indicate that an RD estimate is statisticallysignificant: *** p < .01; ** p < .05; * p < .10.

Benazir Income Support Programme: Final Impact Evaluation Report
© Oxford Policy Management 89
Annex C Consumption expenditure and poverty: technicalappendix
The consumption aggregate which is considered a better indicator of household welfare thanincome in developing countries has been calculated. The consumption expenditure includes bothpaid and unpaid such as:
Purchased and consumed Own produced and consumed Wages and salaries in kind received and consumed Received as gift, assistance or inheritance and consumed
There are different components of household consumption expenditure. Mainly, consumptionaggregate includes consumption expenditure incurred on food items, fuel and utilities, house rentand housing, frequent non-food expenses such as household laundry, cleaning, personal careproducts and services. Other leading non-food expenses relate to clothes, footwear, education andhealth-related expenses. However, some consumption expenditures not related to living standardshave been excluded while computing consumption aggregate. These relate to expenses which areof lumpy nature and seriously compromise the household/individual welfare ranking, such asexpenses on religious functions like marriage and funerals.
Different items have different recall periods. There are certain items for example milk, meat, fruitsand vegetables which are very frequently consumed by the households and the recall period forsuch items is last fortnight before the date of interview. The recall period is last month before theinterview for those items such as wheat, rice, pulses, vegetable ghee, tea and fuels which are lessfrequently consumed. The recall period is last year from interview for items which are occasionallypurchased and consumed such as cloth, shoes and medical expenses. When the expenditure ofthese items is aggregated, they are homogenised in monthly terms.
Household surveys collect data about household consumption expenditure at the household levelwhereas welfare needs to be measured at the individual level. Therefore, household consumptionexpenditure is adjusted by household size and its composition. The common practice is to get percapita consumption expenditure by dividing the household consumption expenditure by thehousehold size, ignoring the adjustment of household composition.
This argument does not carry much weight because it gives equal welfare ranking to twohouseholds with the same total consumption and same number of household members whereasone household is dominated by adults and the other by children. Nutrition-based adult equivalentscales, which differentiate between households on the basis of sex and age, are also used in someresearch to convert individuals in a household into adult equivalent. However, the use of suchscales to non-food consumption expenditure is not convincing. In this report, the household hasbeen adjusted by a simple scale in order to get per adult equivalent consumption expenditure. Thisscale applies a weight of 0.8 to individuals younger than 18 years old and a weight of 1 to thosewho are 18 years and older.
Thus, the number of equivalent adults per household is calculated as follows:ℎ ℎ= 0.8 × ( < 18 ) + 1 × ( ≥ 18 )

Benazir Income Support Programme: Final Impact Evaluation Report
© Oxford Policy Management 90
C.1 Regional and intra-survey temporal price deflator
The BISP Impact Evaluation Surveys both at baseline and first follow-up were conducted over anextended period of time and, as a result, households face different prices across provinces overthe period. Therefore, it is very important to compute the welfare indicator in real values. In order totake into account the price differences faced by the households, the Paasche Price Index has beencomputed at a primary sampling unit where most of the household interviews occurred at the sametime and this index has been used to convert the nominal per adult equivalent monthlyconsumption expenditure into real values, that allow us to compare consumption expenditureacross regions.
This survey provides information on the implicit prices/unit values and budget shares of food andfuel items. The average budget share of each Primary Sampling Unit (PSU) has been utilised as aweight for the ratio of median prices faced by the households in each Primary Sampling Unit andthe median national prices.
These are used to produce the Paasche Price Index at the PSU level, which is calculated asfollows:
=Where,= ℎ= ;=The nominal per adult equivalent monthly expenditure of each household is then divided by thePaasche Price Index of the respective PSU to which the household belongs to arrive at the realmonthly per adult equivalent expenditure.
C.2 Poverty line
To calculate the headcount rate or proportion of households that live in poverty one must calculatethe proportion of households that live below the poverty line. The poverty line in Pakistan is setsuch that it allows households to consume a basic basket of goods. To calculate the poverty linewe have used the poverty line set by the Government of Pakistan and adjusted this for inflationusing price statistics housed in the Pakistan Bureau of Statistics.
The relevant poverty lines to be used for this report are discussed in Section 5.1.1

Benazir Income Support Programme: Final Impact Evaluation Report
© Oxford Policy Management 91
Annex D Sampling: technical appendix
In order to implement the RD approach a complex multi-stage sampling strategy was required toidentify our treatment and control groups. A number of contextual factors at the time of the baselinesurvey influenced the sampling strategy. Primary amongst these was the requirement to conductthe baseline survey before any payments had been made to BISP beneficiaries.
At the time of the baseline survey the BISP poverty census was still on-going. Under idealcircumstances the evaluation would have waited for the poverty census to complete and sampletreatment and control households directly from this census. However, implementation of thepoverty census was not synchronised across evaluation provinces with the implication thatpayments would begin in some districts before the census had been completed in others30.
This meant that evaluation households were identified separately as potential treatment andcontrol households based on a household listing exercise conducted in evaluation communities byOPM prior to the BISP baseline evaluation survey. In this household listing exercise an exactreplica of the BISP poverty scorecard was delivered to all households in evaluation communities toapproximate as closely as possible their actual BISP poverty score (as determined by the BISPpoverty census) and assign them to treatment and control groups.
The consequence of this approach meant that when evaluation households were matched to theBISP Management Information System (MIS) via the number on the Computerised NationalIdentity Card (CNIC) to identify their actual poverty score, not all households in the originalevaluation sample were in the appropriate BISP poverty score range for the RD analysis.
To bolster the sample size of households in the appropriate RD analysis range, a re-samplingexercise was conducted in 2016 for the final round of the evaluation survey to draw new treatmentand control households for interview in existing research communities. The total sample size forthe final round of evaluation of this independent evaluation is presented in Table 2
Table 2 presents the final sample size of 9,139 households that have been interviewed for thefinal round of evaluation. The sample is split between a total of 5,212 beneficiary households and3,927 non-beneficiary households. Of all beneficiary households 3,935 households are within theappropriate poverty score range for the RD analysis.
Table 37 Total evaluation sample size
Total beneficiariesBeneficiaries in RDrange
Non-beneficiaries Total households
Punjab 1,714 1,526 1,572 3,286Sindh 1,860 1,191 1,147 3,007KhyberPakhtunkhwa
1,286 948 889 2,175
Balochistan 352 270 352 671Total 5,212 3,935 3,927 9,139Source: BISP impact evaluation survey 2016. Notes: BISP poverty score full range: 0 - 100
30 The idea of a rolling baseline that would follow the delivery was tabled during the inception phase. However, this wouldhave required a detailed and confirmed workplan of the poverty census rollout, which was not possible given that thecensus was implemented by multiple third party implementers.

Benazir Income Support Programme: Final Impact Evaluation Report
© Oxford Policy Management 92
The resampling exercise consisted of the following steps:
- All households that had previously been successfully matched to the BISP MIS wereretained providing that they had a BISP poverty score of less than 21.17
- All PSUs in the evaluation sample were matched to the BISP MIS
- BISP provided a set of households (both treatment and control) that had a BISP povertyscore of +/- 5 points from the eligibility threshold
- 9 treatment and 9 control households were randomly selected in each matched PSU.

Benazir Income Support Programme: Final Impact Evaluation Report
© Oxford Policy Management 93
Annex E Multi-dimensional poverty: technical appendix
The methodology for constructing the Multidimensional Poverty Index for BISP beneficiaries wasadapted from the Oxford Poverty and Human Development Initiative (OPHI) GlobalMultidimensional Poverty Index. The Global MPI has been constructed and calculated by OPHI for108 developing countries using data mostly from the Demographic Health Surveys (DHS) andMultiple Indicator Cluster Surveys (MICS). The Global MPI is contains ten indicators over threedimensions - Education, Health and Standard of Living – and is constructed to capture a set ofdirect deprivations that affect an individual or household at the same time. It was constructedthrough a rigorous technique for multidimensional measurement created by Sabina Alkire andJames Foster (the Alkire Foster method)31.
The MPI presented in this report differs slightly from that developed by OPHI. It contains elevenindicators over the dimensions of Education, Health and Living Standards. Indicated in the diagrambelow, each dimension is equally weighted and each indicator within a dimension is also equallyweighted.
Figure 28 Construction of the BISP MPI
The variations between the MPI constructed for BISP beneficiaries and that used by OPHI are aresult of minor discrepancies between the BISP and DHS survey questionnaires. The keydifferences include:
A Child Immunization indicator has been substituted for the Child Mortality indicatorbecause data on child mortality was not collected in the BISP survey.
The Nutrition indicator contains data on child nutrition only, as data on adult nutrition is notavailable in the BISP survey.
A Food Consumption indicator has been added to the health dimension to add analyticaldepth and supplement the indicators on child health with one that applies to adults as well.
Table 38 documents the definitions and weights of each indicator included in the index andindicates where there are differences between the BISP MPI and the OPHI MPI.
31 More information can be found here: www.ophi.org.uk/wp-content/uploads/ophi-wp38.pdf
Education (1/3) •Years of Schooling (1/6)•School Attendance (1/6)
Health (1/3)•Child Immunization (1/9)•Child Nutrition (1/9)•Food Consumption (1/9)
Living Standards (1/3)
•Electricity (1/18)•Improved Sanitation (1/18)•Improved Drinking Water (1/18)•Floor (1/18)•Cooking Fuel (1/18)•Assets (1/18)

Benazir Income Support Programme: Final Impact Evaluation Report
© Oxford Policy Management 94
Table 38 Dimensions of MPI poverty
Dimension Indicator Deprived if…Divergence from OPHI
MPI IndicatorWeight
Education
Years ofSchooling
There no household member who has completed
five years or more of schooling.1/6
Child SchoolAttendance
There is at least one school-aged child (up to
class 8)32 who is not attending school.1/6
Health
ChildImmunization
At least one child in the household between the
ages of 20 and 59 months is not fully immunized33.
Replaces indicator on
child mortality.1/9
ChildNutrition
Any child for whom there is nutritional information
is malnourished34.
Does not include data on
adults.1/9
FoodConsumption
The household does not have an acceptable level
of food consumption (either poor or borderline).
Not included in OPHI
MPI.1/9
Living
Standards
Electricity The household has no electricity. 1/18
ImprovedSanitation
The household’s sanitation facility is not improved
(as defined by the Pakistan Bureau of Statistics)35.
Sanitation categorised by
Pakistan Bureau of
Statistics, not the WHO’s
JMP definitions.
1/18
ImprovedDrinking
Water
The household does not have access to improved
drinking water36, or safe drinking water is located
more than a 30-minute roundtrip from home.
1/18
FloorThe household’s floor is made of dirt, sand, or
dung.1/18
Cooking FuelThe household uses dung, wood or charcoal to
cook.
Indicator inferred from
reported expenditures,
rather than a direct
question.
1/18
Assets
The household does not own more than one
(combined) of a radio, TV, bicycle, motorbike, or
refrigerator, and nor does its members own either
a car or a truck.
Telephone not included in
list of assets.1/18
32 Considered to be between the years of age 5 and 12 in Pakistan.33 Children are considered to be fully immunized if they have received both DPT 3 and measles vaccinations.34 Children are considered malnourished if their z-score of weight-for-age is below minus two standard deviations from the median of the referencepopulations. This data exists in the BISP survey for children under 5-years-old.35 Based on JMP/ Pakistan Bureau of Statistics, sanitation facilities classified as ‘improved’ include flush connected either to public sewerage, a pit, or anopen drain. A household is considered to have ‘unimproved’ sanitation facilities if they have a dry raised latrine or dry pit latrine, or there is no toilet in thehousehold.36 Water sources classified as ‘improved’ include piped water, hand pumps, tube wells, and closed wells. ‘Unimproved’ water sources include open wells,ponds, rivers, springs, and other sources.

Benazir Income Support Programme: Final Impact Evaluation Report
© Oxford Policy Management 95
Adopted from OPHI’s methodology, a person is considered to be multi-dimensionally poor (MPIpoor) if they are deprived in one third or more of the weighted indicators. The proportion ofthe population that lies below this poverty threshold represents the incidence of poverty or theheadcount ratio (H), and the average proportion of weighted indicators in which those who fallbelow this threshold are deprived is defined as the intensity of poverty (A).
The overall MPI is computed by multiplying these two indicators (MPA = H x A), and thereforereflects both the share of people in poverty and the degree to which they are deprived. Personsdeprived in the range of 20-33.3% of the weighted indicators are considered ‘vulnerable to poverty’and those deprived on half or more of the weighted indicators are considered to be in ‘severepoverty’.
Although the BISP MPI statistics are reported at the level of the individual (ex. the proportion ofindividuals who are MPI poor), deprivations are calculated at the household level. As such, anindividual is considered to be deprived on an indicator if they live in a household that is deprived onthat indicator. For example, if a household has three school age children, two of whom are inschool and one of whom is not in school, all members of the household, including the two childrenwho are in school are considered deprived on School Attendance. Some indicators (e.g. SchoolAttendance, Child Immunization and Child Nutrition) are not applicable across households becausenot all households contain members of the indicator’s reference populations (school-aged childrenor children under 5 years of age, for example). In line with OPHI’s methodology, a household isconsidered not deprived on an indicator in cases where the household does not contain anymembers of the indicator’s reference population.

Benazir Income Support Programme: Final Impact Evaluation Report
© Oxford Policy Management 96
Annex F Local Average Treatment Effect
Given that the RD approach analyses only households in very close proximity to the eligibilitythreshold its estimate of impact is a Local Average Treatment Effect (LATE). This means thatwhilst the RD approach has strong internal validity, in that it provides robust estimates of impactfor the set of households on which it is implemented, it has weaker external validity, in terms ofits applicability to households further away from the eligibility threshold.
To assess the strength of the external validity we must conduct an assessment of whether or notthe sub-sample of beneficiary households on which the RD is conducted (our evaluation treatmentgroup) has similar characteristics to all beneficiary households in our sample.
Table 39 makes this comparison comparing all beneficiary households in our evaluation sample tothe sub-sample of households within +/-5 points of the BISP eligibility threshold. This analysissuggests that there are indeed some differences between the two groups of households thatshould be carefully considered when interpreting the results of this evaluation for all beneficiaryhouseholds.
In particular we find that beneficiary households that have BISP poverty scores closer to theeligibility threshold tend to be slightly smaller (driven by having less children under the age of 14),are more likely to own a variety of household assets and are likely to be slightly more wealthy(evidenced by the lower poverty rates.
The implications for the evaluation are those associated with the drawbacks of the RD design37 inthat it delivers a Local Average Treatment Effect, which provides robust estimates of impact fortreatment households close to the BISP poverty score threshold. Thus care must be taken in theinterpretation of estimates of impact presented in Section 5 onwards, noting that the estimates ofimpact are relevant for a sub-sample of households that differ from the average beneficiaryhousehold in a variety of ways detailed in Table 39.
Table 39 Household characteristics by BISP poverty score
Variable All beneficiaries Beneficiaries in RDrange (+/- 5 points)
Household compositionHousehold size 7.91 7.65***Children under the age of 5 0.76 0.72*Male 5-14 1.39 1.33***Male 15-24 0.93 0.89*Male 25-34 0.33 0.33Male 35-44 0.30 0.30Male 45-54 0.33 0.32
Male 55-64 0.17 0.17Male above 65 0.12 0.11Female 5-14 1.28 1.21***Female 15-24 0.93 0.90Female 25-34 0.36 0.37
37 The RD approach was adopted at baseline as the best available approach given the way the BISP is implemented,following extensive consultation with the main evaluation stakeholders, BISP and the World Bank.

Benazir Income Support Programme: Final Impact Evaluation Report
© Oxford Policy Management 97
Variable All beneficiaries Beneficiaries in RDrange (+/- 5 points)
Female 35-44 0.44 0.43Female 45-54 0.32 0.32
Female 55-64 0.14 0.15
Female above 65 0.12 0.12Household head characteristics
Household head has no education 62.45 60.50*Household head is female 12.66 13.59Household head is literate 4.32 4.48
Housing characteristicsNumber of rooms in household 1.85 1.88Household has improved water source 88.96 89.07Household has improved toilet 61.47 66.21***
Livestock ownershipCow 17.74 16.51Buffalo 15.91 14.08**Sheep 2.49 2.38Goat 22.18 20.25**
Asset ownershipRefrigerator 22.64 25.70***Fan 90.02 92.09***Washing machine 37.10 40.99***Cooking stove 27.37 31.41***Bicycle 22.07 22.84Motorcycle 21.85 22.89TV 48.51 52.18***Sewing machine 37.14 40.17***
PovertyProportion poor (FEI) 32.22 28.80***Proportion poor (CBN) 66.70 64.26**
Source: BISP impact evaluation survey (2016). Notes: (1) Asterisks (*) indicate that an estimate is significantlydifferent to the relevant treatment comparator: *** = 99%, ** = 95%, *=90%.

Benazir Income Support Programme: Final Impact Evaluation Report
© Oxford Policy Management 98
Annex G Districts visited for quantitative survey
Table 40 Districts visited for quantitative survey household sample size
Province District Urban Rural Total
Punjab ATTOCK 18 102 120Punjab BAHAWALNAGAR 21 71 92Punjab BHAKKAR 56 56 112Punjab BHAWALPUR 91 92 183Punjab CHAKWAL 35 72 107Punjab D.G.KHAN 0 59 59Punjab FAISALABAD 84 128 212Punjab GUJRANWALA 112 123 235Punjab GUJRANWALA CANTT 18 0 18Punjab GUJRAT 0 42 42Punjab HAFIZABAD 18 36 54Punjab ISLAMABAD 17 67 84Punjab JHANG 0 96 96Punjab JHELUM 18 45 63Punjab KASUR 19 129 148Punjab KHANEWAL 18 38 56Punjab KHUSHAB 0 33 33Punjab LAHORE 34 73 107Punjab LODHRAN 38 36 74Punjab MANDI BAHAUDDIN 34 39 73Punjab MUZAFFARGARH 18 137 155Punjab NAROWAL 0 34 34Punjab OKARA 18 111 129Punjab R.Y. KHAN 17 106 123Punjab RAJANPUR 0 30 30Punjab RAWALPINDI 71 0 71Punjab SAHIWAL 38 60 98Punjab SARGODHA 108 72 180Punjab SHEIKHUPURA 18 169 187Punjab SIALKOT 34 44 78Punjab T.T.SINGH 27 75 102Punjab VEHARI 19 112 131Sindh BADIN 61 133 194Sindh DADU 54 292 346Sindh GHOTKI 18 106 124Sindh HYDERABAD 375 163 538Sindh JACOBABAD 75 194 269Sindh KARACHI CENTRAL 52 0 52Sindh KARACHI EAST 72 0 72Sindh KARACHI SOUTH 92 0 92Sindh KARACHI WEST 73 42 115Sindh KHAIRPUR 55 148 203

Benazir Income Support Programme: Final Impact Evaluation Report
© Oxford Policy Management 99
Province District Urban Rural Total
Sindh LARKANA 54 125 179Sindh NAUSHAHRO FEROZE 15 201 216Sindh NAWABSHAH 16 108 124Sindh SHIKARPUR 85 112 197Sindh SUKKUR 93 75 168Sindh THATTA 23 95 118KhyberPakhtunkhwa ABBOTTABAD 18 45 63
KhyberPakhtunkhwa BANNU 0 70 70
KhyberPakhtunkhwa BUNER 0 76 76
KhyberPakhtunkhwa CHARSADA 97 63 160
KhyberPakhtunkhwa CHITRAL 0 59 59
KhyberPakhtunkhwa D.I.KHAN 18 157 175
KhyberPakhtunkhwa HARIPUR 0 67 67
KhyberPakhtunkhwa KOHAT 36 72 108
KhyberPakhtunkhwa KOHISTAN 0 18 18
KhyberPakhtunkhwa LOWER DIR 36 55 91
KhyberPakhtunkhwa MALAKAND AGCY 39 18 57
KhyberPakhtunkhwa
MALAKAND PROTECTEDAR 0 59 59
KhyberPakhtunkhwa MANSEHRA 18 147 165
KhyberPakhtunkhwa MARDAN 55 111 166
KhyberPakhtunkhwa NOWSHERA 55 53 108
KhyberPakhtunkhwa PESHAWAR 139 125 264
KhyberPakhtunkhwa SHANGLA 0 57 57
KhyberPakhtunkhwa SWABI 82 101 183
KhyberPakhtunkhwa SWAT 59 134 193
KhyberPakhtunkhwa UPPER DIR 18 18 36
Balochistan BARKHAN 17 17 34Balochistan BOLAN 18 35 53Balochistan CHAGHI 0 36 36Balochistan JAFFARABAD 22 27 49

Benazir Income Support Programme: Final Impact Evaluation Report
© Oxford Policy Management 100
Province District Urban Rural Total
Balochistan JHAL MAGSI 0 2 2Balochistan KALAT 0 11 11Balochistan KHARAN 0 18 18Balochistan KILLA ABDULLAH 0 14 14Balochistan KOHLU 0 13 13Balochistan LASBELA 24 28 52Balochistan LORALAI 0 54 54Balochistan MASTUNG 12 6 18Balochistan NASIRABAD 15 0 15Balochistan PISHIN 18 40 58Balochistan QUETTA 56 31 87Balochistan SIBI 36 50 86Balochistan ZHOB 19 13 32Balochistan ZIARAT 0 39 39TOTAL 3119 6020 9139