belt transitions analysis by finite element analysis · a conveyor belt (in particular a ......
TRANSCRIPT

1
B17-02 Copyright of IMHC
BELT TRANSITIONS ANALYSIS BY FINITE ELEMENT ANALYSIS
Ryan Lemmon
Advanced Conveyor Technologies, Inc. (AC-Tek)
1. INTRODUCTION
Every troughed belt conveyor requires a transition zone from the flat pulley to the troughed configuration of the idlers. There are several published methods to determine the required length of the transition. This paper reviews these methods. A finite element model has been developed to calculate actual stresses in the transition. The results of the finite element study are compared to existing theories to determine which methods are most accurate for conveyor design.
2. EXISTING THEORY
There are two types of widely used transitions, these are: 1. An "In-line" or "Full trough" transition. This transition is sometimes called an in-
line transition because the pulley top is at the same elevation as the belt line of the centre roll. Figure 1 shows the geometry of an in-line transition.
2. "Elevated Pulley" transition. In an elevated pulley transition the top of the pulley is elevated a specified amount above the centre roll belt line. The pulley elevation is typically 1/3 to a little more than 1/2 of the idler trough depth. The purpose of elevating the pulley is to reduce the resultant stresses caused by the belt transition. Figure 2 shows an elevated pulley transition.
Figure 1. In-line or full trough transition

2
B17-02 Copyright of IMHC
Figure 2. Elevated pulley transition
There are several published methods to determine the required transition distance. These are summarised below.
2.1 CEMA
CEMA3 simply provides a look-up table for a full trough transition and the elevated pulley transition. The required transition distance is a factor times the belt width. The factor is a function of the trough angle, tension level with respect to the rated belt tension, and belt type (i.e. fabric or steel cord). For the elevated pulley transition (CEMA call this type of transition a "half trough transition"), CEMA recommends the pulley elevation be 1/2 the trough depth. Table 7.26 of the CEMA 6th Edition lists the factors for the half trough (or elevated pulley transition).
Idler Trough Angle % Rated Belt Tension Recommended Transition
Distance = Factor x Belt Width (BW)
Fabric Belts Steel Cord Belts
20°
> 90% 0.9 2.0
60% to 90% 0.8 1.6
< 60% 0.6 1.0
35°
> 90% 1.6 3.4
60% to 90% 1.3 2.6
< 60% 1.0 1.8
45°
> 90% 2.0 4.0
60% to 90% 1.6 3.2
< 60% 1.3 2.3
Table 1. Table 7.26 of CEMA 6th edition – half trough transition

3
B17-02 Copyright of IMHC
Idler Trough Angle % Rated Belt Tension Recommended Transition
Distance = Factor x Belt Width (BW)
Fabric Belts Steel Cord Belts
20°
> 90%
60% to 90% 1.6 3.2
< 60% 1.2 2.8
35°
> 90% 3.2 6.8
60% to 90% 2.4 5.2
< 60% 1.8 3.6
45°
> 90% 4.0 8.0
60% to 90% 3.2 6.4
< 60% 2.4 4.4
Table 2. Table 7.28 of CEMA 6th edition – full trough (in-line) transition
2.2 ISO 5293 / DIN 22101 / BECKLEY
The ISO 52932 standard, DIN 221011 standard, and the method presented by Beckley4 estimate the stresses in transition by determining the geometric change in length of incremental sections in the belt. Then an ideal stress variation across the belt width is assumed to determine both edge and centre stresses. It is beyond the scope of this paper to specifically review these equations, however, the standards themselves provide the details of equations and calculation methods. For in-line transitions, the three standards give very similar results. For the elevated pulley transition, the results are also similar, however there is more variation in the required transition lengths as will be seen in the following sections. In addition to the above standards, various belt manufacturers have published guidelines for belt transitions, which include Contitech7, Bridgestone9, Goodyear5, Dunlop8, and others.
3. DESIGN CRITERIA
Transitions have two design criteria to consider, which are:
1. Stress in the centre of the belt must be positive to prevent buckling. 2. Edge stress must not exceed the allowable stress. The first criterion is consistent among existing standards and design manuals. As the belt changes shape from troughed to flat, the belt centre is compressed. The combined nominal tension plus compressive stresses due to the shape change must be greater than zero to prevent buckling. As the belt changes shape, the edge portion of the belt is stretched. The total stretch at the edge of the belt is the nominal stress (from the belt tension) plus the stretch from the shape change.

4
B17-02 Copyright of IMHC
The allowable stress at the belt edge must be treated in the same manner as other localised high stress areas of the conveyor such as vertical curves, horizontal curves, and belt turnovers10. The author recommends edge stresses not exceed approximately 115% (for a steel cord belt) of the allowable nominal belt rating. The belt manufacturer should be consulted for the specified belt as their requirements may vary depending on the belt and splice construction. The third criterion is the length of the transition. The transition length must not be so long that there is potential for material spillage as the material is forced from a trough shape to the flat pulley. This criterion is more subjective and depends on material characteristics and requires the experience of the design engineer. The maximum allowable stress criterion may be relaxed somewhat if the transition length becomes so long that material spillage is possible. Finally, if the head transition is of the elevated pulley type, the additional pulley elevation must be considered in the trajectory of the material discharge in the chute design.
4. FEA MODEL
The purpose of the finite element model is to better understand the stress distribution in transition, validate existing theories and equations, and if necessary, to modify theoretical equations in order to improve their accuracy. The finite element model was completed in ANSYS. Non-linear and orthotropic shell elements with stress stiffening capability were used to model the belt. A non-linear model is necessary due to the large deformations and stress stiffening effects in the transition. Stress stiffening is required because belt tensions increase the effective bending stiffness of the belt. The finite element model has the following aspects: 1. The model is parametric so that any geometry, belt dimensions and properties,
idler spacing and configuration, and belt tension can easily be modelled.
2. Additional length can be added past the transition length. Figure 5 shows the extra boundary length in the transition. This length can be varied to see how belt stresses vary outside of the transition. This is also important in order to understand if stresses from the transition extend past the transition length.
3. The transition is assumed to be symmetrical with respect to the centreline of the belt. The stresses on the left side of the belt are assumed to be the same as on the right side of the belt.
4. Correct geometry of transition rolls are modelled including roll lengths, idler elevation, and trough angles.
5. Material loading is modelled to correctly account for the weight of the material on top of the belt.
5
B17-02 Copyright of IMHC
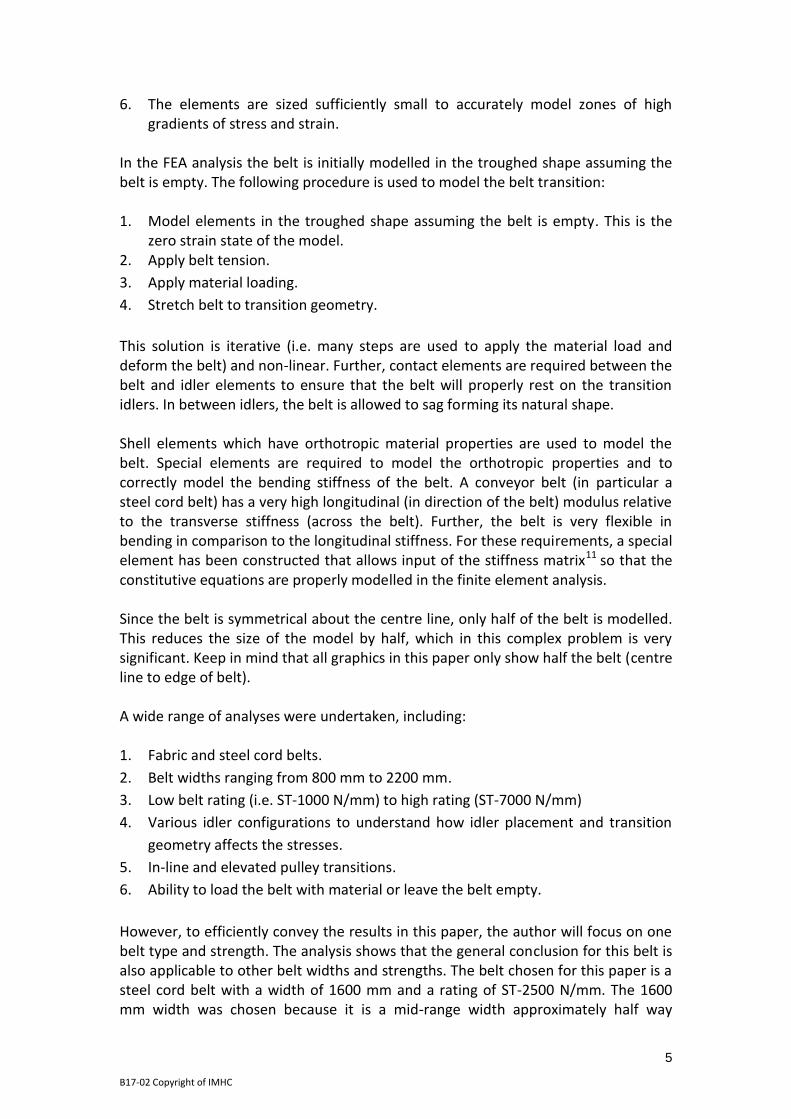
6. The elements are sized sufficiently small to accurately model zones of high gradients of stress and strain.
In the FEA analysis the belt is initially modelled in the troughed shape assuming the belt is empty. The following procedure is used to model the belt transition: 1. Model elements in the troughed shape assuming the belt is empty. This is the
zero strain state of the model. 2. Apply belt tension.
3. Apply material loading.
4. Stretch belt to transition geometry.
This solution is iterative (i.e. many steps are used to apply the material load and deform the belt) and non-linear. Further, contact elements are required between the belt and idler elements to ensure that the belt will properly rest on the transition idlers. In between idlers, the belt is allowed to sag forming its natural shape. Shell elements which have orthotropic material properties are used to model the belt. Special elements are required to model the orthotropic properties and to correctly model the bending stiffness of the belt. A conveyor belt (in particular a steel cord belt) has a very high longitudinal (in direction of the belt) modulus relative to the transverse stiffness (across the belt). Further, the belt is very flexible in bending in comparison to the longitudinal stiffness. For these requirements, a special element has been constructed that allows input of the stiffness matrix11 so that the constitutive equations are properly modelled in the finite element analysis. Since the belt is symmetrical about the centre line, only half of the belt is modelled. This reduces the size of the model by half, which in this complex problem is very significant. Keep in mind that all graphics in this paper only show half the belt (centre line to edge of belt). A wide range of analyses were undertaken, including: 1. Fabric and steel cord belts.
2. Belt widths ranging from 800 mm to 2200 mm.
3. Low belt rating (i.e. ST-1000 N/mm) to high rating (ST-7000 N/mm)
4. Various idler configurations to understand how idler placement and transition
geometry affects the stresses.
5. In-line and elevated pulley transitions.
6. Ability to load the belt with material or leave the belt empty.
However, to efficiently convey the results in this paper, the author will focus on one belt type and strength. The analysis shows that the general conclusion for this belt is also applicable to other belt widths and strengths. The belt chosen for this paper is a steel cord belt with a width of 1600 mm and a rating of ST-2500 N/mm. The 1600 mm width was chosen because it is a mid-range width approximately half way

6
B17-02 Copyright of IMHC
between a narrow belt (800 mm) and wide belts (2200 mm) used in the iron ore mines in Brazil. Likewise, the belt rating of ST-2500 N/mm is selected since it is a commonly used mid-rating. Figure 3 shows a finite element model of the transition in the 1600 mm belt. The figure shows the belt in final deformed shape. Keep in mind that analysis only models half belt width because the belt is symmetrical about the centreline. Figure 4 shows the final deformed shape for the entire belt (elements were mirrored). All remaining graphics in this paper only show the half belt as in Figure 3.
Figure 3. Finite element model (final deformed shape) of 1600 mm belt (symmetric about centreline)
Figure 4. Full belt width
7
B17-02 Copyright of IMHC
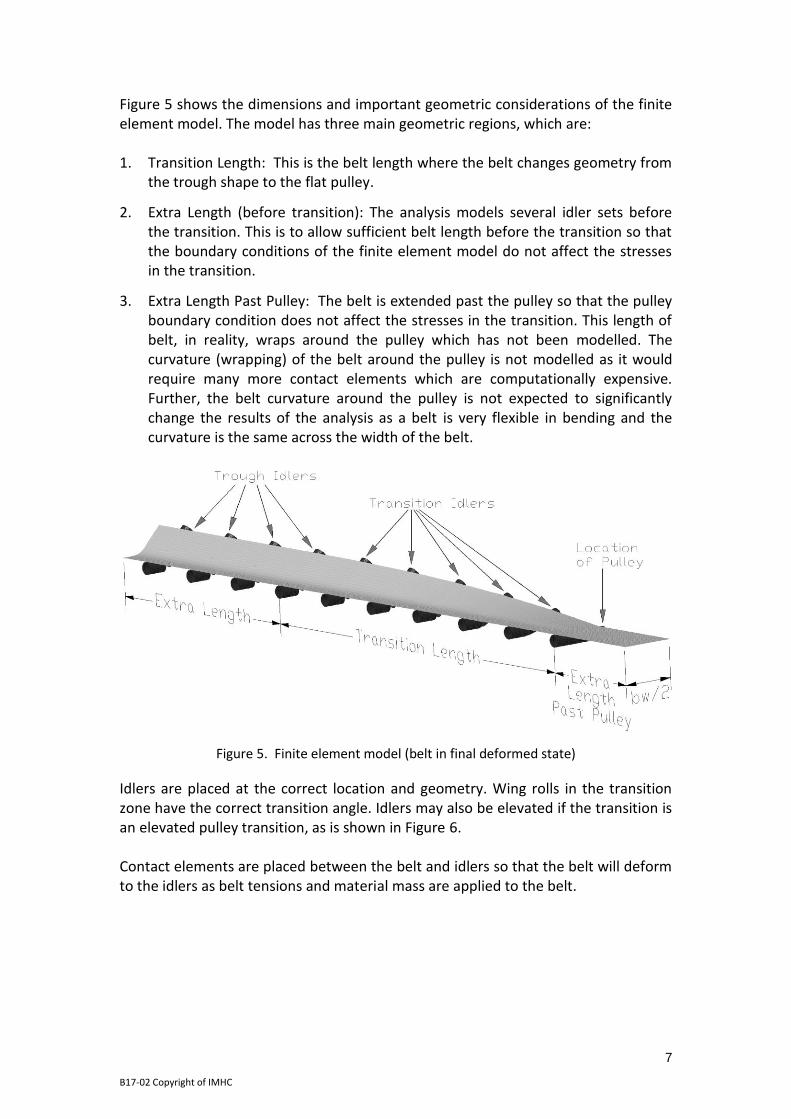
Figure 5 shows the dimensions and important geometric considerations of the finite element model. The model has three main geometric regions, which are: 1. Transition Length: This is the belt length where the belt changes geometry from
the trough shape to the flat pulley.
2. Extra Length (before transition): The analysis models several idler sets before the transition. This is to allow sufficient belt length before the transition so that the boundary conditions of the finite element model do not affect the stresses in the transition.
3. Extra Length Past Pulley: The belt is extended past the pulley so that the pulley boundary condition does not affect the stresses in the transition. This length of belt, in reality, wraps around the pulley which has not been modelled. The curvature (wrapping) of the belt around the pulley is not modelled as it would require many more contact elements which are computationally expensive. Further, the belt curvature around the pulley is not expected to significantly change the results of the analysis as a belt is very flexible in bending and the curvature is the same across the width of the belt.
Figure 5. Finite element model (belt in final deformed state)
Idlers are placed at the correct location and geometry. Wing rolls in the transition zone have the correct transition angle. Idlers may also be elevated if the transition is an elevated pulley transition, as is shown in Figure 6. Contact elements are placed between the belt and idlers so that the belt will deform to the idlers as belt tensions and material mass are applied to the belt.

8
B17-02 Copyright of IMHC
Figure 6. Elevated pulley transition
Figure 7 shows the boundary conditions of the model. At the belt end (fully troughed side), the belt is constrained in the longitudinal direction to prevent displacement of the belt when tensions are applied. At the pulley side, the belt is tensioned. Also at the pulley side of the transition, the un-deformed belt is displaced so that the belt at the pulley is flat. The belt end at the pulley is displaced incrementally to ensure convergence of the model. Of course, contact elements between the belt and idlers force the belt to rest at the idler roller locations. Finally, at the belt centreline, a symmetrical boundary condition is placed since only half the belt is modelled (this boundary condition is not shown in the figure).
Figure 7. Boundary condition of the transition
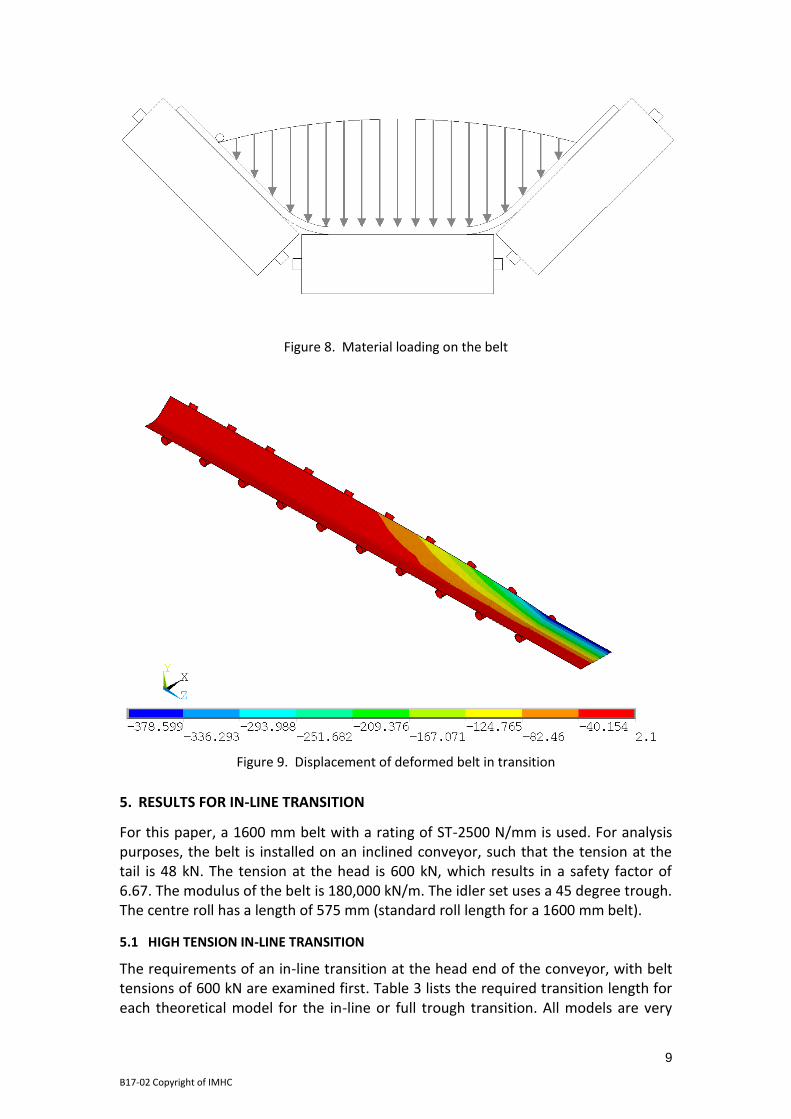
Figure 8 shows the pressure/force profile of the material on the belt. In order to properly load the belt, each belt element is given a downward force relative to its location in the force profile shown in Figure 8. Figure 9 shows the total displacement of the belt.
9
B17-02 Copyright of IMHC
Figure 8. Material loading on the belt
Figure 9. Displacement of deformed belt in transition
5. RESULTS FOR IN-LINE TRANSITION
For this paper, a 1600 mm belt with a rating of ST-2500 N/mm is used. For analysis purposes, the belt is installed on an inclined conveyor, such that the tension at the tail is 48 kN. The tension at the head is 600 kN, which results in a safety factor of 6.67. The modulus of the belt is 180,000 kN/m. The idler set uses a 45 degree trough. The centre roll has a length of 575 mm (standard roll length for a 1600 mm belt).
5.1 HIGH TENSION IN-LINE TRANSITION
The requirements of an in-line transition at the head end of the conveyor, with belt tensions of 600 kN are examined first. Table 3 lists the required transition length for each theoretical model for the in-line or full trough transition. All models are very

10
B17-02 Copyright of IMHC
close, and the required transition length varies between 12.8 m to 13.1 m. Therefore, the selected transition length for the finite element model is 13.1 m. Table 3 also lists the calculated edge stress and centre stress in the transition. The models give the same results. The analytical edge stress is 432 N/mm and the centre stress is 350 N/mm. The last row lists the edge and centre stress as predicted by the FEA model, which is nearly identical to the analytical model.
Model Required Length
(m)
Belt Length = 13.0 m
Edge SF Edge Stress
(N/mm) Centre Stress
(N/mm)
CEMA 12.8 NA NA NA
ISO 13.1 5.79 432 350
DIN 13.1 5.79 432 350
Beckley 13.1 5.79 432 348
FEA 13.1 5.77 433 357
Table 3. Results of in-line transition. Tension = 600 kN
The main conclusion is that the theoretical models are correctly predicting the stresses in an in-line or full trough transition. Figure 10 shows the contour plot of stresses in the transition.
Figure 10. Stress contour plot of 13.0 m in-line transition. Tension = 600 kN
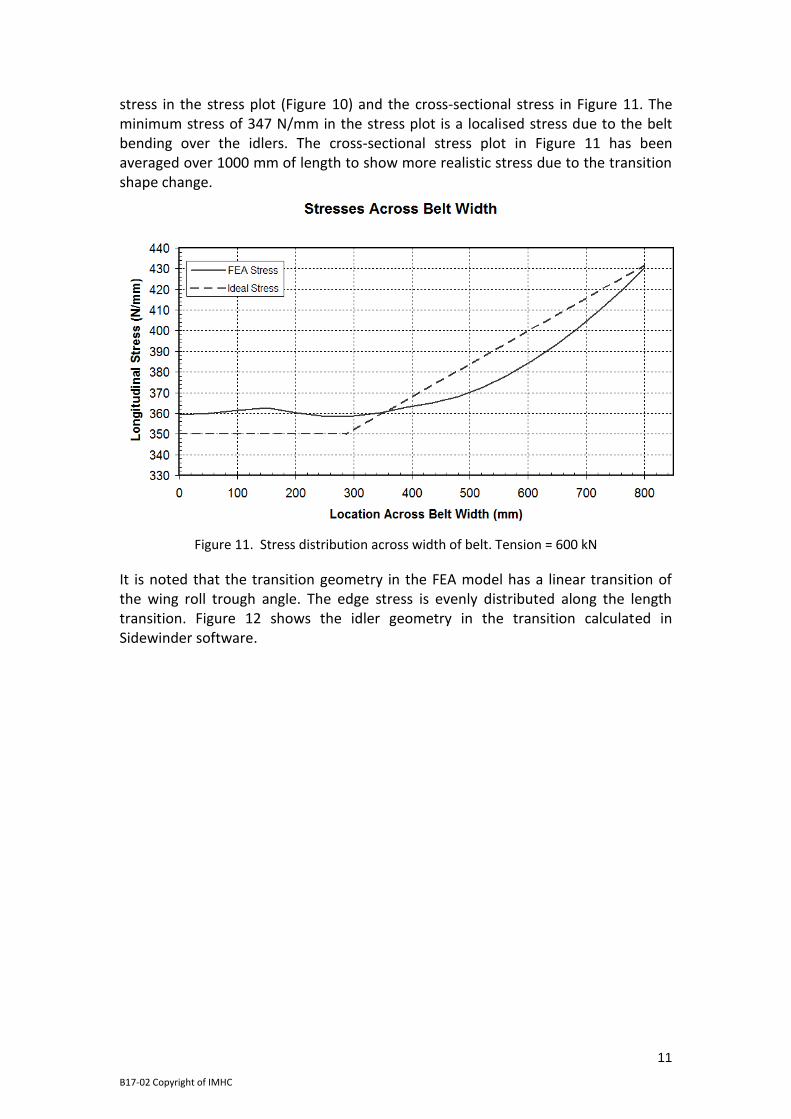
Figure 11 shows the stress distribution across the width of the belt. This plot is shown because the various standards assume an "idealised" stress distribution in order to analytically calculate the stresses. Figure 11 also shows the idealised stress assumed by the standards. While the idealised stress is not exactly the same as the FEA stress, it is approximately correct. There is a small difference in the minimum
11
B17-02 Copyright of IMHC
stress in the stress plot (Figure 10) and the cross-sectional stress in Figure 11. The minimum stress of 347 N/mm in the stress plot is a localised stress due to the belt bending over the idlers. The cross-sectional stress plot in Figure 11 has been averaged over 1000 mm of length to show more realistic stress due to the transition shape change.
Figure 11. Stress distribution across width of belt. Tension = 600 kN
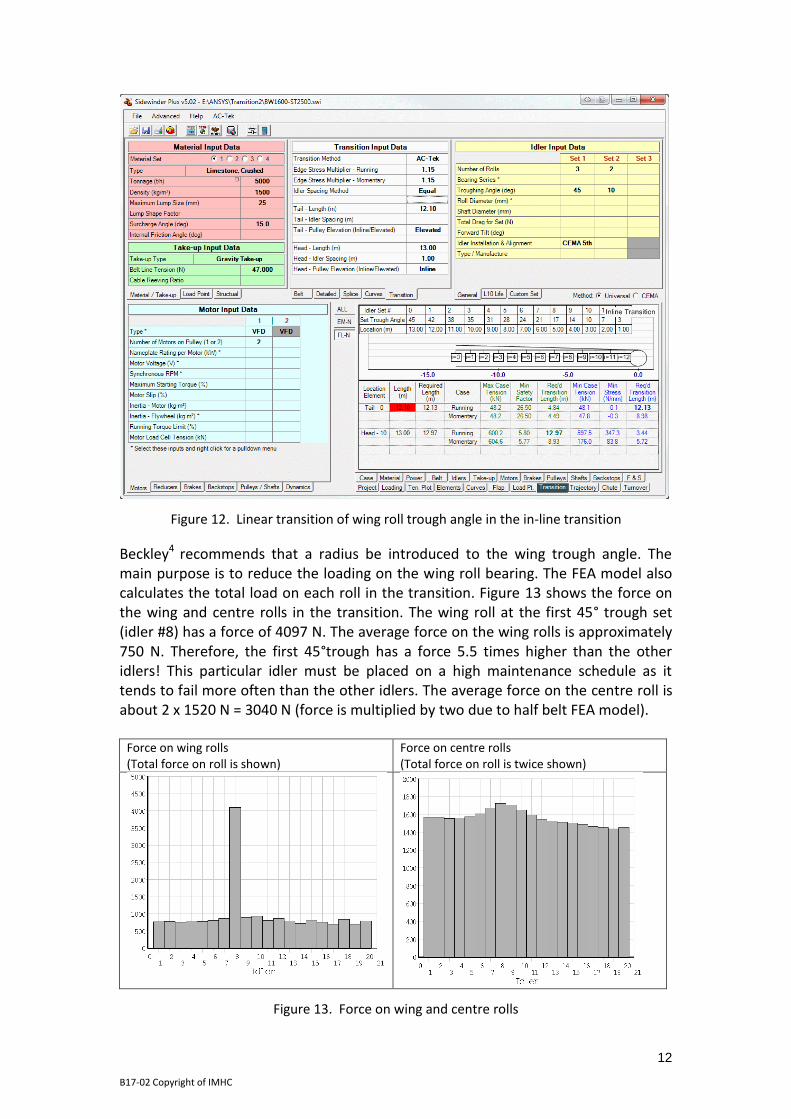
It is noted that the transition geometry in the FEA model has a linear transition of the wing roll trough angle. The edge stress is evenly distributed along the length transition. Figure 12 shows the idler geometry in the transition calculated in Sidewinder software.
12
B17-02 Copyright of IMHC
Figure 12. Linear transition of wing roll trough angle in the in-line transition
Beckley4 recommends that a radius be introduced to the wing trough angle. The main purpose is to reduce the loading on the wing roll bearing. The FEA model also calculates the total load on each roll in the transition. Figure 13 shows the force on the wing and centre rolls in the transition. The wing roll at the first 45° trough set (idler #8) has a force of 4097 N. The average force on the wing rolls is approximately 750 N. Therefore, the first 45°trough has a force 5.5 times higher than the other idlers! This particular idler must be placed on a high maintenance schedule as it tends to fail more often than the other idlers. The average force on the centre roll is about 2 x 1520 N = 3040 N (force is multiplied by two due to half belt FEA model).
Force on wing rolls (Total force on roll is shown)
Force on centre rolls (Total force on roll is twice shown)
Figure 13. Force on wing and centre rolls

13
B17-02 Copyright of IMHC
To prevent the high loading on this idler, Beckley recommended that the wing roll trough angles in the transition have a radius to better balance the load on the wing rolls. Beckley's recommended wing roll angle is shown in Figure 14.
[
[ (
)
]]
Figure 14. Beckley's recommended trough angle in transition4
Pn is the distance from the edge of the transition. This geometry is also analysed in the FEA model. Figure 15 shows the Beckley geometry for the 13 m transition.
Figure 15. Beckley geometry for the 13 m full trough transition
Figure16 shows the resulting forces on the idler rolls in the transition. The Beckley radius in the wing roll geometry is efficient at evenly distributing the loads. The maximum load on any one wing roll is 1530 N.
14
B17-02 Copyright of IMHC
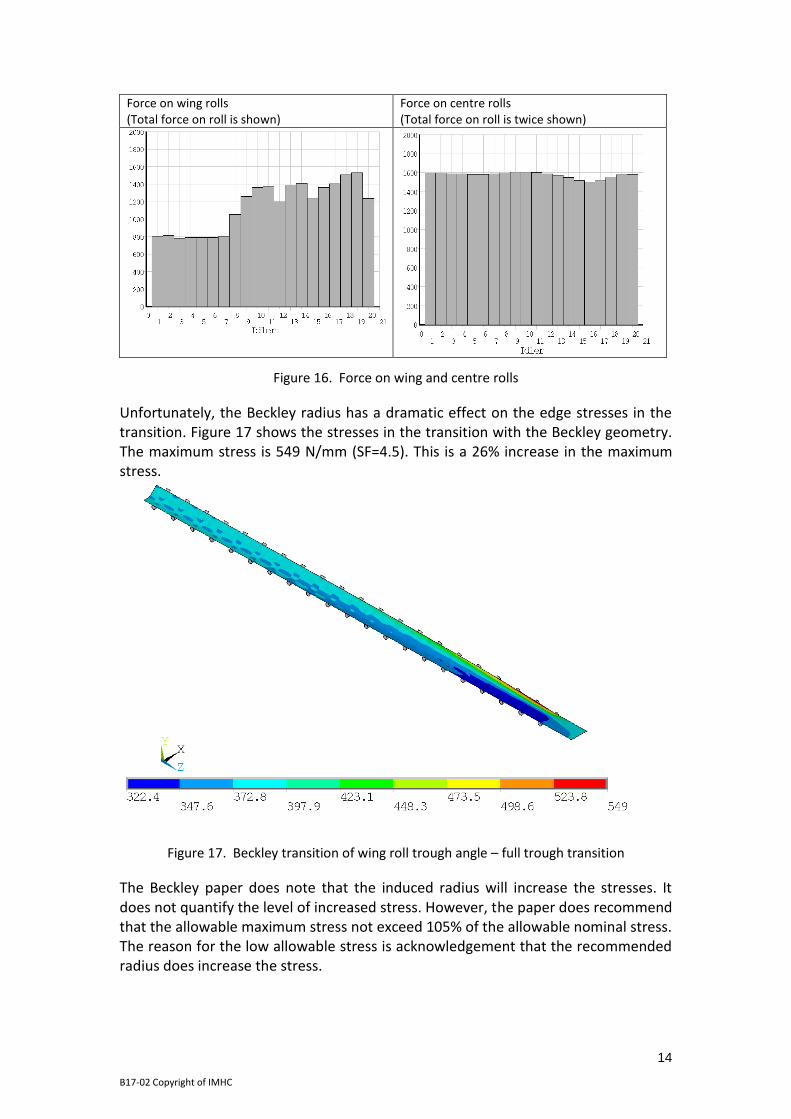
Force on wing rolls (Total force on roll is shown)
Force on centre rolls (Total force on roll is twice shown)
Figure 16. Force on wing and centre rolls
Unfortunately, the Beckley radius has a dramatic effect on the edge stresses in the transition. Figure 17 shows the stresses in the transition with the Beckley geometry. The maximum stress is 549 N/mm (SF=4.5). This is a 26% increase in the maximum stress.
Figure 17. Beckley transition of wing roll trough angle – full trough transition
The Beckley paper does note that the induced radius will increase the stresses. It does not quantify the level of increased stress. However, the paper does recommend that the allowable maximum stress not exceed 105% of the allowable nominal stress. The reason for the low allowable stress is acknowledgement that the recommended radius does increase the stress.

15
B17-02 Copyright of IMHC
For this transition, if the minimum allowable edge safety factor is divided by 1.05 or 6.67/1.05 = 6.35 then the required length of the transition is 22.6 m. If the transition were increased to 22.6 m, the maximum stress (as determined by FEA) is reduced to 439 N/mm for a safety factor of 5.70 which is at the same level as the 13 m length with a linear transition of trough angle (Figure 10).
The conclusions of finite element model of the inline geometry are as follows:
1. The theoretical models (DIN, ISO, Beckley) correctly predict the stresses within the transition.
2. A linear transition of the wing roll trough angle results in the lowest stress state and results in the stresses predicted by the theoretical models.
3. The wing roll of the first full trough idler set at the edge of the transition takes a larger portion of the load and is prone to a higher rate of failure than the other wing rolls in the transition.
4. The Beckley recommended geometry, which places a radius in the wing roll trough angle, does indeed spread the load evenly on the wing rolls. However, the edge stress is increased by approximately 20% to 30% over a linear transition angle geometry.
5.2 LOW TENSION IN-LINE TRANSITION
The low tension that is considered for the belt conveyor is 48 kN. Table 4 shows the required length for an in-line or full trough transition at a tension of 48 kN. The required length is 12.1 m for ISO, DIN, and Beckley. However, CEMA only requires a length of 7.04 m. The required transition length of 12.1 m is governed by a buckling criterion. At 12.1 m, the centre stress is zero. For the FEA model, a length of 12.1 m was selected. The stresses from the finite element model are very close to the analytical model. Figure 18 shows the stresses in the 12.1 m in-line transition at a tension of 48 kN.
Model Required Length
(m)
Belt Length = 12.1 m
Edge SF Edge Stress
(N/mm) Centre Stress
(N/mm)
CEMA 7.04 NA NA NA
ISO 12.1 26.5 94 0
DIN 12.1 26.5 94 0
Beckley 12.1 26.5 94 0
FEA 12.1 26.7 94 2
Table 4. Results of in-line transition. Tension = 48 kN, belt is empty
16
B17-02 Copyright of IMHC
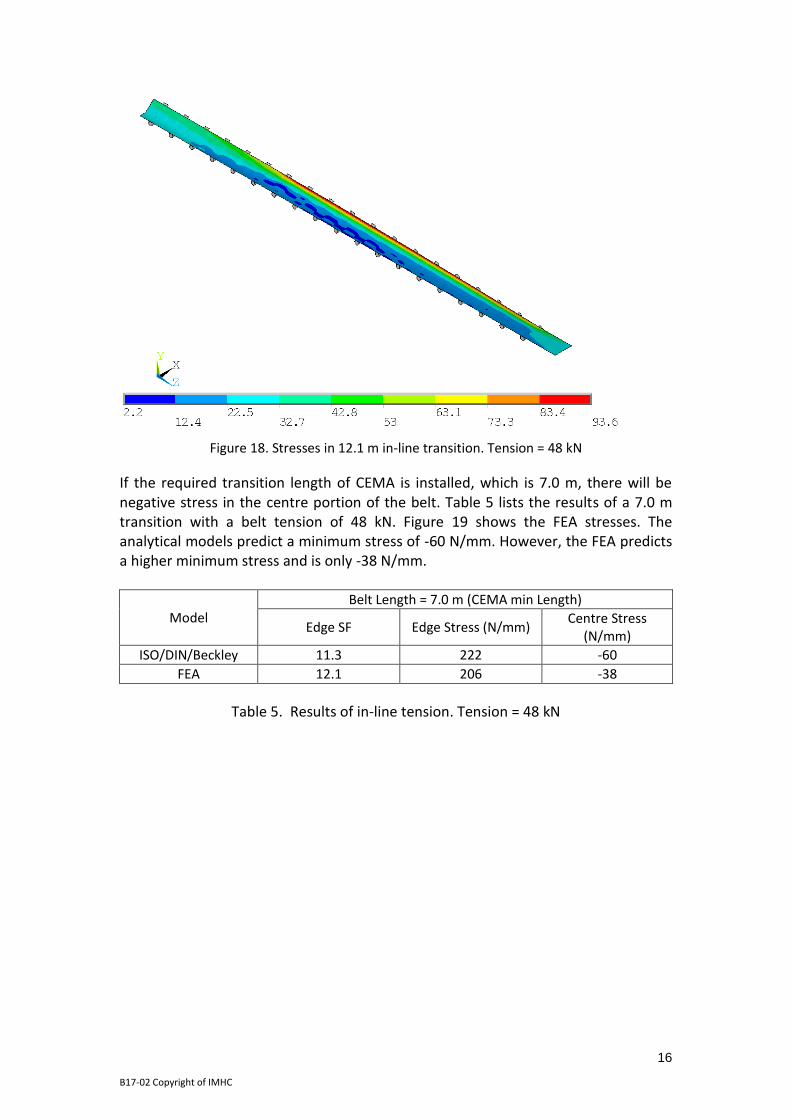
Figure 18. Stresses in 12.1 m in-line transition. Tension = 48 kN
If the required transition length of CEMA is installed, which is 7.0 m, there will be negative stress in the centre portion of the belt. Table 5 lists the results of a 7.0 m transition with a belt tension of 48 kN. Figure 19 shows the FEA stresses. The analytical models predict a minimum stress of -60 N/mm. However, the FEA predicts a higher minimum stress and is only -38 N/mm.
Model Belt Length = 7.0 m (CEMA min Length)
Edge SF Edge Stress (N/mm) Centre Stress
(N/mm)
ISO/DIN/Beckley 11.3 222 -60
FEA 12.1 206 -38
Table 5. Results of in-line tension. Tension = 48 kN
17
B17-02 Copyright of IMHC
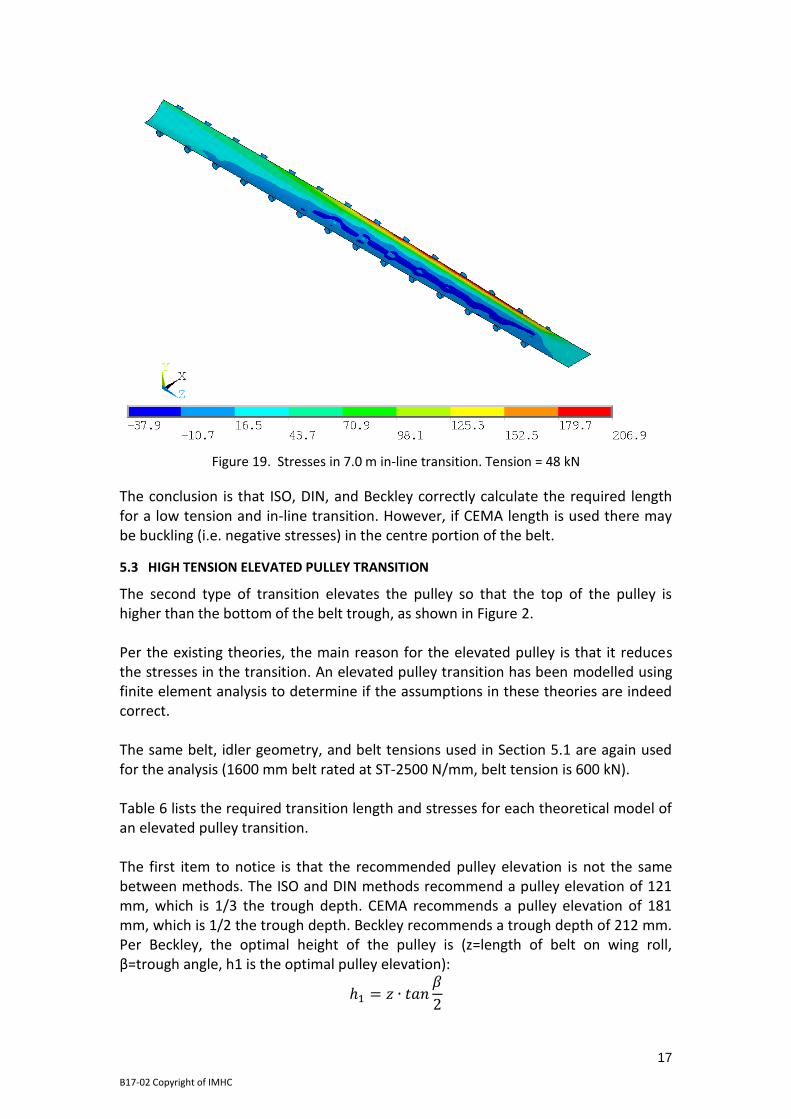
Figure 19. Stresses in 7.0 m in-line transition. Tension = 48 kN
The conclusion is that ISO, DIN, and Beckley correctly calculate the required length for a low tension and in-line transition. However, if CEMA length is used there may be buckling (i.e. negative stresses) in the centre portion of the belt.
5.3 HIGH TENSION ELEVATED PULLEY TRANSITION
The second type of transition elevates the pulley so that the top of the pulley is higher than the bottom of the belt trough, as shown in Figure 2. Per the existing theories, the main reason for the elevated pulley is that it reduces the stresses in the transition. An elevated pulley transition has been modelled using finite element analysis to determine if the assumptions in these theories are indeed correct. The same belt, idler geometry, and belt tensions used in Section 5.1 are again used for the analysis (1600 mm belt rated at ST-2500 N/mm, belt tension is 600 kN). Table 6 lists the required transition length and stresses for each theoretical model of an elevated pulley transition. The first item to notice is that the recommended pulley elevation is not the same between methods. The ISO and DIN methods recommend a pulley elevation of 121 mm, which is 1/3 the trough depth. CEMA recommends a pulley elevation of 181 mm, which is 1/2 the trough depth. Beckley recommends a trough depth of 212 mm. Per Beckley, the optimal height of the pulley is (z=length of belt on wing roll, β=trough angle, h1 is the optimal pulley elevation):

18
B17-02 Copyright of IMHC
At a trough angle of 25°,35°, and 45°, the Beckley height is 52%, 55%, and 59% of the full trough height respectively. It is also noted that the required transition lengths are different for each method. Further, the higher the pulley elevation, the shorter the required transition distance. As such Beckley requires the shortest distance as it has the highest pulley elevation. CEMA is next shortest, and ISO/DIN have the longest transition distance.
Model Required
Length (m)
Pulley Elevation
(mm) Edge SF
Edge Stress (N/mm)
Centre Stress
(N/mm)
Beckley 5.2 212 5.80 436 255
CEMA 6.4 181 NA NA NA
ISO 8.7 121 5.81 436 349
DIN 9.4 121 5.80 436 349
Table 6. Results of elevated pulley transition. Tension = 600 kN
Table 7 lists the resultant stresses as calculated by finite element analysis. The main result is that the stresses calculated by finite element are much higher than the analytical methods. The required analytical lengths were determined by imposing a minimum safety factor of 5.8 in the edge stresses (allowing 15% additional stress above the nominal safety factor value of 6.67). However, as is shown in the table below, the safety factor at the edge cables is significantly lower. The results in the table depict the belt fully loaded. This means that the belt does not lift off the idlers and must conform to the geometry of the idlers. When the belt is empty, the belt lifts off the idlers and the effective length of the transition would be longer, resulting in lower stresses.
Model Length (m) Pulley
Elevation (mm)
Edge SF Edge Stress
(N/mm)
Centre Stress
(N/mm)
FEA 5.2 212, Linear 3.55 704 258
FEA 5.2 212, Beckley 2.43 1030 167
FEA 6.4 181 4.05 617 279
FEA 8.7 121 4.87 513 324
FEA 9.4 121 5.06 494 326
Table 7. Results of elevated pulley transition. Tension = 600 kN
The Beckley model requires a length of 5.2 m. This length was analysed with two idler geometries. The first geometry assumed a linear transition of idler height and trough angle in the transition. The second model assumed the recommended geometry in the Beckley paper, which uses a radial shape in the transition geometry. Figure 20 shows the recommended packing height of the idlers and trough angle per the Beckley paper. (Note: the equation below has been updated by Beckley on a post on www.bulk-online.com, the correct equation is shown in Figure 20).

19
B17-02 Copyright of IMHC
( )
[
[ (
)
]]
Figure 20. Recommended packing height and trough angle per Beckley for an elevated pulley transition4
For the linear transition geometry, the maximum edge stress is 704 N/mm (safety factor = 3.55). For the recommended Beckley geometry, the maximum edge stress is 1030 N/mm (safety factor = 2.43). Figure 21 shows the stresses in 5.2 m transition with a pulley elevation of 212 mm and with a linear transition of idler height and trough angle. The figure shows both an isometric view and a front view.
Figure 22 shows the stresses in 5.2 m transition with a pulley elevation of 212 mm and with the recommended Beckley transition geometry of idler height and trough angle. From these two figures, it is noted that the high edge stress is NOT evenly distributed along the entire length of the transition but rather is concentrated near the pulley. In contrast, the analytical methods assume that the stress will be constant along the length of the transition. This figure can be compared to Figure 10 (13 m in-line transition), where the stress is fairly constant along the length of transition. This is a significant result of the FEA analysis and clearly demonstrates why the analytical results are incorrect. As the pulley elevation is less (i.e. ISO/DIN methods), the stress becomes more evenly distributed along the length of the transition.
Figure 21. Elevated pulley transition, L=5.2 m, pulley elevation=212 mm, linear transition of idlers

20
B17-02 Copyright of IMHC
Figure 22. Elevated pulley transition, L=5.2 m, pulley elevation=212 mm, recommended Beckley transition of idlers
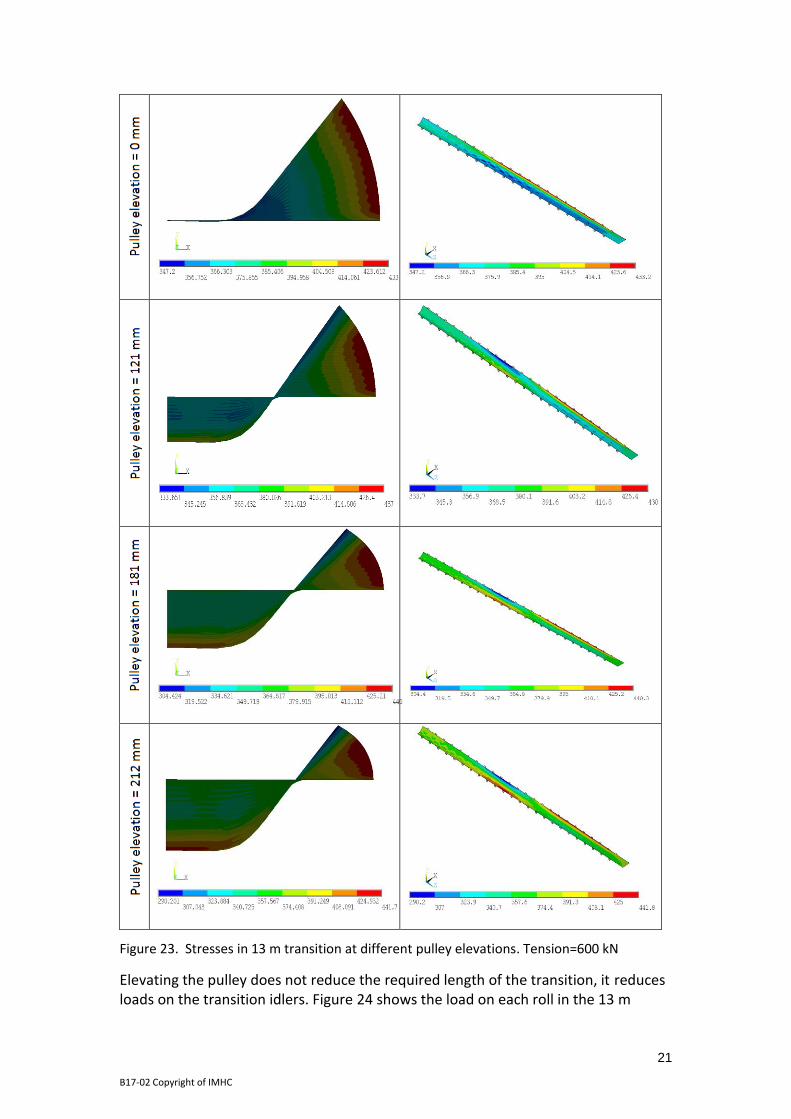
The next logical step in the finite element analysis is to compare the stresses in an elevated pulley transition to the in-line transition of the same length. Table 8 shows the results of this analysis. The key result of the analysis is that the maximum stress is nearly the same for all pulley elevations. For an in-line transition, the maximum stress is 433 N/mm. If the pulley is elevated 212 mm, the maximum stress is 442 N/mm, which is 2% higher than an inline transition. Figure 23 shows the stress plots for each pulley elevation of the 13 m transition. This is a very important conclusion, as it has been assumed for many years that an elevated pulley transition lowers the stresses in a transition. In reality, the stresses in an elevated pulley transition are approximately the same as an in-line transition of the same length. The same analysis has been completed on belts of different width and ratings and it has been found that the above conclusion holds valid. The author therefore recommends that if a transition uses an elevated pulley, the required length of an in-line transition be used for the elevated pulley transition.
Model Length (m) Pulley
Elevation (mm)
Edge SF Edge Stress
(N/mm)
Centre Stress
(N/mm)
FEA 13 0 5.77 433 347
FEA 13 121 5.71 438 334
FEA 13 181 5.68 440 304
FEA 13 212 5.66 442 290
Table 8. Results of 13 m transition. Tension = 600 kN
21
B17-02 Copyright of IMHC
Figure 23. Stresses in 13 m transition at different pulley elevations. Tension=600 kN
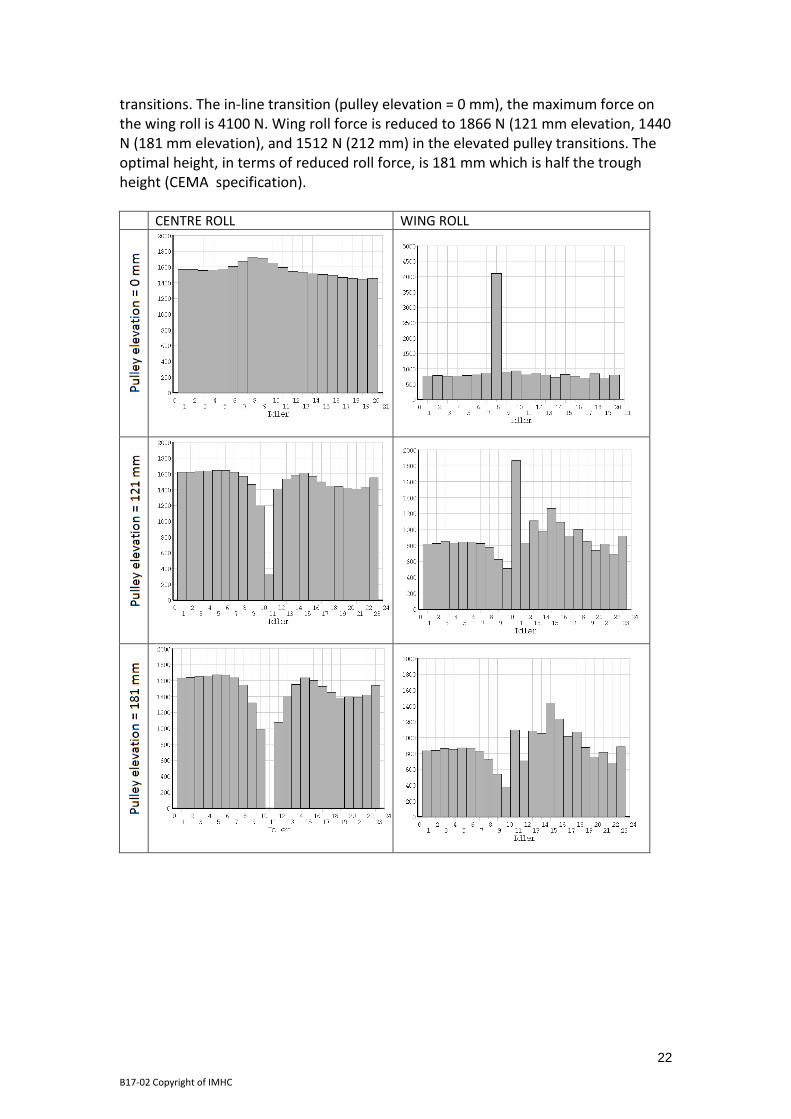
Elevating the pulley does not reduce the required length of the transition, it reduces loads on the transition idlers. Figure 24 shows the load on each roll in the 13 m
22
B17-02 Copyright of IMHC
transitions. The in-line transition (pulley elevation = 0 mm), the maximum force on the wing roll is 4100 N. Wing roll force is reduced to 1866 N (121 mm elevation, 1440 N (181 mm elevation), and 1512 N (212 mm) in the elevated pulley transitions. The optimal height, in terms of reduced roll force, is 181 mm which is half the trough height (CEMA specification).
CENTRE ROLL WING ROLL

23
B17-02 Copyright of IMHC
Figure 24. Load on idler rolls in 13 m transition at different pulley elevations.Tension = 600 kN
5.4 LOW TENSION ELEVATED PULLEY TRANSITION
In this section, the stresses in a low tension elevated pulley transition are analysed. The same belt, idler geometry, and belt tensions as in Section 5.2 are used for the analysis (belt width = 1600 mm, rating = ST-2500 N/mm, tension = 48 kN). Table 9 lists the required transition length for each theoretical model for the elevated pulley transition. It is noted that the required transition lengths are different for each method.
Model Required
Length (m)
Pulley Elevation
(mm) Edge SF
Edge Stress (N/mm)
Centre Stress
(N/mm)
CEMA 3.7 181 NA NA NA
ISO 8.1 121 26.67 94 0
DIN 8.8 121 26.63 94 0
Beckley 10.4 212 56.60 44 0
Table 9. Results of elevated pulley transition. Tension = 48 kN
Table 10 lists the resultant stresses as calculated by finite element analysis. The results in this table are for an empty belt. For a flat or inclined conveyor, the empty belt condition is assumed since low tension transitions are at the tail.
Model Length (m) Pulley
Elevation (mm)
Edge SF Edge Stress
(N/mm)
Centre Stress
(N/mm)
FEA 3.7 181 6.23 401 -99
FEA 8.1 121 14.7 164 -11
FEA 8.8 121 16.7 150 -10
FEA 10.4 212, Linear 20.7 118 -11
FEA 10.4 212, Beckley 10.2 246 -38
Table 10. Results of elevated pulley transition. Tension = 48 kN, belt is empty

24
B17-02 Copyright of IMHC
Table 11 lists the resultant stresses as calculated by finite element analysis for a fully loaded belt. For downhill conveyors, the low tension transition is at the head end where the belt is fully loaded.
Model Length (m) Pulley
Elevation (mm)
Edge SF Edge Stress
(N/mm)
Centre Stress
(N/mm)
FEA 3.7 181 6.0 416 -127
FEA 8.1 121 14.7 170 -64
FEA 8.8 121 16.7 150 -65
FEA 10.4 212, Linear 20.7 121 -40
FEA 10.4 212, Beckley 10.4 240 -76
Table 11. Results of elevated pulley transition. Tension = 48 kN, belt is fully loaded
The maximum edge stress is approximately the same whether the belt is empty or full. However, the centre stress is somewhat lower for the fully loaded belt. When the belt is loaded, the belt is forced to conform to the idler shape due to the weight of the material. It must also be noted that the minimum stress (at belt centre) in a fully loaded belt is affected by the amount of belt sag between idlers. Figure 26 shows that the maximum compressive stress occurs at the idler junction (located between centre and wing rolls). A longer idler spacing may result in higher compressive stresses and a shorter idler spacing will help to relieve the compressive stresses in a low tension elevated pulley transition if the compressive stresses are due to belt sag with a fully loaded belt. In all cases, the centre stress is negative using the required lengths from analytical methods. The other difference is that the belt will tend to lift off the idlers if the belt is empty in the transition. The main conclusion is that the centre stresses calculated by finite element are much lower than the analytical methods. For all methods except CEMA, the required lengths were determined by ensuring that the centre stress be greater than zero. However, in actuality the centre stresses are less than zero, which is not allowed according to design criteria. The Beckley model requires a length of 10.4 m. This length was analysed with two idler geometries. The first geometry assumed a linear transition of idler height and trough angle in the transition. The second model assumed the recommended geometry in the Beckley paper, which uses a circular shape in the transition geometry (Figure 20). For the linear transition geometry, the minimum stress is -40 N/mm. For the recommended Beckley geometry, the minimum stress is -76 N/mm. Figure 25 shows the stresses in a 10.4 m transition with a pulley elevation of 212 mm and a linear transition of idler height and trough angle. Figure 26 shows the stresses in 10.4 m transition with a pulley elevation of 212 mm and with the recommended Beckley transition geometry of idler height and trough angle.

25
B17-02 Copyright of IMHC
Empty Belt
Fully Loaded Belt
Figure 25. Elevated pulley transition, L=10.4 m, pulley elevation=212 mm, linear transition of idlers
Empty Belt
Fully Loaded Belt
Figure 26. Elevated pulley transition, L=5.4 m, pulley elevation=212 mm, recommended Beckley transition of idlers
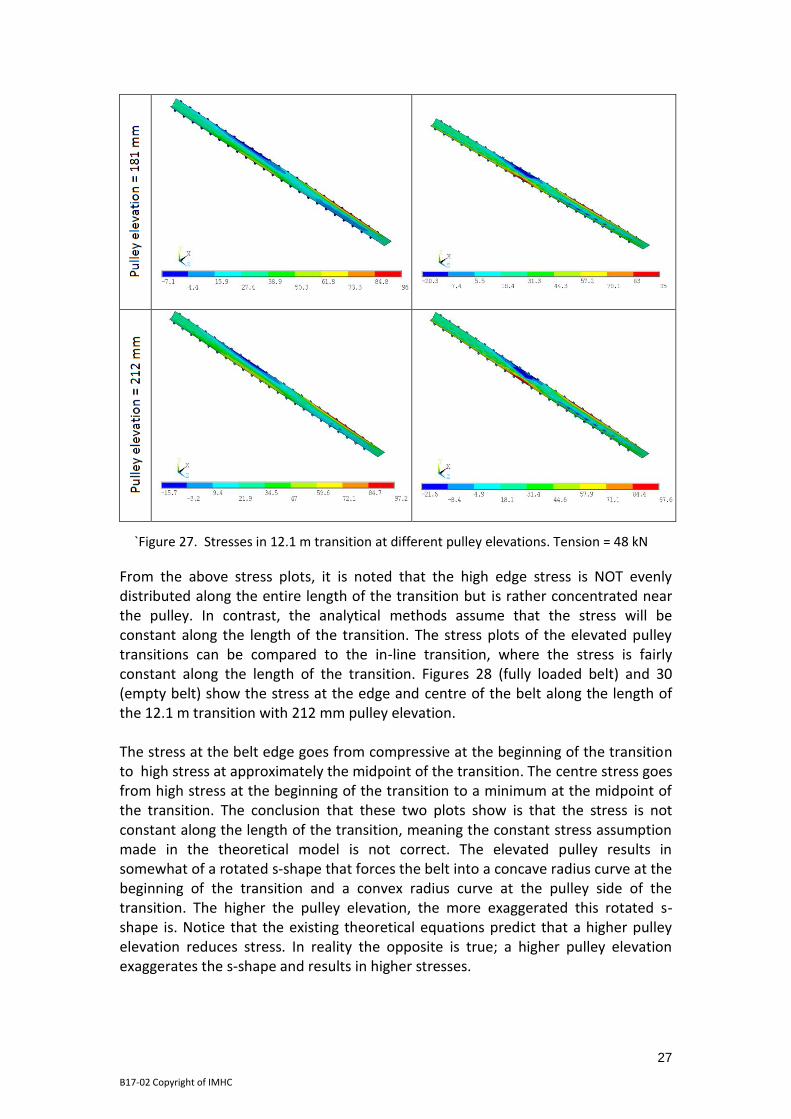
Next, the finite element analysis compares the stresses in an elevated pulley transition to the in-line transition of the same length. For a belt tension of 48 kN, the required length of an in-line transition is 12.1 m (using the analytical models). Tables 12 (empty belt) and 13 (fully loaded belt) show the results of this analysis. Figure 27 shows the stress plots of the 12.1 m transition for each pulley elevation. The primary result of the analysis is that the maximum stress in nearly the same for all pulley elevations. For all transitions, whether elevated or not, the maximum stress is approximately 97 N/mm. The minimum stress is also approximately zero for all pulley elevations when the belt is empty. The minimum stress in the fully loaded belt is approximately -20 N/mm. The same analysis has been completed on belts of different width and ratings and it has been found that the above conclusions continue to be valid. The author therefore recommends that if a low tension transition uses an elevated pulley, the required length of an in-line transition be used for the elevated pulley transition.

26
B17-02 Copyright of IMHC
Model Length (m) Pulley
Elevation (mm) Edge SF
Max Stress (N/mm)
Min Stress (N/mm)
FEA 12.1 0 26.6 94 2
FEA 12.1 121 26.6 94 8
FEA 12.1 181 26.5 98 -1
FEA 12.1 212 26.5 97 -16
Table 12. Results of 12.1 m transition. Tension = 48 kN, empty belt
Model Length (m) Pulley
Elevation (mm) Edge SF
Max Stress (N/mm)
Min Stress (N/mm)
FEA 12.1 0 28.4 88 -18
FEA 12.1 121 26.6 93 -20
FEA 12.1 181 26.6 96 -20
FEA 12.1 212 26.5 97 -22
Table 13. Results of 12.1 m transition. Tension = 48 kN, fully loaded belt
Empty Belt Fully Loaded Belt
27
B17-02 Copyright of IMHC
`Figure 27. Stresses in 12.1 m transition at different pulley elevations. Tension = 48 kN
From the above stress plots, it is noted that the high edge stress is NOT evenly distributed along the entire length of the transition but is rather concentrated near the pulley. In contrast, the analytical methods assume that the stress will be constant along the length of the transition. The stress plots of the elevated pulley transitions can be compared to the in-line transition, where the stress is fairly constant along the length of the transition. Figures 28 (fully loaded belt) and 30 (empty belt) show the stress at the edge and centre of the belt along the length of the 12.1 m transition with 212 mm pulley elevation. The stress at the belt edge goes from compressive at the beginning of the transition to high stress at approximately the midpoint of the transition. The centre stress goes from high stress at the beginning of the transition to a minimum at the midpoint of the transition. The conclusion that these two plots show is that the stress is not constant along the length of the transition, meaning the constant stress assumption made in the theoretical model is not correct. The elevated pulley results in somewhat of a rotated s-shape that forces the belt into a concave radius curve at the beginning of the transition and a convex radius curve at the pulley side of the transition. The higher the pulley elevation, the more exaggerated this rotated s-shape is. Notice that the existing theoretical equations predict that a higher pulley elevation reduces stress. In reality the opposite is true; a higher pulley elevation exaggerates the s-shape and results in higher stresses.

28
B17-02 Copyright of IMHC
Due to the concave shape at the beginning of the curve the edge stress can be compressive, which is something that the analytical equation does not predict. In the 212 mm elevated pulley example, the minimum stress at the belt centre is approximately 10 N/mm in the empty belt condition and 35 N/mm in fully loaded condition. However, the minimum stress at the edge is approximately -20 N/mm (both empty and full). The compressive stress occurs at the beginning of the transition where concave radius shape is located.
Figure 28. Stress at belt edge and centre in 12.1 m elevated pulley transition, fully loaded
belt
Figure 29. Stress at belt edge and centre in 12.1 m elevated pulley transition, fully loaded
belt
12.1 m Elevated Pulley Transition
Pulley Elevation = 212 mm, Fully Loaded
-30
-20
-10
0
10
20
30
40
50
60
70
80
90
100
110
0 1 2 3 4 5 6 7 8 9 10 11 12 13 14 15 16 17 18 19 20 21 22 23 24
Longitudinal Location (m)
Str
ess (
N/m
m)
Stress at Belt Edge
Stress at Belt Center
Begin
nin
g o
f T
ransitio
n
Pulle
y L
ocation
12.1 m Elevated Pulley Transition
Pulley Elevation = 212 mm, Empty Belt
-30
-20
-10
0
10
20
30
40
50
60
70
80
90
100
110
0 1 2 3 4 5 6 7 8 9 10 11 12 13 14 15 16 17 18 19 20 21 22 23 24
Longitudinal Location (m)
Str
ess (
N/m
m)
Stress at Belt Edge
Stress at Belt Center
Begin
nin
g o
f T
ransitio
n
Pulle
y L
ocatio
n

29
B17-02 Copyright of IMHC
Figure 30 shows the stress across the belt width of the 12.1 transition with a 212 mm pulley elevation. Two stress cross-sections are shown, at the beginning of the transition (z=10.6 m of Figure 28) and at the midpoint (z=16.4 m). The maximum compressive stress occurs at the idler junction (between centre and wing roll), which is partly due to belt sag as discussed above.
Figure 30. Stress across belt width in elevated pulley transition
Elevating the pulley in a low tension transition is generally not recommended especially if the transition is adjacent to the loading station with skirt boards. In a low tension transition, the loading on the idlers should not be an issue due to low tensions. This means that elevating the pulley to reduce idler loading has no advantage over an in-line transition. However, when the belt is empty there is potential for the belt lifting off the idlers. If the transition is adjacent to the skirt boards in a loading station, any belt lift may cause sealing or wear problems on the skirt and/or belt. Figure 31 shows the force on the centre roll in each of the transitions for both the empty and fully loaded belt. When the idler force is zero, there is no contact between belt and roll and the belt lifts off the idler. For the in-line transition, there is no belt lift-off. For each successive higher pulley elevation, there is more and more belt-liftoff when the belt is empty. Further, the elevated pulley transition has the disadvantage of a more difficult material trajectory which must be taken into account in the chute design.
Stresses Across Belt Width
12.1 m Transition, Pulley Elevation = 212 mm
-20
0
20
40
60
80
100
120
0 100 200 300 400 500 600 700 800
Location Across Belt Width (mm)
Str
ess
(N
/mm
)
Stress at Beginning of Transition
Stress at Trasition Mid Point

30
B17-02 Copyright of IMHC
CENTRE ROLL - Empty Belt CENTRE ROLL - Fully Loaded Belt
Figure 31. Load on idler rolls in 12.1 m transition at different pulley elevations. Tension = 48 kN

31
B17-02 Copyright of IMHC
6. SUMMARY
The following main conclusions are made from the finite element analysis of in-line belt transitions: 1. The DIN, ISO, and Beckley calculation methods are correct in determination of
required transition lengths and resulting stresses.
2. A linear transition of the wing roll trough angle results in the lowest belt stresses.
3. A linear transition of the wing roll trough angle results in a high loading on the first non-transition idler wing roll. In the example, this force was 5.5 times higher than the nominal roll loading.
4. The Beckley method recommends adding a radius shape to the wing roll trough angle to reduce the loads on the rolls. This Beckley geometry does indeed reduce the loading on the roll. However, it is at the penalty of significantly increased stresses in the belt. As such, the Beckley geometry is not recommended unless the transition length is increased to compensate for the higher stresses.
The following conclusions are made for the finite element analysis of elevated pulley transitions: 1. All methods underestimate the belt stresses in the elevated pulley transition.
2. The stresses in an elevated pulley transition have approximately the same stresses as an in-line transition of the same length.
3. It is recommended to use the required length of an in-line transition to determine the required length of an elevated pulley transition.
4. The main advantage of an elevated pulley transition is that the load on the idler rolls is relatively evenly distributed. This advantage applies only to high tension transitions.
5. In practice, elevated pulley transitions operating at the specified lengths by existing standards are actually operating at a lower safety factor than expected.
ACKNOWLEDGEMENTS
The author is grateful to Advanced Conveyor Technologies (AC-Tek, www.actek.com) for permission to publish this work. Sidewinder software courtesy of Advanced Conveyor Technologies, Inc.

32
B17-02 Copyright of IMHC
REFERENCES
1 DIN 22101:2010-02, DIN Deutsches Institut Für Normunge.V.
2 ISO 5293:2004(E), Second Edition 2004-09-15, Conveyor belts - Determination of the minimum transition distance on three idler rollers
3 CEMA, Belt Conveyors for Bulk Materials Sixth Edition, Engineering Conference for Conveyor Equipment Manufacturers Association (2005)
4 Beckley, D.E., Belt Conveyor Transition Geometry, Bulk Solids Handling, Volume 2, Number 4, December 1982
5 Goodyear, Handbook of Conveyor & Elevator Belting, Akron, Ohio (1975)
6 Phoenix, Phoenix Conveyor Belts Design Fundamentals, Hamburg (2004)
7 Contitech, Conveyor Belt System Design, Hannover Germany (1995)
8 Fenner Dunlop, Unique Conveyor Problems and Solutions
9 Bridgestone, Conveyor Belt Design Manual
10 Lemmon, R., Belt Turnover Design Using Finite Element Analysis, BELTCON 15, South Africa
11 Jones, R.M., Mechanics of Composite Materials, Hemisphere Publishing Corp (1975)

33
B17-02 Copyright of IMHC
ABOUT THE AUTHOR
RYAN LEMMON
Ryan Lemmon received both his bachelor and master of science degrees in mechanical engineering from the University of Idaho. He is co-owner of Advanced Conveyor Technologies, Inc. and has over 18 years of experience in the material handling industry. His talents include design and analysis of complex conveyor numerical analysis methods including discrete element method (DEM) and finite element analysis (FEA), data acquisition and field measurements, research and development, and programming. Ryan Lemmon Advanced Conveyor Technologies, Inc. (AC-Tek) 3911 East 132 North Rigby, ID 83442 U.S.A. Tel: (208) 745-6914 www.actek.com
Presenter
DAVID KRUSE
David Kruse received his B.S. in engineering mechanics and astronautics from the University of Wisconsin, Madison and also has a master of science in aeronautics and astronautics from the University of Washington. He is co-owner of Advanced Conveyor Technologies Inc. and has over 15 years of experience designing long overload conveyor systems. His specific interests are in the areas of belt dynamics, data acquisition and field measurements, rubber rheology, and transfer chute design using the discrete element method (DEM). He has developed a wide variety of mining engineering software that is currently in use today. David Kruse Advanced Conveyor Technologies Inc. (AC-Tek) 19415 594th Avenue Mankato, Minnesota 56001, U.S.A Tel: (507) 345-5748 www.actek.com ..