bc gro op satistics
TRANSCRIPT
8/9/2019 BC Gro Op Satistics
http://slidepdf.com/reader/full/bc-gro-op-satistics 1/78
MARIHUANA GROWING
OPERATIONSIN BRITISH COLUMBIA
AN EMPIRICAL SURVEY(1997-2000)
Darryl PlecasYvon Dandurand
Vivienne ChinTim Segger
May 2002
Department of Criminology and Criminal JusticeUniversity College of the Fraser Valley
Abbotsford B.C.
International Centre for Criminal Law Reformand Criminal Justice Policy
(Vancouver, B.C.)
8/9/2019 BC Gro Op Satistics
http://slidepdf.com/reader/full/bc-gro-op-satistics 2/78
Marihuana Growing Operations in British Columbia 2
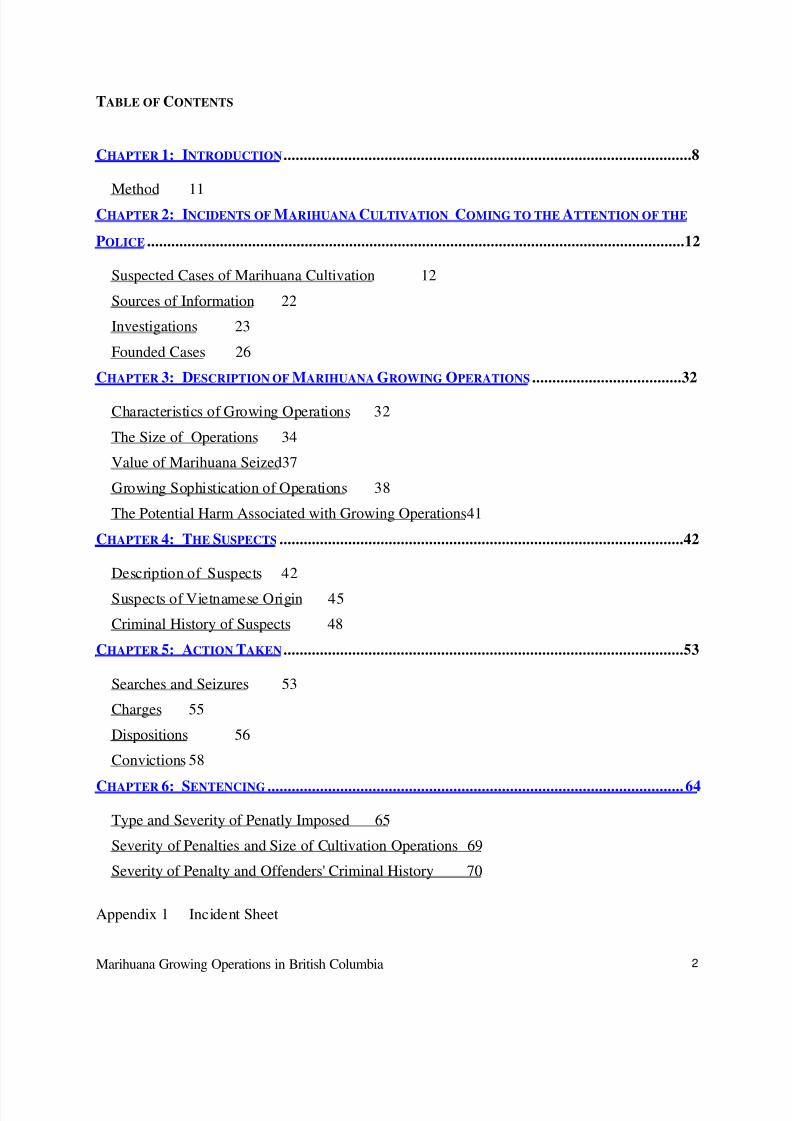
TABLE OF CONTENTS
CHAPTER 1: INTRODUCTION .....................................................................................................8
Method 11CHAPTER 2: INCIDENTS OF MARIHUANA CULTIVATION COMING TO THE ATTENTION OF THE
POLICE .....................................................................................................................................12
Suspected Cases of Marihuana Cultivation 12
Sources of Information 22
Investigations 23
Founded Cases 26
CHAPTER 3: DESCRIPTION OF MARIHUANA GROWING OPERATIONS .....................................32
Characteristics of Growing Operations 32
The Size of Operations 34
Value of Marihuana Seized37
Growing Sophistication of Operations 38
The Potential Harm Associated with Growing Operations41
CHAPTER 4: THE SUSPECTS ....................................................................................................42
Description of Suspects 42
Suspects of Vietnamese Origin 45
Criminal History of Suspects 48
CHAPTER 5: ACTION TAKEN ...................................................................................................53
Searches and Seizures 53
Charges 55
Dispositions 56
Convictions 58
CHAPTER 6: SENTENCING ....................................................................................................... 64
Type and Severity of Penatly Imposed 65
Severity of Penalties and Size of Cultivation Operations 69
Severity of Penalty and Offenders' Criminal History 70
Appendix 1 Incident Sheet
8/9/2019 BC Gro Op Satistics
http://slidepdf.com/reader/full/bc-gro-op-satistics 3/78
Marihuana Growing Operations in British Columbia 3
Appendix 2 Suspect Sheet
Appendix 3 Criminal History Sheet
8/9/2019 BC Gro Op Satistics
http://slidepdf.com/reader/full/bc-gro-op-satistics 4/78
Marihuana Growing Operations in British Columbia 4
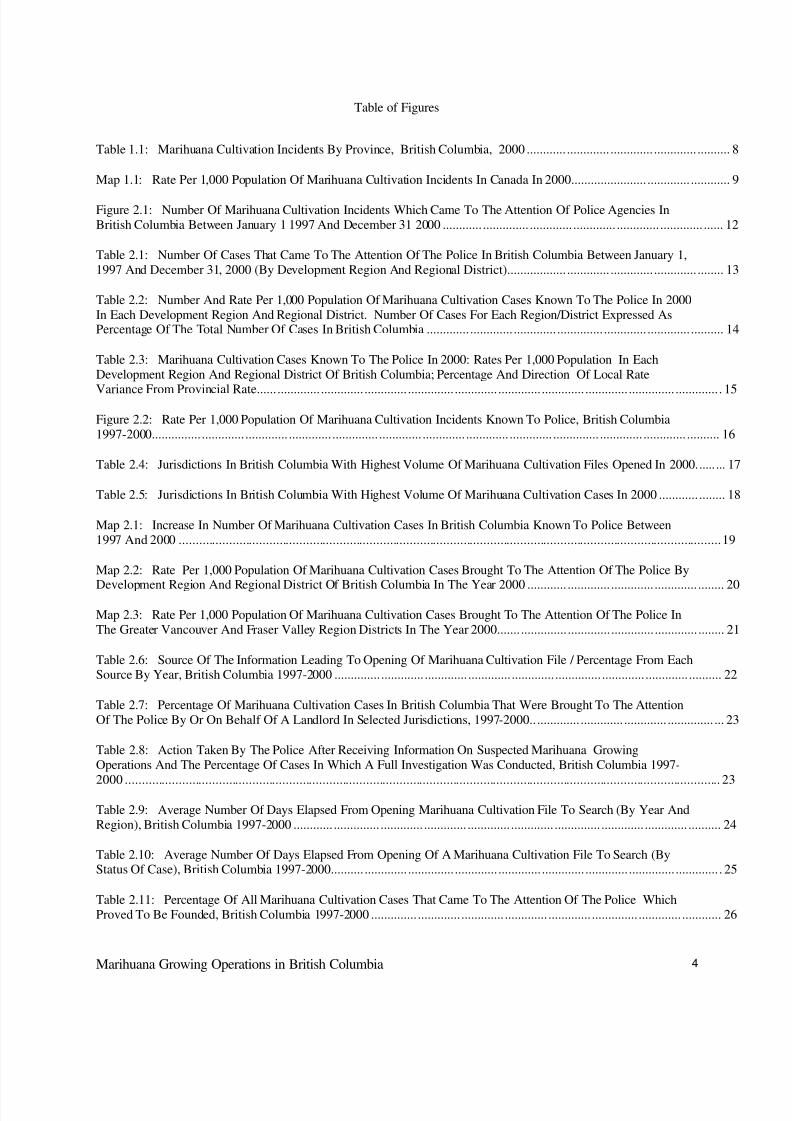
Table of Figures
Table 1.1: Marihuana Cultivation Incidents By Province, British Columbia, 2000 ............ ............. ............. ............. .......... 8
Map 1.1: Rate Per 1,000 Population Of Marihuana Cultivation Incidents In Canada In 2000....................... ............. ............ 9
Figure 2.1: Number Of Marihuana Cultivation Incidents Which Came To The Attention Of Police Agencies InBritish Columbia Between January 1 1997 And December 31 2000 ............ .............. ............. ............. ............. ............. ...... 12
Table 2.1: Number Of Cases That Came To The Attention Of The Police In British Columbia Between January 1,1997 And December 31, 2000 (By Development Region And Regional District).................. ............. ............. ............. ........ 13
Table 2.2: Number And Rate Per 1,000 Population Of Marihuana Cultivation Cases Known To The Police In 2000In Each Development Region And Regional District. Number Of Cases For Each Region/District Expressed AsPercentage Of The Total Number Of Cases In British Columbia ............. ............. ............. .............. ............. ............. .......... 14
Table 2.3: Marihuana Cultivation Cases Known To The Police In 2000: Rates Per 1,000 Population In EachDevelopment Region And Regional District Of British Columbia; Percentage And Direction Of Local Rate
Variance From Provincial Rate...... ............. ............. ............. .............. ............. ............. ............. ............. .............. ............. . 15
Figure 2.2: Rate Per 1,000 Population Of Marihuana Cultivation Incidents Known To Police, British Columbia1997-2000............... ............. ............. ............. .............. ............. ............. ............. ............. .............. ............. ............. .......... 16
Table 2.4: Jurisdictions In British Columbia With Highest Volume Of Marihuana Cultivation Files Opened In 2000...... ... 17
Table 2.5: Jurisdictions In British Columbia With Highest Volume Of Marihuana Cultivation Cases In 2000 ............ ........ 18
Map 2.1: Increase In Number Of Marihuana Cultivation Cases In British Columbia Known To Police Between1997 And 2000 ..................................................................................................................................................................19
Map 2.2: Rate Per 1,000 Population Of Marihuana Cultivation Cases Brought To The Attention Of The Police By
Development Region And Regional District Of British Columbia In The Year 2000 ............ ............. ............. ............. ........ 20
Map 2.3: Rate Per 1,000 Population Of Marihuana Cultivation Cases Brought To The Attention Of The Police InThe Greater Vancouver And Fraser Valley Region Districts In The Year 2000....... .............. ............. ............. ............. ........ 21
Table 2.6: Source Of The Information Leading To Opening Of Marihuana Cultivation File / Percentage From EachSource By Year, British Columbia 1997-2000 .............. ............. ............. ............. ............. .............. ............. ............. .......... 22
Table 2.7: Percentage Of Marihuana Cultivation Cases In British Columbia That Were Brought To The AttentionOf The Police By Or On Behalf Of A Landlord In Selected Jurisdictions, 1997-2000............... ............. ............. .............. ... 23
Table 2.8: Action Taken By The Police After Receiving Information On Suspected Marihuana GrowingOperations And The Percentage Of Cases In Which A Full Investigation Was Conducted, British Columbia 1997-
2000 .................................................................................................................................................................................. 23
Table 2.9: Average Number Of Days Elapsed From Opening Marihuana Cultivation File To Search (By Year AndRegion), British Columbia 1997-2000 ............ .............. ............. ............. ............. ............. .............. ............. ............. .......... 24
Table 2.10: Average Number Of Days Elapsed From Opening Of A Marihuana Cultivation File To Search (ByStatus Of Case), British Columbia 1997-2000.......... ............. .............. ............. ............. ............. ............. .............. ............. . 25
Table 2.11: Percentage Of All Marihuana Cultivation Cases That Came To The Attention Of The Police WhichProved To Be Founded, British Columbia 1997-2000 .............. ............. ............. ............. ............. .............. ............. ............ 26
8/9/2019 BC Gro Op Satistics
http://slidepdf.com/reader/full/bc-gro-op-satistics 5/78
Marihuana Growing Operations in British Columbia 5
Table 2.12: Percentage Of Full Investigations Where The Case Of Marihuana Cultivation Proved To Be Founded,British Columbia 1997-2000 ............. ............. .............. ............. ............. ............. ............. .............. ............. ............. .......... 27
Figure 2.3: Number Of Founded Marihuana Cultivation Cases, British Columbia 1997-2000 ............. ............. .............. ... 27
Figure 2.4: Rates Per 1,000 Population Of Founded Marihuana Cultivation Cases, British Columbia 1997-2000............. ... 27
Table 2.13: Number Of Founded Cases Of Marihuana Cultivation By Development Region, British Columbia1997-2000............... ............. ............. ............. .............. ............. ............. ............. ............. .............. ............. ............. .......... 28
Table 2.14: Founded Cases Of Marihuana Cultivation And Percentage Increase In The Rates Over The Four-YearPeriod, British Columbia 1997- 2000.............. .............. ............. ............. ............. ............. .............. ............. ............. .......... 29
Map 2.4: Rate Per 1,000 Population Of Founded Marihuana Cultivation Cases By Development Region AndRegional District, British Columbia, 2000 ............. ............. ............. .............. ............. ............. ............. ............. .............. ... 30
Figure 3.1: Type Of Marihuana Growing Operations, British Columbia 1997-2000....... ............. .............. ............. ............ 34
Table 3.1: Percentage Of Marihuana Cultivation Cases Involving An Outdoor Operation In Each DevelopmentRegion, British Columbia 1997- 2000................. ............. ............. ............. .............. ............. ............. ............. ............. ...... 34
Figure 3.2: Number Of Marihuana Plants Seized, British Columbia, 1997-2000 ............ ............. .............. ............. ............ 35
Table 3.2: Number Of Marihuana Plants Seized And Average Number Of Plants Involved When Plants WereSeized By Type Of Operation, British Columbia 1997-2000 ............ .............. ............. ............. ............. ............. .............. ... 36
Table 3.3: Number Of Kilograms Of Harvested Marihuana Seized And Average Number Of Kilograms InvolvedWhen Harvested Marihuana Was Seized, British Columbia 1997- 2000 ............. ............. ............. .............. ............. ............ 37
Table 3.4: Estimated Total Quantity Of Potentially Marketable Marihuana Seized, British Columbia 1997-2000 ............ ... 37
Figure 3.3: Total Quantity (In Kilograms) Of Potentially Marketable Marihuana Seized, British Columbia 1997-2000 .................................................................................................................................................................................. 38
Table 3.5: Estimates Of The Total Value Of Potentially Marketable Marihuana Seized, British Columbia 1997-2000 .................................................................................................................................................................................. 39
Table 3.6: Special Growing Lights Seized From Indoor Marihuana Cultivation Operations, British Columbia 1997-2000 .................................................................................................................................................................................. 40
Table 3.7: Theft Of Electricity Involved In Cases Of Indoor Marihuana Growing Operations, British Columbia1997-2000............... ............. ............. ............. .............. ............. ............. ............. ............. .............. ............. ............. .......... 41
Table 3.8: Other Characteristics Of Marihuana Growing Operations, British Columbia 1997-2000.... ............. ............. ...... 42
Table 4.1: Number Of Suspects Identified In Relation To Founded Marihuana Cultivation Operations, BritishColumbia 1997-2000............ ............. ............. .............. ............. ............. ............. ............. .............. ............. ............. .......... 43
Table 4.2: Number, Age And Ethnic Group Of Suspects Involved In Marihuana Cultivation Operations, BritishColumbia 1997-2000............ ............. ............. .............. ............. ............. ............. ............. .............. ............. ............. .......... 45
Figure 4.1: Annual Percentages Of Suspects Involved In Marihuana Cultivation Operations By Ethnic Group,British Columbia 1997-2000 ............. ............. .............. ............. ............. ............. ............. .............. ............. ............. .......... 44
Table 4.3: Place Of Birth Of Suspects Involved In Marihuana Cultivation Incidents, British Columbia 1997-2000............ . 47
8/9/2019 BC Gro Op Satistics
http://slidepdf.com/reader/full/bc-gro-op-satistics 6/78
Marihuana Growing Operations in British Columbia 6
Table 4.4: Percentage Of Suspects Of Vietnamese Origin And Percentage Of Cases Involving Suspects Of Vietnamese Origin: Ten Jurisdictions In British Columbia With The Highest Volume Of Marihuana CultivationCases In 2000....................... ............. ............. .............. ............. ............. ............. ............. .............. ............. ............. .......... 48
Figure 4.2: Increase In The Proportion In Marihuana Cultivation Cases Involving Vietnamese Suspects – TenJurisdictions With Highest Volume Of Cases, British Columbia 1997–2000....... ............. ............. .............. ............. ............ 49
Table 4.5: Percentage Increase / Decrease Between 1997 And 2000 In The Number Of Founded MarihuanaCultivation Cases And In The Number Of Cases Without Suspects Of Vietnamese Origin - Ten Jurisdictions InBritish Columbia With The Highest Volume Of Founded Marihuana Cultivation Cases In 2000.............. .............. ............. . 47
Table 4.6: Percentage Of Suspects With A Confirmed Prior Criminal Conviction, Marihuana Cultivation Cases,British Columbia 1997-2000 ............. ............. .............. ............. ............. ............. ............. .............. ............. ............. .......... 51
Table 4.7: Comparison By Ethnic Affiliation Of The Criminal Histories Of Suspects Involved In MarihuanaCultivation Offences, British Columbia 1997-2000.... .............. ............. ............. ............. ............. .............. ............. ............ 52
Table 4.8: Province Where Marihuana Cultivation Suspects Have Most Frequently Been Convicted Of A CriminalOffence In The Past.............. ............. ............. .............. ............. ............. ............. ............. .............. ............. ............. .......... 53
Table 4.9: Province In Which Marihuana Cultivation Suspects Of Vietnamese Origin Have Most Frequently BeenConvicted Of A Criminal Offence In The Past, 1997-2000....... ............. ............. ............. ............. .............. ............. ............ 53
Table 4.10: Fifteen Most Frequent Jurisdictions In Which The Identified Suspects Of Vietnamese Origin HadPreviously Been Convicted In Canada............ .............. ............. ............. ............. ............. .............. ............. ............. .......... 54
Table 5.1: Percentage Of Founded Marihuna Cultivation Cases Classified As ‘No Case’ Seizures, British Columbia1997-2000............... ............. ............. ............. .............. ............. ............. ............. ............. .............. ............. ............. .......... 56
Table 5.2: Percentage Of Founded Cases Which Were Classified As ‘No Case’ By The Number Of MarihuanaPlants Seized, British Columbia 1997-2000 ............. ............. .............. ............. ............. ............. ............. .............. ............. . 57
Table 5.3: Total Number Of Charges Relating To Marihuana Cultivaion Incidents, British Columbia 1997-2000............ ... 58
Table 5.4: Percentage Of Charged Suspects By Type Of Charges, Marihuana Cultivation Operations, BritishColumbia 1997-2000............ ............. ............. .............. ............. ............. ............. ............. .............. ............. ............. .......... 59
Table 5.5: Percentage Of Suspects Whose Charges Were Stayed, Marihuana Cultivation Cases, British Columbia,1997-2000............... ............. ............. ............. .............. ............. ............. ............. ............. .............. ............. ............. .......... 60
Table 5.6: Gender Of Suspects In Whose Case Proceedings Have Been Stayed With Respect To All Charges,Marihuana Cultivation Cases, British Columbia 1997-2000 ............. .............. ............. ............. ............. ............. .............. ... 60
Table 5.7: Cases In Which Disposition Was Known In Marihuna Cultivation Cases, British Columbia 1997–2000......... ... 61
Table 5.8: Suspects Convicted Of Offences Related To Marihuana Cultivation Cases, British Columbia 1997-2000 ......... . 62
Table 5.9: Suspects Charged And Convicted, By Type Of Charge, Marihuana Cultivation Cases, British Columbia1997-2000............... ............. ............. ............. .............. ............. ............. ............. ............. .............. ............. ............. .......... 62
Table 5.10: Summary Comparison of Action Taken on the Charges, Accused, and Files Associated with CasesApproved by Crown Counsel in Marihuana Cultivation Cases, British Columbia 1997-2000............. ............. ............. ........ 63
Table 6.1: Percentage Of Cases Where Selected Penalties Were Awarded As Part Of A Sentence For Any Of TheCharges Involved, Marihuana Cultivation Cases, British Columbia 1997-2000............ ............. ............. ............. .............. ... 65
8/9/2019 BC Gro Op Satistics
http://slidepdf.com/reader/full/bc-gro-op-satistics 7/78
Marihuana Growing Operations in British Columbia 7
Table 6.2: Percentage Of Cases Where Prison Or Another Penalty Was The Most Serious Disposition Awarded AsPart Of The Sentence, Marihuana Cultivation Cases, British Columbia 1997-2000 ............ .............. ............. ............. .......... 66
Table 6.3: Percentage Of Cases In Which A Particular Penalty Was Imposed For The Offence For Which
Offenders Were Convicted And Penalty Imposed Depending On Whether Or Not The Offender Was Also ConvictedAnd Sentenced For Other Related Offences, Convictions In Relation To Marihuana Cultivation Cases, BritishColumbia 1997-2000............ ............. ............. .............. ............. ............. ............. ............. .............. ............. ............. .......... 67
Table 6.4: Average Quantum Of The Penalties Imposed By Type Of Penalty, Marihuana Cultivation Cases, BritishColumbia 1997-2000............ ............. ............. .............. ............. ............. ............. ............. .............. ............. ............. .......... 68
Table 6.5: Average Quantum Of Penalty Imposed Depending On The Offence For Which The Offender WasConvicted And Sentenced, And Penalty Imposed Depending On Whether Or Not The Offender Was Also ConvictedAnd Sentenced For Other Related Offences - Convictions In Relation To Marihuana Cultivation Cases, BritishColumbia 1997-2000............ ............. ............. .............. ............. ............. ............. ............. .............. ............. ............. .......... 69
Table 6.6: Relationship Between The Severity Of The Penalties Imposed And The Size Of The MarihuanaCultivation Operation - Offenders Sentenced For Offences Related To Marihuana Cultivation Operations, BritishColumbia 1997-2000............ ............. ............. .............. ............. ............. ............. ............. .............. ............. ............. .......... 70
Table 6.7: Percentage Of Offenders Who Received A Prison Term For An Offence Related To A MarihuanaCultivation Operation And Average Length Of Prison Terms, By Offenders’ Number Of Previous CriminalConvictions Of Any Type, British Columbia,1997-2000.............. ............. ............. .............. ............. ............. ............. ........ 71
Table 6.8: Percentage Of Offenders Who Received A Prison Term For An Offence Related To A MarihuanaCultivation Operation And Average Length Of Prison Terms, By Offenders’ Number Of Previous Convictions ForDrug Trafficking Or Production Related Offences, British Columbia 1997-2000............. ............. .............. ............. ............ 72
Table 6.9: Percentage Of Offenders With Prior Convictions Sentenced To A Prison Term And Average Of PrisonTerms, By Size Of The Marihuana Cultivation Operation, Marihuana Cultivation Operations, BritishColumbia,1997-2000............ ............. ............. .............. ............. ............. ............. ............. .............. ............. ............. .......... 73
Figure 6.1: Average Length Of Prison Term Imposed, Marihuana Cultivation Cases, British Columbia 1997-2000... ......... . 74
Table 6.10: Prison Sentences That Would Have Been Awarded Under Sentencing Guidelines Similar To Those InForce In The State Of Washington As Compared To Sentences Imposed In British Columbia: Offences Related ToMarihuana Cultivation Operations, British Columbia 1997- 2000............... .............. ............. ............. ............. ............. ...... 75
8/9/2019 BC Gro Op Satistics
http://slidepdf.com/reader/full/bc-gro-op-satistics 8/78
Marihuana Growing Operations in British Columbia 8
Chapter 1
IntroductionIt is no longer “breaking news” that marihuana growing operations or, “grow ops”, have
become a major concern in British Columbia in the press, among the public and, of course,
among those involved in law enforcement and the administration of justice. In terms of numbers
alone, according to Statistics Canada, cases of marihuana cultivation in this province accounted
for over 40% of all known incidents in the country. Despite this widespread concern, however,
up to this point in time, no comprehensive analysis of the nature and scope of the problem has
been undertaken on a province-wide basis. This document reports the findings of just such an
investigation.
According to the report Canadian Crime Statistics 20001 published by the Canadian Centre for
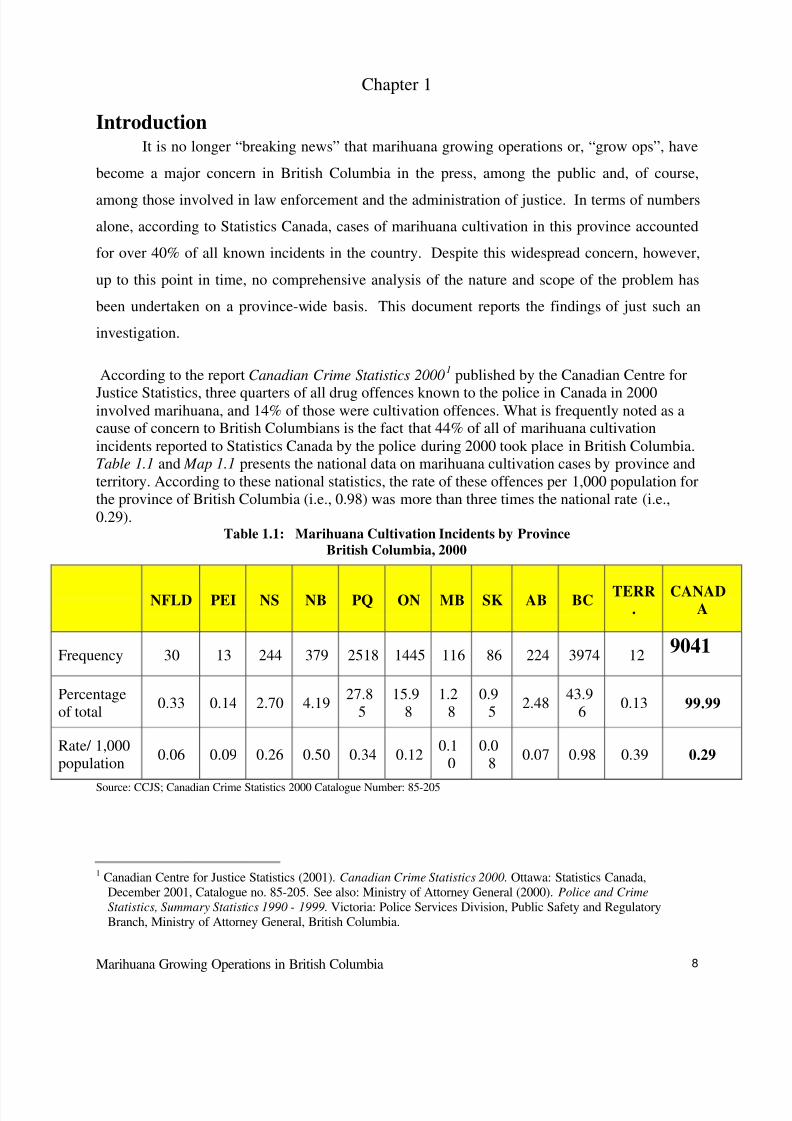
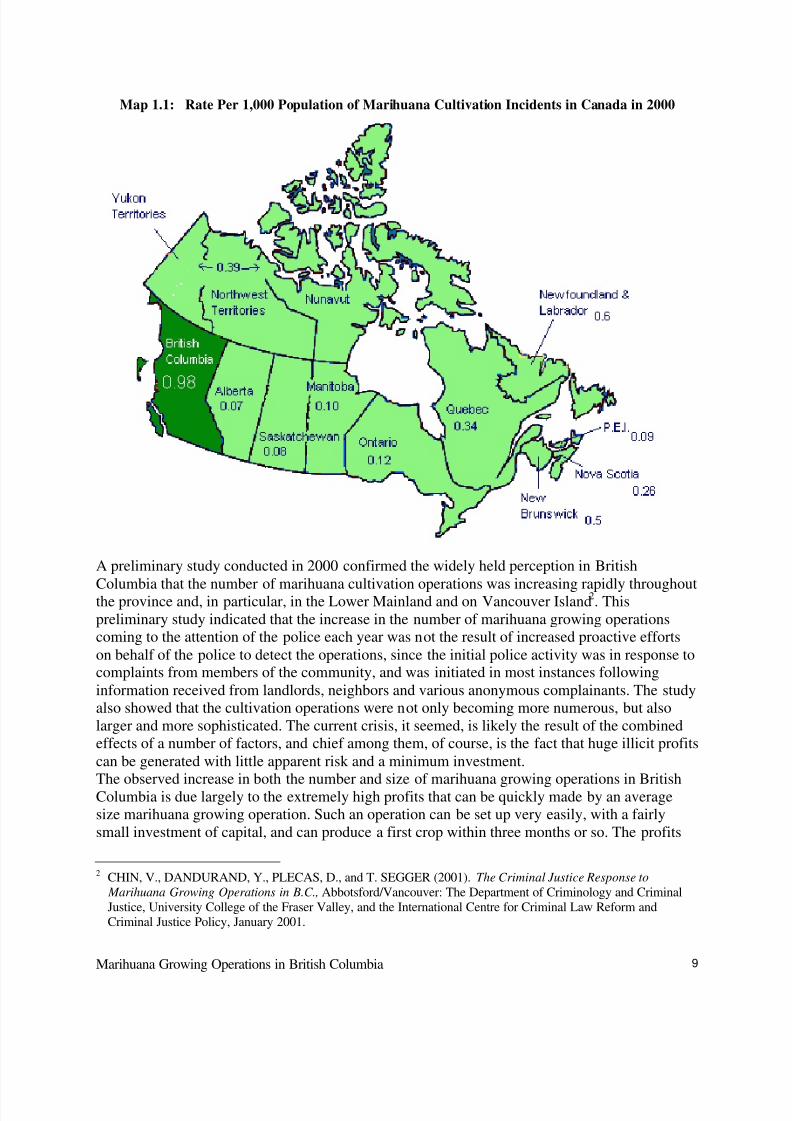
Justice Statistics, three quarters of all drug offences known to the police in Canada in 2000involved marihuana, and 14% of those were cultivation offences. What is frequently noted as acause of concern to British Columbians is the fact that 44% of all of marihuana cultivationincidents reported to Statistics Canada by the police during 2000 took place in British Columbia.Table 1.1 and Map 1.1 presents the national data on marihuana cultivation cases by province andterritory. According to these national statistics, the rate of these offences per 1,000 population forthe province of British Columbia (i.e., 0.98) was more than three times the national rate (i.e.,0.29).
Table 1.1: Marihuana Cultivation Incidents by ProvinceBritish Columbia, 2000
NFLD PEI NS NB PQ ON MB SK AB BC TERR.
CANADA
Frequency 30 13 244 379 2518 1445 116 86 224 3974 129041
Percentageof total
0.33 0.14 2.70 4.1927.8
515.9
81.2
80.9
52.48
43.96
0.13 99.99
Rate/ 1,000population
0.06 0.09 0.26 0.50 0.34 0.120.1
00.0
80.07 0.98 0.39 0.29
Source: CCJS; Canadian Crime Statistics 2000 Catalogue Number: 85-205
1 Canadian Centre for Justice Statistics (2001). Canadian Crime Statistics 2000. Ottawa: Statistics Canada,
December 2001, Catalogue no. 85-205. See also: Ministry of Attorney General (2000). Police and Crime
Statistics, Summary Statistics 1990 - 1999. Victoria: Police Services Division, Public Safety and RegulatoryBranch, Ministry of Attorney General, British Columbia.
8/9/2019 BC Gro Op Satistics
http://slidepdf.com/reader/full/bc-gro-op-satistics 9/78
Marihuana Growing Operations in British Columbia 9
Map 1.1: Rate Per 1,000 Population of Marihuana Cultivation Incidents in Canada in 2000
A preliminary study conducted in 2000 confirmed the widely held perception in British
Columbia that the number of marihuana cultivation operations was increasing rapidly throughoutthe province and, in particular, in the Lower Mainland and on Vancouver Island2. Thispreliminary study indicated that the increase in the number of marihuana growing operationscoming to the attention of the police each year was not the result of increased proactive effortson behalf of the police to detect the operations, since the initial police activity was in response tocomplaints from members of the community, and was initiated in most instances followinginformation received from landlords, neighbors and various anonymous complainants. The studyalso showed that the cultivation operations were not only becoming more numerous, but alsolarger and more sophisticated. The current crisis, it seemed, is likely the result of the combinedeffects of a number of factors, and chief among them, of course, is the fact that huge illicit profitscan be generated with little apparent risk and a minimum investment.
The observed increase in both the number and size of marihuana growing operations in BritishColumbia is due largely to the extremely high profits that can be quickly made by an averagesize marihuana growing operation. Such an operation can be set up very easily, with a fairlysmall investment of capital, and can produce a first crop within three months or so. The profits
2 CHIN, V., DANDURAND, Y., PLECAS, D., and T. SEGGER (2001). The Criminal Justice Response to
Marihuana Growing Operations in B.C., Abbotsford/Vancouver: The Department of Criminology and CriminalJustice, University College of the Fraser Valley, and the International Centre for Criminal Law Reform andCriminal Justice Policy, January 2001.
8/9/2019 BC Gro Op Satistics
http://slidepdf.com/reader/full/bc-gro-op-satistics 10/78
Marihuana Growing Operations in British Columbia 10
generated by the sale of a single crop are often totally out of proportion with the size of thegrower’s investment and the limited risks involved in running the operation. Nevertheless, therapid growth in the overall size of this illicit industry in British Columbia is most often explainedas a direct consequence of the relative impunity that marihuana growers enjoy in the province.There is of course no way of finding out exactly how many marihuana growing operations thereare in the province or in a given police jurisdiction. It is clear, however, that in many
communities, the problem has become endemic and has provoked severe crises for them as wellas serious challenges for law enforcement agencies. There is also mounting concern, particularlyamong law enforcement officials, that the increased criminal activity is the result of theinvolvement of organized criminal groups and their tightening control over the industry. There isgrowing evidence that criminal organizations have been moving their marihuana growingoperations from other parts of the country, or from neighboring states, to British Columbia.There is concern about how the huge profits realized by marihuana growing operations can beused by organized criminal elements to finance other activities or to illegally control othermarkets or parts of the local economy. Finally, it is becoming more evident that these organizedcriminal activities offer an increased threat of violent crime in many of the communities of theprovince.
Several community-based crime prevention initiatives have been launched throughout the regionin concert with various forms of enhanced law enforcement activities. “Snitch lines” and so-called “green teams” or “grow busters” teams have been set up by the police. Public informationinitiatives have also been launched as well as projects to foster the cooperation of propertyowners in preventing and detecting marihuana growing operations. Municipal by-laws havebeen adopted in some communities to put added pressure on property owners to become morediligent in preventing their property from being used for marihuana cultivation. These and otherinitiatives consume a significant amount of law enforcement and criminal justice resources.Current law enforcement efforts are by all accounts very significant; however, they have yet toproduce visible results in British Columbia in terms of reducing the prevalence of these illegalgrowing operations and effectively disrupting the resulting thriving illicit market. At best, itwould seem, they have succeeded in some cases in producing a slight displacement of theproblem from one area to another, or from one neighborhood to another.The present study was conducted jointly by the Department of Criminology and Criminal Justiceof the University College of the Fraser Valley and the International Centre for Criminal LawReform and Criminal Justice Policy, in cooperation with the Drug Enforcement Branch, “E”Division, of the Royal Canadian Mounted Police. The study was funded by the R.C.M.P. andwas based on the same methodology as the preliminary study mentioned earlier which hadfocused on only three jurisdictions in the Province of British Columbia. The present study,however, involved the cooperation of every single police jurisdiction in the province and yieldeddata on all cases of marihuana growing operations that came to the attention of the police in theprovince between January 1, 1997 and December 31, 2000. The data were collected during thesummer of 2001 and analyzed the following fall.
The study was conducted in order to gain a better understanding of the proliferation of marihuana growing operations in British Columbia and to review the current law enforcementand criminal justice response to that problem. The study was designed to: (1) documentvariations in the prevalence and profile of the marihuana growing operations that came to theattention of the police in British Columbia during the four-year period; and, (2) document thevarious decisions made in these cases with respect to the investigation, disposition andsentencing of these cases in the province during that period.
8/9/2019 BC Gro Op Satistics
http://slidepdf.com/reader/full/bc-gro-op-satistics 11/78
Marihuana Growing Operations in British Columbia 11
METHODBased on experience of the first study, it was decided that the current study would capture datafor the four-year period of time between January 1, 1997 and December 31, 2000. It was felt thatsuch of period of time would be sufficient to allow the observation of potential changes in thepatterns of the operations. It was also felt that most cases originating in 1997, 1998 and 1999would hold a reasonable prospect of being completed and having reached the sentencing stage.It had been agreed that all R.C.M.P. detachments within the province would participate in thestudy. Furthermore, the participation of every municipal police department in the province wassolicited and obtained by officials of the R.C.M.P. “E” Division.Based on the revised list of data elements identified during the preliminary study and furtherconsultations with R.C.M.P. and Vancouver Police officials, as well as officials from theOrganized Crime Agency of British Columbia and the Police Services Division of the Ministry of the Attorney General, a list was developed of all the data elements to be captured during the datacollection phase. Several elements which the preliminary study had shown could not beconsistently obtained from police files were eliminated from the list. The list was then used todevelop the three data coding instruments which can be found in the Appendices, one for each case( Appendix 1) and two for each offender involved in a case ( Appendices 2 and 3).Researchers visited virtually every R.C.M.P. detachment and municipal police department in theprovince, a total of 1493, and they physically reviewed every police file4 coded as a marihuanacultivation file (according to the OSR Scoring Guide) and manually coded and recorded theinformation contained therein on the project data gathering and scoring sheets (a few of the 1997files, less than one hundred, could not be accessed due to a change in the way in which thesefiles were coded by the police for statistical purposes). The information collected from each fileincluded information about the suspect, the location of the alleged growing operation, the natureand origin of the complaint, the police investigation, the size and type of the growing operation,the amount of marihuana involved, the presence of other drugs, the presence of variousequipment, decisions made by the prosecution, and the sentencing outcome.Most operations involved multiple suspects. In every case, the initial suspect-related information
collected from police files, such as the suspect’s name and aliases, date of birth, or fingerprintsheet (F.P.S.) identification number, was then used to conduct a criminal record check for eachsuspect and to obtain a copy of the suspect’s criminal record. The information on the suspect’scriminal record was then coded and related by a unique identifier to the other data collected oneach case of marihuana cultivation. At the same time, the criminal record information was alsoused to verify the information already collected on offenders’ case dispositions or sentences inthe marihuana growing cases in relation to which they had been identified for the purpose of thestudy. After the data was collected in the manner described above and a database was created, allinformation concerning the identity of individual suspects was removed from the researcher’sdatabase, and the data collection forms including such information were destroyed. The finaldatabase, thus prepared, was analyzed using the statistical analysis program SPSS (version 10.1).
3 Researchers visited 149 locations including: 130 R.C.M.P. detachments (there were only 5 detachments in remote
locations that were not attended and that was because it was determined that there were no cases at thoselocations); 5 R.C.M.P District Drug offices; all 12 municipal police departments; and 2 Organized Crime Agencyof British Columbia offices.
4 A very small number of files were excluded mostly because the investigation was still in progress and the security
of the sensitive information they contained had to be protected.
8/9/2019 BC Gro Op Satistics
http://slidepdf.com/reader/full/bc-gro-op-satistics 12/78
Marihuana Growing Operations in British Columbia 12
Chapter 2
Incidents of Alleged Marihuana Cultivation Coming to the
Attention of the PoliceAccording to the present study, the number of alleged incidents of marihuana cultivation thatcame to the attention of the police in British Columbia between 1997 and 2000 increased by anaverage of 48% each year. By the year 2000, the number of such incidents was more than threetimes what it had been in 1997, bringing the provincial rate of these incidents per 1,000population to 1.18, by far the highest in the country.A substantial increase in the number of cases was observed in all parts of the province, but wasparticularly evident in a number of jurisdictions in the Lower Mainland and on VancouverIsland. Ten police jurisdictions from these regions accounted for six out of every ten cases in2000. The increased volume appears to have been driven mostly by anonymous complaints andcomplaints by neighbors and landlords. In that sense, law enforcement agencies were mostly
responding to complaints received from the public, as opposed to being engaged in proactiveefforts to uncover new marihuana cultivation operations. The data collected suggests that therapid increase in the volume of cases has impaired the ability of some police forces to investigatenew cases as expeditiously as they did before the increase, and may even have adversely affectedthe effectiveness of these investigations.
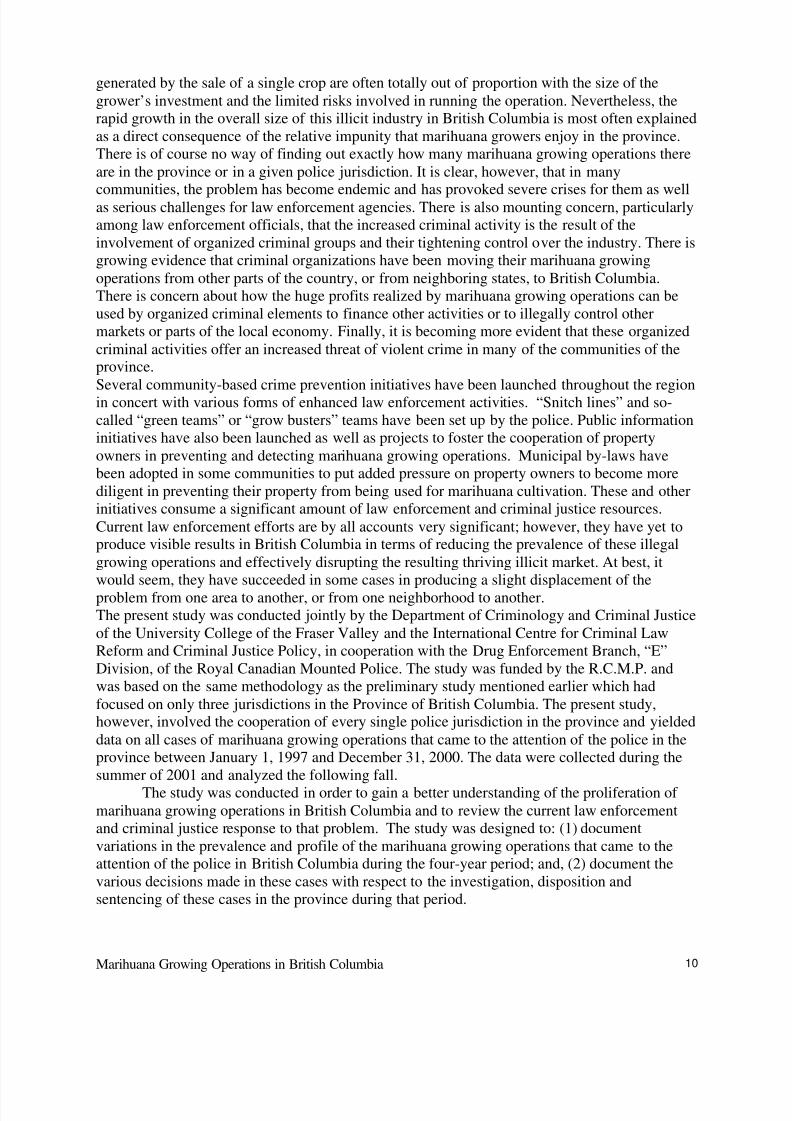
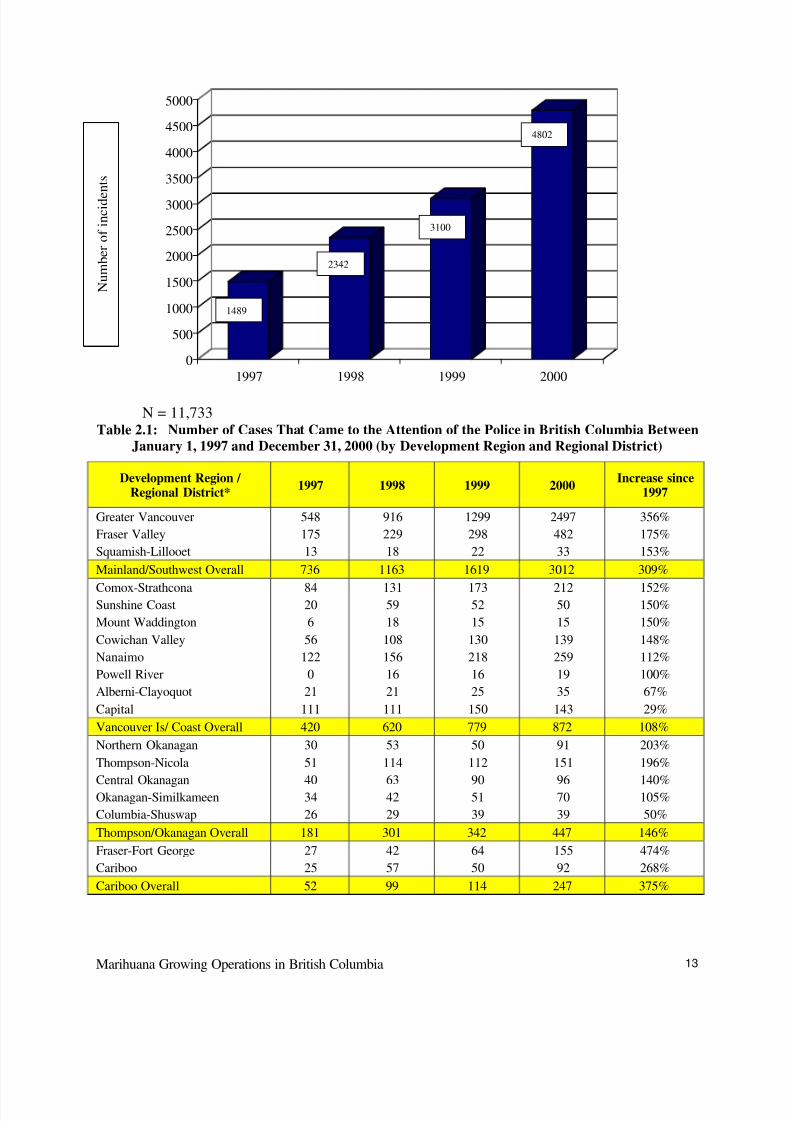
SUSPECTED CASES OF MARIHUANA CULTIVATIONDuring the four-year period between January 1997 and December 2000, a total of 11,733 distinctincidents of alleged marihuana cultivation came to the attention of the police in the province of British Columbia. Figure 2.1, below, reports the total number of cases of marihuana growingoperations for each of the four years. It is readily apparent that the number of incidents increased
drastically every year during the period under review, and by an average of 48% each year, (thatis 57% in 1998, 32% in 1999, and 55% in 2000). The number of cases in 2000 was more thanthree times that of 1997. In fact, the 4,802 incidents in 2000 represented an increase of 222%over the number of known incidents in 1997.
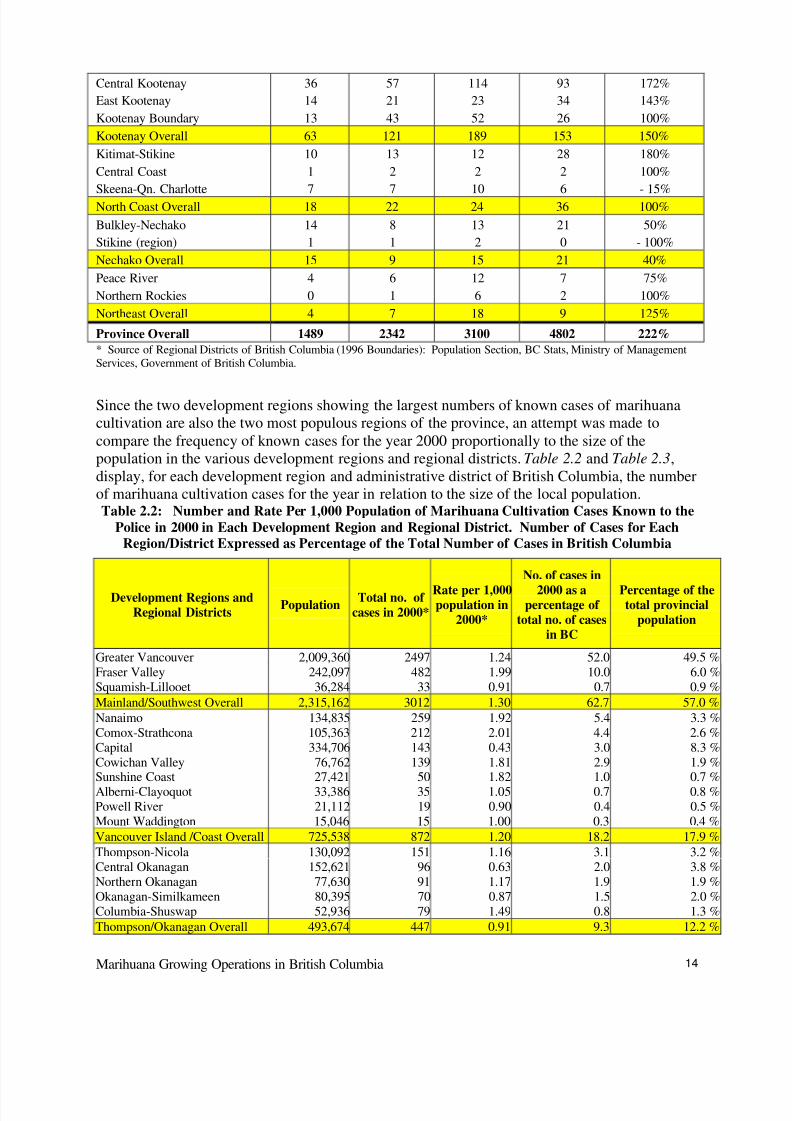
Table 2.1, presents data on the frequency of marihuana cultivation cases in each of the eightdevelopment regions of the province: Mainland/Southwest, Vancouver Island/Coast,Thompson/Okanagan, Cariboo, Kootenay, North Coast, Nechako, and the Northeast. Eighty onepercent of all known cases of marihuana cultivation were found in only two of the eight regions,the Lower Mainland (including Vancouver) and the Vancouver Island/Coast Region. The former,in particular, has seen a spectacular growth (309 %) between 1997 and 2000.
Figure 2.1: Number of Marihuana Cultivation Incidents Which Came to the Attention of Police
Agencies in British Columbia Between January, 1 1997 and December 31, 20005
5 The frequencies shown in Figure 2.1 exclude a small number files relating to on-going investigations,
“information” files, and a number of files from the period between January 1, 1997 and May 30, 1997, which weremissed from the review because they were classified under a coding system different from the current one, and theone used to guide the extracting of files for review. The total number of files thus missed was calculated to be lessthan 100.
8/9/2019 BC Gro Op Satistics
http://slidepdf.com/reader/full/bc-gro-op-satistics 13/78
Marihuana Growing Operations in British Columbia 13
0
500
1000
1500
2000
2500
3000
3500
4000
4500
5000
1997 1998 1999 2000
N = 11,733Table 2.1: Number of Cases That Came to the Attention of the Police in British Columbia Between
January 1, 1997 and December 31, 2000 (by Development Region and Regional District)
Development Region / Regional District*
1997 1998 1999 2000Increase since
1997
Greater Vancouver
Fraser Valley
Squamish-Lillooet
548
175
13
916
229
18
1299
298
22
2497
482
33
356%
175%
153%
Mainland/Southwest Overall 736 1163 1619 3012 309%
Comox-StrathconaSunshine Coast
Mount Waddington
Cowichan Valley
Nanaimo
Powell River
Alberni-Clayoquot
Capital
8420
6
56
122
0
21
111
13159
18
108
156
16
21
111
17352
15
130
218
16
25
150
21250
15
139
259
19
35
143
152%150%
150%
148%
112%
100%
67%
29%
Vancouver Is/ Coast Overall 420 620 779 872 108%
Northern Okanagan
Thompson-Nicola
Central OkanaganOkanagan-Similkameen
Columbia-Shuswap
30
51
4034
26
53
114
6342
29
50
112
9051
39
91
151
9670
39
203%
196%
140%105%
50%
Thompson/Okanagan Overall 181 301 342 447 146%
Fraser-Fort George
Cariboo
27
25
42
57
64
50
155
92
474%
268%
Cariboo Overall 52 99 114 247 375%
4802
1489
3100
2342
N u m b e r o f i n c i d e
n t s
8/9/2019 BC Gro Op Satistics
http://slidepdf.com/reader/full/bc-gro-op-satistics 14/78
Marihuana Growing Operations in British Columbia 14
Central Kootenay
East Kootenay
Kootenay Boundary
36
14
13
57
21
43
114
23
52
93
34
26
172%
143%
100%
Kootenay Overall 63 121 189 153 150%
Kitimat-Stikine
Central Coast
Skeena-Qn. Charlotte
10
1
7
13
2
7
12
2
10
28
2
6
180%
100%
- 15%
North Coast Overall 18 22 24 36 100%
Bulkley-Nechako
Stikine (region)
14
1
8
1
13
2
21
0
50%
- 100%
Nechako Overall 15 9 15 21 40%
Peace River
Northern Rockies
4
0
6
1
12
6
7
2
75%
100%
Northeast Overall 4 7 18 9 125%
Province Overall 1489 2342 3100 4802 222%* Source of Regional Districts of British Columbia (1996 Boundaries): Population Section, BC Stats, Ministry of ManagementServices, Government of British Columbia.
Since the two development regions showing the largest numbers of known cases of marihuanacultivation are also the two most populous regions of the province, an attempt was made tocompare the frequency of known cases for the year 2000 proportionally to the size of thepopulation in the various development regions and regional districts. Table 2.2 and Table 2.3,display, for each development region and administrative district of British Columbia, the numberof marihuana cultivation cases for the year in relation to the size of the local population.Table 2.2: Number and Rate Per 1,000 Population of Marihuana Cultivation Cases Known to the
Police in 2000 in Each Development Region and Regional District. Number of Cases for EachRegion/District Expressed as Percentage of the Total Number of Cases in British Columbia
Development Regions andRegional Districts
PopulationTotal no. of
cases in 2000*
Rate per 1,000population in
2000*
No. of cases in
2000 as apercentage of
total no. of casesin BC
Percentage of thetotal provincial
population
Greater Vancouver 2,009,360 2497 1.24 52.0 49.5 %Fraser Valley 242,097 482 1.99 10.0 6.0 %Squamish-Lillooet 36,284 33 0.91 0.7 0.9 %
Mainland/Southwest Overall 2,315,162 3012 1.30 62.7 57.0 %Nanaimo 134,835 259 1.92 5.4 3.3 %Comox-Strathcona 105,363 212 2.01 4.4 2.6 %Capital 334,706 143 0.43 3.0 8.3 %Cowichan Valley 76,762 139 1.81 2.9 1.9 %Sunshine Coast 27,421 50 1.82 1.0 0.7 %Alberni-Clayoquot 33,386 35 1.05 0.7 0.8 %Powell River 21,112 19 0.90 0.4 0.5 %Mount Waddington 15,046 15 1.00 0.3 0.4 %Vancouver Island /Coast Overall 725,538 872 1.20 18.2 17.9 %Thompson-Nicola 130,092 151 1.16 3.1 3.2 %Central Okanagan 152,621 96 0.63 2.0 3.8 %Northern Okanagan 77,630 91 1.17 1.9 1.9 %Okanagan-Similkameen 80,395 70 0.87 1.5 2.0 %Columbia-Shuswap 52,936 79 1.49 0.8 1.3 %Thompson/Okanagan Overall 493,674 447 0.91 9.3 12.2 %
8/9/2019 BC Gro Op Satistics
http://slidepdf.com/reader/full/bc-gro-op-satistics 15/78
Marihuana Growing Operations in British Columbia 15
Fraser-Fort George 106,850 155 1.45 3.2 2.6 %Cariboo 73,492 92 1.25 1.9 1.8 %
Cariboo Overall 180,342 247 1.37 5.1 4.4 %Central Kootenay 61,752 93 1.51 2.0 1.5 %East Kootenay 62,240 34 0.55 0.7 1.5 %Kootenay Boundary 34,040 26 0.76 0.5 0.8 %Kootenay Overall 158,032 153 0.97 3.3 3.9 %
Kitimat-Stikine 46,803 28 0.60 0.6 1.2 %Central Coast 4,328 2 0.46 0.1 0.1 %Skeena-Queen Charlotte 25,493 6 0.24 0.0 0.6 %North Coast Overall 72,296 36 0.50 0.7 1.8 %Bulkley-Nechako 45,538 21 0.46 0.4 1.1 %Stikine (region) 1,489 0 0.00 0.0 0%
Nechako Overall 47,027 21 0.45 0.4 1.2 %Peace River 60,333 7 0.12 0.1 1.5 %Northern Rockies 6,429 2 0.31 0.0 0.2 %
Northeast Overall 66,762 9 0.13 0.2 1.6 %
Province Overall 4,058,833 4802 1.18 100 100.0%* Source of population statistics: Population Section, BC Stats, Ministry of Management Services, Government of BritishColumbia.
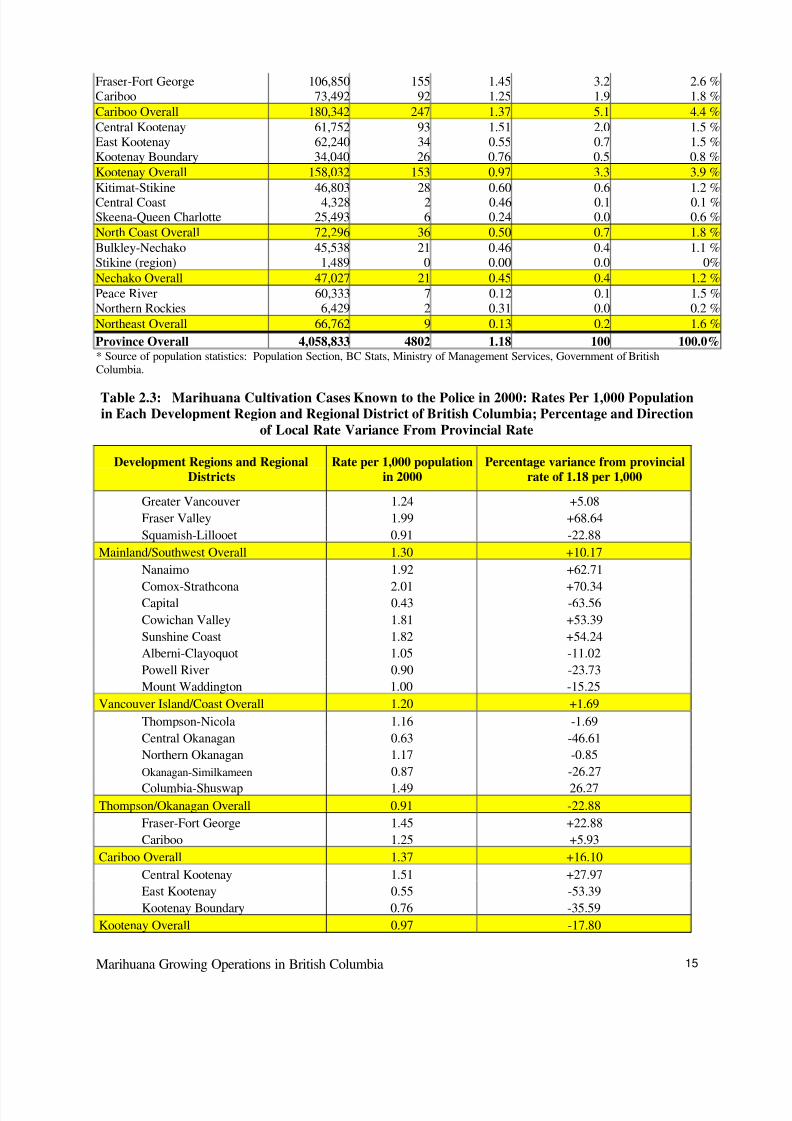
Table 2.3: Marihuana Cultivation Cases Known to the Police in 2000: Rates Per 1,000 Populationin Each Development Region and Regional District of British Columbia; Percentage and Direction
of Local Rate Variance From Provincial Rate
Development Regions and RegionalDistricts
Rate per 1,000 populationin 2000
Percentage variance from provincialrate of 1.18 per 1,000
Greater Vancouver 1.24 +5.08
Fraser Valley 1.99 +68.64
Squamish-Lillooet 0.91 -22.88
Mainland/Southwest Overall 1.30 +10.17
Nanaimo 1.92 +62.71
Comox-Strathcona 2.01 +70.34Capital 0.43 -63.56
Cowichan Valley 1.81 +53.39
Sunshine Coast 1.82 +54.24
Alberni-Clayoquot 1.05 -11.02
Powell River 0.90 -23.73
Mount Waddington 1.00 -15.25
Vancouver Island/Coast Overall 1.20 +1.69
Thompson-Nicola 1.16 -1.69
Central Okanagan 0.63 -46.61
Northern Okanagan 1.17 -0.85
Okanagan-Similkameen 0.87 -26.27
Columbia-Shuswap 1.49 26.27Thompson/Okanagan Overall 0.91 -22.88
Fraser-Fort George 1.45 +22.88
Cariboo 1.25 +5.93
Cariboo Overall 1.37 +16.10
Central Kootenay 1.51 +27.97
East Kootenay 0.55 -53.39
Kootenay Boundary 0.76 -35.59
Kootenay Overall 0.97 -17.80
8/9/2019 BC Gro Op Satistics
http://slidepdf.com/reader/full/bc-gro-op-satistics 16/78
Marihuana Growing Operations in British Columbia 16
Kitimat-Stikine 0.60 -49.15
Central Coast 0.46 -61.02
Skeena-Qn. Charlotte 0.24 -79.66
North Coast Overall 0.50 -57.63
Bulkley-Nechako 0.46 -61.02
Stikine (region) 0.00 -100.00
Nechako Overall 0.45 -61.86
Peace River 0.12 -89.83
Northern Rockies 0.31 -73.73
Northeast Overall 0.13 -88.98
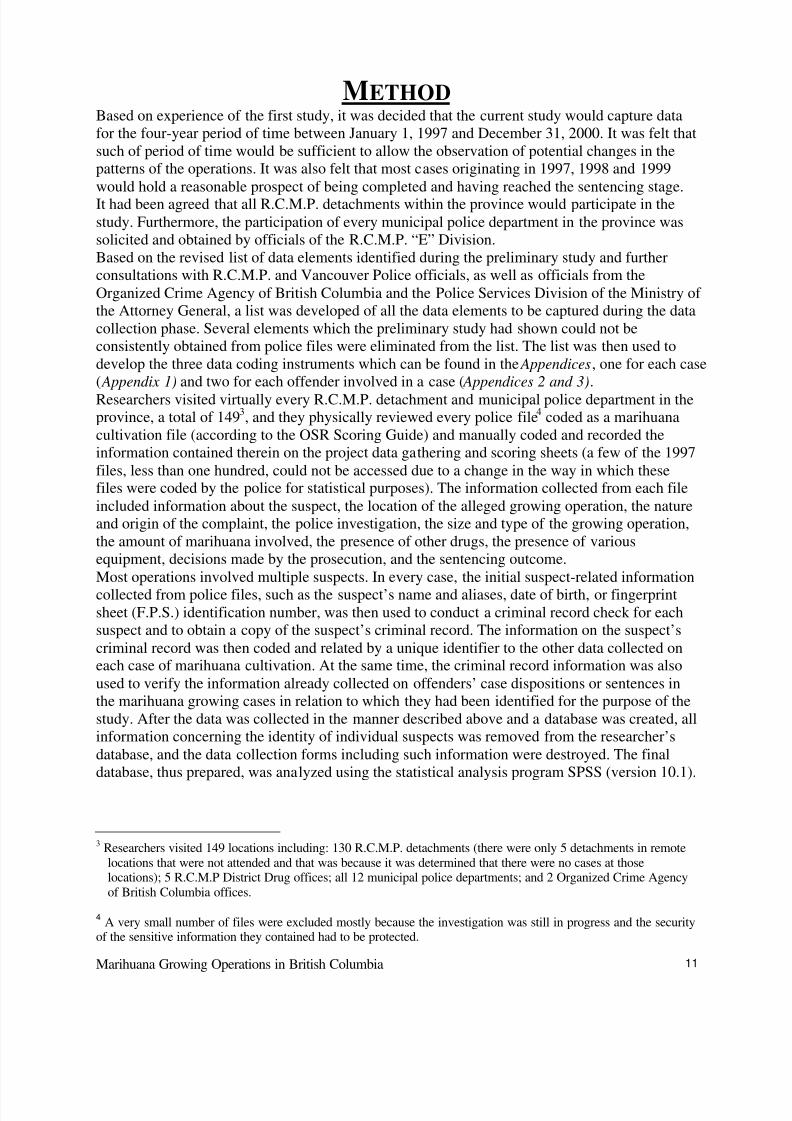
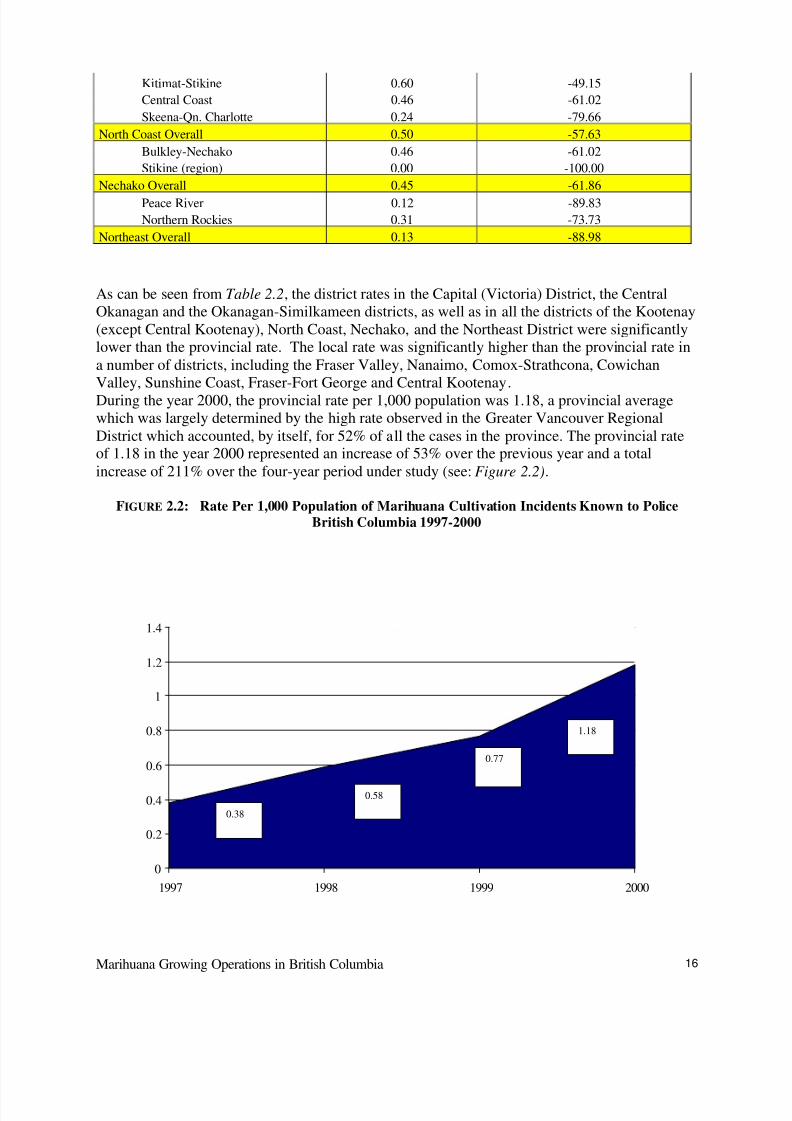
As can be seen from Table 2.2, the district rates in the Capital (Victoria) District, the CentralOkanagan and the Okanagan-Similkameen districts, as well as in all the districts of the Kootenay(except Central Kootenay), North Coast, Nechako, and the Northeast District were significantlylower than the provincial rate. The local rate was significantly higher than the provincial rate ina number of districts, including the Fraser Valley, Nanaimo, Comox-Strathcona, CowichanValley, Sunshine Coast, Fraser-Fort George and Central Kootenay.During the year 2000, the provincial rate per 1,000 population was 1.18, a provincial averagewhich was largely determined by the high rate observed in the Greater Vancouver RegionalDistrict which accounted, by itself, for 52% of all the cases in the province. The provincial rateof 1.18 in the year 2000 represented an increase of 53% over the previous year and a totalincrease of 211% over the four-year period under study (see: Figure 2.2).
FIGURE 2.2: Rate Per 1,000 Population of Marihuana Cultivation Incidents Known to PoliceBritish Columbia 1997-2000
0
0.2
0.4
0.6
0.8
1
1.2
1.4
1997 1998 1999 2000
0.77
1.18
0.58
0.38
8/9/2019 BC Gro Op Satistics
http://slidepdf.com/reader/full/bc-gro-op-satistics 17/78
Marihuana Growing Operations in British Columbia 17
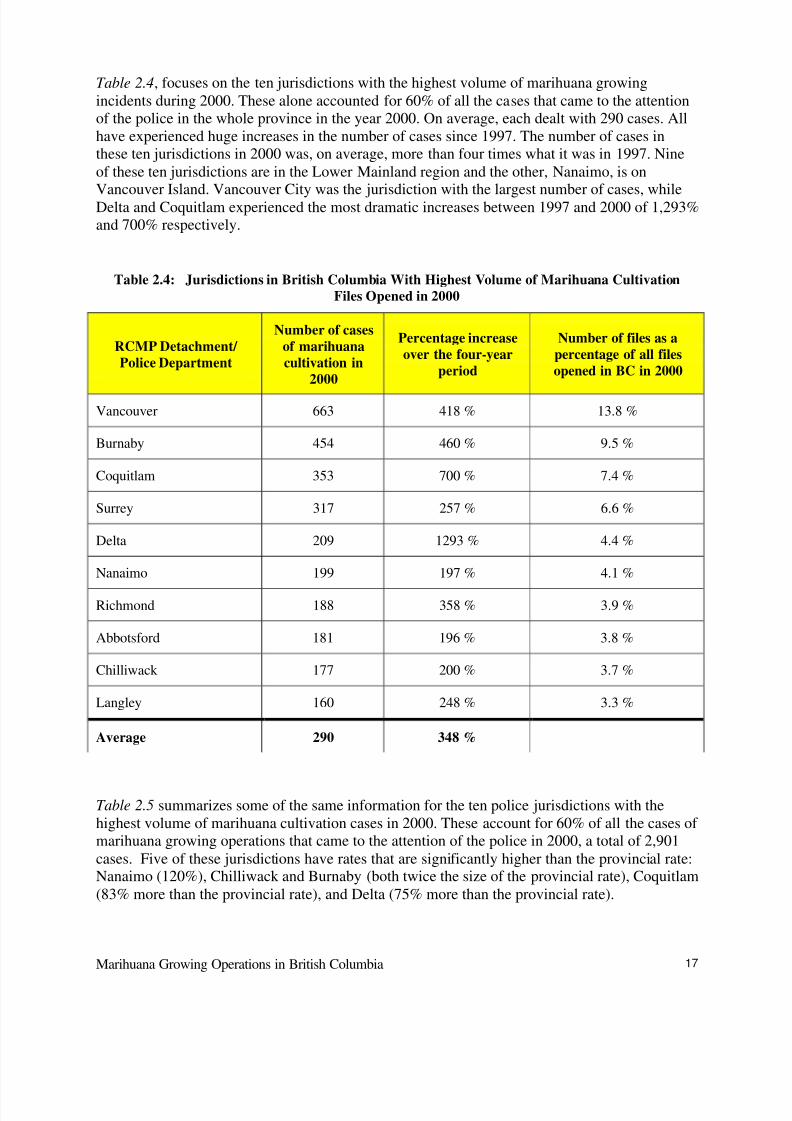
Table 2.4, focuses on the ten jurisdictions with the highest volume of marihuana growingincidents during 2000. These alone accounted for 60% of all the cases that came to the attentionof the police in the whole province in the year 2000. On average, each dealt with 290 cases. Allhave experienced huge increases in the number of cases since 1997. The number of cases inthese ten jurisdictions in 2000 was, on average, more than four times what it was in 1997. Nineof these ten jurisdictions are in the Lower Mainland region and the other, Nanaimo, is on
Vancouver Island. Vancouver City was the jurisdiction with the largest number of cases, whileDelta and Coquitlam experienced the most dramatic increases between 1997 and 2000 of 1,293%and 700% respectively.
Table 2.4: Jurisdictions in British Columbia With Highest Volume of Marihuana CultivationFiles Opened in 2000
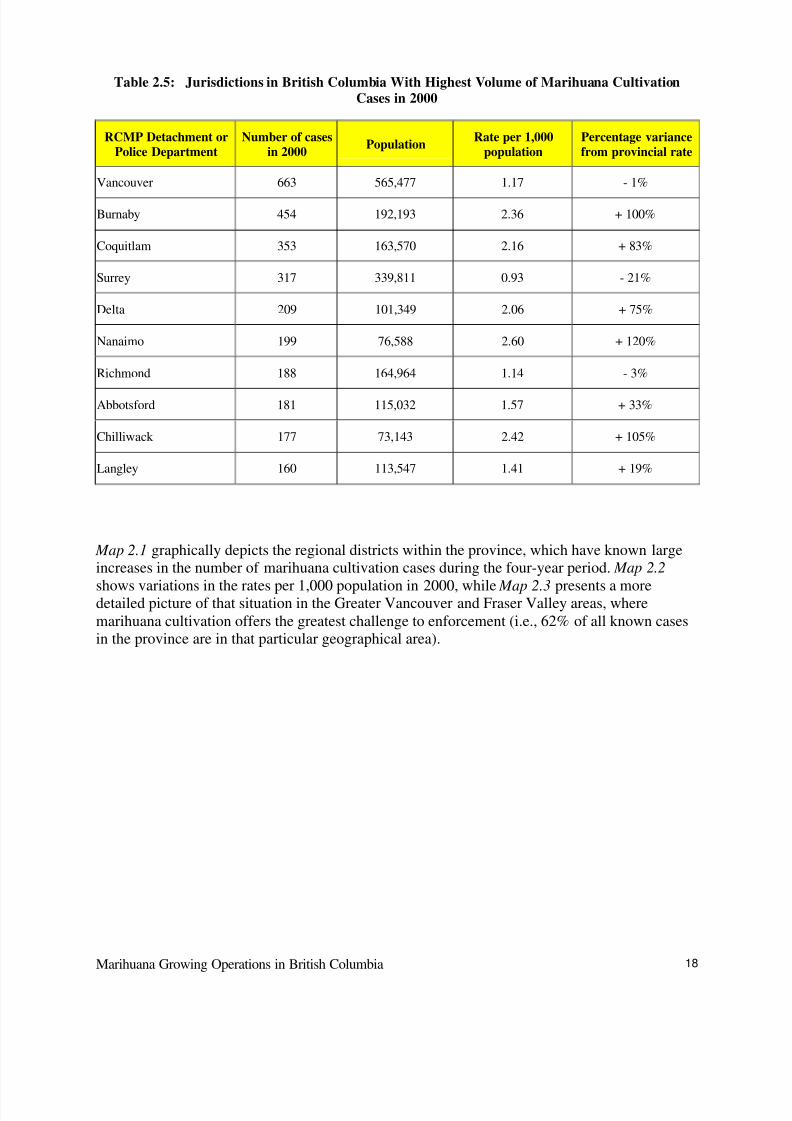
Table 2.5 summarizes some of the same information for the ten police jurisdictions with thehighest volume of marihuana cultivation cases in 2000. These account for 60% of all the cases of marihuana growing operations that came to the attention of the police in 2000, a total of 2,901cases. Five of these jurisdictions have rates that are significantly higher than the provincial rate:Nanaimo (120%), Chilliwack and Burnaby (both twice the size of the provincial rate), Coquitlam(83% more than the provincial rate), and Delta (75% more than the provincial rate).
RCMP Detachment/ Police Department
Number of casesof marihuanacultivation in
2000
Percentage increaseover the four-year
period
Number of files as apercentage of all filesopened in BC in 2000
Vancouver 663 418 % 13.8 %
Burnaby 454 460 % 9.5 %
Coquitlam 353 700 % 7.4 %
Surrey 317 257 % 6.6 %
Delta 209 1293 % 4.4 %
Nanaimo 199 197 % 4.1 %
Richmond 188 358 % 3.9 %
Abbotsford 181 196 % 3.8 %
Chilliwack 177 200 % 3.7 %
Langley 160 248 % 3.3 %
Average 290 348 %
8/9/2019 BC Gro Op Satistics
http://slidepdf.com/reader/full/bc-gro-op-satistics 18/78
Marihuana Growing Operations in British Columbia 18
Table 2.5: Jurisdictions in British Columbia With Highest Volume of Marihuana CultivationCases in 2000
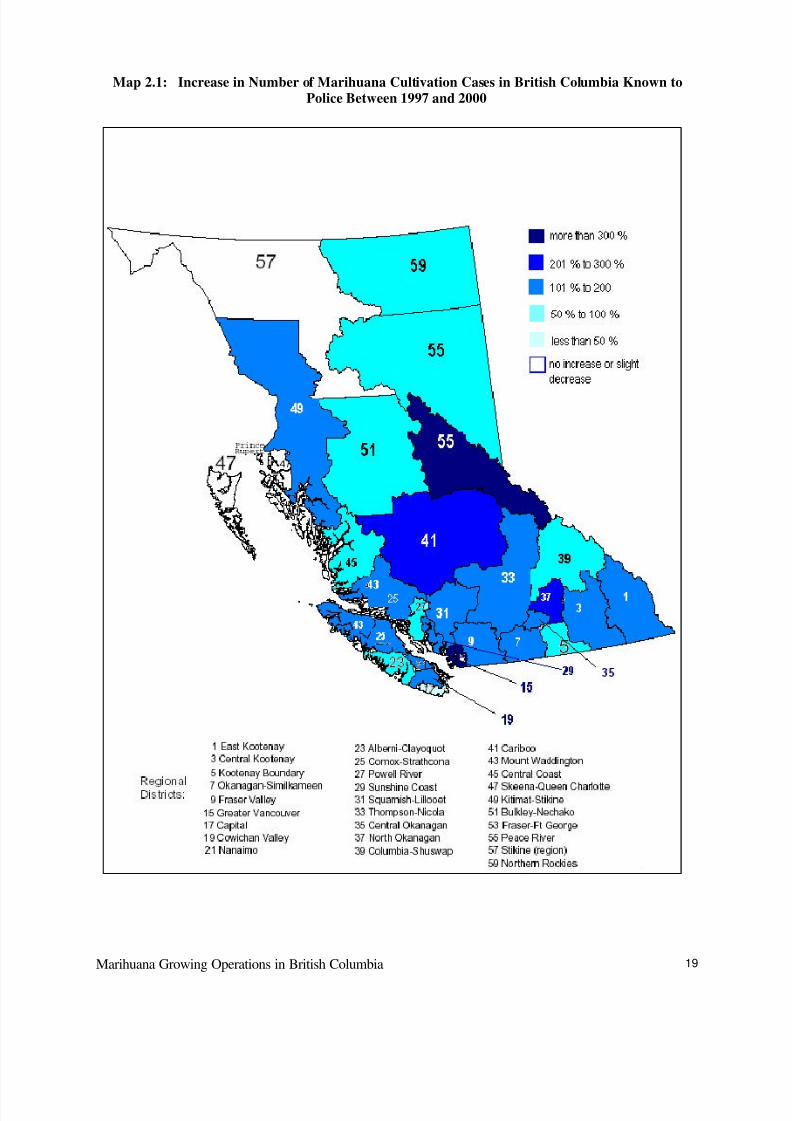
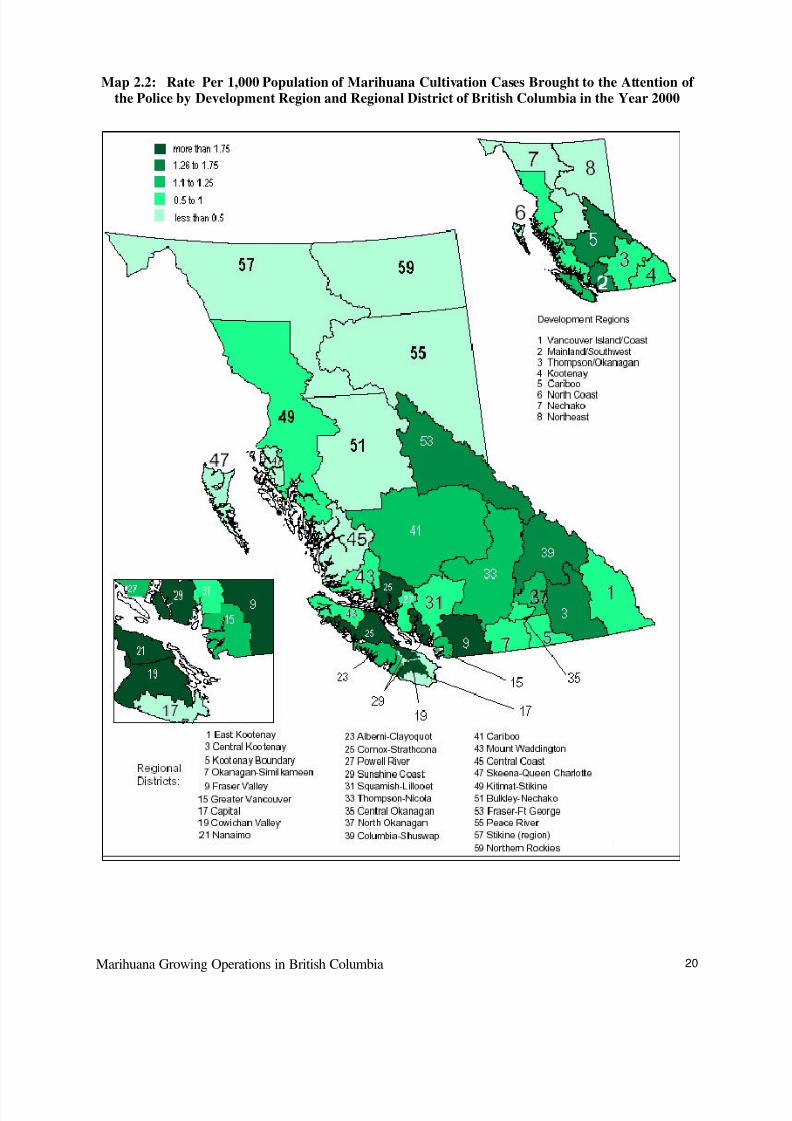
Map 2.1 graphically depicts the regional districts within the province, which have known largeincreases in the number of marihuana cultivation cases during the four-year period. Map 2.2
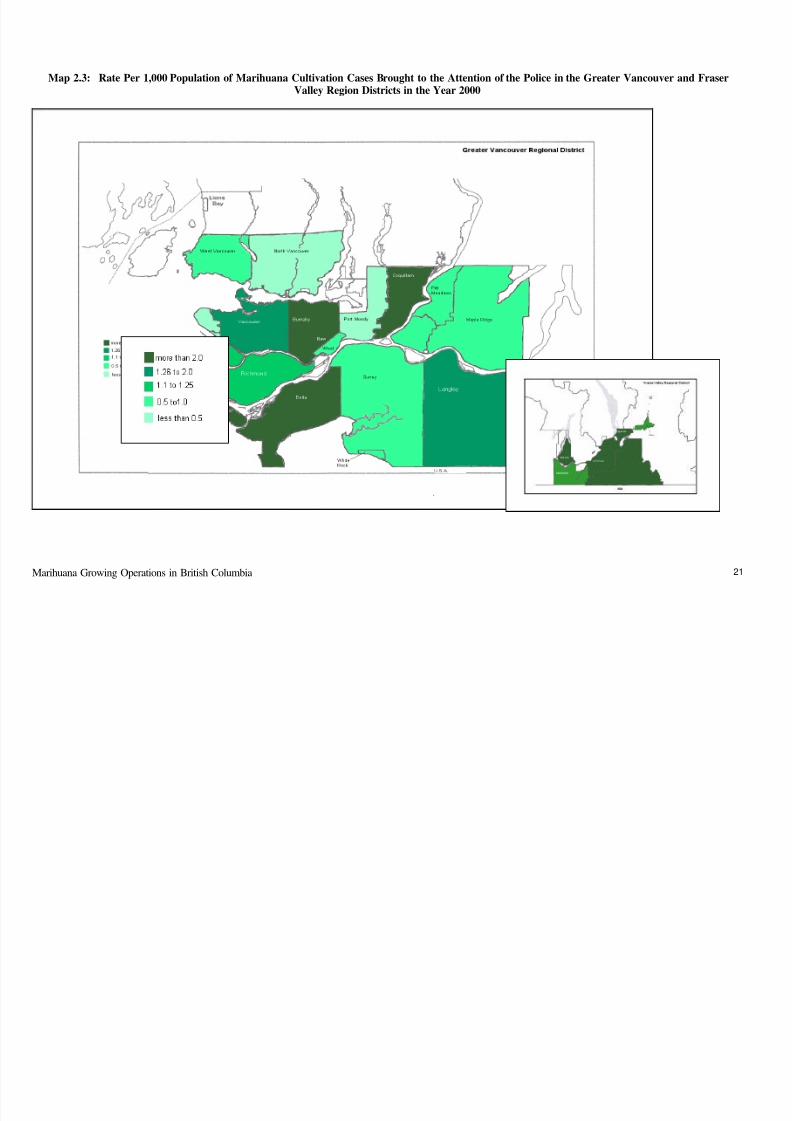
shows variations in the rates per 1,000 population in 2000, while Map 2.3 presents a moredetailed picture of that situation in the Greater Vancouver and Fraser Valley areas, wheremarihuana cultivation offers the greatest challenge to enforcement (i.e., 62% of all known casesin the province are in that particular geographical area).
RCMP Detachment orPolice Department
Number of casesin 2000
PopulationRate per 1,000
populationPercentage variancefrom provincial rate
Vancouver 663 565,477 1.17 - 1%
Burnaby 454 192,193 2.36 + 100%
Coquitlam 353 163,570 2.16 + 83%
Surrey 317 339,811 0.93 - 21%
Delta 209 101,349 2.06 + 75%
Nanaimo 199 76,588 2.60 + 120%
Richmond 188 164,964 1.14 - 3%
Abbotsford 181 115,032 1.57 + 33%
Chilliwack 177 73,143 2.42 + 105%
Langley 160 113,547 1.41 + 19%
8/9/2019 BC Gro Op Satistics
http://slidepdf.com/reader/full/bc-gro-op-satistics 19/78
Marihuana Growing Operations in British Columbia 19
Map 2.1: Increase in Number of Marihuana Cultivation Cases in British Columbia Known toPolice Between 1997 and 2000
8/9/2019 BC Gro Op Satistics
http://slidepdf.com/reader/full/bc-gro-op-satistics 20/78
Marihuana Growing Operations in British Columbia 20
Map 2.2: Rate Per 1,000 Population of Marihuana Cultivation Cases Brought to the Attention of the Police by Development Region and Regional District of British Columbia in the Year 2000
8/9/2019 BC Gro Op Satistics
http://slidepdf.com/reader/full/bc-gro-op-satistics 21/78
Marihuana Growing Operations in British Columbia 21
Map 2.3: Rate Per 1,000 Population of Marihuana Cultivation Cases Brought to the Attention of the Police in the Greater Vancouver and FraserValley Region Districts in the Year 2000
8/9/2019 BC Gro Op Satistics
http://slidepdf.com/reader/full/bc-gro-op-satistics 22/78
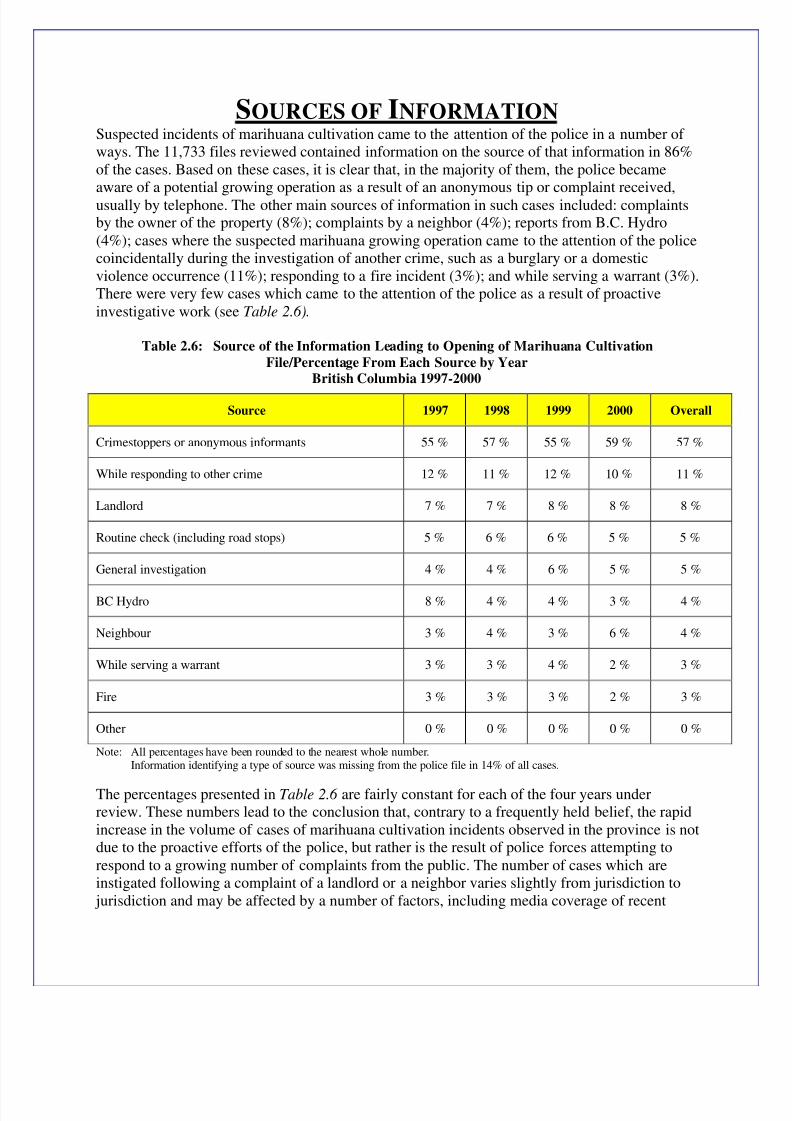
SOURCES OF INFORMATIONSuspected incidents of marihuana cultivation came to the attention of the police in a number of ways. The 11,733 files reviewed contained information on the source of that information in 86%of the cases. Based on these cases, it is clear that, in the majority of them, the police becameaware of a potential growing operation as a result of an anonymous tip or complaint received,usually by telephone. The other main sources of information in such cases included: complaintsby the owner of the property (8%); complaints by a neighbor (4%); reports from B.C. Hydro(4%); cases where the suspected marihuana growing operation came to the attention of the policecoincidentally during the investigation of another crime, such as a burglary or a domesticviolence occurrence (11%); responding to a fire incident (3%); and while serving a warrant (3%).There were very few cases which came to the attention of the police as a result of proactiveinvestigative work (see Table 2.6).
Table 2.6: Source of the Information Leading to Opening of Marihuana CultivationFile/Percentage From Each Source by Year
British Columbia 1997-2000
Source 1997 1998 1999 2000 Overall
Crimestoppers or anonymous informants 55 % 57 % 55 % 59 % 57 %
While responding to other crime 12 % 11 % 12 % 10 % 11 %
Landlord 7 % 7 % 8 % 8 % 8 %
Routine check (including road stops) 5 % 6 % 6 % 5 % 5 %
General investigation 4 % 4 % 6 % 5 % 5 %
BC Hydro 8 % 4 % 4 % 3 % 4 %
Neighbour 3 % 4 % 3 % 6 % 4 %
While serving a warrant 3 % 3 % 4 % 2 % 3 %
Fire 3 % 3 % 3 % 2 % 3 %
Other 0 % 0 % 0 % 0 % 0 %
Note: All percentages have been rounded to the nearest whole number.Information identifying a type of source was missing from the police file in 14% of all cases.
The percentages presented in Table 2.6 are fairly constant for each of the four years underreview. These numbers lead to the conclusion that, contrary to a frequently held belief, the rapidincrease in the volume of cases of marihuana cultivation incidents observed in the province is notdue to the proactive efforts of the police, but rather is the result of police forces attempting torespond to a growing number of complaints from the public. The number of cases which areinstigated following a complaint of a landlord or a neighbor varies slightly from jurisdiction to jurisdiction and may be affected by a number of factors, including media coverage of recent
8/9/2019 BC Gro Op Satistics
http://slidepdf.com/reader/full/bc-gro-op-satistics 23/78
Marihuana Growing Operations in British Columbia
23
23
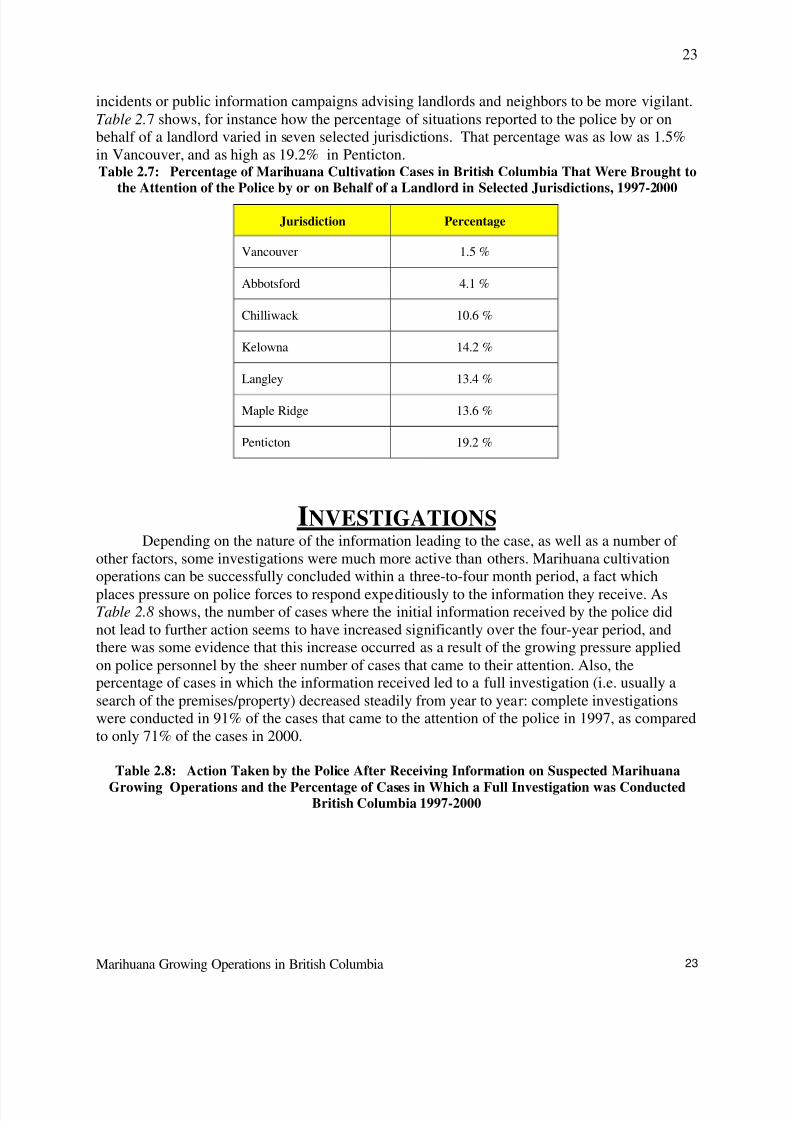
incidents or public information campaigns advising landlords and neighbors to be more vigilant.Table 2.7 shows, for instance how the percentage of situations reported to the police by or onbehalf of a landlord varied in seven selected jurisdictions. That percentage was as low as 1.5%in Vancouver, and as high as 19.2% in Penticton.Table 2.7: Percentage of Marihuana Cultivation Cases in British Columbia That Were Brought to
the Attention of the Police by or on Behalf of a Landlord in Selected Jurisdictions, 1997-2000
INVESTIGATIONSDepending on the nature of the information leading to the case, as well as a number of
other factors, some investigations were much more active than others. Marihuana cultivationoperations can be successfully concluded within a three-to-four month period, a fact which
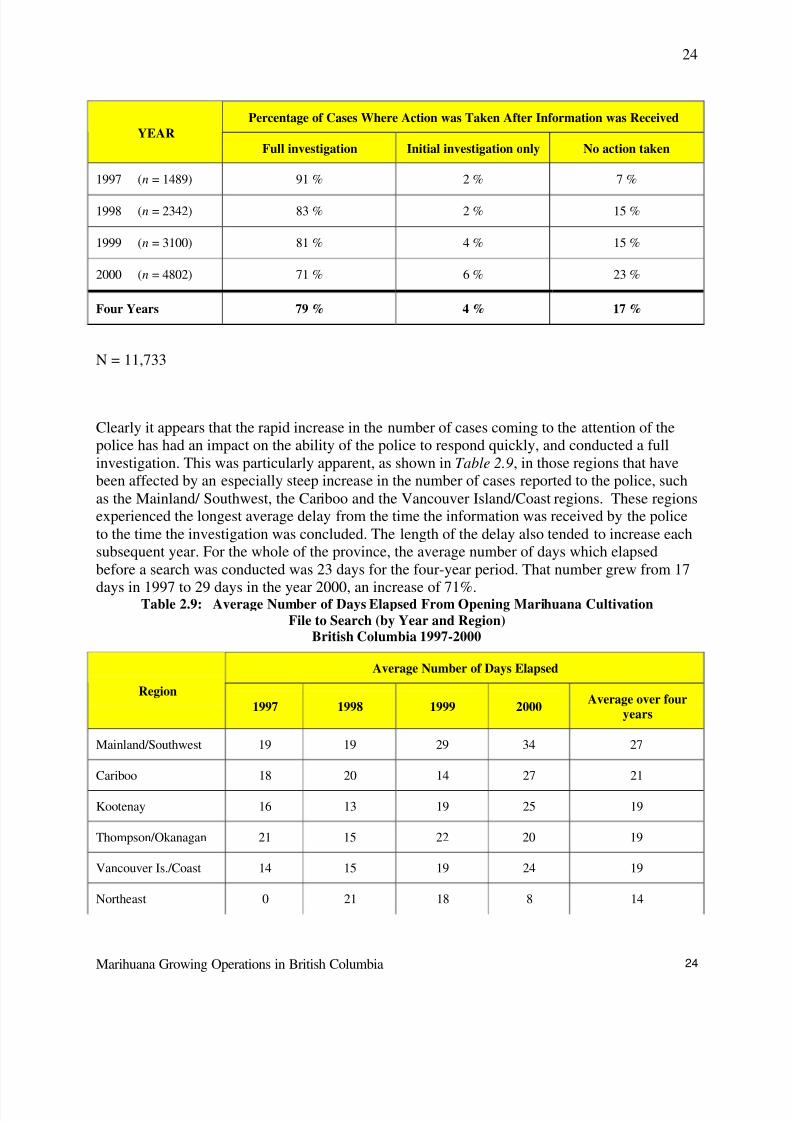
places pressure on police forces to respond expeditiously to the information they receive. AsTable 2.8 shows, the number of cases where the initial information received by the police didnot lead to further action seems to have increased significantly over the four-year period, andthere was some evidence that this increase occurred as a result of the growing pressure appliedon police personnel by the sheer number of cases that came to their attention. Also, thepercentage of cases in which the information received led to a full investigation (i.e. usually asearch of the premises/property) decreased steadily from year to year: complete investigationswere conducted in 91% of the cases that came to the attention of the police in 1997, as comparedto only 71% of the cases in 2000.
Table 2.8: Action Taken by the Police After Receiving Information on Suspected Marihuana
Growing Operations and the Percentage of Cases in Which a Full Investigation was ConductedBritish Columbia 1997-2000
Jurisdiction Percentage
Vancouver 1.5 %
Abbotsford 4.1 %
Chilliwack 10.6 %
Kelowna 14.2 %
Langley 13.4 %
Maple Ridge 13.6 %
Penticton 19.2 %
8/9/2019 BC Gro Op Satistics
http://slidepdf.com/reader/full/bc-gro-op-satistics 24/78
Marihuana Growing Operations in British Columbia
24
24
N = 11,733
Clearly it appears that the rapid increase in the number of cases coming to the attention of thepolice has had an impact on the ability of the police to respond quickly, and conducted a fullinvestigation. This was particularly apparent, as shown in Table 2.9, in those regions that havebeen affected by an especially steep increase in the number of cases reported to the police, suchas the Mainland/ Southwest, the Cariboo and the Vancouver Island/Coast regions. These regionsexperienced the longest average delay from the time the information was received by the policeto the time the investigation was concluded. The length of the delay also tended to increase eachsubsequent year. For the whole of the province, the average number of days which elapsedbefore a search was conducted was 23 days for the four-year period. That number grew from 17
days in 1997 to 29 days in the year 2000, an increase of 71%.Table 2.9: Average Number of Days Elapsed From Opening Marihuana Cultivation
File to Search (by Year and Region)British Columbia 1997-2000
Average Number of Days Elapsed
Region1997 1998 1999 2000
Average over fouryears
Mainland/Southwest 19 19 29 34 27
Cariboo 18 20 14 27 21
Kootenay 16 13 19 25 19
Thompson/Okanagan 21 15 22 20 19
Vancouver Is./Coast 14 15 19 24 19
Northeast 0 21 18 8 14
Percentage of Cases Where Action was Taken After Information was ReceivedYEAR
Full investigation Initial investigation only No action taken
1997 (n = 1489) 91 % 2 % 7 %
1998 (n = 2342) 83 % 2 % 15 %
1999 (n = 3100) 81 % 4 % 15 %
2000 (n = 4802) 71 % 6 % 23 %
Four Years 79 % 4 % 17 %
8/9/2019 BC Gro Op Satistics
http://slidepdf.com/reader/full/bc-gro-op-satistics 25/78
Marihuana Growing Operations in British Columbia
25
25
Nechako 5 19 19 17 15
North Coast 3 3 49 4 13
Provincial Overall 17 17 24 29 23
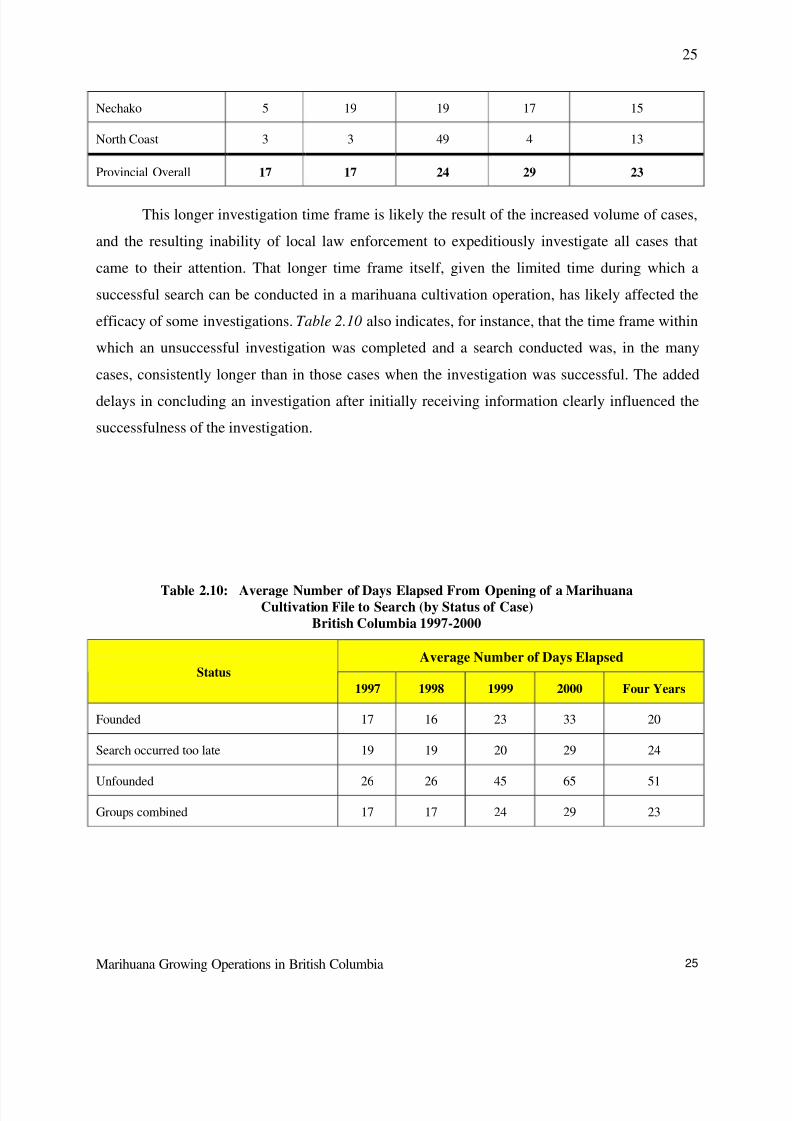
This longer investigation time frame is likely the result of the increased volume of cases,
and the resulting inability of local law enforcement to expeditiously investigate all cases that
came to their attention. That longer time frame itself, given the limited time during which a
successful search can be conducted in a marihuana cultivation operation, has likely affected the
efficacy of some investigations. Table 2.10 also indicates, for instance, that the time frame within
which an unsuccessful investigation was completed and a search conducted was, in the many
cases, consistently longer than in those cases when the investigation was successful. The added
delays in concluding an investigation after initially receiving information clearly influenced the
successfulness of the investigation.
Table 2.10: Average Number of Days Elapsed From Opening of a MarihuanaCultivation File to Search (by Status of Case)
British Columbia 1997-2000
Average Number of Days ElapsedStatus
1997 1998 1999 2000 Four Years
Founded 17 16 23 33 20
Search occurred too late 19 19 20 29 24
Unfounded 26 26 45 65 51
Groups combined 17 17 24 29 23
8/9/2019 BC Gro Op Satistics
http://slidepdf.com/reader/full/bc-gro-op-satistics 26/78
Marihuana Growing Operations in British Columbia
26
26
* ALL FIGURES ROUNDED.
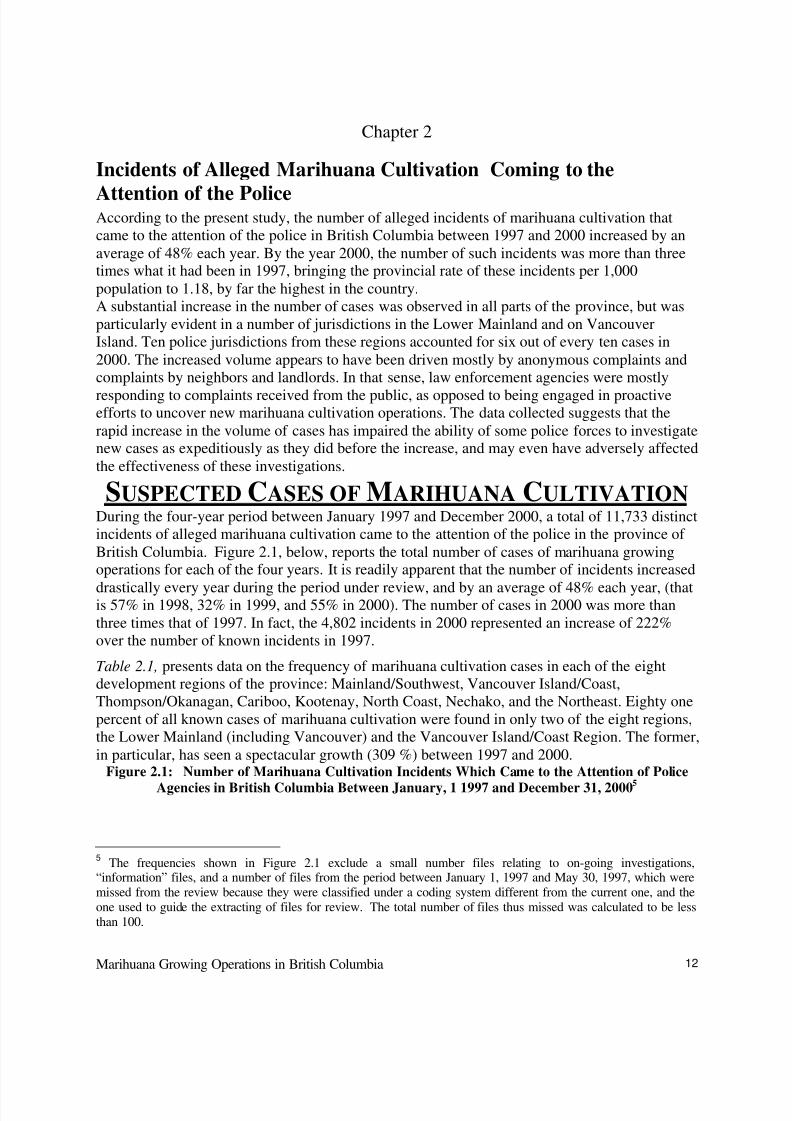
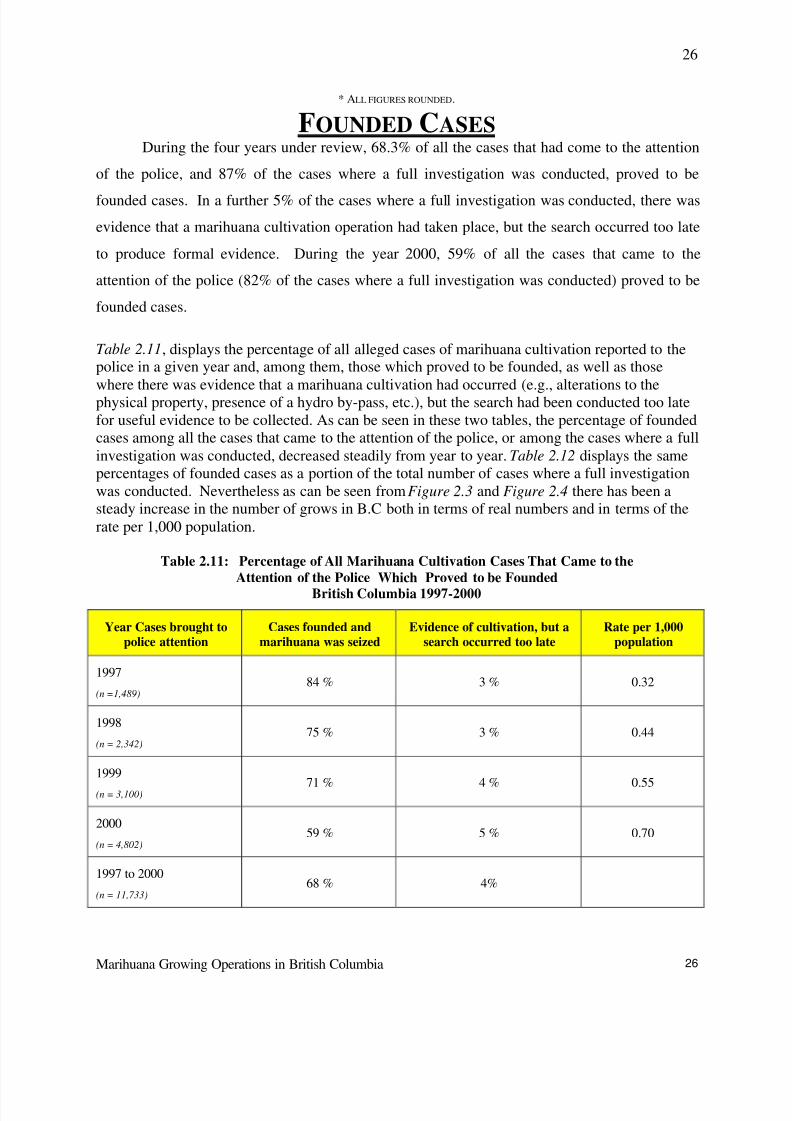
FOUNDED CASESDuring the four years under review, 68.3% of all the cases that had come to the attention
of the police, and 87% of the cases where a full investigation was conducted, proved to be
founded cases. In a further 5% of the cases where a full investigation was conducted, there was
evidence that a marihuana cultivation operation had taken place, but the search occurred too late
to produce formal evidence. During the year 2000, 59% of all the cases that came to the
attention of the police (82% of the cases where a full investigation was conducted) proved to be
founded cases.
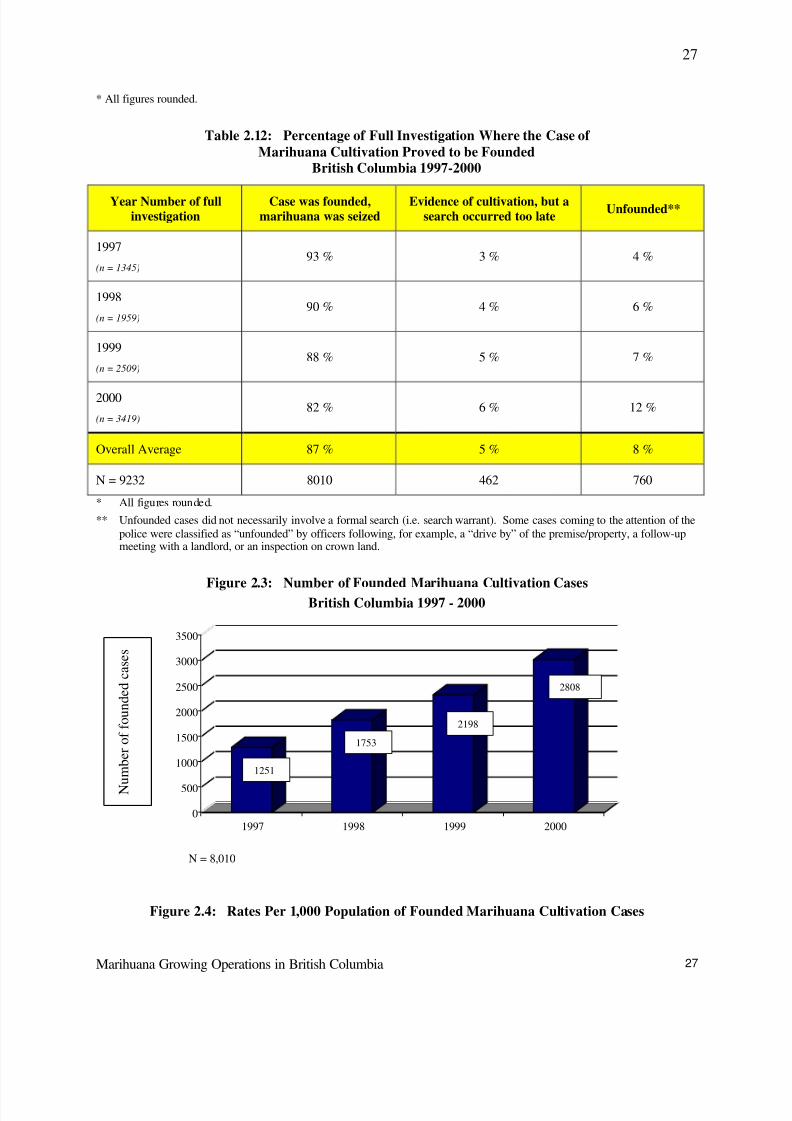
Table 2.11, displays the percentage of all alleged cases of marihuana cultivation reported to thepolice in a given year and, among them, those which proved to be founded, as well as those
where there was evidence that a marihuana cultivation had occurred (e.g., alterations to thephysical property, presence of a hydro by-pass, etc.), but the search had been conducted too latefor useful evidence to be collected. As can be seen in these two tables, the percentage of foundedcases among all the cases that came to the attention of the police, or among the cases where a fullinvestigation was conducted, decreased steadily from year to year. Table 2.12 displays the samepercentages of founded cases as a portion of the total number of cases where a full investigationwas conducted. Nevertheless as can be seen from Figure 2.3 and Figure 2.4 there has been asteady increase in the number of grows in B.C both in terms of real numbers and in terms of therate per 1,000 population.
Table 2.11: Percentage of All Marihuana Cultivation Cases That Came to theAttention of the Police Which Proved to be Founded
British Columbia 1997-2000
Year Cases brought topolice attention
Cases founded andmarihuana was seized
Evidence of cultivation, but asearch occurred too late
Rate per 1,000population
1997
(n =1,489)84 % 3 % 0.32
1998
(n = 2,342)75 % 3 % 0.44
1999
(n = 3,100) 71 % 4 % 0.55
2000
(n = 4,802)59 % 5 % 0.70
1997 to 2000
(n = 11,733)68 % 4%
8/9/2019 BC Gro Op Satistics
http://slidepdf.com/reader/full/bc-gro-op-satistics 27/78
Marihuana Growing Operations in British Columbia
27
27
* All figures rounded.
Table 2.12: Percentage of Full Investigation Where the Case of Marihuana Cultivation Proved to be Founded
British Columbia 1997-2000
* All figures rounded.
** Unfounded cases did not necessarily involve a formal search (i.e. search warrant). Some cases coming to the attention of thepolice were classified as “unfounded” by officers following, for example, a “drive by” of the premise/property, a follow-upmeeting with a landlord, or an inspection on crown land.
Figure 2.3: Number of Founded Marihuana Cultivation CasesBritish Columbia 1997 - 2000
0
500
1000
1500
2000
2500
3000
3500
1997 1998 1999 2000
N = 8,010
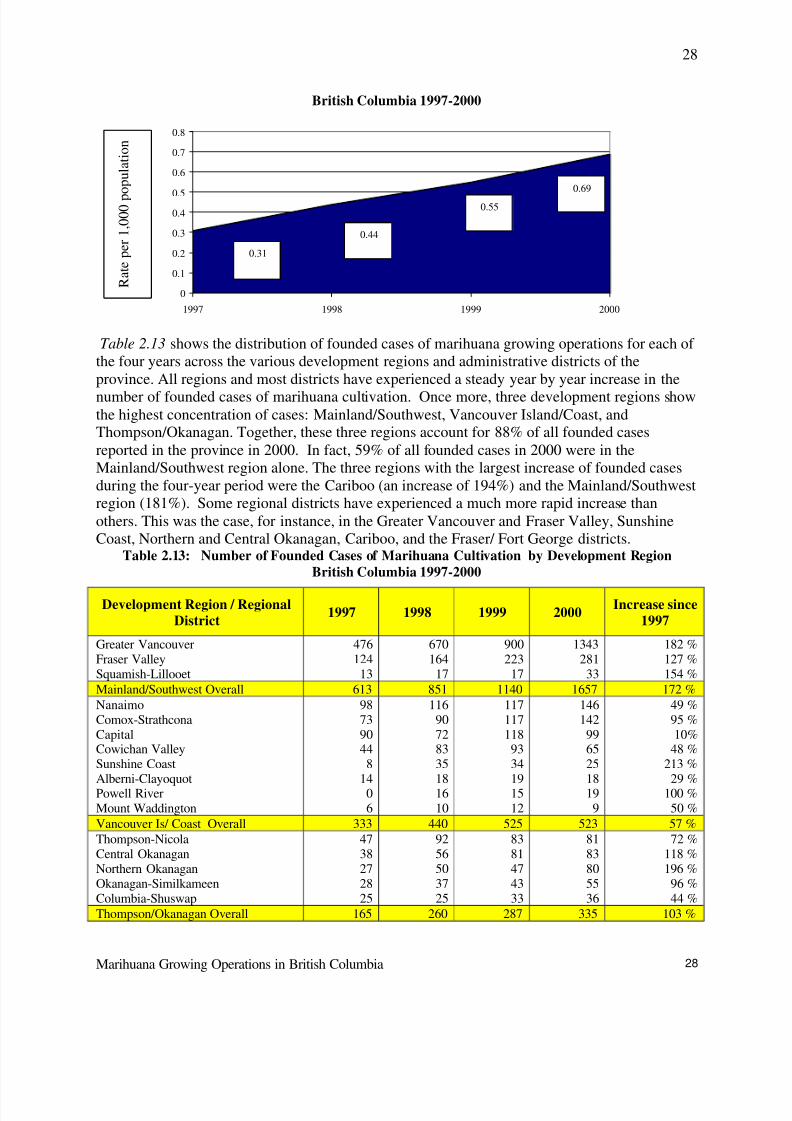
Figure 2.4: Rates Per 1,000 Population of Founded Marihuana Cultivation Cases
Year Number of fullinvestigation
Case was founded,marihuana was seized
Evidence of cultivation, but asearch occurred too late
Unfounded**
1997
(n = 1345)93 % 3 % 4 %
1998
(n = 1959)90 % 4 % 6 %
1999
(n = 2509)88 % 5 % 7 %
2000
(n = 3419)82 % 6 % 12 %
Overall Average 87 % 5 % 8 %
N = 9232 8010 462 760
1251
2198
1753
2808
N u m b e r o f f o u n d e d c a s e s
8/9/2019 BC Gro Op Satistics
http://slidepdf.com/reader/full/bc-gro-op-satistics 28/78
Marihuana Growing Operations in British Columbia
28
28
British Columbia 1997-2000
0
0.1
0.2
0.3
0.4
0.5
0.6
0.7
0.8
1997 1998 1999 2000
Table 2.13 shows the distribution of founded cases of marihuana growing operations for each of the four years across the various development regions and administrative districts of theprovince. All regions and most districts have experienced a steady year by year increase in the
number of founded cases of marihuana cultivation. Once more, three development regions showthe highest concentration of cases: Mainland/Southwest, Vancouver Island/Coast, andThompson/Okanagan. Together, these three regions account for 88% of all founded casesreported in the province in 2000. In fact, 59% of all founded cases in 2000 were in theMainland/Southwest region alone. The three regions with the largest increase of founded casesduring the four-year period were the Cariboo (an increase of 194%) and the Mainland/Southwestregion (181%). Some regional districts have experienced a much more rapid increase thanothers. This was the case, for instance, in the Greater Vancouver and Fraser Valley, SunshineCoast, Northern and Central Okanagan, Cariboo, and the Fraser/ Fort George districts.
Table 2.13: Number of Founded Cases of Marihuana Cultivation by Development RegionBritish Columbia 1997-2000
Development Region / RegionalDistrict
1997 1998 1999 2000Increase since
1997
Greater VancouverFraser ValleySquamish-Lillooet
47612413
670164
17
90022317
134328133
182 %127 %154 %
Mainland/Southwest Overall 613 851 1140 1657 172 %
NanaimoComox-StrathconaCapitalCowichan ValleySunshine CoastAlberni-ClayoquotPowell RiverMount Waddington
987390448
1406
11690728335181610
1171171189334191512
14614299652518199
49 %95 %10%
48 %213 %29 %
100 %50 %
Vancouver Is/ Coast Overall 333 440 525 523 57 %Thompson-NicolaCentral OkanaganNorthern OkanaganOkanagan-SimilkameenColumbia-Shuswap
4738272825
9256503725
8381474333
8183805536
72 %118 %196 %96 %44 %
Thompson/Okanagan Overall 165 260 287 335 103 %
R a t e p e r 1 , 0
0 0 p o p u l a t i o n
0.69
0.55
0.44
0.31
8/9/2019 BC Gro Op Satistics
http://slidepdf.com/reader/full/bc-gro-op-satistics 29/78
Marihuana Growing Operations in British Columbia
29
29
Fraser-Fort GeorgeCariboo
2323
2829
4326
6561
183 %165 %
Cariboo Overall 46 67 69 126 174 %
Central KootenayKootenay BoundaryEast Kootenay
321314
453820
763922
622129
94 %62 %
107 %
Kootenay Overall 59 103 137 112 90 %Kitimat-StikineSkeena-Qn. CharlotteCentral Coast
1071
1260
1250
2521
150 %- 71 %
-
North Coast Overall 18 18 17 28 56 %Bulkley-NechakoStikine (region)
130
71
82
190
46 %0 %
Nechako Overall 13 8 10 19 46 %
Peace RiverNorthern Rockies
40
51
112
71
75 %100 %
Northeast Overall 4 6 13 8 100 %
Province Overall 1251 1753 2198 2808 124 %
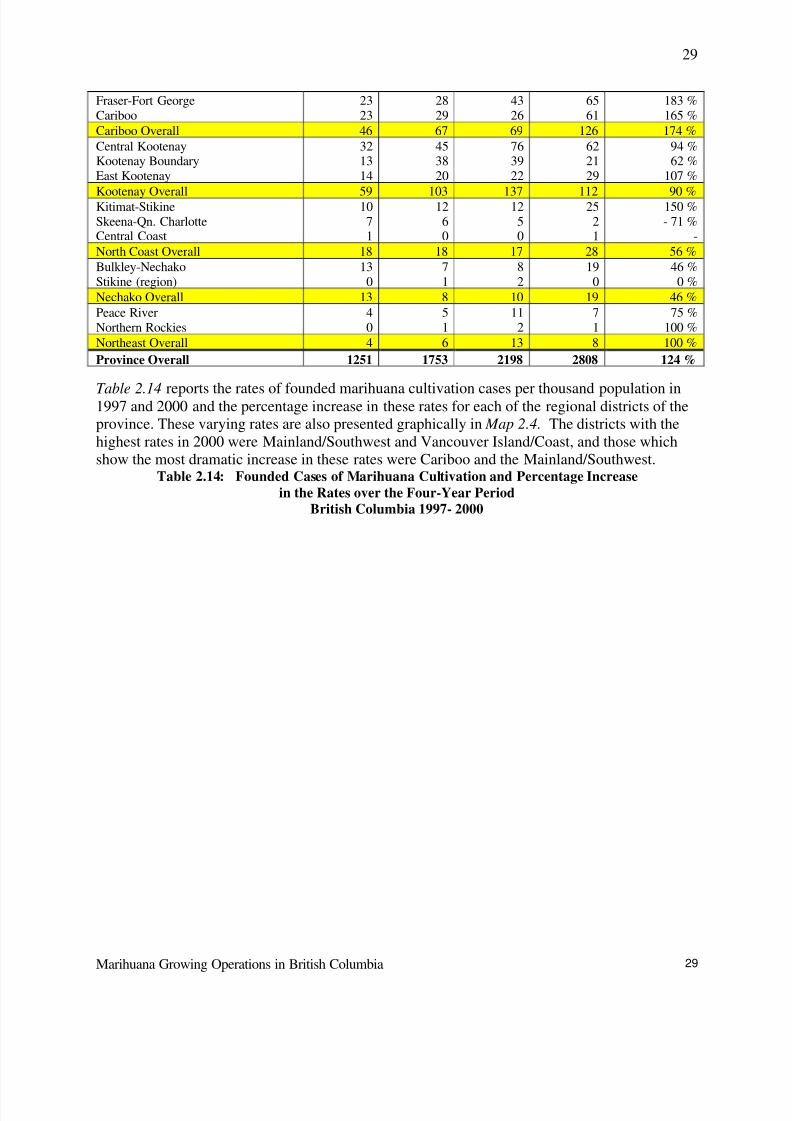
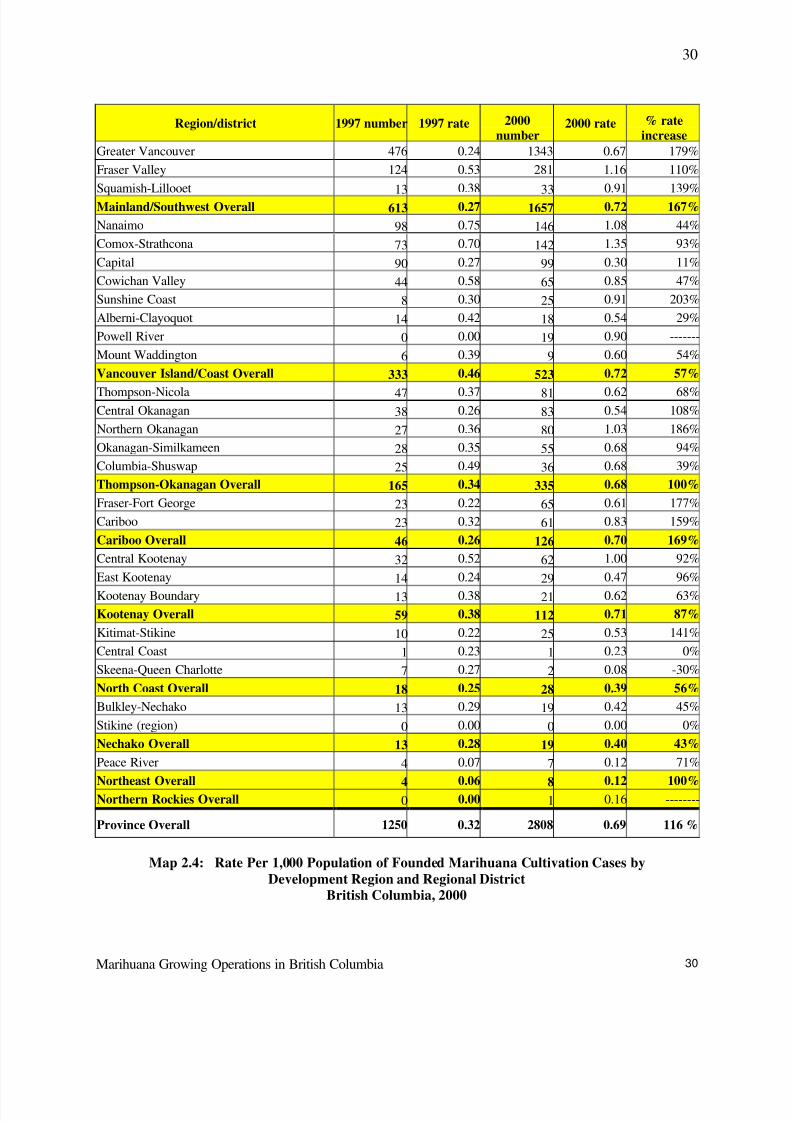
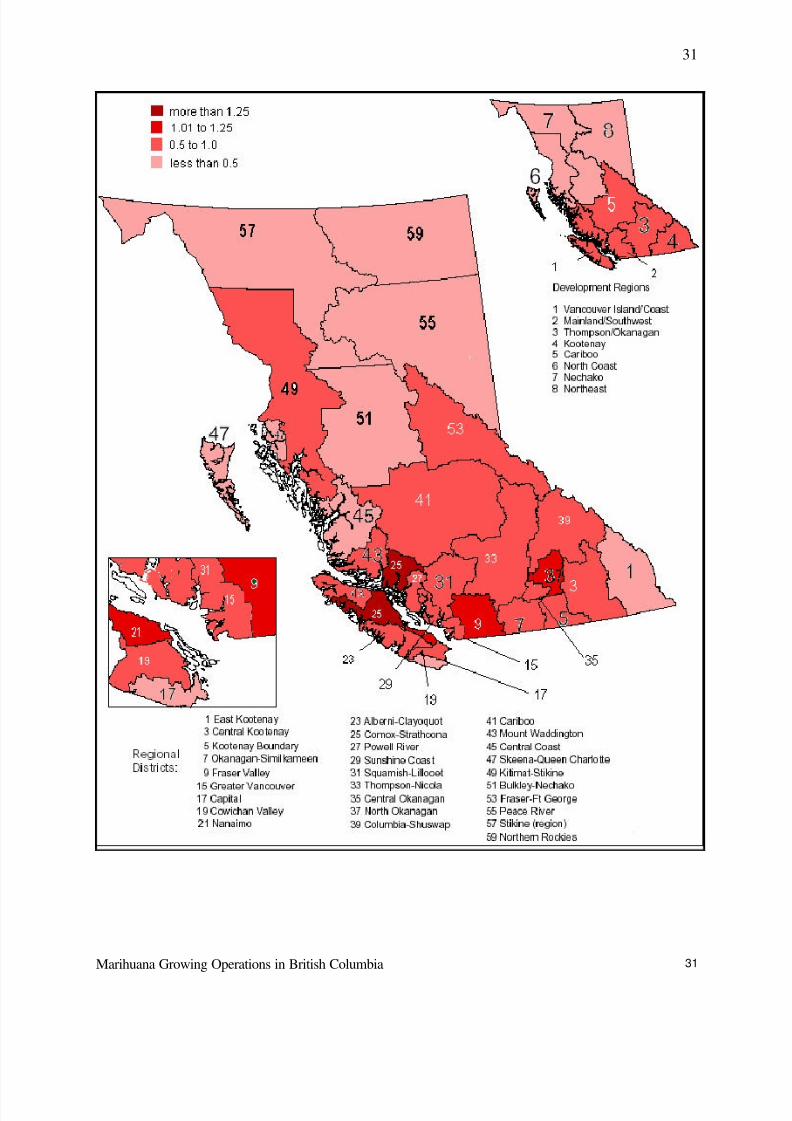
Table 2.14 reports the rates of founded marihuana cultivation cases per thousand population in1997 and 2000 and the percentage increase in these rates for each of the regional districts of theprovince. These varying rates are also presented graphically in Map 2.4. The districts with thehighest rates in 2000 were Mainland/Southwest and Vancouver Island/Coast, and those whichshow the most dramatic increase in these rates were Cariboo and the Mainland/Southwest.
Table 2.14: Founded Cases of Marihuana Cultivation and Percentage Increasein the Rates over the Four-Year Period
British Columbia 1997- 2000
8/9/2019 BC Gro Op Satistics
http://slidepdf.com/reader/full/bc-gro-op-satistics 30/78
Marihuana Growing Operations in British Columbia
30
30
Map 2.4: Rate Per 1,000 Population of Founded Marihuana Cultivation Cases byDevelopment Region and Regional District
British Columbia, 2000
Region/district 1997 number 1997 rate 2000number
2000 rate % rateincrease
Greater Vancouver 476 0.24 1343 0.67 179%
Fraser Valley 124 0.53 281 1.16 110%
Squamish-Lillooet13
0.3833
0.91 139%
Mainland/Southwest Overall 613 0.27 1657 0.72 167%
Nanaimo 98 0.75 146 1.08 44%
Comox-Strathcona 73 0.70 142 1.35 93%
Capital 90 0.27 99 0.30 11%
Cowichan Valley 44 0.58 65 0.85 47%
Sunshine Coast 8 0.30 25 0.91 203%
Alberni-Clayoquot 14 0.42 18 0.54 29%
Powell River 0 0.00 19 0.90 -------
Mount Waddington 6 0.39 9 0.60 54%
Vancouver Island/Coast Overall 333 0.46 523 0.72 57%
Thompson-Nicola 47 0.37 81 0.62 68%Central Okanagan 38 0.26 83 0.54 108%
Northern Okanagan 27 0.36 80 1.03 186%
Okanagan-Similkameen 28 0.35 55 0.68 94%
Columbia-Shuswap 25 0.49 36 0.68 39%
Thompson-Okanagan Overall 165 0.34 335 0.68 100%
Fraser-Fort George 23 0.22 65 0.61 177%
Cariboo 23 0.32 61 0.83 159%
Cariboo Overall 46 0.26 126 0.70 169%
Central Kootenay 32 0.52 62 1.00 92%
East Kootenay 14 0.24 29 0.47 96%
Kootenay Boundary 13 0.38 21 0.62 63%
Kootenay Overall 59 0.38 112 0.71 87%
Kitimat-Stikine 10 0.22 25 0.53 141%
Central Coast 1 0.23 1 0.23 0%
Skeena-Queen Charlotte 7 0.27 2 0.08 -30%
North Coast Overall 18 0.25 28 0.39 56%
Bulkley-Nechako 13 0.29 19 0.42 45%
Stikine (region) 0 0.00 0 0.00 0%
Nechako Overall 13 0.28 19 0.40 43%
Peace River 4 0.07 7 0.12 71%
Northeast Overall 4 0.06 8 0.12 100%Northern Rockies Overall 0 0.00 1 0.16 --------
Province Overall 1250 0.32 2808 0.69 116 %
8/9/2019 BC Gro Op Satistics
http://slidepdf.com/reader/full/bc-gro-op-satistics 31/78
Marihuana Growing Operations in British Columbia
31
31
8/9/2019 BC Gro Op Satistics
http://slidepdf.com/reader/full/bc-gro-op-satistics 32/78
Marihuana Growing Operations in British Columbia
32
32
Chapter 3
Description of Marihuana Growing OperationsDuring the period studied, more than 1.2 million marihuana plants were seized in British
Columbia, as well as 8,646 kilograms of harvested marihuana. The value of the seized marihuana
is conservatively estimated at three quarters of a billion dollars. The majority of the operations
were indoor operations, and predominantly in the Mainland/ South Coast region of the province.
The operations overall are becoming larger and more frequent every year everywhere in the
province. They are also becoming increasingly sophisticated, using better and more expensive
equipment and diverting electricity to avoid detection. Their presence in the community
represents additional risks for that community, including an increased risk of violence and fire.
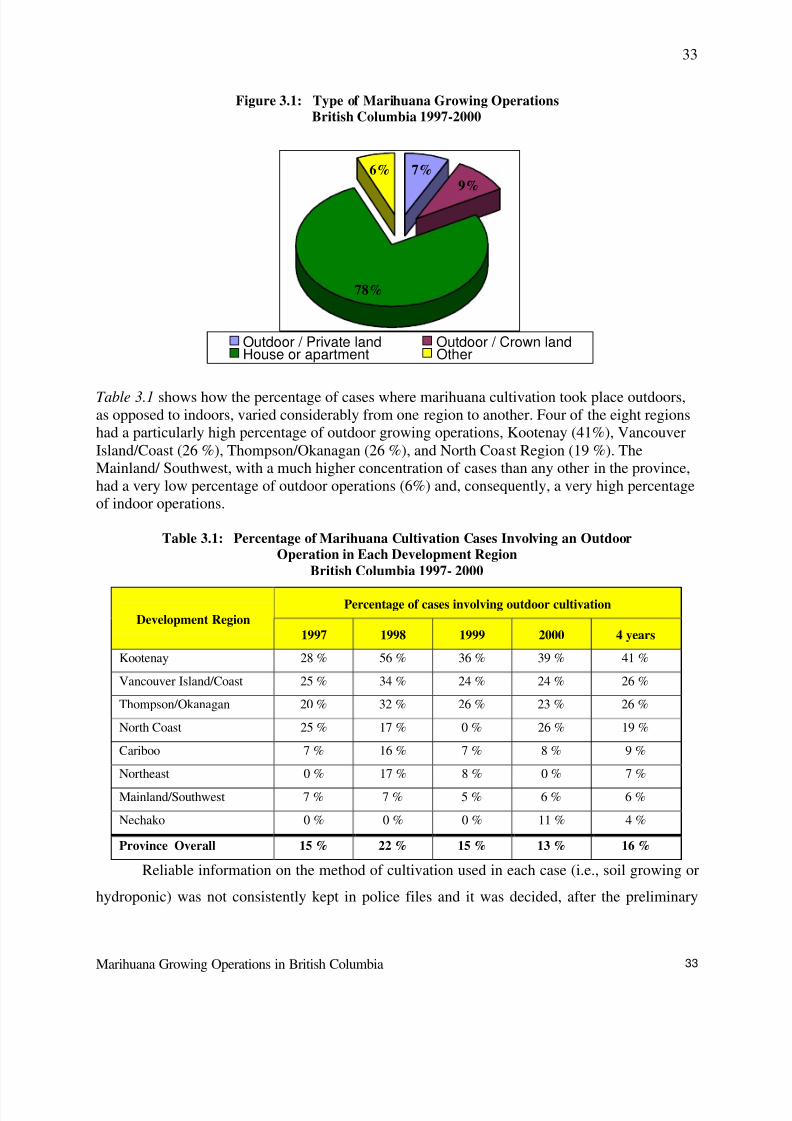
CHARACTERISTICS OF GROWING OPERATIONSAs mentioned earlier, there were 8,010 founded cases of marihuana cultivation in British
Columbia during the four-year period between January 1, 1997 and December 31, 2000. More
than 73% of these cases were indoor operations (see Figure 3.1); 69% were in a private houses,
4% in apartments or multiple unit residences, 2% were in commercial buildings, and 5% were in
detached buildings such as barns or sheds. Sixteen percent of all the operations were conducted
outdoors, either on private land (in 7% of the cases) or on Crown land (9%).
8/9/2019 BC Gro Op Satistics
http://slidepdf.com/reader/full/bc-gro-op-satistics 33/78
Marihuana Growing Operations in British Columbia
33
33
Figure 3.1: Type of Marihuana Growing OperationsBritish Columbia 1997-2000
7%9%
78%
6%
Outdoor / Private land Outdoor / Crown landHouse or apartment Other
Table 3.1 shows how the percentage of cases where marihuana cultivation took place outdoors,as opposed to indoors, varied considerably from one region to another. Four of the eight regionshad a particularly high percentage of outdoor growing operations, Kootenay (41%), VancouverIsland/Coast (26 %), Thompson/Okanagan (26 %), and North Coast Region (19 %). TheMainland/ Southwest, with a much higher concentration of cases than any other in the province,had a very low percentage of outdoor operations (6%) and, consequently, a very high percentageof indoor operations.
Table 3.1: Percentage of Marihuana Cultivation Cases Involving an OutdoorOperation in Each Development Region
British Columbia 1997- 2000
Reliable information on the method of cultivation used in each case (i.e., soil growing or
hydroponic) was not consistently kept in police files and it was decided, after the preliminary
Percentage of cases involving outdoor cultivationDevelopment Region
1997 1998 1999 2000 4 years
Kootenay 28 % 56 % 36 % 39 % 41 %
Vancouver Island/Coast 25 % 34 % 24 % 24 % 26 %
Thompson/Okanagan 20 % 32 % 26 % 23 % 26 %
North Coast 25 % 17 % 0 % 26 % 19 %
Cariboo 7 % 16 % 7 % 8 % 9 %
Northeast 0 % 17 % 8 % 0 % 7 %
Mainland/Southwest 7 % 7 % 5 % 6 % 6 %
Nechako 0 % 0 % 0 % 11 % 4 %
Province Overall 15 % 22 % 15 % 13 % 16 %

8/9/2019 BC Gro Op Satistics
http://slidepdf.com/reader/full/bc-gro-op-satistics 34/78
Marihuana Growing Operations in British Columbia
34
34
study, that such information could not be systematically collected. It was nevertheless evident
that hydroponic cultivation operations were not as frequent as it is often assumed. The great
majority of operations used the soil-based method.
THE SIZE OF OPERATIONSMarihuana was seized in two forms: in plant form (in which case the number of plants wascounted) and in the form of harvested marihuana (in which case, the quantity of marihuanaseized was measured in kilograms). The total number of marihuana plants seized in BritishColumbia during the four-year period was 1,223,521; in addition, a total of 8,646 kilograms of harvested marihuana was seized. In a small percentage of cases (3.3%), the search also revealedthe presence of other illicit drugs, which were usually present only in small quantities.As depicted in Figure 3.2, the total number of plants seized in the province increased each year.In 2000, the total reached 459,884 plants, representing an increase of 173% over the number of plants seized in 1997 (see Table 3.2).
Figure 3.2: Number of Marihuana Plants SeizedBritish Columbia 1997-2000
0
50000
100000
150000
200000
250000
300000
350000
400000
450000
500000
1997 1998 1999 2000
In cases where plants were seized, the number in each case varied between 1 and 7,281plants. Over the four-year period, the average number of plants seized per operation was 166plants. The average seizure size increased from an average of 141 in 1997, to an average of 180plants in 2000.
As shown in Table 3.2, the average number of plants involved (when plants were seized)was substantially higher for indoor operations than outdoor ones. It is also evident that the
average size of both indoor and outdoor growing operations increased between 1997 and2000. The average size of growing operations, as judged by the number of plants seized, hasincreased by 18% during the period under review. The average size of an indoor growingoperation, judged by the same criterion, has increased by 29%, while the average size of outdoor grows has increased by 76%.
Table 3.2: Number of Marihuana Plants Seized and in Parentheses Average Number of Plants Involved When Plants Were Seized by Type of Operation
British Columbia 1997-2000
N u m
b e r o f p l a n t s s e i z e d
168468
375650
229777
459884
8/9/2019 BC Gro Op Satistics
http://slidepdf.com/reader/full/bc-gro-op-satistics 35/78
Marihuana Growing Operations in British Columbia
35
35
* All figures rounded.
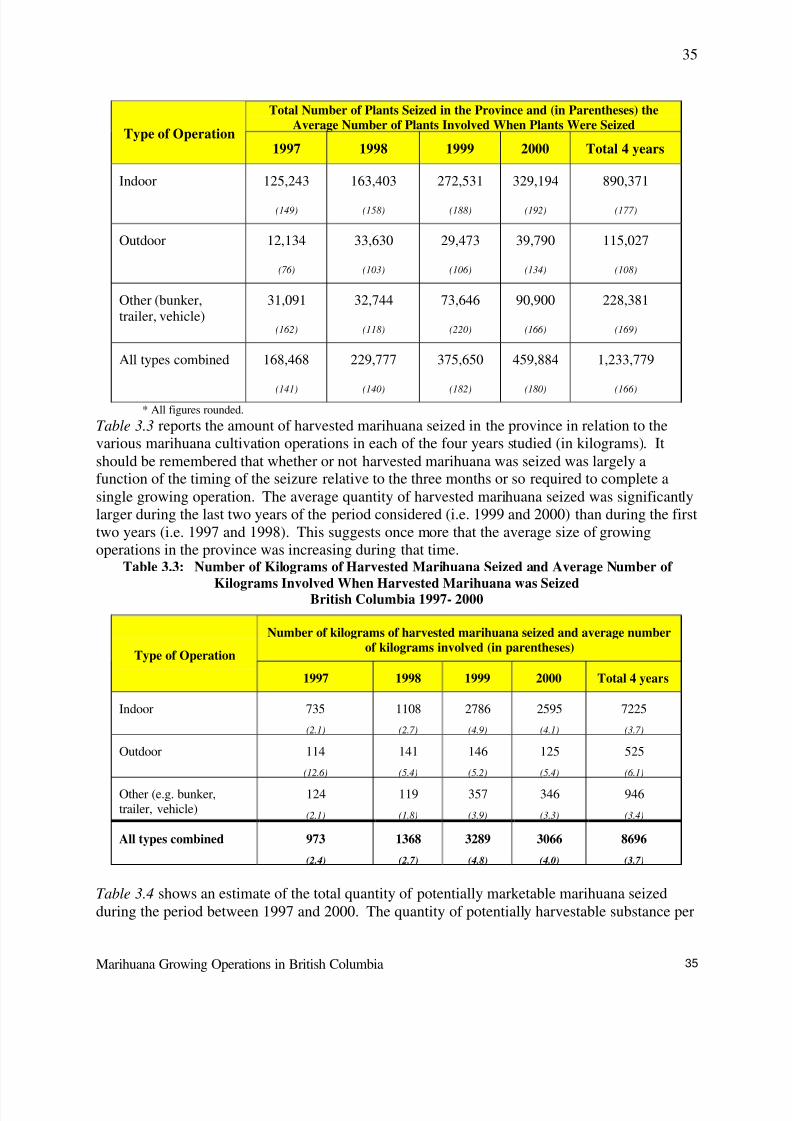
Table 3.3 reports the amount of harvested marihuana seized in the province in relation to thevarious marihuana cultivation operations in each of the four years studied (in kilograms). Itshould be remembered that whether or not harvested marihuana was seized was largely afunction of the timing of the seizure relative to the three months or so required to complete asingle growing operation. The average quantity of harvested marihuana seized was significantlylarger during the last two years of the period considered (i.e. 1999 and 2000) than during the firsttwo years (i.e. 1997 and 1998). This suggests once more that the average size of growingoperations in the province was increasing during that time.
Table 3.3: Number of Kilograms of Harvested Marihuana Seized and Average Number of
Kilograms Involved When Harvested Marihuana was SeizedBritish Columbia 1997- 2000
Table 3.4 shows an estimate of the total quantity of potentially marketable marihuana seizedduring the period between 1997 and 2000. The quantity of potentially harvestable substance per
Total Number of Plants Seized in the Province and (in Parentheses) theAverage Number of Plants Involved When Plants Were Seized
Type of Operation1997 1998 1999 2000 Total 4 years
Indoor 125,243
(149)
163,403
(158)
272,531
(188)
329,194
(192)
890,371
(177)
Outdoor 12,134
(76)
33,630
(103)
29,473
(106)
39,790
(134)
115,027
(108)
Other (bunker,trailer, vehicle)
31,091
(162)
32,744
(118)
73,646
(220)
90,900
(166)
228,381
(169)
All types combined 168,468
(141)
229,777
(140)
375,650
(182)
459,884
(180)
1,233,779
(166)
Number of kilograms of harvested marihuana seized and average numberof kilograms involved (in parentheses)
Type of Operation
1997 1998 1999 2000 Total 4 years
Indoor 735
(2.1)
1108
(2.7)
2786
(4.9)
2595
(4.1)
7225
(3.7)
Outdoor 114
(12.6)
141
(5.4)
146
(5.2)
125
(5.4)
525
(6.1)
Other (e.g. bunker,trailer, vehicle)
124
(2.1)
119
(1.8)
357
(3.9)
346
(3.3)
946
(3.4)
All types combined 973
(2.4)
1368
(2.7)
3289
(4.8)
3066
(4.0)
8696
(3.7)
8/9/2019 BC Gro Op Satistics
http://slidepdf.com/reader/full/bc-gro-op-satistics 36/78
8/9/2019 BC Gro Op Satistics
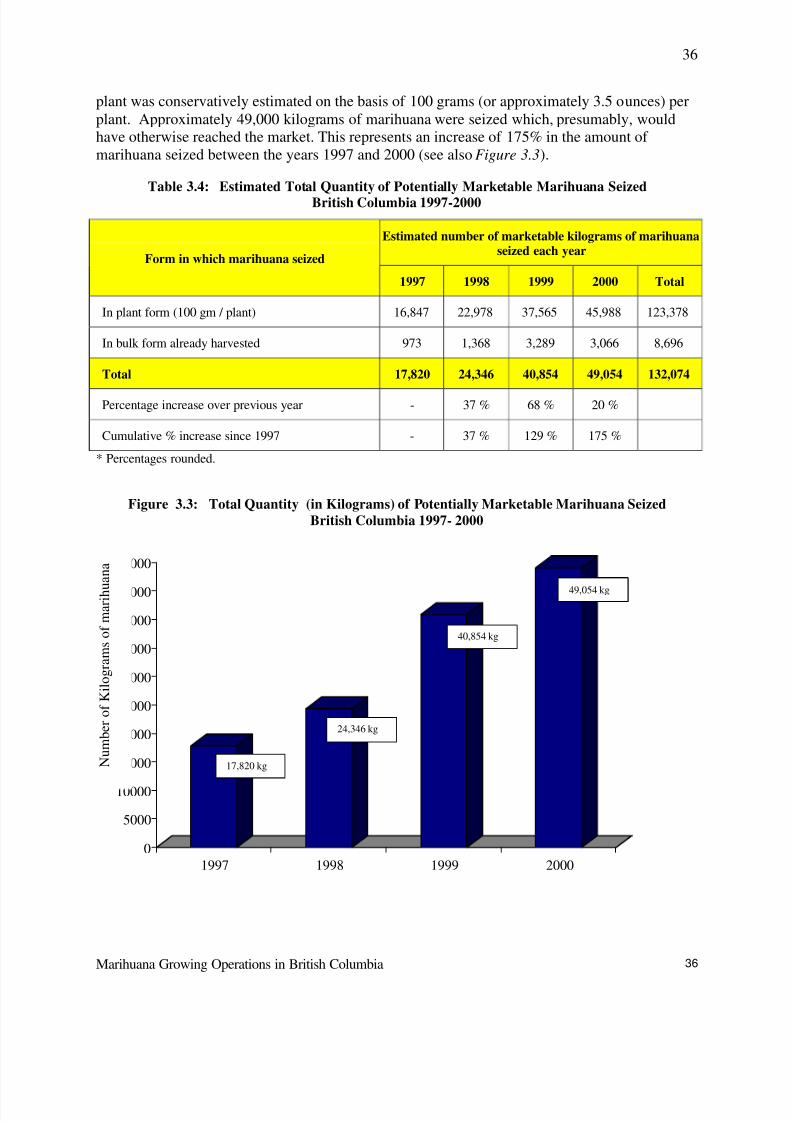
http://slidepdf.com/reader/full/bc-gro-op-satistics 37/78
Marihuana Growing Operations in British Columbia
37
37
VALUE OF MARIHUANA SEIZEDThere are obviously different ways of estimating the dollar value of the confiscated marihuana.Not all marihuana is of the same quality. Its market value varies depending on a number of factors, such as its quality, the time of the year, where it is being sold, and the quantity in whichit is being sold (wholesale/retail). There are different views on what the average market value of confiscated marihuana is and on how to estimate it. Some varieties of marihuana plants have agreater yield than others. Furthermore, not all confiscated plants have reached maturity or canproduce a yield. To arrive at the estimate of the total potentially marketable amount of marihuana seized (see Table 3.4 above), it was assumed that marihuana plants could produce aharvest of approximately 100 grams (or around 3.5 ounces) per plant. Current estimates of theaverage wholesale market value of a kilogram of dry local marihuana in British Columbia, soldin large quantities of a kilogram or more, vary from $3,500 to $7,500 per kilogram. Estimates of the retail value of a kilogram of dry local marihuana in British Columbia, sold by the pound orby the ounce, vary between $3,500 and $9,000 per kilogram. One can reasonably assume thatthe average market price in British Columbia during the periodconsidered was probably somewhere between $5,000 and $7,000 per kilogram.Based on the above assumptions, the total estimated value of the marihuana seized in BritishColumbia during the year 2000 could be as little as $172 million and as much as $466 million(see estimate in Table 3.5), although it was more likely worth somewhere between $250 and$350 million. During the same year, the average value of the marihuana seized per case isestimated between $100,000 and $130,000. In turn, the total estimated value of the marihuanaseized in the province between January 1, 1997 and December 31, 2000 could be as little as $462million or as much as $1.25 billion (again see estimate in Table 3.5). Its overall market valuewas more realistically estimated at three quarters of a billion dollars.
Table 3.5: Estimates of the Total Value of Potentially Marketable Marihuana SeizedBritish Columbia 1997-2000
Kilograms of marihuana seized
1997 1998 1999 2000 Total
In plant form 16847 22978 37565 45988 123378
Already harvested 973 1368 3289 3066 8696
Total in kg 17820 24346 40854 49054 132074
Cost at $3500/kg $ 62,369,300 $ 85,209,950 $ 142,989,000 $171,690,400 $ 462,258,650
Cost at $5000/kg $ 89,099,000 $ 121,728,500 $ 204,270,000 $ 245,272,000 $ 660,369,500
Cost at $6500/kg $ 115,828,700 $ 158,247,050 $ 265,551,000 $ 318,853,600 $ 858,480,350
Cost at $8000/kg $ 142,558,400 $ 194,765,600 $ 326,832,000 $ 392,435,200 $ 1,056,591,200
Cost at $9500/kg $ 169,288,100 $ 231,284,150 $ 388,113,000 $ 466,016,800 $ 1,254,702,050
8/9/2019 BC Gro Op Satistics
http://slidepdf.com/reader/full/bc-gro-op-satistics 38/78
Marihuana Growing Operations in British Columbia
38
38
GROWING SOPHISTICATION OF OPERATIONSIt was easily ascertainable from the police files reviewed that marihuana growing
operations were becoming not only more frequent and larger than in the past, but also in many
ways more sophisticated and better organized. Special timers and automatic watering and plant
feeding systems were being used more frequently, particularly in the Vancouver and Lower
Mainland area. Special equipment to accelerate plant growth, including special electrical ballasts
and 1,000W or 400W lights, was more commonly being used. The special equipment needed
would appear to be easily accessible in B.C. (see Box 3.1).
Box 3.1Hydroponic Cultivation Equipment Outlets in British Columbia,
Alberta and the State of Washington6
(By: Susan Kirkpatrick, Derek Hansom, Darryl Plecas, and Yvon Dandurand)
A study of the distribution and increase in the number of hydroponic cultivation equipment outlets inBritish Columbia, Alberta, and the State of Washington, was recently conducted. Data was collected on the numberof listings for such outlets in the Yellow Pages. The study revealed that there is a thriving market for hydroponiccultivation equipment in British Columbia which is without a direct parallel in the neighbouring Province of Albertaand State of Washington. The number of hydroponic equipment outlets in British Columbia has growndisproportionately to its population. The figure below shows how, by the year 2000, the rate of hydroponicequipment outlets per hundred thousand population in British Columbia was five times that of Alberta and ten timesthat of the State of Washington.
6 Kirkpatrick, S., Hansom, D., Plecas, D., and Dandurand, Y., (2002). Hydroponic Cultivation Equipment Outlets in
British Columbia, Alberta and the State of Washington. Vancouver/Abbotsford: International Centre for CriminalLaw Reform and Criminal Justice Policy and the Department of Criminology and Criminal Justice, UniversityCollege of the Fraser Valley, January 2002.
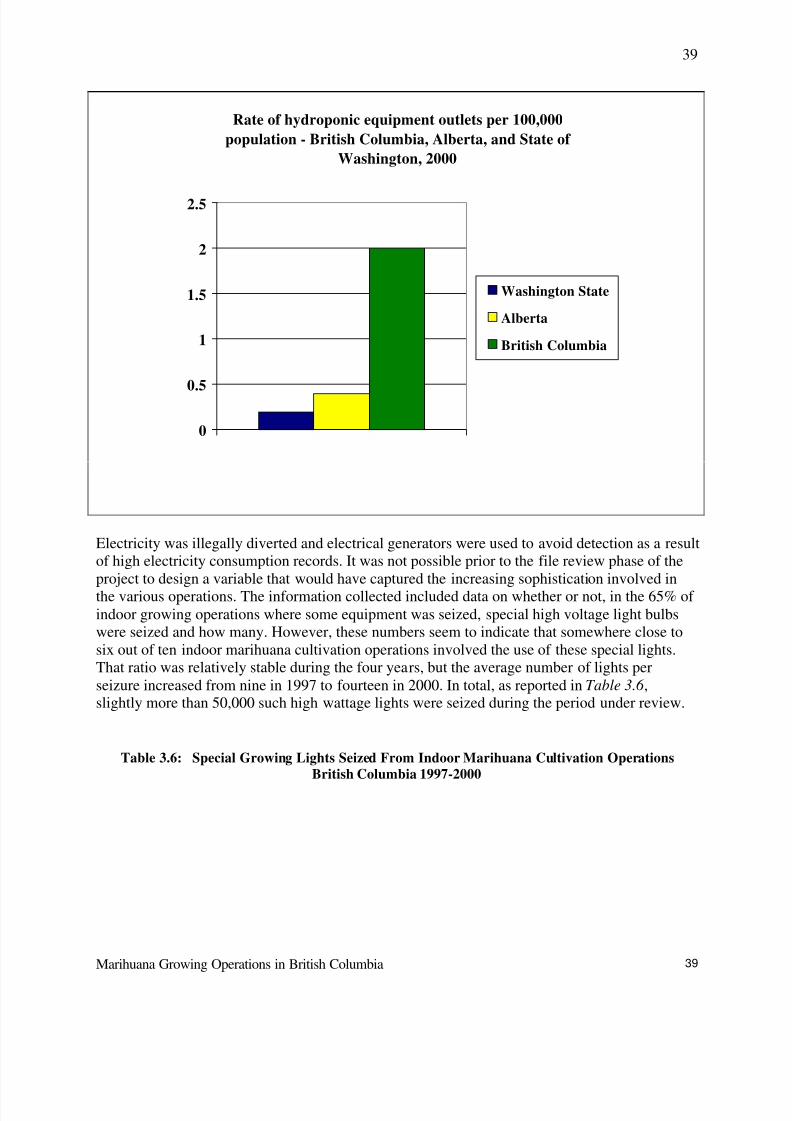
8/9/2019 BC Gro Op Satistics
http://slidepdf.com/reader/full/bc-gro-op-satistics 39/78
Marihuana Growing Operations in British Columbia
39
39
Rate of hydroponic equipment outlets per 100,000
population - British Columbia, Alberta, and State of
Washington, 2000
0
0.5
1
1.5
2
2.5
Washington State
Alberta
British Columbia
Electricity was illegally diverted and electrical generators were used to avoid detection as a resultof high electricity consumption records. It was not possible prior to the file review phase of theproject to design a variable that would have captured the increasing sophistication involved inthe various operations. The information collected included data on whether or not, in the 65% of indoor growing operations where some equipment was seized, special high voltage light bulbswere seized and how many. However, these numbers seem to indicate that somewhere close tosix out of ten indoor marihuana cultivation operations involved the use of these special lights.That ratio was relatively stable during the four years, but the average number of lights perseizure increased from nine in 1997 to fourteen in 2000. In total, as reported in Table 3.6 ,slightly more than 50,000 such high wattage lights were seized during the period under review.
Table 3.6: Special Growing Lights Seized From Indoor Marihuana Cultivation OperationsBritish Columbia 1997-2000
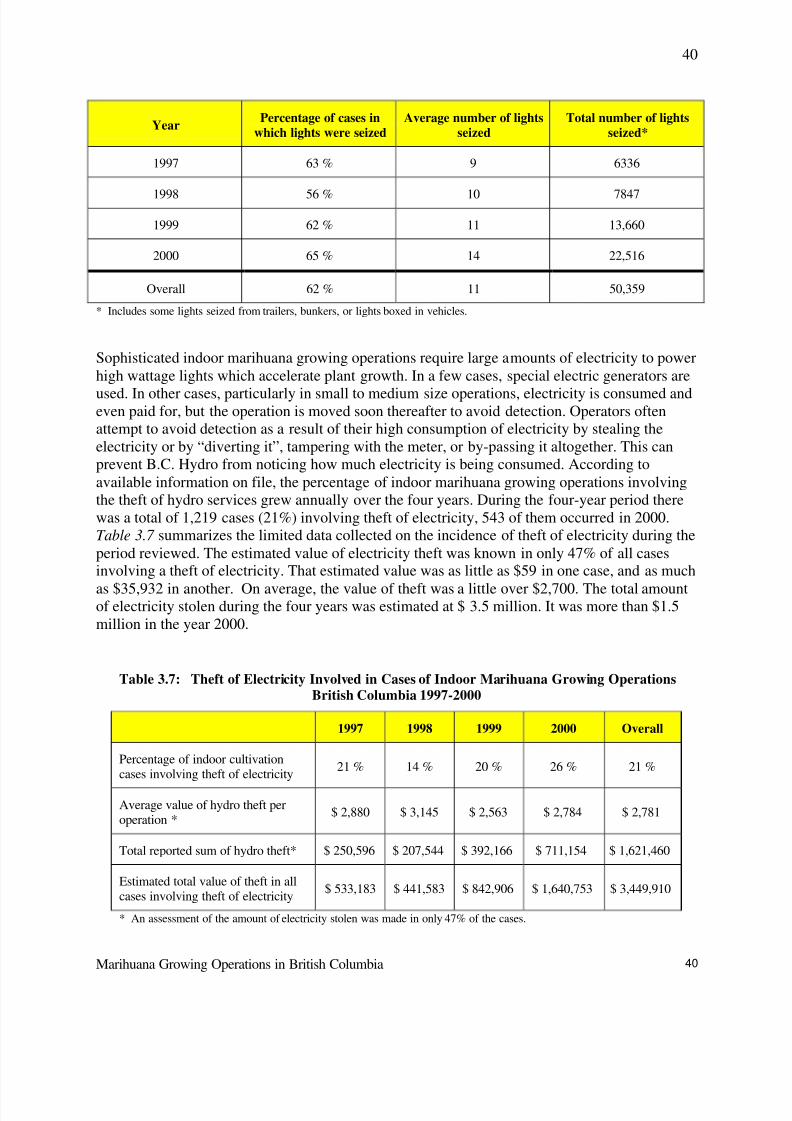
8/9/2019 BC Gro Op Satistics
http://slidepdf.com/reader/full/bc-gro-op-satistics 40/78
Marihuana Growing Operations in British Columbia
40
40
* Includes some lights seized from trailers, bunkers, or lights boxed in vehicles.
Sophisticated indoor marihuana growing operations require large amounts of electricity to powerhigh wattage lights which accelerate plant growth. In a few cases, special electric generators are
used. In other cases, particularly in small to medium size operations, electricity is consumed andeven paid for, but the operation is moved soon thereafter to avoid detection. Operators oftenattempt to avoid detection as a result of their high consumption of electricity by stealing theelectricity or by “diverting it”, tampering with the meter, or by-passing it altogether. This canprevent B.C. Hydro from noticing how much electricity is being consumed. According toavailable information on file, the percentage of indoor marihuana growing operations involvingthe theft of hydro services grew annually over the four years. During the four-year period therewas a total of 1,219 cases (21%) involving theft of electricity, 543 of them occurred in 2000.Table 3.7 summarizes the limited data collected on the incidence of theft of electricity during theperiod reviewed. The estimated value of electricity theft was known in only 47% of all casesinvolving a theft of electricity. That estimated value was as little as $59 in one case, and as much
as $35,932 in another. On average, the value of theft was a little over $2,700. The total amountof electricity stolen during the four years was estimated at $ 3.5 million. It was more than $1.5million in the year 2000.
Table 3.7: Theft of Electricity Involved in Cases of Indoor Marihuana Growing OperationsBritish Columbia 1997-2000
* An assessment of the amount of electricity stolen was made in only 47% of the cases.
YearPercentage of cases in
which lights were seizedAverage number of lights
seizedTotal number of lights
seized*
1997 63 % 9 6336
1998 56 % 10 7847
1999 62 % 11 13,660
2000 65 % 14 22,516
Overall 62 % 11 50,359
1997 1998 1999 2000 Overall
Percentage of indoor cultivationcases involving theft of electricity
21 % 14 % 20 % 26 % 21 %
Average value of hydro theft peroperation *
$ 2,880 $ 3,145 $ 2,563 $ 2,784 $ 2,781
Total reported sum of hydro theft* $ 250,596 $ 207,544 $ 392,166 $ 711,154 $ 1,621,460
Estimated total value of theft in allcases involving theft of electricity
$ 533,183 $ 441,583 $ 842,906 $ 1,640,753 $ 3,449,910
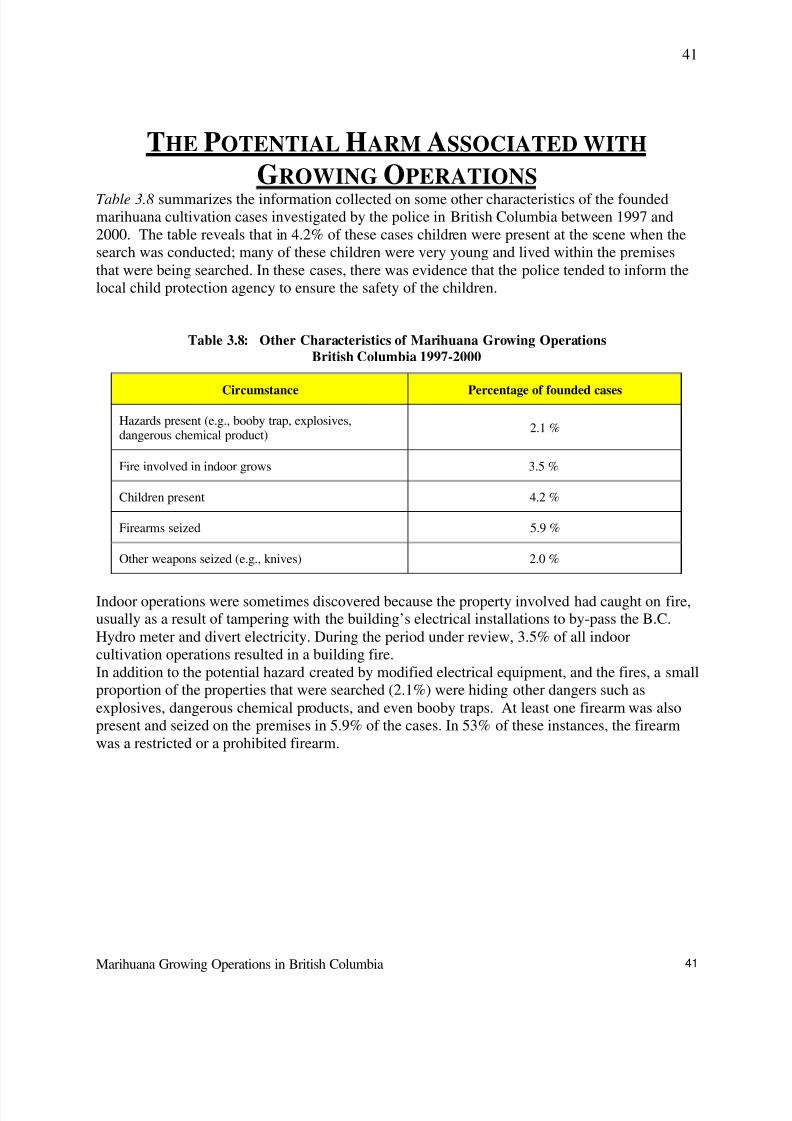
8/9/2019 BC Gro Op Satistics
http://slidepdf.com/reader/full/bc-gro-op-satistics 41/78
Marihuana Growing Operations in British Columbia
41
41
THE POTENTIAL HARM ASSOCIATED WITH
GROWING OPERATIONSTable 3.8 summarizes the information collected on some other characteristics of the foundedmarihuana cultivation cases investigated by the police in British Columbia between 1997 and2000. The table reveals that in 4.2% of these cases children were present at the scene when thesearch was conducted; many of these children were very young and lived within the premisesthat were being searched. In these cases, there was evidence that the police tended to inform thelocal child protection agency to ensure the safety of the children.
Table 3.8: Other Characteristics of Marihuana Growing OperationsBritish Columbia 1997-2000
Indoor operations were sometimes discovered because the property involved had caught on fire,usually as a result of tampering with the building’s electrical installations to by-pass the B.C.Hydro meter and divert electricity. During the period under review, 3.5% of all indoorcultivation operations resulted in a building fire.In addition to the potential hazard created by modified electrical equipment, and the fires, a smallproportion of the properties that were searched (2.1%) were hiding other dangers such asexplosives, dangerous chemical products, and even booby traps. At least one firearm was alsopresent and seized on the premises in 5.9% of the cases. In 53% of these instances, the firearmwas a restricted or a prohibited firearm.
Circumstance Percentage of founded cases
Hazards present (e.g., booby trap, explosives,dangerous chemical product)
2.1 %
Fire involved in indoor grows 3.5 %
Children present 4.2 %
Firearms seized 5.9 %
Other weapons seized (e.g., knives) 2.0 %
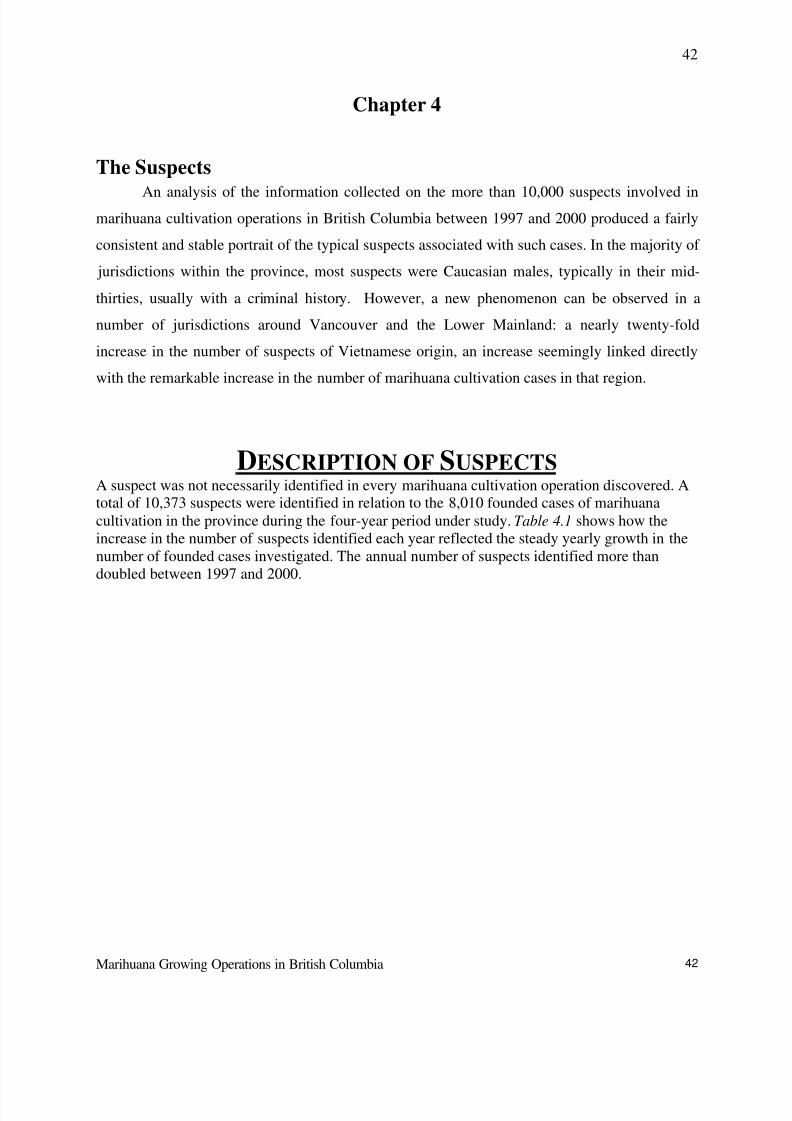
8/9/2019 BC Gro Op Satistics
http://slidepdf.com/reader/full/bc-gro-op-satistics 42/78
Marihuana Growing Operations in British Columbia
42
42
Chapter 4
The Suspects
An analysis of the information collected on the more than 10,000 suspects involved inmarihuana cultivation operations in British Columbia between 1997 and 2000 produced a fairly
consistent and stable portrait of the typical suspects associated with such cases. In the majority of
jurisdictions within the province, most suspects were Caucasian males, typically in their mid-
thirties, usually with a criminal history. However, a new phenomenon can be observed in a
number of jurisdictions around Vancouver and the Lower Mainland: a nearly twenty-fold
increase in the number of suspects of Vietnamese origin, an increase seemingly linked directly
with the remarkable increase in the number of marihuana cultivation cases in that region.
DESCRIPTION OF SUSPECTSA suspect was not necessarily identified in every marihuana cultivation operation discovered. Atotal of 10,373 suspects were identified in relation to the 8,010 founded cases of marihuanacultivation in the province during the four-year period under study. Table 4.1 shows how theincrease in the number of suspects identified each year reflected the steady yearly growth in thenumber of founded cases investigated. The annual number of suspects identified more thandoubled between 1997 and 2000.
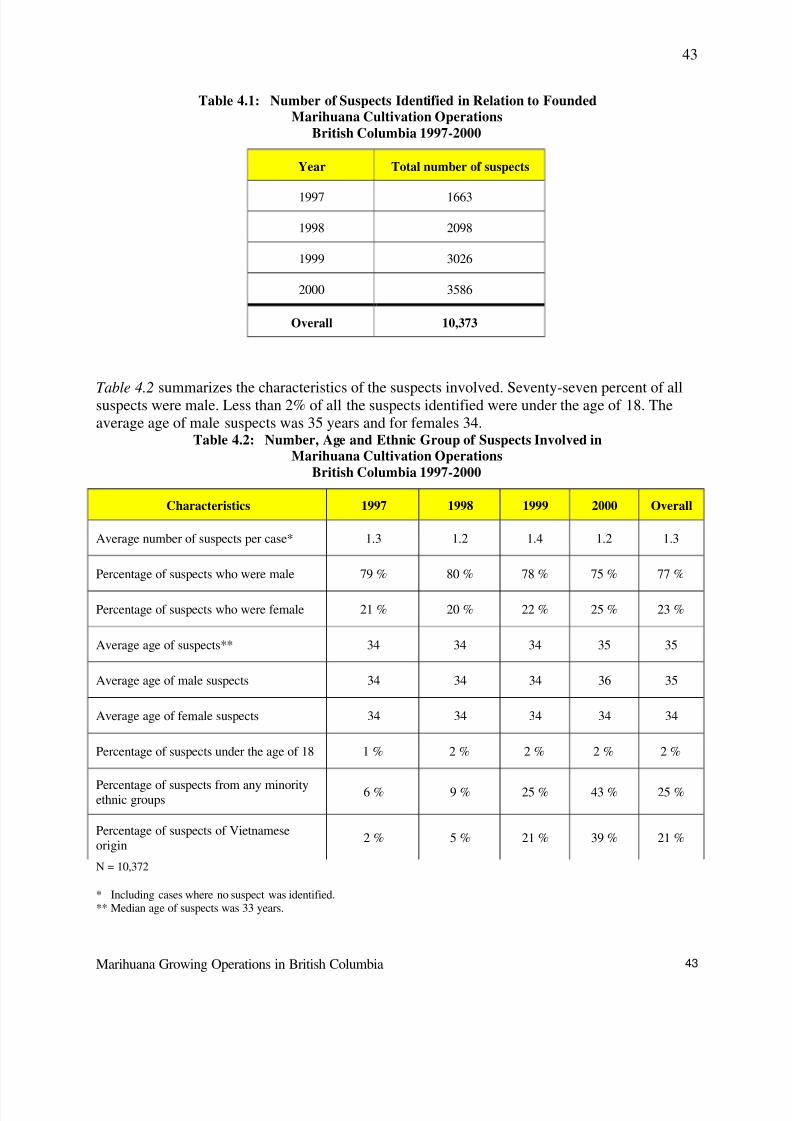
8/9/2019 BC Gro Op Satistics
http://slidepdf.com/reader/full/bc-gro-op-satistics 43/78
Marihuana Growing Operations in British Columbia
43
43
Table 4.1: Number of Suspects Identified in Relation to FoundedMarihuana Cultivation Operations
British Columbia 1997-2000
Table 4.2 summarizes the characteristics of the suspects involved. Seventy-seven percent of allsuspects were male. Less than 2% of all the suspects identified were under the age of 18. Theaverage age of male suspects was 35 years and for females 34.
Table 4.2: Number, Age and Ethnic Group of Suspects Involved inMarihuana Cultivation Operations
British Columbia 1997-2000
N = 10,372
* Including cases where no suspect was identified.** Median age of suspects was 33 years.
Year Total number of suspects
1997 1663
1998 2098
1999 3026
2000 3586
Overall 10,373
Characteristics 1997 1998 1999 2000 Overall
Average number of suspects per case* 1.3 1.2 1.4 1.2 1.3
Percentage of suspects who were male 79 % 80 % 78 % 75 % 77 %
Percentage of suspects who were female 21 % 20 % 22 % 25 % 23 %
Average age of suspects** 34 34 34 35 35
Average age of male suspects 34 34 34 36 35
Average age of female suspects 34 34 34 34 34
Percentage of suspects under the age of 18 1 % 2 % 2 % 2 % 2 %
Percentage of suspects from any minorityethnic groups
6 % 9 % 25 % 43 % 25 %
Percentage of suspects of Vietnameseorigin
2 % 5 % 21 % 39 % 21 %
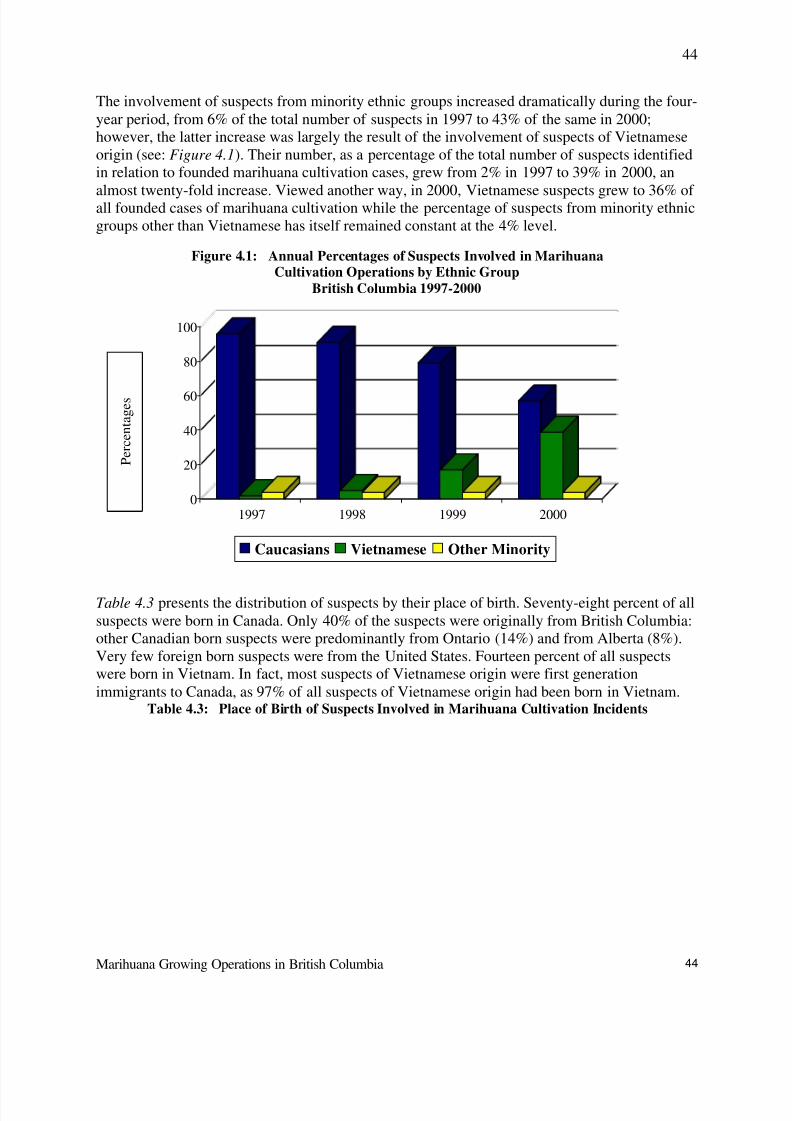
8/9/2019 BC Gro Op Satistics
http://slidepdf.com/reader/full/bc-gro-op-satistics 44/78
Marihuana Growing Operations in British Columbia
44
44
The involvement of suspects from minority ethnic groups increased dramatically during the four-year period, from 6% of the total number of suspects in 1997 to 43% of the same in 2000;however, the latter increase was largely the result of the involvement of suspects of Vietnameseorigin (see: Figure 4.1). Their number, as a percentage of the total number of suspects identifiedin relation to founded marihuana cultivation cases, grew from 2% in 1997 to 39% in 2000, an
almost twenty-fold increase. Viewed another way, in 2000, Vietnamese suspects grew to 36% of all founded cases of marihuana cultivation while the percentage of suspects from minority ethnicgroups other than Vietnamese has itself remained constant at the 4% level.
Figure 4.1: Annual Percentages of Suspects Involved in MarihuanaCultivation Operations by Ethnic Group
British Columbia 1997-2000
0
20
40
60
80
100
1997 1998 1999 2000
Caucasians Vietnamese Other Minority
Table 4.3 presents the distribution of suspects by their place of birth. Seventy-eight percent of allsuspects were born in Canada. Only 40% of the suspects were originally from British Columbia:other Canadian born suspects were predominantly from Ontario (14%) and from Alberta (8%).Very few foreign born suspects were from the United States. Fourteen percent of all suspectswere born in Vietnam. In fact, most suspects of Vietnamese origin were first generationimmigrants to Canada, as 97% of all suspects of Vietnamese origin had been born in Vietnam.
Table 4.3: Place of Birth of Suspects Involved in Marihuana Cultivation Incidents
P e r c e n t a g e s
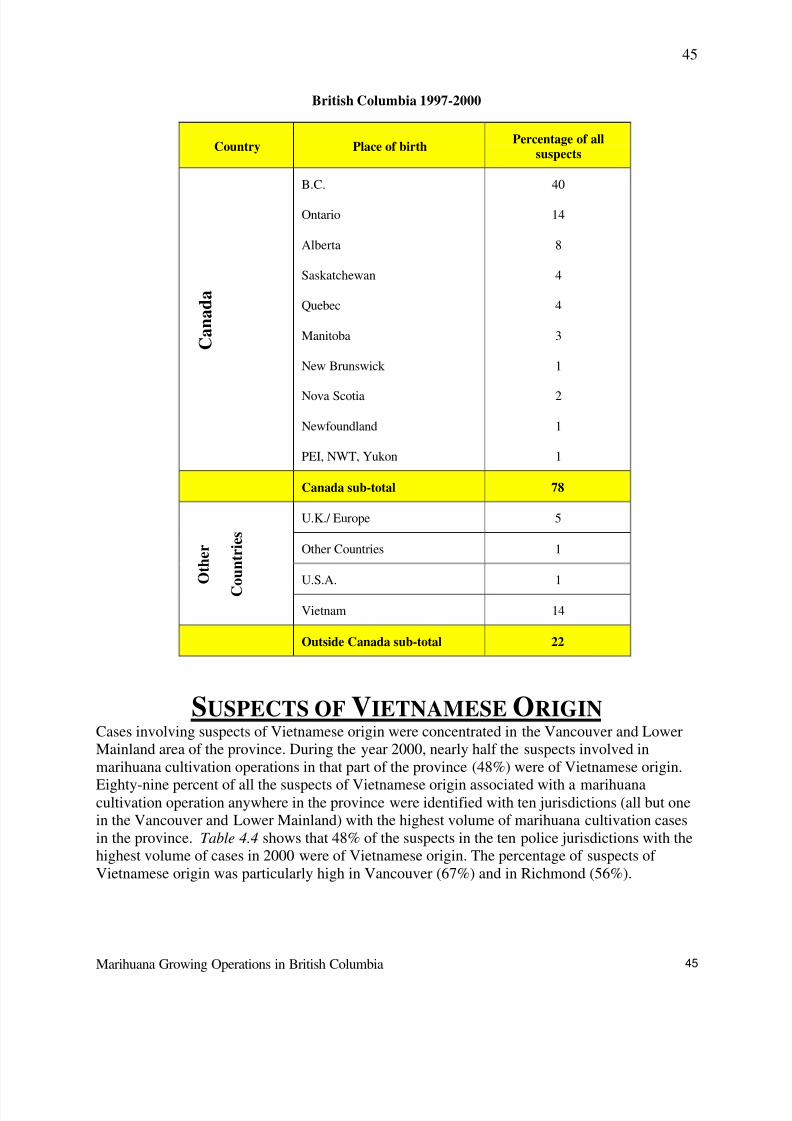
8/9/2019 BC Gro Op Satistics
http://slidepdf.com/reader/full/bc-gro-op-satistics 45/78
Marihuana Growing Operations in British Columbia
45
45
British Columbia 1997-2000
SUSPECTS OF VIETNAMESE ORIGINCases involving suspects of Vietnamese origin were concentrated in the Vancouver and LowerMainland area of the province. During the year 2000, nearly half the suspects involved inmarihuana cultivation operations in that part of the province (48%) were of Vietnamese origin.
Eighty-nine percent of all the suspects of Vietnamese origin associated with a marihuanacultivation operation anywhere in the province were identified with ten jurisdictions (all but onein the Vancouver and Lower Mainland) with the highest volume of marihuana cultivation casesin the province. Table 4.4 shows that 48% of the suspects in the ten police jurisdictions with thehighest volume of cases in 2000 were of Vietnamese origin. The percentage of suspects of Vietnamese origin was particularly high in Vancouver (67%) and in Richmond (56%).
Country Place of birthPercentage of all
suspects
C a n a d a
B.C.
Ontario
Alberta
Saskatchewan
Quebec
Manitoba
New Brunswick
Nova Scotia
Newfoundland
PEI, NWT, Yukon
40
14
8
4
4
3
1
2
1
1
Canada sub-total 78
U.K./ Europe 5
Other Countries 1
U.S.A. 1 O t h e r
C
o u n t r i e s
Vietnam 14
Outside Canada sub-total 22
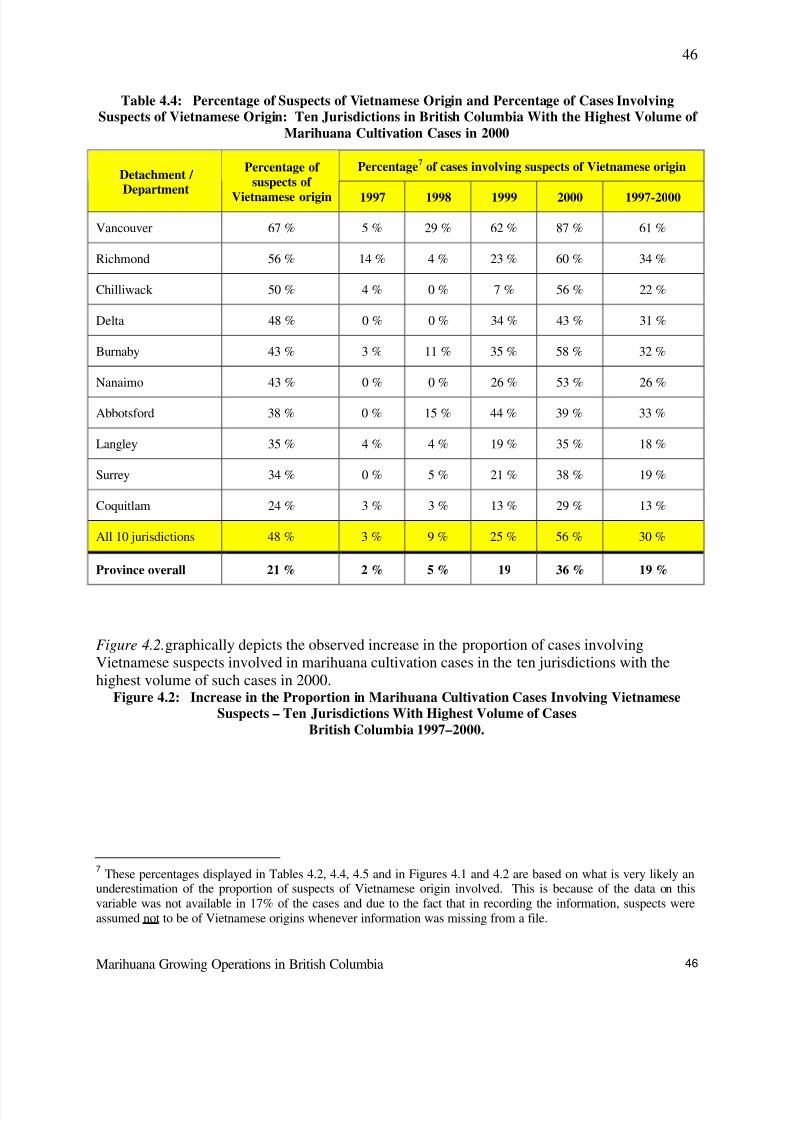
8/9/2019 BC Gro Op Satistics
http://slidepdf.com/reader/full/bc-gro-op-satistics 46/78
Marihuana Growing Operations in British Columbia
46
46
Table 4.4: Percentage of Suspects of Vietnamese Origin and Percentage of Cases InvolvingSuspects of Vietnamese Origin: Ten Jurisdictions in British Columbia With the Highest Volume of
Marihuana Cultivation Cases in 2000
Figure 4.2.graphically depicts the observed increase in the proportion of cases involvingVietnamese suspects involved in marihuana cultivation cases in the ten jurisdictions with thehighest volume of such cases in 2000.
Figure 4.2: Increase in the Proportion in Marihuana Cultivation Cases Involving VietnameseSuspects – Ten Jurisdictions With Highest Volume of Cases
British Columbia 1997–2000.
7 These percentages displayed in Tables 4.2, 4.4, 4.5 and in Figures 4.1 and 4.2 are based on what is very likely an
underestimation of the proportion of suspects of Vietnamese origin involved. This is because of the data on thisvariable was not available in 17% of the cases and due to the fact that in recording the information, suspects wereassumed not to be of Vietnamese origins whenever information was missing from a file.
Percentage7 of cases involving suspects of Vietnamese originDetachment / Department
Percentage of suspects of
Vietnamese origin 1997 1998 1999 2000 1997-2000
Vancouver 67 % 5 % 29 % 62 % 87 % 61 %
Richmond 56 % 14 % 4 % 23 % 60 % 34 %
Chilliwack 50 % 4 % 0 % 7 % 56 % 22 %
Delta 48 % 0 % 0 % 34 % 43 % 31 %
Burnaby 43 % 3 % 11 % 35 % 58 % 32 %
Nanaimo 43 % 0 % 0 % 26 % 53 % 26 %
Abbotsford 38 % 0 % 15 % 44 % 39 % 33 %
Langley 35 % 4 % 4 % 19 % 35 % 18 %
Surrey 34 % 0 % 5 % 21 % 38 % 19 %
Coquitlam 24 % 3 % 3 % 13 % 29 % 13 %
All 10 jurisdictions 48 % 3 % 9 % 25 % 56 % 30 %
Province overall 21 % 2 % 5 % 19 36 % 19 %
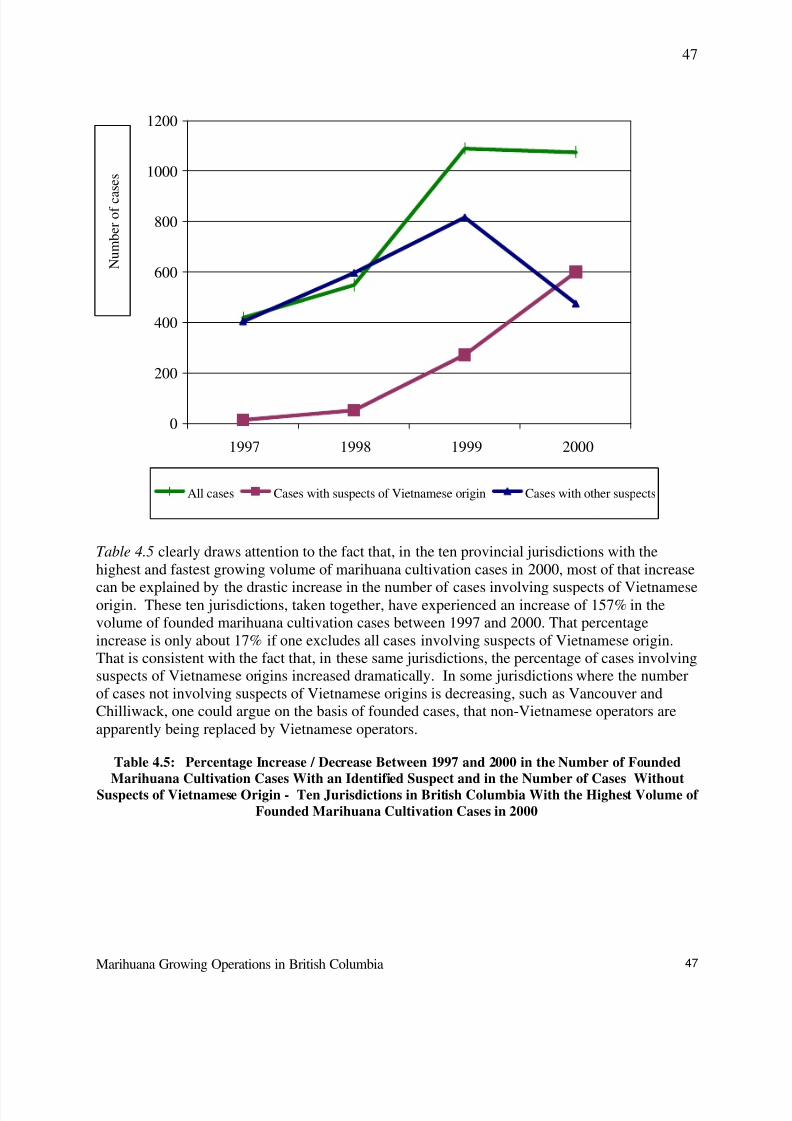
8/9/2019 BC Gro Op Satistics
http://slidepdf.com/reader/full/bc-gro-op-satistics 47/78
Marihuana Growing Operations in British Columbia
47
47
0
200
400
600
800
1000
1200
1997 1998 1999 2000
All cases Cases with suspects of Vietnamese origin Cases with other suspects
Table 4.5 clearly draws attention to the fact that, in the ten provincial jurisdictions with thehighest and fastest growing volume of marihuana cultivation cases in 2000, most of that increase
can be explained by the drastic increase in the number of cases involving suspects of Vietnameseorigin. These ten jurisdictions, taken together, have experienced an increase of 157% in thevolume of founded marihuana cultivation cases between 1997 and 2000. That percentageincrease is only about 17% if one excludes all cases involving suspects of Vietnamese origin.That is consistent with the fact that, in these same jurisdictions, the percentage of cases involvingsuspects of Vietnamese origins increased dramatically. In some jurisdictions where the numberof cases not involving suspects of Vietnamese origins is decreasing, such as Vancouver andChilliwack, one could argue on the basis of founded cases, that non-Vietnamese operators areapparently being replaced by Vietnamese operators.
Table 4.5: Percentage Increase / Decrease Between 1997 and 2000 in the Number of Founded
Marihuana Cultivation Cases With an Identified Suspect and in the Number of Cases WithoutSuspects of Vietnamese Origin - Ten Jurisdictions in British Columbia With the Highest Volume of Founded Marihuana Cultivation Cases in 2000
N u m b e r o f c a
s e s
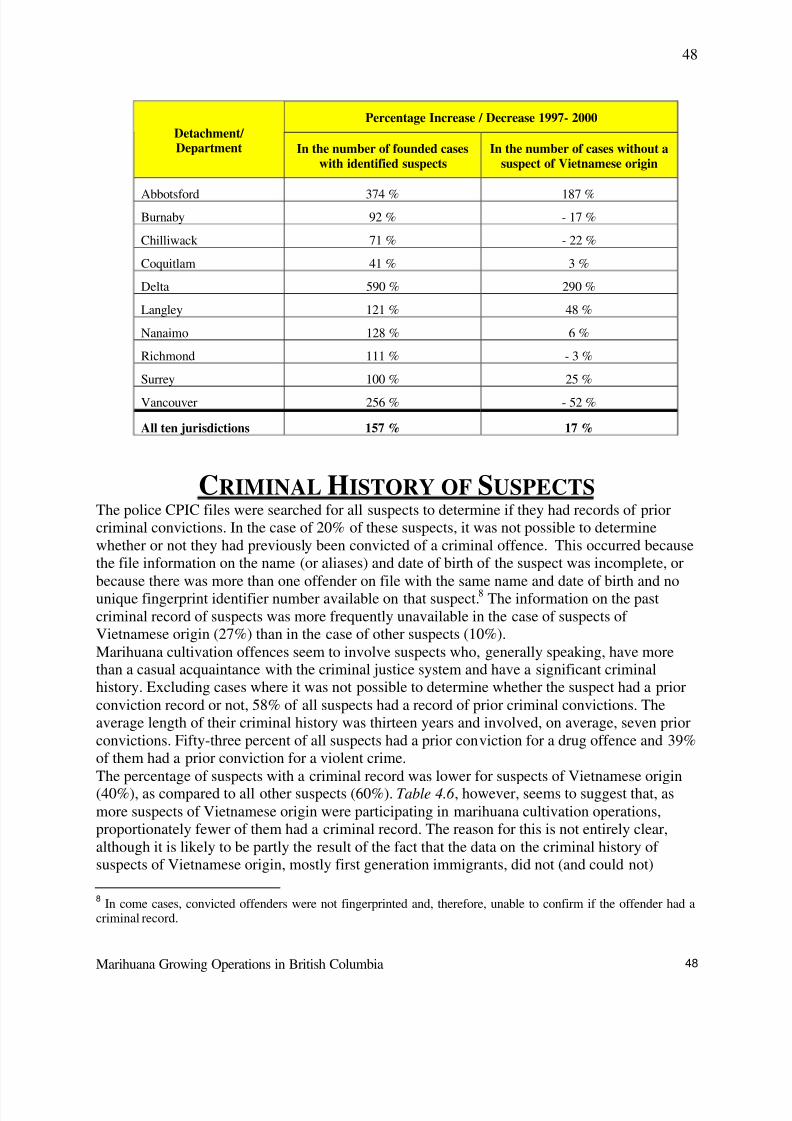
8/9/2019 BC Gro Op Satistics
http://slidepdf.com/reader/full/bc-gro-op-satistics 48/78
Marihuana Growing Operations in British Columbia
48
48
CRIMINAL HISTORY OF SUSPECTSThe police CPIC files were searched for all suspects to determine if they had records of priorcriminal convictions. In the case of 20% of these suspects, it was not possible to determinewhether or not they had previously been convicted of a criminal offence. This occurred becausethe file information on the name (or aliases) and date of birth of the suspect was incomplete, orbecause there was more than one offender on file with the same name and date of birth and nounique fingerprint identifier number available on that suspect.8 The information on the pastcriminal record of suspects was more frequently unavailable in the case of suspects of Vietnamese origin (27%) than in the case of other suspects (10%).Marihuana cultivation offences seem to involve suspects who, generally speaking, have morethan a casual acquaintance with the criminal justice system and have a significant criminalhistory. Excluding cases where it was not possible to determine whether the suspect had a priorconviction record or not, 58% of all suspects had a record of prior criminal convictions. Theaverage length of their criminal history was thirteen years and involved, on average, seven priorconvictions. Fifty-three percent of all suspects had a prior conviction for a drug offence and 39%of them had a prior conviction for a violent crime.The percentage of suspects with a criminal record was lower for suspects of Vietnamese origin(40%), as compared to all other suspects (60%). Table 4.6 , however, seems to suggest that, asmore suspects of Vietnamese origin were participating in marihuana cultivation operations,proportionately fewer of them had a criminal record. The reason for this is not entirely clear,although it is likely to be partly the result of the fact that the data on the criminal history of suspects of Vietnamese origin, mostly first generation immigrants, did not (and could not)
8 In come cases, convicted offenders were not fingerprinted and, therefore, unable to confirm if the offender had a
criminal record.
Percentage Increase / Decrease 1997- 2000Detachment/ Department In the number of founded cases
with identified suspectsIn the number of cases without a
suspect of Vietnamese origin
Abbotsford 374 % 187 %
Burnaby 92 % - 17 %
Chilliwack 71 % - 22 %
Coquitlam 41 % 3 %
Delta 590 % 290 %
Langley 121 % 48 %
Nanaimo 128 % 6 %
Richmond 111 % - 3 %
Surrey 100 % 25 %
Vancouver 256 % - 52 %
All ten jurisdictions 157 % 17 %
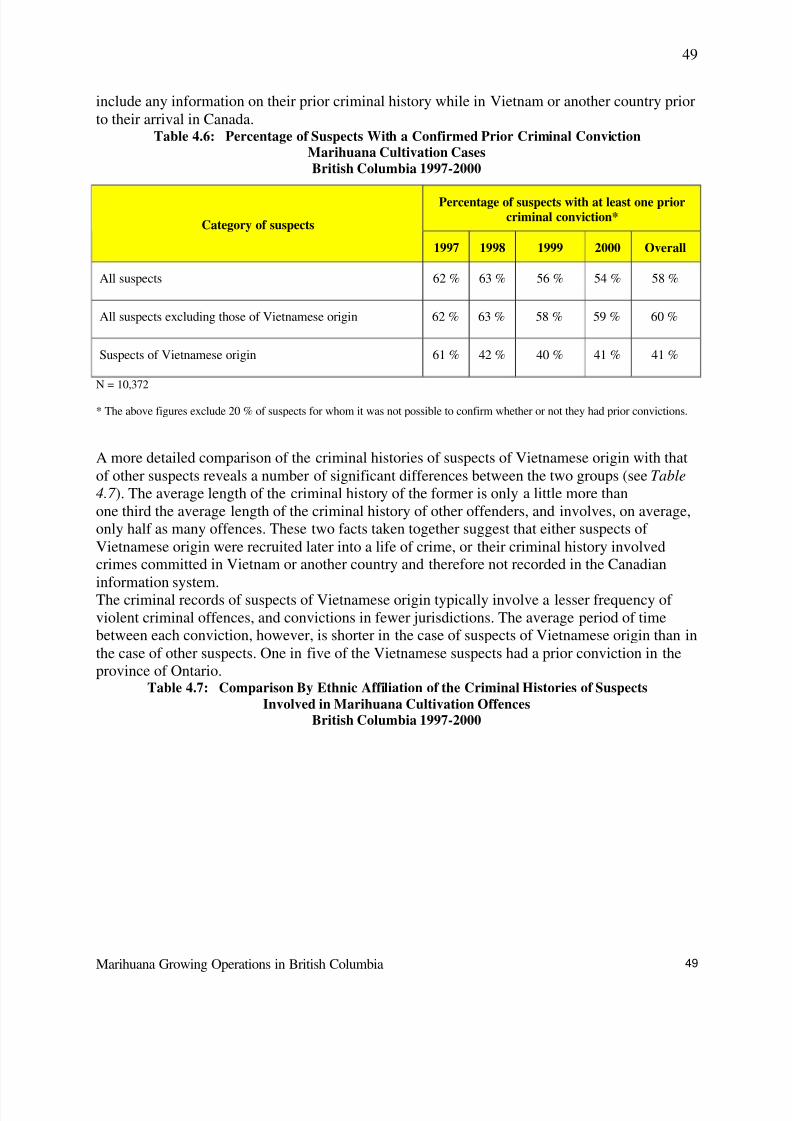
8/9/2019 BC Gro Op Satistics
http://slidepdf.com/reader/full/bc-gro-op-satistics 49/78
Marihuana Growing Operations in British Columbia
49
49
include any information on their prior criminal history while in Vietnam or another country priorto their arrival in Canada.
Table 4.6: Percentage of Suspects With a Confirmed Prior Criminal ConvictionMarihuana Cultivation CasesBritish Columbia 1997-2000
N = 10,372
* The above figures exclude 20 % of suspects for whom it was not possible to confirm whether or not they had prior convictions.
A more detailed comparison of the criminal histories of suspects of Vietnamese origin with thatof other suspects reveals a number of significant differences between the two groups (see Table
4.7 ). The average length of the criminal history of the former is only a little more thanone third the average length of the criminal history of other offenders, and involves, on average,only half as many offences. These two facts taken together suggest that either suspects of Vietnamese origin were recruited later into a life of crime, or their criminal history involvedcrimes committed in Vietnam or another country and therefore not recorded in the Canadian
information system.The criminal records of suspects of Vietnamese origin typically involve a lesser frequency of violent criminal offences, and convictions in fewer jurisdictions. The average period of timebetween each conviction, however, is shorter in the case of suspects of Vietnamese origin than inthe case of other suspects. One in five of the Vietnamese suspects had a prior conviction in theprovince of Ontario.
Table 4.7: Comparison By Ethnic Affiliation of the Criminal Histories of SuspectsInvolved in Marihuana Cultivation Offences
British Columbia 1997-2000
Percentage of suspects with at least one priorcriminal conviction*
Category of suspects
1997 1998 1999 2000 Overall
All suspects 62 % 63 % 56 % 54 % 58 %
All suspects excluding those of Vietnamese origin 62 % 63 % 58 % 59 % 60 %
Suspects of Vietnamese origin 61 % 42 % 40 % 41 % 41 %
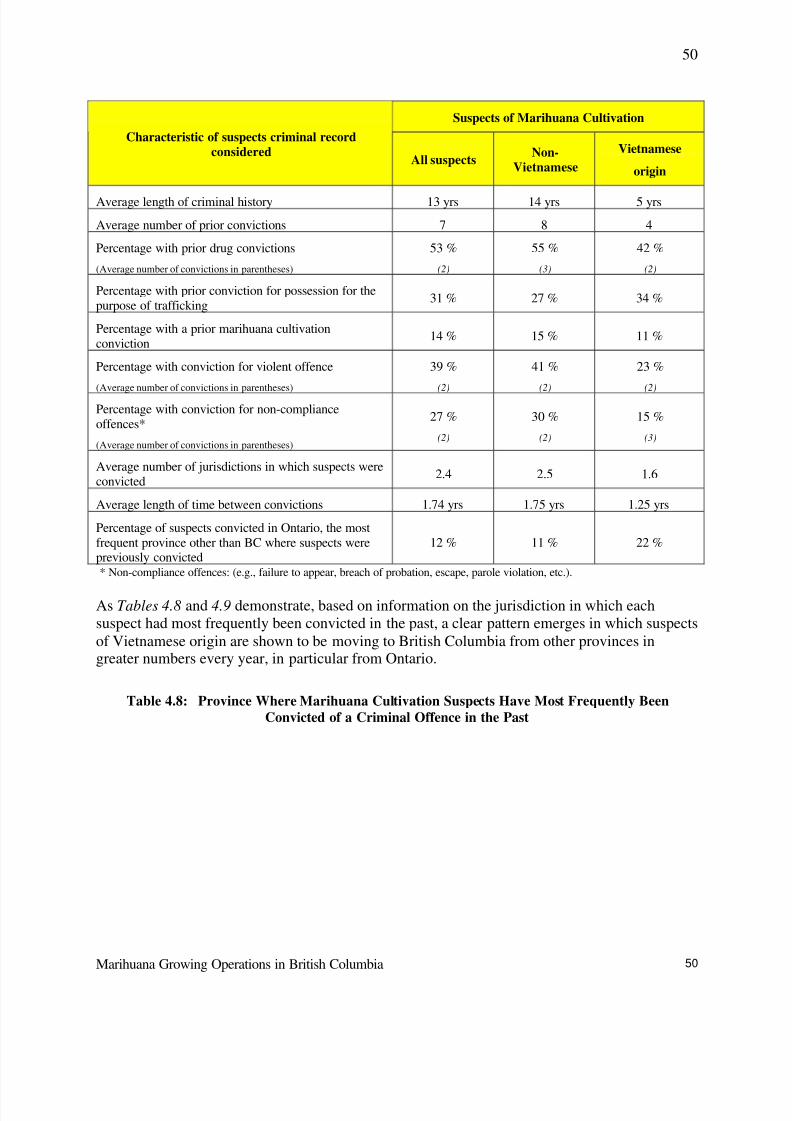
8/9/2019 BC Gro Op Satistics
http://slidepdf.com/reader/full/bc-gro-op-satistics 50/78
Marihuana Growing Operations in British Columbia
50
50
* Non-compliance offences: (e.g., failure to appear, breach of probation, escape, parole violation, etc.).
As Tables 4.8 and 4.9 demonstrate, based on information on the jurisdiction in which eachsuspect had most frequently been convicted in the past, a clear pattern emerges in which suspectsof Vietnamese origin are shown to be moving to British Columbia from other provinces ingreater numbers every year, in particular from Ontario.
Table 4.8: Province Where Marihuana Cultivation Suspects Have Most Frequently BeenConvicted of a Criminal Offence in the Past
Suspects of Marihuana Cultivation
Characteristic of suspects criminal recordconsidered
All suspectsNon-
Vietnamese
Vietnamese
origin
Average length of criminal history 13 yrs 14 yrs 5 yrs
Average number of prior convictions 7 8 4
Percentage with prior drug convictions
(Average number of convictions in parentheses)
53 %
(2)
55 %
(3)
42 %
(2)
Percentage with prior conviction for possession for thepurpose of trafficking
31 % 27 % 34 %
Percentage with a prior marihuana cultivationconviction
14 % 15 % 11 %
Percentage with conviction for violent offence
(Average number of convictions in parentheses)
39 %
(2)
41 %
(2)
23 %
(2)
Percentage with conviction for non-complianceoffences*
(Average number of convictions in parentheses)
27 %
(2)
30 %
(2)
15 %
(3)
Average number of jurisdictions in which suspects wereconvicted
2.4 2.5 1.6
Average length of time between convictions 1.74 yrs 1.75 yrs 1.25 yrs
Percentage of suspects convicted in Ontario, the mostfrequent province other than BC where suspects werepreviously convicted
12 % 11 % 22 %
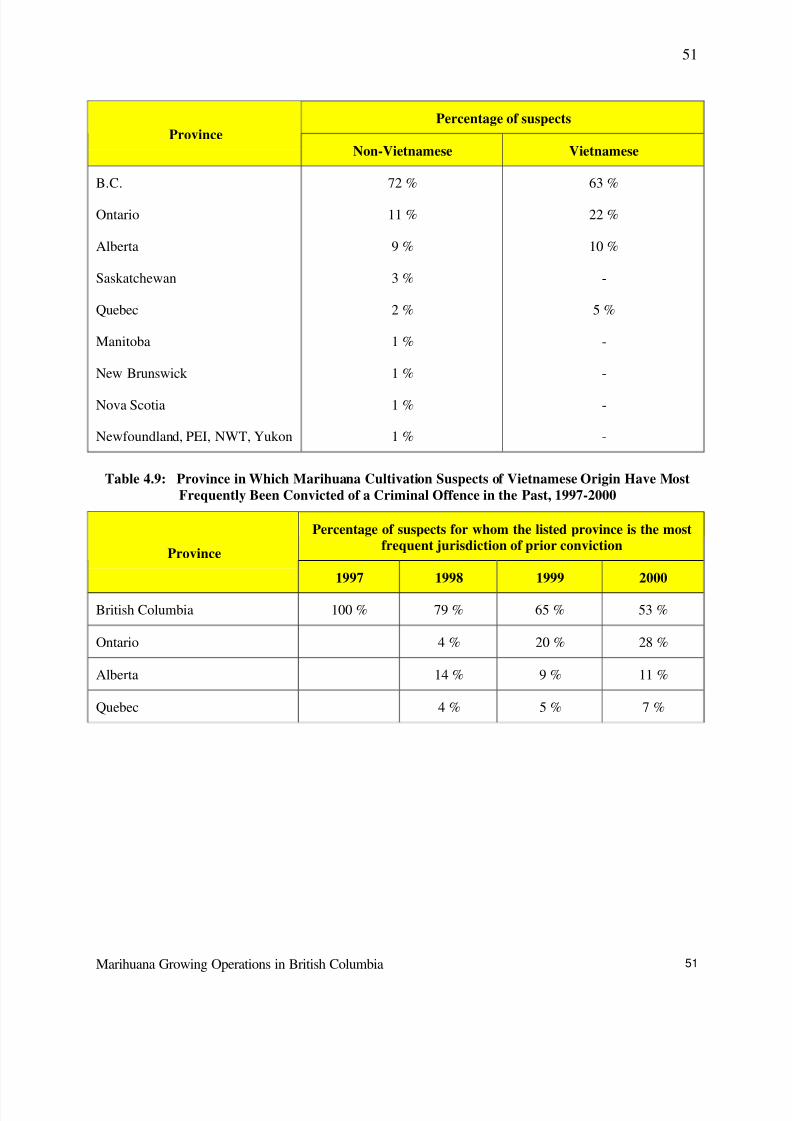
8/9/2019 BC Gro Op Satistics
http://slidepdf.com/reader/full/bc-gro-op-satistics 51/78
Marihuana Growing Operations in British Columbia
51
51
Table 4.9: Province in Which Marihuana Cultivation Suspects of Vietnamese Origin Have MostFrequently Been Convicted of a Criminal Offence in the Past, 1997-2000
Percentage of suspectsProvince
Non-Vietnamese Vietnamese
B.C.
Ontario
Alberta
Saskatchewan
Quebec
Manitoba
New Brunswick
Nova Scotia
Newfoundland, PEI, NWT, Yukon
72 %
11 %
9 %
3 %
2 %
1 %
1 %
1 %
1 %
63 %
22 %
10 %
-
5 %
-
-
-
-
Percentage of suspects for whom the listed province is the mostfrequent jurisdiction of prior conviction
Province
1997 1998 1999 2000
British Columbia 100 % 79 % 65 % 53 %
Ontario 4 % 20 % 28 %
Alberta 14 % 9 % 11 %
Quebec 4 % 5 % 7 %
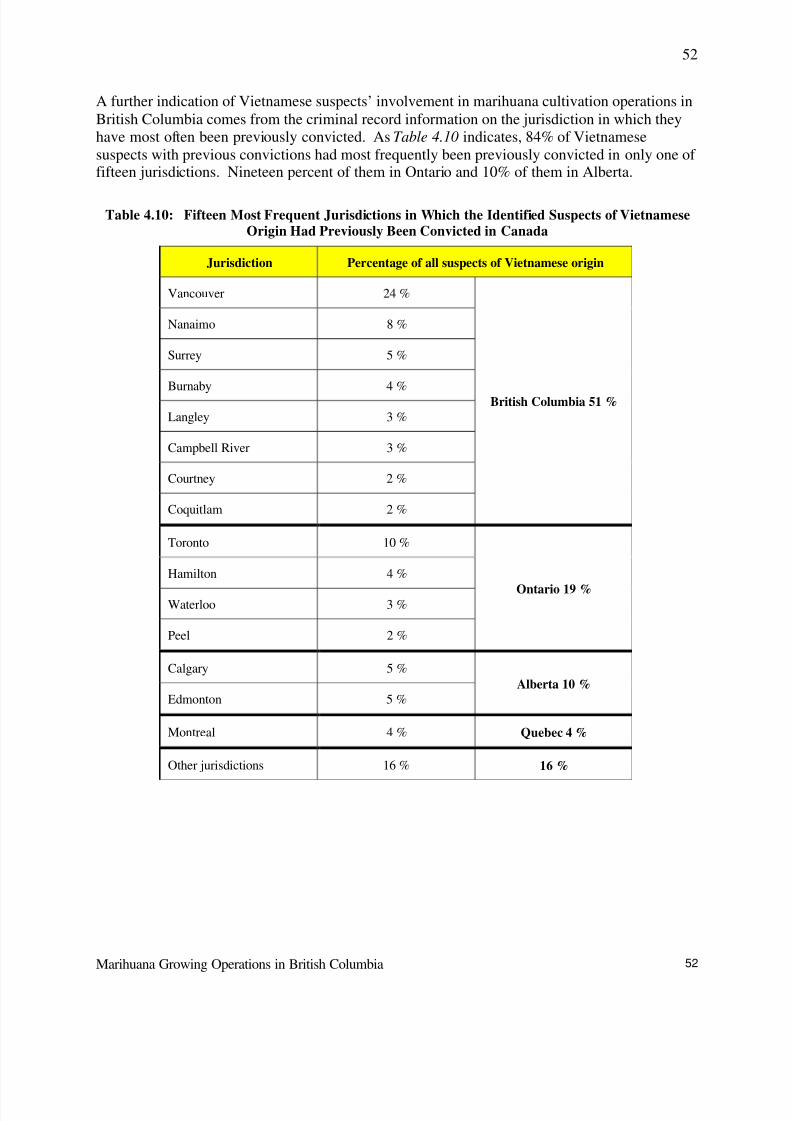
8/9/2019 BC Gro Op Satistics
http://slidepdf.com/reader/full/bc-gro-op-satistics 52/78
Marihuana Growing Operations in British Columbia
52
52
A further indication of Vietnamese suspects’ involvement in marihuana cultivation operations inBritish Columbia comes from the criminal record information on the jurisdiction in which theyhave most often been previously convicted. As Table 4.10 indicates, 84% of Vietnamesesuspects with previous convictions had most frequently been previously convicted in only one of fifteen jurisdictions. Nineteen percent of them in Ontario and 10% of them in Alberta.
Table 4.10: Fifteen Most Frequent Jurisdictions in Which the Identified Suspects of VietnameseOrigin Had Previously Been Convicted in Canada
Jurisdiction Percentage of all suspects of Vietnamese origin
Vancouver 24 %
Nanaimo 8 %
Surrey 5 %
Burnaby 4 %
Langley 3 %
Campbell River 3 %
Courtney 2 %
Coquitlam 2 %
British Columbia 51 %
Toronto 10 %
Hamilton 4 %
Waterloo 3 %
Peel 2 %
Ontario 19 %
Calgary 5 %
Edmonton 5 %Alberta 10 %
Montreal 4 % Quebec 4 %
Other jurisdictions 16 % 16 %
8/9/2019 BC Gro Op Satistics
http://slidepdf.com/reader/full/bc-gro-op-satistics 53/78
Marihuana Growing Operations in British Columbia
53
53
Chapter 5
Action Taken
One of the goals of the present study was to determine the range of measures taken by the
law enforcement and criminal justice system once a marihuana growing operation had been
uncovered. This chapter presents the data collected on the charges that were laid and the
convictions obtained in cases in which charges were laid by the Crown and where the disposition
of these charges was known at the time the data was being collected.
SEARCHES AND SEIZURESDuring the period under review, searches were conducted in 9,232 cases. The results of thesesearches and seizures were described in the previous chapters. In some situations, police officerssimply seized and destroyed the marihuana they found without any further procedure. Theyusually also seized, deactivated, or otherwise disposed of the equipment involved. These
situations are known as “no case” seizures. This type of limited response is based on theexercise of discretion by law enforcement officers. It is used in a number of situations, such aswhen a suspect has not been and is not likely to be identified, the amount of marihuana seized isvery small, the case involves a consent search, the investigating officers believe that there maybe insufficient grounds for a prosecution, or the search is conducted in such a way or undercircumstances such that it would likely render available evidence inadmissible in court.9
As seen in Table 5.1, during the four years covered in the present study, 45% of all casesinvolving a search and in which marihuana was seized were dealt with as “no case” seizures. AsTable 5.1 also shows, the proportion of “no case” seizures was considerably lower in caseswhere one or more suspects had been identified (32%). “No case” seizures were also much lessfrequent when the search resulted from a complaint received from a landlord, a neighbor, or an
anonymous caller and when the police could investigate and obtain a search warrant in advanceof the seizure. Table 5.2 also makes it clear that one of the determining factors of whether or not
9 The subject of “no case” seizures became somewhat controversial in British Columbia during the period under
review, particularly in relation to the activities on the “Growbusters Initiative” in Vancouver. The issue has receiveda fair amount of media attention and has been the object of a review by the Office of Police ComplaintCommissioner. As a result, law enforcement practices in that regard have apparently evolved during the periodunder review. [See: Campbell, Larry (2001). The Growbusters Initiative – A Review of Police Conduct, Policy and
Procedures, Prepared for the Police Complaint Commissioner of British Columbia, July 2001].
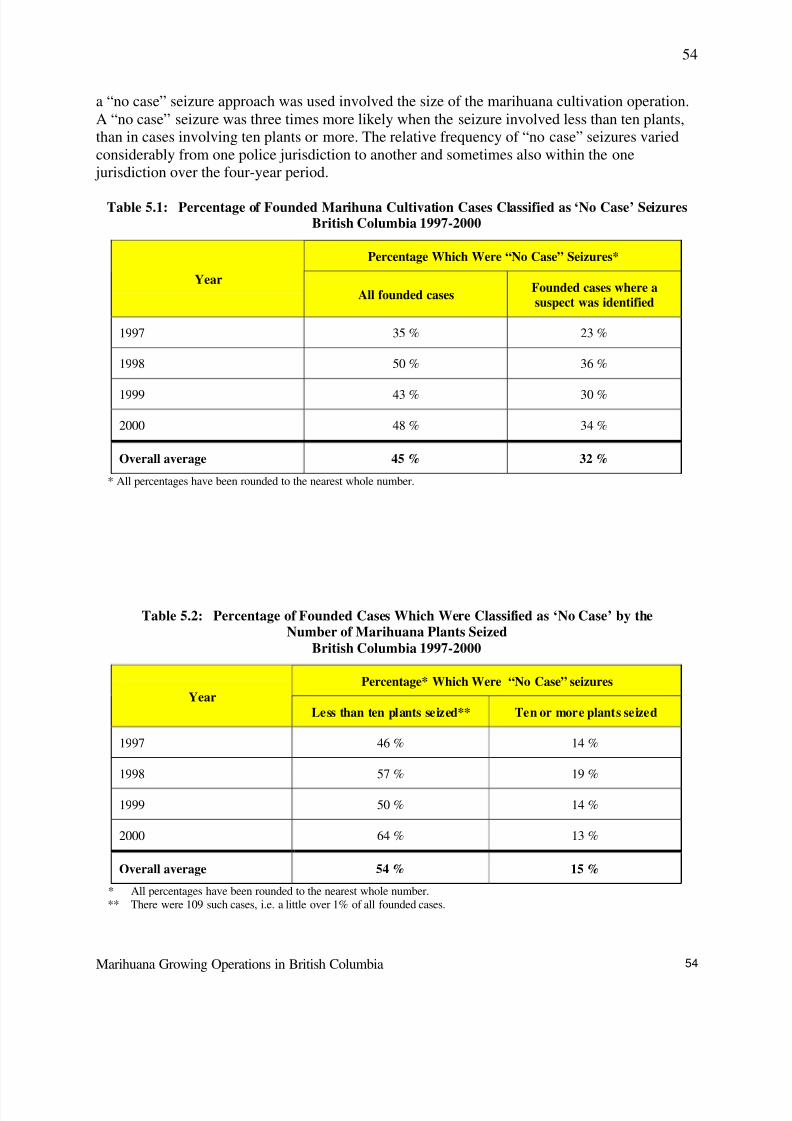
8/9/2019 BC Gro Op Satistics
http://slidepdf.com/reader/full/bc-gro-op-satistics 54/78
Marihuana Growing Operations in British Columbia
54
54
a “no case” seizure approach was used involved the size of the marihuana cultivation operation.A “no case” seizure was three times more likely when the seizure involved less than ten plants,than in cases involving ten plants or more. The relative frequency of “no case” seizures variedconsiderably from one police jurisdiction to another and sometimes also within the one jurisdiction over the four-year period.
Table 5.1: Percentage of Founded Marihuna Cultivation Cases Classified as ‘No Case’ SeizuresBritish Columbia 1997-2000
* All percentages have been rounded to the nearest whole number.
Table 5.2: Percentage of Founded Cases Which Were Classified as ‘No Case’ by theNumber of Marihuana Plants Seized
British Columbia 1997-2000
* All percentages have been rounded to the nearest whole number.** There were 109 such cases, i.e. a little over 1% of all founded cases.
Percentage Which Were “No Case” Seizures*
YearAll founded cases
Founded cases where asuspect was identified
1997 35 % 23 %
1998 50 % 36 %
1999 43 % 30 %
2000 48 % 34 %
Overall average 45 % 32 %
Percentage* Which Were “No Case” seizuresYear
Less than ten plants seized** Ten or more plants seized
1997 46 % 14 %
1998 57 % 19 %
1999 50 % 14 %
2000 64 % 13 %
Overall average 54 % 15 %
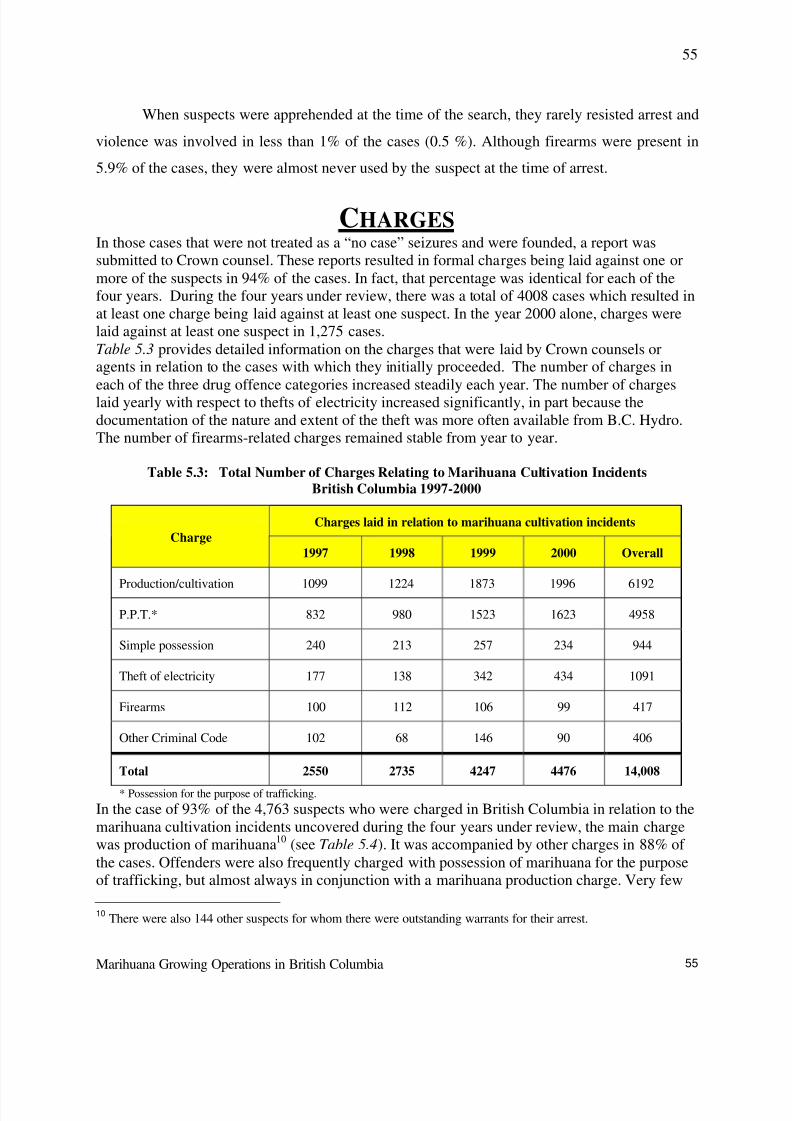
8/9/2019 BC Gro Op Satistics
http://slidepdf.com/reader/full/bc-gro-op-satistics 55/78
Marihuana Growing Operations in British Columbia
55
55
When suspects were apprehended at the time of the search, they rarely resisted arrest and
violence was involved in less than 1% of the cases (0.5 %). Although firearms were present in
5.9% of the cases, they were almost never used by the suspect at the time of arrest.
CHARGESIn those cases that were not treated as a “no case” seizures and were founded, a report wassubmitted to Crown counsel. These reports resulted in formal charges being laid against one ormore of the suspects in 94% of the cases. In fact, that percentage was identical for each of thefour years. During the four years under review, there was a total of 4008 cases which resulted inat least one charge being laid against at least one suspect. In the year 2000 alone, charges werelaid against at least one suspect in 1,275 cases.Table 5.3 provides detailed information on the charges that were laid by Crown counsels oragents in relation to the cases with which they initially proceeded. The number of charges in
each of the three drug offence categories increased steadily each year. The number of chargeslaid yearly with respect to thefts of electricity increased significantly, in part because thedocumentation of the nature and extent of the theft was more often available from B.C. Hydro.The number of firearms-related charges remained stable from year to year.
Table 5.3: Total Number of Charges Relating to Marihuana Cultivation IncidentsBritish Columbia 1997-2000
* Possession for the purpose of trafficking.
In the case of 93% of the 4,763 suspects who were charged in British Columbia in relation to themarihuana cultivation incidents uncovered during the four years under review, the main chargewas production of marihuana10 (see Table 5.4). It was accompanied by other charges in 88% of the cases. Offenders were also frequently charged with possession of marihuana for the purposeof trafficking, but almost always in conjunction with a marihuana production charge. Very few
10
There were also 144 other suspects for whom there were outstanding warrants for their arrest.
Charges laid in relation to marihuana cultivation incidentsCharge
1997 1998 1999 2000 Overall
Production/cultivation 1099 1224 1873 1996 6192
P.P.T.* 832 980 1523 1623 4958
Simple possession 240 213 257 234 944
Theft of electricity 177 138 342 434 1091
Firearms 100 112 106 99 417
Other Criminal Code 102 68 146 90 406
Total 2550 2735 4247 4476 14,008
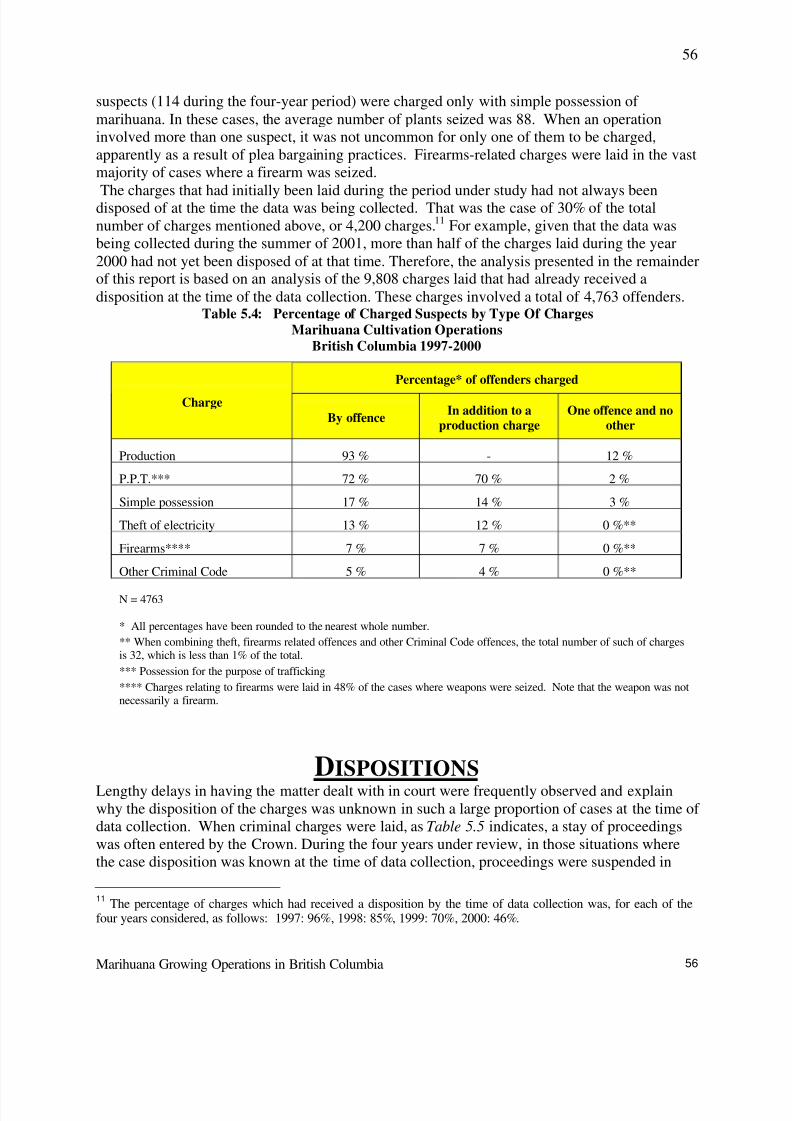
8/9/2019 BC Gro Op Satistics
http://slidepdf.com/reader/full/bc-gro-op-satistics 56/78
Marihuana Growing Operations in British Columbia
56
56
suspects (114 during the four-year period) were charged only with simple possession of marihuana. In these cases, the average number of plants seized was 88. When an operationinvolved more than one suspect, it was not uncommon for only one of them to be charged,apparently as a result of plea bargaining practices. Firearms-related charges were laid in the vastmajority of cases where a firearm was seized.
The charges that had initially been laid during the period under study had not always beendisposed of at the time the data was being collected. That was the case of 30% of the totalnumber of charges mentioned above, or 4,200 charges.11 For example, given that the data wasbeing collected during the summer of 2001, more than half of the charges laid during the year2000 had not yet been disposed of at that time. Therefore, the analysis presented in the remainderof this report is based on an analysis of the 9,808 charges laid that had already received adisposition at the time of the data collection. These charges involved a total of 4,763 offenders.
Table 5.4: Percentage of Charged Suspects by Type Of ChargesMarihuana Cultivation Operations
British Columbia 1997-2000
N = 4763
* All percentages have been rounded to the nearest whole number.
** When combining theft, firearms related offences and other Criminal Code offences, the total number of such of chargesis 32, which is less than 1% of the total.
*** Possession for the purpose of trafficking
**** Charges relating to firearms were laid in 48% of the cases where weapons were seized. Note that the weapon was notnecessarily a firearm.
DISPOSITIONSLengthy delays in having the matter dealt with in court were frequently observed and explainwhy the disposition of the charges was unknown in such a large proportion of cases at the time of data collection. When criminal charges were laid, as Table 5.5 indicates, a stay of proceedingswas often entered by the Crown. During the four years under review, in those situations wherethe case disposition was known at the time of data collection, proceedings were suspended in
11
The percentage of charges which had received a disposition by the time of data collection was, for each of thefour years considered, as follows: 1997: 96%, 1998: 85%, 1999: 70%, 2000: 46%.
Percentage* of offenders charged
ChargeBy offence
In addition to aproduction charge
One offence and noother
Production 93 % - 12 %
P.P.T.*** 72 % 70 % 2 %
Simple possession 17 % 14 % 3 %
Theft of electricity 13 % 12 % 0 %**
Firearms**** 7 % 7 % 0 %**
Other Criminal Code 5 % 4 % 0 %**
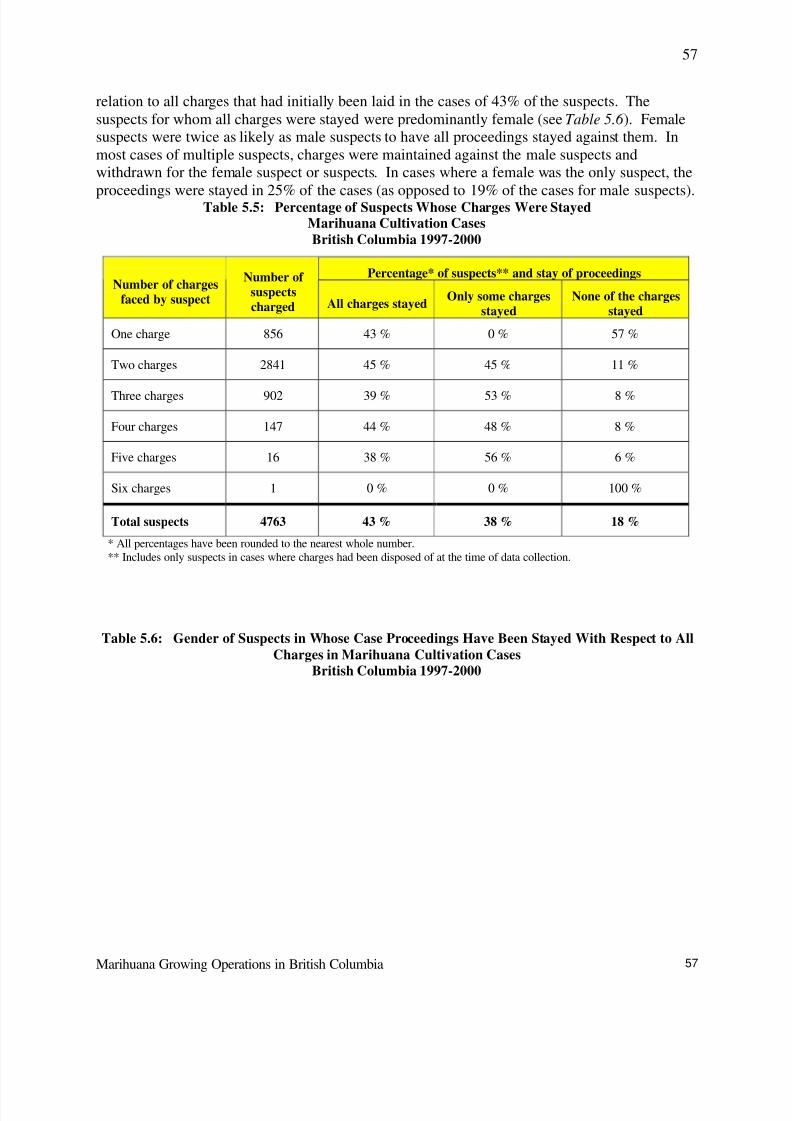
8/9/2019 BC Gro Op Satistics
http://slidepdf.com/reader/full/bc-gro-op-satistics 57/78
Marihuana Growing Operations in British Columbia
57
57
relation to all charges that had initially been laid in the cases of 43% of the suspects. Thesuspects for whom all charges were stayed were predominantly female (see Table 5.6 ). Femalesuspects were twice as likely as male suspects to have all proceedings stayed against them. Inmost cases of multiple suspects, charges were maintained against the male suspects andwithdrawn for the female suspect or suspects. In cases where a female was the only suspect, the
proceedings were stayed in 25% of the cases (as opposed to 19% of the cases for male suspects).Table 5.5: Percentage of Suspects Whose Charges Were StayedMarihuana Cultivation CasesBritish Columbia 1997-2000
* All percentages have been rounded to the nearest whole number.** Includes only suspects in cases where charges had been disposed of at the time of data collection.
Table 5.6: Gender of Suspects in Whose Case Proceedings Have Been Stayed With Respect to AllCharges in Marihuana Cultivation Cases
British Columbia 1997-2000
Percentage* of suspects** and stay of proceedingsNumber of charges
faced by suspect
Number of suspectscharged All charges stayed
Only some chargesstayed
None of the chargesstayed
One charge 856 43 % 0 % 57 %
Two charges 2841 45 % 45 % 11 %
Three charges 902 39 % 53 % 8 %
Four charges 147 44 % 48 % 8 %
Five charges 16 38 % 56 % 6 %
Six charges 1 0 % 0 % 100 %
Total suspects 4763 43 % 38 % 18 %
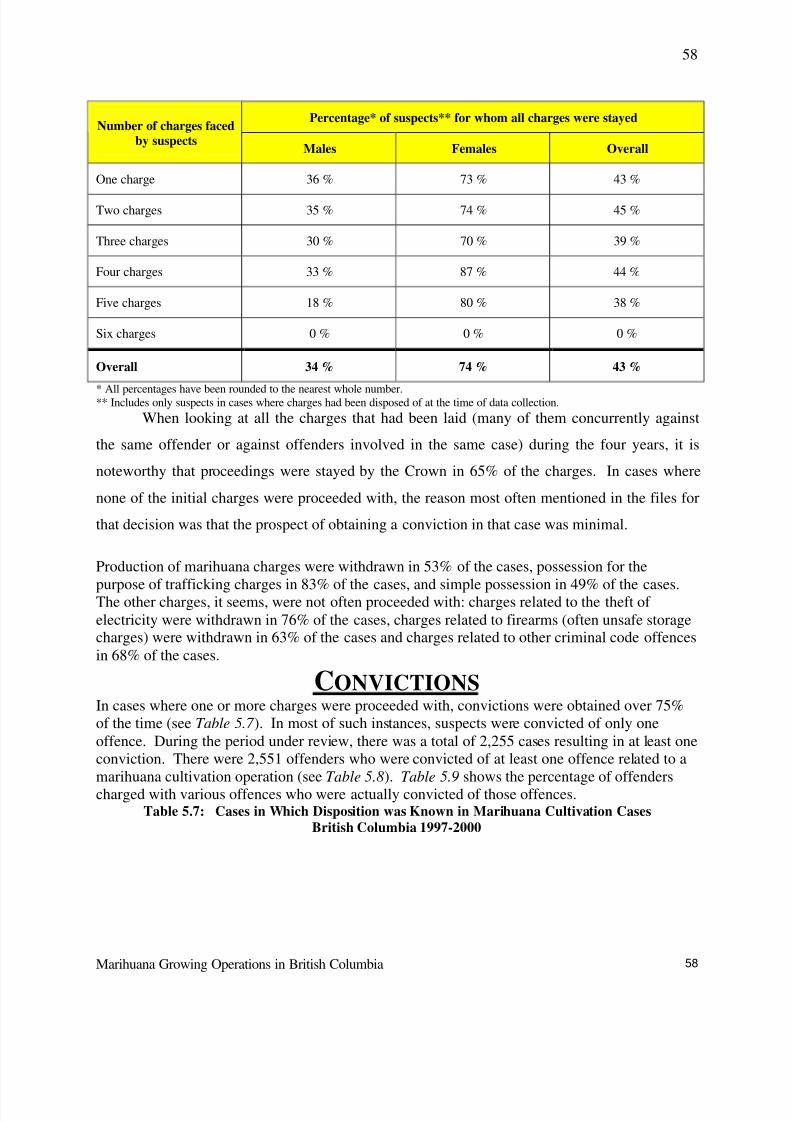
8/9/2019 BC Gro Op Satistics
http://slidepdf.com/reader/full/bc-gro-op-satistics 58/78
Marihuana Growing Operations in British Columbia
58
58
* All percentages have been rounded to the nearest whole number.** Includes only suspects in cases where charges had been disposed of at the time of data collection.
When looking at all the charges that had been laid (many of them concurrently against
the same offender or against offenders involved in the same case) during the four years, it is
noteworthy that proceedings were stayed by the Crown in 65% of the charges. In cases where
none of the initial charges were proceeded with, the reason most often mentioned in the files for
that decision was that the prospect of obtaining a conviction in that case was minimal.
Production of marihuana charges were withdrawn in 53% of the cases, possession for the
purpose of trafficking charges in 83% of the cases, and simple possession in 49% of the cases.The other charges, it seems, were not often proceeded with: charges related to the theft of electricity were withdrawn in 76% of the cases, charges related to firearms (often unsafe storagecharges) were withdrawn in 63% of the cases and charges related to other criminal code offencesin 68% of the cases.
CONVICTIONSIn cases where one or more charges were proceeded with, convictions were obtained over 75%of the time (see Table 5.7 ). In most of such instances, suspects were convicted of only oneoffence. During the period under review, there was a total of 2,255 cases resulting in at least oneconviction. There were 2,551 offenders who were convicted of at least one offence related to amarihuana cultivation operation (see Table 5.8). Table 5.9 shows the percentage of offenderscharged with various offences who were actually convicted of those offences.
Table 5.7: Cases in Which Disposition was Known in Marihuana Cultivation CasesBritish Columbia 1997-2000
Percentage* of suspects** for whom all charges were stayedNumber of charges faced
by suspectsMales Females Overall
One charge 36 % 73 % 43 %
Two charges 35 % 74 % 45 %
Three charges 30 % 70 % 39 %
Four charges 33 % 87 % 44 %
Five charges 18 % 80 % 38 %
Six charges 0 % 0 % 0 %
Overall 34 % 74 % 43 %
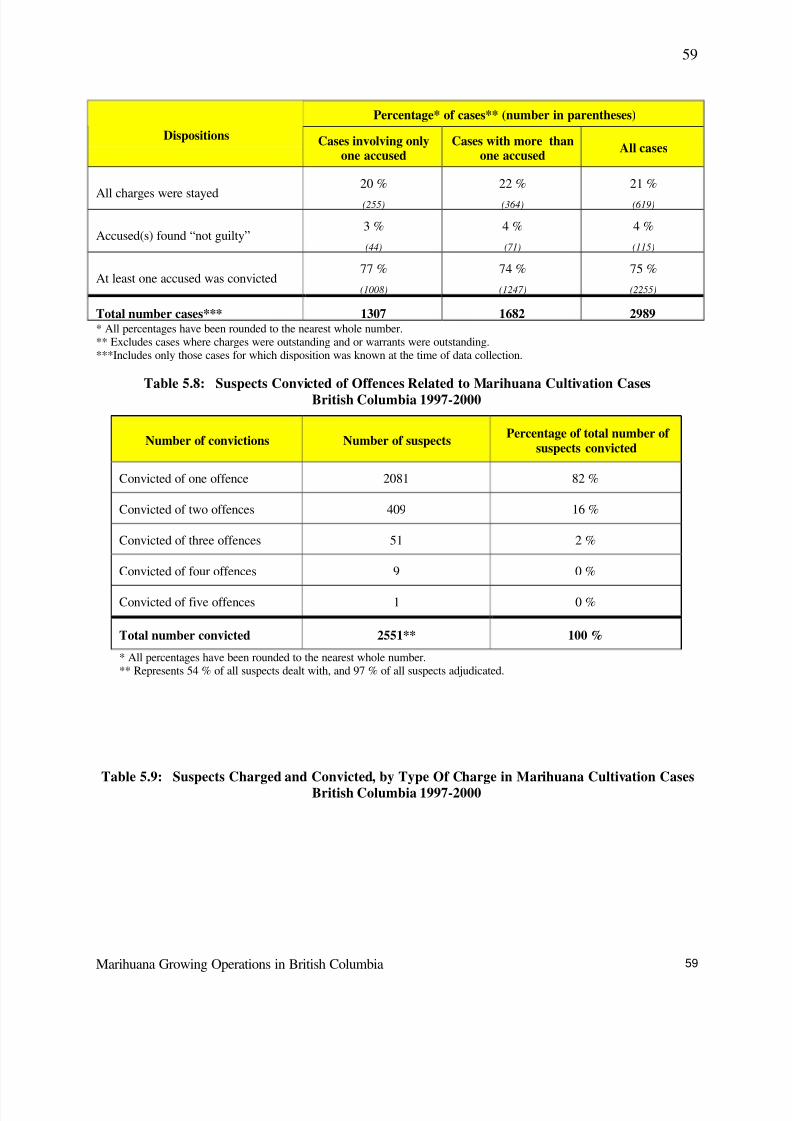
8/9/2019 BC Gro Op Satistics
http://slidepdf.com/reader/full/bc-gro-op-satistics 59/78
Marihuana Growing Operations in British Columbia
59
59
* All percentages have been rounded to the nearest whole number.** Excludes cases where charges were outstanding and or warrants were outstanding.***Includes only those cases for which disposition was known at the time of data collection.
Table 5.8: Suspects Convicted of Offences Related to Marihuana Cultivation CasesBritish Columbia 1997-2000
* All percentages have been rounded to the nearest whole number.** Represents 54 % of all suspects dealt with, and 97 % of all suspects adjudicated.
Table 5.9: Suspects Charged and Convicted, by Type Of Charge in Marihuana Cultivation CasesBritish Columbia 1997-2000
Percentage* of cases** (number in parentheses)
Dispositions Cases involving onlyone accused
Cases with more thanone accused
All cases
All charges were stayed
20 %
(255)
22 %
(364)
21 %
(619)
Accused(s) found “not guilty”3 %
(44)
4 %
(71)
4 %
(115)
At least one accused was convicted77 %
(1008)
74 %
(1247)
75 %
(2255)
Total number cases*** 1307 1682 2989
Number of convictions Number of suspectsPercentage of total number of
suspects convicted
Convicted of one offence 2081 82 %
Convicted of two offences 409 16 %
Convicted of three offences 51 2 %
Convicted of four offences 9 0 %
Convicted of five offences 1 0 %
Total number convicted 2551** 100 %
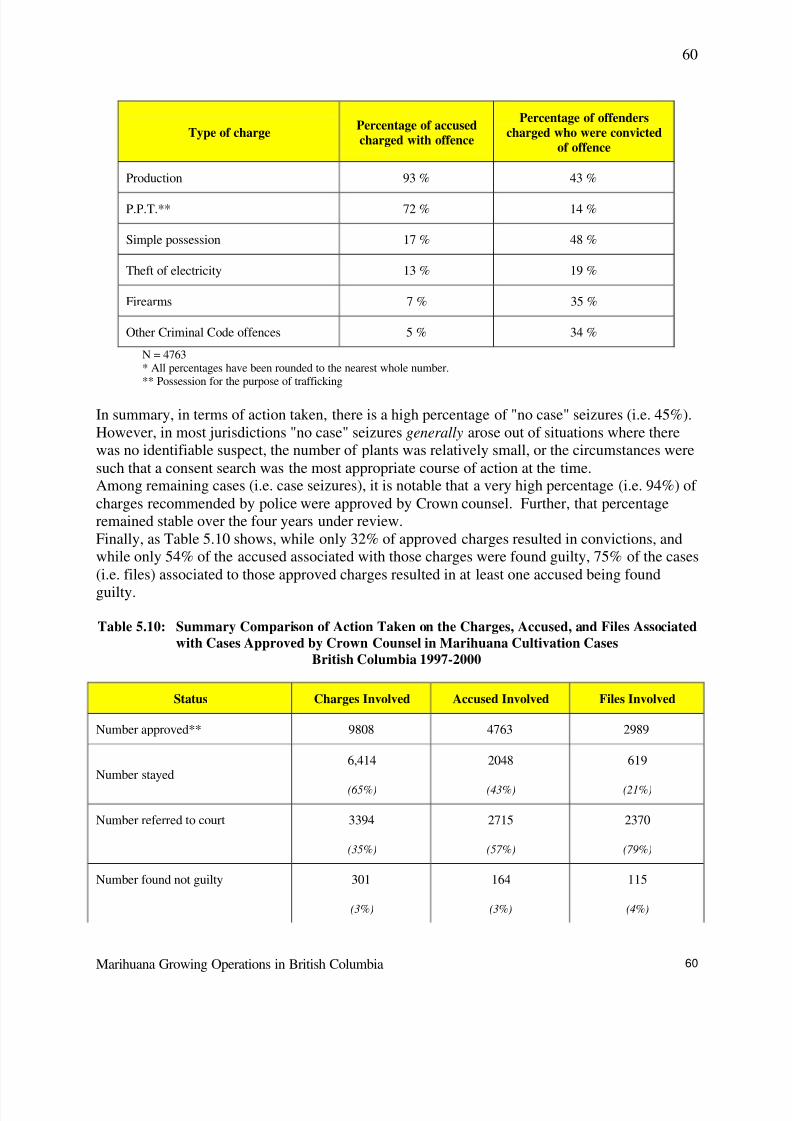
8/9/2019 BC Gro Op Satistics
http://slidepdf.com/reader/full/bc-gro-op-satistics 60/78
Marihuana Growing Operations in British Columbia
60
60
N = 4763* All percentages have been rounded to the nearest whole number.** Possession for the purpose of trafficking
In summary, in terms of action taken, there is a high percentage of "no case" seizures (i.e. 45%).However, in most jurisdictions "no case" seizures generally arose out of situations where therewas no identifiable suspect, the number of plants was relatively small, or the circumstances weresuch that a consent search was the most appropriate course of action at the time.Among remaining cases (i.e. case seizures), it is notable that a very high percentage (i.e. 94%) of charges recommended by police were approved by Crown counsel. Further, that percentageremained stable over the four years under review.Finally, as Table 5.10 shows, while only 32% of approved charges resulted in convictions, andwhile only 54% of the accused associated with those charges were found guilty, 75% of the cases(i.e. files) associated to those approved charges resulted in at least one accused being found
guilty.
Table 5.10: Summary Comparison of Action Taken on the Charges, Accused, and Files Associatedwith Cases Approved by Crown Counsel in Marihuana Cultivation Cases
British Columbia 1997-2000
Status Charges Involved Accused Involved Files Involved
Number approved** 9808 4763 2989
Number stayed6,414
(65%)
2048
(43%)
619
(21%)
Number referred to court 3394
(35%)
2715
(57%)
2370
(79%)
Number found not guilty 301
(3%)
164
(3%)
115
(4%)
Type of chargePercentage of accusedcharged with offence
Percentage of offenderscharged who were convicted
of offence
Production 93 % 43 %
P.P.T.** 72 % 14 %
Simple possession 17 % 48 %
Theft of electricity 13 % 19 %
Firearms 7 % 35 %
Other Criminal Code offences 5 % 34 %
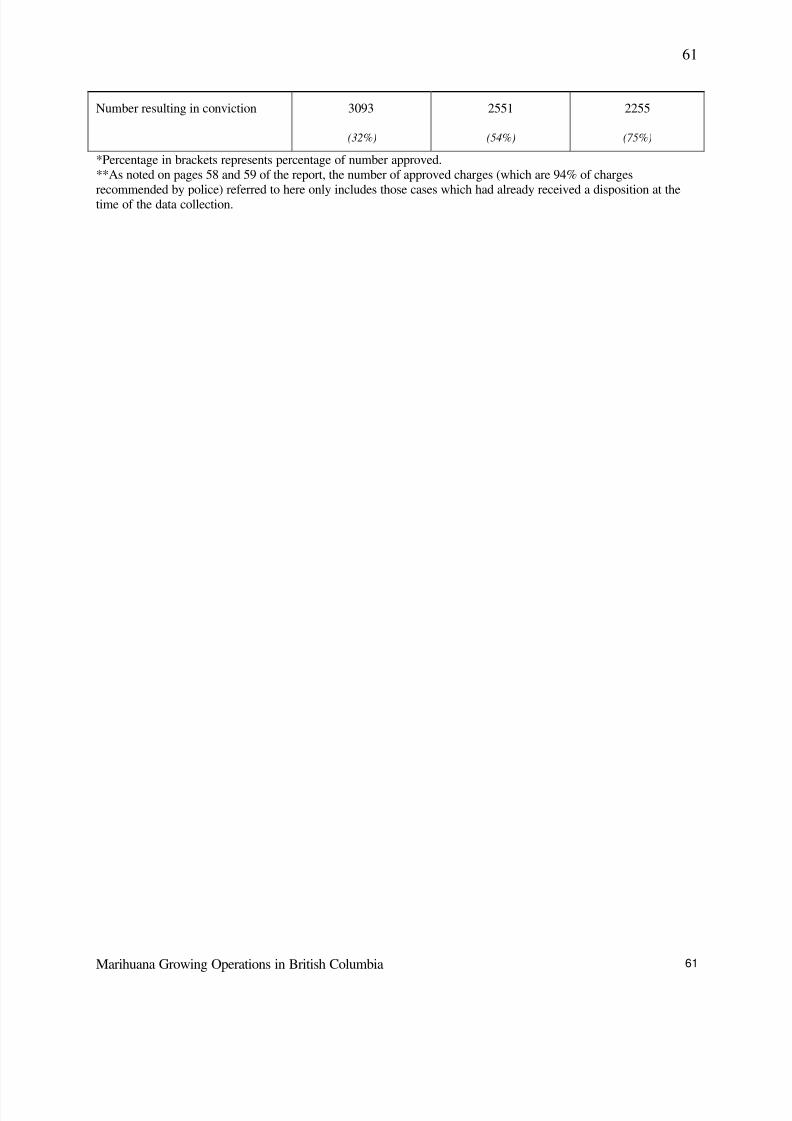
8/9/2019 BC Gro Op Satistics
http://slidepdf.com/reader/full/bc-gro-op-satistics 61/78
Marihuana Growing Operations in British Columbia
61
61
Number resulting in conviction 3093
(32%)
2551
(54%)
2255
(75%)
*Percentage in brackets represents percentage of number approved.**As noted on pages 58 and 59 of the report, the number of approved charges (which are 94% of charges
recommended by police) referred to here only includes those cases which had already received a disposition at thetime of the data collection.
8/9/2019 BC Gro Op Satistics
http://slidepdf.com/reader/full/bc-gro-op-satistics 62/78
Marihuana Growing Operations in British Columbia
62
62
Chapter 6
Sentencing
It is not easy to present an accurate picture of the complex sentencing patterns thatemerge when looking at the sentences imposed on convicted offenders in relation to marihuana
cultivation operations. The difficulty arises out of a number of complicating factors. First,
suspects who were accused in relation to their involvement in a marihuana cultivation operation
were often charged, as we have already seen, with multiple offences. The initial charges laid
usually included a production of marihuana charge (97% of the cases) and a possession for the
purpose of trafficking charge (72% of the cases). Other charges were also often involved, such as
charges relating to the simple possession of marihuana, the possession of other controlled
substances, theft of electricity, firearm related offences and various other Criminal Code
offences. Secondly, the accused individuals frequently pleaded guilty to one or more charges,
not necessarily the drug production charge, based on an agreement with the Crown that other
charges would not be proceeded with. Accordingly, some offenders were convicted of only one
of the offences that they had originally been charged with, while others were convicted of two or
three charges relating to the same marihuana cultivation operation. Thirdly, in most instances,
convicted offenders received multiple dispositions for either the various related charges or even
one single charge (e.g., some combination of prison, probation, fine, or restitution). Finally,
when an offender was sentenced to several dispositions for different charges, these sentences
could be ordered served either concurrently or consecutively. The following attempts to give a
clear picture of the sentencing patterns observed attempts to capture the capture the complexity
of these patterns.
TYPE AND SEVERITY OF PENALTY IMPOSEDTable 6.1, displays the percentage of cases where various penalties were awarded as part of a
sentence, broken down by year. The most frequent sentences are conditional imprisonment,probation and fines. During the four-year period under review, a fine was part of the sentenceordered by the court in 42% of the cases and, in a little over half of these instances, it was theonly penalty. During that same period of time, imprisonment was included in the sentenceordered by the court in only 18% of the cases. When ordered, imprisonment was accompanied byanother penalty in 64% of the cases (e.g. a fine, a probation term, or a restitution order).
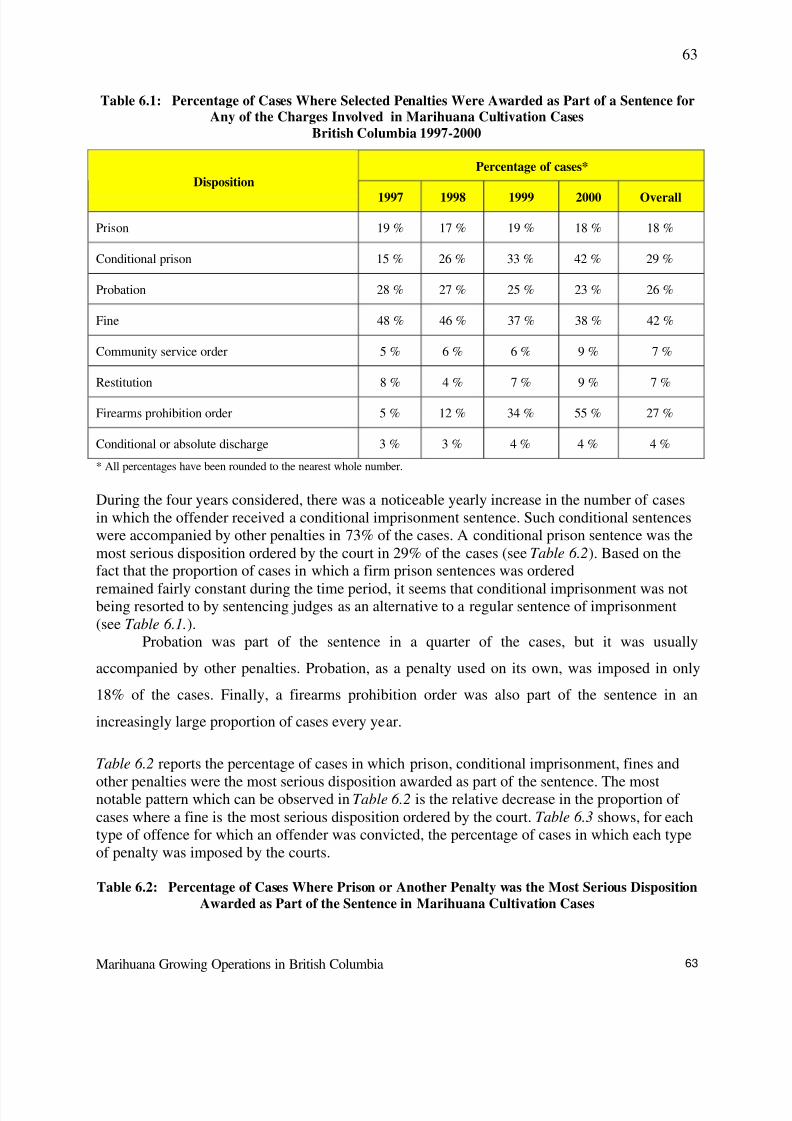
8/9/2019 BC Gro Op Satistics
http://slidepdf.com/reader/full/bc-gro-op-satistics 63/78
Marihuana Growing Operations in British Columbia
63
63
Table 6.1: Percentage of Cases Where Selected Penalties Were Awarded as Part of a Sentence forAny of the Charges Involved in Marihuana Cultivation Cases
British Columbia 1997-2000
* All percentages have been rounded to the nearest whole number.
During the four years considered, there was a noticeable yearly increase in the number of casesin which the offender received a conditional imprisonment sentence. Such conditional sentenceswere accompanied by other penalties in 73% of the cases. A conditional prison sentence was themost serious disposition ordered by the court in 29% of the cases (see Table 6.2). Based on thefact that the proportion of cases in which a firm prison sentences was ordered
remained fairly constant during the time period, it seems that conditional imprisonment was notbeing resorted to by sentencing judges as an alternative to a regular sentence of imprisonment(see Table 6.1.).
Probation was part of the sentence in a quarter of the cases, but it was usually
accompanied by other penalties. Probation, as a penalty used on its own, was imposed in only
18% of the cases. Finally, a firearms prohibition order was also part of the sentence in an
increasingly large proportion of cases every year.
Table 6.2 reports the percentage of cases in which prison, conditional imprisonment, fines and
other penalties were the most serious disposition awarded as part of the sentence. The mostnotable pattern which can be observed in Table 6.2 is the relative decrease in the proportion of cases where a fine is the most serious disposition ordered by the court. Table 6.3 shows, for eachtype of offence for which an offender was convicted, the percentage of cases in which each typeof penalty was imposed by the courts.
Table 6.2: Percentage of Cases Where Prison or Another Penalty was the Most Serious DispositionAwarded as Part of the Sentence in Marihuana Cultivation Cases
Percentage of cases*Disposition
1997 1998 1999 2000 Overall
Prison 19 % 17 % 19 % 18 % 18 %
Conditional prison 15 % 26 % 33 % 42 % 29 %
Probation 28 % 27 % 25 % 23 % 26 %
Fine 48 % 46 % 37 % 38 % 42 %
Community service order 5 % 6 % 6 % 9 % 7 %
Restitution 8 % 4 % 7 % 9 % 7 %
Firearms prohibition order 5 % 12 % 34 % 55 % 27 %
Conditional or absolute discharge 3 % 3 % 4 % 4 % 4 %
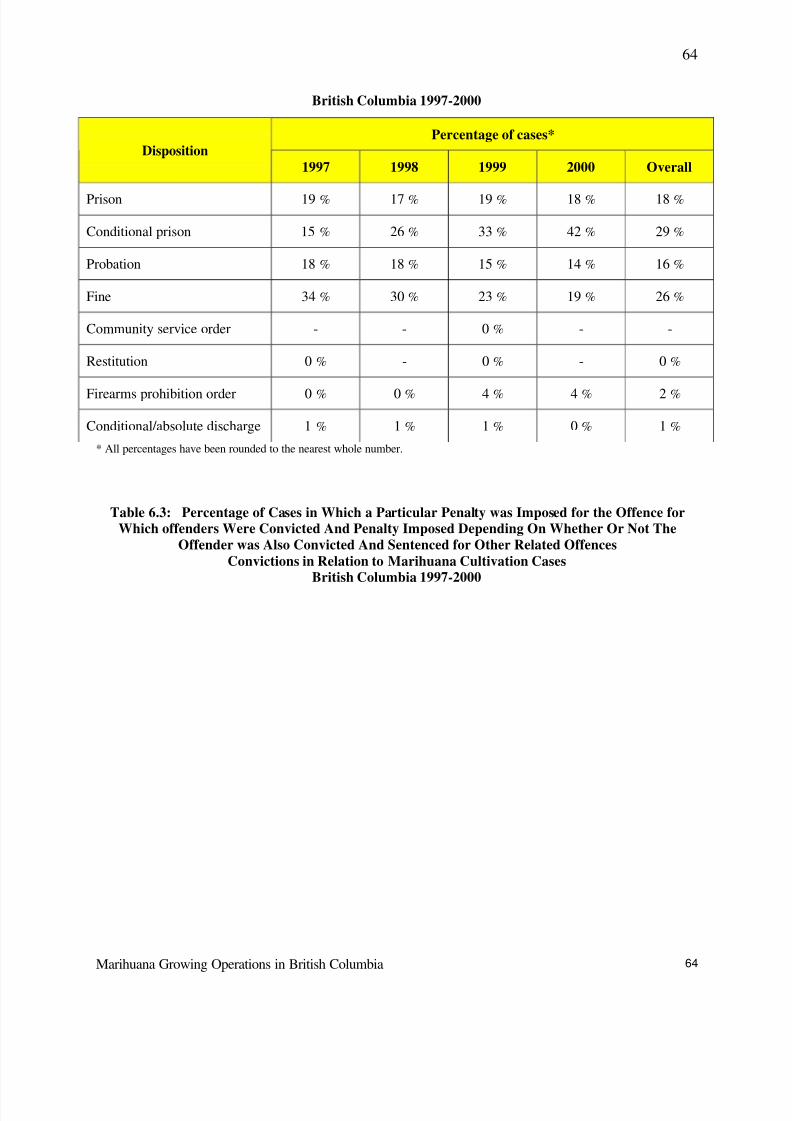
8/9/2019 BC Gro Op Satistics
http://slidepdf.com/reader/full/bc-gro-op-satistics 64/78
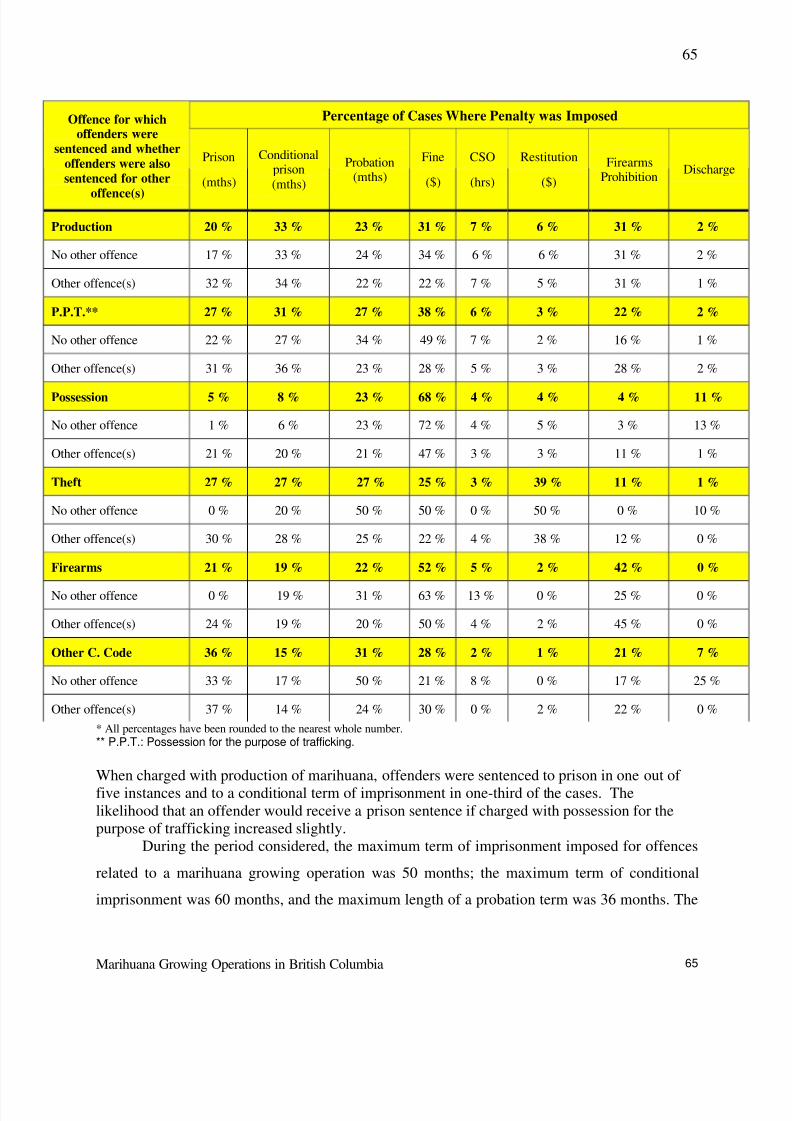
8/9/2019 BC Gro Op Satistics
http://slidepdf.com/reader/full/bc-gro-op-satistics 65/78
Marihuana Growing Operations in British Columbia
65
65
* All percentages have been rounded to the nearest whole number.** P.P.T.: Possession for the purpose of trafficking.
When charged with production of marihuana, offenders were sentenced to prison in one out of five instances and to a conditional term of imprisonment in one-third of the cases. Thelikelihood that an offender would receive a prison sentence if charged with possession for thepurpose of trafficking increased slightly.
During the period considered, the maximum term of imprisonment imposed for offences
related to a marihuana growing operation was 50 months; the maximum term of conditional
imprisonment was 60 months, and the maximum length of a probation term was 36 months. The
Percentage of Cases Where Penalty was ImposedOffence for whichoffenders were
sentenced and whetheroffenders were alsosentenced for other
offence(s)
Prison
(mths)
Conditionalprison(mths)
Probation(mths)
Fine
($)
CSO
(hrs)
Restitution
($)
FirearmsProhibition
Discharge
Production 20 % 33 % 23 % 31 % 7 % 6 % 31 % 2 %
No other offence 17 % 33 % 24 % 34 % 6 % 6 % 31 % 2 %
Other offence(s) 32 % 34 % 22 % 22 % 7 % 5 % 31 % 1 %
P.P.T.** 27 % 31 % 27 % 38 % 6 % 3 % 22 % 2 %
No other offence 22 % 27 % 34 % 49 % 7 % 2 % 16 % 1 %
Other offence(s) 31 % 36 % 23 % 28 % 5 % 3 % 28 % 2 %
Possession 5 % 8 % 23 % 68 % 4 % 4 % 4 % 11 %
No other offence 1 % 6 % 23 % 72 % 4 % 5 % 3 % 13 %
Other offence(s) 21 % 20 % 21 % 47 % 3 % 3 % 11 % 1 %
Theft 27 % 27 % 27 % 25 % 3 % 39 % 11 % 1 %
No other offence 0 % 20 % 50 % 50 % 0 % 50 % 0 % 10 %
Other offence(s) 30 % 28 % 25 % 22 % 4 % 38 % 12 % 0 %
Firearms 21 % 19 % 22 % 52 % 5 % 2 % 42 % 0 %
No other offence 0 % 19 % 31 % 63 % 13 % 0 % 25 % 0 %
Other offence(s) 24 % 19 % 20 % 50 % 4 % 2 % 45 % 0 %
Other C. Code 36 % 15 % 31 % 28 % 2 % 1 % 21 % 7 %
No other offence 33 % 17 % 50 % 21 % 8 % 0 % 17 % 25 %
Other offence(s) 37 % 14 % 24 % 30 % 0 % 2 % 22 % 0 %
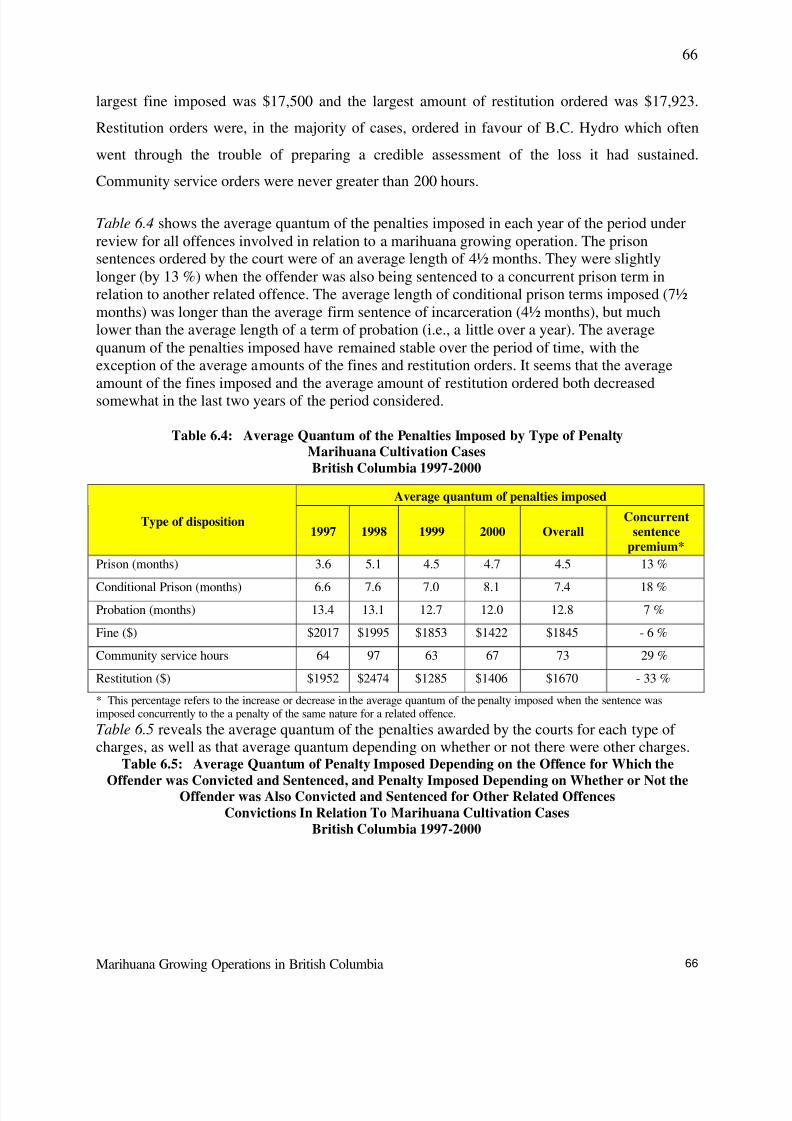
8/9/2019 BC Gro Op Satistics
http://slidepdf.com/reader/full/bc-gro-op-satistics 66/78
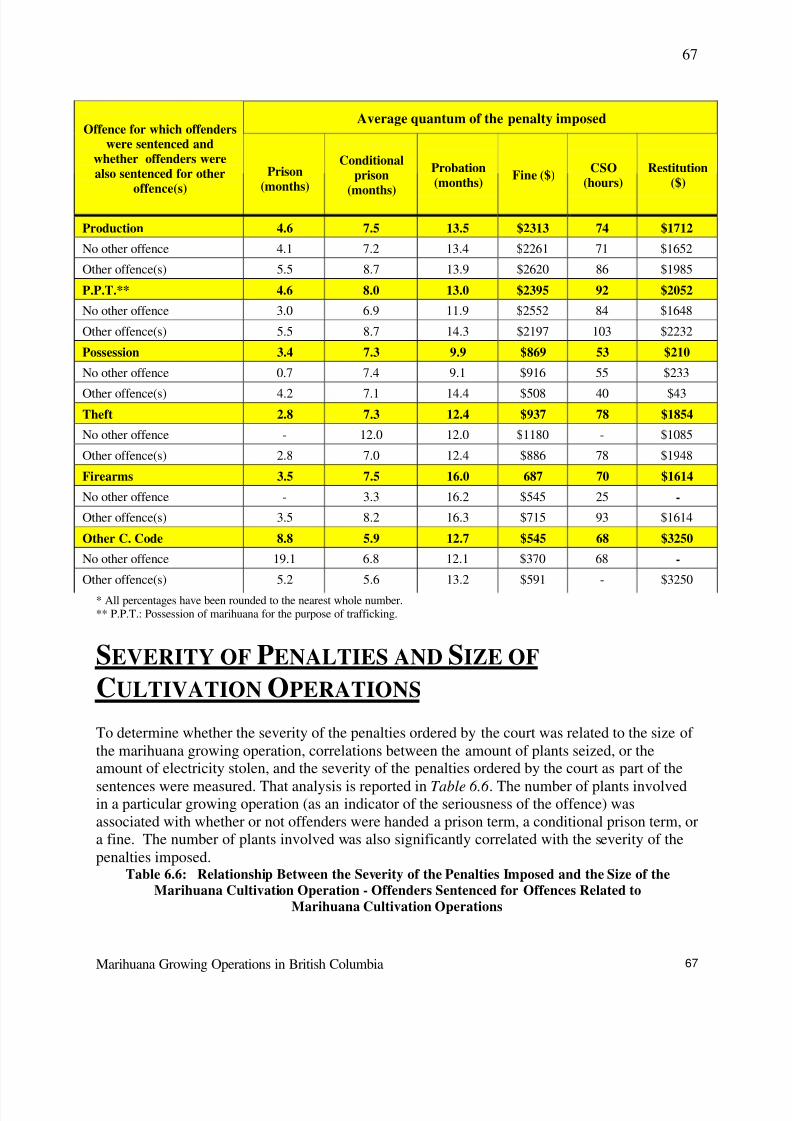
8/9/2019 BC Gro Op Satistics
http://slidepdf.com/reader/full/bc-gro-op-satistics 67/78
Marihuana Growing Operations in British Columbia
67
67
* All percentages have been rounded to the nearest whole number.** P.P.T.: Possession of marihuana for the purpose of trafficking.
SEVERITY OF PENALTIES AND SIZE OF
CULTIVATION OPERATIONS
To determine whether the severity of the penalties ordered by the court was related to the size of the marihuana growing operation, correlations between the amount of plants seized, or theamount of electricity stolen, and the severity of the penalties ordered by the court as part of the
sentences were measured. That analysis is reported in Table 6.6 . The number of plants involvedin a particular growing operation (as an indicator of the seriousness of the offence) wasassociated with whether or not offenders were handed a prison term, a conditional prison term, ora fine. The number of plants involved was also significantly correlated with the severity of thepenalties imposed.
Table 6.6: Relationship Between the Severity of the Penalties Imposed and the Size of theMarihuana Cultivation Operation - Offenders Sentenced for Offences Related to
Marihuana Cultivation Operations
Average quantum of the penalty imposedOffence for which offenders
were sentenced andwhether offenders werealso sentenced for other
offence(s)
Prison(months)
Conditionalprison
(months)
Probation(months)
Fine ($)CSO
(hours)Restitution
($)
Production 4.6 7.5 13.5 $2313 74 $1712
No other offence 4.1 7.2 13.4 $2261 71 $1652
Other offence(s) 5.5 8.7 13.9 $2620 86 $1985
P.P.T.** 4.6 8.0 13.0 $2395 92 $2052
No other offence 3.0 6.9 11.9 $2552 84 $1648
Other offence(s) 5.5 8.7 14.3 $2197 103 $2232
Possession 3.4 7.3 9.9 $869 53 $210
No other offence 0.7 7.4 9.1 $916 55 $233
Other offence(s) 4.2 7.1 14.4 $508 40 $43
Theft 2.8 7.3 12.4 $937 78 $1854
No other offence - 12.0 12.0 $1180 - $1085
Other offence(s) 2.8 7.0 12.4 $886 78 $1948
Firearms 3.5 7.5 16.0 687 70 $1614
No other offence - 3.3 16.2 $545 25 -
Other offence(s) 3.5 8.2 16.3 $715 93 $1614
Other C. Code 8.8 5.9 12.7 $545 68 $3250
No other offence 19.1 6.8 12.1 $370 68 -
Other offence(s) 5.2 5.6 13.2 $591 - $3250
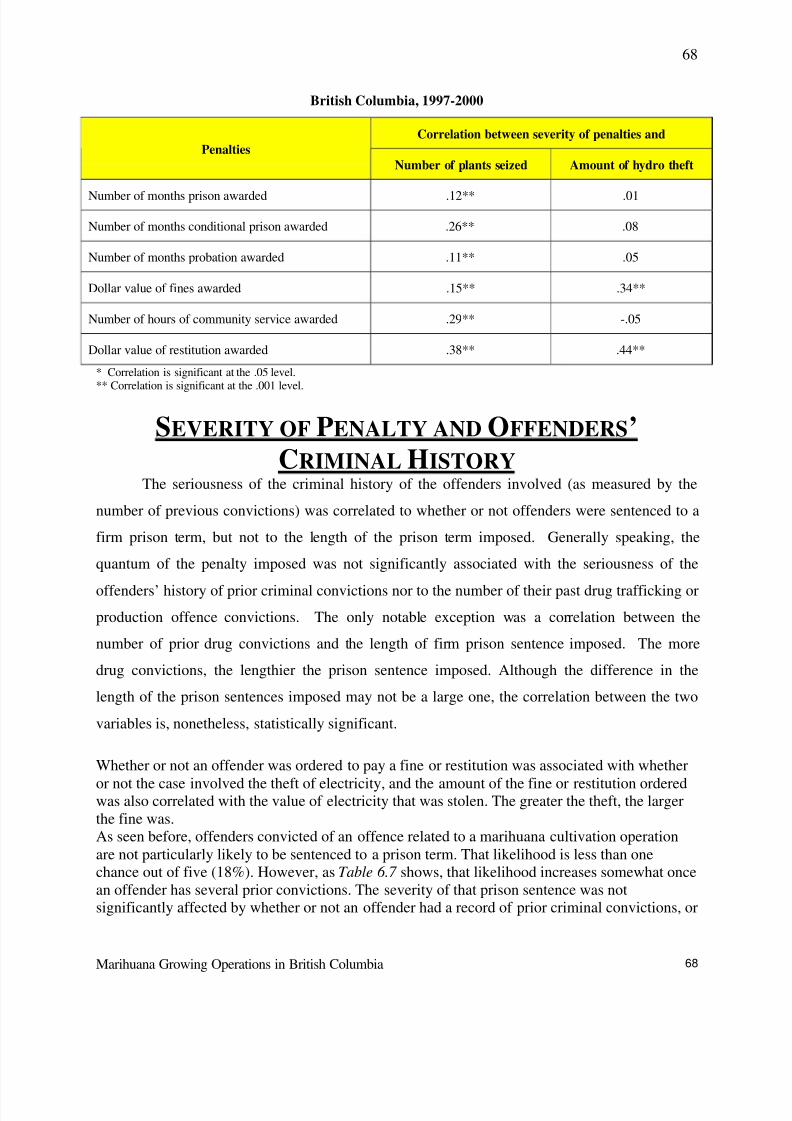
8/9/2019 BC Gro Op Satistics
http://slidepdf.com/reader/full/bc-gro-op-satistics 68/78
Marihuana Growing Operations in British Columbia
68
68
British Columbia, 1997-2000
* Correlation is significant at the .05 level.** Correlation is significant at the .001 level.
SEVERITY OF PENALTY AND OFFENDERS’CRIMINAL HISTORY
The seriousness of the criminal history of the offenders involved (as measured by the
number of previous convictions) was correlated to whether or not offenders were sentenced to a
firm prison term, but not to the length of the prison term imposed. Generally speaking, the
quantum of the penalty imposed was not significantly associated with the seriousness of the
offenders’ history of prior criminal convictions nor to the number of their past drug trafficking or
production offence convictions. The only notable exception was a correlation between the
number of prior drug convictions and the length of firm prison sentence imposed. The more
drug convictions, the lengthier the prison sentence imposed. Although the difference in the
length of the prison sentences imposed may not be a large one, the correlation between the two
variables is, nonetheless, statistically significant.
Whether or not an offender was ordered to pay a fine or restitution was associated with whether
or not the case involved the theft of electricity, and the amount of the fine or restitution orderedwas also correlated with the value of electricity that was stolen. The greater the theft, the largerthe fine was.As seen before, offenders convicted of an offence related to a marihuana cultivation operationare not particularly likely to be sentenced to a prison term. That likelihood is less than onechance out of five (18%). However, as Table 6.7 shows, that likelihood increases somewhat oncean offender has several prior convictions. The severity of that prison sentence was notsignificantly affected by whether or not an offender had a record of prior criminal convictions, or
Correlation between severity of penalties andPenalties
Number of plants seized Amount of hydro theft
Number of months prison awarded .12** .01
Number of months conditional prison awarded .26** .08
Number of months probation awarded .11** .05
Dollar value of fines awarded .15** .34**
Number of hours of community service awarded .29** -.05
Dollar value of restitution awarded .38** .44**
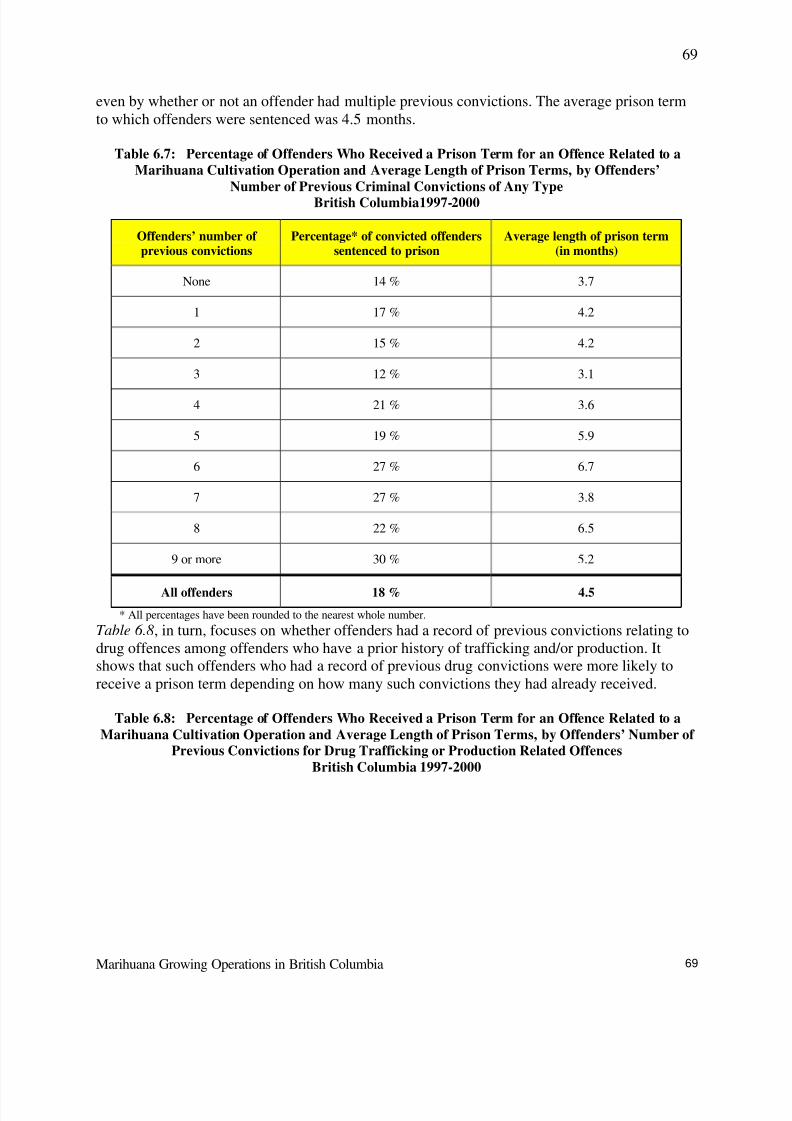
8/9/2019 BC Gro Op Satistics
http://slidepdf.com/reader/full/bc-gro-op-satistics 69/78
Marihuana Growing Operations in British Columbia
69
69
even by whether or not an offender had multiple previous convictions. The average prison termto which offenders were sentenced was 4.5 months.
Table 6.7: Percentage of Offenders Who Received a Prison Term for an Offence Related to aMarihuana Cultivation Operation and Average Length of Prison Terms, by Offenders’
Number of Previous Criminal Convictions of Any TypeBritish Columbia1997-2000
* All percentages have been rounded to the nearest whole number.
Table 6.8, in turn, focuses on whether offenders had a record of previous convictions relating todrug offences among offenders who have a prior history of trafficking and/or production. Itshows that such offenders who had a record of previous drug convictions were more likely toreceive a prison term depending on how many such convictions they had already received.
Table 6.8: Percentage of Offenders Who Received a Prison Term for an Offence Related to aMarihuana Cultivation Operation and Average Length of Prison Terms, by Offenders’ Number of
Previous Convictions for Drug Trafficking or Production Related OffencesBritish Columbia 1997-2000
Offenders’ number of previous convictions
Percentage* of convicted offenderssentenced to prison
Average length of prison term(in months)
None 14 % 3.7
1 17 % 4.2
2 15 % 4.2
3 12 % 3.1
4 21 % 3.6
5 19 % 5.9
6 27 % 6.7
7 27 % 3.8
8 22 % 6.5
9 or more 30 % 5.2
All offenders 18 % 4.5
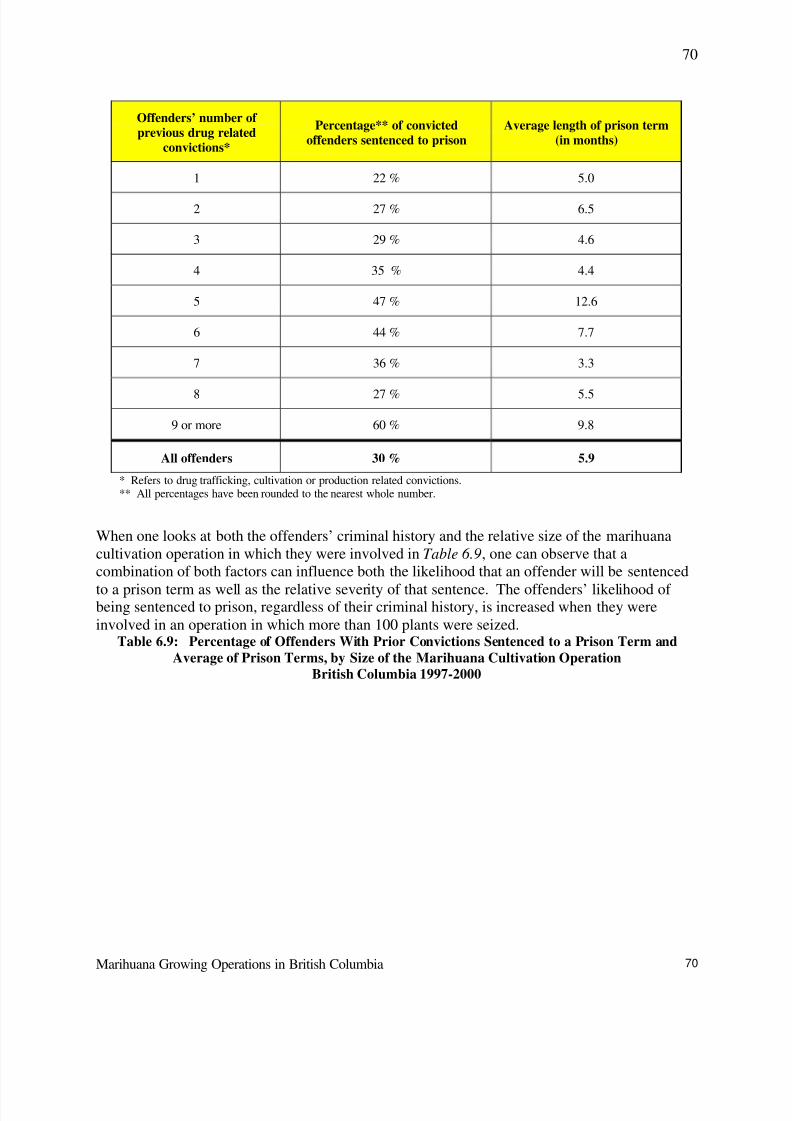
8/9/2019 BC Gro Op Satistics
http://slidepdf.com/reader/full/bc-gro-op-satistics 70/78
Marihuana Growing Operations in British Columbia
70
70
* Refers to drug trafficking, cultivation or production related convictions.** All percentages have been rounded to the nearest whole number.
When one looks at both the offenders’ criminal history and the relative size of the marihuanacultivation operation in which they were involved in Table 6.9, one can observe that acombination of both factors can influence both the likelihood that an offender will be sentenced
to a prison term as well as the relative severity of that sentence. The offenders’ likelihood of being sentenced to prison, regardless of their criminal history, is increased when they wereinvolved in an operation in which more than 100 plants were seized.
Table 6.9: Percentage of Offenders With Prior Convictions Sentenced to a Prison Term andAverage of Prison Terms, by Size of the Marihuana Cultivation Operation
British Columbia 1997-2000
Offenders’ number of previous drug related
convictions*
Percentage** of convictedoffenders sentenced to prison
Average length of prison term(in months)
1 22 % 5.0
2 27 % 6.5
3 29 % 4.6
4 35 % 4.4
5 47 % 12.6
6 44 % 7.7
7 36 % 3.3
8 27 % 5.5
9 or more 60 % 9.8
All offenders 30 % 5.9
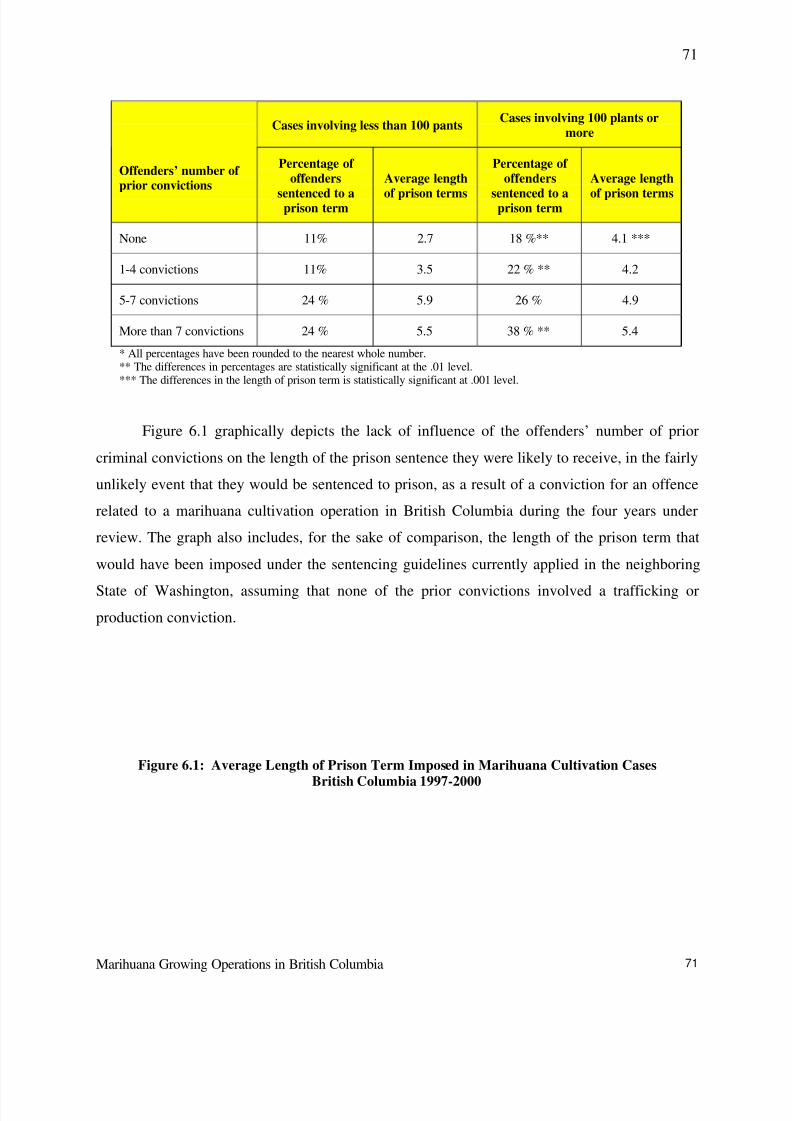
8/9/2019 BC Gro Op Satistics
http://slidepdf.com/reader/full/bc-gro-op-satistics 71/78
Marihuana Growing Operations in British Columbia
71
71
* All percentages have been rounded to the nearest whole number.** The differences in percentages are statistically significant at the .01 level.*** The differences in the length of prison term is statistically significant at .001 level.
Figure 6.1 graphically depicts the lack of influence of the offenders’ number of prior
criminal convictions on the length of the prison sentence they were likely to receive, in the fairly
unlikely event that they would be sentenced to prison, as a result of a conviction for an offence
related to a marihuana cultivation operation in British Columbia during the four years under
review. The graph also includes, for the sake of comparison, the length of the prison term that
would have been imposed under the sentencing guidelines currently applied in the neighboring
State of Washington, assuming that none of the prior convictions involved a trafficking or
production conviction.
Figure 6.1: Average Length of Prison Term Imposed in Marihuana Cultivation Cases
British Columbia 1997-2000
Cases involving less than 100 pantsCases involving 100 plants or
more
Offenders’ number of prior convictions
Percentage of offenders
sentenced to aprison term
Average length
of prison terms
Percentage of offenders
sentenced to aprison term
Average length
of prison terms
None 11% 2.7 18 %** 4.1 ***
1-4 convictions 11% 3.5 22 % ** 4.2
5-7 convictions 24 % 5.9 26 % 4.9
More than 7 convictions 24 % 5.5 38 % ** 5.4
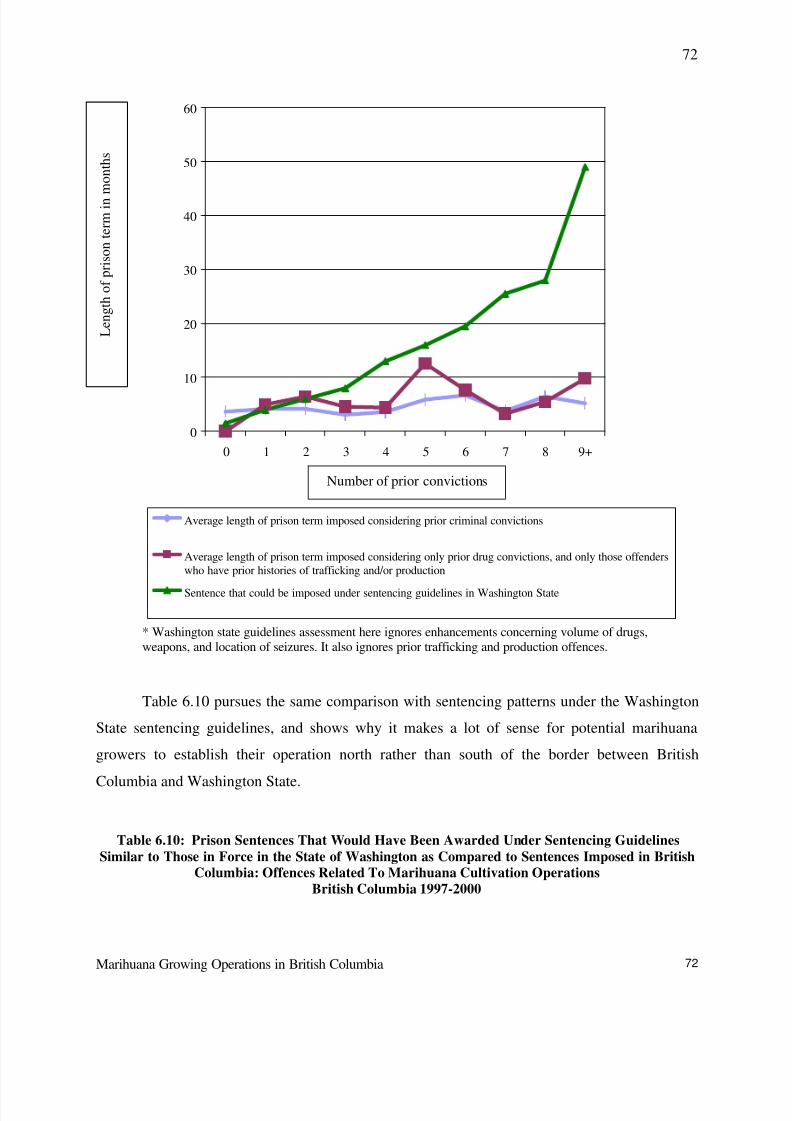
8/9/2019 BC Gro Op Satistics
http://slidepdf.com/reader/full/bc-gro-op-satistics 72/78
Marihuana Growing Operations in British Columbia
72
72
0
10
20
30
40
50
60
0 1 2 3 4 5 6 7 8 9+
Average length of prison term imposed considering prior criminal convictions
Average length of prison term imposed considering only prior drug convictions, and only those offenderswho have prior histories of trafficking and/or production
Sentence that could be imposed under sentencing guidelines in Washington State
* Washington state guidelines assessment here ignores enhancements concerning volume of drugs,weapons, and location of seizures. It also ignores prior trafficking and production offences.
Table 6.10 pursues the same comparison with sentencing patterns under the Washington
State sentencing guidelines, and shows why it makes a lot of sense for potential marihuana
growers to establish their operation north rather than south of the border between British
Columbia and Washington State.
Table 6.10: Prison Sentences That Would Have Been Awarded Under Sentencing GuidelinesSimilar to Those in Force in the State of Washington as Compared to Sentences Imposed in British
Columbia: Offences Related To Marihuana Cultivation OperationsBritish Columbia 1997-2000
Number of prior convictions
L e n g t h o f p r i s o n t e r m i n
m o n t h s
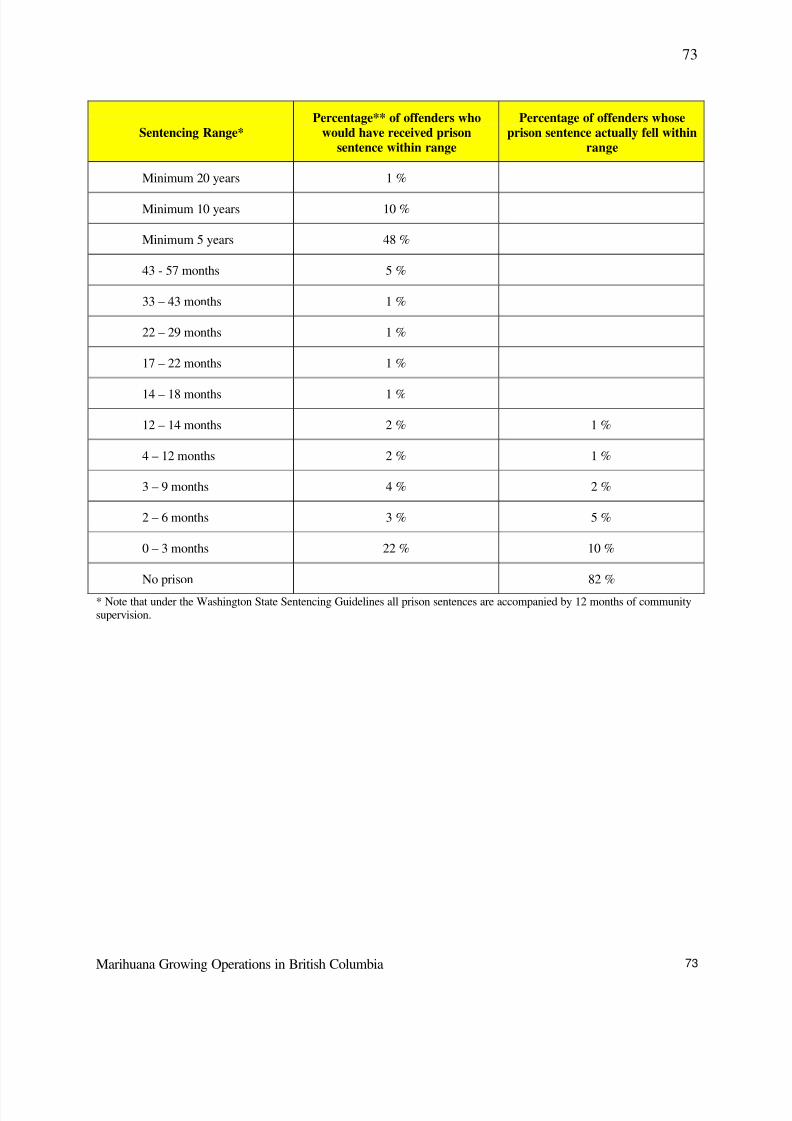
8/9/2019 BC Gro Op Satistics
http://slidepdf.com/reader/full/bc-gro-op-satistics 73/78
Marihuana Growing Operations in British Columbia
73
73
* Note that under the Washington State Sentencing Guidelines all prison sentences are accompanied by 12 months of communitysupervision.
Sentencing Range*Percentage** of offenders who
would have received prisonsentence within range
Percentage of offenders whoseprison sentence actually fell within
range
Minimum 20 years 1 %
Minimum 10 years 10 %
Minimum 5 years 48 %
43 - 57 months 5 %
33 – 43 months 1 %
22 – 29 months 1 %
17 – 22 months 1 %
14 – 18 months 1 %
12 – 14 months 2 % 1 %
4 – 12 months 2 % 1 %
3 – 9 months 4 % 2 %
2 – 6 months 3 % 5 %
0 – 3 months 22 % 10 %
No prison 82 %
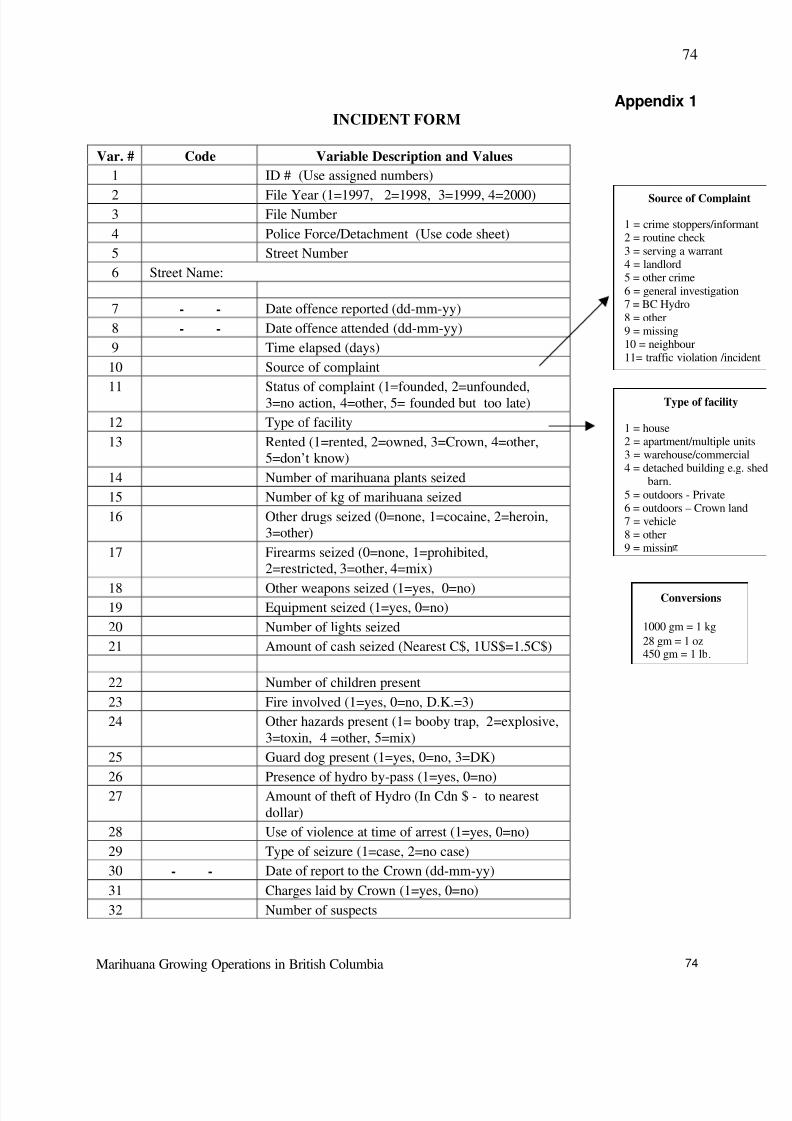
8/9/2019 BC Gro Op Satistics
http://slidepdf.com/reader/full/bc-gro-op-satistics 74/78
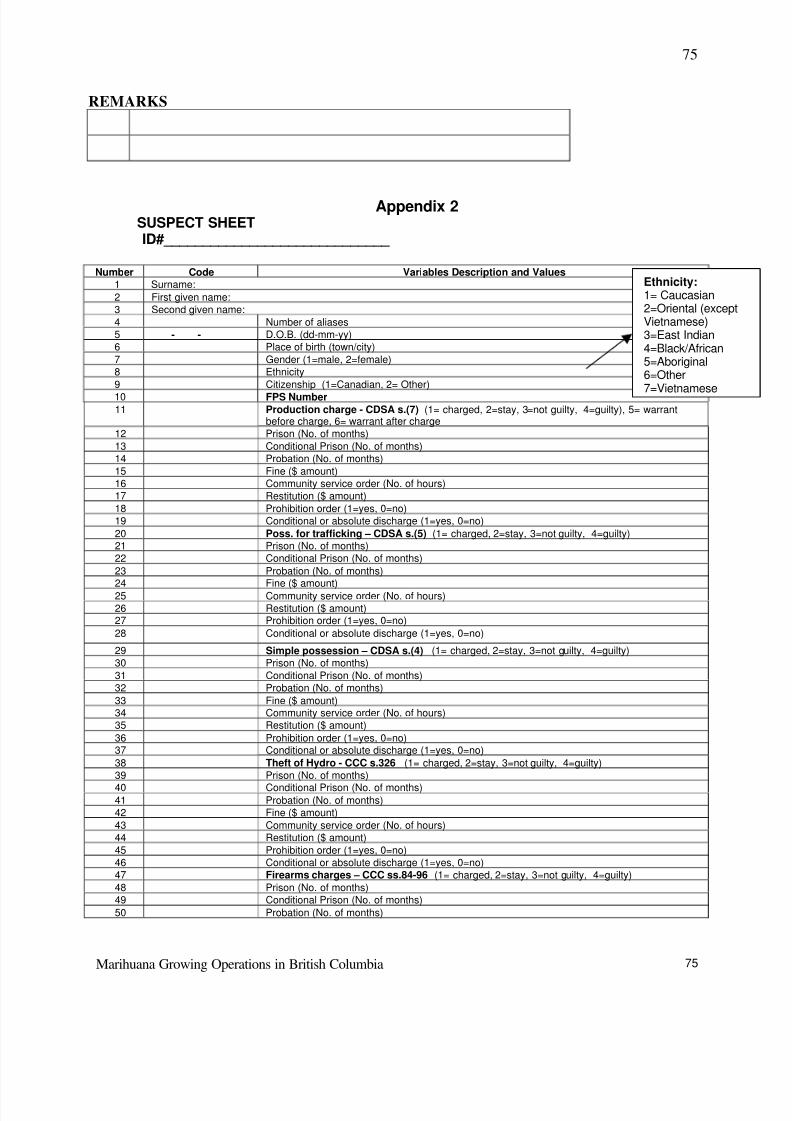
8/9/2019 BC Gro Op Satistics
http://slidepdf.com/reader/full/bc-gro-op-satistics 75/78
Marihuana Growing Operations in British Columbia
75
75
REMARKS
Appendix 2SUSPECT SHEETID#_____________________________
Number Code Variables Description and Values1 Surname:
2 First given name:3 Second given name:4 Number of aliases5 - - D.O.B. (dd-mm-yy)6 Place of birth (town/city)7 Gender (1=male, 2=female)8 Ethnicity9 Citizenship (1=Canadian, 2= Other)
10 FPS Number
11 Production charge - CDSA s.(7) (1= charged, 2=stay, 3=not guilty, 4=guilty), 5= warrantbefore charge, 6= warrant after charge
12 Prison (No. of months)13 Conditional Prison (No. of months)14 Probation (No. of months)15 Fine ($ amount)16 Community service order (No. of hours)17 Restitution ($ amount)18 Prohibition order (1=yes, 0=no)19 Conditional or absolute discharge (1=yes, 0=no)
20 Poss. for trafficking – CDSA s.(5) (1= charged, 2=stay, 3=not guilty, 4=guilty)21 Prison (No. of months)22 Conditional Prison (No. of months)
23 Probation (No. of months)24 Fine ($ amount)
25 Community service order (No. of hours)26 Restitution ($ amount)27 Prohibition order (1=yes, 0=no)
28 Conditional or absolute discharge (1=yes, 0=no)
29 Simple possession – CDSA s.(4) (1= charged, 2=stay, 3=not guilty, 4=guilty)30 Prison (No. of months)31 Conditional Prison (No. of months)32 Probation (No. of months)
33 Fine ($ amount)34 Community service order (No. of hours)35 Restitution ($ amount)
36 Prohibition order (1=yes, 0=no)37 Conditional or absolute discharge (1=yes, 0=no)
38 Theft of Hydro - CCC s.326 (1= charged, 2=stay, 3=not guilty, 4=guilty)39 Prison (No. of months)
40 Conditional Prison (No. of months)41 Probation (No. of months)42 Fine ($ amount)43 Community service order (No. of hours)44 Restitution ($ amount)45 Prohibition order (1=yes, 0=no)46 Conditional or absolute discharge (1=yes, 0=no)47 Firearms charges – CCC ss.84-96 (1= charged, 2=stay, 3=not guilty, 4=guilty)48 Prison (No. of months)49 Conditional Prison (No. of months)
50 Probation (No. of months)
Ethnicity:1= Caucasian2=Oriental (exceptVietnamese)3=East Indian4=Black/African5=Aboriginal6=Other
7=Vietnamese
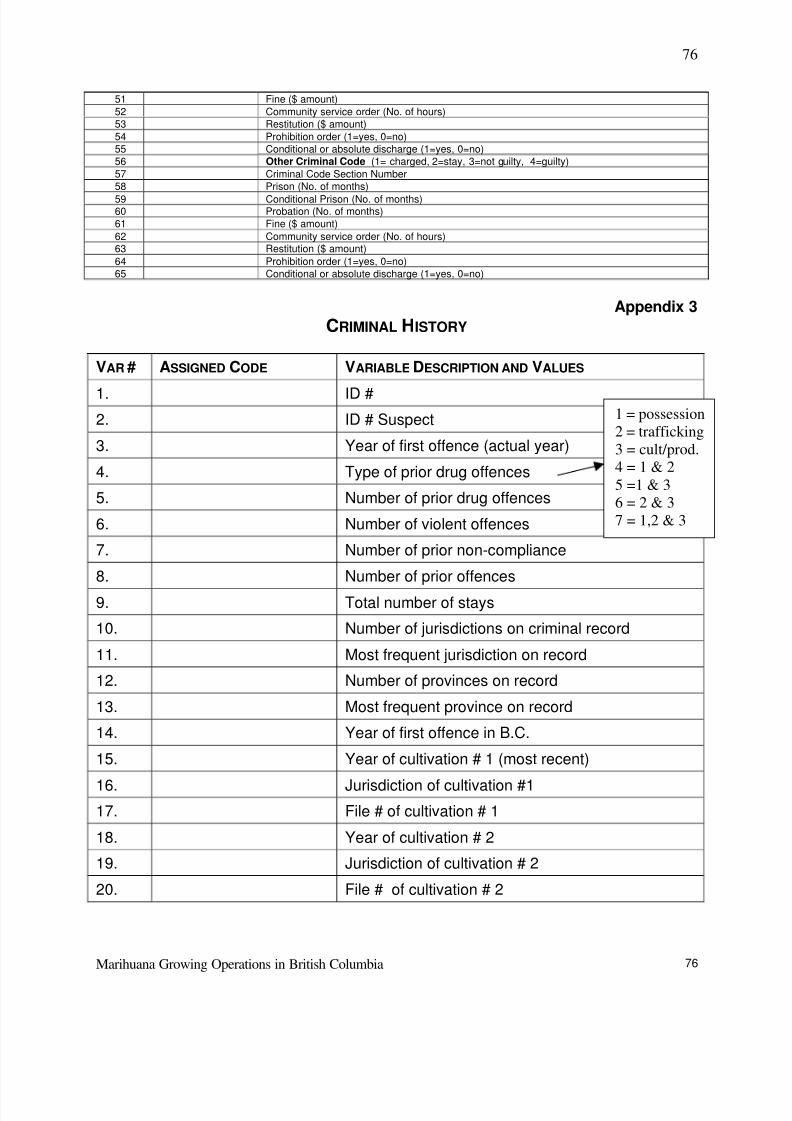
8/9/2019 BC Gro Op Satistics
http://slidepdf.com/reader/full/bc-gro-op-satistics 76/78
Marihuana Growing Operations in British Columbia
76
76
51 Fine ($ amount)52 Community service order (No. of hours)53 Restitution ($ amount)54 Prohibition order (1=yes, 0=no)55 Conditional or absolute discharge (1=yes, 0=no)56 Other Criminal Code (1= charged, 2=stay, 3=not guilty, 4=guilty)57 Criminal Code Section Number58 Prison (No. of months)
59 Conditional Prison (No. of months)60 Probation (No. of months)61 Fine ($ amount)
62 Community service order (No. of hours)63 Restitution ($ amount)
64 Prohibition order (1=yes, 0=no)65 Conditional or absolute discharge (1=yes, 0=no)
Appendix 3
CRIMINAL HISTORY
VAR # ASSIGNED CODE VARIABLE DESCRIPTION AND VALUES
1. ID #
2. ID # Suspect
3. Year of first offence (actual year)
4. Type of prior drug offences
5. Number of prior drug offences
6. Number of violent offences
7. Number of prior non-compliance
8. Number of prior offences
9. Total number of stays
10. Number of jurisdictions on criminal record
11. Most frequent jurisdiction on record
12. Number of provinces on record
13. Most frequent province on record
14. Year of first offence in B.C.
15. Year of cultivation # 1 (most recent)
16. Jurisdiction of cultivation #117. File # of cultivation # 1
18. Year of cultivation # 2
19. Jurisdiction of cultivation # 2
20. File # of cultivation # 2
1 = possession2 = trafficking3 = cult/prod.4 = 1 & 25 =1 & 36 = 2 & 37 = 1,2 & 3
8/9/2019 BC Gro Op Satistics
http://slidepdf.com/reader/full/bc-gro-op-satistics 77/78
Marihuana Growing Operations in British Columbia
77
77
21. Year of cultivation # 3
22. Jurisdiction of cultivation # 3
23. File of cultivation # 3
NOTES
8/9/2019 BC Gro Op Satistics
http://slidepdf.com/reader/full/bc-gro-op-satistics 78/78
78
ACKNOWLEDGEMENTS
This report and the study upon which it is based could not have been completed without the
valuable assistance of many individuals and the organizations they represent. In particular,the International Centre for Criminal Law Reform and Criminal Justice Policy and theDepartment of Criminology and Criminal Justice of the University College of the Fraser Valley,as well as the authors wish to acknowledge those cited below for their valuable contributions tothe success of this project:
• The tireless and dedicated researchers: Janet Beland, Michelle Golden, Vanessa Griffith,Robin Litzenberger, Kathleen McIntosh, and Linda Wunderlich.
• The sworn and civilian members at each of the locations visited for file reviews. This
includes those employees at 130 R.C.M.P. detachments, five R.C.M.P. district drugoffices, and all 12 municipal police departments in British Columbia as well as officersand staff at the Organized Crime Agency of British Columbia. With every visit we foundthat officers and staff went out of their way to facilitate the process and answer anyquestions we had about the nature and extent of grow operations and marihuanatrafficking cases in general.
• Gary Bass, Assistant Commissioner, R.C.M.P. “E” Division, who facilitated theassistance of the R.C.M.P., the Organized Crime Agency of British Columbia and allmunicipal police departments in the province.