bayesian classification
TRANSCRIPT

BAYESIAN CLASSIFICATION
CSE 634 DATA MINING | PROF. ANITA WASILEWSKA

References ● Bayes Theorem : https://www.investopedia.com/terms/b/bayes-theorem.asp ● Bayes Classfication: https://www.tutorialspoint.com/data_mining/dm_bayesian_classification.html ● http://users.sussex.ac.uk/~christ/crs/ml/lec02b.html ● The-Morgan-Kaufmann-Series-in-Data-Management-Systems-Jiawei-Han-Micheline-Kamber-Jian-Pei-Data-Mining.-
Concepts-and-Techniques-3rd-Edition-Morgan-Kaufmann-2011.pdf ● Example of Bayes Classification:
https://mlcorner.wordpress.com/2013/04/28/bayesian-classifier/ ● Data Mining Concepts and Techniques 2nd Edition by Jiawei Han and Micheline Kamber ● Classify mail as spam or ham using Bayes:
https://github.com/varunon9/naive-bayes-classifier ● Applications of Bayes Classification:
https://www.quora.com/In-what-real-world-applications-is-Naive-Bayes-classifier-used ● Sentiment Analysis using Bayes:
http://suruchifialoke.com/2017-06-10-sentiment-analysis-movie/ ● Classify mail using Bayes:
https://medium.com/swlh/classify-emails-into-ham-and-spam-using-naive-bayes-classifier-ffddd7faa1ef

Topics
1) Introduction and Bayes Theorem
2) Naive Bayes Classification
3) Bayesian Belief Networks
4) Applications of Naive Bayes
5) Research Paper - Comparing Bayes
Introduction
● Bayesian classifiers are the statistical classifiers based on Bayes' Theorem
● Bayesian classifiers can predict class membership probabilities i.e. the
probability that a given tuple belongs to a particular class.
● It uses the given values to train a model and then it uses this model
to classify new data
Source : https://www.tutorialspoint.com/data_mining/dm_bayesian_classification.htm
Where is it used?
Source : https://mlcorner.wordpress.com/2013/04/28/bayesian-classifier/

Trying to find the answer
There are only two possible events possible for the given question: A: It is going to rain tomorrow
B: It will not rain tomorrow. If you think intuitively ● It's either going to be raining today or it is NOt going to be raining today ● So technically there is 50% CHANCE OF RAIN tomorrow. Correct?
Source : https://mlcorner.wordpress.com/2013/04/28/bayesian-classifier/

That's too Naive even for Bayes !
Bayesian theorem argues that the probability of an event taking place changes if there is information available about a related event
● This means that if you recall the previous weather conditions for the last week, and you
remember that it has actually rained every single day, your answer will no longer be 50% ● The Bayesian approach provides a way of explaining how you should change your
existing beliefs in the light of new evidence. ● Bayesian rule’s emphasis on prior probability makes it better suited to be applied in a wide
range of scenarios
Source : https://mlcorner.wordpress.com/2013/04/28/bayesian-classifier/
What is Bayes Theorem?
● Bayes' theorem, named after 18th-century British mathematician Thomas Bayes, is a mathematical formula for determining conditional probability
● The theorem provides a way to revise existing predictions or theories given new or additional evidence.
● In finance, Bayes' theorem can be used to rate the risk of lending money to potential borrowers.
Source : https://www.investopedia.com/terms/b/bayes-theorem.asp

Bayes Formula
● The formula for the Bayes theorem is given as follows: ● Bayes' theorem is also called Bayes' Rule or Bayes' Law.
Source : https://www.investopedia.com/terms/b/bayes-theorem.asp

Small Example
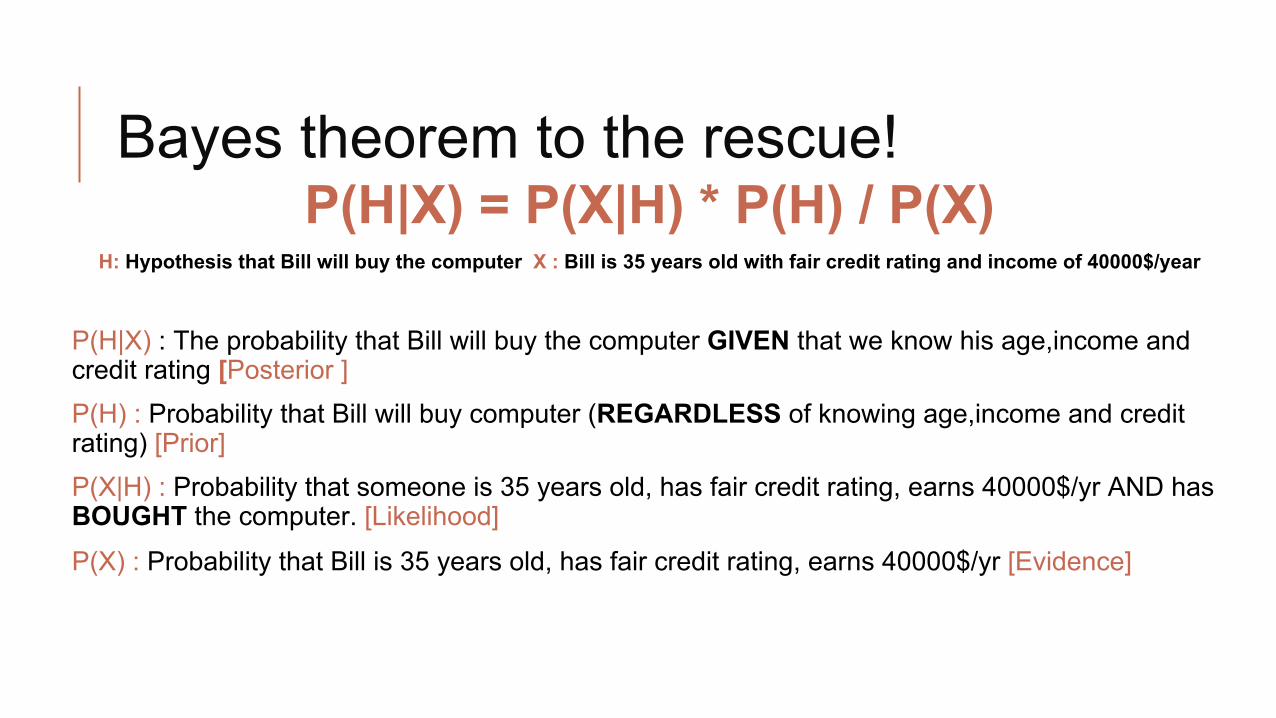
Bayes theorem to the rescue! P(H|X) = P(X|H) * P(H) / P(X)
H: Hypothesis that Bill will buy the computer X : Bill is 35 years old with fair credit rating and income of 40000$/year
P(H|X) : The probability that Bill will buy the computer GIVEN that we know his age,income and credit rating [Posterior ] P(H) : Probability that Bill will buy computer (REGARDLESS of knowing age,income and credit rating) [Prior] P(X|H) : Probability that someone is 35 years old, has fair credit rating, earns 40000$/yr AND has BOUGHT the computer. [Likelihood]
P(X) : Probability that Bill is 35 years old, has fair credit rating, earns 40000$/yr [Evidence]
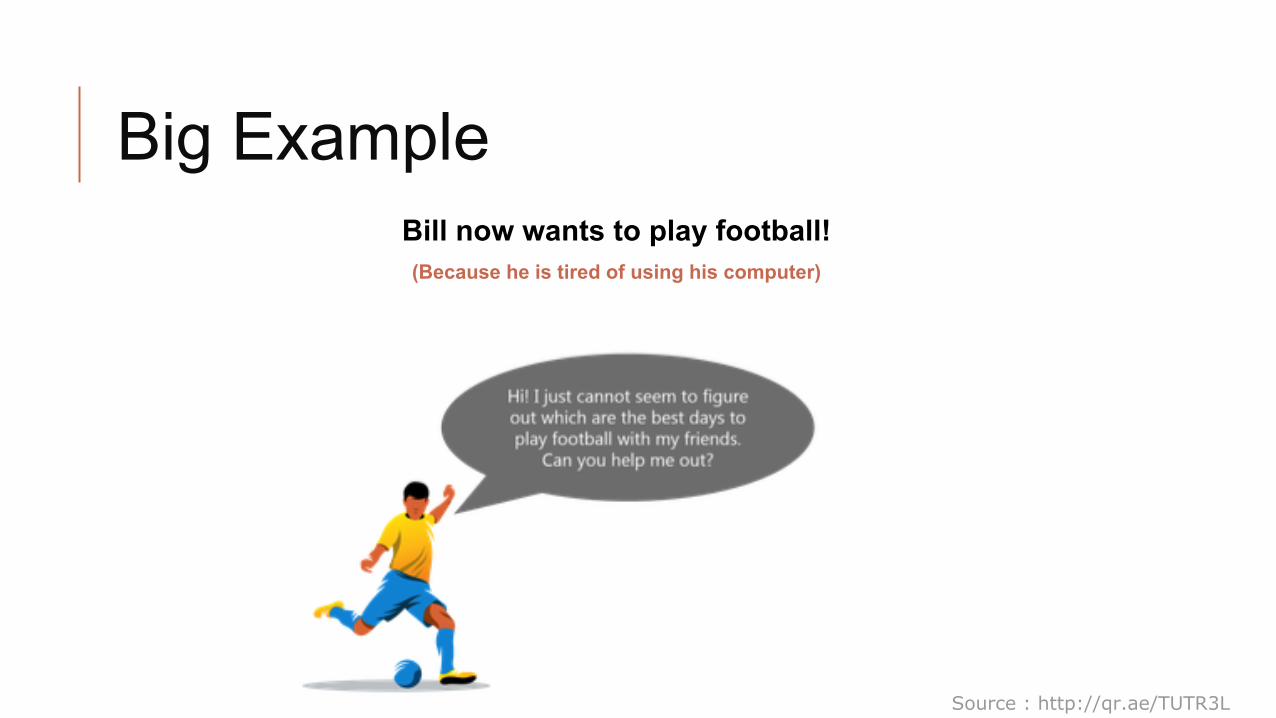
Big Example Bill now wants to play football! (Because he is tired of using his computer)
Source : http://qr.ae/TUTR3L

The Naive Bayes nerd is here!
Source : http://qr.ae/TUTR3L

Lets identify all the factors!
Source : http://qr.ae/TUTR3L

Draw frequency tables for each factor
Source : http://qr.ae/TUTR3L

Find the probability
Source : http://qr.ae/TUTR3L

How to know if results are correct?
The Accuracy of Classification can be found out using a Confusion Matrix

Confusion Matrix ● True Positives (TP): number of positive examples, labeled as such.
● False Positives (FP): number of negative examples, labeled as positive.
● True Negatives (TN): number of negative examples, labeled as such.
● False Negatives (FN): number of positive examples, labeled as negative.
Source :https://rasbt.github.io/mlxtend/user_guide/evaluate/confusion_matrix/

Finding accuracy of classification
Accuracy = (TP + TN)/(TP + TN + FP + FN)
Accuracy gives us the result of total correct predictions out of all the predictions
Precision: TP/(TP + FP) Precision answers the following question: Out of all the examples the classifier labeled as positive, what fraction were correct?
Recall : TP/(TP + FN)
Recall answers: out of all the positive examples there were, what fraction did the classifier pick up?
Source :https://tryolabs.com/blog/2013/03/25/why-accuracy-alone-bad-measure-classification-tasks-and-what-we-can-do-about-it/

● The Homo apriorius establishes the probability of an hypothesis, no matter what data tell. ● The Homo pragamiticus establishes that it is interested by the data only. ● The Homo frequentistus measures the probability of the data given the hypothesis. ● The Homo sapients measures the probability of the data and of the hypothesis. ● The Homo bayesianis measures the probability of the hypothesis, given the data.
Source : http://www.brera.mi.astro.it/~andreon/inference/Inference.html

Just because...
http://www3.cs.stonybrook.edu/~cse634/L3ch6classification.pdf

What are Bayesian Classifiers?
● Statistical classifiers. ● Predict class membership probabilities, such as the probability that a
given tuple belongs to a particular class. ● Based on Bayes’ theorem
● Exhibits high accuracy and speed when applied to large databases.
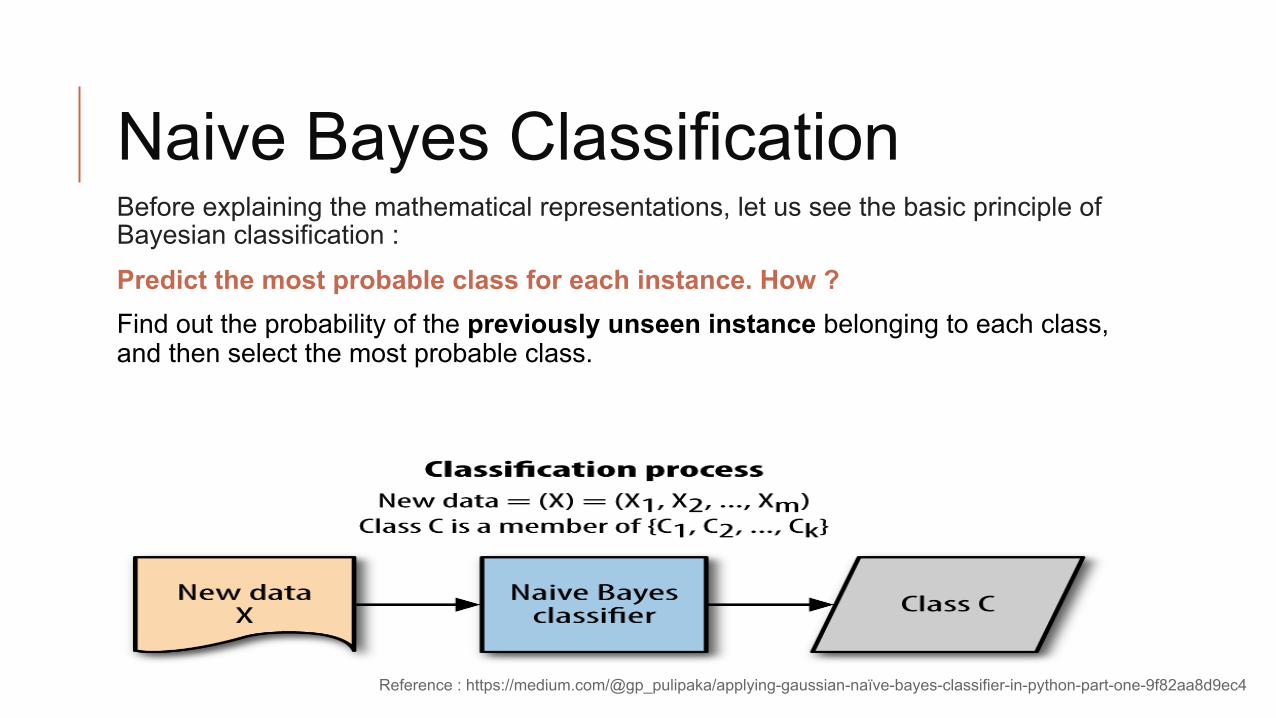
Naive Bayes Classification Before explaining the mathematical representations, let us see the basic principle of Bayesian classification :
Predict the most probable class for each instance. How ? Find out the probability of the previously unseen instance belonging to each class, and then select the most probable class.
Reference : https://medium.com/@gp_pulipaka/applying-gaussian-naïve-bayes-classifier-in-python-part-one-9f82aa8d9ec4

Naive Bayes Classification
A Naive Bayes Classifier is a program which predicts a class value given a set of set of attributes. For each known class value, ● Calculate probabilities for each attribute, conditional on the class value. ● Use the product rule to obtain a joint conditional probability for the
attributes. ● Use Bayes rule to derive conditional probabilities for the class variable.
Once this has been done for all class values, output the class with the highest probability.

Model Parameters
For the Bayes classifier, we need to “learn” two functions, the likelihood and the prior.
Reference :http://blog.datumbox.com/machine-learning-tutorial-the-naive-bayes-text-classifier/

Model Parameters ● Instance Attributes :
Instances are represented as a vector of attributes.
● Let there are ‘m’ classes :
● Classification is to derive the maximum posteriori, ie maximal P(Ci|X) ● The likelihood now becomes
This affects the number of model parameters.
Model Parameters
The problem with explicitly modeling P(X1,…,Xn|Y) is that there are usually
way too many parameters:
● We’ll run out of space
● We’ll run out of time
● And we’ll need tons of training data (which is usually not available)
● It is computationally expensive to evaluate P(X|Ci )

Conditional Independence
● A Naive Bayes Classifier assumes that attributes are conditionally independent given the class.
ie, each feature is conditionally independent of every other feature for a particular class label. This reduces the number of model parameters.
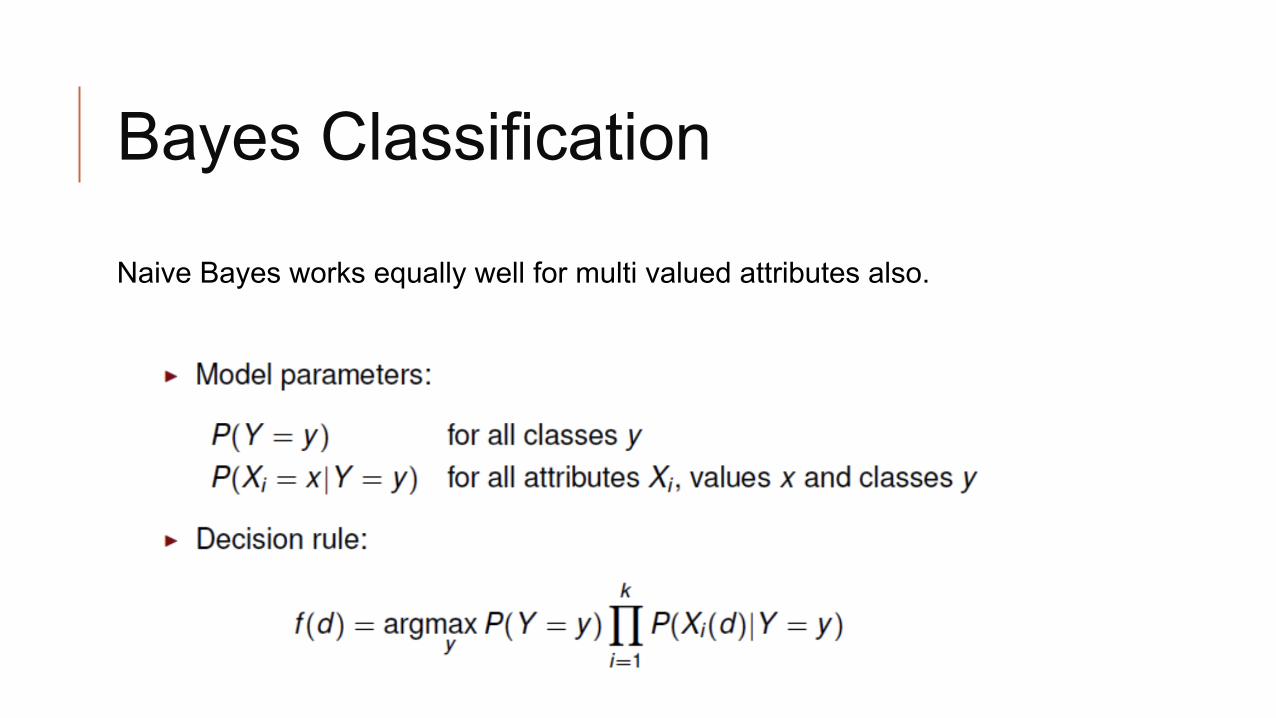
Bayes Classification Naive Bayes works equally well for multi valued attributes also.

“Zero” Problem
What if there is a class, Ci and X has an attribute Xk such that none of the samples in Ci has that attribute value?
In that case P(xk|Ci ) = 0, which results in P(X|Ci ) =0 even though P(xk|Ci ) for all the other attributes in X may be large.
“Zero” Problem - Remedy ● The class conditional probability can be re-estimated with the ‘m-
estimate’ : m is the number of virtual samples ~ upto 1% of training example
● Using the Laplacian correction to avoid computing probability values of
zero. Here we have 1 more tuple for each attribute-class pair. The “corrected” probability estimates are close to their “uncorrected” counterparts, yet the zero probability value is avoided.

Numeric Underflow Problem
● What’s nice about Naïve Bayes is that it returns probabilities. These probabilities can tell us how confident the algorithm is.
● Since we are multiplying these probabilities, it could lead to a floating -point underflow.
● So it is better to sum logs of probabilities rather than multiplying probabilities
Bayesian Belief Networks ● Naive Bayesian classifier assumes class conditional independence ● This assumption simplifies computation ● When this assumption is true, Naive Bayesian classifier is the most
accurate in comparison with all other classifiers ● However, dependencies can exist between variables ● Bayesian Belief Networks makes no class conditional
independence assumption – improvement over Naive Bayesian classifier

Bayesian Belief Networks ● Specifies joint conditional probability distributions ● Allows class conditional independencies to be defined between
subsets of variables ● Provides graphical model of causal relationships ● Trained Bayesian Belief Networks can be used for classification ● Also known as Belief Networks, Bayesian Networks and
Probabilistic Networks

Bayesian Belief Networks ● Defined by two components
1. A Directed Acyclic Graph 2. Set of conditional probability tables
● Each node in the DAG represents a random variable (Discrete or Continuous valued)
● Each node may correspond to actual attributes given in the data or to “hidden variables” believed to form a relationship
● Each edge represents a probabilistic dependence

Bayesian Belief Networks ● If there is an edge from node Y to a node Z, then Y is a parent or
immediate predecessor of Z, and Z is a descendant of Y
● Each variable is conditionally independent of its non-descendants in the graph, given its parents

Bayesian Belief Networks
● A simple Bayesian Belief Network
Reference: Data Mining Concepts and Techniques 2nd Edition by Jiawei Han and Micheline Kamber, Page 316
Bayesian Belief Networks
● Has Conditional Probability Table (CPT) for each variable ● CPT for a variable Y specifies the conditional distribution
P(Y | Parents(Y)), where Parents(Y) are the parents of Y
● From previous example:
P(LungCancer = yes | FamilyHistory = yes, Smoker = yes) = 0.8 P(LungCancer = no | FamilyHistory = no, Smoker = no) = 0.9

Bayesian Belief Networks ● Let X = (x1,..., xn) be a data tuple described by the
variables or attributes Y1,..., Yn respectively ● P(x1,..., xn) is the probability of a particular combination
of values of X, and the values for P(xi | Parents(Yi)) correspond to the entries in the CPT for Y
Bayesian Belief Networks ● A node within the network can be selected as an output node,
representing a class label attribute ● There may be more than one output node ● Various algorithms for learning can be applied to the network ● Rather than returning a single class label, the classification process
can return a probability distribution that gives the probability of each class

Bayesian Belief Networks - Training Case 1
● Network topology is given in advance ● Human experts have knowledge of the conditional dependencies
which helps in designing the network ● Experts specifies conditional probabilities for the nodes that
participate in direct dependencies ● There are various methods for training the belief network ● Example: Gradient Descent

Bayesian Belief Networks - Training Case 2
● Network topology is inferred from data ● There are several algorithms for learning the topology from the
training data given observable variables ● The problem is one of Discrete Optimization

Naive Bayes in Real Life
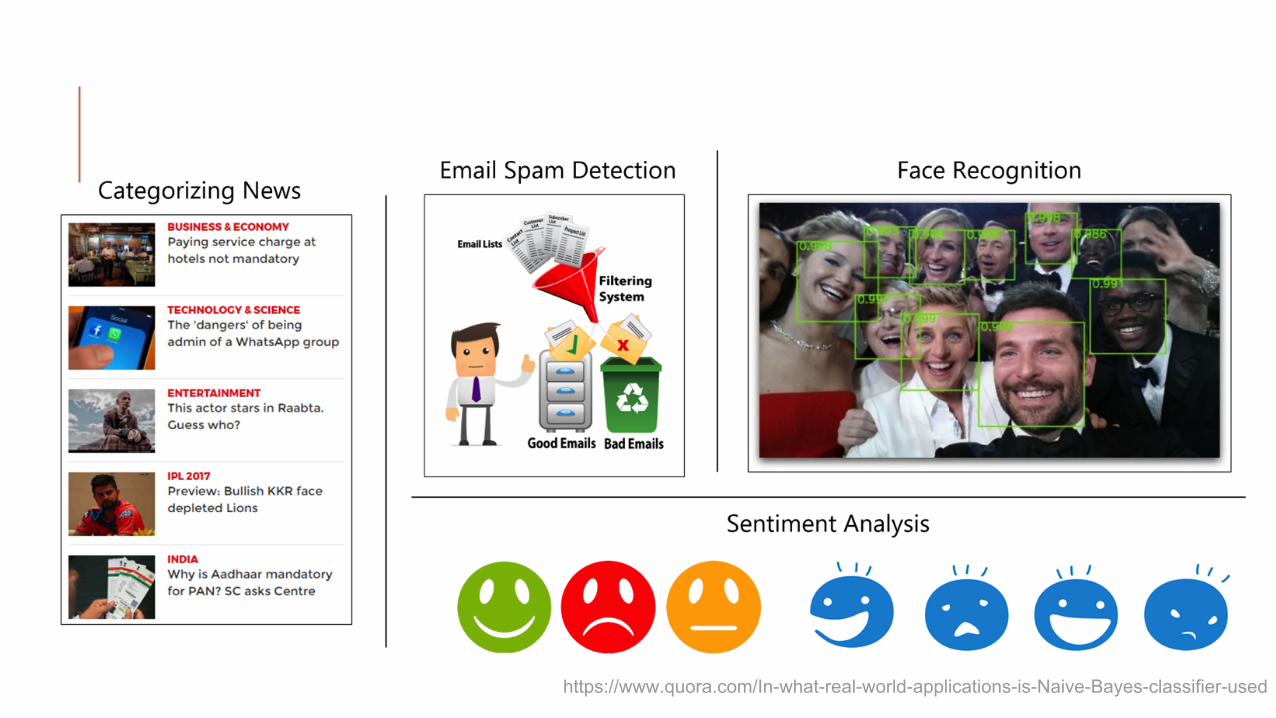
https://www.quora.com/In-what-real-world-applications-is-Naive-Bayes-classifier-used

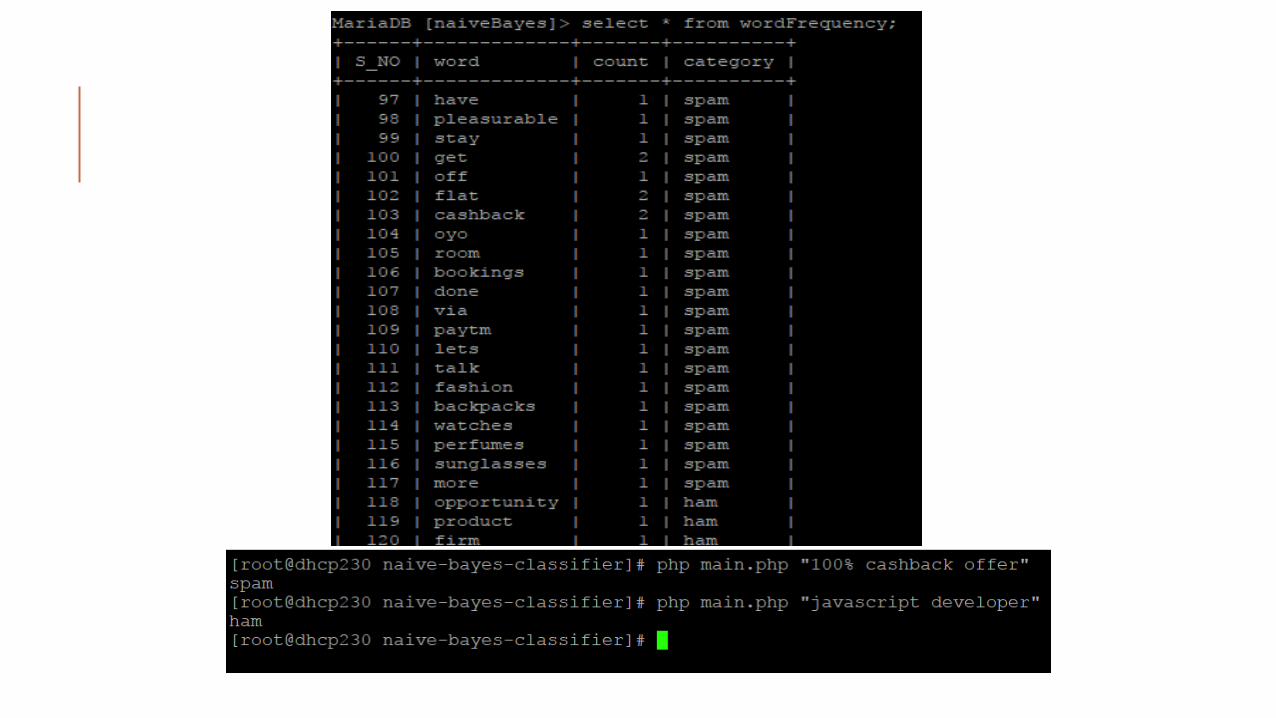
Text classification:
● Naive Bayes Classifier application.
● Why Text Classification? ○ Classify web pages by topic ○ Learning which articles are of interest ○ Information extraction ○ Internet filters.
https://www.slideshare.net/ashrafmath/naive-bayes-15644818
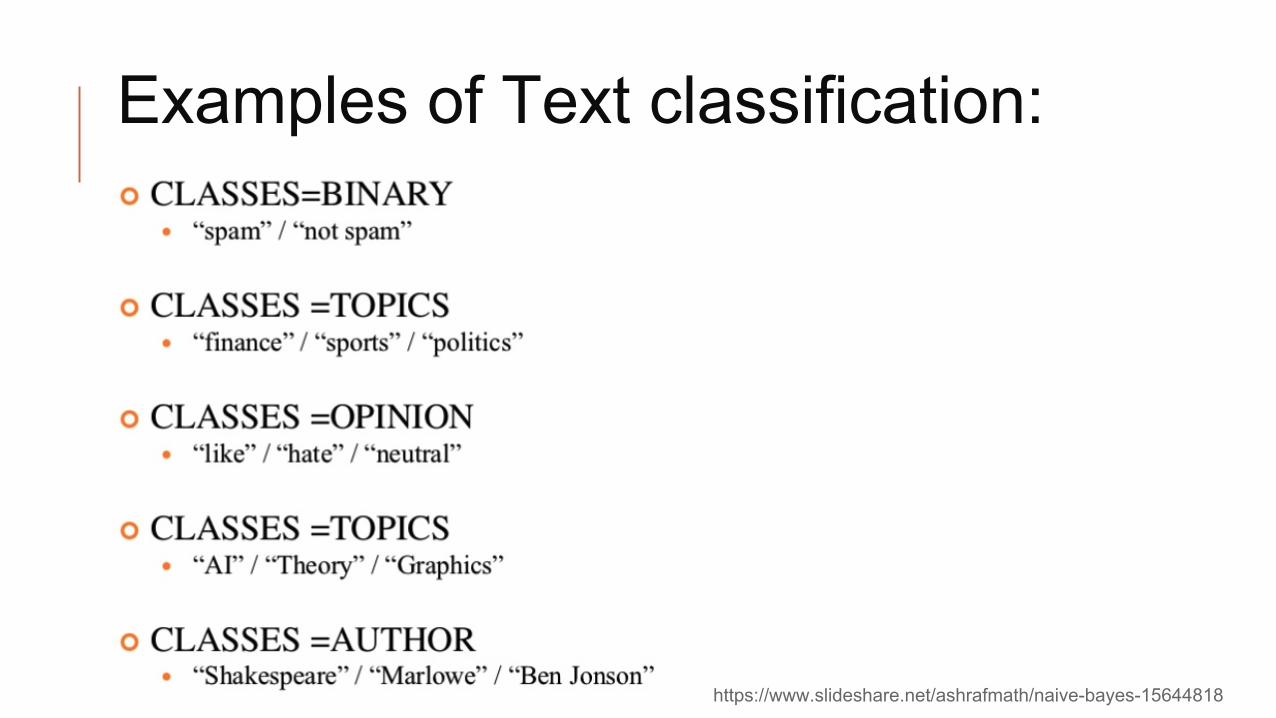
Examples of Text classification:
https://www.slideshare.net/ashrafmath/naive-bayes-15644818
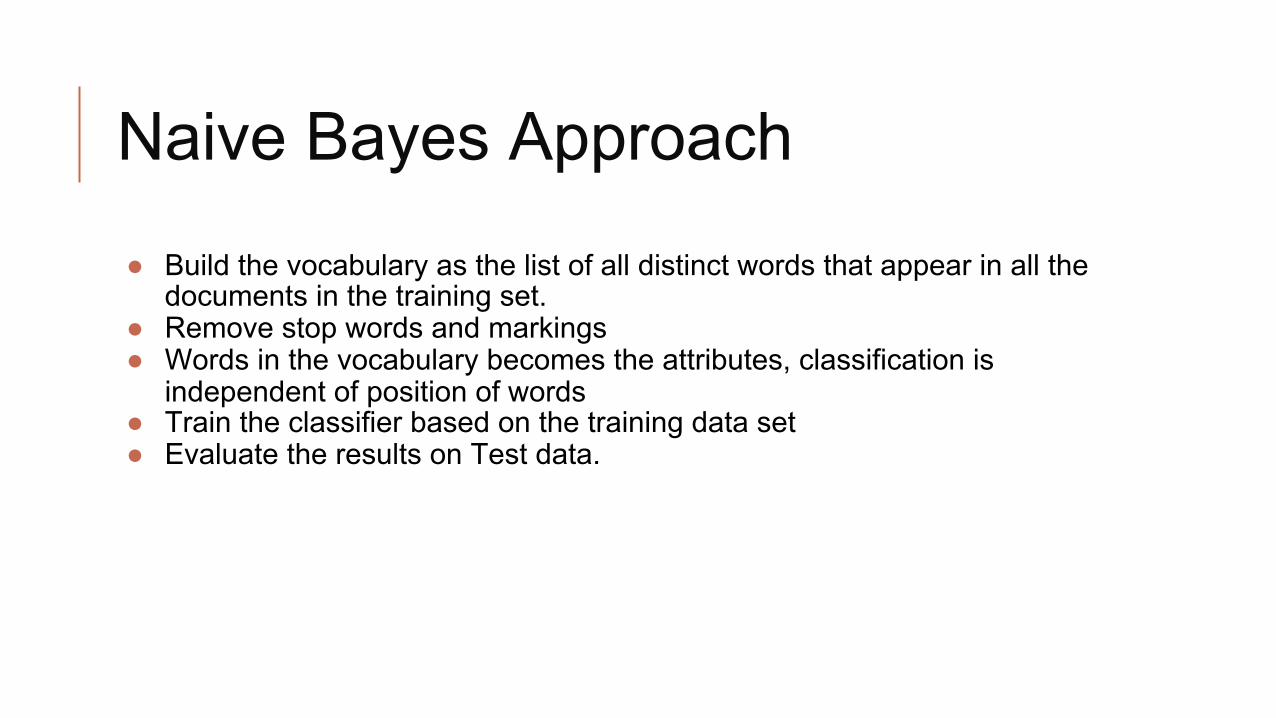
Naive Bayes Approach
● Build the vocabulary as the list of all distinct words that appear in all the documents in the training set.
● Remove stop words and markings ● Words in the vocabulary becomes the attributes, classification is
independent of position of words ● Train the classifier based on the training data set ● Evaluate the results on Test data.


Advantages: ● Requires a small amount of training data to estimate the parameters. ● Good results obtained in most cases ● Easy to implement
Disadvantages: ● Practically, dependencies exist among variables.
eg: hospitals : patients: Profile: age, family history etc. Symptoms: fever, cough etc., Disease: lung cancer, diabetes, etc. ● Dependencies among these cannot be modelled by Naive bayesian
classifier.

Recommendation System:
Weather prediction:
https://www.quora.com/In-what-real-world-applications-is-Naive-Bayes-classifier-used http://suruchifialoke.com/2017-06-10-sentiment-analysis-movie

https://www.quora.com/In-what-real-world-applications-is-Naive-Bayes-classifier-used

PART 2 Research Paper

Research Paper
Title : Improved Study of Heart Disease Prediction System using Data Mining Classification Techniques Authors : Chaitrali S. Dangare & Sulabha S. Apte, PhD Journal : International Journal of Computer Applications (0975 – 888) Volume 47– No.10 Publishing Period : June 2012
Abstract
● Bayes Network has been present since time immemorial. For years, it proved to be a simple yet powerful classifier that could be used for prediction.
● The computation power required to run a bayesian classifier is considerately simpler when compared to most of the modern day classification algorithms.
● This paper debates the use of bayesian classifier along with IDT and NN and their usage in a Heart Disease Prediction System in the medical field.

We have used a cutting edge classifier to look into your medical report and analyse you. It is our new innovation.
So,What Does it Say ?
Source: bigstock-healthcare-technology-and-med-83203256.jpg

That You are Pregnant ! Are You Serious !
Classifiers are Important !!! Source: bigstock-healthcare-technology-and-med-83203256.jpg
Data Set Used
● The publicly available heart disease database is used. ● The Cleveland Heart Disease database consists of 303
records & Statlog Heart Disease database consists of 270 records .
● The data set consists of 3 types of attributes: Input, Key & Predictable attribute
● The analysis was performed on 13 attributes initially followed by 2 more attributes separately.

Attribute Description Value
age age 1 = male 0 = female
sex male or female 1 = typical type 1 2 = typical type agina 3 = non-agina pain 4 = asymptomatic
cp chest pain Continuous value in mm hg
thestbps resting blood pressure
Continuous value in mm/dl
chol serum cholestrol Continuous value in mm/dl
restecg rest ecg results 0 = normal 1 = having_ST_T wave abnormal 2 = left ventricular hypertrophy
fbs fasting blood sugar
1 ≥ 120 mg/dl 0 ≤ 120 mg/dl
thalach max heart rate Continuous value
exang exercise induced agina
0= no 1 = yes
Attribute Description Value
oldpeak ST depression induced by exercise relative to rest
Continuous value
solpe Slope of the peak exercise
1 = unsloping 2 = flat 3 = ownsloping
ca Number of major vessels colored by floursopy
0-3 value
thal Defect type 3 = normal 6 = fixed 7 = reversible defect
Attribute Description Value
obes obesity 1 = yes 0 = no
smoke smoking 1= past 2 = current 3 = never
Table 2.1 Primary Attributes
Table 2.1 Additional Attributes

Performing Naive Bayes :
● Naive Bayes classifier is based on Bayes theorem. ● This classifier algorithm uses conditional independence.
(NAIVE !) ● Let X={x1 , x2 , ....., xn} be a set of n attributes. ● In Bayesian, X is considered as evidence and H be some hypothesis
means, the data of X belongs to specific class C. ● We have to determine P (H|X), the probability that the hypothesis H holds
given evidence i.e. data sample X. ● According to Bayes theorem the P (H|X) is expressed as
P(H|X) = P (X| H) P (H) / P (X)

Performance Actual Output/Prediction a ( has heart disease ) b ( no heart disease )
a ( has heart disease ) TP TN
b ( no heart disease ) FP FN
Confusion Matrix
a b
a 110 5
b 10 145
a b
a 100 7
b 18 145
a b
a 123 4
b 5 138
a b
a 85 0
b 1 185
a b
a 117 0
b 2 151
a b
a 106 0
b 0 164
bayes classifier Decision Trees Neural Networks
source : http://citeseerx.ist.psu.edu/viewdoc/download?doi=10.1.1.258.8158&rep=rep1&type=pdf | Figure 3-6
13 Attributes
15 Attributes
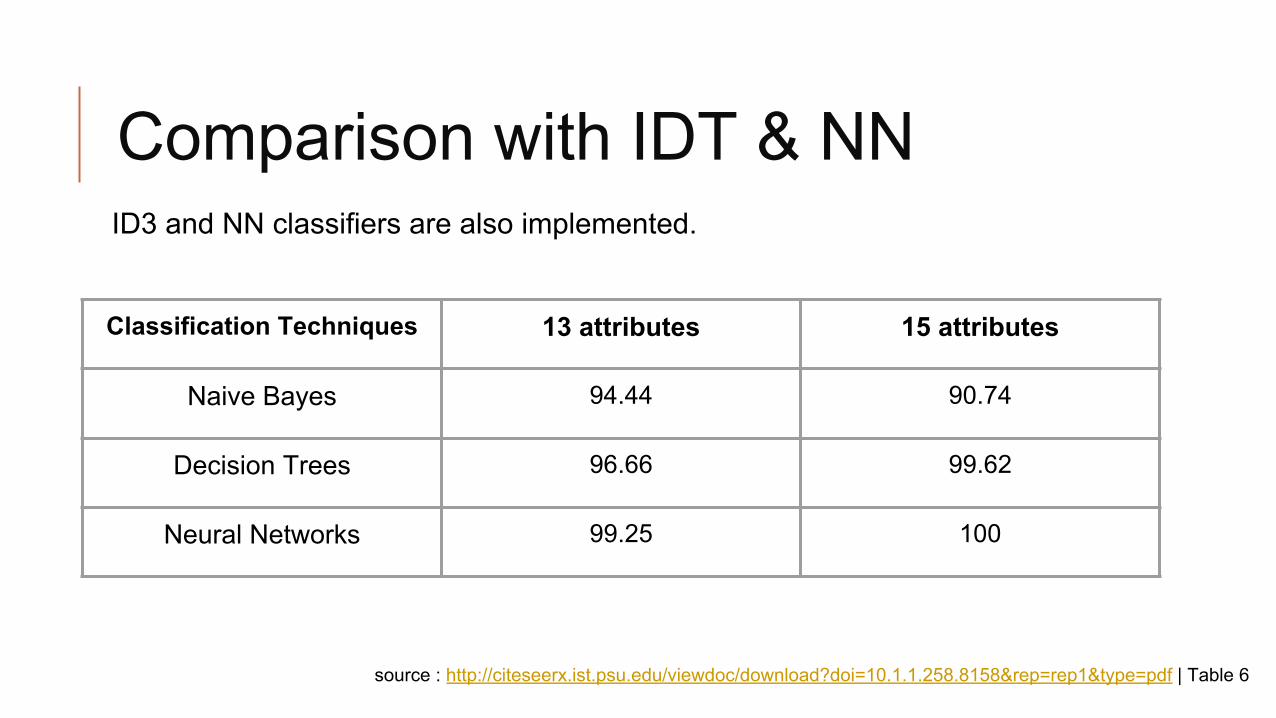
Comparison with IDT & NN
Classification Techniques 13 attributes 15 attributes
Naive Bayes 94.44 90.74
Decision Trees 96.66 99.62
Neural Networks 99.25 100
source : http://citeseerx.ist.psu.edu/viewdoc/download?doi=10.1.1.258.8158&rep=rep1&type=pdf | Table 6
ID3 and NN classifiers are also implemented.

Prediction Accuracy - 13 attributes
- 15 attributes
source : http://citeseerx.ist.psu.edu/viewdoc/download?doi=10.1.1.258.8158&rep=rep1&type=pdf | Figure 2

Conclusion
● The overall objective of the work is to predict more accurately the presence of heart disease.
● It has been seen that Neural Networks provides accurate results as compared to Decision trees & Naive Bayes.
● Naive Bayes has a serious drawback where the events are considered mutually independent of each other.
● In Real life, it is very much difficult for events to be exclusively unrelated and naive bayes fails to make use of the correlation.
● However given the compute power required ,it is a reasonably efficient classifier.

FREE COMPUTE POWER !!!
Source : https://i.ytimg.com/vi/E7myDAKBgRs/maxresdefault.jpg
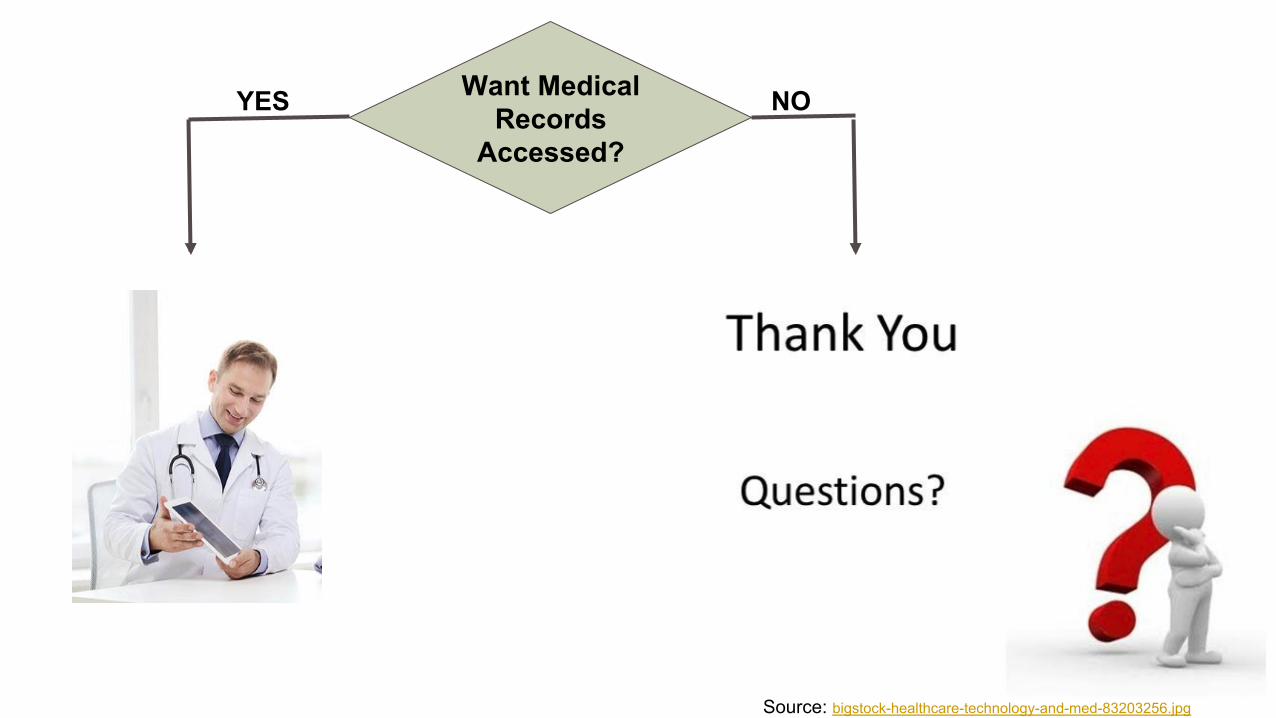
Want Medical Records
Accessed?
YES NO
Source: bigstock-healthcare-technology-and-med-83203256.jpg