back-to-college survey 2016 infographic
TRANSCRIPT
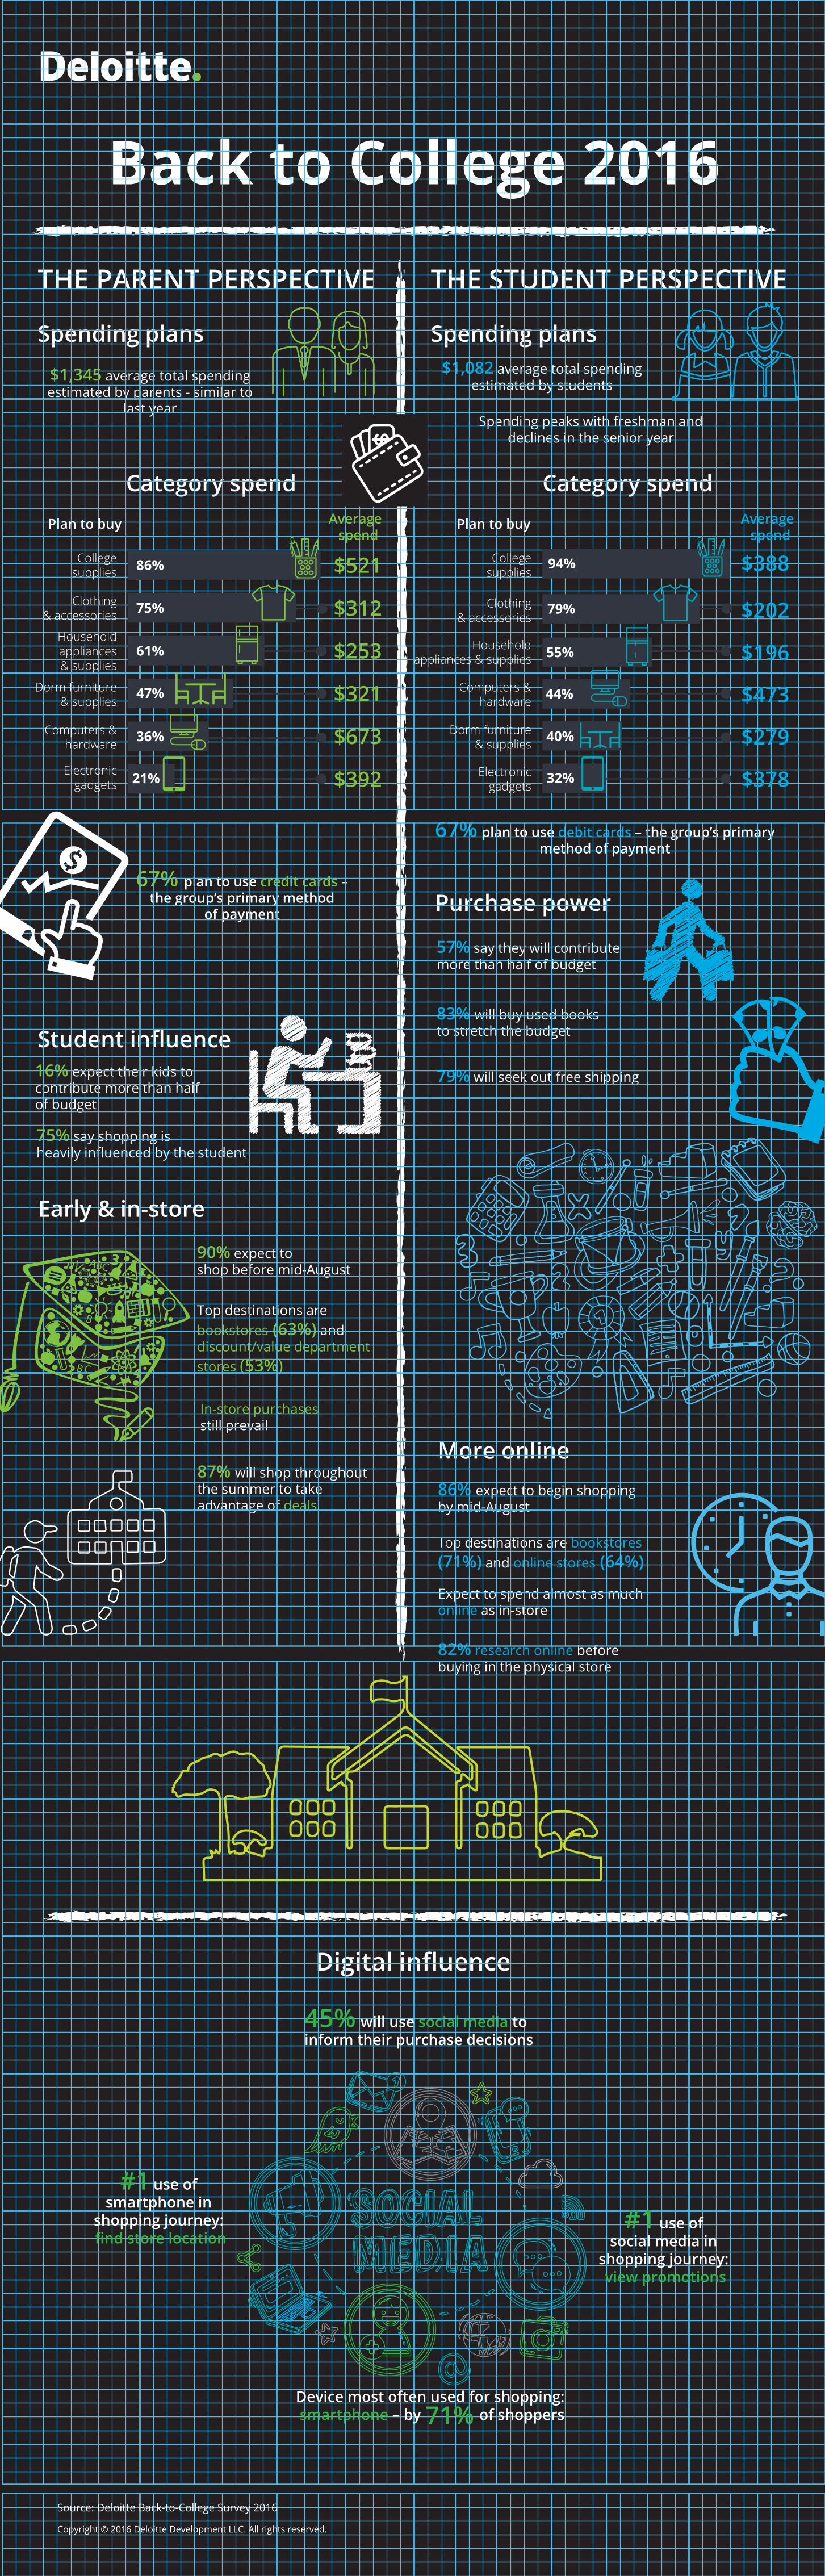
Spending plans Spending plans
Student influence
More online
THE PARENT PERSPECTIVE THE STUDENT PERSPECTIVE
Category spend Category spend
Purchase power
Digital influence
Back to College 2016
$1,345 average total spending estimated by parents - similar to
last year
$1,082 average total spending estimated by students
Spending peaks with freshman and declines in the senior year
67% plan to use debit cards – the group’s primary method of payment
67% plan to use credit cards – the group’s primary method
of payment
16% expect their kids to contribute more than half of budget
57% say they will contribute more than half of budget
75% say shopping is heavily influenced by the student
83% will buy used books to stretch the budget
90% expect to shop before mid-August
Top destinations are bookstores (63%) and discount/value department stores (53%)
86% expect to begin shopping by mid-August
In-store purchases still prevail
Top destinations are bookstores (71%) and online stores (64%)
Expect to spend almost as much online as in-store
82% research online before buying in the physical store
79% will seek out free shipping
87% will shop throughout the summer to take advantage of deals
Early & in-store
86%College supplies $521
$312
$253
$321
$673
$392
$388
$202
$196
$473
$279
$378
75%Clothing & accessories
61%Household appliances & supplies
47%Dorm furniture & supplies
36%Computers & hardware
21%Electronic gadgets
Plan to buy Averagespend
Plan to buy Averagespend
Electronic gadgets 32%
Dorm furniture & supplies 40%
Computers & hardware 44%
Household appliances & supplies 55%
Clothing & accessories
79%
College supplies
94%
Copyright © 2016 Deloitte Development LLC. All rights reserved.
Source: Deloitte Back-to-College Survey 2016
#1 use of smartphone in
shopping journey: find store location
45% will use social media to inform their purchase decisions
#1 use of social media in
shopping journey: view promotions
Device most often used for shopping: smartphone – by of shoppers71%