avalanche dynamics field observations, full-scaletests...
TRANSCRIPT

Avalanche Dynamics
Field observations, full-scale tests, laboratory investigations and numericalmodelling of snow avalanches in Switzerland
Betty Sovilla*, Marc Christen, Francois Dufour, Urs Gruber, Martin Kern, Margherita Maggioni, FelixTiefenbacher, Barbara Turnbull and Perry Bartelt.
Federal Institute for Snow and Avalanche Research (SLF), Davos Dorf, Switzerland
Abstract: There are still many unresolved questions in snow avalanche dynamics. This was apparent during thecatastrophic avalanche Winter of 1999. In this paper we overview on-going avalanche dynamics research at theSwiss Federal Institute for Snow and Avalanche Research. Field observations, full-scale tests and laboratoryinvestigations are used in combination graphical information systems and numerical modelling to improve ourunderstanding of the basic physical processes in both flowing and powder snow avalanches. Present research topicsinclude mass balance and snow cover entrainment, avalanche release frequency, granular flow dynamics, powderavalanche initiation, avalanche interaction with defense structures and numerical modelling of mixed avalanchesfrom initiation to runout.
Keywords: flowing avalanches, powder avalanches, chute experiments, optical velocity sensors, capacitancedensity probes, velocity profiles, radar, mass balance, snow cover entrainment, numerical modelling..
•
1. Introduction
A sound knowledge of snow avalanche dynamics isfundamental to develop efficient protection methodsagainst avalanches. Both land planning (hazard maps)and passive defense measures (snow sheds, deflectingdarns, breaking mounds) require estimating avalancherunout distances, flow velocities and impact pressures.The increasing demands for information and basicmethodologies (models) requires a basic understandingof the flow dynamics of both flowing and powderavalanches.
The evaluation of the avalanche winter 1999 inSwitzerland revealed the as yet unanswered questions ofavalanche dynamics (Gruber, 2000a and 2000b). Inparticular:
a) better estimating the size and fracture heights ofavalanche release zones.
b) the conditions of powder cloud formation or thevertical density and velocity profiles within the powderavalanche.
c) the interaction of dense and powder avalancheswith defence structures and the dependence of theimpact forces on the flow velocity and density .
Corresponding author address:Betty Sovilla, Federal Institute for Snow and AvalancheResearch (SLF), Fliielastrasse II, CH-7260 DavosDorf, Switzerland, tel: +41814170263; fax: +41814170111; email: [email protected]
71
d) the influence of entrainment and depositionprocesses on avalanche motion. As a consequence ofthe avalanche winter 1999 the avalanche dynamics teamof the Swiss Federal Institute for Snow and AvalancheResearch intensified the effort to collect data from realscale avalanches.
At Vallee de la Sionne avalanche test site (Ammann,1999) a 20 metre high pylon was equipped with newmeasurement devices to determine the avalanchevelocity, density, flow height and pressure.
Experiments at a 34 meters long chute wereperformed to determine avalanche velocity profiles.
Photograrnmetric, radar and manual techniquesallowed the determination of the avalanche mass ofnumerous avalanches.
On the basis of the collected information a newmixed numerical model with entrainment wasdeveloped.
2. Internal flow velocity and densityprofiles
2.1 Optical Sensors
To measure the vertical velocity profile inside theavalanche we installed optical sensors on the 20 metrehigh pylon of the Vallee de la Sionne test site. A newgeneration of optical sensors based on the designoriginally proposed at Montana State University (Dent1997) was developed. The optical sensor consists ofthree photo diode/photo transistor pairs. The photo
International Snow Science Workshop (2002: Penticton, B.C.)
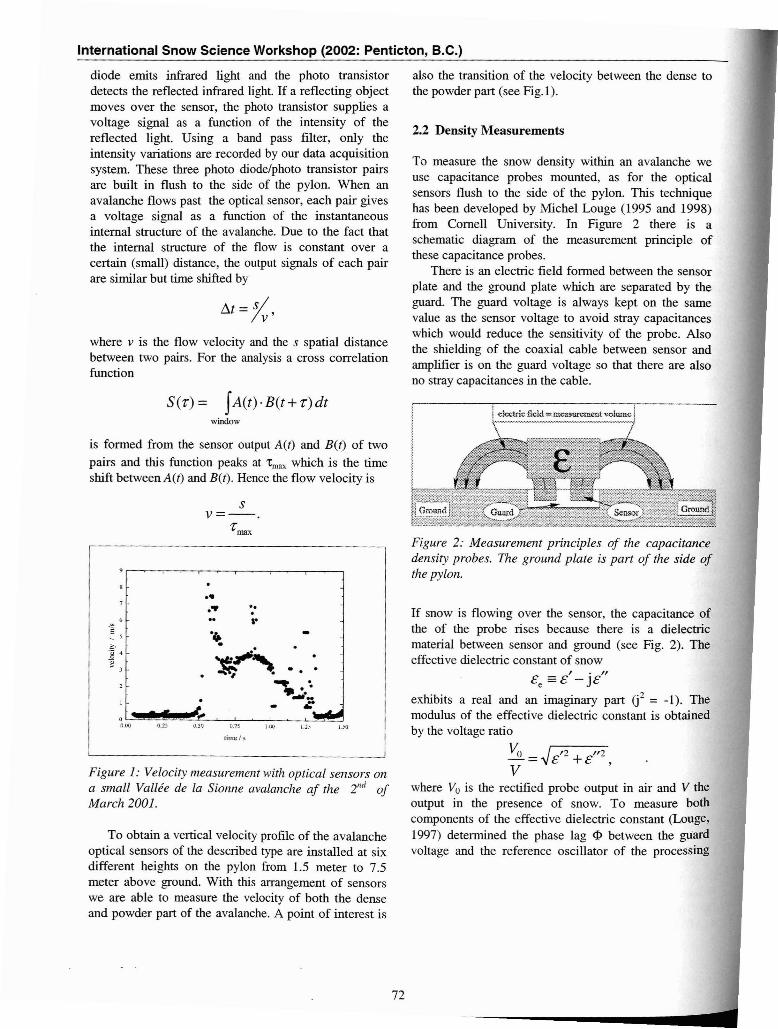
Figure 2: Measurement principles of the capacitancedensity probes. The ground plate is part of the side ofthe pylon.
also the transition of the velocity between the dense tothe powder part (see Fig. i).
2.2 Density Measurements
To measure the snow density within an avalanche weuse capacitance probes mounted, as for the opticalsensors flush to the side of the pylon. This techniquehas been developed by Michel Louge (i995 and 1998)from Cornell University. In Figure 2 there is aschematic diagram of the measurement principle ofthese capacitance probes.
There is an electric field formed between the sensorplate and the ground plate which are separated by theguard. The guard voltage is always kept on the samevalue as the sensor voltage to avoid stray capacitanceswhich would reduce the sensitivity of the probe. Alsothe shielding of the coaxial cable between sensor andamplifier is on the guard voltage so that there are alsono stray capacitances in the cable.
I ."£e =£ - J£
exhibits a real and an imaginary part (j2 = -i). Themodulus of the effective dielectric constant is obtainedby the voltage ratio
Vo =~£'2 + £//2V '
where Vo is the rectified probe output in air and V theoutput in the presence of snow. To measure bothcomponents of the effective dielectric constant (Louge,i997) determined the phase lag <I> between the gliardvoltage and the reference oscillator of the processing
If snow is flowing over the sensor, the capacitance ofthe of the probe rises because there is a dielectricmaterial between sensor and ground (see Fig. 2). Theeffective dielectric constant of snow
72
".r
limt:/s
."••
is formed from the sensor output A(t) and B(t) of twopairs and this function peaks at 'tmax which is the timeshift between A(t) and B(t). Hence the flow velocity is
S(T)= fA(t).B(t+T)dtwindow
where v is the flow velocity and the s spatial distancebetween two pairs. For the analysis a cross correlationfunction
D.t = sllv'
diode emits infrared light and the photo transistordetects the reflected infrared light. If a reflecting objectmoves over the sensor, the photo transistor supplies avoltage signal as a function of the intensity of thereflected light. Using a band pass filter, only theintensity variations are recorded by our data acquisitionsystem. These three photo diode/photo transistor pairsare built in flush to the side of the pylon. When anavalanche flows past the optical sensor, each pair givesa voltage signal as a function of the instantaneousinternal structure of the avalanche. Due to the fact thatthe internal structure of the flow is constant over acertain (small) distance, the output signals of each pairare similar but time shifted by
sv=--
Tmax
Figure 1: Velocity measurement with optical sensors ona small Vallee de la Sionne avalanche af the 2nd ofMarch 2001.
To obtain a vertical velocity profile of the avalancheoptical sensors of the described type are installed at sixdifferent heights on the pylon from 1.5 meter to 7.5meter above ground. With this arrangement of sensorswe are able to measure the velocity of both the denseand powder part of the avalanche. A point of interest is

"Itan <1>1 =~.
c
electronics. Using amplifiers of the company Capacitec1
we have
The capacitance probes we use are run with a oscillatorfrequency of 16 kHz. In this frequency range thefunction te(p) depends also on the microstructure of thesnow. Thus, we need to calibrate the capacitance probeto the actual snow conditions using a snow press asdescribed in (Louge, 1997).
Figure 3: As the optical sensors for measuring theavalanche velocity, the capacitance density probes areintegrated flush to the side of the pylon. The electronicsof the optical sensors and the capacitance densityprobes are located behind the aluminium plates.
In the Vallee de la Sionne avalanche test site two typesof capacitance probes are installed: one probe tomeasure the density of the flowing part of the avalancheand one for the powder part. The difference between thetwo types is the geometry of the probes. The one for thepowder part has a much bigger measurement volumebecause the densities of the powder cloud are smallerthan the density of the dense part. To achieve acomparable sensitivity of the probe, the measurementvolume of the powder probe must be increased (seeFig.3).
2.3 Relation between pressure density e velocity
On the front side of the pylon in Vallee de la Sionnenine pressure sensors are installed on different heights,from 1.5 meters to 10 meters above ground. Anotherone is mounted at the top of the pylon at a height of 19
,Capacitec, PO Box 819, 87 Fitchburg Road, Ayer,
MA 01432, USA
73
Avalanche Dynamics
m (Schaer, 2001) (see Fig. 4). The comparison of thepressure data with the speed profiles and densityprofiles should allow the important correlation betweenthese three parameters. Although pressures have beenrecorded, to prove the correlation between density,velocity and pressure more data must be collected.
Figure 4: On the front of the pylon there are mountedimpact pressure sensors on different height withdifferent diameters (from 5 cm up to 25 cm).
2.4 Chute experiments
In the following, experiments on the Weissfluhjochsnow chute are briefly outlined. The Weissfluhjochchute was built in the early 1960ies for impact forcemeasurements (Salm, 1964 and Issler, 1999) and islocated 2663 m a.s.l. beside the old SLF building atWeissfluhjoch, Davos.
The chute was partly destroyed by extraordinary largesnow loads during the catastrophic winter 199912000. Inthe time from 2000-2002, the chute was reconstructedand equipped with optical velocity sensors (see § 2.1)and a basal friction measurement system. The chute hasa total length of 25 m and is 2.5 m wide. Its inclinationcan be varied between 35° and 45°. Up to 25m3 of snowcan be stored in the upper part of the chute and bereleased by opening the release gate.

International Snow Science Workshop (2002: Penticton, B.C.)
3.1 Avalanche mass balance
8567
velocity' (m/s)
4
flow structure to get an idea of possible constitutivelaws governing the snow flow behaviour. A betterknowledge about the constitutive behaviour of flowingsnow will be an important step towards more realisticnumerical modelling of snow flow avalanches.
At present, measurements along the avalanche path arethe only possibility to determine mass and volumevariations in flowing avalanches. This information iscollected by means of field measurements and/or usingmore sophisticated but not necessarily more precisetechniques such as photogrammetry or orthophotoanalysis.
Field measurements allow only the avalanche massto be determined. However, it should be observed thatnot only the avalanche mass is important but also itsdistribution inside the avalanche can substantiallymodify the avalanche dynamics.
Therefore, additional measurement are collected tofind the distribution of the avalanche mass. Arepresentative parameter concerning the avalanche massdistribution has been obtained by measuring theavalanche flow depth distribution.
For flowing avalanches, the entrainment process ismainly controlled by the interaction between avalancheand snow cover. The avalanche mass variation is relatedto the forces exerted by the avalanche on the snowcover. These forces control the erosion rate, theentrainment location and influence the avalanchemotion. To achieve information about this process radartechniques and field experiments have been used.
3. Avalanche mass balance
Figure 6. Example for the time evolution of velocityprofiles.
74
Figure 5: Side view of the chute lifted up to aninclination angle of45°.
In order to achieve a turbulent, avalanchellike flow ofthe snow in the chute, the bottom is roughened byrubbers bars. The rubber bars cover the lower part ofthe chute and are collectively linked to piezoelectricforce sensors to get an idea of the basal friction forces.
The motivation for the large scale chute experimentsis, on one hand, to have the possibility to examine theinternal flow structure of reproducable avalanche-likesnow flows, and, on the other hand, to clear the questionof how far real avalanche flow problems may be scaleddown to granular model flows with similar Froudenumbers. The validation of scaling laws is importantwhen studying the interaction of snow avalanches withbreaking structures. (Hakonard6ttir, 2001 andHakonard6ttir, 2002). Another important application ofthe experimental chute, is to test newly developedmeasuring techniques (velocity and density sensors,radar) on real snow flows, before they are placed in thefield.
The velocity profiles measured by a linear sensorarrangement perpendicular to the flow direction at theside wall of the chute are similar to the ones found inlittle real snow flow avalanches (Dent, 1997). This is ahint to the chute being an appropriate instrument togenerate reproducable avalanche-like snow flows. Anexample of velocity profiles measured on the chute isprovided in Figure 6.
Furthermore, measurements on the effectivity ofdifferent shaped dams and retarding structures wereperformed on the chute. The effectivity of the structureswas derived from the analysis of snow flow velocities infront of and behind the breaking structures.
Summarizing, the Weissfluhjoch chute is a powerfultool to generate reproducale, avalanche-like snow flows,which are analyzed with respect to the internal snow

3.2 Avalanche mass
The techniques used for determining the avalanche massare divided into two main sections: a) Fieldmeasurements and b) Photograrnmetric measurements.
In general, field observations allow a more detailedand accurate definition of the avalanche mass but theyrequire a large amount of manual work in very difficultconditions. This analysis is suitable for smallavalanches where the average volume is of the order offew thousand cubic meters and where safety conditionallow the avalanche path to be entered (for detailedinformation see Sovilla (2001)).
For large avalanches, where the avalanche volumecan reach millions of cubic meters, photogrammetrictechniques are used. This technology has two mainadvantages: measurements can be performed withoutentering the path and very large areas and volumes canbe mapped without much effort. On the other hand, allinformation concerning the snow cover i.e. stratigraphy,densities, etc., can not be collected with sufficientdetail, as in the manual method. A second problem isdue to the difficulties in applying the photograrnmetricmethod to a snow surface.
Figure 7: Catastrophic winter 1999. Jungstafelavalanche. Release area, perimeter and deposition ofthe avalanche of the 22"d of February 1999 are shown.Deposition depth and snow depth in the avalanchetrack along five profiles are determined byphotogrammetry.
When the snow cover contrast is not well defined (i.e.the avalanche boundaries have a white over whitedefinition) the error can invalidate the measurements.For this reason, only fragmentary information isobtained (for detailed information see Vallet (2001)).
. A third technique is the ortophoto analysis. Usingthis technique the mass of an avalanche can not bedetennined. However, additional information aboutrelease boundary conditions, avalanche width along thepath, deposition contour etc. can be defined on the geo-
75
Avalanche Dynamics
referenced picture, providing an useful tool for thedetermination of additional avalanche characteristics.
During the winter 1999 photogramrnetry data ofcatastrophic avalanche were collected. Fig. 7 shows adata example. The analysis of the measurements showedthat there were avalanches able to erode a snow coverdepth, over all the potential erosion area, larger than therelease fracture depth. This is likely to happen when thedry low density snow condition favours the erosionprocess.
On the other hand, there were avalanches for whicherosion had a small influence. In this case the highsnow water content strongly limited the process.However, it is observed that higher values of theentrainment can be expected, i.e. even longer runoutdistances, for dry snow conditions along the wholepath.
3.3 Distribution of the mass in the avalanche
A representative parameter concerning the avalanchemass distribution is obtained measuring the avalancheflow depth distribution. In the last years measurementshave been performed using flow the depth sensors andFMCW radars (Gubler, 1984 and Dawes, 1999).
Figure 8 shows two examples of FMCW radar output.In the figures, the amplitude of the signal reflected fromdifferent heights in the avalanche is plotted as a functionof time on a three-dimensional intensity plot. A graphrelating flow heights and intensities is obtained.
3.4 Avalanche/ snowcover interaction
The avalanche mass and its distribution is stronglyrelated to the interaction between avalanche and snowcover. The location where the snow cover is entrainedinto the avalanche, the quantity of mass that theavalanche erodes; the force that the avalanche exerts onthe snow cover and the resistance the snow cover offersto this force are all factors that modify the avalanchedynamics.
Part of this information, i.e. the entrainment locationand the quantity of entrained snow, is determined byanalysis of the FMCW radar plots whereas, attempts tomeasure shear and normal forces exerted by theavalanche on the ground, i.e. snow cover, have beenperformed without any valuable results. Informationabout the mechanical properties of the snow cover helpsto overcome the problem.
Investigation of the entrainment location can beperformed with FMCW radars. Fig. 8 at the bottom-leftshows the interaction between avalanche and snowcover. These events were measured at the Vallee de laSionne test site on the 21 51 of February 2000 and on the29th of December 2001. Analysis of different FMCW

International Snow Science Workshop (2002: Penticton, B.C.)
measurements shows that front entrainment processesappear to dominate over basal erosion. Ourobservations are that avalanches tend to dive into thesnow cover and slide over a more resistant and olderlayer or on the ground. A frontal impact between theavalanche front and the snow cover takes place and theavalanche collects all the snow immediately at the front.This process is often referred to as "ploughing".However, it has also been observed that, avalanchesflow on a hard resistant layer within the snowcover. Ithas been conjectured that avalanche scrapes mass fromthe surface in a process termed "basal erosion".
Figure 8: FMCW radar plots. Measurements collectedat the Vallee de la SiOlme test site. The avalanches ofthe 21" of Febntary 2000 (top) and of the 2<jh ofDecember 2001 are shown.
The radar data can be correlated to the snowcharacteristics by field measurements. Fieldmeasurements are performed after each event in order tocollect as much information as possible on the snowcover characteristics and mechanical properties. Inparticular layering, grain size, shape and density of thesnow cover are collected. Ram profile are performedtoo.
4. Avalanche release frequency
In paragraph 3.2 different methods to measure theavalanche mass were explained.Concerning the release mass of an avalanche, twoparameters are important: the release area and thefracture depth. The ortophoto analysis is a valid
76
technique to detennine the release area, but not alwaysit's possible to get these pictures.A try to overcome this lack is to perform an accurateanalysis of the topography to find general rules for thedefinition of potential avalanche release areas. The ideais to work out an automatic procedure to definepotential release areas and link them to topographicfeatures. This procedure is applied in the region ofDavos, where an almost complete database of avalancheevents during the last 50 years is available. UsingGeographic Information System (GIS) technologies incombination with Digital Elevation Models (DEM), allavalanche release areas have been analysed with respectto topographic characteristics. Topographic parameterslike "distance to the next ridge", "slope", "confinement"and "aspect in relation to the main wind direction" arederived from the DEM and from meteorologicalobservations.The statistical analysis results in general rules andprobability distributions for release extents as a functionof the frequency and the topographic parameters. Thegeneral rules are a valuable aid for the avalancheexperts in cases where information about historicavalanche is lacking for a particular track. Furthermore,the probability distributions can be directly used asinput for uncertainty modelling of avalanche run-outdistances by Monte Carlo methods. In the avalanchewinter of 1999 (in the European Alps), the latter topichas been shown to be very important for the furtherimprovement of avalanche hazard maps and for the riskassessment of avalanche hazard in general.
5. Avalanche modeling
5.1 AVAL·1D: A model for avalanche practitioners
The Voellmy-Salm model has been traditionally used inSwitzerland to prepare hazard maps. This model is nowbeing replaced by a numerical model that tracksavalanche motion from initiation to runout. The modelis called AVAL-1D and is now widely used inSwitzerland, Austria and Italy (Christen, in press.).Similar to the Voellmy-Salm model,. AVAL-lDcombines a dry Coulomb-like friction with a Chezyvelocity-squared dependent drag (Bartelt, 1999). Thenumerical model has been extensively validated byback-calculating many historical avalanches, includingmany large events from the Winter of 1999. However,the model does not include important effects such assnowcover entrainment.
5.2 A mixed flowing/powder snow avalanche model
E
Avalanche Dynamics
Figure 10: Zoom of the end of a Vallee de la Sionnesimulation. Dense flow and snow cover scaled 50X.
Britter R.E. and lE. Simpson., 1978. Experiments onthe dynamics of a gravity current head, J. Fluid Mech.,88, 223-240.
new Swiss test-site forin the Vallee the laRegions Science and
7. ReferencesAmmann, W.l 1999. A
avalanche experimentsSionneNalais. ColdTechnology, 30, 3-11.
Acknowledgement. Funding for this research has beenprovided by the Swiss National, the European Union,via the Swiss Foundation for Education and Science(BBW) and the Swiss Highway Agency (ASTRA).Furthermore, members of the avalanche dynamics teamwould like to thank the logistics staff of the SLF fortheir support in both the field and laboratory.
6. ConclusionAs a consequence of the avalanche winter 1999 the
avalanche dynamics team of the Swiss Federal Institutefor Snow and Avalanche Research intensified the effortto collect data from real scale avalanches. In addition,laboratory and snow chute experiments have beenperformed. The collected data allowed a betterunderstanding of avalanche physical processes and thedevelop of new numerical models taking into accountmany of the processes presented in this paper.
to the turbulent wake. The wake is the low density,highly mixed region of a powder avalanche with notranslational velocity.
e) Deposition of mass from the dense flow andfrom the turbulent wake.
Once the mass of the component parts is understood,momentum equations describing the dynamics can bewritten for each.
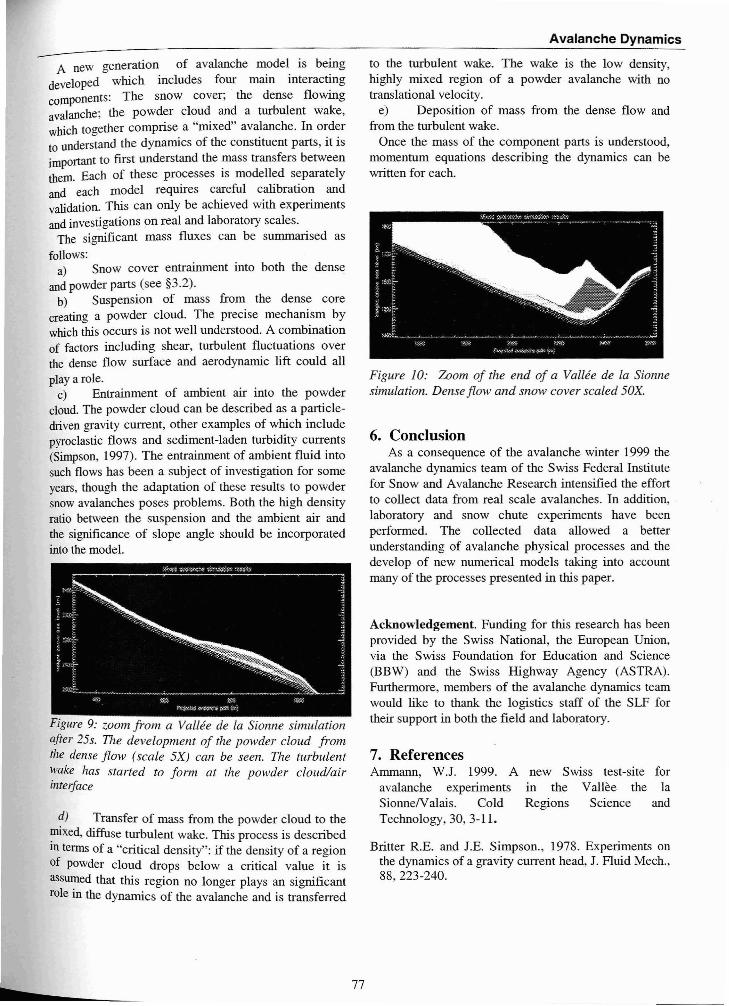
Figure 9: zoom from a Vallee de la SiOlwe simulationafter 25s. The development of the powder cloud fromthe dense flow (scale 5X) can be seen. The turbulent~vake has started to form at the powder cloud/airl11teiface
~) Transfer of mass from the powder cloud to the~ed, diffuse turbulent wake. This process is describedIII terms of a "critical density": if the density of a regionof powder cloud drops below a critical value it isassu~ed that this region no longer plays an significantrole III the dynamics of the avalanche and is transferred
- A new generation of avalanche model is beingdeveloped which includes four main interactingcomponents: The snow cover; the dense flowingavalanche; the powder cloud and a turbulent wake,which together comprise a "mixed" avalanche. In orderto understand the dynamics of the constituent parts, it isimportant to first understand the mass transfers betweenthem. Each of these processes is modelled separatelyand each model requires careful calibration andvalidation. This can only be achieved with experimentsand investigations on real and laboratory scales.
The significant mass fluxes can be summarised as
follows:a) Snow cover entrainment into both the dense
and powder parts (see §3.2).b) Suspension of mass from the dense core
creating a powder cloud. The precise mechanism bywhich this occurs is not well understood. A combinationof factors including shear, turbulent fluctuations overthe dense flow surface and aerodynamic lift could allplaya role.
c) Entrainment of ambient air into the powdercloud. The powder cloud can be described as a particledriven gravity current, other examples of which includepyroclastic flows and sediment-laden turbidity currents(Simpson, 1997). The entrainment of ambient fluid intosuch flows has been a subject of investigation for someyears, though the adaptation of these results to powdersnow avalanches poses problems. Both the high densityratio between the suspension and the ambient air andthe significance of slope angle should be incorporatedinto the model.
b77

International Snow Science Workshop (2002: Penticton, B.C.)
Christen, M., P. Bartelt and U. Gruber. AVAL-ID: anavalanche dynamics program for the practice.Proceeding of Interpraevent 2002 in the Pacific Rim,Matsumoto, Japan.
Dawes, N., 1999. Project Vallee de la Sionne. Full scaleexperimentation and development of AvALDAT RadarData Development and Interpretation Package,Diploma thesis, University of Bath, Claverton Down,Bath, England.
Dent J.D., Burrel KJ., Schmidt D.S., Louge M.Y.,Adams E.E., and Jazbutis T.G., 1997. Density,velocity and friction measurements in a dry snowavalanche, Ann. Glaciol., 26.
Gubler, H. and M. Hiller, 1984. The use of microwaveFMCW radar in snow and avalanche research, ColdRegions Science and Technology, 9, 109-119.
Gruber, U. and P. Bartelt. 2000a. Study of the 1999avalanches in the Obergorns valley, Switzerland, withrespect to avalanche hazard mapping. Proceeding ofthe International Snow Science Workshop (ISSW),Big Sky, Montana.
Gruber, U. and Margreth, S. 2000b. Winter 1999: avaluable test of the avalanche hazard mappingprocedure in Switzerland. Ann. Glaciol., 32, 328-332.
Hakonard6ttir, K.M., AJ. Hogg, T. J6hannesson, andG.G. T6masson.A laboratory study of the retardingeffect of braking mounds. To appear in J. Glaciol.,May 2002.
Hakonard6ttir, K.M., T. J6hannesson, F. Tiefenbacher,and M.A Kern. A laboratory study of the retardingeffect of braking mounds in 3, 6and 9m long chutes.Technical Report 01007, Icelandic MeteorologicalOffice, Reykjavik, May 2001.
Louge M.Y., Steiner R, Keast S.c., Decker R, Dent, J.and Schneebeli M., 1997. Application of capacitanceinstrumentation to the measurement of the density andvelocity of flowing snow, Cold Regions Science andTechnology, 25, 47-63.
Issler, D. European avalanche test sites. Overview andanalysis in view of coordinated experiments.Mitteilungen 59, Swiss Federal Institute for Snow andAvalanche Research, 1999.
Louge M.Y., Foster RL., Jensen N., and Patterson R,1998. A portable capacitance snow soundinginstrument, Cold Regions Science and Technology,28,73-81.
Salm, B, 1964. Anlage zur Untersuchung dynamischer
78
Wirkungen von bewegtem Schnee. SLF internalreport.
Schaer M. and Issler D., 2001. Particle densities,velocities and size distributions in large avalanchesfrom impact-sensor measurements, Ann. Glaciol., 32,321-327.
Simpson J.E., 1997. Gravity currents in the environmentand the laboratory, CUP.
Sovilla, B., F. Sommavila and A Tomaselli, 2001.Measurements of mass balance in dense snowavalanche events, Ann. Glaciol., 32, 230-236.
Sovilla, B. and P. Bartelt. In press. Observationsandmodelling of snow avalanche entrainment. NaturalHazard and Earth System Sciences.
Vallet, J., U. Gruber and F. Dufour, 2001.Photograrnmetric avalanche volume measurements atVallee de la Sionne, Ann. Glaciol, 32, 141-146.