automatic determination of indigo and sodium dithionite in ... · pdf filedetermination of...
TRANSCRIPT

Application note
Automatic determination of indigo and sodium dithionite in vat dyebaths
Enscada S.r.l. , Busto Arsizio (VA) Italy [email protected]
Introduction
This article describe the results of experimental work undertaken in the last decade that letEnscada to develop a technology viable for commercial use in automatic determination of bothindigo dye and sodium dithionite.
Academic research of the last decade
Indigo is a vat dye, is insoluble in an aqueoussolution in its oxidised form, but is water soluble inits leuco form in an alkali solution [2]. It becomesinsoluble again by oxidation after fabrics have beensteeped. Sodium dithionite in an alkali solution isusually used to reduce indigo to its leuco form.Concentrations of indigo and dithionite have beenmonitored simultaneously by electrochemicaltitration using potassium hexacyanoferrate(III) asthe titrant. Event though this method is widely usedin at−line analyzers, there are interferences due toblack sulfur dye when present as bottoming.Further, it is not possible to determine indigo at allby titration if dithionite is not present in dyebaths.Lastly, titration method has shown in the lastdecade to be less reliable than optical methods incontinuous indigo dyebaths measurements.
In [6] a flow injection technique was introduced forcontinuous monitoring of reagents in dyebaths, and multivariate calibration models were developedto allow rapid determination of each dye in amixture. In a more recent study, flow injection analysis (FIA)was developed as a real−time analytical techniquefor determining leuco indigo dye concentration in abatch dyebath process. A 20−µL sample wasintroduced in FIA and diluted with five differentreducing agents.Absorbance measurements were made at 406 nmat the maximum of the leuco indigo absorption peakwith a fiber optic coupled spectrometer. However,the method was very sensitive to atmosphericoxygen, and the concentration of leuco indigodecreased as the reduced molecules came intocontact with atmospheric oxygen and oxidised [5].
© 2002−2010, By Enscada

Nitrogen gas was bubbled continuously into thesolution to prevent this oxidation of leuco indigo. In another study, a voltammetric sensor wasdeveloped using a rotating discchronoamperometric technique for determiningsodium dithionite and indanthrene/indigo dyes inalkaline solution by Govaert et al.[4]. Due to the absorption of the oxidised dyestuff to theelectrode surface, multipulse potential steps wereused to reduce the dye to soluble form and to cleanthe surface. In the semicontinuous determination ofdyestuff at −0.6 V versus SCE, there was a smallinterference due to the presence of dithionite.This method yielded a linear relation between themeasured current and the dye concentration fromthe detection limit up to 6 g. In [1] fiber optic sensors measured the relativeabsorbance and reflectance of dye solutions anddyed fabrics with respect to the standard solutions.The sampling path could be adjusted down to 0.1mm, and absorbance was measured directly in thesolution. However, the method was not suitable formeasuring dye concentrations in dyebaths, so noreal−time monitoring could be done in that study.Using various dosing techniques or continuoustechniques after dyeing results in a relatively longresponse time for determining dye concentrations.In [7] a laser diode absorption spectrometer iscoupled with a continuous dilution system for real−time monitoring of indigo dyeing of denim yarn.
The reduced form of indigo in the dyebath iscontinuously pumped by a peristaltic pump into amixing cuvette, where it is diluted by a factor of 80with aerated water and oxidised into its stable form.This solution is then pumped into the sampling cellof the laser diode spectrometer for absorptionmeasurements. Monochromatic radiation emittedfrom the laser diode at 635 nm is used to measureindigo absorption at the shoulder of a broadabsorption peak. A linear calibration curve isobtained in a concentration range between 10 and150 mg/l with a linear regression coefficient of r2 =0.9993, which corresponds to indigo concentrationsin the dyebath covering the range between 0.8−12g/l. The last implementation, event though is viablefor commercial use, is limited to the automaticanalysis of indigo, while sodium dithionite is nottaken into consideration.
Figure 1
Enscada method for automatic analysis ofindigo and sodium dithionite in vat dyebaths:Endenim automatic chemical analyzer
Endenim has been built incrementally in twophases:
Phase one, 1996: Tintometro
Development of Tintometro has been undertaken ata main Italian denim producer during year 1996 onindigo rope dye ranges. (figure 2)Tintometro is an at−line analyzer. An operator hasto grab the sample from dyebath and submit it toTintometro for analysis.
Figure 2
© 2002−2010, By Enscada

Phase two, 2002−2004: Endenim
Development of Endenim, a chemical analyzer with afull automatic sampling system.
Each analyzer is connected to two dye ranges.At the end of 2004 Endenim has undertaken alloperation tests and passed them in three installationsites. (figure 3)
Phase three, 2006: IHPA(Indigo Hydrosulfite Process Analyzer)
IHPA has been designed for the international marketwith modularity and serviceability in mind.It consists of the following two modules:
a Sensor Actuator Manager Unit (SAMU) and aSample Conditioning Unit (SCU). (figure 4)
Figure 3
Figure 4
Sample Conditioning Unit (SCU) Sensor Actuator Manager Unit (SAMU)
© 2002−2010, By Enscada

SAMU is a sampling system controller and acommunications gateway/bridge to exchangemeasurements and configuration data between thesensor/actuators, contained inside the SCU.
SAMU is an embedded computing device furnishedwith an industry common operating system andchemometric software that manage the calibration.
Both Endenim and IHPA require that the dyer or thechemical analyst performs the calibration on an asneed or regular basis by manual sampling theindigo circulation.
IHPA SCU is connected to the indigo dye range bymeans of a sampling loop connected to therecirculation of the dye liquor as shown in figure 5.The SCU performs all the necessary operations forthe conditioning of the bath. After conditioning, theSAMU can read the concentrations of indigo dyeand sodium dithionite in g/l units.
Figure 5
Endenim results
In this article we want to show five mainexperimental results of Endenim technology:
Range of indigo analysis is very high: 0.0 − 30.0g/l.
Endenim SCU covers the indigo concentrationrange between 0.0 − 30.0 g/l and the sodiumdithionite concentration range between 0.0 − 3.0 g/l.Some customers produce dark indigo shades using15.0 − 20.0 g/l indigo dyebaths.
The indigo measurement precision at lowconcentration levels is high: 0.01 g/l.
Indigo detection require high precision at lowconcentrations. Endenim features very precisemeasurement at low concentrations. High stabilityof the measurement is required at lowconcentrations, because the small variations ofindigo concentrations, below 3.0 g/l, are highlyvisible on the final dyed fabrics. In our testsEndenim precision in this range overtaken theprecision of electrochemical titration usingpotassium hexacyanoferrate(III) as the titrant.
The analyzer require low maintenance.
The main result of Endenim operation is reliability.The required maintenance is low, even with highconcentration dyebaths. The maintenance can beeasily programmed, based on metric counterspresent on the analyzer.
Modularity.Endenim sample conditioning unit performs indigoand sodium dithionite analysis in a modular,independent and integral way.
Low cost of operation.The main cost of operation is the refilling of notanalytical grade reagents.
Conclusions:with these five main goals achieved, it is possible tosatisfy every customer who has a visible andconsistent upper management support of processanalytical chemistry.
© 2002−2010, By Enscada

Enscada expertise
� Enscada is able to design processspectrometers for UV/VIS applications.
� Enscada is able to design sample conditioningunits.
� Enscada is able to develop embedded SAMs(Sensor Actuator Managers), with chemometricssoftware for calibration purposes. SAM is asampling system controller and acommunications gateway/bridge to exchangemeasurements and configuration data betweenthe bus−sensor/actuators.
Figure 6
Organisation issues:
Although this article has focused upon thetechnologies involved in the automaticdetermination of indigo and sodium dithionite in vatdyebaths, it may not be obvious to many readersthat successful implementation is more dependentupon corporate organisational issues than upon theinstrumentation itself. This is a bold statement.Process analytical chemistry is highly multi−disciplinary[8]. It involves process engineers andchemists who know what they want to measure andwhere it can be measured, instrumentationtechnicians who will maintain the instrument,technology gatekeepers who look for newinstrumentation, analytical chemists who performthe laboratory chemical analyses upon which thecalibration is based, and researchers who likelyperform the initial feasibility studies.There are also specialists in data communication,safety and others. Therefore, the person whoidentifies the instrument may not be the sameperson who calibrate it, or who is the eventual"owner" of the equipment. The person whodevelops the calibration may not be responsible forits maintenance over time.
Companies that establish the means for this"internal technology transfer" among their variousgroups will have the greatest likelihood of achievingthe benefits of on−line analytical technologydescribed above. A fundamental requirement forsuch success is visible and consistent uppermanagement support of process analyticalchemistry.Without this, workers will be less inclined to "sticktheir neck out" and try a new technology that mayhelp their organisation to improve product qualitymore efficiently. This is difficult in an era ofcorporate downsizing where concern for job securitydoes not inspire workers to take such risks. This isalso made difficult in most instances because theseinstruments are often installed in existing, profitableprocesses. Their benefit is not "all or nothing", butrather incremental, which is harder to justify.Sometimes, catching a major process upset earlypays for the entire cost of the instrument. In otherwords, if everything worked perfectly there would beno need for automatic analytical instrumentation inthe first place. Lastly, for companies just beginningto consider such on−line technology, it is importantto build advocacy with early success by judiciousselection of the first application.
© 2002−2010, By Enscada

Literature cited:
1. Ericson, A. C., and Posner, S., Relative Absorbance and Reflectance Measurements ofDye Solutions and Dyed Fabrics, Textile Chem. Color. 28, 23−27 (1996).
2. Etters, J. N., Advances In Indigo Dyeing: Implications for the Dyer, ApparelManufacturer and Environment, Textile Chem. Color. 27(2), 17−22 (1995).
3. Fox, M. R., and Pierce, J. H., Indigo−Past and Present, Textile Chem. Color. 22(4),13−15 (1990).
4. Govaert, F., Temmerman, E., and Kiekens, P., Development of Voltammetric Sensorsfor the Determination of Sodium Dithionite and Indanhrene/Indigo Dyes in AlkalineSolutions, Anal. Chim. Acta 385, 307−314 (1999).
5. Merritt, J. T., Beck, K. R., Smith, C. B., Hauser, P. J., and Jasper, W. J.,Determination of Indigo in Dyebaths by Flow Injection Analysis and Redox Titrations,AATCC Rev. 1(4), 41−45 (2001).
6. Lefeber, M. R., Beck, K. R., Smith, C. B., and McGregor, R., Flow Injection Analysisof Dyebaths, Textile Chem. Color. 26(5), 30−34 (1994).
7.Ugur Sahin and Ahmet Ulgen Ahmet, Kekec Ali Gokmen, Real−Time Monitoringof Indigo Concentrations in the Dyebath with a Laser Diode Spectrometer,Textile Research Institute (2004).
8.S.Jacobs and S. Mehta, Process Quality Measurement Systems: An Integrated Approach toa Successful Program in Process Analytical Chemistry, American Laboratory, 15−22(December 1997)
© 2002−2010, By Enscada
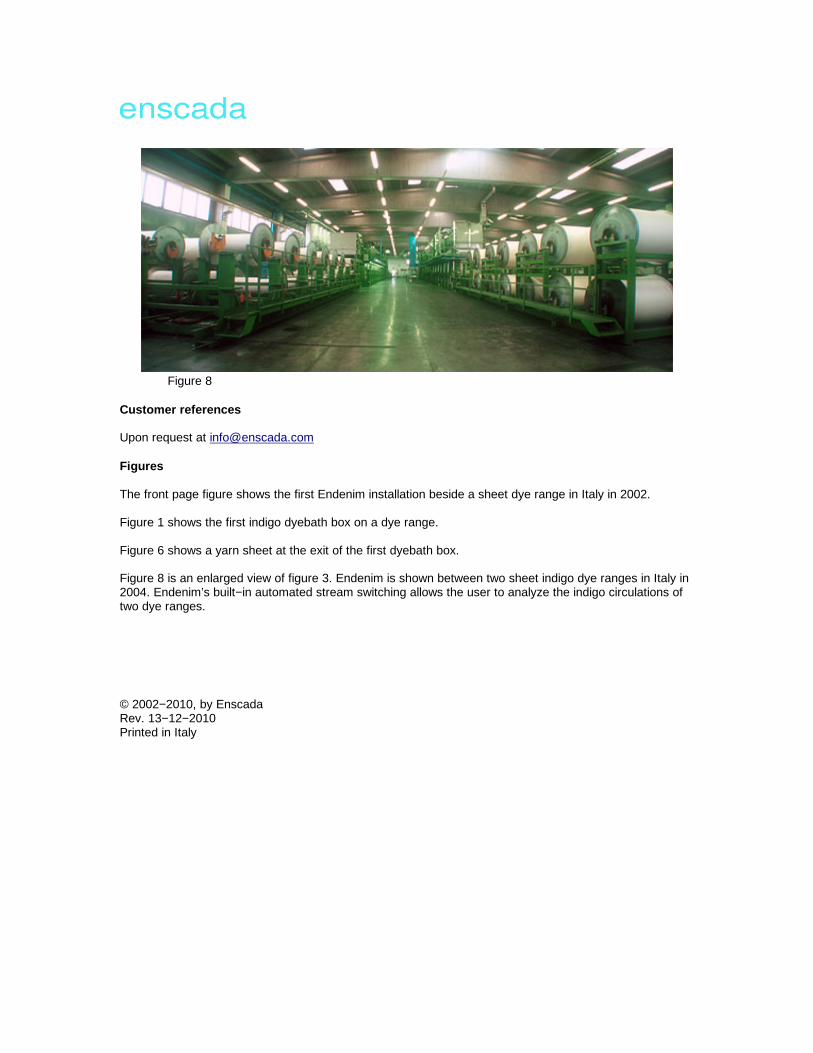
Figure 8
Customer references
Upon request at [email protected]
Figures
The front page figure shows the first Endenim installation beside a sheet dye range in Italy in 2002.
Figure 1 shows the first indigo dyebath box on a dye range.
Figure 6 shows a yarn sheet at the exit of the first dyebath box.
Figure 8 is an enlarged view of figure 3. Endenim is shown between two sheet indigo dye ranges in Italy in2004. Endenim’s built−in automated stream switching allows the user to analyze the indigo circulations oftwo dye ranges.
© 2002−2010, by EnscadaRev. 13−12−2010Printed in Italy