auto dashboard april 2013
TRANSCRIPT

7/30/2019 AUTO Dashboard April 2013
http://slidepdf.com/reader/full/auto-dashboard-april-2013 1/36
May 2013
DashboardThe Monthly Auto Update
Speedometer
12-month relative performance
April 2013 relative performance
Chirag Jain ([email protected]); + 91 22 3982 5418
Aggregate Volumes For April 2013*
Segment Apr-13 Apr-12 YoY (%) Mar-13 MoM (%) FY13 FY12 Chg (%)
2-Wheelers 973,230 1,074,439 -9.4 909,966 7.0 1,007,966 1,098,338 -8.2
Motorcycl e 880,577 970,854 ‐9.3 809,267 8.8 915,313 994,753 ‐8.0
3‐Whe ele rs 52,100 46,829 11.3 39,018 33.5 52,100 46,829 11.3
Cars 102,252 115,405 ‐11.4 124,106 ‐17.6 102,252 115,405 ‐11.4
UVs 43,812 43,265 1.3 54,609 ‐19.8 43,812 43,265 1.3
Commercial Vehicles 51,198 50,787 0.8 79,989 -36.0 63,586 64,982 -2.1
LCV 31,628 29,768 6.2 49,916 ‐36.6 31,628 29,768 6.2
M&HCV 19,570 21,019‐6.9 30,073
‐34.9 31,958 35,214
‐9.2
Tractors 23,202 16,797 38.1 17,330 33.9 23,202 16,797 38.1
Total Volumes 1,245,794 1,347,522 -7.5 1,225,018 1.7 1,292,918 1,385,616 -6.7
* Aggrega te of Baja j, Hero, TVS Motor, Maruti, M&M, Tata Motors, Ash ok Leyland & Eicher Motors Source: Compa ny, MOSL
Investors are advised to refer through disclosures made at the end of the Research Report.
Jinesh Gandhi ([email protected]); +91 22 3982 5416
1
Data Track: April 2013 volume update of auto majors
Sector overview and outlook ........................................................... 2
Hero MotoCorp .................................................................................3
Bajaj Auto .......................................................................................... 4
Maruti Suzuki .................................................................................... 6
Mahindra & Mahindra ....................................................................... 8
Tata Motors ...................................................................................... 10
Ashok Leyland ................................................................................. 12
Eicher Motors .................................................................................. 13
TVS Motor ........................................................................................ 14
Special Report MARUTI SUZUKI: Internal target to grow volumes by 10-12% ....... 16
HMSI launches its cheapest motorcycle Dream Neo ..................... 19
Sector Gauge: March update
Two-wheelers ................................................................................. 21
Three-wheelers .............................................................................. 23
Cars and UVs .................................................................................... 25
Commercial vehicles ....................................................................... 27
News and Events ............................................................................... 30
Honda launches Amaze, to roll out UVs over two-three years
Royal Enfield starts new plant, targets to sell 175,000 units in CY13
Comparative Valuation
CMP * Rating
(INR) FY13E FY14E FY15E FY13E FY14E FY15E FY13E FY14E FY15E FY13E FY14E FY15E
Ba jaj Auto 1,860 Buy 18.0 15.1 13.0 12.5 9.9 8.2 44.7 44.0 41.8 61.8 61.5 57.0
Hero MotoCorp 1,613 Buy 15.2 14.3 10.5 9.3 8.2 6.8 45.6 41.9 48.0 43.6 50.8 60.6
M&M 955 Buy 15.3 12.2 9.8 9.5 7.7 6.1 22.0 20.5 20.1 24.2 24.5 24.1
Maruti Suzuki 1,680 Buy 21.0 14.6 12.1 10.5 7.2 5.6 12.9 15.9 16.5 15.5 19.5 20.3
Tata Motors 296 Buy 10.8 8.6 7.4 4.7 4.2 3.7 21.8 22.3 21.2 22.1 23.1 23.5
Ashok Leyland 23 Buy 22.0 13.4 9.3 10.2 7.7 6.6 6.6 10.5 14.6 8.0 10.3 12.6
Ei che r Mo tors # 3,046 B uy 25.3 26.6 18.7 20.7 18.5 11.3 20.3 17.1 21.4 22.9 17.5 23.7
* Price a s on 2nd Ma y 2013. # Nos. are on CY bas is Source: Compa ny, MOSL
P/E (x) EV/EBITDA (x) RoE (%) RoCE (%)
7/30/2019 AUTO Dashboard April 2013
http://slidepdf.com/reader/full/auto-dashboard-april-2013 2/36
Dashboard
May 2013 2
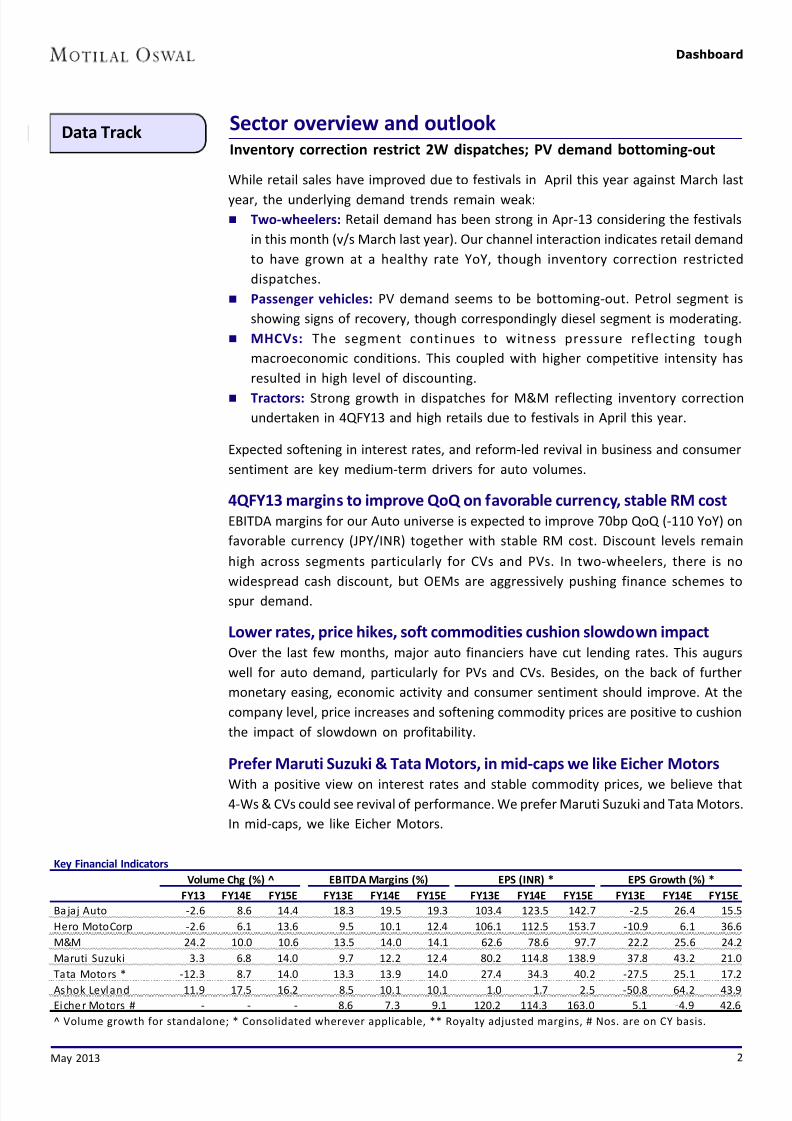
Sector overview and outlookInventory correction restrict 2W dispatches; PV demand bottoming-out
Data Track
While retail sales have improved due to festivals in April this year against March last
year, the underlying demand trends remain weak:
Two-wheelers: Retail demand has been strong in Apr-13 considering the festivals
in this month (v/s March last year). Our channel interaction indicates retail demand
to have grown at a healthy rate YoY, though inventory correction restricted
dispatches.
Passenger vehicles: PV demand seems to be bottoming-out. Petrol segment is
showing signs of recovery, though correspondingly diesel segment is moderating.
MHCVs: The segment continues to witness pressure reflecting tough
macroeconomic conditions. This coupled with higher competitive intensity has
resulted in high level of discounting.
Tractors: Strong growth in dispatches for M&M reflecting inventory correction
undertaken in 4QFY13 and high retails due to festivals in April this year.
Expected softening in interest rates, and reform-led revival in business and consumer
sentiment are key medium-term drivers for auto volumes.
4QFY13 margins to improve QoQ on favorable currency, stable RM cost
EBITDA margins for our Auto universe is expected to improve 70bp QoQ (-110 YoY) on
favorable currency (JPY/INR) together with stable RM cost. Discount levels remain
high across segments particularly for CVs and PVs. In two-wheelers, there is no
widespread cash discount, but OEMs are aggressively pushing finance schemes to
spur demand.
Lower rates, price hikes, soft commodities cushion slowdown impact
Over the last few months, major auto financiers have cut lending rates. This augurs
well for auto demand, particularly for PVs and CVs. Besides, on the back of further
monetary easing, economic activity and consumer sentiment should improve. At the
company level, price increases and softening commodity prices are positive to cushion
the impact of slowdown on profitability.
Prefer Maruti Suzuki & Tata Motors, in mid-caps we like Eicher Motors
With a positive view on interest rates and stable commodity prices, we believe that4-Ws & CVs could see revival of performance. We prefer Maruti Suzuki and Tata Motors.
In mid-caps, we like Eicher Motors.
Key Financial Indicators
FY13 FY14E FY15E FY13E FY14E FY15E FY13E FY14E FY15E FY13E FY14E FY15E
Ba jaj Auto -2.6 8.6 14.4 18.3 19.5 19.3 103.4 123.5 142.7 -2.5 26.4 15.5
Hero MotoCorp -2.6 6.1 13.6 9.5 10.1 12.4 106.1 112.5 153.7 -10.9 6.1 36.6
M&M 24.2 10.0 10.6 13.5 14.0 14.1 62.6 78.6 97.7 22.2 25.6 24.2
Maruti Suzuki 3.3 6.8 14.0 9.7 12.2 12.4 80.2 114.8 138.9 37.8 43.2 21.0
Tata Motors * -12.3 8.7 14.0 13.3 13.9 14.0 27.4 34.3 40.2 -27.5 25.1 17.2
Ashok Leyland 11.9 17.5 16.2 8.5 10.1 10.1 1.0 1.7 2.5 -50.8 64.2 43.9
Eiche r Motors # - - - 8.6 7.3 9.1 120.2 114.3 163.0 5.1 -4.9 42.6
^ Volume growth for standalone; * Consolidated wherever applicable, ** Royalty adjusted margins, # Nos. are on CY basis.
EPS (INR) * EPS Growth (%) *Volume Chg (%) ̂ EBITDA Margins (%)
7/30/2019 AUTO Dashboard April 2013
http://slidepdf.com/reader/full/auto-dashboard-april-2013 3/36
Dashboard
May 2013 3
Data Track
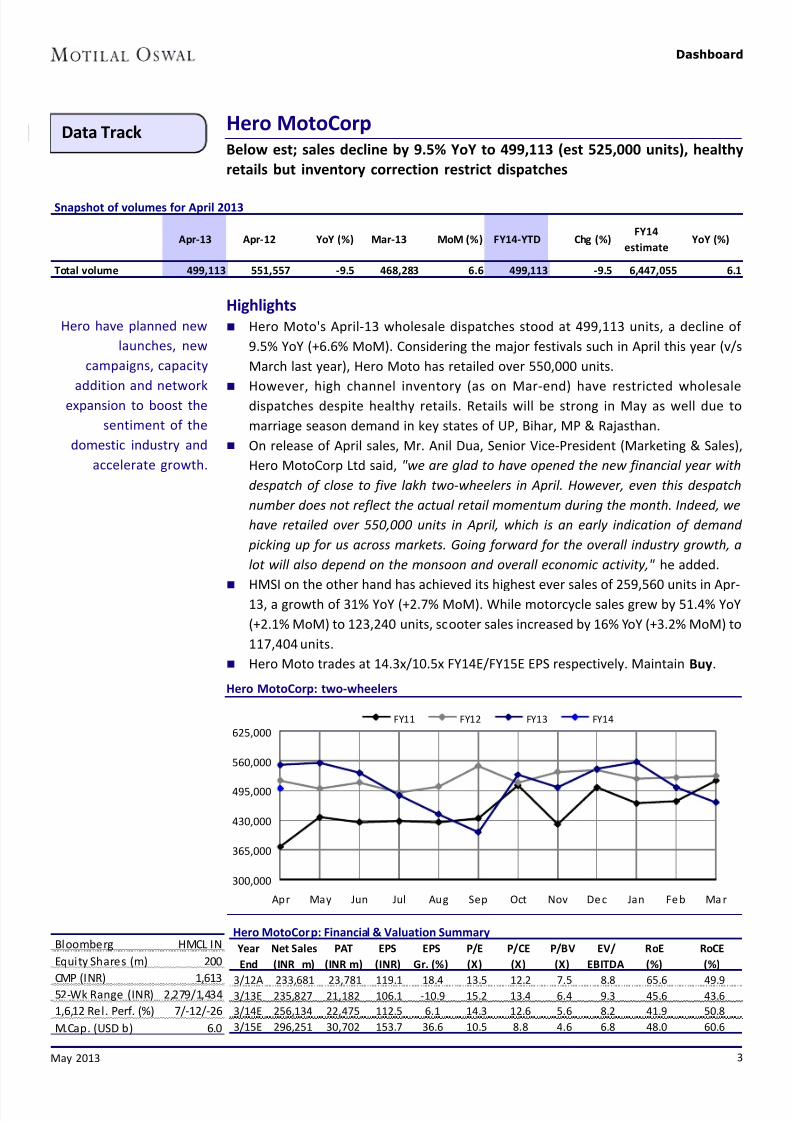
Hero MotoCorp: two-wheelers
Hero have planned new
launches, new
campaigns, capacity
addition and network
expansion to boost the
sentiment of the
domestic industry and
accelerate growth.
Hero MotoCorpBelow est; sales decline by 9.5% YoY to 499,113 (est 525,000 units), healthy
retails but inventory correction restrict dispatches
Highlights
Hero Moto's April-13 wholesale dispatches stood at 499,113 units, a decline of
9.5% YoY (+6.6% MoM). Considering the major festivals such in April this year (v/s
March last year), Hero Moto has retailed over 550,000 units.
However, high channel inventory (as on Mar-end) have restricted wholesaledispatches despite healthy retails. Retails will be strong in May as well due to
marriage season demand in key states of UP, Bihar, MP & Rajasthan.
On release of April sales, Mr. Anil Dua, Senior Vice-President (Marketing & Sales),
Hero MotoCorp Ltd said, "we are glad to have opened the new financial year with
despatch of close to five lakh two-wheelers in April. However, even this despatch
number does not reflect the actual retail momentum during the month. Indeed, we
have retailed over 550,000 units in April, which is an early indication of demand
picking up for us across markets. Going forward for the overall industry growth, a
lot will also depend on the monsoon and overall economic activity," he added.
HMSI on the other hand has achieved its highest ever sales of 259,560 units in Apr-13, a growth of 31% YoY (+2.7% MoM). While motorcycle sales grew by 51.4% YoY
(+2.1% MoM) to 123,240 units, scooter sales increased by 16% YoY (+3.2% MoM) to
117,404 units.
Hero Moto trades at 14.3x/10.5x FY14E/FY15E EPS respectively. Maintain Buy.
Hero MotoCorp: Financial & Valuation Summary
Year Net Sales PAT EPS EPS P/E P/CE P/BV EV/ RoE RoCE
End (INR m) (INR m) (INR) Gr. (%) (X) (X) (X) EBITDA (%) (%)
3/12A 233,681 23,781 119.1 18.4 13.5 12.2 7.5 8.8 65.6 49.93/13E 235,827 21,182 106.1 -10.9 15.2 13.4 6.4 9.3 45.6 43.6
3/14E 256,134 22,475 112.5 6.1 14.3 12.6 5.6 8.2 41.9 50.8
3/15E 296,251 30,702 153.7 36.6 10.5 8.8 4.6 6.8 48.0 60.6
Bloomberg HMCL IN
Equity Shares (m) 200
CMP (INR) 1,61352-Wk Range (INR) 2,279/1,434
1,6,12 Rel. Perf. (%) 7/-12/-26
M.Cap. (USD b) 6.0
300,000
365,000
430,000
495,000
560,000
625,000
Apr May Jun Jul Aug Sep Oct Nov De c Jan Fe b Ma r
FY11 FY12 FY13 FY14
Snapshot of volumes for April 2013
Apr-13 Apr-12 YoY (%) Mar-13 MoM (%) FY14-YTD Chg (%)FY14
estimateYoY (%)
Total volume 499,113 551,557 -9.5 468,283 6.6 499,113 -9.5 6,447,055 6.1
7/30/2019 AUTO Dashboard April 2013
http://slidepdf.com/reader/full/auto-dashboard-april-2013 4/36
Dashboard
May 2013 4
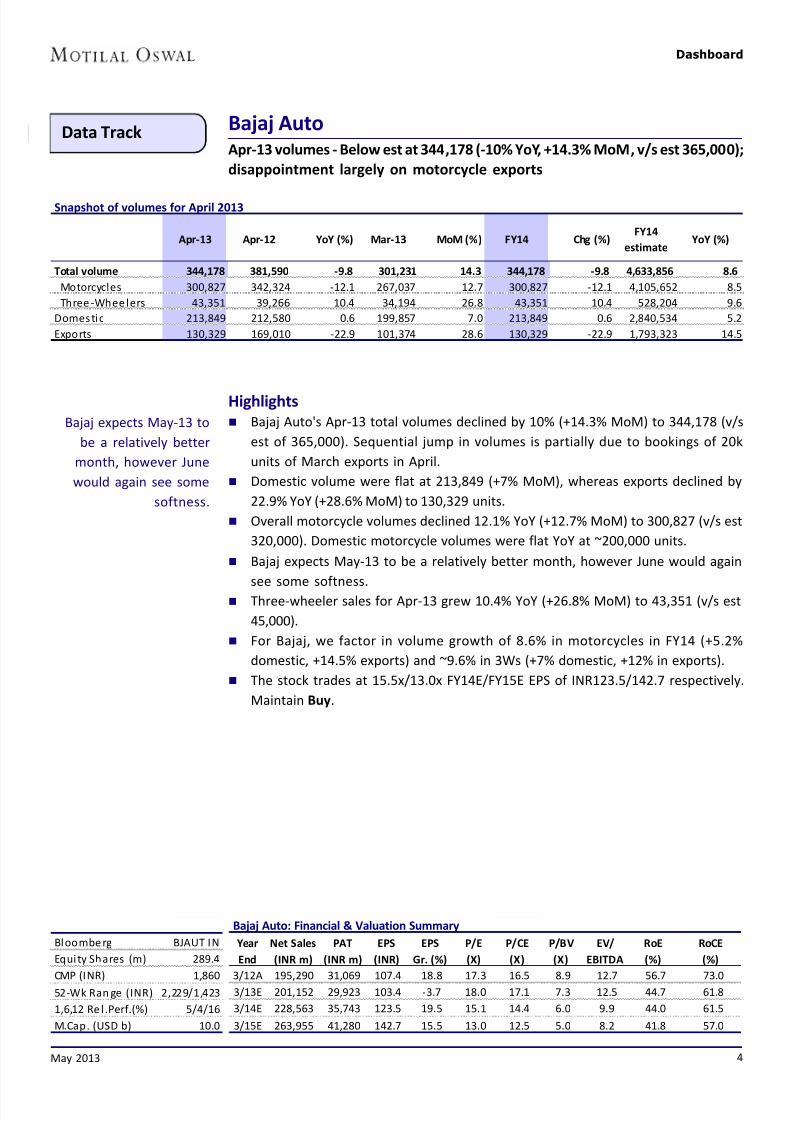
Bajaj AutoApr-13 volumes - Below est at 344,178 (-10% YoY, +14.3% MoM, v/s est 365,000);
disappointment largely on motorcycle exports
Data Track
Bloombe rg BJAUT IN
Equi ty Shares (m) 289.4
CMP (INR) 1,860
52-Wk Ran ge (INR) 2,229/1,423
1,6,12 Re l .Perf.(%) 5/4/16
M.Cap. (USD b) 10.0
Bajaj expects May-13 to
be a relatively better
month, however June
would again see some
softness.
Highlights
Bajaj Auto's Apr-13 total volumes declined by 10% (+14.3% MoM) to 344,178 (v/s
est of 365,000). Sequential jump in volumes is partially due to bookings of 20k
units of March exports in April.
Domestic volume were flat at 213,849 (+7% MoM), whereas exports declined by
22.9% YoY (+28.6% MoM) to 130,329 units.
Overall motorcycle volumes declined 12.1% YoY (+12.7% MoM) to 300,827 (v/s est
320,000). Domestic motorcycle volumes were flat YoY at ~200,000 units.
Bajaj expects May-13 to be a relatively better month, however June would again
see some softness.
Three-wheeler sales for Apr-13 grew 10.4% YoY (+26.8% MoM) to 43,351 (v/s est
45,000).
For Bajaj, we factor in volume growth of 8.6% in motorcycles in FY14 (+5.2%
domestic, +14.5% exports) and ~9.6% in 3Ws (+7% domestic, +12% in exports).
The stock trades at 15.5x/13.0x FY14E/FY15E EPS of INR123.5/142.7 respectively.
Maintain Buy.
Bajaj Auto: Financial & Valuation Summary
Year Net Sales PAT EPS EPS P/E P/CE P/BV EV/ RoE RoCE
End (INR m) (INR m) (INR) Gr. (%) (X) (X) (X) EBITDA (%) (%)
3/12A 195,290 31,069 107.4 18.8 17.3 16.5 8.9 12.7 56.7 73.0
3/13E 201,152 29,923 103.4 -3.7 18.0 17.1 7.3 12.5 44.7 61.8
3/14E 228,563 35,743 123.5 19.5 15.1 14.4 6.0 9.9 44.0 61.5
3/15E 263,955 41,280 142.7 15.5 13.0 12.5 5.0 8.2 41.8 57.0
Snapshot of volumes for April 2013
Apr-13 Apr-12 YoY (%) Mar-13 MoM (%) FY14 Chg (%)FY14
estimateYoY (%)
Total volume 344,178 381,590 -9.8 301,231 14.3 344,178 -9.8 4,633,856 8.6
Motorcycles 300,827 342,324 -12.1 267,037 12.7 300,827 -12.1 4,105,652 8.5
Three -Whee lers 43,351 39,266 10.4 34,194 26.8 43,351 10.4 528,204 9.6
Domestic 213,849 212,580 0.6 199,857 7.0 213,849 0.6 2,840,534 5.2
Exports 130,329 169,010 -22.9 101,374 28.6 130,329 -22.9 1,793,323 14.5

7/30/2019 AUTO Dashboard April 2013
http://slidepdf.com/reader/full/auto-dashboard-april-2013 5/36
Dashboard
May 2013 5
Exports under pressure
during the month
180,000
245,000
310,000
375,000
440,000
Apr Ma y Jun Ju l Aug Sep Oct Nov Dec Jan Feb Mar
FY11 FY12 FY13 FY14
24,000
31,000
38,000
45,000
52,000
Apr Ma y Jun Jul Aug Sep Oct Nov Dec Ja n Fe b Mar
FY11 FY12 FY13 FY14
40,000
80,000
120,000
160,000
200,000
Ap r May Jun Jul Aug Sep Oct No v De c Ja n Fe b Ma r
FY11 FY12 FY13 FY14
0%
25%
50%
75%
100%
A p r
‐ 1 0
M a y
‐ 1 0
J u n
‐
1 0
J u l
‐
1 0
A u g
‐ 1 0
S e p
‐
1 0
O c t
‐ 1 0
N o v
‐ 1 0
D e c
‐
1 0
J a n
‐
1 1
F e b
‐
1 1
M a r
‐ 1 1
A p r
‐ 1 1
M a y
‐ 1 1
J u n
‐
1 1
J u l
‐
1 1
A u g
‐ 1 1
S e p
‐
1 1
O c t
‐ 1 1
N o v
‐ 1 1
D e c
‐
1 1
J a n
‐
1 2
F e b
‐
1 2
M a r
‐ 1 2
A p r
‐ 1 2
M a y
‐ 1 2
J u n
‐
1 2
J u l
‐
1 2
A u g
‐ 1 2
S e p
‐
1 2
O c t
‐ 1 2
N o v
‐ 1 2
D e c
‐
1 2
J a n
‐
1 3
F e b
‐
1 3
M a r
‐ 1 3
A p r
‐ 1 3
Domestic Exports
Source: Company, MOSL
Three-wheeler volumes (units)
Two-wheeler volumes (units)
Discover and Pulsar
contribute ~70% to
two-wheeler volumes
Share of domestic sales
have increased in Apr-13
Market mix
Three-wheeler sales
sales bounces back

7/30/2019 AUTO Dashboard April 2013
http://slidepdf.com/reader/full/auto-dashboard-april-2013 6/36
Dashboard
May 2013 6
Data Track Maruti SuzukiApr-13 volumes marginally below est at 97,302 units; Domestic sales in-line,
blip in exports temporary phenomena
Maruti Suzuki has been
gaining market share
over the last few months
led by steady deliveries
of diesel models (due to
bookings) and recovery in
petrol segment.
Bloomberg MSIL IN
Equity Shares (m) 302.1
CMP (INR) 1,68052-Wk Range (INR 1,690/1,052
1,6,12 Rel .Perf.(%) 30/16/22
M.Cap. (USD b) 9.4
Maruti Suzuki: Financial & Valuation Summary
Year Total Inc. PAT Con. EPS EPS Con. P/E P/CE P/BV EV/ RoE RoCE
End (INR m) (INR m) (INR) Gr. (%) (x) (x) (X) EBITDA (%) (%)
3/12A 355,871 16,351 58.2 -29.4 - - - - 10.8 13.23/13E 435,879 23,921 80.2 37.8 21.0 11.8 2.7 10.5 12.9 15.5
3/14E 481,250 34,284 114.8 43.2 14.6 8.9 2.3 7.2 15.9 19.5
3/15E 556,685 41,971 138.9 21.0 12.1 7.6 2.0 5.6 16.5 20.3
Highlights
Maruti's Apr-13 volumes de-grew by 3.1% YoY (-18.9% MoM) to 97,302 (v/s est
99,000 units).
While domestic volumes were flat YoY at 90,523 (v/s est 88,000), exports declined
by 33% YoY (-44% MoM) to 6,779 units. Management highlighted drop in export
volumes as a temporary phenomena and expects to recover next month onwards.
Dzire continues to perform strongly with 25% YoY growth to 19,446 units.
MSIL has guided for 5-6% industry growth for FY14. Our industry interaction
indicates that the company is internally targeting 10-12% growth in FY14 volumes.
Hyundai's domestic sales have declined by 7.6% YoY (-4.3% MoM). However,
exports have grown by 26% YoY (+8.7% MoM) to 24,551 units.
On release of April sales, Hyundai's Rakesh Srivastava (SVP - Sales & Marketing)
said "The exports have shown good growth on account of strong demand from
non-European markets, while the domestic market continues to witness
pressure...There are signs of recovery with the increase in demand for petrol cars".
Maruti Suzuki trades at 14.6x/12.1x FY14E/15E consolidated EPS and 8.9x/7.6x CEPS.
Maintain Buy.
Snapshot of volumes for April 2013
Apr-13 Apr-12 YoY (%) Mar-13 MoM (%) FY14-YTD Chg (%)FY14
estimateYoY (%)
Total volume 97,302 100,415 -3.1 119,937 -18.9 97,302 -3.1 1,251,077 6.8
Domestic 90,523 90,255 0.3 107,890 -16.1 90,523 0.3 1,116,534 6.2
A1 1,500 1,705 -12.0 2,050 -26.8 1,500 -12.0
C 8,696 11,723 -25.8 9,506 -8.5 8,696 -25.8
A2 54,962 55,087 -0.2 68,865 -20.2 54,962 -0.2
A3 20,047 16,144 24.2 20,981 -4.5 20,047 24.2
A4 0 3 NA 0 NA 0 NA
UV 5,318 5,593 -4.9 6,488 -18.0 5,318 NA
Export 6,779 10,160 -33.3 12,047 -43.7 6,779 -33.3 134,542 11.8
7/30/2019 AUTO Dashboard April 2013
http://slidepdf.com/reader/full/auto-dashboard-april-2013 7/36
Dashboard
7
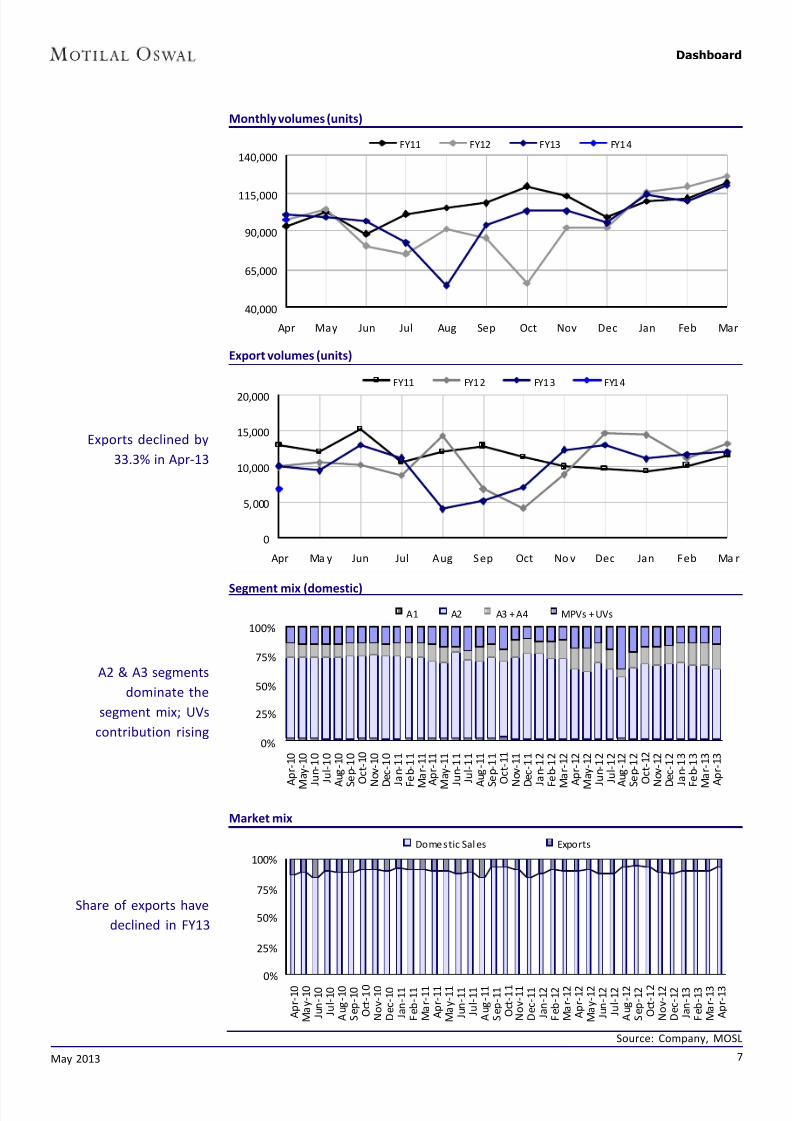
Export volumes (units)
Segment mix (domestic)
Source: Company, MOSL
Monthly volumes (units)
Exports declined by
33.3% in Apr-13
A2 & A3 segments
dominate the
segment mix; UVs
contribution rising
Share of exports have
declined in FY13
Market mix
40,000
65,000
90,000
115,000
140,000
Apr May Jun Jul Aug Sep Oct Nov Dec Jan Feb Mar
FY11 FY12 FY13 FY14
0%
25%
50%
75%
100%
A p r - 1 0
M
a y - 1 0
J u n - 1 0
J u l - 1 0
A
u g - 1 0
S
e p - 1 0
O c t - 1 0
N
o v - 1 0
D
e c - 1 0
J a n - 1 1
F
e b - 1 1
M
a r - 1 1
A p r - 1 1
M
a y - 1 1
J u n - 1 1
J u l - 1 1
A
u g - 1 1
S
e p - 1 1
O c t - 1 1
N
o v - 1 1
D
e c - 1 1
J a n - 1 2
F
e b - 1 2
M
a r - 1 2
A p r - 1 2
M
a y - 1 2
J u n - 1 2
J u l - 1 2
A
u g - 1 2
S
e p - 1 2
O c t - 1 2
N
o v - 1 2
D
e c - 1 2
J a n - 1 3
F
e b - 1 3
M
a r - 1 3
A p r - 1 3
A1 A2 A3 + A4 MPVs + UVs
0%
25%
50%
75%
100%
A p r - 1 0
M a y - 1 0
J u n - 1 0
J u l - 1 0
A u g - 1 0
S e p - 1 0
O c t - 1 0
N o v - 1 0
D e c - 1 0
J a n - 1 1
F e b - 1 1
M a r - 1 1
A p r - 1 1
M a y - 1 1
J u n - 1 1
J u l - 1 1
A u g - 1 1
S e p - 1 1
O c t - 1 1
N o v - 1 1
D e c - 1 1
J a n - 1 2
F e b - 1 2
M a r - 1 2
A p r - 1 2
M a y - 1 2
J u n - 1 2
J u l - 1 2
A u g - 1 2
S e p - 1 2
O c t - 1 2
N o v - 1 2
D e c - 1 2
J a n - 1 3
F e b - 1 3
M a r - 1 3
A p r - 1 3
Domestic Sal es Exports
0
5,000
10,000
15,000
20,000
Apr Ma y Jun Jul Aug Sep Oct No v Dec Jan Feb Ma r
FY11 FY12 FY13 FY14
May 2013

7/30/2019 AUTO Dashboard April 2013
http://slidepdf.com/reader/full/auto-dashboard-april-2013 8/36
Dashboard
May 2013 8
Mahindra and Mahindra: Financial & Valuation Summary
Year Net Sales S/A PAT * S/A EPS * Cons. Con. EPS P/E Cons. RoE RoCE EV/ EV/
End (INR m) (INR m) (INR) EPS (INR) Gr (%) (x) P/E (x) (%) (%) Sales (x) EBITDA
3/12A 318,535 28,888 48.3 51.2 6.6 19.8 18.6 23.0 23.1 0.0 0.0
3/13E 404,238 34,797 58.1 62.6 22.2 16.4 15.3 22.0 24.2 1.1 9.5
3/14E 457,392 38,596 64.5 78.6 25.6 14.8 12.2 20.5 24.5 0.9 7.7
3/15E 518,648 44,592 74.5 97.7 24.2 12.8 9.8 20.1 24.1 0.7 6.1
* S/A includi ng MVML
Data Track Mahindra & MahindraApr-13 volumes: Above est; Tractor volume surprises with 38% YoY growth,
growth in Auto disappoints with marginal growth of 2% YoY
"We are happy with the
38% growth which we
have achieved during
April 2013. We feel that
this is on the back of
improved market
sentiments. In addition
the expectation of a
normal monsoon is clearly
being seen as a positiveindicator" said Rajesh
Jejurikar, Chief Executive,
Farm Equipment Sector,
on release of tractor
sales.
Bloomberg MM IN
Equi ty Sha res (m) 587.2
CMP (INR) 955
52-Wk Range ( INR) 975/622
1,6,12 Rel .Perf.(%) -3/-1/14
M.Cap. (USD b) 10.6
Highlights M&M's Apr-13 Tractor volumes grew by 38% YoY (+33.9% MoM) to 23,202 units
(v/s 17,250 units). The company mentioned such high growth is due to improved
market sentiments (led by festivals in this month). Our channel interaction
indicates inventory build-up as well, apart from healthy retails, post the inventory
correction undertaken in 4QFY13. For FY14, we forecast a growth of 7% for M&M's
tractor volumes.
Auto volumes grew marginally by 2% YoY (-20% MoM) to 41,432 units (v/s est
~45,338 units). UVs & Pick-ups segment grew by 6.6% YoY (-19.7% MoM) to 35,742
units, against our expectation of 38,225 units. Growth in passenger UVs stood only
at 1% YoY, while SCVs (pick-ups) grew by 10% YoY to 14,414 units. Our industryinteraction indicates pressure across product segments except Bolero. Sales for
XUV5OO is estimated at 2,500 units (v/s FY13 avg of 3,800 units), while Xylo/Quanto
at 1,500 units. 3-wheeler volumes declined by 13.4% YoY (-16.5% MoM) to 4,036
(v/s est 5,032) units.
Pravin Shah, Chief Executive, Automotive Division, Mahindra & Mahindra Ltd.
said on release of monthly Auto division sales, "We are extremely disappointed
that the additional 3% excise duty on SUVs has not been reversed in the Finance Bill.
We remain cautiously optimistic of the current situation and do hope that with the
much awaited and needed reduction in interest rates announcement by the RBI
next week, the auto industry will look up. At Mahindra, we hope to create excitement
with the launch of the Verito Vibe and other product variants".
The stock trades at 12.2x/9.8x consol. FY14E/FY15E EPS of INR 78.6/97.7 respectively.
Maintain Buy.
Snapshot of volumes for April 2013
Apr-13 Apr-12 YoY (%) Mar-13 MoM (%) FY14-YTD Chg (%)FY14
estimateYoY (%)
Total volume 64,634 57,516 12.4 69,234 -6.6 64,634 12.4 868,346 10.6
UV (incl . pick-ups) 35,742 33,531 6.6 44,527 -19.7 35,742 6.6 527,426 12.5
LCV (MNAL) 704 1,028 -31.5 1,335 -47.3 704 -31.5 13,001 10.0
Ve ri to 950 1,501 -36.7 1,211 -21.6 950 -36.7 18,011 15.0
Thre e-Wheele rs 4,036 4,659 -13.4 4,831 -16.5 4,036 -13.4 70,650 8.0
Tractors 23,202 16,797 38.1 17,330 33.9 23,202 38.1 239,259 7.0

7/30/2019 AUTO Dashboard April 2013
http://slidepdf.com/reader/full/auto-dashboard-april-2013 9/36
Dashboard
May 2013 9
Tractor volume (units)
Tractor volumes grew by
38% YoY
Utility vehicle volumes (units)
Product mix
Source: Company, MOSL
Tractors and UVs
dominate the segment
mix, but we expect the
share of three wheelers
and LCVs to increase
Growth in UV volumes
have moderated in Apr-
13
12,000
21,000
30,000
39,000
48,000
Apr Ma y Jun Jul Aug Sep Oct Nov Dec Jan Feb Ma r
FY11 FY12 FY13 FY14
4,000
12,000
20,000
28,000
36,000
Apr Ma y Jun Jul Aug Sep Oct Nov De c Jan Fe b Mar
FY11 FY12 FY13 FY14
0%
25%
50%
75%
100%
A p r - 1 0
J u n - 1 0
A u g - 1 0
O c t - 1 0
D e c - 1 0
F e b - 1 1
A p r - 1 1
J u n - 1 1
A u g - 1 1
O c t - 1 1
D e c - 1 1
F e b - 1 2
A p r - 1 2
J u n - 1 2
A u g - 1 2
O c t - 1 2
D e c - 1 2
F e b - 1 3
A p r - 1 3
UVs Tractors LCVs , 3-wheelers Cars
7/30/2019 AUTO Dashboard April 2013
http://slidepdf.com/reader/full/auto-dashboard-april-2013 10/36
Dashboard
May 2013 10
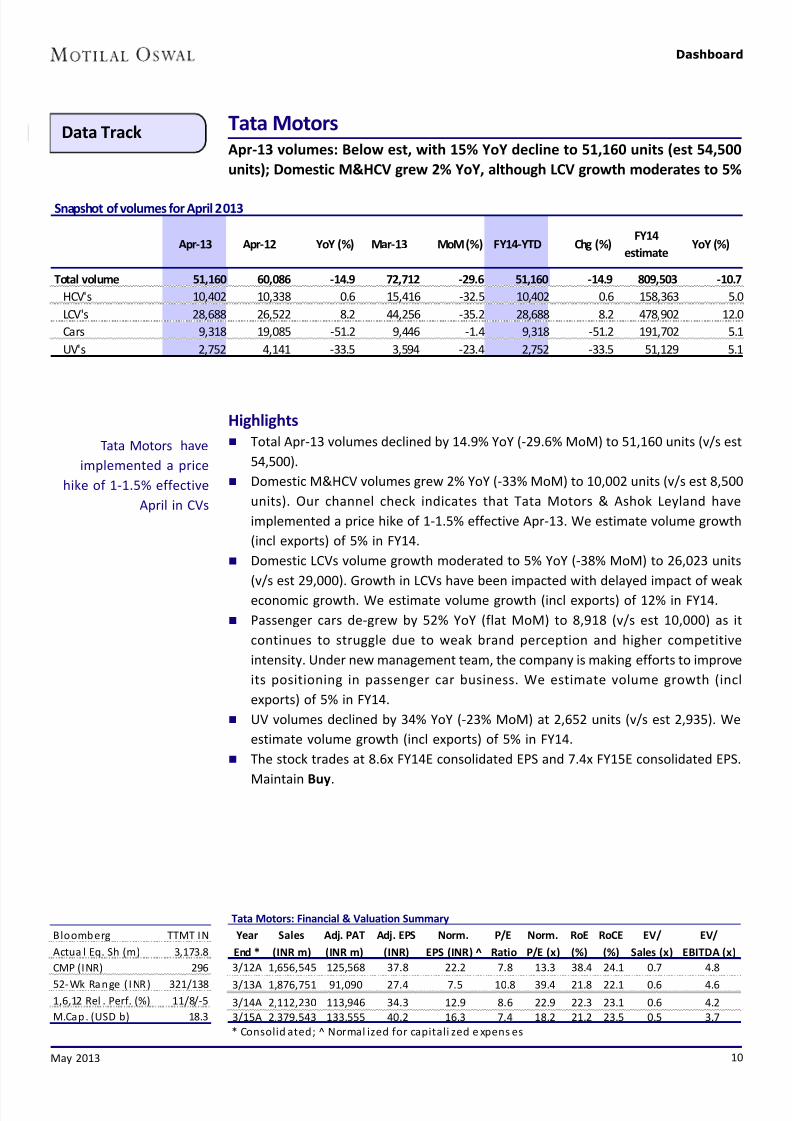
Data Track Tata MotorsApr-13 volumes: Below est, with 15% YoY decline to 51,160 units (est 54,500
units); Domestic M&HCV grew 2% YoY, although LCV growth moderates to 5%
Tata Motors have
implemented a price
hike of 1-1.5% effective
April in CVs
Highlights
Total Apr-13 volumes declined by 14.9% YoY (-29.6% MoM) to 51,160 units (v/s est
54,500).
Domestic M&HCV volumes grew 2% YoY (-33% MoM) to 10,002 units (v/s est 8,500
units). Our channel check indicates that Tata Motors & Ashok Leyland have
implemented a price hike of 1-1.5% effective Apr-13. We estimate volume growth
(incl exports) of 5% in FY14.
Domestic LCVs volume growth moderated to 5% YoY (-38% MoM) to 26,023 units
(v/s est 29,000). Growth in LCVs have been impacted with delayed impact of weak
economic growth. We estimate volume growth (incl exports) of 12% in FY14.
Passenger cars de-grew by 52% YoY (flat MoM) to 8,918 (v/s est 10,000) as it
continues to struggle due to weak brand perception and higher competitive
intensity. Under new management team, the company is making efforts to improve
its positioning in passenger car business. We estimate volume growth (incl
exports) of 5% in FY14.
UV volumes declined by 34% YoY (-23% MoM) at 2,652 units (v/s est 2,935). We
estimate volume growth (incl exports) of 5% in FY14.
The stock trades at 8.6x FY14E consolidated EPS and 7.4x FY15E consolidated EPS.
Maintain Buy.
Bloomberg TTMT IN
Actua l Eq. Sh (m) 3,173.8
CMP (INR) 296
52-Wk Range ( INR) 321/138
1,6,12 Rel . Perf. (%) 11/8/-5
M.Cap. (USD b) 18.3
Tata Motors: Financial & Valuation Summary
Year Sales Adj. PAT Adj. EPS Norm. P/E Norm. RoE RoCE EV/ EV/
End * (INR m) (INR m) (INR) EPS (INR) ̂ Ratio P/E (x) (%) (%) Sales (x) EBITDA (x)
3/12A 1,656,545 125,568 37.8 22.2 7.8 13.3 38.4 24.1 0.7 4.8
3/13A 1,876,751 91,090 27.4 7.5 10.8 39.4 21.8 22.1 0.6 4.6
3/14A 2,112,230 113,946 34.3 12.9 8.6 22.9 22.3 23.1 0.6 4.2
3/15A 2,379,543 133,555 40.2 16.3 7.4 18.2 21.2 23.5 0.5 3.7
* Consolid ated; ^ Normal ized for capitali zed e xpens es
Snapshot of volumes for April 2013
Apr-13 Apr-12 YoY (%) Mar-13 MoM (%) FY14-YTD Chg (%)FY14
estimateYoY (%)
Total volume 51,160 60,086 -14.9 72,712 -29.6 51,160 -14.9 809,503 -10.7
HCV's 10,402 10,338 0.6 15,416 -32.5 10,402 0.6 158,363 5.0
LCV's 28,688 26,522 8.2 44,256 -35.2 28,688 8.2 478,902 12.0
Cars 9,318 19,085 -51.2 9,446 -1.4 9,318 -51.2 191,702 5.1
UV's 2,752 4,141 -33.5 3,594 -23.4 2,752 -33.5 51,129 5.1
7/30/2019 AUTO Dashboard April 2013
http://slidepdf.com/reader/full/auto-dashboard-april-2013 11/36
Dashboard
11
5,000
11,000
17,000
23,000
29,000
35,000
Ap r May Jun Jul Aug Sep Oct Nov Dec Jan Feb Mar
FY11 FY12 FY13 FY14
LCV volumes (units)
Car volumes (units)
Source: Company, MOSL
Product mix in the CV segment
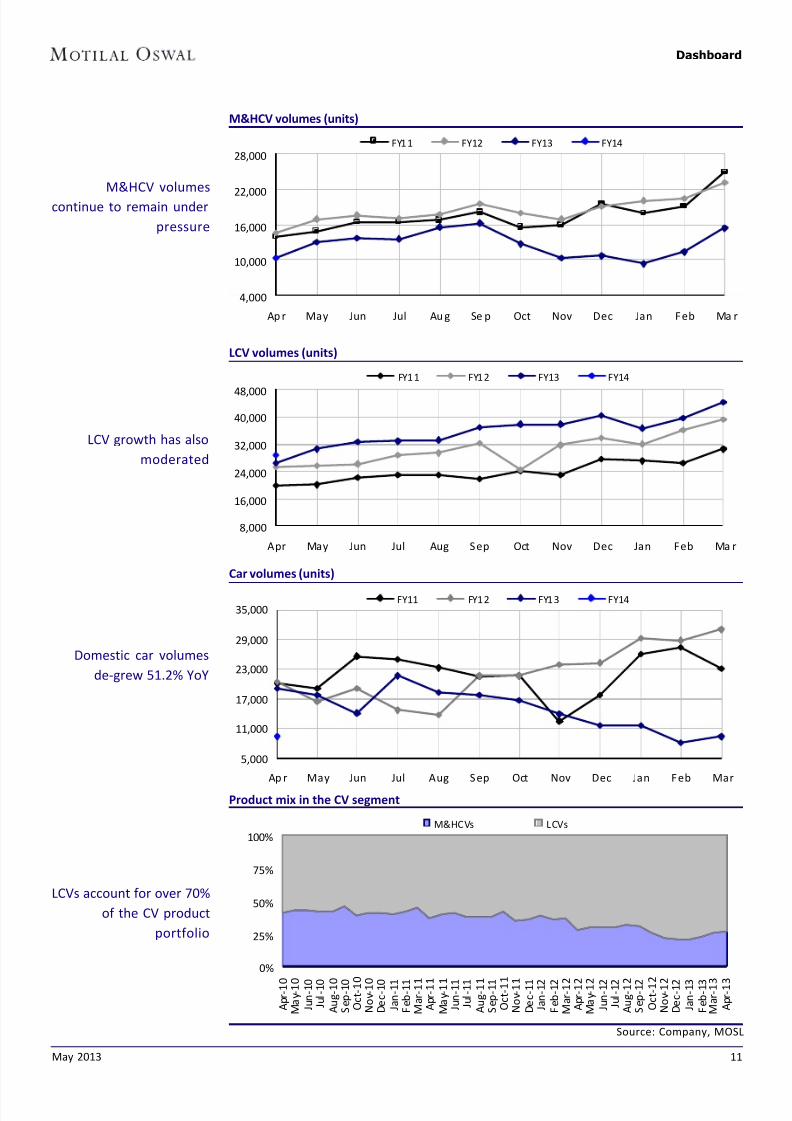
LCV growth has also
moderated
Domestic car volumes
de-grew 51.2% YoY
M&HCV volumes (units)
M&HCV volumes
continue to remain under
pressure
LCVs account for over 70%
of the CV product
portfolio
4,000
10,000
16,000
22,000
28,000
Ap r May Jun Jul Au g Se p Oct Nov Dec Jan Feb Ma r
FY11 FY12 FY13 FY14
8,000
16,000
24,000
32,000
40,000
48,000
Apr May Jun Jul Aug Sep Oct Nov Dec Jan Feb Ma r
FY11 FY12 FY13 FY14
0%
25%
50%
75%
100%
A p r - 1 0
M a y - 1 0
J u n - 1 0
J u l - 1 0
A u g - 1 0
S e p - 1 0
O c t - 1 0
N o v - 1 0
D e c - 1 0
J a n - 1 1
F e b - 1 1
M a r - 1 1
A p r - 1 1
M a y - 1 1
J u n - 1 1
J u l - 1 1
A u g - 1 1
S e p - 1 1
O c t - 1 1
N o v - 1 1
D e c - 1 1
J a n - 1 2
F e b - 1 2
M a r - 1 2
A p r - 1 2
M a y - 1 2
J u n - 1 2
J u l - 1 2
A u g - 1 2
S e p - 1 2
O c t - 1 2
N o v - 1 2
D e c - 1 2
J a n - 1 3
F e b - 1 3
M a r - 1 3
A p r - 1 3
M&HCVs LCVs
May 2013

7/30/2019 AUTO Dashboard April 2013
http://slidepdf.com/reader/full/auto-dashboard-april-2013 12/36
Dashboard
May 2013 12
Data Track Ashok LeylandBelow est; MHCVs decline by 18.8% YoY to 5,251 (v/s 5,821), Dost volume grows
only by 1%
Ashok Leyland haveimplemented a price
hike of 1-1.5% and
discount reduction of 20-
25% MoM effective Apr-
13, as per our industry
interactions
Highlights
Ashok Leyland Apr-13 volumes declined by 13.8% YoY (-46.6% MoM) to 7,487 (v/s
est 8,686 units).
MHCVs registered a decline of 18.8% YoY (-45.8% MoM) to 5,251 units (v/s est
5,821 units) as weak economic growth impact freight availability and transporters
profitability. We estimate 6% growth in FY14 MHCV volumes.
Dost (LCV) sales at 2,236 units (v/s est 3,250 units), a growth of 1% YoY. We estimate
DOST volumes of 50,000 units in FY14.
With expected improvement in macro-economic environment, we expect MHCV
industry to recover in 2HFY14/FY15. AL, being pure play and second largest CV
player in India, is the best bet to play expected improvement in CV cycle.
The stock trades at 13.4x/9.3x FY14E/FY15E earnings of INR1.7/2.5 respectively.Maintain Buy.
Ashok Leyland: Financial & Valuation Summary
Year Net Sales PAT EPS EPS P/E P/BV RoE RoCE EV/ EV/
End (INR m) (INR m) (INR) Gr. (%) (x) (x) (%) (%) Sales (x) EBITDA (x)
3/11A 111,771 6,313 4.7 48.1 4.8 1.5 16.5 14.8 0.4 4.1
3/12A 128,420 5,660 2.1 -55.3 10.8 1.5 13.8 12.5 0.7 6.9
3/13E 123,590 4,155 1.0 -50.8 22.0 1.4 6.6 8.0 0.9 10.2
3/14E 141,214 4,564 1.7 64.2 13.4 1.4 10.5 10.3 0.8 7.7
3/15E 166,587 6,567 2.5 43.9 9.3 1.3 14.6 12.6 0.7 6.6
Bloomberg AL IN
Eq ui ty Sh are s (m) 2660.68
52-Wee k Range 33/20
1,6,12 Re l . Pe rf. (%) 4/-3/-29
M.Cap. (INR b) 61
M.Cap. (USD b) 1.1
Snapshot of volumes for April 2013
Apr‐13 Apr‐12 YoY (%) Mar‐13 MoM (%) FY14‐YTD Chg (%)FY14
estimateYoY (%)
Total volume 7,487 8,686 ‐13.8 14,020 ‐46.6 7,487 ‐13.8 134,547 17.5
CV (e x DOST SCV) 5,251 6,468 -18.8 9,695 -45.8 5,251 -18.8 84,547 6.0
DOST 2,236 2,218 0.8 4,325 -48.3 2,236 0.8 50,000 44.1

7/30/2019 AUTO Dashboard April 2013
http://slidepdf.com/reader/full/auto-dashboard-april-2013 13/36
Dashboard
May 2013 13
Eicher MotorsAbove est, Buses continues to grow strongly with 41% YoY growth, decline in
LMD restricted to 11% (v/s 15.6% CY13-YTD)
Data Track
Royal Enfield continues
to enjoy average waiting
period of over 8-10
months across products.
Highlights
Eicher Motor's Apr-13 CV volumes declined 7% YoY (-11% MoM) to 3,917 units
(v/s est 3,638 units). Sales volumes were higher across segments v/s our estimates.
LMD segment declined by 10.6% YoY (-24.6% MoM) to 2,126 units. For CY13, we
estimate Eicher's LMD segment to decline by 12.8%.
HD volumes declined by 35.3% YoY (-42.2% MoM) to 506 units. For domestic HD
segment, we estimate 5.6% decline in CY13 for Eicher Motors due to challenging
macro-economic environment.
Bus volumes have increased by 41.4% YoY (+6.6% MoM) to 1,134 units. For CY13,
Eicher buses are expected to grow by 11.8%.
CY13 would witness the benefit in volumes from the start of bus body plant (in
1QFY13), commencement of medium duty engine project (3QCY13) and launch of
the new HD range in 4QCY13 (jointly developed by Eicher-Volvo).
Royal Enfield sales have grown by 42% YoY to 12,788 units. The company is targeting
sales of 175,000 units (v/s 113k units in CY12).
Eicher Motors trades at 26.6x/18.7x/13.7x CY13E/CY14E/CY15E EPS of INR 114.3/
163.0/222.5. Maintain Buy.
Snapshot of volumes for April 2013
Apr-13 Apr-12YoY (%)
chg
March1
3
MoM
(%) chgCY13
YTD (%)
chg
CY13
estimate
YoY (%)
chg
Residual
Growth
(%)
Residual
Monthly
Run rate
CY13
YTD
Monthly
Run rate
Royal Enfie ld 12,788 9,007 42.0 12,139 5.3 47,524 44.4 180,432 59.1 65.0 16,613 11,881
VECV 3,917 4,213 -7.0 4,962 -21.1 16,305 -11.4 44,497 -7.8 -5.6 3,524 4,076
Domes tic LMD 2,126 2,379 -10.6 2,820 -24.6 9,765 -15.6 25,762 -12.8 -11.0 2,000 2,441
Domestic HD 506 782 -35.3 876 -42.2 2,615 -14.9 7,268 -5.6 0.6 582 654
Domestic Buses 1,134 802 41.4 1,064 6.6 3,322 16.8 9,524 11.8 9.3 775 831
Total Domestic 3,766 3,963 -5.0 4,760 -20.9 15,702 -10.2 42,554 -7.0 -5.0 3,356 3,926
Exports 151 250 -39.6 202.0 -25.248 603 -34.6 1,944 -22.3 -15.1 168 151
Source: Compa ny, MOSL
Bloomberg EIM IN
Equity Sha res (m) 27.0
52-Wk Ra nge (INR) 3,240/1,620
1,6,12 Rel . Perf. (%) 3/26/56
M.Cap. (INR b) 72.7M.Cap. (USD b) 1.3
Eicher Motors: Financial & Valuation Summary
Year Net Sales PAT EPS EPS P/E P/BV RoE RoCE EV/EBITDA Div. Yld
End (INR b) (INR b) (INR) Gr (%) (x) (x) (%) (%) (x) (%)
12/12A 63.9 3.2 120.2 5.1 25.3 4.8 20.3 22.9 20.7 0.6
12/13E 71.7 3.1 114.3 -4.9 26.6 4.3 17.1 17.5 18.5 0.6
12/14E 95.3 4.4 163.0 42.6 18.7 3.7 21.4 23.7 11.3 0.912/15E 119.1 6.0 222.5 36.5 13.7 3.1 25.0 28.6 7.8 1.2
7/30/2019 AUTO Dashboard April 2013
http://slidepdf.com/reader/full/auto-dashboard-april-2013 14/36
Dashboard
May 2013 14
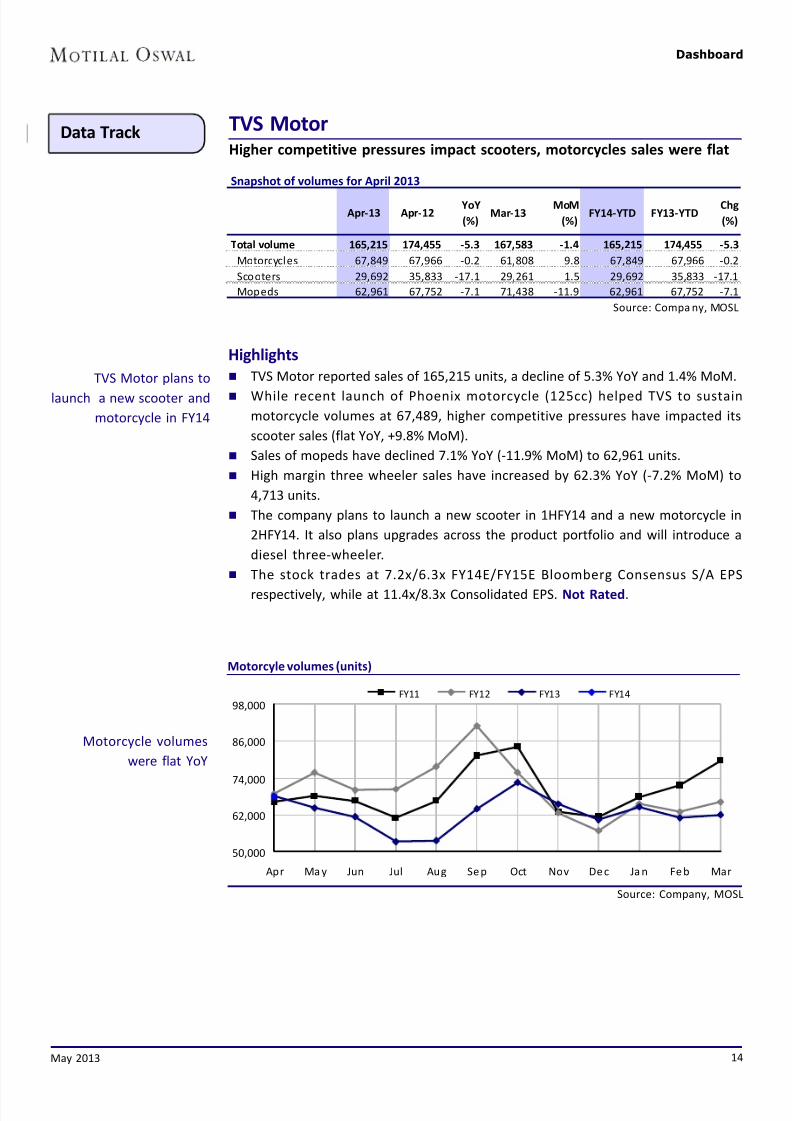
TVS MotorHigher competitive pressures impact scooters, motorcycles sales were flat
Data Track
Motorcyle volumes (units)
Motorcycle volumes
were flat YoY
Snapshot of volumes for April 2013
Apr‐13 Apr‐12YoY
(%)Mar‐13
MoM
(%)FY14‐YTD FY13‐YTD
Chg
(%)
Total volume 165,215 174,455 ‐5.3 167,583 ‐1.4 165,215 174,455 ‐5.3
Motorcycles 67,849 67,966 ‐0.2 61,808 9.8 67,849 67,966 ‐0.2
Scooters 29,692 35,833 ‐17.1 29,261 1.5 29,692 35,833 ‐17.1
Mopeds 62,961 67,752 ‐7.1 71,438 ‐11.9 62,961 67,752 ‐7.1
Source: Compa ny, MOSL
TVS Motor plans to
launch a new scooter and
motorcycle in FY14
Highlights
TVS Motor reported sales of 165,215 units, a decline of 5.3% YoY and 1.4% MoM.
While recent launch of Phoenix motorcycle (125cc) helped TVS to sustain
motorcycle volumes at 67,489, higher competitive pressures have impacted its
scooter sales (flat YoY, +9.8% MoM).
Sales of mopeds have declined 7.1% YoY (-11.9% MoM) to 62,961 units.
High margin three wheeler sales have increased by 62.3% YoY (-7.2% MoM) to
4,713 units.
The company plans to launch a new scooter in 1HFY14 and a new motorcycle in
2HFY14. It also plans upgrades across the product portfolio and will introduce a
diesel three-wheeler.
The stock trades at 7.2x/6.3x FY14E/FY15E Bloomberg Consensus S/A EPS
respectively, while at 11.4x/8.3x Consolidated EPS. Not Rated.
Source: Company, MOSL
50,000
62,000
74,000
86,000
98,000
Apr Ma y Jun Jul Aug Se p Oct Nov De c Ja n Fe b Mar
FY11 FY12 FY13 FY14
7/30/2019 AUTO Dashboard April 2013
http://slidepdf.com/reader/full/auto-dashboard-april-2013 15/36
Dashboard
15
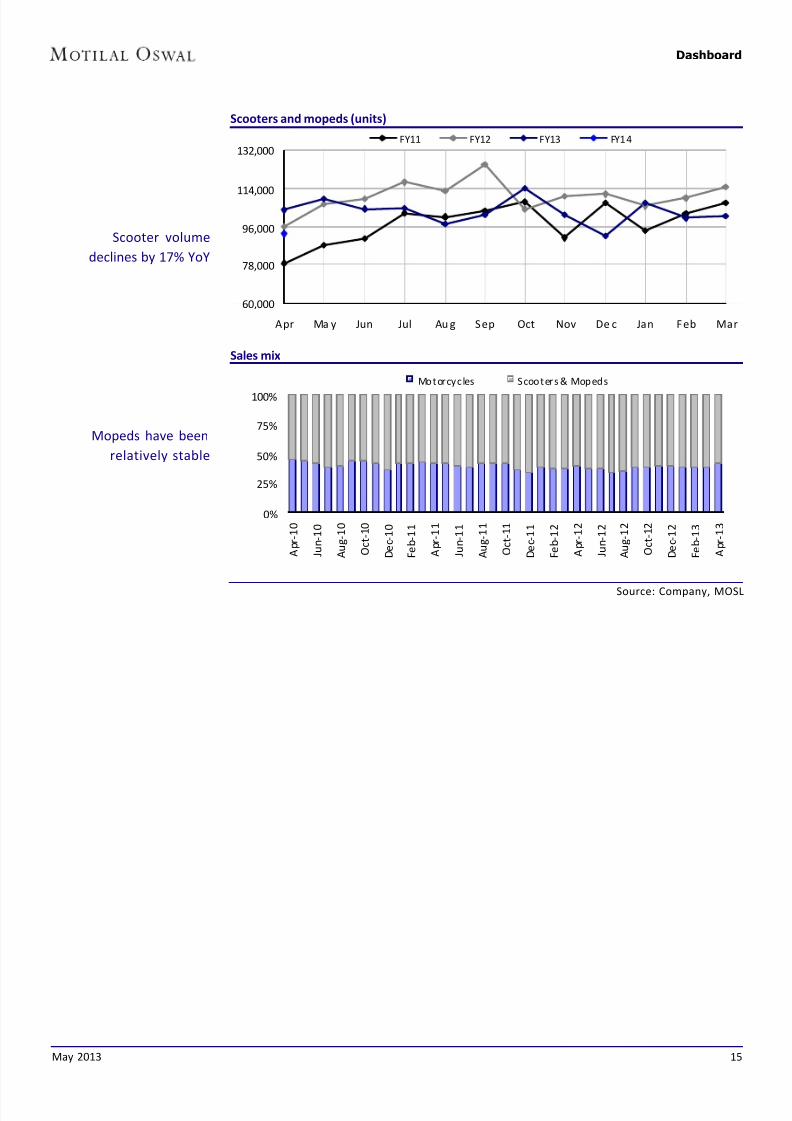
Scooters and mopeds (units)
Sales mix
Source: Company, MOSL
Mopeds have been
relatively stable
Scooter volume
declines by 17% YoY
0%
25%
50%
75%
100%
A p r - 1 0
J u n - 1 0
A u g - 1 0
O c t - 1 0
D e c - 1 0
F e b - 1 1
A p r - 1 1
J u n - 1 1
A u g - 1 1
O c t - 1 1
D e c - 1 1
F e b - 1 2
A p r - 1 2
J u n - 1 2
A u g - 1 2
O c t - 1 2
D e c - 1 2
F e b - 1 3
A p r - 1 3
Motorcycles Scooters & Mopeds
60,000
78,000
96,000
114,000
132,000
Apr Ma y Jun Jul Au g Sep Oct Nov De c Jan Feb Mar
FY11 FY12 FY13 FY14
May 2013
7/30/2019 AUTO Dashboard April 2013
http://slidepdf.com/reader/full/auto-dashboard-april-2013 16/36
Dashboard
16
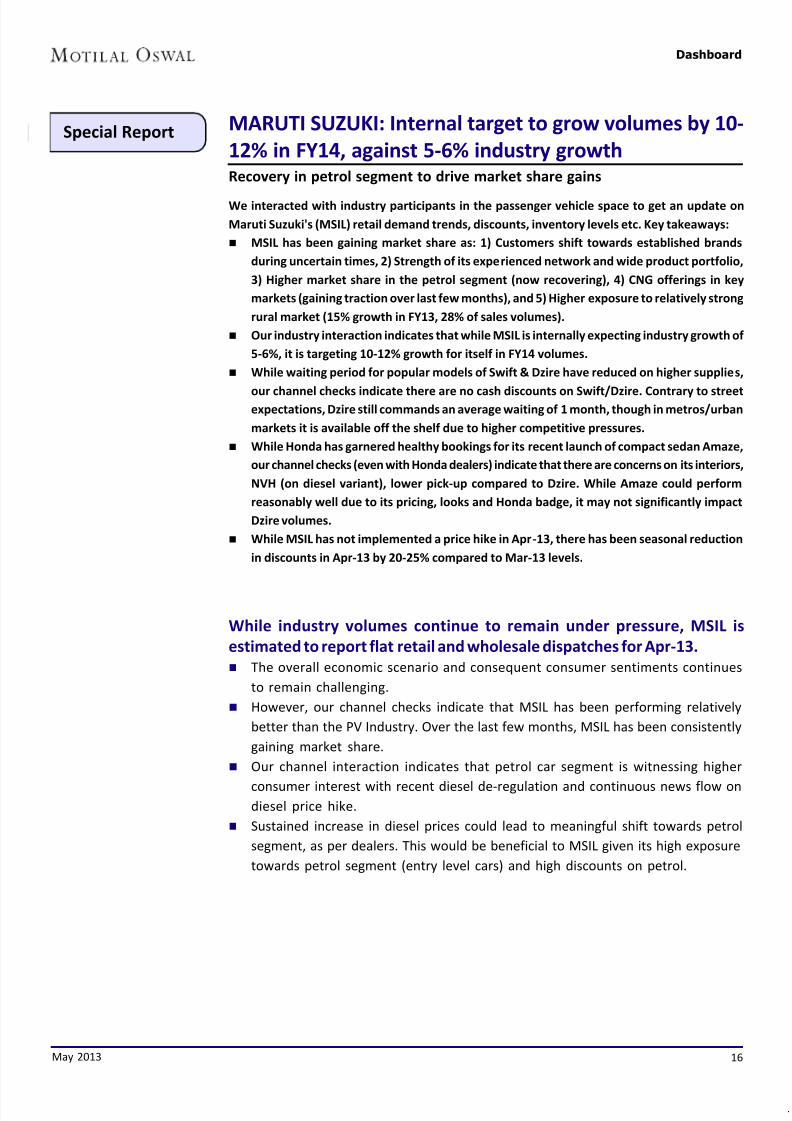
Special Report MARUTI SUZUKI: Internal target to grow volumes by 10-
12% in FY14, against 5-6% industry growthRecovery in petrol segment to drive market share gains
We interacted with industry participants in the passenger vehicle space to get an update on
Maruti Suzuki's (MSIL) retail demand trends, discounts, inventory levels etc. Key takeaways:
MSIL has been gaining market share as: 1) Customers shift towards established brands
during uncertain times, 2) Strength of its experienced network and wide product portfolio,
3) Higher market share in the petrol segment (now recovering), 4) CNG offerings in key
markets (gaining traction over last few months), and 5) Higher exposure to relatively strong
rural market (15% growth in FY13, 28% of sales volumes).
Our industry interaction indicates that while MSIL is internally expecting industry growth of
5-6%, it is targeting 10-12% growth for itself in FY14 volumes.
While waiting period for popular models of Swift & Dzire have reduced on higher supplies,
our channel checks indicate there are no cash discounts on Swift/Dzire. Contrary to streetexpectations, Dzire still commands an average waiting of 1 month, though in metros/urban
markets it is available off the shelf due to higher competitive pressures.
While Honda has garnered healthy bookings for its recent launch of compact sedan Amaze,
our channel checks (even with Honda dealers) indicate that there are concerns on its interiors,
NVH (on diesel variant), lower pick-up compared to Dzire. While Amaze could perform
reasonably well due to its pricing, looks and Honda badge, it may not significantly impact
Dzire volumes.
While MSIL has not implemented a price hike in Apr-13, there has been seasonal reduction
in discounts in Apr-13 by 20-25% compared to Mar-13 levels.
While industry volumes continue to remain under pressure, MSIL is
estimated to report flat retail and wholesale dispatches for Apr-13.
The overall economic scenario and consequent consumer sentiments continues
to remain challenging.
However, our channel checks indicate that MSIL has been performing relatively
better than the PV Industry. Over the last few months, MSIL has been consistently
gaining market share.
Our channel interaction indicates that petrol car segment is witnessing higher
consumer interest with recent diesel de-regulation and continuous news flow ondiesel price hike.
Sustained increase in diesel prices could lead to meaningful shift towards petrol
segment, as per dealers. This would be beneficial to MSIL given its high exposure
towards petrol segment (entry level cars) and high discounts on petrol.
May 2013

7/30/2019 AUTO Dashboard April 2013
http://slidepdf.com/reader/full/auto-dashboard-april-2013 17/36
Dashboard
17
MSIL's market share have been on a rising trend MSIL has higher market share in petrol segment
MSIL internally targeting 10-12% growth in FY14 volumes, higher thanindustry volume growth expectation of 5-6%
While MSIL expects domestic industry volume growth of 5-6% in FY14, it is internally
targeting higher than industry growth at 10-12% in FY14 volumes.
MSIL has been gaining market share as 1) Customers shift towards established
brands during uncertain times, 2) Strength of its experienced/extensive network
and wide product portfolio, 3) Higher market share in the petrol segment (now
recovering), 4) CNG offerings in key markets of Delhi/Mumbai (gaining traction
over last few months), and 5) Higher exposure to relatively strong rural market
(15% growth in FY13, 28% of sales volumes).
Waiting period for popular diesel models have reduced on higher supplies;
Contrary to street expectations, Dzire still commands an average waiting
of 1 month
Strong response to new model launches (Swift, Dzire, Ertiga), shift of preference
towards diesel variants (due to differential fuel pricing) and lock-out at Manesar
led to huge order backlog for diesel variants of popular models for MSIL.
Post the normalization of Manesar operations, MSIL has been focusing on
increasing the supply of diesel variants of such popular models.
This has led to reduction in waiting period for diesel variants of Swift/Dzire and
almost NIL for Ertiga, while petrol variants of Swift/Dzire had come under waiting
list for few months.
Our channel interaction indicates that waiting period for Swift/Dzire have reduced
over the last few months on higher supplies.
However, Dzire continues to command a waiting period of average 1 month, though
in metros/urban markets it is available off the shelf on higher supplies (due to
relatively higher competitive pressures).
Despite declining waiting period, our channel checks indicate there are no cash
discounts on Swift/Dzire.
May 2013
7/30/2019 AUTO Dashboard April 2013
http://slidepdf.com/reader/full/auto-dashboard-april-2013 18/36
Dashboard
18
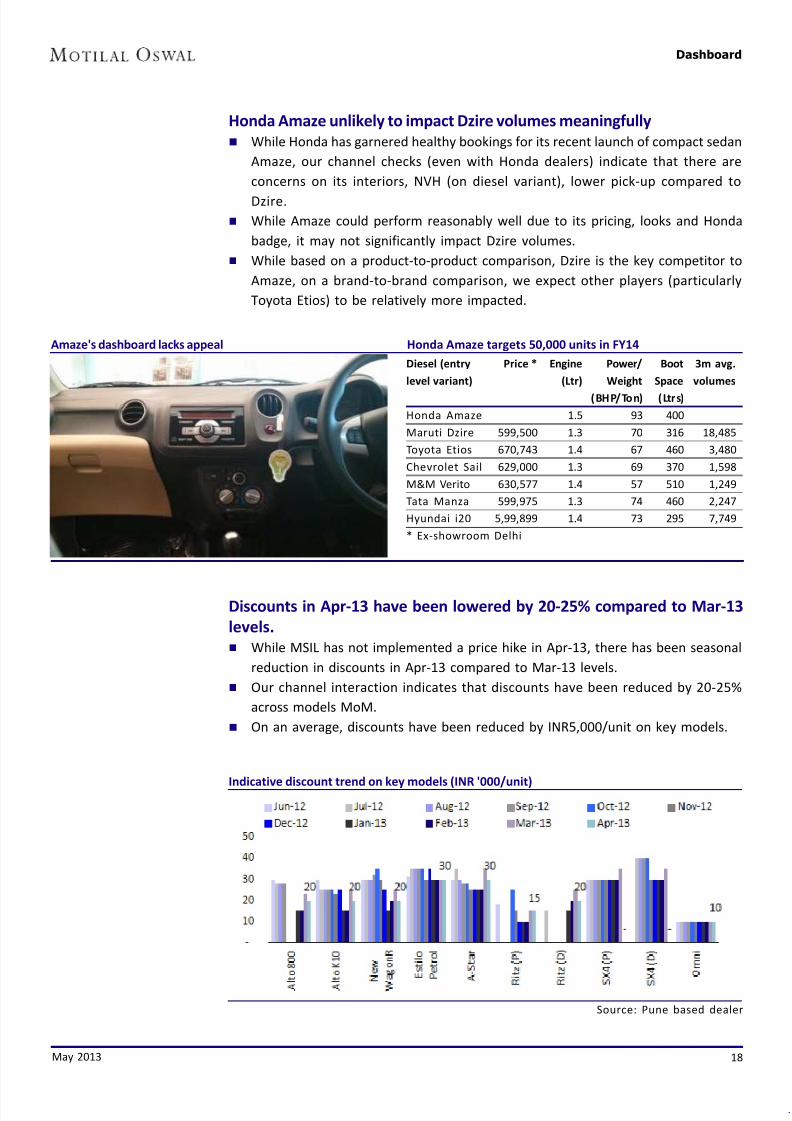
Honda Amaze unlikely to impact Dzire volumes meaningfully
While Honda has garnered healthy bookings for its recent launch of compact sedan
Amaze, our channel checks (even with Honda dealers) indicate that there are
concerns on its interiors, NVH (on diesel variant), lower pick-up compared to
Dzire.
While Amaze could perform reasonably well due to its pricing, looks and Honda
badge, it may not significantly impact Dzire volumes.
While based on a product-to-product comparison, Dzire is the key competitor to
Amaze, on a brand-to-brand comparison, we expect other players (particularly
Toyota Etios) to be relatively more impacted.
Amaze's dashboard lacks appeal Honda Amaze targets 50,000 units in FY14
Discounts in Apr-13 have been lowered by 20-25% compared to Mar-13
levels.
While MSIL has not implemented a price hike in Apr-13, there has been seasonal
reduction in discounts in Apr-13 compared to Mar-13 levels.
Our channel interaction indicates that discounts have been reduced by 20-25%
across models MoM.
On an average, discounts have been reduced by INR5,000/unit on key models.
Indicative discount trend on key models (INR '000/unit)
Source: Pune based dealer
Diesel (entry Price * Engine Power/ Boot 3m avg.
level variant) (Ltr) Weight Space volumes
(BHP/Ton) (Ltrs)
Honda Amaze 1.5 93 400
Maruti Dzire 599,500 1.3 70 316 18,485
Toyota Etios 670,743 1.4 67 460 3,480
Chevrolet Sail 629,000 1.3 69 370 1,598
M&M Verito 630,577 1.4 57 510 1,249
Tata Manza 599,975 1.3 74 460 2,247
Hyundai i20 5,99,899 1.4 73 295 7,749
* Ex-showroom Delhi
May 2013

7/30/2019 AUTO Dashboard April 2013
http://slidepdf.com/reader/full/auto-dashboard-april-2013 19/36
Dashboard
19
Special Report INDIA AUTO (2W): HMSI launches its cheapest new 110cc
motorcycle Dream Neo priced against Hero's SplendorHMSI aims to grow by 43% in FY14 to 3.93m units
HMSI has further expanded its product portfolio with the launch of 110cc motorcycle under
Dream series (Dream Neo) - its cheapest and most fuel efficient offering in India.
Dream Neo is priced at INR 43,150 (ex-showroom Delhi), INR2k cheaper than Dream Yuga
and similarly priced as Hero's Splendor (INR42,950, ex-showroom Delhi).
Dream Neo has the same engine (and looks) as Dream Yuga with marginally higher mileage
and lower power/torque than Dream Yuga. Dream Neo outputs a peak power of 8.36 PS at
7,500 rpm and a peak torque of 8.633 Nm at 5,500 rpm. These figures are slightly lower
than the 8.5 Bhp-8.91 Nm of Dream Yuga.
HMSI targets to grow by 150% in 100-110cc mass market segment in FY14. It is confident of
achieving 43% growth in FY14 to 3.93m units.
Talking about Honda's strategic direction, Mr. Keita Muramatsu - President & CEO, HMSI, said
"DREAM NEO is Honda's next big leap towards creating deep inroads into the Indian commuter
segment. Our newly opened Technical centre comprising of R&D, Engineering, Purchase &
Quality team, overcame the challenge of improving Mileage and meeting the competitive
price point. Backed by our new product launches & network expansion, Honda aims to grow
over 150% in 100-110cc motorcycle segment YoY. Overall, we are confident of customer
demand for Honda 2Wheelers and eye 43% growth with 39.3 lac unit sales in FY'14."
Elaborating on Dream Neo, Mr. Y. S. Guleria, Vice President - Sales & Marketing, HMSI, said
"Creating a new paradigm in mass mobility, DREAM NEO is Honda's Most Affordable and
Most Fuel Efficient 2Wheeler ever in India. While DREAM NEO is loaded with attractive & best
in class features like Top Mileage of 74 kmpl*, it is being delivered at a truly aggressive pricingto delight Indian customers. Finally DREAM NEO is a package which is hard to resist by 100-
110cc mass segment motorcycle customers".
Valuation & view: We expect two-wheeler volume recovery to be back-ended in
FY14, with near term volumes expected to remain weak. This coupled with HMSI's
continued expansion on capacity, dealer network and product portfolio would result
in sustained pressure on the domestic players. While valuations for both Hero
MotoCorp and Bajaj Auto are reasonable, demand recovery along with stability in
competitive intensity would be key driver for stock performance.
Honda Dream Neo
May 2013
7/30/2019 AUTO Dashboard April 2013
http://slidepdf.com/reader/full/auto-dashboard-april-2013 20/36
Dashboard
20
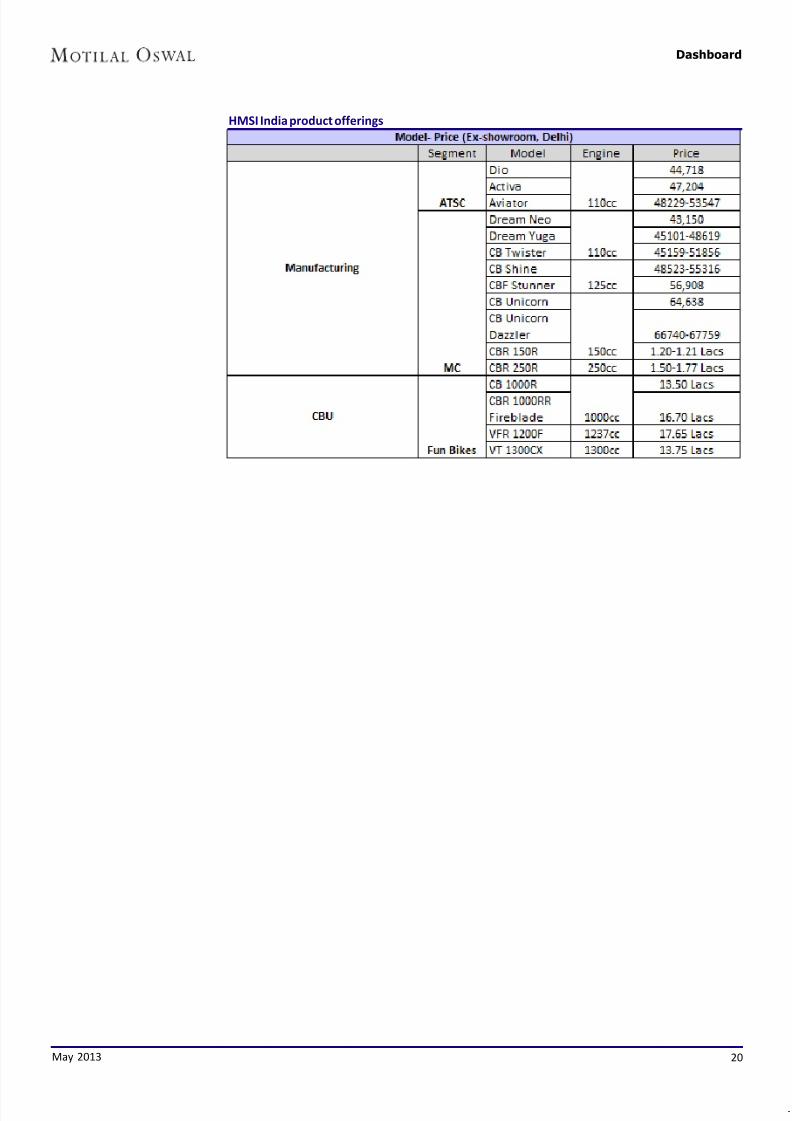
HMSI India product offerings
May 2013
7/30/2019 AUTO Dashboard April 2013
http://slidepdf.com/reader/full/auto-dashboard-april-2013 21/36
Dashboard
May 2013 21
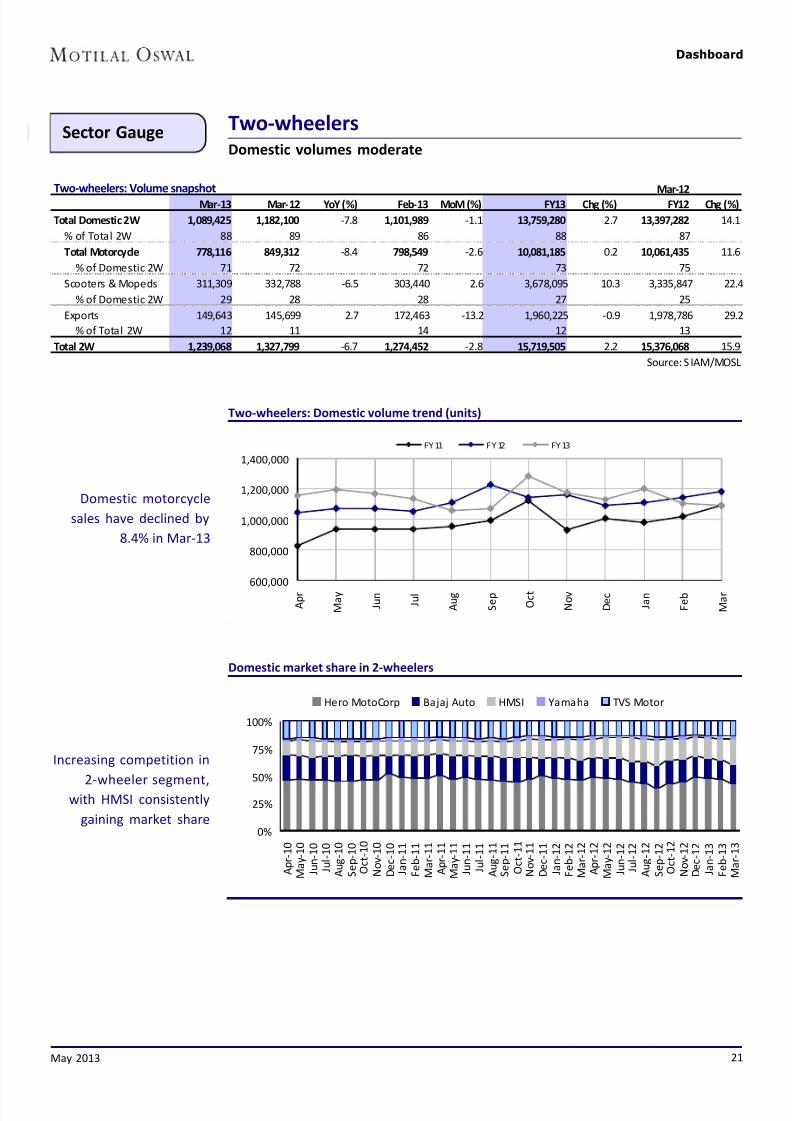
Sector Gauge Two-wheelersDomestic volumes moderate
Two-wheelers: Domestic volume trend (units)
Domestic market share in 2-wheelers
Domestic motorcycle
sales have declined by
8.4% in Mar-13
Increasing competition in
2-wheeler segment,with HMSI consistently
gaining market share
Two-wheelers: Volume snapshot Mar-12
Mar-13 Mar-12 YoY (%) Feb-13 MoM (%) FY13 Chg (%) FY12 Chg (%)
Total Domestic 2W 1,089,425 1,182,100 -7.8 1,101,989 -1.1 13,759,280 2.7 13,397,282 14.1
% of Total 2W 88 89 86 88 87
Total Motorcycle 778,116 849,312 -8.4 798,549 -2.6 10,081,185 0.2 10,061,435 11.6
% of Domestic 2W 71 72 72 73 75
Scooters & Mopeds 311,309 332,788 -6.5 303,440 2.6 3,678,095 10.3 3,335,847 22.4
% of Domestic 2W 29 28 28 27 25
Exports 149,643 145,699 2.7 172,463 -13.2 1,960,225 -0.9 1,978,786 29.2
% of Total 2W 12 11 14 12 13
Total 2W 1,239,068 1,327,799 -6.7 1,274,452 -2.8 15,719,505 2.2 15,376,068 15.9
Source: S IAM/MOSL
0%
25%
50%
75%
100%
A p r - 1 0
M a y - 1 0
J u n - 1 0
J u l - 1 0
A u g - 1 0
S e p - 1 0
O c t - 1 0
N o v - 1 0
D e c - 1 0
J a n - 1 1
F e b - 1 1
M a r - 1 1
A p r - 1 1
M a y - 1 1
J u n - 1 1
J u l - 1 1
A u g - 1 1
S e p - 1 1
O c t - 1 1
N o v - 1 1
D e c - 1 1
J a n - 1 2
F e b - 1 2
M a r - 1 2
A p r - 1 2
M a y - 1 2
J u n - 1 2
J u l - 1 2
A u g - 1 2
S e p - 1 2
O c t - 1 2
N o v - 1 2
D e c - 1 2
J a n - 1 3
F e b - 1 3
M a r - 1 3
Hero MotoCorp Bajaj Auto HMSI Yamaha TVS Motor
600,000
800,000
1,000,000
1,200,000
1,400,000
A p r
M a y
J u n
J u l
A u g
S e p
O c t
N o v
D e c
J a n
F e b
M a r
FY 11 F Y 12 FY 13
7/30/2019 AUTO Dashboard April 2013
http://slidepdf.com/reader/full/auto-dashboard-april-2013 22/36
Dashboard
May 2013 22
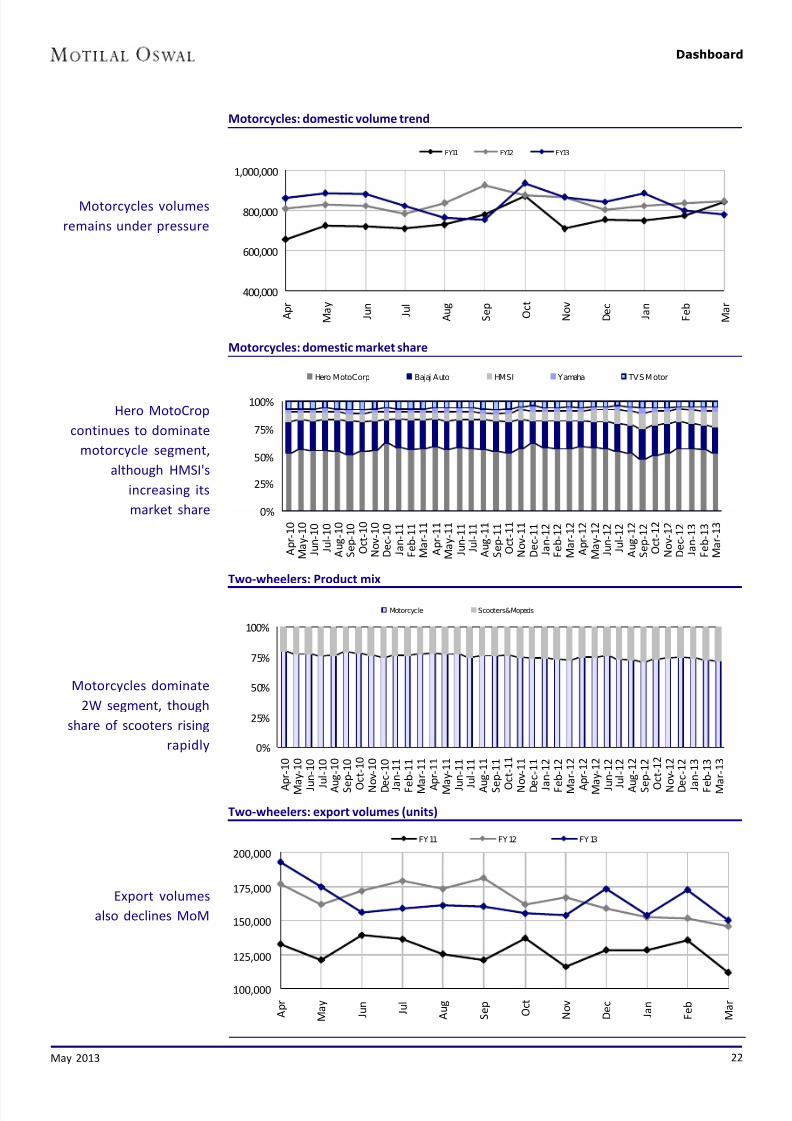
Motorcycles: domestic volume trend
Motorcycles: domestic market share
Two-wheelers: Product mix
Two-wheelers: export volumes (units)
Motorcycles volumes
remains under pressure
Motorcycles dominate
2W segment, though
share of scooters rising
rapidly
Export volumes
also declines MoM
Hero MotoCrop
continues to dominate
motorcycle segment,
although HMSI's
increasing its
market share
400,000
600,000
800,000
1,000,000
A p r
M a y
J u n
J u l
A u g
S e p
O c t
N o v
D e c
J a n
F e b
M a r
FY11 FY12 FY13
0%
25%
50%
75%
100%
A p r ‐ 1 0
M a y
‐ 1 0
J u n
‐ 1 0
J u l ‐ 1 0
A u g
‐ 1 0
S e p
‐ 1 0
O c t ‐ 1 0
N o v
‐ 1 0
D e c
‐ 1 0
J a n
‐ 1 1
F e b
‐ 1 1
M a r ‐ 1 1
A p r ‐ 1 1
M a y
‐ 1 1
J u n
‐ 1 1
J u l ‐ 1 1
A u g
‐ 1 1
S e p
‐ 1 1
O c t
‐ 1 1
N o v
‐ 1 1
D e c
‐ 1 1
J a n
‐ 1 2
F e b
‐ 1 2
M a r ‐ 1 2
A p r ‐ 1 2
M a y
‐ 1 2
J u n
‐ 1 2
J u l ‐ 1 2
A u g
‐ 1 2
S e p
‐ 1 2
O c t ‐ 1 2
N o v
‐ 1 2
D e c ‐ 1 2
J a n
‐ 1 3
F e b
‐ 1 3
M a r ‐ 1 3
Hero MotoCorp Bajaj Auto HMSI Yamaha TVS Motor
0%
25%
50%
75%
100%
A p r ‐ 1 0
M a y
‐ 1 0
J u
n ‐
1 0
J u l ‐ 1 0
A u
g ‐
1 0
S e
p ‐
1 0
O
c t ‐ 1 0
N o v
‐ 1 0
D e
c ‐
1 0
J a
n ‐
1 1
F e
b ‐
1 1
M a r ‐ 1 1
A p r ‐ 1 1
M a y
‐ 1 1
J u
n ‐
1 1
J u l ‐ 1 1
A u
g ‐
1 1
S e
p ‐
1 1
O
c t ‐ 1 1
N o v
‐ 1 1
D e
c ‐
1 1
J a
n ‐
1 2
F e
b ‐
1 2
M a r ‐ 1 2
A p r ‐ 1 2
M a y
‐ 1 2
J u
n ‐
1 2
J u l ‐ 1 2
A u
g ‐
1 2
S e
p ‐
1 2
O
c t ‐ 1 2
N o v ‐ 1 2
D e
c ‐
1 2
J a
n ‐
1 3
F e
b ‐
1 3
M a r ‐ 1 3
Motorcycle Scooters & Mopeds
100,000
125,000
150,000
175,000
200,000
A p r
M a y
J u n
J u l
A u g
S e p
O c t
N o v
D e c
J a n
F e b
M a r
FY11 FY12 FY13
7/30/2019 AUTO Dashboard April 2013
http://slidepdf.com/reader/full/auto-dashboard-april-2013 23/36
Dashboard
23
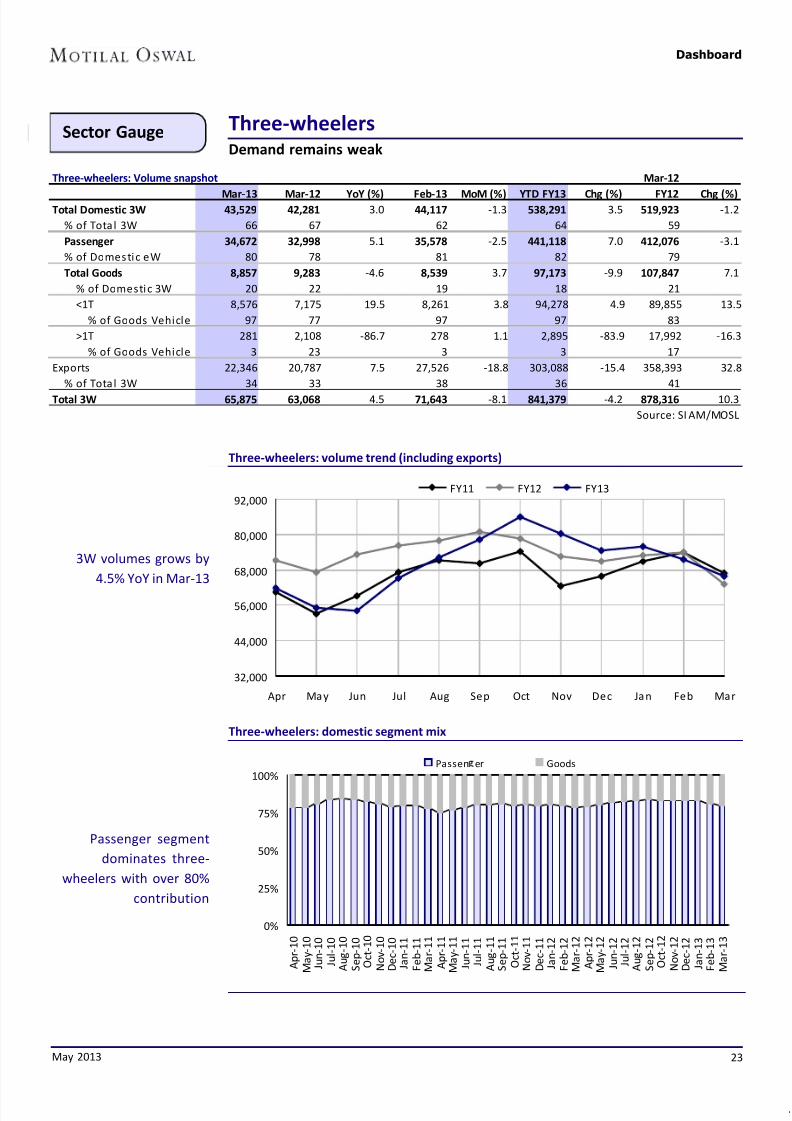
Sector Gauge Three-wheelersDemand remains weak
Three-wheelers: volume trend (including exports)
Three-wheelers: domestic segment mix
3W volumes grows by
4.5% YoY in Mar-13
Passenger segment
dominates three-
wheelers with over 80%
contribution
Three-wheelers: Volume snapshot Mar-12
Mar-13 Mar-12 YoY (%) Feb-13 MoM (%) YTD FY13 Chg (%) FY12 Chg (%)Total Domestic 3W 43,529 42,281 3.0 44,117 -1.3 538,291 3.5 519,923 -1.2
% of Tota l 3W 66 67 62 64 59
Passenger 34,672 32,998 5.1 35,578 -2.5 441,118 7.0 412,076 -3.1
% of Domestic eW 80 78 81 82 79
Total Goods 8,857 9,283 -4.6 8,539 3.7 97,173 -9.9 107,847 7.1
% of Domestic 3W 20 22 19 18 21
<1T 8,576 7,175 19.5 8,261 3.8 94,278 4.9 89,855 13.5
% of Goods Vehicle 97 77 97 97 83
>1T 281 2,108 -86.7 278 1.1 2,895 -83.9 17,992 -16.3
% of Goods Vehicle 3 23 3 3 17
Exports 22,346 20,787 7.5 27,526 -18.8 303,088 -15.4 358,393 32.8
% of Tota l 3W 34 33 38 36 41
Total 3W 65,875 63,068 4.5 71,643 -8.1 841,379 -4.2 878,316 10.3
Source: SI AM/MOSL
32,000
44,000
56,000
68,000
80,000
92,000
Apr May Jun Jul Aug Sep Oct Nov Dec Jan Feb Mar
FY11 FY12 FY13
0%
25%
50%
75%
100%
A p r - 1 0
M a y - 1 0
J u n - 1 0
J u l - 1 0
A u g - 1 0
S e p - 1 0
O c t - 1 0
N o v - 1 0
D e c - 1 0
J a n - 1 1
F e b - 1 1
M a r - 1 1
A p r - 1 1
M a y - 1 1
J u n - 1 1
J u l - 1 1
A u g - 1 1
S e p - 1 1
O c t - 1 1
N o v - 1 1
D e c - 1 1
J a n - 1 2
F e b - 1 2
M a r - 1 2
A p r - 1 2
M a y - 1 2
J u n - 1 2
J u l - 1 2
A u g - 1 2
S e p - 1 2
O c t - 1 2
N o v - 1 2
D e c - 1 2
J a n - 1 3
F e b - 1 3
M a r - 1 3
Passen er Goods
May 2013

7/30/2019 AUTO Dashboard April 2013
http://slidepdf.com/reader/full/auto-dashboard-april-2013 24/36
Dashboard
24
Three wheelers: passenger segment market share
Three wheelers: goods segment market share
Bajaj Auto continues to
dominate passenger
segment…
... Piaggio continues to
lead in the goods
segment
0%
25%
50%
75%
100%
A p r ‐ 1 0
M a y
‐ 1 0
J u n
‐ 1 0
J u l ‐ 1 0
A u g
‐ 1 0
S e p
‐ 1 0
O c t ‐ 1 0
N o v
‐ 1 0
D e c
‐ 1 0
J a n
‐ 1 1
F e b
‐ 1 1
M a r ‐ 1 1
A p r ‐ 1 1
M a y
‐ 1 1
J u n
‐ 1 1
J u l ‐ 1 1
A u g
‐ 1 1
S e p
‐ 1 1
O c t ‐ 1 1
N o v
‐ 1 1
D e c
‐ 1 1
J a n
‐ 1 2
F e b
‐ 1 2
M a r ‐ 1 2
A p r ‐ 1 2
M a y
‐ 1 2
J u n
‐ 1 2
J u l ‐ 1 2
A u g
‐ 1 2
S e p
‐ 1 2
O c t ‐ 1 2
N o v
‐ 1 2
D e c
‐ 1 2
J a n
‐ 1 3
F e b
‐ 1 3
M a r ‐ 1 3
Baja j Auto Piaggio M&M TVS Others
0%
25%
50%
75%
100%
A p r ‐ 1 0
M a y
‐ 1 0
J u n
‐ 1 0
J u l ‐ 1 0
A u g
‐ 1 0
S e p
‐ 1 0
O c t ‐ 1 0
N o v
‐ 1 0
D e c
‐ 1 0
J a n
‐ 1 1
F e b
‐ 1 1
M a r ‐ 1 1
A p r ‐ 1 1
M a y
‐ 1 1
J u n
‐ 1 1
J u l ‐ 1 1
A u g
‐ 1 1
S e p
‐ 1 1
O c t ‐ 1 1
N o v
‐ 1 1
D e c
‐ 1 1
J a n
‐ 1 2
F e b
‐ 1 2
M a r ‐ 1 2
A p r ‐ 1 2
M a y
‐ 1 2
J u n
‐ 1 2
J u l ‐ 1 2
A u g
‐ 1 2
S e p
‐ 1 2
O c t ‐ 1 2
N o v
‐ 1 2
D e c
‐ 1 2
J a n
‐ 1 3
F e b
‐ 1 3
M a r ‐ 1 3
Baja j Auto Piaggio M&M Others
May 2013
7/30/2019 AUTO Dashboard April 2013
http://slidepdf.com/reader/full/auto-dashboard-april-2013 25/36
Dashboard
25
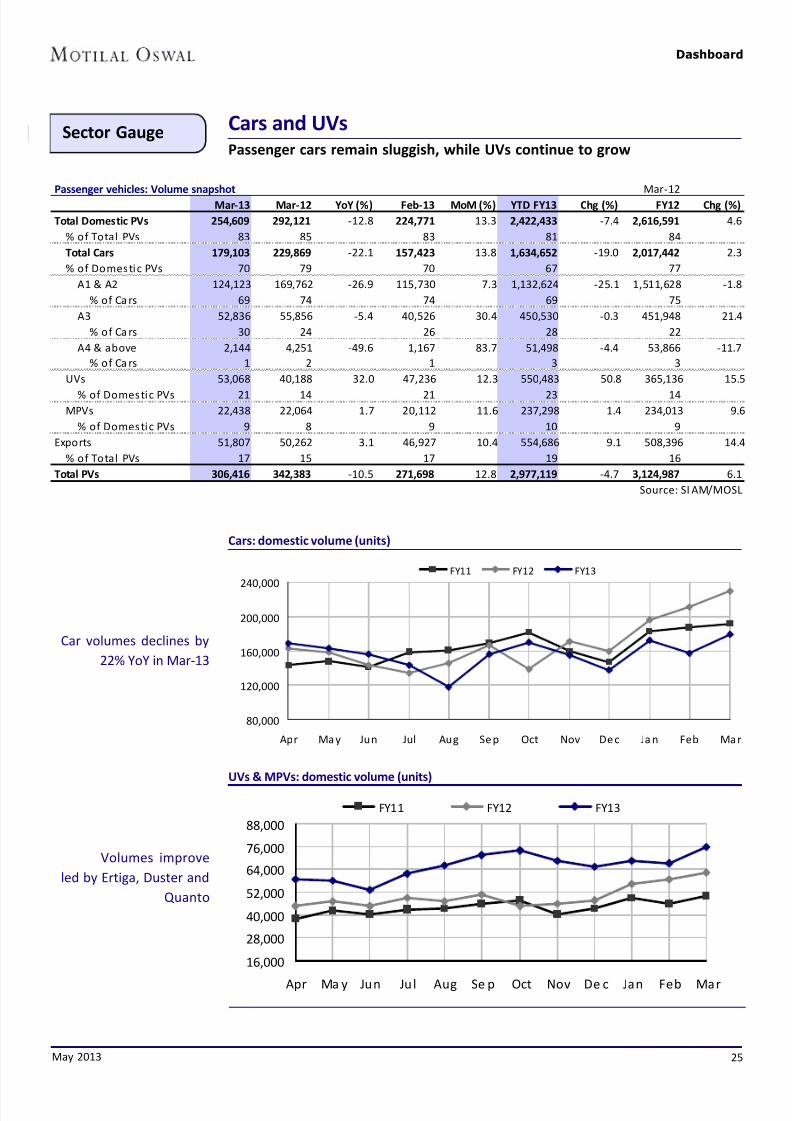
Sector Gauge Cars and UVsPassenger cars remain sluggish, while UVs continue to grow
Passenger vehicles: Volume snapshot Mar‐12
Mar‐13 Mar‐12 YoY (%) Feb‐13 MoM (%) YTD FY13 Chg (%) FY12 Chg (%)
Total Domestic PVs 254,609 292,121 ‐12.8 224,771 13.3 2,422,433 ‐7.4 2,616,591 4.6
% of Total PVs 83 85 83 81 84
Total Cars 179,103 229,869 ‐22.1 157,423 13.8 1,634,652 ‐19.0 2,017,442 2.3
% of Domestic PVs 70 79 70 67 77
A1 & A2 124,123 169,762 ‐26.9 115,730 7.3 1,132,624 ‐25.1 1,511,628 ‐1.8
% of Ca rs 69 74 74 69 75
A3 52,836 55,856 ‐5.4 40,526 30.4 450,530 ‐0.3 451,948 21.4
% of Ca rs 30 24 26 28 22
A4 & above 2,144 4,251 ‐49.6 1,167 83.7 51,498 ‐4.4 53,866 ‐11.7
% of Ca rs 1 2 1 3 3
UVs 53,068 40,188 32.0 47,236 12.3 550,483 50.8 365,136 15.5
% of Domestic PVs 21 14 21 23 14MPVs 22,438 22,064 1.7 20,112 11.6 237,298 1.4 234,013 9.6
% of Domestic PVs 9 8 9 10 9
Exports 51,807 50,262 3.1 46,927 10.4 554,686 9.1 508,396 14.4
% of Total PVs 17 15 17 19 16
Total PVs 306,416 342,383 ‐10.5 271,698 12.8 2,977,119 ‐4.7 3,124,987 6.1
Source: SI AM/MOSL
Cars: domestic volume (units)
UVs & MPVs: domestic volume (units)
Car volumes declines by
22% YoY in Mar-13
Volumes improve
led by Ertiga, Duster and
Quanto
80,000
120,000
160,000
200,000
240,000
Apr Ma y Jun Jul Aug Se p Oct Nov De c Ja n Feb Ma r
FY11 FY12 FY13
16,000
28,000
40,000
52,000
64,000
76,000
88,000
Apr Ma y Jun Jul Aug Se p Oct Nov De c Jan Feb Mar
FY11 FY12 FY13
May 2013

7/30/2019 AUTO Dashboard April 2013
http://slidepdf.com/reader/full/auto-dashboard-april-2013 26/36
Dashboard
26
Passenger vehicles: export volume (units)
Cars: domestic market share
UVs: domestic market share
Passenger vehicles: segment mix
Export volumes
pick-up MoM
Maruti's market share
improves, driven
by Ertiga
A2 dominates the
passenger vehicles
segment
MSIL market share
improves over the last
few months
20,000
29,000
38,000
47,000
56,000
65,000
Apr Ma y Jun Jul Aug Sep Oct Nov Dec Jan Feb Ma r
FY11 FY12 FY13
0%
25%
50%
75%
100%
A p r ‐ 1 0
M a y
‐ 1 0
J u n
‐ 1 0
J u l ‐ 1 0
A u g
‐ 1 0
S e p
‐ 1 0
O c t ‐ 1 0
N o v
‐ 1 0
D e c
‐ 1 0
J a n
‐ 1 1
F e b
‐ 1 1
M a r ‐ 1 1
A p r ‐ 1 1
M a y
‐ 1 1
J u n
‐ 1 1
J u l ‐ 1 1
A u g
‐ 1 1
S e p
‐ 1 1
O c t ‐ 1 1
N o v
‐ 1 1
D e c
‐ 1 1
J a n
‐ 1 2
F e b
‐ 1 2
M a r ‐ 1 2
A p r ‐ 1 2
M a y
‐ 1 2
J u n
‐ 1 2
J u l ‐ 1 2
A u g
‐ 1 2
S e p
‐ 1 2
O c t ‐ 1 2
N o v
‐ 1 2
D e c
‐ 1 2
J a n
‐ 1 3
F e b
‐ 1 3
M a r ‐ 1 3
Maruti TataMotor Hyundai GM Honda
0%
25%
50%
75%
100%
A p r ‐ 1 0
M a y
‐ 1 0
J u n
‐ 1 0
J u l ‐ 1 0
A u g
‐ 1 0
S e p
‐ 1 0
O c t ‐ 1 0
N o v
‐ 1 0
D e c
‐ 1 0
J a n
‐ 1 1
F e b
‐ 1 1
M a r ‐ 1 1
A p r ‐ 1 1
M a y
‐ 1 1
J u n
‐ 1 1
J u l ‐ 1 1
A u g
‐ 1 1
S e p
‐ 1 1
O c t ‐ 1 1
N o v
‐ 1 1
D e c
‐ 1 1
J a n
‐ 1 2
F e b
‐ 1 2
M a r ‐ 1 2
A p r ‐ 1 2
M a y
‐ 1 2
J u n
‐ 1 2
J u l ‐ 1 2
A u g
‐ 1 2
S e p
‐ 1 2
O c t ‐ 1 2
N o v
‐ 1 2
D e c
‐ 1 2
J a n
‐ 1 3
F e b
‐ 1 3
M a r ‐ 1 3
M&M TataMotor Toyota Maruti GM
0%
25%
50%
75%
100%
A p r ‐ 1 0
M a y
‐ 1 0
J u n
‐ 1 0
J u l ‐ 1 0
A u g
‐ 1 0
S e p
‐ 1 0
O c t ‐ 1 0
N o v
‐ 1 0
D e c
‐ 1 0
J a n
‐ 1 1
F e b
‐ 1 1
M a r ‐ 1 1
A p r ‐ 1 1
M a y
‐ 1 1
J u n
‐ 1 1
J u l ‐ 1 1
A u g
‐ 1 1
S e p
‐ 1 1
O c t ‐ 1 1
N o v
‐ 1 1
D e c
‐ 1 1
J a n
‐ 1 2
F e b
‐ 1 2
M a r ‐ 1 2
A p r ‐ 1 2
M a y
‐ 1 2
J u n
‐ 1 2
J u l ‐ 1 2
A u g
‐ 1 2
S e p
‐ 1 2
O c t ‐ 1 2
N o v
‐ 1 2
D e c
‐ 1 2
J a n
‐ 1 3
F e b
‐ 1 3
M a r ‐ 1 3
A1 A2 A3 A4 & above MPV UV
May 2013

7/30/2019 AUTO Dashboard April 2013
http://slidepdf.com/reader/full/auto-dashboard-april-2013 27/36
Dashboard
27
Sector Gauge Commercial vehiclesM&HCV declines, growth in LCV also moderates
M&HCVs: domestic volume - buses (units)
M&HCVs: Domestic volume - goods (units)
M&HCV volumes
remains under pressure
Commercial vehicles: Volume snapshot Mar‐
12Mar-13 Mar-12 YoY (%) F eb-13 MoM (%) YTD FY13 Chg (%) FY12 Chg (%)
Total Domestic CVs 84,956 90,343 ‐6.0 68,353 24.3 793,082 ‐0.5 797,257 16.6
% of Total CVs 94 92 91 91 90
Total M&HCV 29,591 40,004 ‐26.0 21,463 37.9 268,196 ‐22.8 347,364 7.5
% of Domestic CVs 35 44 31 34 44
Goods 23,724 33,664 ‐29.5 17,421 36.2 221,705 ‐25.9 299,085 8.7
% of M&HCVs 80 84 81 83 86
Pass enger 5,867 6,340 ‐7.5 4,042 45.2 46,491 ‐3.7 48,279 0.6
% of M&HCVs 20 16 19 17 14
Total LCVs 55,365 50,339 10.0 46,890 18.1 524,886 16.7 449,893 24.7
% of Domestic CVs 65 56 69 66 56
Goods 50,121 44,573 12.4 43,093 16.3 476,733 18.7 401,793 27.2
% of LCVs 59 49 63 60 50
Pass enger 5,244 5,766 ‐9.1 3,797 38.1 48,153 0.1 48,100 7.4
% of LCVs 6 6 6 6 6
Exports 5,848 8,160 ‐28.3 6,372 ‐8.2 80,002 ‐11.2 90,080 21.8
% of Total CVs 6 8 9 9 10
Total CVs 90,804 98,503 ‐7.8 74,725 21.5 873,084 ‐1.6 887,337 17.1
Source: SI AM/MOSL
0
8,000
16,000
24,000
32,000
40,000
Apr Ma y Jun Jul Aug Sep Oct Nov Dec Ja n Feb Ma r
FY11 FY12 FY13
0
1,500
3,000
4,500
6,000
7,500
Apr Ma y Jun Jul Aug Sep Oct Nov Dec Ja n Feb Ma r
FY11 FY12 FY13
May 2013

7/30/2019 AUTO Dashboard April 2013
http://slidepdf.com/reader/full/auto-dashboard-april-2013 28/36
Dashboard
28
M&HCVs: domestic market share, goods (%)
M&HCVs: domestic market share, buses (%)
LCVs: domestic volumes (units)
LCVs continue
robust growth
Tata Motors continue
to dominate M&HCV
goods segment
0%
25 %
50 %
75 %
100%
A p r ‐ 1 0
M a y ‐ 1 0
J u n ‐ 1 0
J u l ‐ 1 0
A u g ‐ 1 0
S e p ‐ 1 0
O c t ‐ 1 0
N o v ‐ 1 0
D e c ‐ 1 0
J a n ‐ 1 1
F e b
‐ 1 1
M a r ‐ 1 1
A p r ‐ 1 1
M a y ‐ 1 1
J u n ‐ 1 1
J u l ‐ 1 1
A u g ‐ 1 1
S e p ‐ 1 1
O c t ‐ 1 1
N o v ‐ 1 1
D e c ‐ 1 1
J a n ‐ 1 2
F e b
‐ 1 2
M a r ‐ 1 2
A p r ‐ 1 2
M a y ‐ 1 2
J u n ‐ 1 2
J u l ‐ 1 2
A u g ‐ 1 2
S e p ‐ 1 2
O c t ‐ 1 2
N o v ‐ 1 2
D e c ‐ 1 2
J a n ‐ 1 3
F e b
‐ 1 3
M a r ‐ 1 3
Ta ta Motor As hokLe yl and Eic he r
0%
25%
50%
75%
100%
A p r ‐ 1 0
M a y ‐ 1 0
J u n ‐ 1 0
J u l ‐ 1 0
A u g ‐ 1 0
S e p ‐ 1 0
O c t ‐ 1 0
N o v ‐ 1 0
D e c ‐ 1 0
J a n ‐ 1 1
F e b
‐ 1 1
M a r ‐ 1 1
A p r ‐ 1 1
M a y ‐ 1 1
J u n ‐ 1 1
J u l ‐ 1 1
A u g ‐ 1 1
S e p ‐ 1 1
O c t ‐ 1 1
N o v ‐ 1 1
D e c ‐ 1 1
J a n ‐ 1 2
F e b
‐ 1 2
M a r ‐ 1 2
A p r ‐ 1 2
M a y ‐ 1 2
J u n ‐ 1 2
J u l ‐ 1 2
A u g ‐ 1 2
S e p ‐ 1 2
O c t ‐ 1 2
N o v ‐ 1 2
D e c ‐ 1 2
J a n ‐ 1 3
F e b
‐ 1 3
M a r ‐ 1 3
Ta taMoto r As ho kLe ylan d Eiche r Swara j
20,000
30,000
40,000
50,000
60,000
Ap r May Jun Ju l Aug Sep Oct Nov Dec Jan Fe b Mar
FY11 FY12 FY13
May 2013
7/30/2019 AUTO Dashboard April 2013
http://slidepdf.com/reader/full/auto-dashboard-april-2013 29/36
Dashboard
May 2013 29
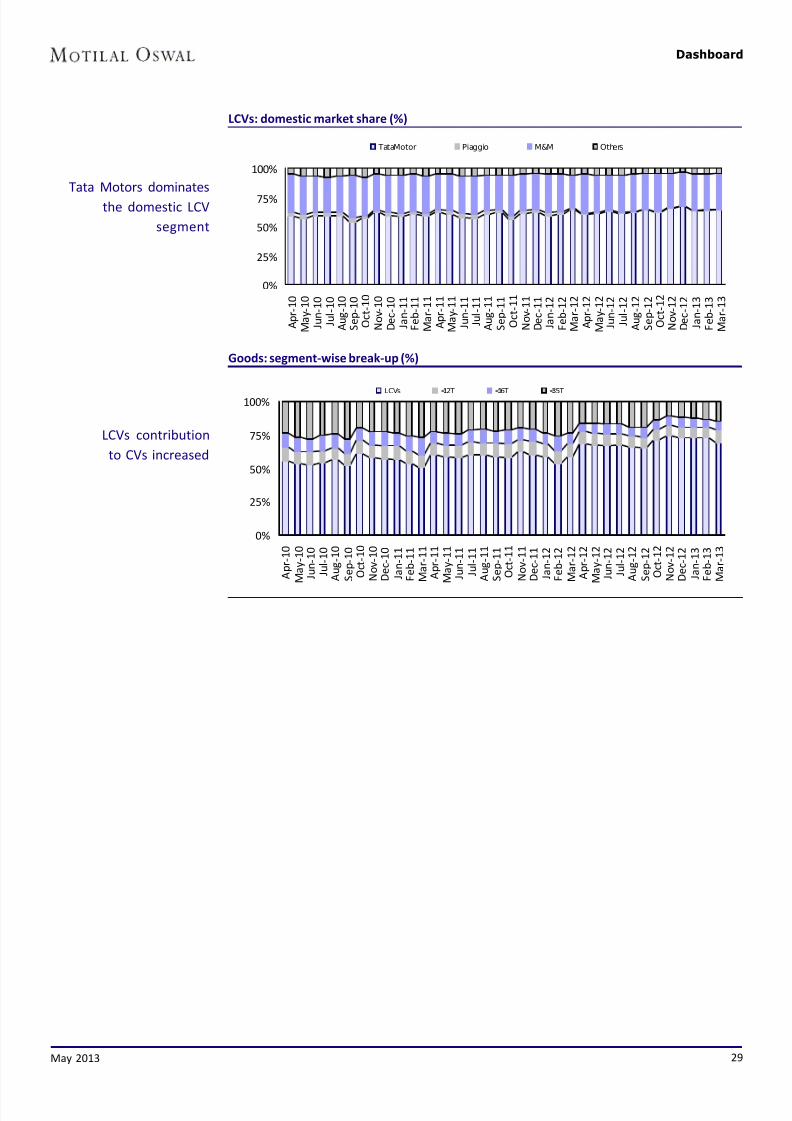
LCVs: domestic market share (%)
Goods: segment-wise break-up (%)
Tata Motors dominates
the domestic LCV
segment
LCVs contribution
to CVs increased
0%
25%
50%
75%
100%
A p r ‐ 1 0
M a y
‐ 1 0
J u n
‐ 1 0
J u l ‐ 1 0
A u g
‐ 1 0
S e p
‐ 1 0
O c t ‐ 1 0
N o v ‐ 1 0
D e c
‐ 1 0
J a n
‐ 1 1
F e b
‐ 1 1
M a r ‐ 1 1
A p r ‐ 1 1
M a y ‐ 1 1
J u n
‐ 1 1
J u l ‐ 1 1
A u g
‐ 1 1
S e p
‐ 1 1
O c t ‐ 1 1
N o v ‐ 1 1
D e c
‐ 1 1
J a n
‐ 1 2
F e b
‐ 1 2
M a r ‐ 1 2
A p r ‐ 1 2
M a y
‐ 1 2
J u n
‐ 1 2
J u l ‐ 1 2
A u g
‐ 1 2
S e p
‐ 1 2
O c t ‐ 1 2
N o v
‐ 1 2
D e c
‐ 1 2
J a n
‐ 1 3
F e b
‐ 1 3
M a r ‐ 1 3
TataMotor Piaggio M&M Others
0%
25%
50%
75%
100%
A p r ‐ 1 0
M a y
‐ 1 0
J u n
‐ 1 0
J u l ‐ 1 0
A u g
‐ 1 0
S e p
‐ 1 0
O c t
‐ 1 0
N o v
‐ 1 0
D e c
‐ 1 0
J a n
‐ 1 1
F e b
‐ 1 1
M a r ‐ 1 1
A p r ‐ 1 1
M a y
‐ 1 1
J u n
‐ 1 1
J u l ‐ 1 1
A u g
‐ 1 1
S e p
‐ 1 1
O c t ‐ 1 1
N o v
‐ 1 1
D e c ‐ 1 1
J a n
‐ 1 2
F e b
‐ 1 2
M a r ‐ 1 2
A p r ‐ 1 2
M a y
‐ 1 2
J u n
‐ 1 2
J u l ‐ 1 2
A u g
‐ 1 2
S e p
‐ 1 2
O c t ‐ 1 2
N o v
‐ 1 2
D e c
‐ 1 2
J a n
‐ 1 3
F e b
‐ 1 3
M a r ‐ 1 3
LCVs <12T <16T <35T
7/30/2019 AUTO Dashboard April 2013
http://slidepdf.com/reader/full/auto-dashboard-april-2013 30/36
Dashboard
May 2013 30
News and Events
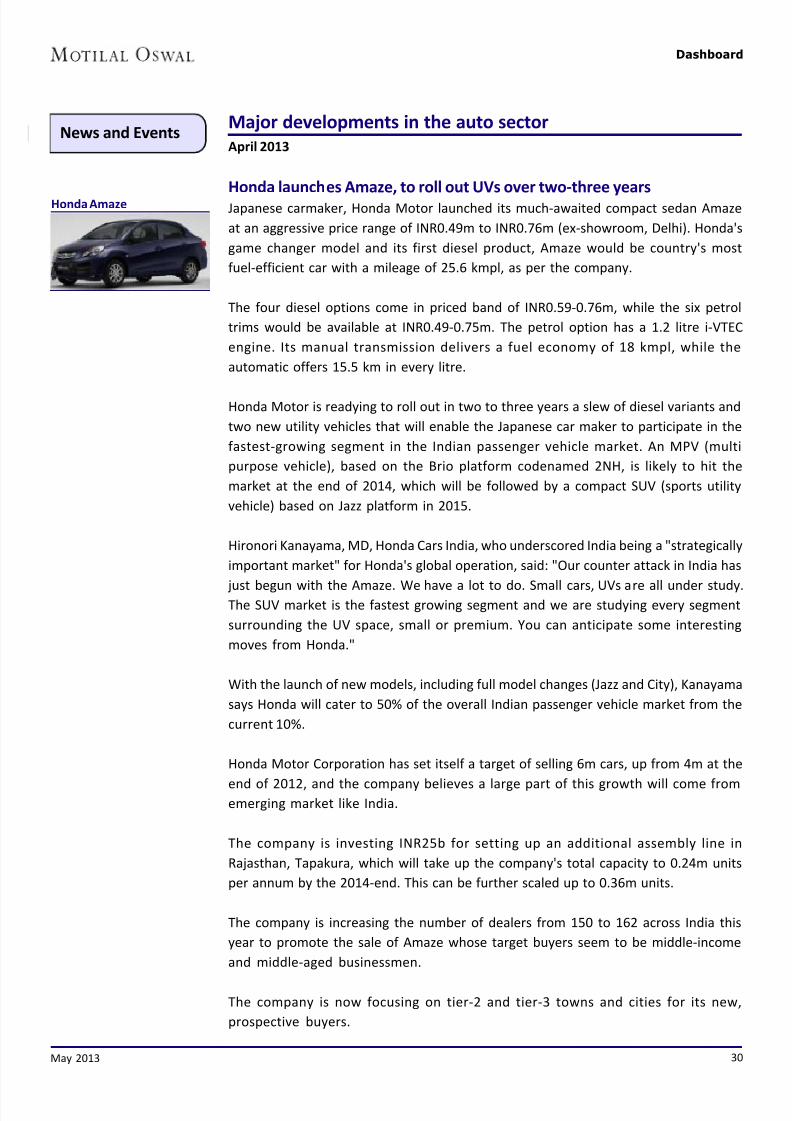
Honda launches Amaze, to roll out UVs over two-three years
Japanese carmaker, Honda Motor launched its much-awaited compact sedan Amaze
at an aggressive price range of INR0.49m to INR0.76m (ex-showroom, Delhi). Honda's
game changer model and its first diesel product, Amaze would be country's most
fuel-efficient car with a mileage of 25.6 kmpl, as per the company.
The four diesel options come in priced band of INR0.59-0.76m, while the six petrol
trims would be available at INR0.49-0.75m. The petrol option has a 1.2 litre i-VTEC
engine. Its manual transmission delivers a fuel economy of 18 kmpl, while the
automatic offers 15.5 km in every litre.
Honda Motor is readying to roll out in two to three years a slew of diesel variants and
two new utility vehicles that will enable the Japanese car maker to participate in the
fastest-growing segment in the Indian passenger vehicle market. An MPV (multi
purpose vehicle), based on the Brio platform codenamed 2NH, is likely to hit the
market at the end of 2014, which will be followed by a compact SUV (sports utility
vehicle) based on Jazz platform in 2015.
Hironori Kanayama, MD, Honda Cars India, who underscored India being a "strategically
important market" for Honda's global operation, said: "Our counter attack in India has
just begun with the Amaze. We have a lot to do. Small cars, UVs are all under study.The SUV market is the fastest growing segment and we are studying every segment
surrounding the UV space, small or premium. You can anticipate some interesting
moves from Honda."
With the launch of new models, including full model changes (Jazz and City), Kanayama
says Honda will cater to 50% of the overall Indian passenger vehicle market from the
current 10%.
Honda Motor Corporation has set itself a target of selling 6m cars, up from 4m at the
end of 2012, and the company believes a large part of this growth will come fromemerging market like India.
The company is investing INR25b for setting up an additional assembly line in
Rajasthan, Tapakura, which will take up the company's total capacity to 0.24m units
per annum by the 2014-end. This can be further scaled up to 0.36m units.
The company is increasing the number of dealers from 150 to 162 across India this
year to promote the sale of Amaze whose target buyers seem to be middle-income
and middle-aged businessmen.
The company is now focusing on tier-2 and tier-3 towns and cities for its new,
prospective buyers.
Major developments in the auto sector
April 2013
Honda Amaze

7/30/2019 AUTO Dashboard April 2013
http://slidepdf.com/reader/full/auto-dashboard-april-2013 31/36
Dashboard
May 2013 31
Royal Enfield Royal Enfield starts new plant, targets to sell 175,000 units in CY13
Royal Enfield has commenced operations at its new plant at Oragadam, Chennai.
Siddhartha Lal, (MD & CEO of Eicher Motors) believes Royal Enfield's new plant coming
up in Oragadam near Chennai next year will "once and forever" change the company.
"We are taking this new plant as an opportunity to upgrade ourselves to absolute
global standards in terms of manufacturing excellence".
The Oragadam facility will operate in tandem with the existing plant in Tiruvottiyur
for motorcycle assembly next year. This activity will, thereafter, be confined to the
new unit while engines will still be machined and assembled in the old plant. "Initially
in 2013, we will do a combined 150,000 units, while Oragadam can do twice as much
on its own subsequently," Lal says.
Lal's next step is to target markets beyond India. He shrugs off the ongoing crisis in
Europe saying the company's exposure to this part of the world is "extremely small".
Over the next decade, Royal Enfield sees developing markets as the bigger play, a list
that includes Latin America, Southeast Asia, Africa and West Asia.
South Africa first to get new Mahindra vehicle 'Genio'
South Africa has become the first country outside India to get the latest product
'Genio' from the Mahindra range of pick-up vehicles.
Mahindra South Africa has added another variant to its range of one-tonne Genio
pick-ups that are proving very popular in the country.
"This new addition is in response to customer requests and in line with Mahindra's
policy of listening to feedback and adapting our product range to meet these needs,
when volumes make it viable," said Mahindra South Africa CEO Ashok Thakur.
"In the case of the Genio with drop sides and a flat load bed we see this is well suited
to small business operators in need of a versatile, reliable and tough 1.2 tonne light
commercial vehicle to facilitate their daily working operations and delivery needs,"
Thakur said.
In the past, Mahindra has adapted Indian domestic models, such as the Bolero, Scorpio,
Thar and Xylo, for sale in the South African market, but the Genio is the result of a new
global approach to research and development.
"The Genio is the result of extensive worldwide research in terms of what the pick-up
buyer requires in the various markets where this type of vehicle is popular," Thakur
said, adding that South Africa was the first country outside India to receive the Genio.
Mahindra sees the Genio as a versatile pick-up that sits between the requirementsfor a workhorse bakkie and a recreational vehicle.
Mahindra Genio
7/30/2019 AUTO Dashboard April 2013
http://slidepdf.com/reader/full/auto-dashboard-april-2013 32/36
Dashboard
May 2013 32
The Genio is made at Mahindra's state-of-the-art manufacturing facility in Chakan,
which was completed in November 2009, with an initial manufacturing capacity of
300,000 units a year and the potential to double this output in the future.
Mahindra South Africa is a fully-owned subsidiary of the USD 15.9-billionMahindra
Group, Mahindra & Mahindra of India, which was established in 1945.
The company operates in South Africa with over 50 dealerships, and is also exporting
vehicles to Zimbabwe, Zambia, Botswana, Swaziland and Namibia.
Mahindra South Africa has achieved significant growth in the country since its
establishment in October 2004, and since then, the company has sold a total of
approximately 18,000 vehicles.
Volkswagen launches Polo petrol variant at INR0.79mVolkswagen launched a petrol variant of its popular hatchback Polo. The 1.2-litre new
Polo is priced at INR0.79m (ex-showroom Delhi), said Arvind Saxena, Managing Director
for passenger cars, Volkswagen Group Sales India after the launch here.
"Fuel efficiency has become vital for every customer looking at purchasing a new car
and the Polo GT TSI is an answer to this demand offering maximum power and
minimum consumption," Saxena said, adding that the TSI is a pioneering technology
of petrol engines by Volkswagen.
Volkswagen, the largest European car maker, sells the Polo, Vento, Jetta, Passat and
the Touareg in the domestic market.
Mercedes-Benz to roll out 3 new models in 3 months
The German luxury carmaker Mercedes-Benz has set a hectic pace for itself and expects
to launch three new models in India within three months. The company will introduce
its all-new luxury sports utility vehicle GL in the presence of German tennis star Boris
Becker on May 16 in New Delhi.
This will be followed by the launch of the diesel variant of its B Class and the globally
popular A Class hatch in both the petrol and diesel variants.
Eberhard H. Kern, Managing Director and CEO of Mercedes-Benz India, said, "The
company will significantly expand its product portfolio during the year and thereby
be able to address a much larger luxury car market."
He told Business Line that the luxury auto market in India is set to grow significantly
from barely 1.2% of the 2.6-million passenger car market to about 4% of the expanded
market by 2020.
"We are currently functioning in India within fewer segments with the C, E and S Class
and the petrol variant of the B Class. But wherever we are present we have a
leadership role," he said.
7/30/2019 AUTO Dashboard April 2013
http://slidepdf.com/reader/full/auto-dashboard-april-2013 33/36
Dashboard
May 2013 33
BMW Mini Cooper
"Having closed 2012 with overall sales volumes of about 7,000 cars, and registering a
growth of about 5.3% during the first quarter ended March 31, 2013 with 2,009 cars,
we expect to register double-digit growth during the current year with the expanded
portfolio," he said.
The company last year commissioned a new paint shop at Chakan in Maharashtra,
which can handle up to 20,000 cars. It expects to complete the expansion project,
which will take the capacity to 20,000 vehicles per annum, by the year-end.
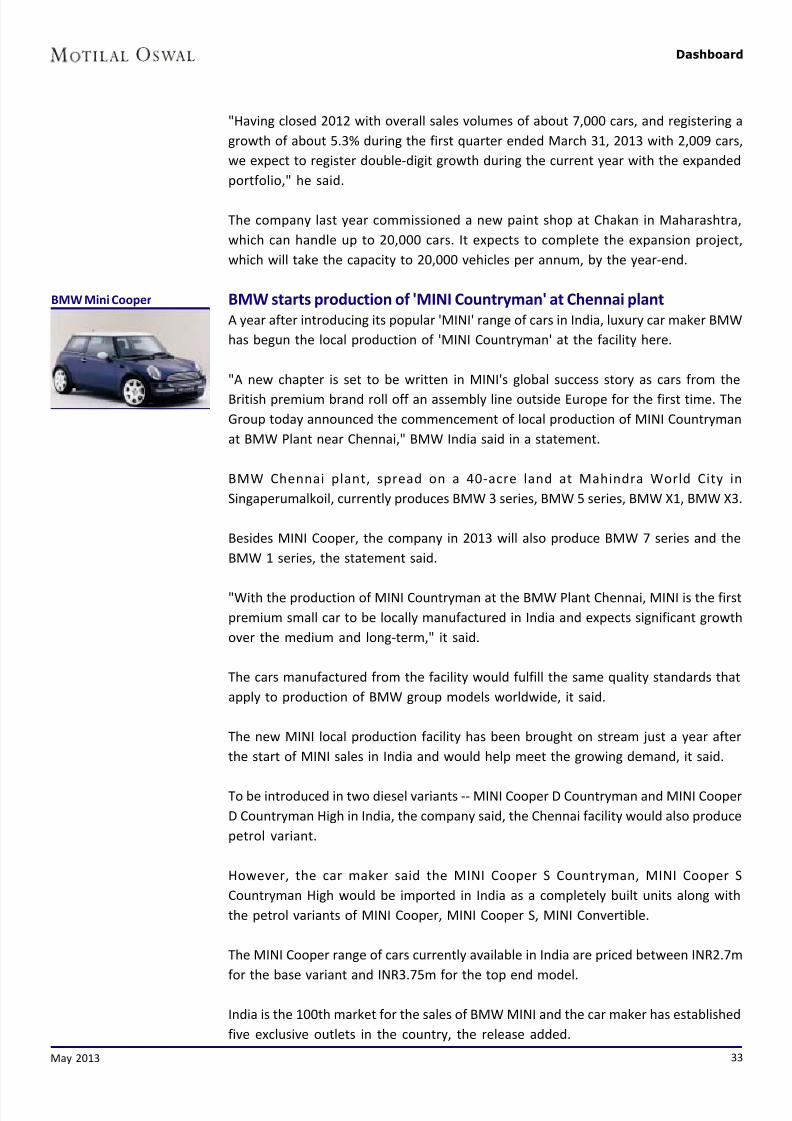
BMW starts production of 'MINI Countryman' at Chennai plant
A year after introducing its popular 'MINI' range of cars in India, luxury car maker BMW
has begun the local production of 'MINI Countryman' at the facility here.
"A new chapter is set to be written in MINI's global success story as cars from the
British premium brand roll off an assembly line outside Europe for the first time. The
Group today announced the commencement of local production of MINI Countryman
at BMW Plant near Chennai," BMW India said in a statement.
BMW Chennai plant, spread on a 40-acre land at Mahindra World City in
Singaperumalkoil, currently produces BMW 3 series, BMW 5 series, BMW X1, BMW X3.
Besides MINI Cooper, the company in 2013 will also produce BMW 7 series and the
BMW 1 series, the statement said.
"With the production of MINI Countryman at the BMW Plant Chennai, MINI is the first
premium small car to be locally manufactured in India and expects significant growth
over the medium and long-term," it said.
The cars manufactured from the facility would fulfill the same quality standards that
apply to production of BMW group models worldwide, it said.
The new MINI local production facility has been brought on stream just a year after
the start of MINI sales in India and would help meet the growing demand, it said.
To be introduced in two diesel variants -- MINI Cooper D Countryman and MINI Cooper
D Countryman High in India, the company said, the Chennai facility would also produce
petrol variant.
However, the car maker said the MINI Cooper S Countryman, MINI Cooper S
Countryman High would be imported in India as a completely built units along with
the petrol variants of MINI Cooper, MINI Cooper S, MINI Convertible.
The MINI Cooper range of cars currently available in India are priced between INR2.7m
for the base variant and INR3.75m for the top end model.
India is the 100th market for the sales of BMW MINI and the car maker has established
five exclusive outlets in the country, the release added.
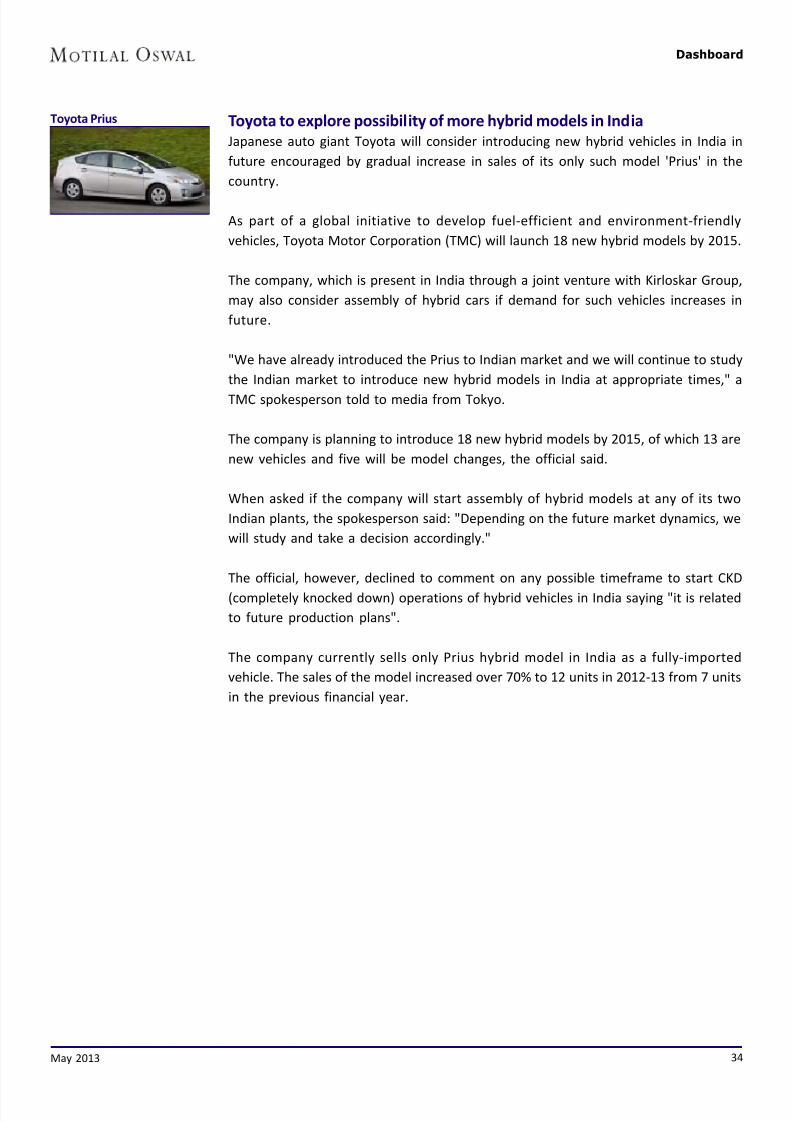
7/30/2019 AUTO Dashboard April 2013
http://slidepdf.com/reader/full/auto-dashboard-april-2013 34/36
Dashboard
May 2013 34
Toyota to explore possibility of more hybrid models in India
Japanese auto giant Toyota will consider introducing new hybrid vehicles in India in
future encouraged by gradual increase in sales of its only such model 'Prius' in the
country.
As part of a global initiative to develop fuel-efficient and environment-friendly
vehicles, Toyota Motor Corporation (TMC) will launch 18 new hybrid models by 2015.
The company, which is present in India through a joint venture with Kirloskar Group,
may also consider assembly of hybrid cars if demand for such vehicles increases in
future.
"We have already introduced the Prius to Indian market and we will continue to study
the Indian market to introduce new hybrid models in India at appropriate times," a
TMC spokesperson told to media from Tokyo.
The company is planning to introduce 18 new hybrid models by 2015, of which 13 are
new vehicles and five will be model changes, the official said.
When asked if the company will start assembly of hybrid models at any of its two
Indian plants, the spokesperson said: "Depending on the future market dynamics, we
will study and take a decision accordingly."
The official, however, declined to comment on any possible timeframe to start CKD
(completely knocked down) operations of hybrid vehicles in India saying "it is related
to future production plans".
The company currently sells only Prius hybrid model in India as a fully-imported
vehicle. The sales of the model increased over 70% to 12 units in 2012-13 from 7 units
in the previous financial year.
Toyota Prius
7/30/2019 AUTO Dashboard April 2013
http://slidepdf.com/reader/full/auto-dashboard-april-2013 35/36
Dashboard
May 2013 35
N O T E S

7/30/2019 AUTO Dashboard April 2013
http://slidepdf.com/reader/full/auto-dashboard-april-2013 36/36
DisclosuresThis report is for personal information of the authorized recipient and does not construe to be any investment, legal or taxation advice to you. This research report does not constitute an offer, invitation or inducement
to invest in securities or other investments and Motilal Oswal Securities Limited (hereinafter referred as MOSt) is not soliciting any action based upon it. This report is not for public distribution and has been
furnished to you solely for your information and should not be reproduced or redistributed to any other person in any form.
Unauthorized disclosure, use, dissemination or copying (either whole or partial) of this information, is prohibited. The person accessing this information specifically agrees to exempt MOSt or any of its affiliates
or employees from, any and all responsibility/liability arising from such misuse and agrees not to hold MOSt or any of its affiliates or employees responsible for any such misuse and further agrees to hold MOSt
or any of its affil iates or employees free and harmless from all losses, costs, damages, expenses that may be suffered by the person accessing this information due to any errors and delays.
The information contained herein is based on publicly available data or other sources believed to be reliable. While we would endeavour to update the information herein on reasonable basis, MOSt and/or its
affiliates are under no obligation to update the information. Also there may be regulatory, compliance, or other reasons that may prevent MOSt and/or its affiliates from doing so. MOSt or any of its affiliates or
employees shall not be in any way responsible and liable for any loss or damage that may arise to any person from any inadvertent error in the information contained in this report . MOSt or any of its affiliatesor employees do not provide, at any time, any express or implied warranty of any kind, regarding any matter pertaining to this report, including without limitation the implied warranties of merchantability, fitness
for a particular purpose, and non-infringement. The recipients of this report should rely on their own investigations.
This report is intended for distribution to institutional investors. Recipients who are not institutional investors should seek advice of their independent financial advisor prior to taking any investment decision
based on this report or for any necessary explanation of its contents.
MOSt and/or its affiliates and/or employees may have interests/positions, financial or otherwise in the securities mentioned in this report. To enhance transparency, MOSt has incorporated a Disclosure of Interest
Statement in this document. This should, however, not be treated as endorsement of the views expressed in the report.
Disclosure of Interest Statement Companies where there is interest
1. Analyst ownership of the stock None
2. Group/Directors ownership of the stock Hero MotoCorp, Eicher Motors
3. Broking relationship with company covered None
4. Investment Banking relationship with company covered None
Analyst Certi ficationThe views expressed in this research report accurately reflect the personal views of the analyst(s) about the subject securities or issues, and no part of the compensation of the research analyst(s) was, is, or
will be directly or indirectly related to the specific recommendations and views expressed by research analyst(s) in this report. The research analysts, strategists, or research associates principally responsible
for preparation of MOSt research receive compensation based upon various factors, including quality of research, investor client feedback, stock picking, competitive factors and firm revenues.
Regional Disclos ures (outside India)This report is not directed or intended for distribution to or use by any person or entity resident in a state, country or any jurisdiction, where such distribution, publication, availability or use would be contrary to
law, regulation or which would subject MOSt & its group companies to registration or licensing requirements within such jurisdictions.
For U.K.This report is intended for distribution only to persons having professional experience in matters relating to investments as described in Article 19 of the Financial Services and Markets Act 2000 (Financial
Promotion) Order 2005 (referred to as "investment professionals"). This document must not be acted on or relied on by persons who are not investment professionals. Any investment or investment activity to
which this document relates is only available to investment professionals and will be engaged in only with such persons.
For U.S.Motilal Oswal Securities Limited (MOSL) is not a registered broker - dealer under the U.S. Securities Exchange Act of 1934, as amended (the"1934 act") and under applicable state laws in the United States.
In addition MOSL is not a registered investment adviser under the U.S. Investment Advisers Act of 1940, as amended (the "Advisers Act" and together with the 1934 Act, the "Acts), and under applicable state
laws in the United States. Accordingly, in the absence of specific exemption under the Acts, any brokerage and investment services provided by MOSL, including the products and services described herein
are not available to or intended for U.S. persons.
This report is intended for distribution only to "Major Institutional Investors" as defined by Rule 15a-6(b)(4) of the Exchange Act and interpretations thereof by SEC (henceforth referred to as "major institutional
investors"). This document must not be acted on or relied on by persons who are not major institutional investors. Any investment or investment activity to which this document relates is only available to major
institutional investors and will be engaged in only with major institutional investors. In reliance on the exemption from registration provided by Rule 15a-6 of the U.S. Securities Exchange Act of 1934, as amended
(the "Exchange Act") and interpretations thereof by the U.S. Securities and Exchange Commission ("SEC") in order to conduct business with Institutional Investors based in the U.S., MOSL has entered into
a chaperoning agreement with a U.S. registered broker-dealer, Motilal Oswal Securities International Private Limited. ("MOSIPL"). Any business interaction pursuant to this report will have to be executed within
the provisions of this chaperoning agreement.
The Research Analysts contributing to the report may not be registered /qualified as research analyst with FINRA. Such research analyst may not be associated persons of the U.S. registered broker-dealer,
MOSIPL, and therefore, may not be subject to NASD rule 2711 and NYSE Rule 472 restrictions on communication with a subject company, public appearances and trading securities held by a research analyst
account.
For SingaporeMotilal Oswal Capital Markets Singapore Pte Limited is acting as an exempt financial advisor under section 23(1)(f) of the Financial Advisers Act(FAA) read with regulation 17(1)(d) of the Financial Advisors
Regulations and is a subsidiary of Motilal Oswal Securities Limited in India. This research is distributed in Singapore by Motilal Oswal Capital Markets Singapore Pte Limited and it is only directed in Singapore
to accredited investors, as defined in the Financial Advisers Regulations and the Securities and Futures Act (Chapter 289), as amended from time to time.
In respect of any matter arising from or in connection with the research you could contact the following representatives of Motilal Oswal Capital Markets Singapore Pte Limited:
Nihar Oza Kadambari Balachandran
Email: [email protected] Email : [email protected]
Contact: (+65) 68189232 Contact: (+65) 68189233 / 65249115
Office address: 21 (Suite 31), 16 Collyer Quay, Singapore 049318
M til l O l S iti Ltd