author's personal copy - information services & …shahriar/publication/jnnfm1.pdf ·...
TRANSCRIPT
This article appeared in a journal published by Elsevier. The attachedcopy is furnished to the author for internal non-commercial researchand education use, including for instruction at the authors institution
and sharing with colleagues.
Other uses, including reproduction and distribution, or selling orlicensing copies, or posting to personal, institutional or third party
websites are prohibited.
In most cases authors are permitted to post their version of thearticle (e.g. in Word or Tex form) to their personal website orinstitutional repository. Authors requiring further information
regarding Elsevier’s archiving and manuscript policies areencouraged to visit:
http://www.elsevier.com/copyright

Author's personal copy
J. Non-Newtonian Fluid Mech. 156 (2009) 29–43
Contents lists available at ScienceDirect
Journal of Non-Newtonian Fluid Mechanics
journa l homepage: www.e lsev ier .com/ locate / jnnfm
Influence of viscoelasticity on drop deformation and orientation in shear flowPart 1. Stationary states
Kristof Verhulsta, Ruth Cardinaelsa, Paula Moldenaersa, Yuriko Renardyb,∗, Shahriar Afkhamib
a Katholieke Universiteit Leuven, Department of Chemical Engineering, W. de Croylaan 46 - B 3001 Heverlee, Leuven, Belgiumb Department of Mathematics and ICAM, 460 McBryde Hall, Virginia Polytechnic Institute and State University, Blackburg VA 24061-0123, USA
a r t i c l e i n f o
Article history:Received 28 September 2007Received in revised form 10 June 2008Accepted 11 June 2008
Keywords:Drop deformationOldroyd-B modelVolume-of-fluid methodBlend morphologyViscoelasticity
a b s t r a c t
The influence of matrix and droplet viscoelasticity on the steady deformation and orientation of a singledroplet subjected to simple shear is investigated microscopically. Experimental data are obtained in thevelocity–vorticity and velocity–velocity gradient plane. A constant viscosity Boger fluid is used, as well as ashear-thinning viscoelastic fluid. These materials are described by means of an Oldroyd-B, Giesekus, Ellis,or multi-mode Giesekus constitutive equation. The drop-to-matrix viscosity ratio is 1.5. The numericalsimulations in 3D are performed with a volume-of-fluid algorithm and focus on capillary numbers 0.15 and0.35. In the case of a viscoelastic matrix, viscoelastic stress fields, computed at varying Deborah numbers,show maxima slightly above the drop tip at the back and below the tip at the front. At both capillarynumbers, the simulations with the Oldroyd-B constitutive equation predict the experimentally observedphenomena that matrix viscoelasticity significantly suppresses droplet deformation and promotes dropletorientation. These two effects saturate experimentally at high Deborah numbers. Experimentally, thehigh Deborah numbers are achieved by decreasing the droplet radius with other parameters unchanged.At the higher capillary and Deborah numbers, the use of the Giesekus model with a small amount ofshear-thinning dampens the stationary state deformation slightly and increases the angle of orientation.Droplet viscoelasticity on the other hand hardly affects the steady droplet deformation and orientation,both experimentally and numerically, even at moderate to high capillary and Deborah numbers.
© 2008 Elsevier B.V. All rights reserved.
1. Introduction
Dilute polymeric blends commonly form a droplet–matrix inter-face [1,2]. The final material properties are significantly influencedby the deformation, break-up and coalescence of droplets duringflow. Control of these processes is therefore essential in the devel-opment of high performance blends. The investigation of singledroplet dynamics in simple shear is a contribution towards thisgoal. In fact, theoretical and experimental studies on the singledroplet problem recently include the effects of component vis-coelasticity [3]. Perturbation theories for small deformation [4,5]predict that viscoelasticity hardly affects the steady droplet defor-mation at low flow intensity. Steady droplet orientation towardsthe (shear) flow direction is predicted to be highly promoted bymatrix viscoelasticity. The effect of droplet viscoelasticity on theorientation of the droplet is less pronounced. Several experimentalstudies confirm these trends [6–8].
∗ Corresponding author.E-mail address: [email protected] (Y. Renardy).
The small deformation theories are modified and extended tohandle larger droplet deformations in recent phenomenologicalmodels. In the case of steady droplet deformation, quantitativeagreement is found for low to moderate droplet deformations.At high droplet deformations, the discrepancy with experimentalresults is more pronounced. [8–14].
In planar extensional flow [15] and uniaxial elongational flow[16], matrix elasticity promotes droplet deformation at station-ary states for viscosity ratios (� = drop to matrix ratio) less thanor equal to one. In the case of droplet elasticity, the opposite isfound [16,17]. For � > 1, experiments on planar extensional flowwith various non-Newtonian droplet systems result in stationaryshapes that resemble corresponding Newtonian–Newtonian sys-tems [18]. Less attention has been given to the study of simpleshear. Experimental results of Guido et al. [7] demonstrate thatmatrix viscoelasticity suppresses droplet deformation at high flowintensities at viscosity ratios 0.1, 1 and 4.7. This result is confirmedby Verhulst et al. [8] at viscosity ratio 0.75 and is in qualitativeagreement with the predictions of the phenomenological mod-els [9–11]. On the contrary, several authors conclude the opposite,i.e. matrix elasticity enhances droplet deformation [19–21]. Thenumerical investigation of Yue et al. [22] clarifies the interaction
0377-0257/$ – see front matter © 2008 Elsevier B.V. All rights reserved.doi:10.1016/j.jnnfm.2008.06.007
Author's personal copy
30 K. Verhulst et al. / J. Non-Newtonian Fluid Mech. 156 (2009) 29–43
between the various stress components and pressure acting on thesurface of the droplet, and explains the differences according to thelevel of matrix elasticity. In addition, Verhulst et al. [8] demonstratethat similar materials, studied at moderate to high shear rates, canyield different steady droplet deformations under the same exper-imental conditions; i.e. when the same dimensionless parameters(borrowed from small deformation theory) are studied for differentmaterials.
Experimental studies on the deformation of a viscoelasticdroplet in a Newtonian matrix have only been performed at a vis-cosity ratio of one in the papers of Lerdwijitjarud et al. [23,24] andSibillo et al. [13]. In the latter, the experimental results are com-pared with a model equation. Numerical simulations are conductedin [25] for an Oldroyd-B droplet in a Newtonian matrix undersimple shear. The drop is found to deform less as the Deborah num-ber increases, while at high capillary numbers, the deformationincreases with increasing Deborah number. A first-order ordinarydifferential equation is used as a phenomenological model [25]. Itdescribes an overdamped system, in which the viscous stretchingforce is proportional to the shear rate, a damping term is propor-tional to viscosity, and a restoring force is proportional to the firstnormal stress difference. The latter creates an elastic force whichacts to eventually decrease deformation, but it predicts greaterdecrease than observed in the numerical results. Moreover, themodel cannot predict the critical curve in the Ca vs. � parametersfor the Stokes regime, nor the transient overshoot which resultsfrom strong initial conditions [26], or predict results for a Newto-nian drop in a viscoelastic matrix. The suppression of deformationwith increasing drop elasticity is also noted in the theoretical andnumerical studies of [9,22,27,28].
In this paper, the influence of both matrix and droplet viscoelas-ticity on the steady deformation and orientation of a single dropletsubjected to a homogeneous shear flow is investigated at a viscosityratio of 1.5. The study is performed for a broad range of the rele-vant dimensionless parameters, which allows the examination ofthe dependence on matrix elasticity in 3D at high Deborah num-bers. The 2D study of [22] finds a numerically small non-monotonicdependence of stationary state deformation on the matrix Deborahnumber, which is not noticeable in 3D for the specific parametersof this study. Throughout this paper, the experimental results arecompared with three-dimensional simulations performed with avolume-of-fluid algorithm for viscoelastic liquid–liquid systems.
2. Numerical simulations
The governing equations are as follows. The liquids are density-matched. For each liquid, the solvent viscosity is denoted �s,polymeric viscosity �p, total viscosity � = �s + �p, relaxation time�, shear rate � , and the initial elastic modulus G(0) = �p/�. Addi-tional subscripts ‘d’ and ‘m’ denote the drop and matrix liquids.The governing equations include incompressibility and momentumtransport:
∇ · u = 0,
�(∂u∂t
+ u · ∇u) = ∇ · T − ∇p + ∇ · (�s(∇u + (∇u)T )) + F,(1)
where T denotes the extra stress tensor. The total stress tensor is� = −pI + T + �s[∇u + (∇u)T ]. Each liquid is identified with a colorfunction,
C(x, t) ={
0 in the matrix liquid1 in the drop
(2)
which advects with the flow. The position of the interface is givenby the discontinuities in the color function. The interfacial tension
force is formulated as a body force
F = �nıS, = −∇ · n, (3)
where � denotes the surface tension, n the normal to the interface,ıS the delta-function at the interface, and the curvature. In (3),n = ∇C/|∇C|, ıS = |∇C|.
The drop and matrix liquids are governed by the Giesekus consti-tutive equations, which has had reasonable success in comparisonsof two-layer channel flow with actual data [29]. One feature thatdistinguishes the Giesekus model from others is the non-zero sec-ond normal stress difference N2. This is relevant to the flow of twoimmiscible liquids because it has been shown that a discontinu-ity in N2 affects interfacial stability [30]. In one limit, the Giesekusmodel reduces to the simpler Oldroyd-B constitutive equation.The experimental data which are addressed in this paper are asa first approximation, Oldroyd-B liquids [8]. However, the Oldroyd-B model is a difficult one to implement because it overpredicts thegrowth of stresses at large deformation rates and lead to numericalinstability. The Giesekus constitutive equation is
�
(∂T∂t
+ (u · ∇)T − (∇u)T − T(∇u)T
)+ T + �T2
= �G(0)(∇u + (∇u)T ).
(4)
The dimensionless parameters are the viscosity ratio (based ontotal viscosities) � = �d/�m, Ca = R0��m/�, a Weissenberg num-ber per fluid We = ��, and retardation parameter per fluid ˇ =�s/�. A Reynolds number based on the matrix liquid Re = ��R2
0/�m
is in the range .01–.05, chosen small so that inertia is negligible.Alternatively, let 1 denote the first normal stress coefficient,
equivalent to 2�p�, and define the Deborah number by
De = 1�
2R0�2; (5)
i.e., Ded = (1 − ˇd)We/(�Ca), and Dem = (1 − ˇm)We/Ca.Numerical and experimental results in later sections are presentedin terms of the Deborah numbers, and dimensionless capillarytime
t�
�mR0= t�
Ca, (6)
hereinafter denoted t. The rescaled Giesekus parameter
�G(0) (7)
is relabeled . The physically viable range is 0 ≤ < 0.5 [30].The Oldroyd-B model is = 0.
The governing equations are discretized with the volume-of-fluid (VOF) method given in Ref. [26]. The interfacial tension force(3) is approximated by either the continuum surface force for-mulation (CSF) or the parabolic representation of the interfacefor the surface tension force (PROST). The reader is referred toRefs. [31,32,28] for these algorithms. Both VOF-PROST and VOF-CSFcodes are parallelized with OpenMP. The efficiency of the paral-lelization for the Newtonian part of the code is discussed in [33];the viscoelastic part has analogous properties. A typical compu-tation presented in this paper is �x = R0/16, �t = 0.00005/Ca,Lx = 16R0, Ly = 8R0, Lz = 8R0, for which one timestep takes 1.2 swith 64 processors on the SGI Altix 3700 supercluster at VirginiaTech. A simulation from dimensionless capillary time 0–11, with 64nodes takes roughly 25 h.
2.1. Boundary conditions
The computational domain is denoted 0 ≤ x ≤ Lx, 0 ≤ y ≤Ly, 0 ≤ z ≤ Lz . The boundaries at z = 0, Lz are walls which move
Author's personal copy
K. Verhulst et al. / J. Non-Newtonian Fluid Mech. 156 (2009) 29–43 31
Table 1Blend characteristics at experimental conditions
Droplet–matrix Droplet phase Matrix phase Temperature (◦C) � (mN/m) �
1 VE–NE BF2 Saturated Rhodorsil 26.00±0.10 2.2 ±0.1 1.52 VE–NE BR16 Infineum mix 24.45 ±0.03 2.65 ±0.05 1.53 NE–VE Rhodorsil mix 1 BF2 26.40 ±0.04 2.0 ±0.1 1.54 NE–NE Rhodorsil mix 2 Parapol 1300 25.50 ±0.05 2.7 ±0.1 1.5
with speeds ±U0. This results in the velocity field (U(z), 0, 0) in theabsence of the drop, where U(z) = U0(2z − Lz)/Lz . The shear rateis � = U ′(z) = 2U0/Lz . Spatial periodicity is imposed in the x and ydirections, at x = 0, Lx and y = 0, Ly, respectively. Additional bound-ary conditions are not needed for the extra stress components. Forcomputational efficiency, Lx, Ly and Lz are chosen to minimize theeffect of neighboring drops and that of the walls. Typically, the dis-tance between the walls is eight times the drop radius, as is thespanwise period, and the period in the flow direction is chosendependent on drop extension. In these and prior (Newtonian) sim-ulations, the influence of the boundaries is negligible under thesecircumstances. Experimental results on the effect of confinementare consistent with this [34].
2.2. Initial conditions
The drop is initially spherical with radius R0. The top and bottomwalls are impulsively set into motion from rest. This requires thatthe viscoelastic stress tensor and velocity are initially zero. Sincethe velocity field is essentially governed by a parabolic PDE closeto Stokes flow, the velocity adjusts immediately to simple shear sothat whether the initial velocity field is zero or simple shear makesno difference in the numerical simulations. The initial viscoelasticstress values do, on the other hand, influence drop deformation. Forexample, if the drop were placed in a pre-existing shear flow, theinitial viscoelastic stress is equal to the values which would prevailin the corresponding simple shear flow with the given shear rate.Fig. 4 of [26] shows that a drop placed in an already establishedflow immediately experiences a large viscoelastic stress and thedeformation may overshoot. On the other hand, if the matrix fluidis viscoelastic with zero initial viscoelastic stress, then even withan established velocity field, it starts out with lower viscous stressdue to the absence of polymer viscosity. This lowers the magnitudeof stress in the matrix fluid, which pulls the drop more gently.
2.3. Drop diagnostics
We report the drop diagnostics with the same notation asin [8,35]. The slice through the center in the x–z plane, or thevelocity–velocity gradient plane, provides the drop length L andbreadth B. The angle of inclination to the flow direction is denoted�. When viewed from above the drop, the slice through the center ofthe drop in the x–y plane, or the velocity–vorticity plane, gives thedrop width W and length Lp. The Taylor deformation parametersare D = (L − B)/(L + B) and Dp = (Lp − W)/(Lp + W). The viscoelas-tic stress fields displayed in this paper are generated from contourvalues of the trace of the extra stress tensor, tr (T). This is directlyproportional to the extension of the polymer molecules, and ismeaningful to plot from the direct numerical simulations. Con-tour values are given on the numerical plots in order to providea comparison among the plots.
2.4. Accuracy
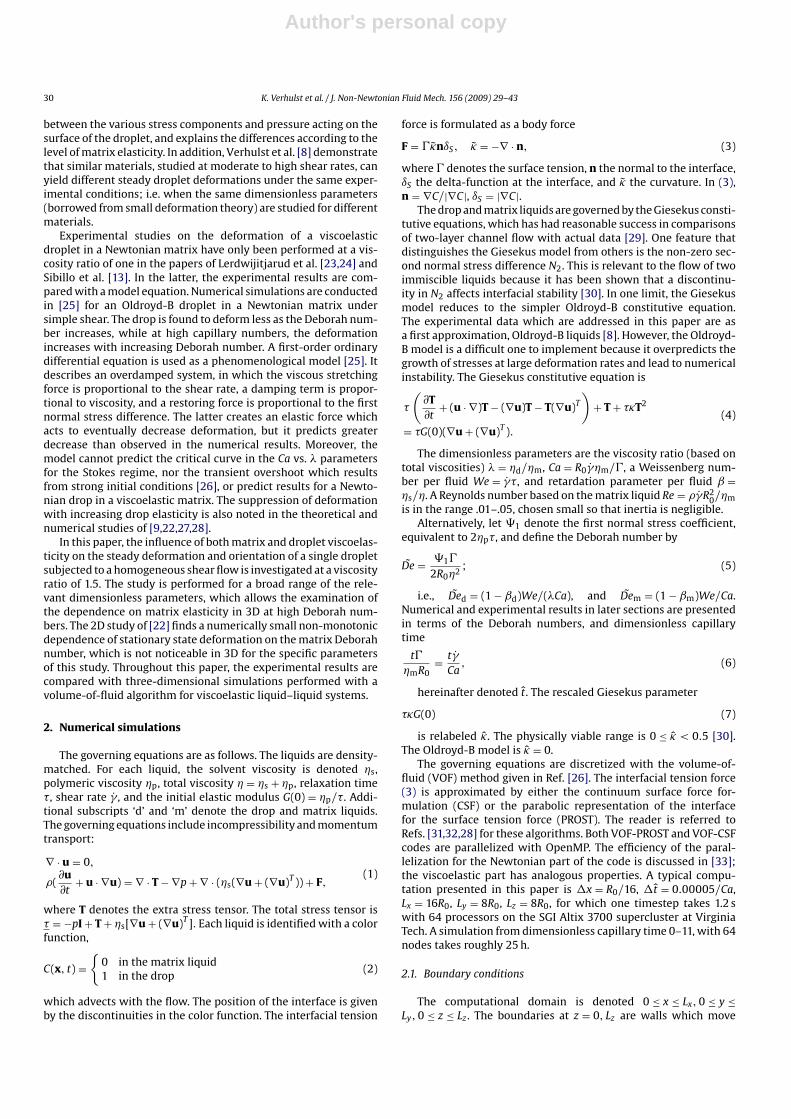
Computational accuracy for the Oldroyd-B portion is discussedin [28] for the 2D code, and in [26] for the 3D version. Fig. 1 is a
Fig. 1. Newtonian reference system with viscosity ratio 1.5 (system 4 of Table 1).Experimental data (– · –) at Ca = 0.156 (lower), 0.363 (upper) are compared withnumerical simulations with the boundary integral code of [36](– –) and VOF-CSF(—).
comparison of the experimental data (– · –) on the sideview lengthfor the Newtonian reference system 4 of Table 1. Two numericalmethods, the VOF-CSF (—) and the boundary integral scheme ofRef. [36], are used to provide quantitative agreement.
Tests for convergence with spatial and temporal refinements areperformed to decide on optimal meshing. Table 2 shows deforma-tion and angle of inclination for an Oldroyd-B drop in Newtonianmatrix with the CSF formulation at Ca = 0.35, Ded = 2.6, � = 1.5and Re = 0.05. The computational box is Lx = 16R0, Ly = 8R0, Lz =8R0. The results are also close for the PROST algorithm; since PROSTis more CPU intensive, CSF is used for later results.
Fig. 2 shows contours of trace (T) computed for the verticalcross-section through the center of a Oldroyd-B drop. The firstrow is t = 5, the second row is t = 10 and the third is t = 15. With�t� = 0.0001, the mesh is varied from �x = R0/8 for the first col-umn, �x = R0/12 for the middle column and R0/16 for the thirdcolumn. The middle column is chosen as optimal: �x = R0/12 forCa = 0.35, Ded = 2.6, � = 1.5. The temporal mesh is also varied tooptimize the timestep. The stresses vary steeply close to the inter-face and the contours are constructed from an interpolation ofthe values from the simulations. This procedure may contributeto some inaccuracy in the shape of the contours, and also thatthey cross the interface. It is clear therefore that mesh refine-ment reduces these features. A sensitivity study on the Reynoldsnumber is performed at Ca = 0.35, Ded = 0, Dem = 1.8, ˇm = 0.68,
Table 2Tests for accuracy at Ded = 2.6, Ca = 0.35, t = 30, � = 1.5, Re = 0.05
�x/R0 �t� D �◦
1/8 0.0003 0.41 23.01/12 0.00014 0.40 23.51/16 0.00014 0.39 23.6
The fluid pair is system 1 of Table 1.

Author's personal copy
32 K. Verhulst et al. / J. Non-Newtonian Fluid Mech. 156 (2009) 29–43
Fig. 2. Contour plots for trace (T) for a Oldroyd-B drop in Newtonian matrix, Ca = 0.35, Ded = 2.6, � = 1.5, t = 5 (row 1), 10 (row 2), 15 (row 3); refinement left to right�x = R0/8, R0/12, R0/16.
� = 1.5, Lx = 16R0, Ly = 8R0, Lz = 8R0, �x = R0/12. The followingproduce similar results: (i) Re = 0.05, �t = 0.00003, (ii) Re = 0.01,�t = 0.00003, (iii) Re = 0.05, �t = 0.000014, all with CSF, and (iv)Re = 0.05, �t = 0.00003 with PROST. Re = 0.05 is chosen as opti-mal.
3. Materials and experimental methods
Table 1 lists the interfacial tension and viscosity ratio for thedroplet–matrix systems used in this study. The first two blendscarry a viscoelastic droplet phase; the third blend contains a vis-
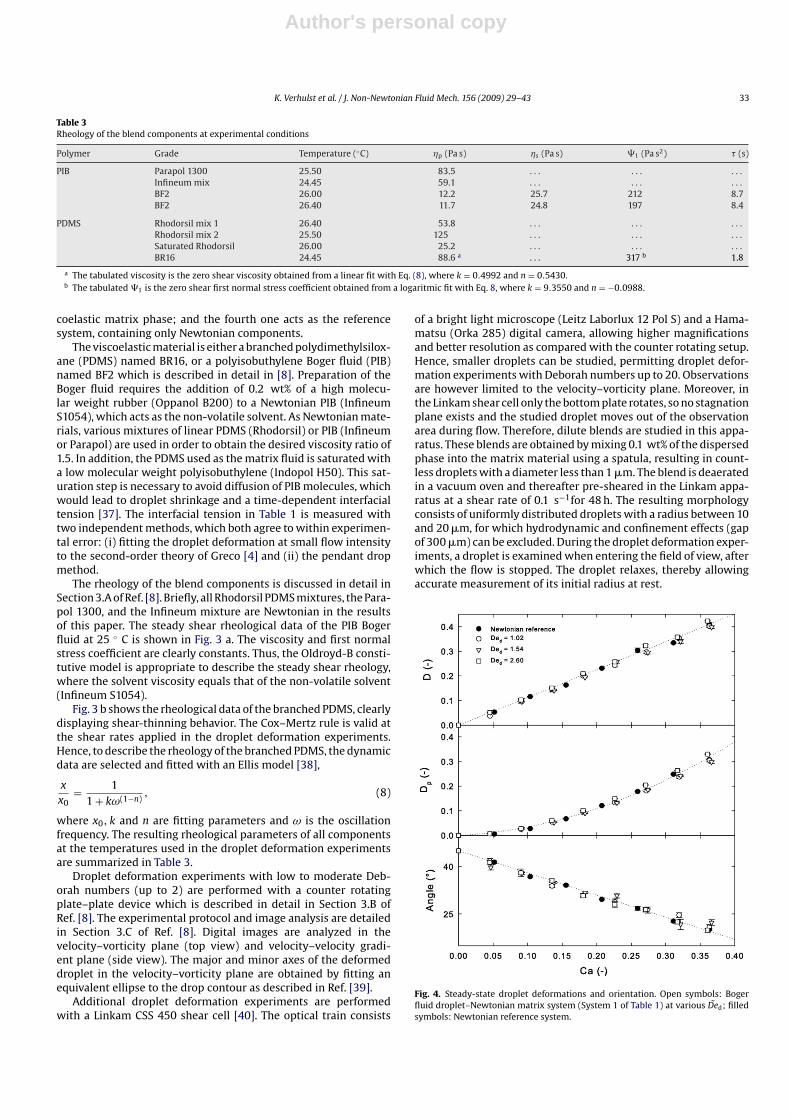
Fig. 3. Rheological characterization of the viscoelastic fluids at a reference temperature of 25◦C. (a) PIB Boger fluid BF2. First normal stress difference: �, viscosity: ♦, firstnormal stress coefficient: ◦; Lines are the Oldroyd-B model. (b) Branched PDMS BR16. Open symbols are dynamic data, 2G′/(ωaT )2: ◦, dynamic viscosity: ♦, 2G′: �; filledsymbols are steady shear data, first normal stress coefficient: �, viscosity: �, first normal stress difference: �; Lines are the Ellis model.
Author's personal copy
K. Verhulst et al. / J. Non-Newtonian Fluid Mech. 156 (2009) 29–43 33
Table 3Rheology of the blend components at experimental conditions
Polymer Grade Temperature (◦C) �p (Pa s) �s (Pa s) 1 (Pa s2) � (s)
PIB Parapol 1300 25.50 83.5 . . . . . . . . .Infineum mix 24.45 59.1 . . . . . . . . .BF2 26.00 12.2 25.7 212 8.7BF2 26.40 11.7 24.8 197 8.4
PDMS Rhodorsil mix 1 26.40 53.8 . . . . . . . . .Rhodorsil mix 2 25.50 125 . . . . . . . . .Saturated Rhodorsil 26.00 25.2 . . . . . . . . .BR16 24.45 88.6 a . . . 317 b 1.8
a The tabulated viscosity is the zero shear viscosity obtained from a linear fit with Eq. (8), where k = 0.4992 and n = 0.5430.b The tabulated 1 is the zero shear first normal stress coefficient obtained from a logaritmic fit with Eq. 8, where k = 9.3550 and n = −0.0988.
coelastic matrix phase; and the fourth one acts as the referencesystem, containing only Newtonian components.
The viscoelastic material is either a branched polydimethylsilox-ane (PDMS) named BR16, or a polyisobuthylene Boger fluid (PIB)named BF2 which is described in detail in [8]. Preparation of theBoger fluid requires the addition of 0.2 wt% of a high molecu-lar weight rubber (Oppanol B200) to a Newtonian PIB (InfineumS1054), which acts as the non-volatile solvent. As Newtonian mate-rials, various mixtures of linear PDMS (Rhodorsil) or PIB (Infineumor Parapol) are used in order to obtain the desired viscosity ratio of1.5. In addition, the PDMS used as the matrix fluid is saturated witha low molecular weight polyisobuthylene (Indopol H50). This sat-uration step is necessary to avoid diffusion of PIB molecules, whichwould lead to droplet shrinkage and a time-dependent interfacialtension [37]. The interfacial tension in Table 1 is measured withtwo independent methods, which both agree to within experimen-tal error: (i) fitting the droplet deformation at small flow intensityto the second-order theory of Greco [4] and (ii) the pendant dropmethod.
The rheology of the blend components is discussed in detail inSection 3.A of Ref. [8]. Briefly, all Rhodorsil PDMS mixtures, the Para-pol 1300, and the Infineum mixture are Newtonian in the resultsof this paper. The steady shear rheological data of the PIB Bogerfluid at 25 ◦ C is shown in Fig. 3 a. The viscosity and first normalstress coefficient are clearly constants. Thus, the Oldroyd-B consti-tutive model is appropriate to describe the steady shear rheology,where the solvent viscosity equals that of the non-volatile solvent(Infineum S1054).
Fig. 3 b shows the rheological data of the branched PDMS, clearlydisplaying shear-thinning behavior. The Cox–Mertz rule is valid atthe shear rates applied in the droplet deformation experiments.Hence, to describe the rheology of the branched PDMS, the dynamicdata are selected and fitted with an Ellis model [38],
x
x0= 1
1 + kω(1−n), (8)
where x0, k and n are fitting parameters and ω is the oscillationfrequency. The resulting rheological parameters of all componentsat the temperatures used in the droplet deformation experimentsare summarized in Table 3.
Droplet deformation experiments with low to moderate Deb-orah numbers (up to 2) are performed with a counter rotatingplate–plate device which is described in detail in Section 3.B ofRef. [8]. The experimental protocol and image analysis are detailedin Section 3.C of Ref. [8]. Digital images are analyzed in thevelocity–vorticity plane (top view) and velocity–velocity gradi-ent plane (side view). The major and minor axes of the deformeddroplet in the velocity–vorticity plane are obtained by fitting anequivalent ellipse to the drop contour as described in Ref. [39].
Additional droplet deformation experiments are performedwith a Linkam CSS 450 shear cell [40]. The optical train consists
of a bright light microscope (Leitz Laborlux 12 Pol S) and a Hama-matsu (Orka 285) digital camera, allowing higher magnificationsand better resolution as compared with the counter rotating setup.Hence, smaller droplets can be studied, permitting droplet defor-mation experiments with Deborah numbers up to 20. Observationsare however limited to the velocity–vorticity plane. Moreover, inthe Linkam shear cell only the bottom plate rotates, so no stagnationplane exists and the studied droplet moves out of the observationarea during flow. Therefore, dilute blends are studied in this appa-ratus. These blends are obtained by mixing 0.1 wt% of the dispersedphase into the matrix material using a spatula, resulting in count-less droplets with a diameter less than 1 �m. The blend is deaeratedin a vacuum oven and thereafter pre-sheared in the Linkam appa-ratus at a shear rate of 0.1 s−1for 48 h. The resulting morphologyconsists of uniformly distributed droplets with a radius between 10and 20 �m, for which hydrodynamic and confinement effects (gapof 300 �m) can be excluded. During the droplet deformation exper-iments, a droplet is examined when entering the field of view, afterwhich the flow is stopped. The droplet relaxes, thereby allowingaccurate measurement of its initial radius at rest.
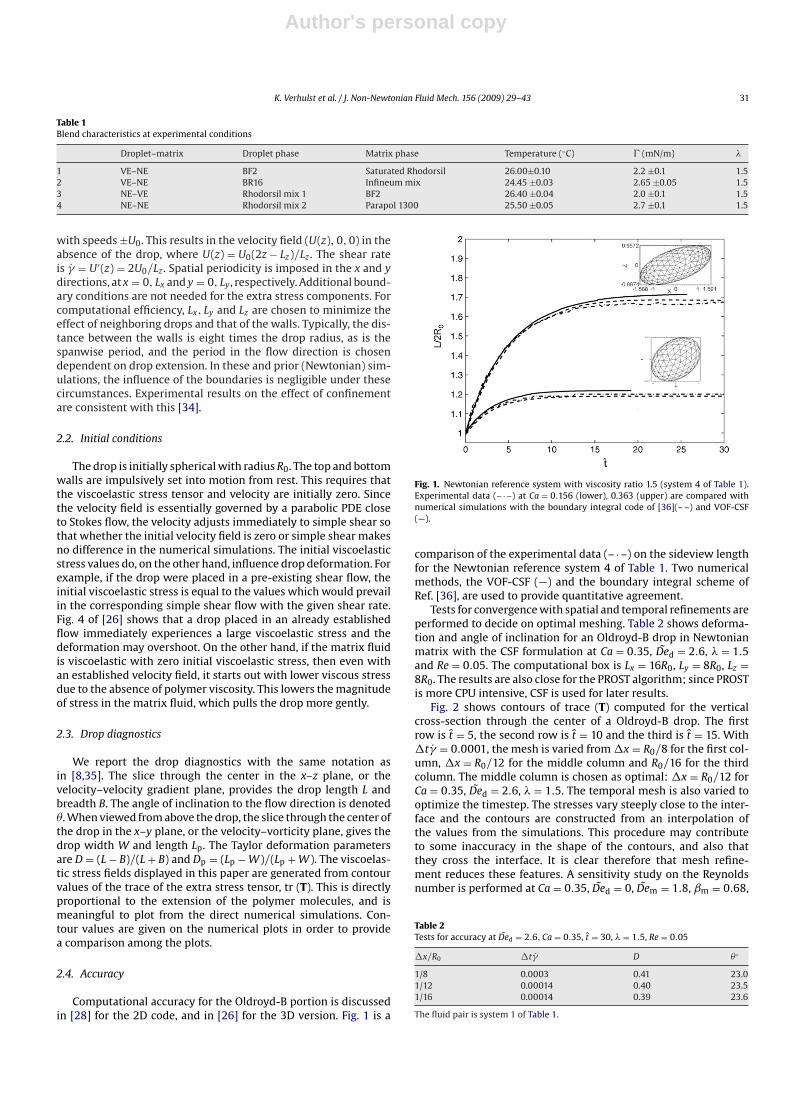
Fig. 4. Steady-state droplet deformations and orientation. Open symbols: Bogerfluid droplet–Newtonian matrix system (System 1 of Table 1) at various Ded; filledsymbols: Newtonian reference system.

Author's personal copy
34 K. Verhulst et al. / J. Non-Newtonian Fluid Mech. 156 (2009) 29–43
Fig. 5. Side view deformation, 3D VOF-CSF simulation (—) and experimental data (o) at fixed Ded = 1.54, for varying Ca = (a) 0.14; (b) 0.32, and Newtonian CSF simulation(−−). The contours for trace (T) at stationary states are given.
4. Results and discussion
4.1. Boger fluid droplet system
The effects of droplet viscoelasticity on the droplet deformationand orientation are systematically studied over a wide range of Deb-orah and capillary numbers and thus contribute to the scarce dataon viscoelastic droplet systems. Fig. 4 shows the stationary dropletdeformations D and Dp, and orientation of a Boger fluid droplet in aNewtonian matrix (System 1, Table 1). The Newtonian/Newtonian
reference (System 4, Table 1) is also plotted for comparison. Therange of Deborah number is achieved by varying the radius of thedroplet. The counter-rotating setup was used, yielding the com-plete 3D picture of the deformed droplet. The figure shows hardlyany difference between the elastic droplet system (open symbols)and the Newtonian/Newtonian reference system (filled symbols) atthe same capillary number, beyond what one expects as the range ofsmall deformation. Moreover, an increase in the Deborah number,i.e. elasticity, does not result in any change in the steady deforma-tion and orientation, at least within experimental error. Thus, even
Fig. 6. Steady-state droplet deformation of the Boger fluid droplet system at various Ded numbers. (a) Top view results as a function of the capillary number; open symbols:counter rotating experiments; filled symbols: Newtonian reference system; gray symbols: Linkam experiments. (b) Top view results at fixed Ca = 0.35; lines denote Newtoniansteady-state deformation.

Author's personal copy
K. Verhulst et al. / J. Non-Newtonian Fluid Mech. 156 (2009) 29–43 35
Table 4Numerical simulations for steady-state of the elastic drop (system 1, Table 1) atCa = 0.35
Ded Lp W Dp L B D Angle
1.02 1.51 0.88 0.26 1.63 0.71 0.39 232.6 1.53 0.85 0.29 1.65 0.7 0.40 234 1.58 0.84 0.31 1.7 0.68 0.43 24
12.31 1.64 0.82 0.33 1.75 0.69 0.43 22
Ded = 1.02 (�x = R0/8), 2.6 (�x = R0/16), 4 (�x = R0/8), 12.31 (�x = R0/12).
for Deborah numbers up to almost 3, which represents strong elas-ticity beyond the small deformation limit, the elastic drop behaveslike a Newtonian one.
Numerical simulations and experimental data are compared inFig. 5 at Ded = 1.54 for Ca = 0.14 and 0.32. At the lower capil-lary number, the viscoelastic droplet simulation is similar to theNewtonian droplet simulation. For the higher Ca, the viscoelas-tic droplet simulation and data show less deformation than theNewtonian simulation. For fixed Deborah number, the magnitudeof viscoelastic stress increases with capillary number. The locationof the maximum viscoelastic stress migrates to slightly above thedrop tip at the back, and slightly below the drop tip at the frontwhen stationary state is reached.
Fig. 6 a shows the steady droplet deformation of the Boger fluiddroplet system against the capillary number at higher Deborahnumbers (Ded up to almost 20), measured with the Linkam shearcell. This setup only allows observations in the velocity–vorticityplane, therefore only information on the axes W and Lp is presented.Fig. 6 a also includes the results at smaller Ded, measured with thecounter-rotating setup; and the Newtonian reference system, all ata viscosity ratio of 1.5. It is clear that, even at these very large Deb-
Fig. 8. Steady-state droplet deformation and orientation. Open symbols: Shear-thinning viscoelastic branched fluid droplet–Newtonian matrix system (System 2of Table 1) at various Ded0 numbers; filled symbols: Newtonian reference system.
Fig. 7. Stationary state contour plot of trace (T) through the vertical cross-section of the drop at Ca = 0.35: (a) Ded= 1.02, (b) 2.6, (c) 12.31 and (d) stream lines for Ded = 12.31.

Author's personal copy
36 K. Verhulst et al. / J. Non-Newtonian Fluid Mech. 156 (2009) 29–43
Fig. 9. Steady-state droplet deformation of the shear-thinning viscoelastic branched fluid droplet system at various Ded0 numbers. (a) Top view results as a function of thecapillary number; open symbols: counter rotating experiments; filled symbols: Newtonian reference system; gray symbols: Linkam experiments. (b) Top view results at fixedCa = 0.35; lines denote Newtonian steady-state deformation.
orah numbers, the effect of droplet elasticity is insignificant. Onecould argue on the basis of Fig. 6 a that at the large Ded numbers thedroplet elasticity has the tendency to suppress the droplet deforma-tion by a small amount. But, by presenting the data as shown in Fig. 6b at a constant capillary number of 0.35, well beyond the range ofsmall deformation, it is obvious that if any effect of droplet elasticitywere present on Lp or W, it is within experimental error. This con-clusion is even more unmistakable when plotting the deformationparameter Dp (see Fig. 6b), where no effect of droplet elasticity isseen, even at the very high Deborah numbers. These results suggestthat the droplet orientation at higher Ded numbers is also hardlyaffected by droplet elasticity.
Numerical simulations for Fig. 6 are conducted at a fixed Ca =0.35 with varying Deborah numbers. Table 4 shows the steady-state drop diagnostics from VOF-CSF simulations at Ca = 0.35,Ded = 1.02, 2.6, 4, 12.31. These indicate a slight elongation withincreasing Ded.
Fig. 7 shows steady-state contours of trace (T) for Ded =1.02, 2.6, 12.31. The magnitude of the elastic stresses increasesand their location shift to narrower areas along the interface asDed increases. The velocity fields are similar to the Newtonian ref-erence system, and streamlines are shown for the Ded = 12.31.The flow inside the drop is a recirculation, and the accompany-ing shear rate is different from the imposed shear rate outside thedrop and moreover, it is not uniform but depends on the shape ofthe droplet. In a recirculating flow, the flow does not exhibit muchstretching compared with the shear flow in the matrix. Therefore,viscoelastic stresses inside the drop are much smaller than thoseobtained outside the droplet in a viscoelastic matrix. Thus, the elon-gational component of the flow is weak, and correspondingly elasticeffects; this is reminiscent of other recirculating flows, such as thecorner eddies in contraction flow. In particular, the 4:1 contrac-tion flow is known to have corner vortices with only weak elasticstresses [41]. The main difference between these and the drop isthat the outer contraction flow determines their sizes, while in thedrop system, the size of the recirculation zone is given. At fixedcapillary number, the position of maximum viscoelastic stress isseen to move slightly upwards at the back of the drop and alsodownwards at the front. Since the maxima are not at the droptips, they promote rotation, and prevent the drop from elongatingfurther.
4.2. Shear-thinning viscoelastic droplet system
In this section, the additional effects of shear-thinning behaviorof the droplet fluid are systematically studied at both low and high
shear flow intensities. Fig. 8, for example, shows the steady defor-mation and orientation for the viscoelastic shear-thinning droplet(system 2 of Table 1) as a function of the capillary and Deborah num-ber. The Newtonian/Newtonian reference system is also plotted forcomparison. The applied Deborah numbers are calculated using thezero-shear values of viscosity and first normal stress difference.The steady droplet shapes observed in the velocity–vorticity planeand the velocity–velocity gradient plane do not display any differ-ence with the deformation observed for the Newtonian/Newtonianreference system. Also the orientation of the droplet is similar tothat observed for the Newtonian reference system. The drop thusbehaves like the Newtonian case, just as the Boger fluid droplet ofthe previous section, even at capillary numbers beyond the smalldeformation limit.
Fig. 10. Steady-state droplet deformation and orientation. Open symbols: New-tonian droplet–Boger fluid matrix system (System 3 of Table 1) at various Dem
numbers; filled symbols: Newtonian reference system.
Author's personal copy
K. Verhulst et al. / J. Non-Newtonian Fluid Mech. 156 (2009) 29–43 37
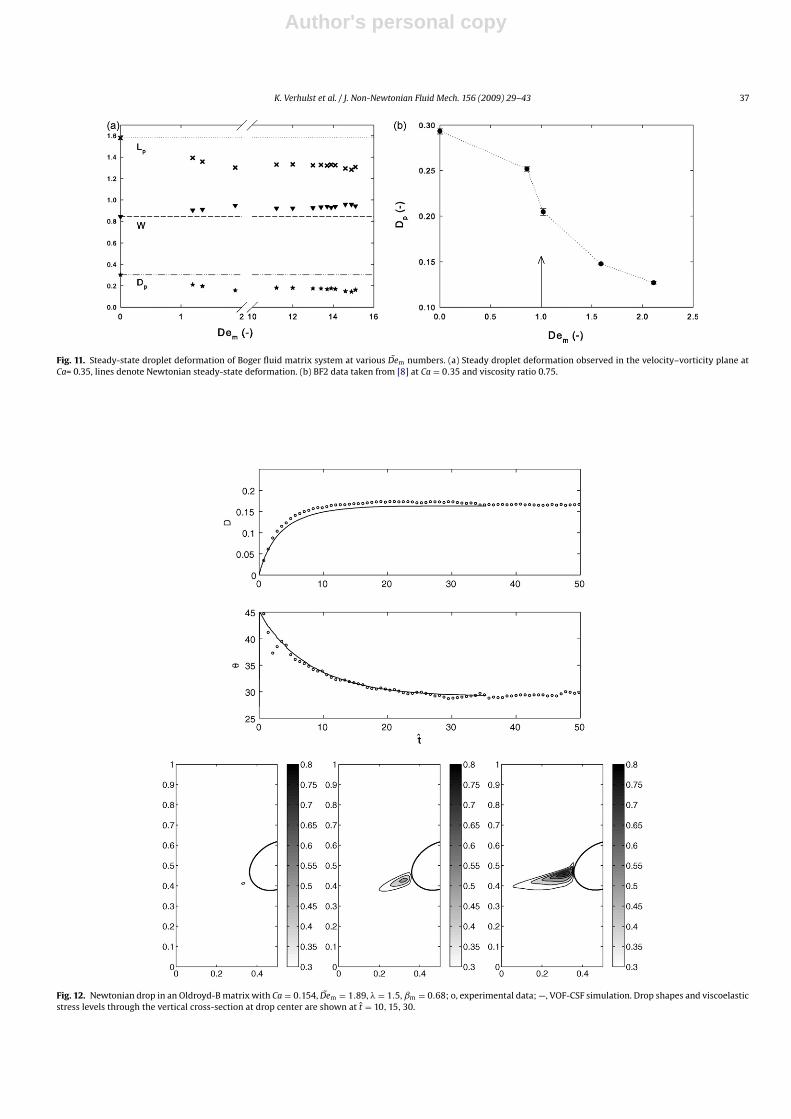
Fig. 11. Steady-state droplet deformation of Boger fluid matrix system at various Dem numbers. (a) Steady droplet deformation observed in the velocity–vorticity plane atCa= 0.35, lines denote Newtonian steady-state deformation. (b) BF2 data taken from [8] at Ca = 0.35 and viscosity ratio 0.75.
Fig. 12. Newtonian drop in an Oldroyd-B matrix with Ca = 0.154, Dem = 1.89, � = 1.5, ˇm = 0.68; o, experimental data; —, VOF-CSF simulation. Drop shapes and viscoelasticstress levels through the vertical cross-section at drop center are shown at t = 10, 15, 30.

Author's personal copy
38 K. Verhulst et al. / J. Non-Newtonian Fluid Mech. 156 (2009) 29–43
Fig. 9 a shows the steady droplet deformation of the vis-coelastic shear-thinning droplet, observed in the velocity–vorticityplane at very high Deborah numbers, i.e. smaller droplets. Thedata are obtained with the Linkam shear cell, studying individ-ual droplets. The steady droplet deformations, measured with thecounter rotating setup are also displayed. It is shown that evenat very large Deborah numbers (Ded0 up to 12), or equivalentimposed shear rates up to 3 s−1, the effect of droplet elasticity andshear-thinning behavior is insignificant, although somewhat morescatter is observed in the Linkam experiments. This becomes moreobvious if the results are plotted versus the Deborah number, asshown in Fig. 9 b at a constant capillary number of 0.35. The linesrepresent the corresponding Newtonian steady deformation. It is
obvious that if any effect of droplet elasticity and shear-thinningbehavior would be present, it is small and within experimentalerror.
As in the previous section (e.g., Fig. 5), numerical simulationswith the Oldroyd-B model at ˇd0 = 0.6 produce similar droplethistory as the Newtonian case. Introducing the shear-thinning bymeans of a Giesekus model, thereby resembling the rheology fit-ted with the Ellis model as exactly as possible, does not have apronounced effect on the resulting steady deformation and ori-entation. Therefore, the numerical results are omitted here sincethey mirror those of the previous section. This result is how-ever not surprising, the shear rate inside the droplet is muchsmaller than the imposed shear rate, and the elastic stresses
Fig. 13. Newtonian drop in BF2 system, modelled with Oldroyd-B. Ca = 0.154. The temporal evolution of deformation for Dem = 0 (. . .), 1 (− · −), 1.89 (−−), 4 (–), togetherwith the stationary values of deformation D vs. Dem. Contours of trace (T) for Dem = 1, 1.89, 4, 6 at t = 30.
Author's personal copy
K. Verhulst et al. / J. Non-Newtonian Fluid Mech. 156 (2009) 29–43 39
generated by the recirculation inside the droplet are small, sim-ilar to what is shown for the Boger fluid droplet system (seeFig. 7).
4.3. Boger fluid matrix system
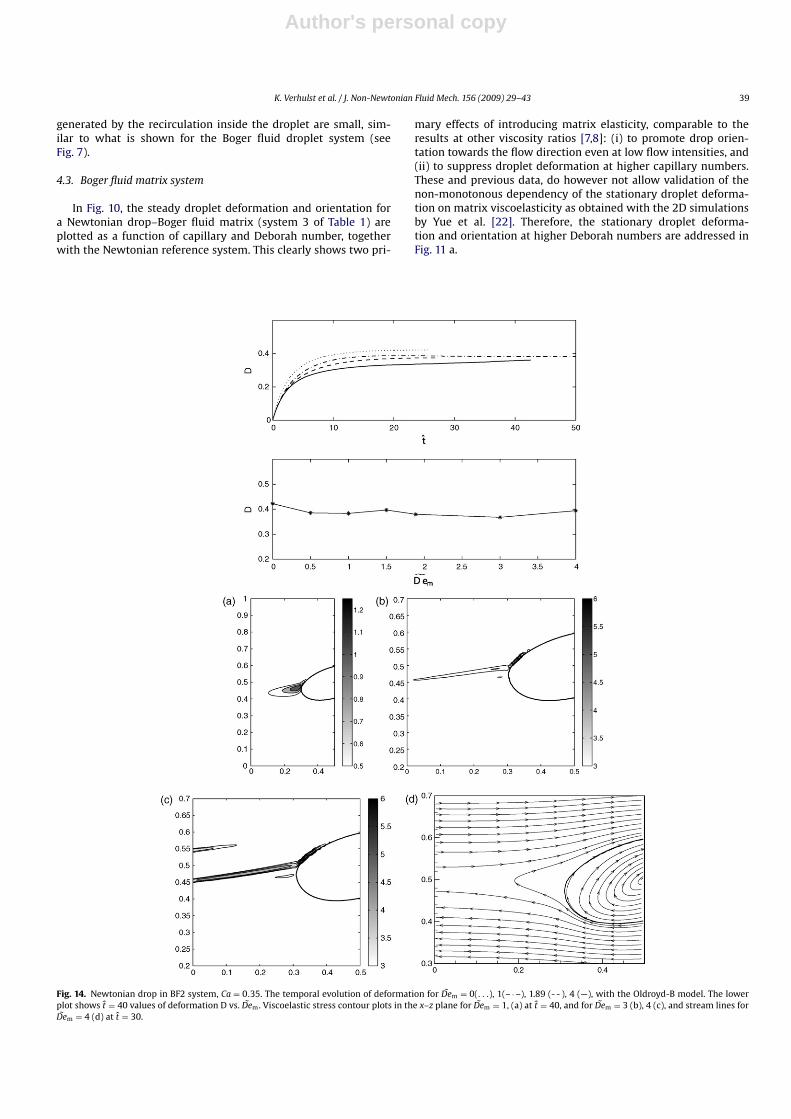
In Fig. 10, the steady droplet deformation and orientation fora Newtonian drop–Boger fluid matrix (system 3 of Table 1) areplotted as a function of capillary and Deborah number, togetherwith the Newtonian reference system. This clearly shows two pri-
mary effects of introducing matrix elasticity, comparable to theresults at other viscosity ratios [7,8]: (i) to promote drop orien-tation towards the flow direction even at low flow intensities, and(ii) to suppress droplet deformation at higher capillary numbers.These and previous data, do however not allow validation of thenon-monotonous dependency of the stationary droplet deforma-tion on matrix viscoelasticity as obtained with the 2D simulationsby Yue et al. [22]. Therefore, the stationary droplet deforma-tion and orientation at higher Deborah numbers are addressed inFig. 11 a.
Fig. 14. Newtonian drop in BF2 system, Ca = 0.35. The temporal evolution of deformation for Dem = 0(. . .), 1(– · –), 1.89 (- - ), 4 (—), with the Oldroyd-B model. The lowerplot shows t = 40 values of deformation D vs. Dem. Viscoelastic stress contour plots in the x–z plane for Dem = 1, (a) at t = 40, and for Dem = 3 (b), 4 (c), and stream lines forDem = 4 (d) at t = 30.

Author's personal copy
40 K. Verhulst et al. / J. Non-Newtonian Fluid Mech. 156 (2009) 29–43
Fig. 15. Newtonian drop in BF2 matrix with Ca = 0.36, Dem = 1.89, � = 1.5,ˇm = 0.68. Experimental data o; 3D Oldroyd-B model —; Giesekus model withm = 0.01 – ·.
Fig. 11 a shows the steady droplet deformation of the Bogerfluid matrix system, observed in the velocity–vorticity plane, plot-ted as a function of the Deborah number (up to 16) at Ca =0.35. It is shown that at Dem ≈ 2, the effect of matrix elastic-ity saturates. The dependency at lower Deborah number (< 2) issimilar to that obtained for the BF2 matrix system with a vis-cosity ratio of 0.75, studied in Verhulst et al. [8], and replottedhere in figure 11 b. Both experiments thus qualitatively yield thesame results. At Dem < 2, a decrease in droplet size, or equiva-lently, an increase in the applied Dem, results in a decrease of thesteady droplet deformation. A sigmoidal dependency on the Deb-orah number is seen with an inflexion point around Dem ≈ 1; thepoint where non-Newtonian effects are expected to become visible[4].
These experimentally observed trends are at least qualitativelypredicted by the various phenomenological models presentedin literature [8–11], although they are predicting a monotonousdecrease of the droplet deformation with increasing Dem. Hence,the quantitative prediction of these models at high capillary num-bers is less satisfying. Verhulst et al. [8] attribute this to thesimplicity of the rheological model used by [10]. Hence, in thenumerical simulations, the Oldroyd-B model is chosen to describethe rheology of the Boger fluid. Numerical simulations are con-ducted at Ca = 0.154, 0.35, or 0.361, and compared with the dataof Figs. 10 and 11 a.
Simulations at low capillary number agree quite well withexperimental data, as exemplified by Fig. 12 at Ca = 0.154 andDem = 1.89, with � = 1.5, ˇm = 0.68. Both deformation and angleof inclination are shown to be closely predicted. Contours oftrace (T) at t = 10, 15, 30 are also shown in the figure. Astime progresses, the area of largest viscoelastic stress movesfrom the drop tip slightly upwards. In Fig. 13, simulationswith Ca = 0.154, and Dem increasing from 0 to 4, are shownbecause the experimental data show saturation in D as theDeborah number increases. For higher Deborah numbers, moremesh refinement is required to capture the high gradient inviscoelastic stress at drop tips, and the initial transient takeslonger. Deformation vs. t is shown in the upper plot, fromwhich t = 40 is used to plot the stationary D vs. Dem. Numer-ical results in Fig. 13 show little change in the stationary
deformation between Dem = 0.5 and 1.5, and then a decrease.Contours of trace(T) are shown at t = 30, which is close tostationary state. Due to spatial periodicity in the x-direction,contours may enter from the left boundary, as for the caseDem = 6.
At the higher capillary number Ca = 0.35, simulations with theOldroyd-B model are shown in Fig. 14. The upper plot shows theevolution of deformation for Dem = 0(. . .) 1 (− · −), 1.89 (- -), 4(—). The transients take longer to settle with increasing Debo-rah number and Dem = 4 is still slightly elongating in the figure.In the lower figure, the t = 40 deformation values vs. Dem areplotted. These are roughly stationary states. The 2D counterpartof this study is in Fig. 1 of [22]: non-monotonic dependence ofsteady-state deformation as a function of the Deborah numberfor capillary number 0.1 and 0.2. Their deformation at Ca = 0.1hits a minimum value of D = 0.103 at Deborah number 0.5 andthen increases to D = 0.122 at Deborah number 2. At Ca = 0.2,their minimum shifts to Deborah number 0.8. The 3D calculationsare qualitatively different from these. The 2D case is that of aninfinitely long cylindrical interface, and differs from 3D results athigher deformations (see Fig. 1 of [42] for another example). Thecontours for trace (T) are shown at Dem = 1, 3, 4 at fixed t = 40.The location of the maxima lie slightly above the drop tip atthe back of the drop rather than at the drop tips, directly at theinterface. The streamlines are shown in the x–z cross-section forDem = 4, and the dividing streamline appears to correspond withthe high viscoelastic stresses that come off of the drop in a narrowregion.
Fig. 15 shows temporal evolution for the particular case ofCa = 0.35, Dem = 1.89, for experimental data (o) against the 3DOldroyd B model (—) and the Giesekus model with m = 0.01. Thereis a slight decay in deformation in the Oldroyd B simulation forlarge time, but it essentially saturates to a constant value of defor-mation and angle. The Giesekus model displays more damping inthe deformation and gives a better fit to the data. The data showsadditional damping as time progresses, which may reflect the pres-ence of more than one relaxation time. The effect of changing theretardation parameter in the 3D simulations is that increasing fromˇm = 0.26 to ˇm = 0.8 decreases the maximum deformation. Thisprovides a check that the value ˇm = 0.68 deduced from Table 3 isconsistent.
The introduction of shear-thinning in the 3D simulation relievesthe overall stress as shown in Fig. 16. The left hand column showsthe viscoelastic stress growing in intensity, while the addition ofm = 0.01 is shown on the right at the corresponding times. Theeffect of introducing the Giesekus parameter is a slight decreasein the stationary state deformation, and slight increase in theangle of inclination, both of which improve the agreement withthe experimental data. However, both settle to constant valuesrather than the prolonged decay in deformation observed in thedata, which may be due to multiple relaxation times. We there-fore develop the 5-mode Giesekus model in Appendix A thatmore accurately describes the linear viscoelasticity, the steadyshear rheology, and steady and transient extensional rheology.It is evident that the presence of the long relaxation time forfluid BF2 explains the decay in the experimental data. The 5-mode model is also used in the second part of this work whendescribing drop relaxation [42]. The single mode rheological char-acterization from [43] has been used throughout this paper inthe numerical simulations. (Note that the simulations of [26] atthe higher capillary numbers with the Oldroyd-B model over-predicts the viscoelastic stresses, and they use a Giesekus modelin order to compare with experimental data. In fact, this isdue to an error in their code which has been corrected in thispaper.)

Author's personal copy
K. Verhulst et al. / J. Non-Newtonian Fluid Mech. 156 (2009) 29–43 41
Fig. 16. Contours for trace (T) through the vertical cross-section of a drop for Fig. 15. Newtonian drop in an Oldroyd-B fluid (left) with Ca = 0.361, Dem = 1.89, � = 1.5,ˇm = 0.68, and Giesekus model with m = 0.01 (right) at t = 5, 10, 30.
5. Conclusion
The influence of matrix and droplet viscoelasticity on the steadydeformation and orientation of a single droplet subjected to ahomogeneous shear flow is investigated microscopically. The vis-cosity ratio is 1.5 and we focus on capillary numbers around 0.15 and0.35, outside the range of small deformation asymptotics. Dropletviscoelasticity has hardly any effect on the steady droplet defor-mation and orientation, even at moderate to high capillary andDeborah numbers. Matrix elasticity, on the other hand, significantlysuppresses droplet deformation and promotes droplet orientation,two effects that saturate at high Deborah numbers. This corre-sponds to decreasing the droplet radius under the same physicalconditions. These experimental results are in quantitative agree-
ment with 3D simulations performed with the Oldroyd-B model;accurate results for the higher capillary number are obtainednumerically for the first time. The 3D simulations also show forthe first time that the stationary value of deformation saturatesat higher matrix Deborah numbers, which is also observed in theexperimental data. The introduction of some shear-thinning in thematrix fluid by means of a Giesekus model yields the trend that thedeformation is lower and the angle is higher, both of which are inthe direction of the data. Additionally, the experimental data showa greater decay in stationary state deformation over a longer timescale than is described by the rheological models used in the numer-ical simulations. This is reconciled by the presence of a mode witha longer relaxation time in the 5-mode Giesekus model describedin Appendix A(Table 5).

Author's personal copy
42 K. Verhulst et al. / J. Non-Newtonian Fluid Mech. 156 (2009) 29–43
Fig. A.1. Rheological characterization of BF2. (a) Steady shear rheology: first normal stress difference �, viscosity ◦, first normal stress coefficient �. (b) Linear viscoelasticity:2G′/(ωaT )2�, dynamic viscosity ◦, 2G′�. Lines are the 5 mode Giesekus model.
Fig. A.2. Rheological characterization of BF2. (a) Steady Trouton ratio. Symbols: experimental data, line: Oldroyd-B model, dashed line: 5 mode giesekus model. (b) TransientTrouton ratio at strain rate of 0.3 s−1. Dashed line: experimental data, line: 5 mode Giesekus model.
Acknowledgements
This research is supported by NSF-DMS-0456086, NCSACTS060022, GOA 03/06 and FWO-Vlaanderen for a fellowship forRuth Cardinaels. The authors would like to thank Prof. Sridhar ofMonash University for measuring the extensional rheology of oursamples, and Pascal Gillioen & Dr. Jorg Lauger of Anton Paar for theirhelp with the counter rotating device.
Appendix A
A 5-mode Giesekus model is proposed to describe the rheologyof the Boger fluid BF2. It describes the linear viscoelasticity, thesteady shear rheology, and steady and transient extensional rheol-ogy, as demonstrated in Figs. A.1 and A.2. All data are temperature
Table 5Giesekus description with 5 relaxation modes of the BF2 fluid
Mode � (s) �p (Pa s)
1 49 2.66 0.22 16.9 7.43 0.000013 2.03 5.82 0.000014 0.187 2.69 0.25 0.0131 1.39 0.2
Solvent – 27.2 –
super-positioned with a reference temperature of 25◦C. The shift-factors aT at a temperature of 26 ◦ C and 26.4 ◦ C are 0.915 and0.882.
The longest relaxation time is obtained from capillary break-upmeasurements using a Caber device. The four additional relaxationtimes and their corresponding partial viscosities are obtained fromfitting the linear viscoelasticity with 5 Maxwell modes, as describedby Quinzani et al. [44]. The -values are obtained from fitting thesteady shear data. The resulting 5 relaxation times and their corre-sponding partial viscosities and -values; and the solvent viscosityare given in Table 5.
References
[1] R.G. Larson, The Structure and Rheology of Complex Fluids, Oxford UniversityPress, 1999.
[2] L.A. Utracki, Polymer Alloys and Blends, Hanser Munich, 1989.[3] S. Guido, F. Greco, Dynamics of a liquid drop in a flowing immiscible liquid, in:
D.M. Binding, K. Walters (Eds.), Rheology Reviews, British Society of Rheology,2004, pp. 99–142.
[4] F. Greco, Drop deformation for non-Newtonian fluids in slow flows, J. Non-Newtonian Fluid Mech. (2002) 111–131.
[5] W. Yu, M. Bousmina, C. Zhou, C.L. Tucker, Theory for drop deformation in vis-coelastic systems, J. Rheol. 48 (2) (2004) 417–438.
[6] S. Guido, M. Simeone, F. Greco, Effects of matrix viscoelasticity on drop defor-mation in dilute polymer blends under slow shear flow, Polymer 44 (2003)467–471.
[7] S. Guido, M. Simeone, F. Greco, Deformation of a Newtonian drop in a viscoelas-tic matrix under steady shear flow. Experimental validation of slow flow theory,J. Non-Newtonian Fluid Mech. 114 (2003) 65–82.
Author's personal copy
K. Verhulst et al. / J. Non-Newtonian Fluid Mech. 156 (2009) 29–43 43
[8] K. Verhulst, P. Moldenaers, M. Minale, Drop shape dynamics of a Newtoniandrop in a non-Newtonian matrix during transient and steady shear flow, J.Rheol. 51 (2007) 261–273.
[9] P.L. Maffettone, F. Greco, Ellipsoidal drop model for single drop dynamics withNon-Newtonian fluids, J. Rheol. 48 (2004) 83–100.
[10] M. Minale, Deformation of a non-Newtonian ellipsoidal drop in a non-Newtonian matrix: extension of Maffettone-Minale model, J. Non-NewtonianFluid Mech. 123 (2004) 151–160.
[11] W. Yu, C. Zhou, M. Bousmina, Theory of morphology evolution inmixtures of viscoelastic immiscible components, J. Rheol. 49 (2005)215–236.
[12] P.L. Maffettone, F. Greco, M. Simeone, S. Guido, Analysis of start-up dynamicsof a single drop through an ellipsoidal drop model for non-Newtonian fluids, J.Non-Newtonian Fluid Mech. 126 (2005) 145–151.
[13] V. Sibillo, S. Guido, F. Greco, P.L. Maffettone, Single drop dynamicsundershearing flow in systems with a viscoelastic phase, in: Times of Polymers,Macromolecular Symposiam 228, Wiley, 2005, pp. 31–39.
[14] V. Sibillo, M. Simeone, S. Guido, F. Greco, P.L. Maffettone, Start-up and retractiondynamics of a Newtonian drop in a viscoelastic matrix under simple shear flow,J. Non-Newtonian Fluid Mech. 134 (2006) 27–32.
[15] D.C. Tretheway, L.G. Leal, Deformation and relaxation of Newtonian drops inplanar extensional flow of a Boger fluid, J. Non-Newtonian Fluid Mech. 99(2001) 81–108.
[16] F. Mighri, A. Ajji, P.J. Carreau, Influence of elastic properties on drop deformationin elongational flow, J. Rheol. 41 (5) (1997) 1183–1201.
[17] H.B. Chin, C.D. Han, Studies on droplet deformation and breakup. I. Dropletdeformation in extensional flow, J. Rheol. 23 (5) (1979) 557–590.
[18] W.J. Milliken, L.G. Leal, Deformation and breakup of viscoelastic drops in planarextensional flows, J. Non-Newtonian Fluid Mech. 40 (1991) 355–379.
[19] H. Vanoene, Modes of dispersion of viscoelastic fluids in flow, J. Colloid InterfaceSci. 40 (3) (1972) 448–467.
[20] J.J. Elmendorp, R.J. Maalcke, A study on polymer blending microrheology: Part1, Polym. Eng. Sci. 25 (1985) 1041–1047.
[21] F. Mighri, P.J. Carreau, Influence of elastic properties on drop deformation andbreakup in shear flow, J. Rheol. 42 (1998) 1477–1490.
[22] P. Yue, J.J. Feng, C. Liu, Viscoelastic effects on drop deformation in steady shear,J. Fluid Mech. 540 (2005) 427–437.
[23] W. Lerdwijitjarud, R.G. Larson, A. Sirivat, M.J. Solomon, Influence ofweak elasticity of dispersed phase on droplet behavior in shearedpolybutadiene/poly(dimethyl siloxane) blends, J. Rheol. 47 (1) (2003) 37–58.
[24] W. Lerdwijitjarud, A. Sirivat, R.G. Larson, Influence of dispersed-phaseelasticity on steady-state deformation and breakup of droplets in simpleshearing flow of immiscible polymer blends, J. Rheol. 48 (4) (2004) 843–862.
[25] N. Aggarwal, K. Sarkar, Deformation and breakup of a viscoelastic drop in aNewtonian matrix under steady shear, J. Fluid Mech. 584 (2007) 1–21.
[26] D. Khismatullin, Y. Renardy, M. Renardy, Development and implementationof VOF-PROST for 3d viscoelastic liquid–liquid simulations, J. Non-NewtonianFluid Mech. 140 (2006) 120–131.
[27] S.B. Pillapakkam, P. Singh, A level-set method for computing solutions to vis-coelastic two-phase flow, J. Comp. Phys. 174 (2001) 552–578.
[28] T. Chinyoka, Y. Renardy, M. Renardy, D.B. Khismatullin, Two-dimensionalstudy of drop deformation under simple shear for Oldroyd-B liquids, J. Non-Newtonian Fluid Mech. 130 (2005) 45–56.
[29] H.K. Ganpule, B. Khomami, A theoretical investigation of interfacial insta-bilities in the three layer superposed channel flow of viscoelastic fluids, J.Non-Newtonian Fluid Mech. 79 (1998) 315–360.
[30] Y. Renardy, M. Renardy, Instability due to second normal stress jump in two-layer shear flow of the Giesekus fluid, J. Non-Newtonian Fluid Mech. 81 (1999)215–234.
[31] J. Li, Y. Renardy, M. Renardy, Numerical simulation of breakup of a viscous dropin simple shear flow through a volume-of-fluid method, Phys. Fluids 12 (2000)269–282.
[32] Y. Renardy, M. Renardy, PROST: a parabolic reconstruction of surface tensionfor the volume-of-fluid method, J. Comp. Phys. 183 (2002) 400–421.
[33] Y. Renardy, J. Li, Parallelized simulations of two-fluid dispersions, SIAM News33 (10) (2000) 1.
[34] A. Vananroye, P. Van Puyvelde, P. Moldenaers, Effect of confinement on dropletbreakup in sheared emulsions, Langmuir 22 (2006) 3972–3974.
[35] A. Vananroye, P. Van Puyvelde, P. Moldenaers, Effect of confinement on thesteady-state behavior of single droplets during shear flow, J. Rheol. 51 (1) (2007)139–153.
[36] V. Cristini, J. Blawzdziewicz, M. Loewenberg, Drop breakup in three-dimensional viscous flows, Phys. fluids 10 (8) (1998) 1781–1783.
[37] S. Guido, M. Simeone, M. Villone, Diffusion effects on the interfacial tension ofimmiscible polymer blends, Rheol. Acta 38 (1999) 287–296.
[38] C.W. Macosko, Rheology Principles, Measurements and Applications, VCH Pub-lishers, Inc., New York, 1994.
[39] S. Guido, M. Villone, Three-dimensional shape of a drop under simple shearflow, J. Rheol. 42 (1998) 395–415.
[40] A. Vananroye, P. Van Puyvelde, P. Moldenaers, Structure development in con-fined polymer blends: steady-state shear flow and relaxation, Langmuir 22(2006) 2273–2280.
[41] P. Wapperom, M.F. Webster, Simulation for viscoelastic flow by a flnite vol-ume/element method, Comput. Appl. Mech. Eng. 180 (1999) 281–304.
[42] K. Verhulst, R. Cardinaels, P. Moldenaers, S. Afkhami, Y. Renardy, Influenceof viscoelasticity on drop deformation and orientation in shear flow. Part 2.Dynamics, J. Non-Newtonian Fluid Mech., submitted for publication..
[43] K. Verhulst, P. Moldenaers, M. Minale, Drop shape dynamics of a Newtoniandrop in a non-Newtonian matrix during transient and steady shear flow, J.Rheol. 51 (2007) 261–273.
[44] L.M. Quinzani, G.H. McKinley, R.A. Brown, R.C. Armstrong, Modeling the rheol-ogy of polyisobutylene solutions, J. Rheol. 34 (5) (1990) 705–748.