australian housing markets report - ffx.adcentre.com.au.s3...
TRANSCRIPT

Australian housing markets reportCairns – rise and rise
Dr Andrew Wilson – Domain Group senior economistNovember 2014

Housing market model – Wilson Curve
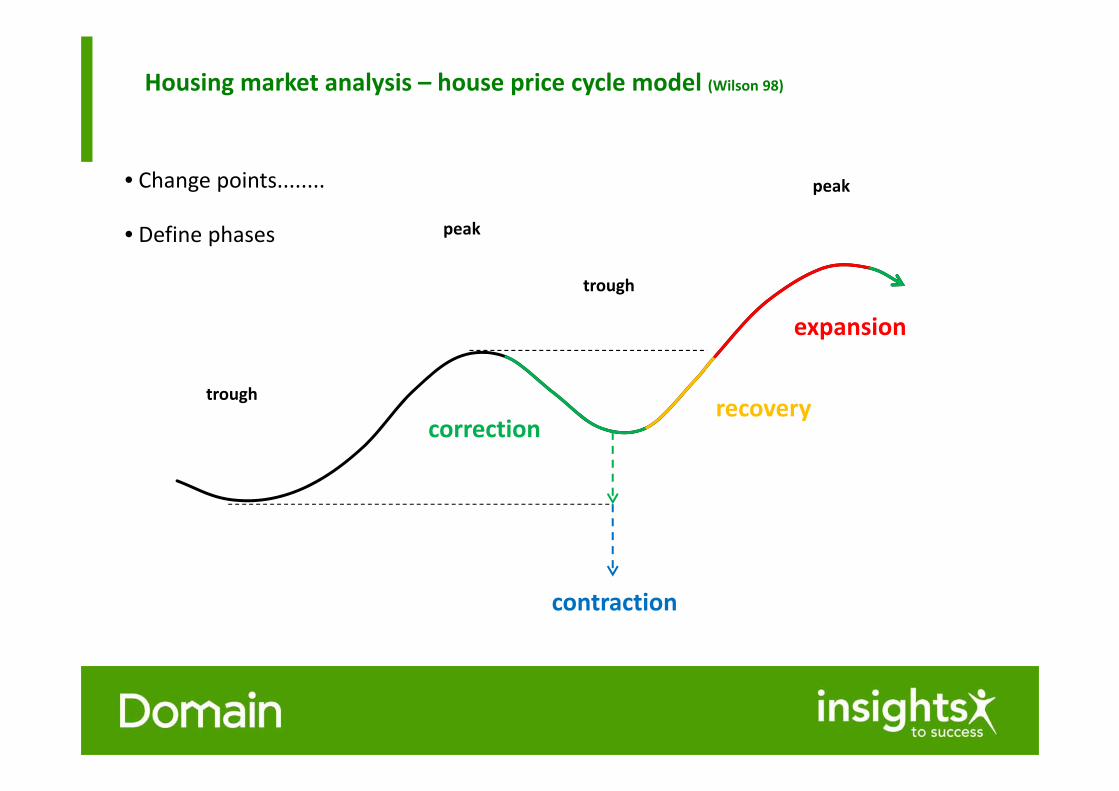
trough
peak
trough
peak
correctionrecovery
expansion
contraction
• Change points........
• Define phases
Housing market analysis – house price cycle model (Wilson 98)
Recent capital city performance
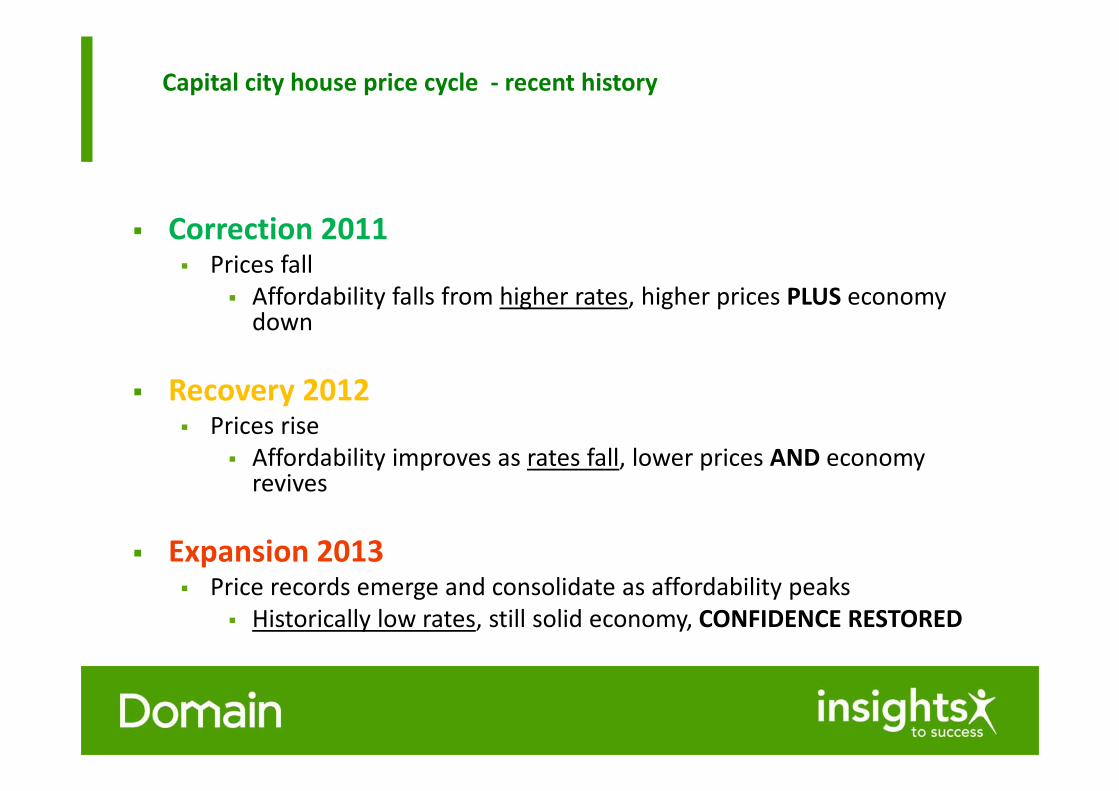
Capital city house price cycle ‐ recent history
Correction 2011 Prices fall
Affordability falls from higher rates, higher prices PLUS economy down
Recovery 2012 Prices rise
Affordability improves as rates fall, lower prices AND economy revives
Expansion 2013 Price records emerge and consolidate as affordability peaks
Historically low rates, still solid economy, CONFIDENCE RESTORED

Current state of the national market
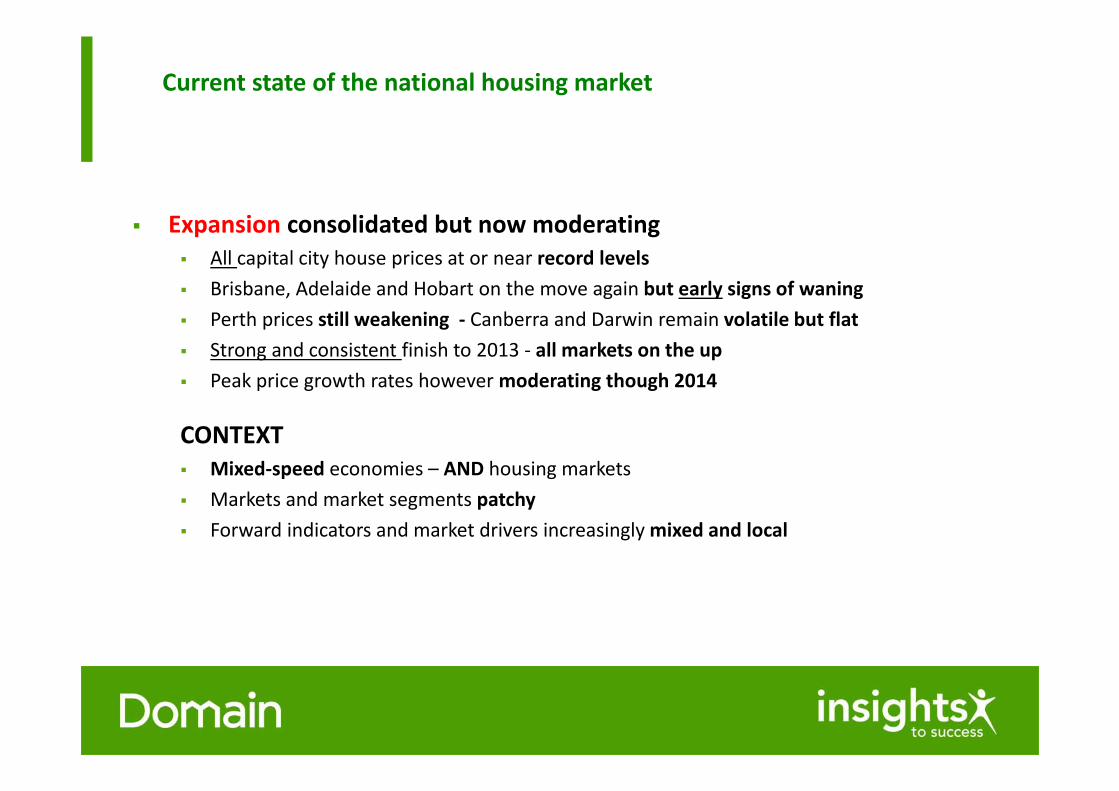
Current state of the national housing market
Expansion consolidated but now moderating All capital city house prices at or near record levels Brisbane, Adelaide and Hobart on the move again but early signs of waning Perth prices still weakening ‐ Canberra and Darwin remain volatile but flat Strong and consistent finish to 2013 ‐ all markets on the up Peak price growth rates however moderating though 2014
CONTEXT Mixed‐speed economies – AND housing markets Markets and market segments patchy Forward indicators and market drivers increasingly mixed and local
Key price drivers

The future for house price growth?
....as usual depends on the economy
Key Drivers Low unemployment and more jobs Rising wages, incomes and profits Lower interest rates Rising stockmarket Confidence
Recent prices growth
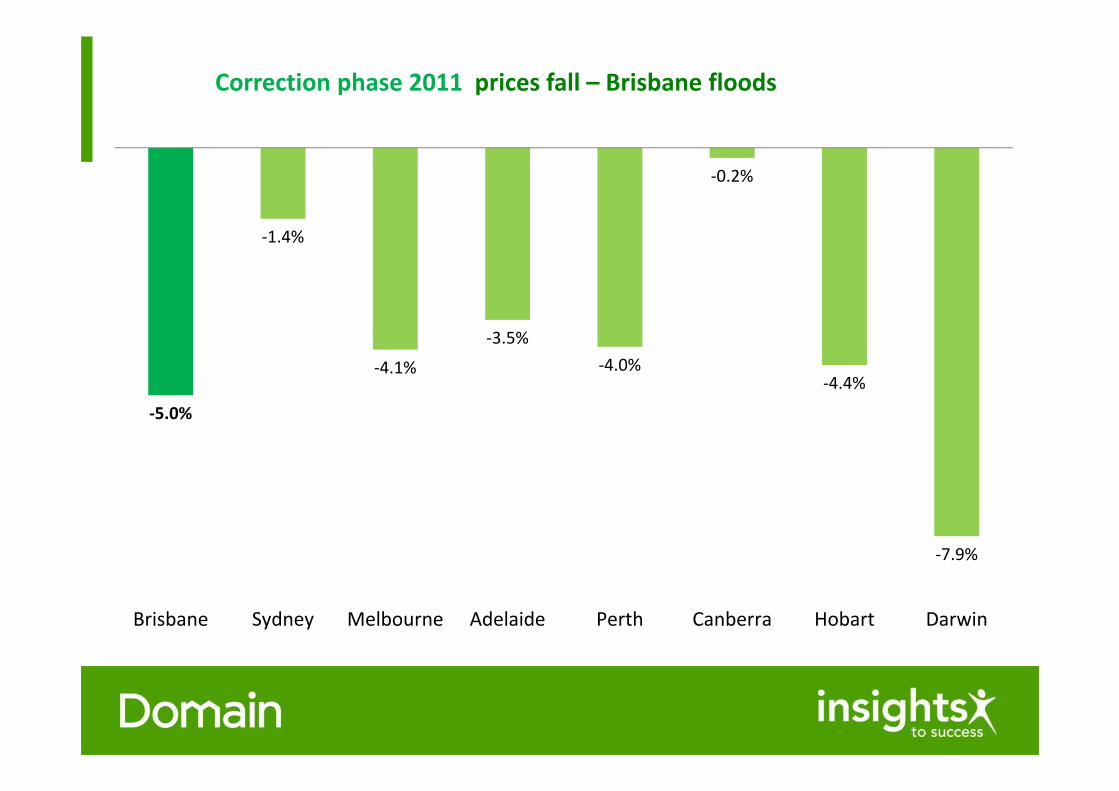
Correction phase 2011 prices fall – Brisbane floods
‐5.0%
‐1.4%
‐4.1%
‐3.5%‐4.0%
‐0.2%
‐4.4%
‐7.9%
Brisbane Sydney Melbourne Adelaide Perth Canberra Hobart Darwin
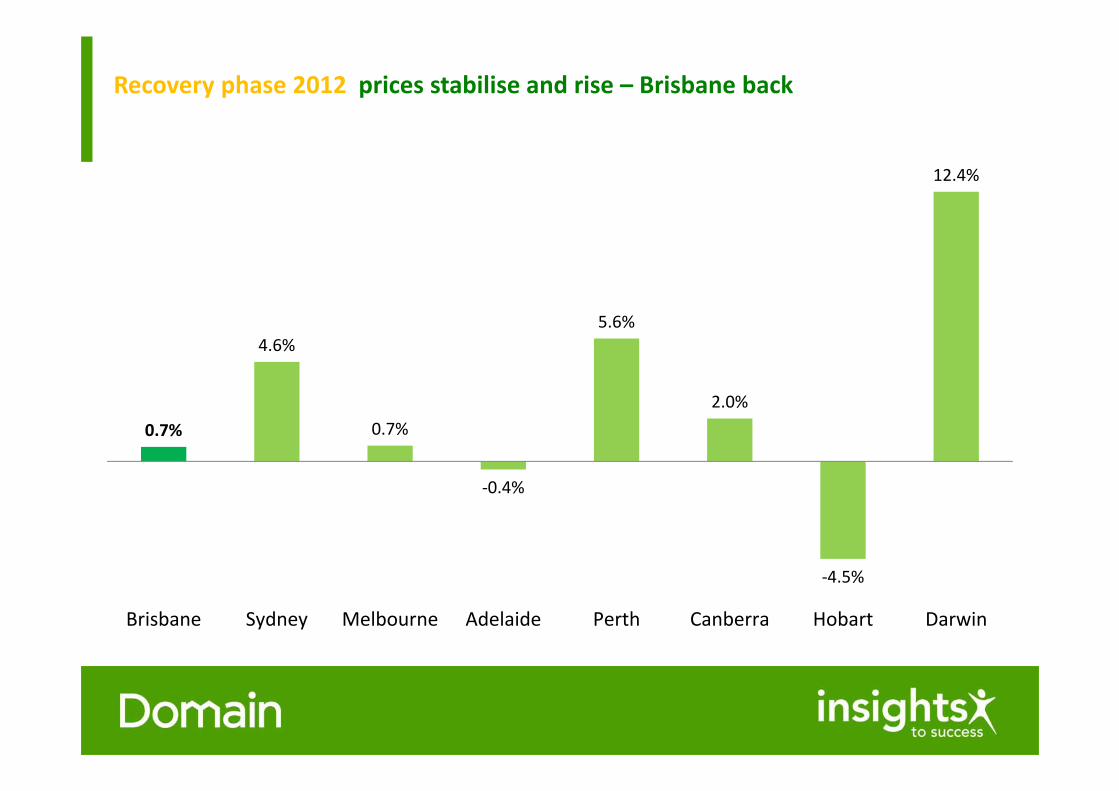
Recovery phase 2012 prices stabilise and rise – Brisbane back
0.7%
4.6%
0.7%
‐0.4%
5.6%
2.0%
‐4.5%
12.4%
Brisbane Sydney Melbourne Adelaide Perth Canberra Hobart Darwin
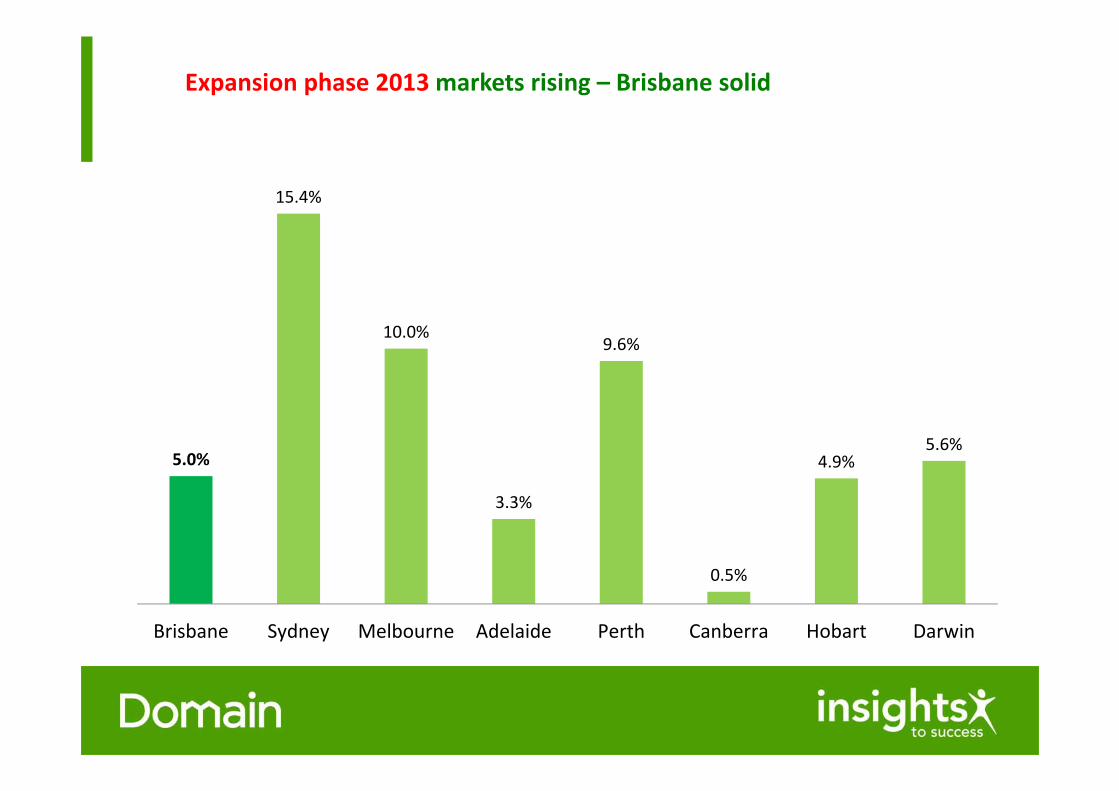
Expansion phase 2013 markets rising – Brisbane solid
5.0%
15.4%
10.0%
3.3%
9.6%
0.5%
4.9%5.6%
Brisbane Sydney Melbourne Adelaide Perth Canberra Hobart Darwin
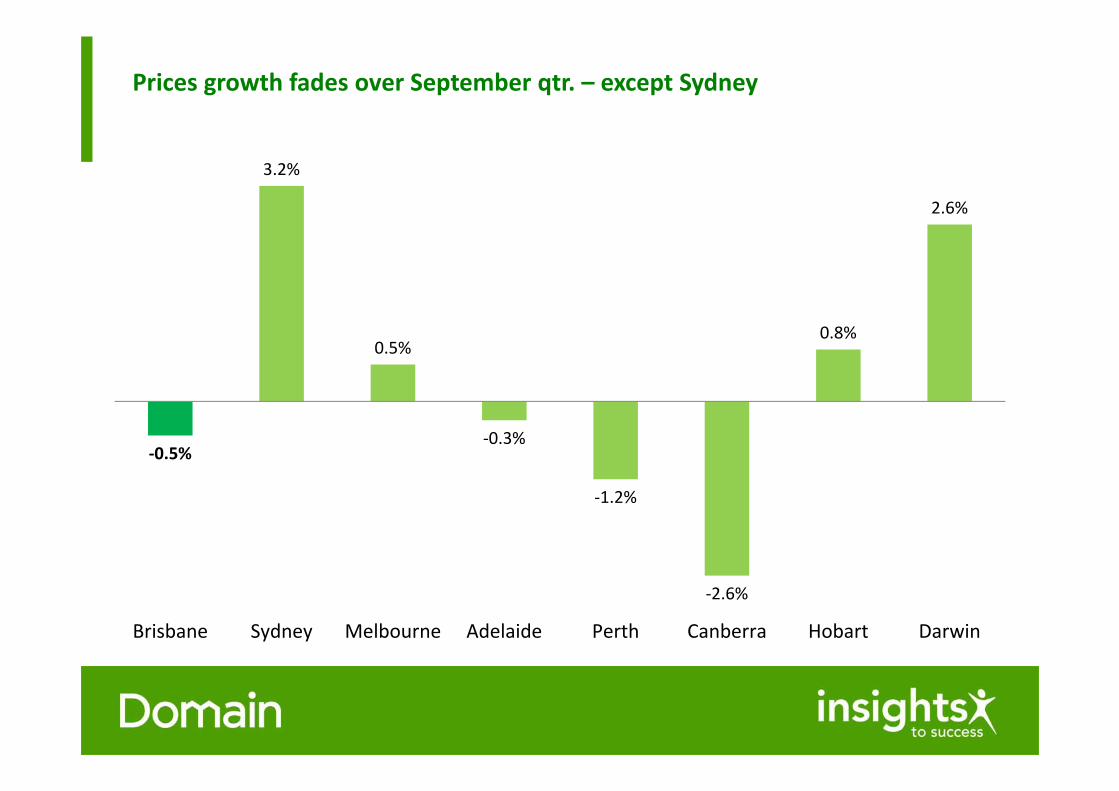
Prices growth fades over September qtr. – except Sydney
‐0.5%
3.2%
0.5%
‐0.3%
‐1.2%
‐2.6%
0.8%
2.6%
Brisbane Sydney Melbourne Adelaide Perth Canberra Hobart Darwin
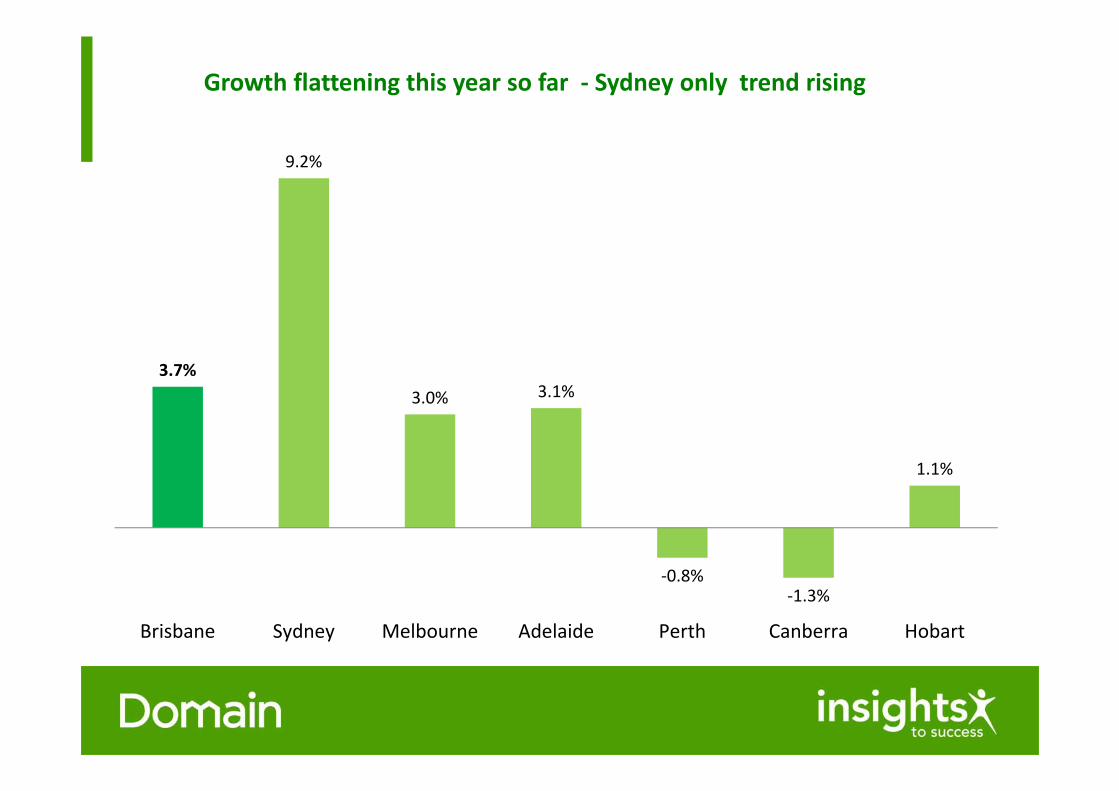
Growth flattening this year so far ‐ Sydney only trend rising
3.7%
9.2%
3.0% 3.1%
‐0.8%‐1.3%
1.1%
Brisbane Sydney Melbourne Adelaide Perth Canberra Hobart
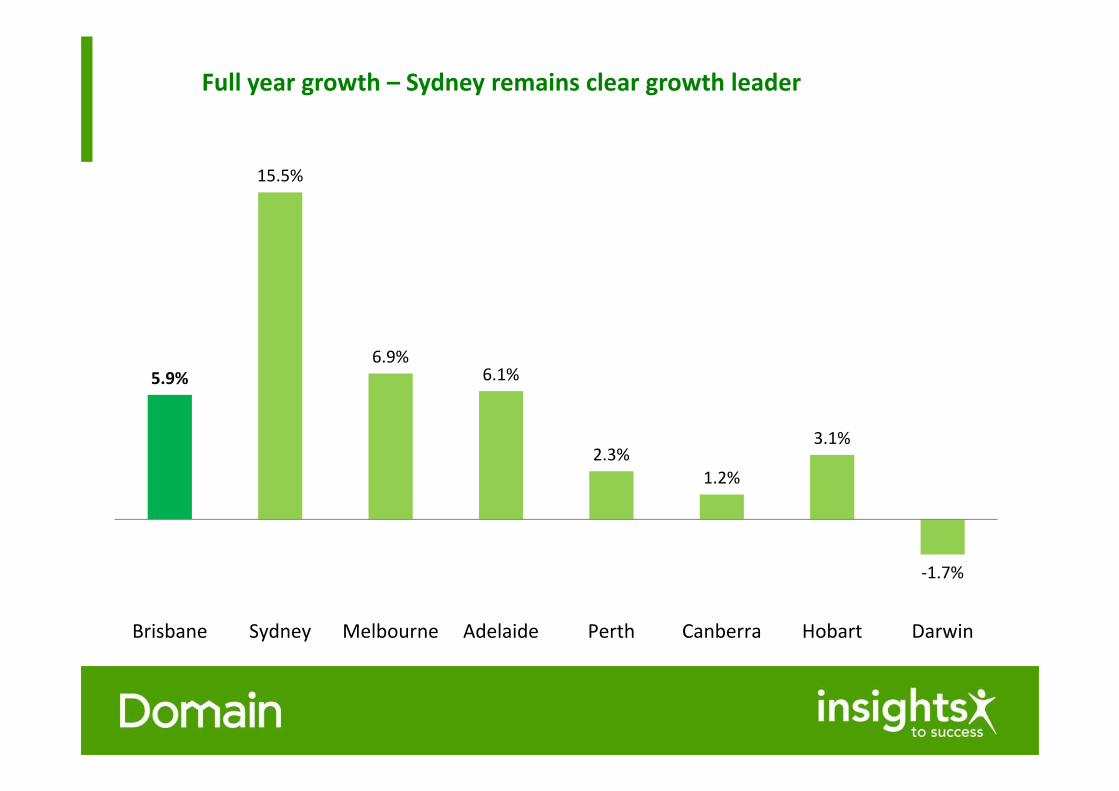
Full year growth – Sydney remains clear growth leader
5.9%
15.5%
6.9%6.1%
2.3%1.2%
3.1%
‐1.7%
Brisbane Sydney Melbourne Adelaide Perth Canberra Hobart Darwin
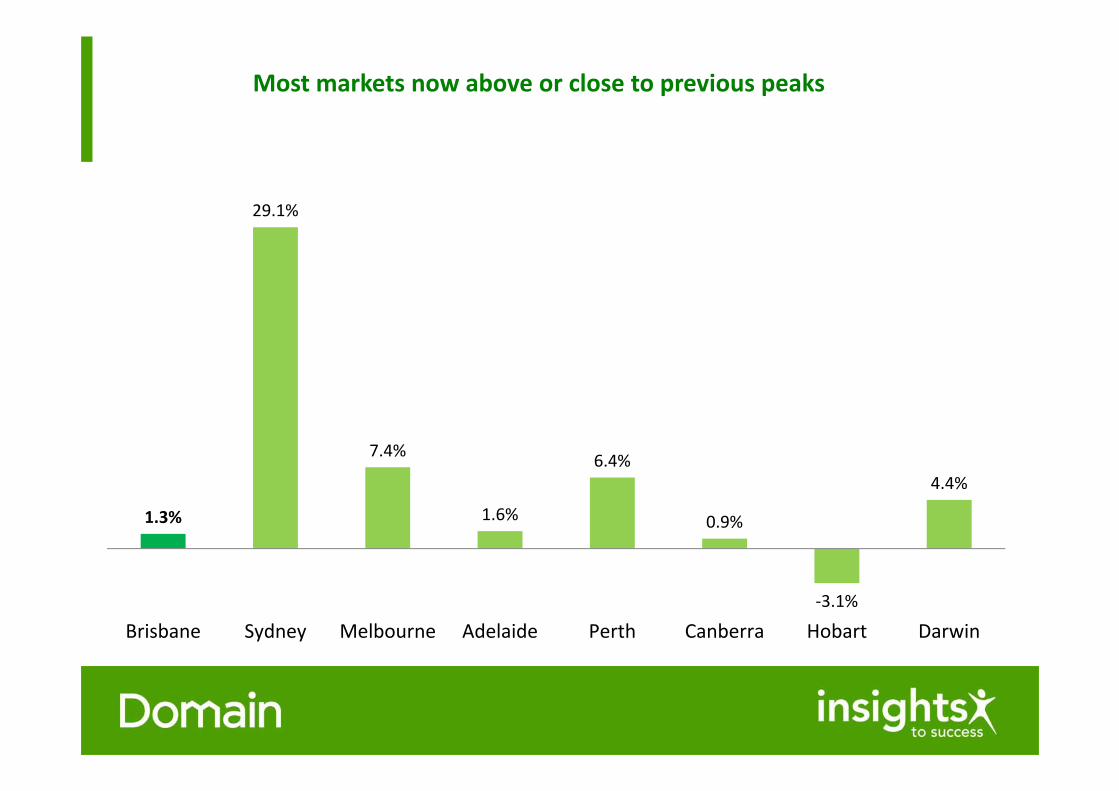
Most markets now above or close to previous peaks
1.3%
29.1%
7.4%
1.6%
6.4%
0.9%
‐3.1%
4.4%
Brisbane Sydney Melbourne Adelaide Perth Canberra Hobart Darwin
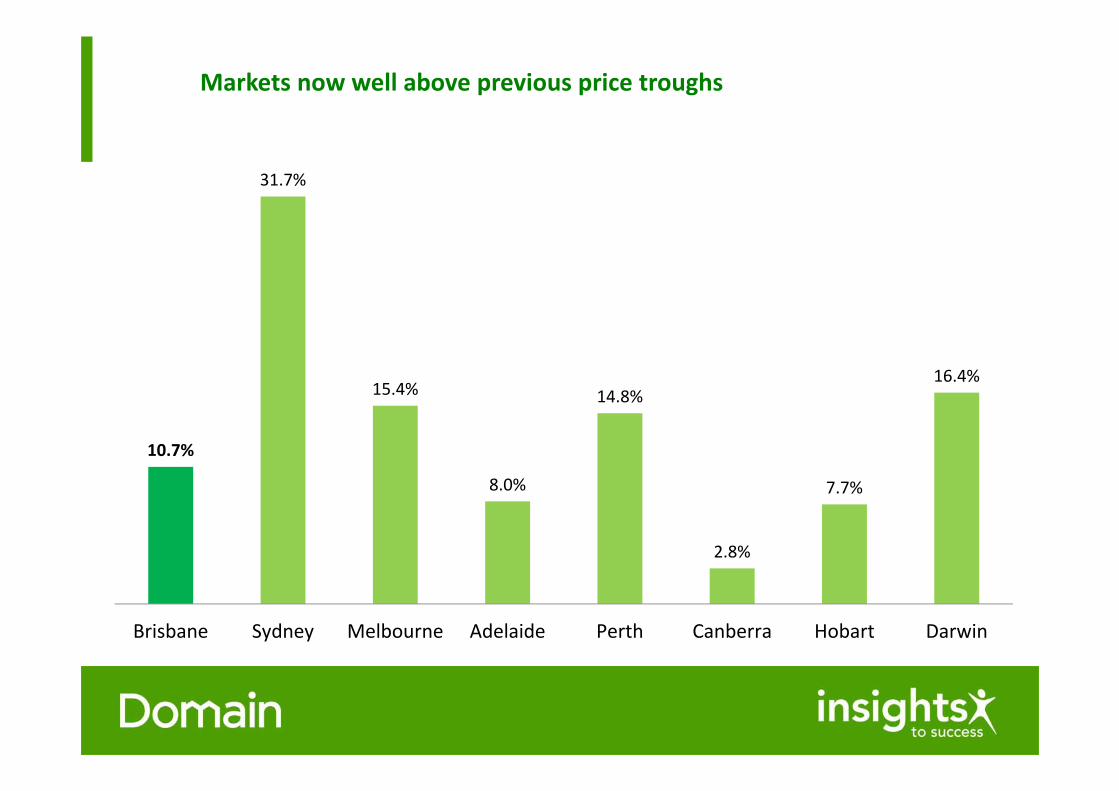
Markets now well above previous price troughs
10.7%
31.7%
15.4%
8.0%
14.8%
2.8%
7.7%
16.4%
Brisbane Sydney Melbourne Adelaide Perth Canberra Hobart Darwin
Current capital city price cycle
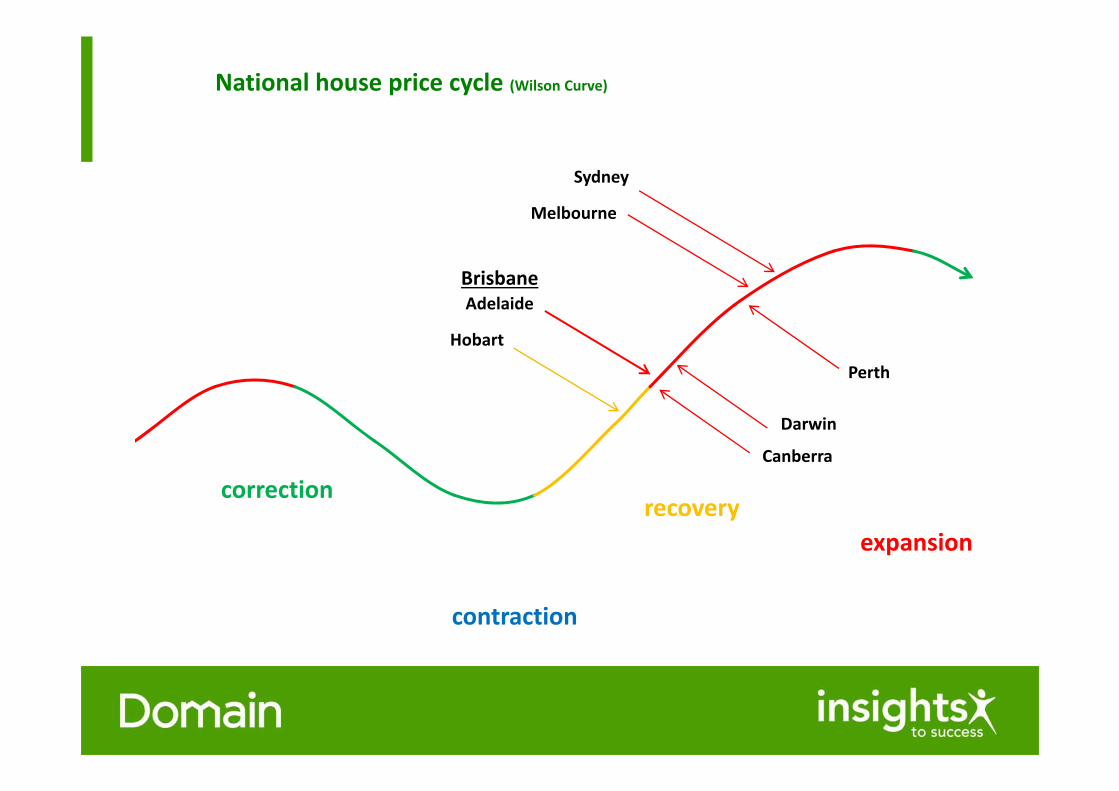
National house price cycle (Wilson Curve)
correctionrecovery
expansion
contraction
Sydney
Perth
Melbourne
BrisbaneAdelaide
Darwin
Hobart
Canberra
Current capital city growth
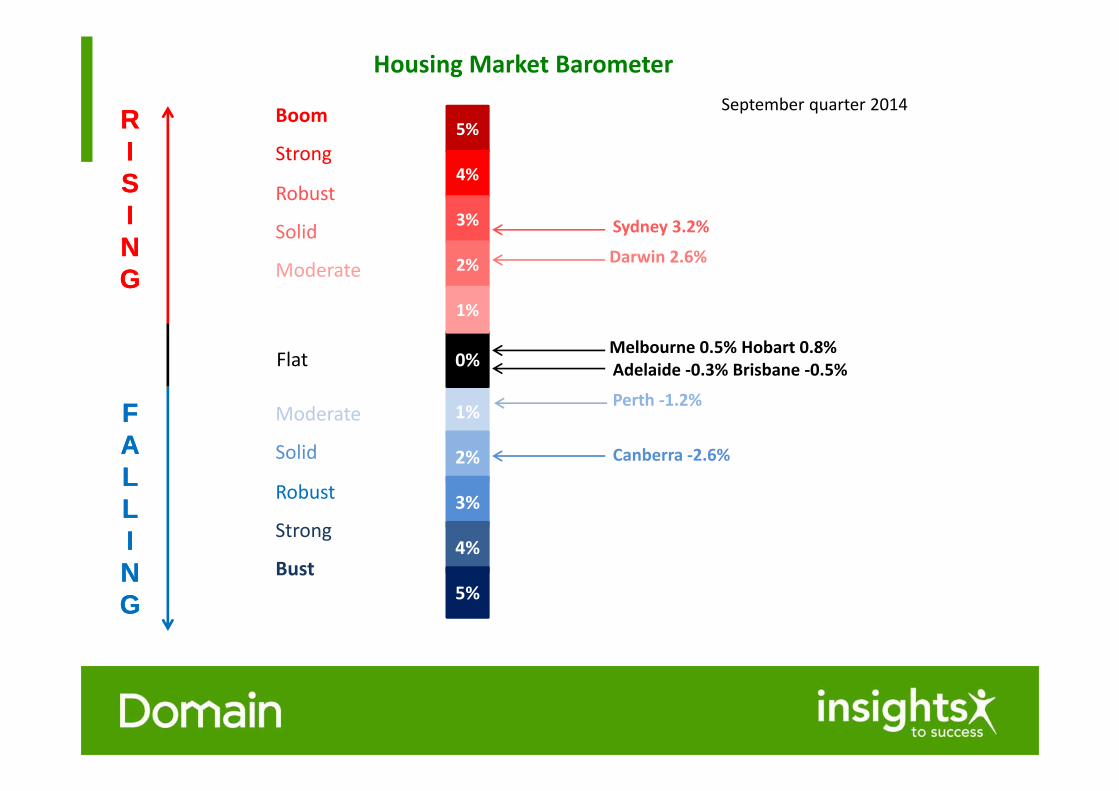
Housing Market Barometer
5%
2%
1%
0%
0%
Sydney 3.2%
Canberra ‐2.6%
Melbourne 0.5% Hobart 0.8%
RISING
FALLING
September quarter 2014
5%
4%4%
3%
2%
1%
2%
3%
4%
5%
Boom
Strong
Robust
Solid
Moderate
Moderate
Solid
Robust
Strong
Bust
Flat
Darwin 2.6%
RISING
FALLING
Perth ‐1.2%
Adelaide ‐0.3% Brisbane ‐0.5%
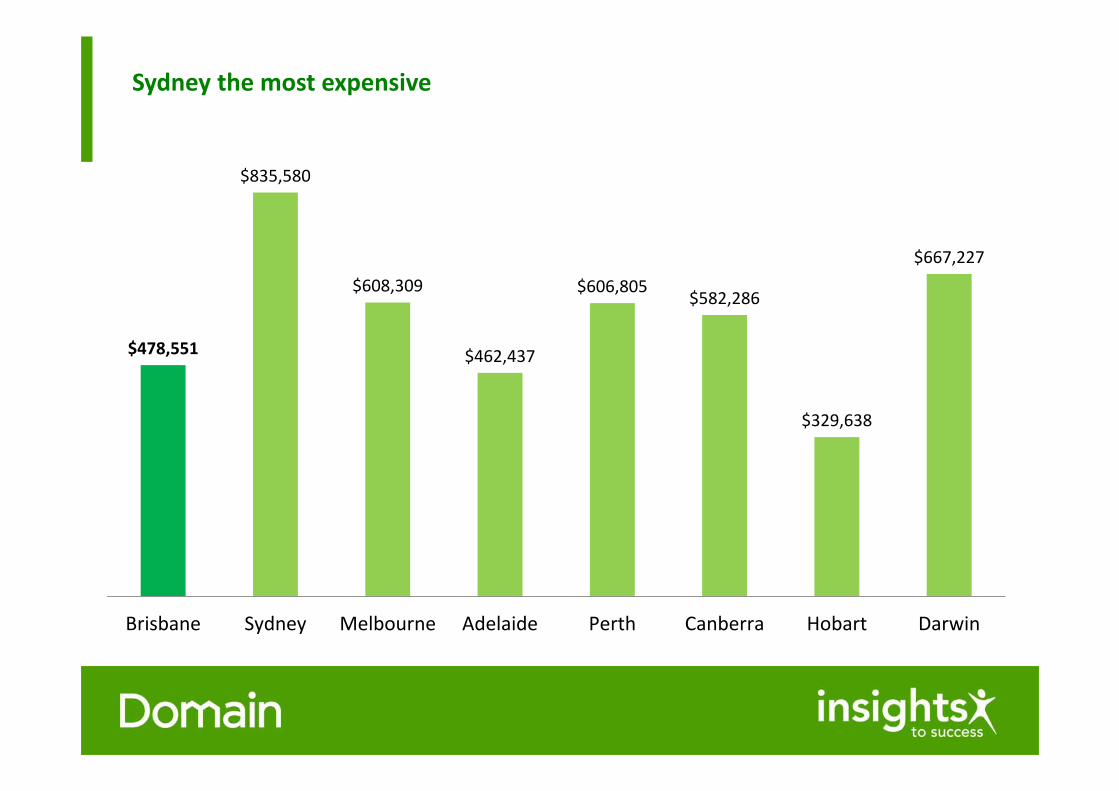
Sydney the most expensive
$478,551
$835,580
$608,309
$462,437
$606,805$582,286
$329,638
$667,227
Brisbane Sydney Melbourne Adelaide Perth Canberra Hobart Darwin
Brisbane price cycle
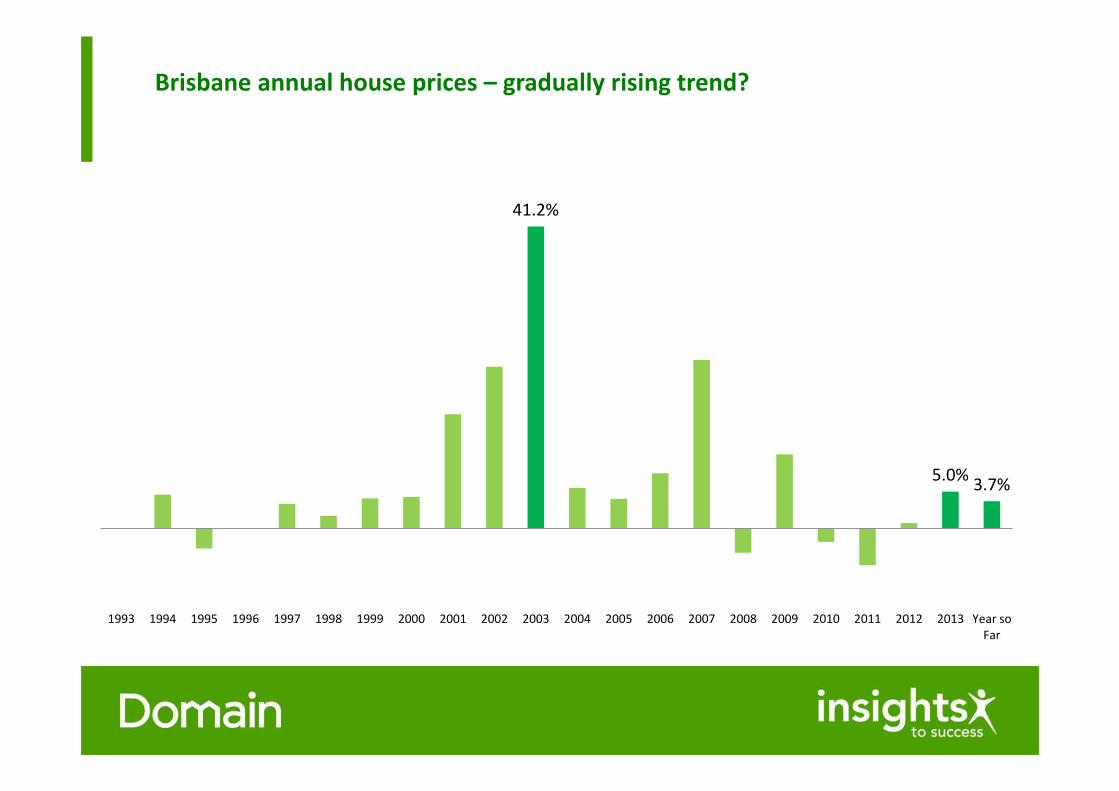
Brisbane annual house prices – gradually rising trend?
41.2%
5.0% 3.7%
1993 1994 1995 1996 1997 1998 1999 2000 2001 2002 2003 2004 2005 2006 2007 2008 2009 2010 2011 2012 2013 Year soFar
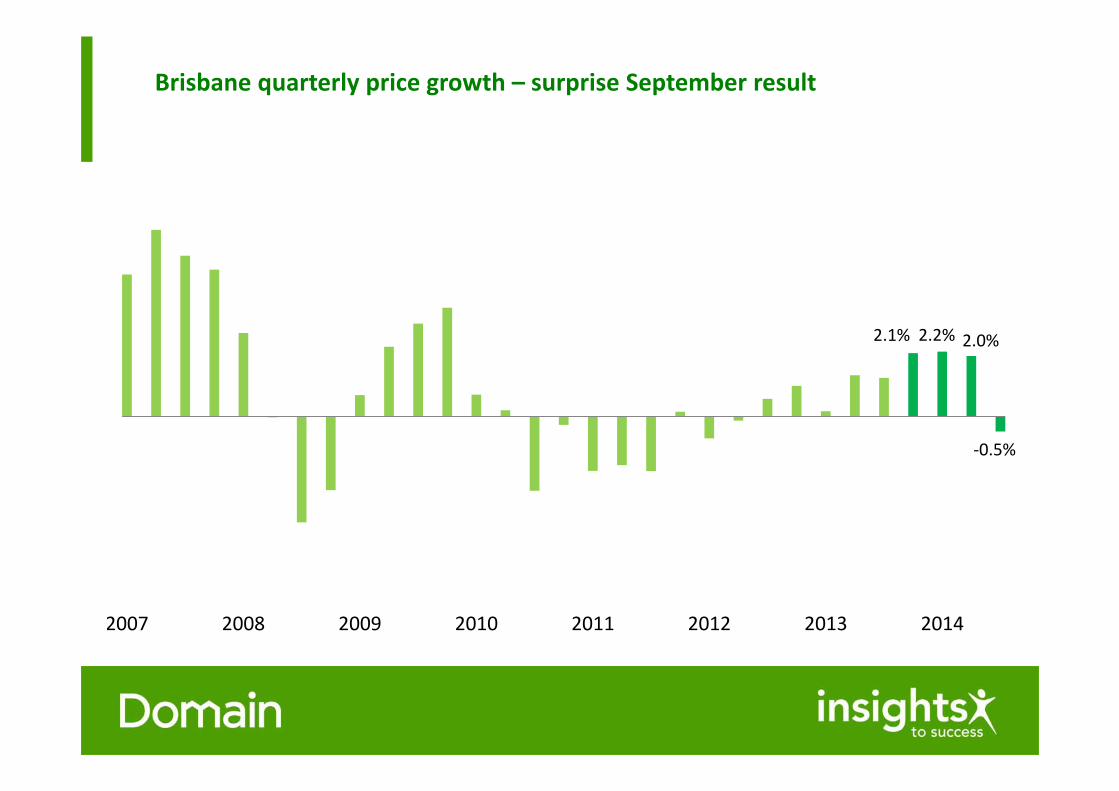
Brisbane quarterly price growth – surprise September result
2.1% 2.2% 2.0%
‐0.5%
2007 2008 2009 2010 2011 2012 2013 2014
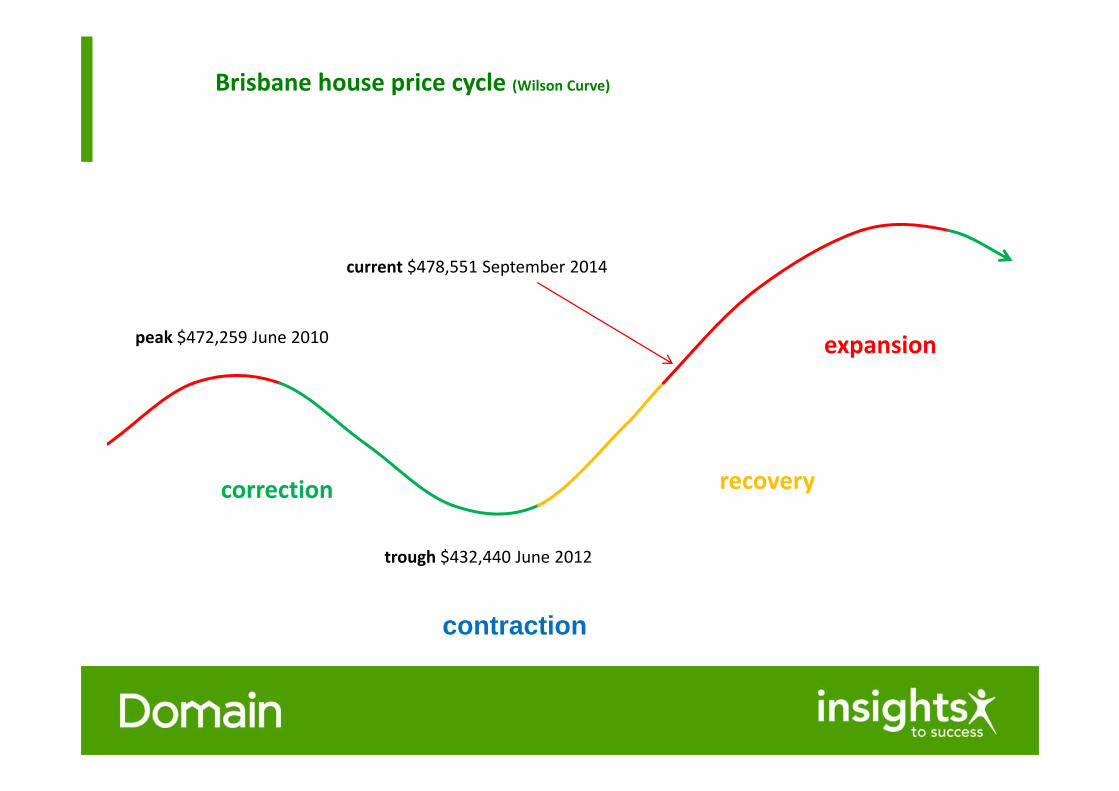
Brisbane house price cycle (Wilson Curve)
correction recovery
expansion
contraction
peak $472,259 June 2010
current $478,551 September 2014
trough $432,440 June 2012
Interest rates and housing markets
1%
2%
3%
4%
5%
6%
7%
8%
$250,000
$350,000
$450,000
$550,000
$650,000
$750,000
$850,000
2006 2007 2008 2009 2010 2011 2012 2013 2014
Sydney Melbourne Brisbane Adelaide Perth Interest rate
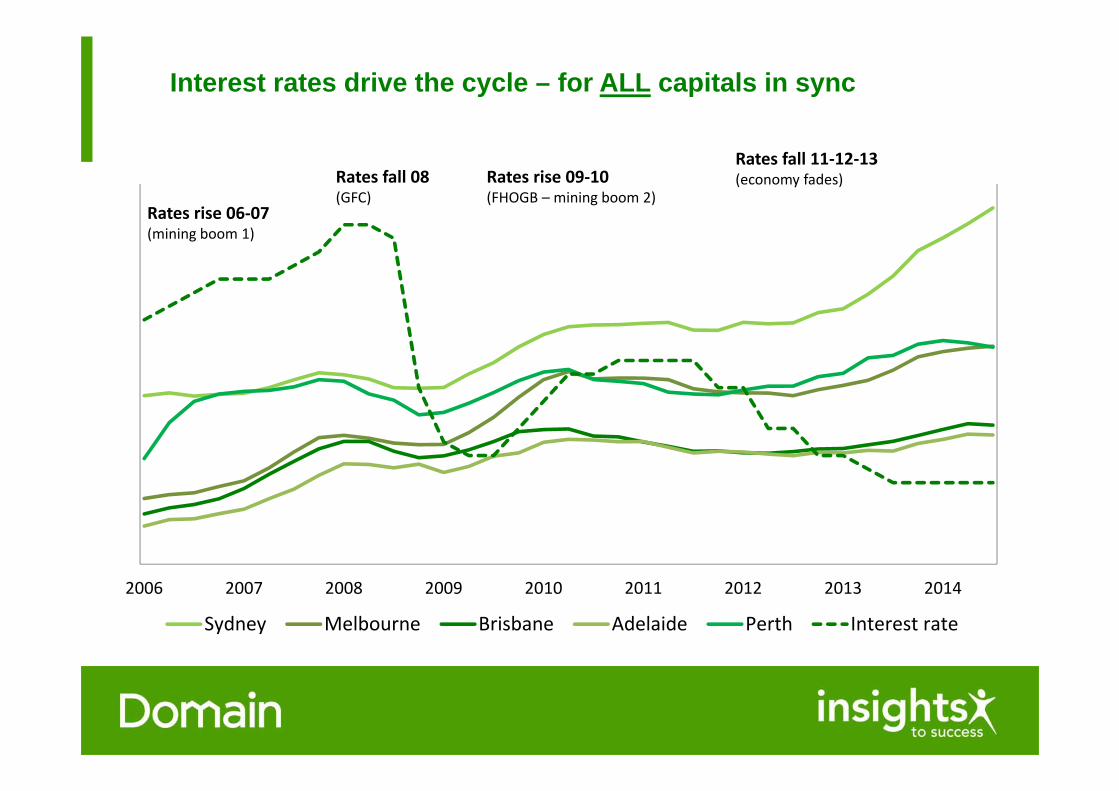
Interest rates drive the cycle – for ALL capitals in sync
Rates rise 09‐10(FHOGB – mining boom 2)
Rates fall 11‐12‐13(economy fades)Rates fall 08
(GFC)Rates rise 06‐07(mining boom 1)
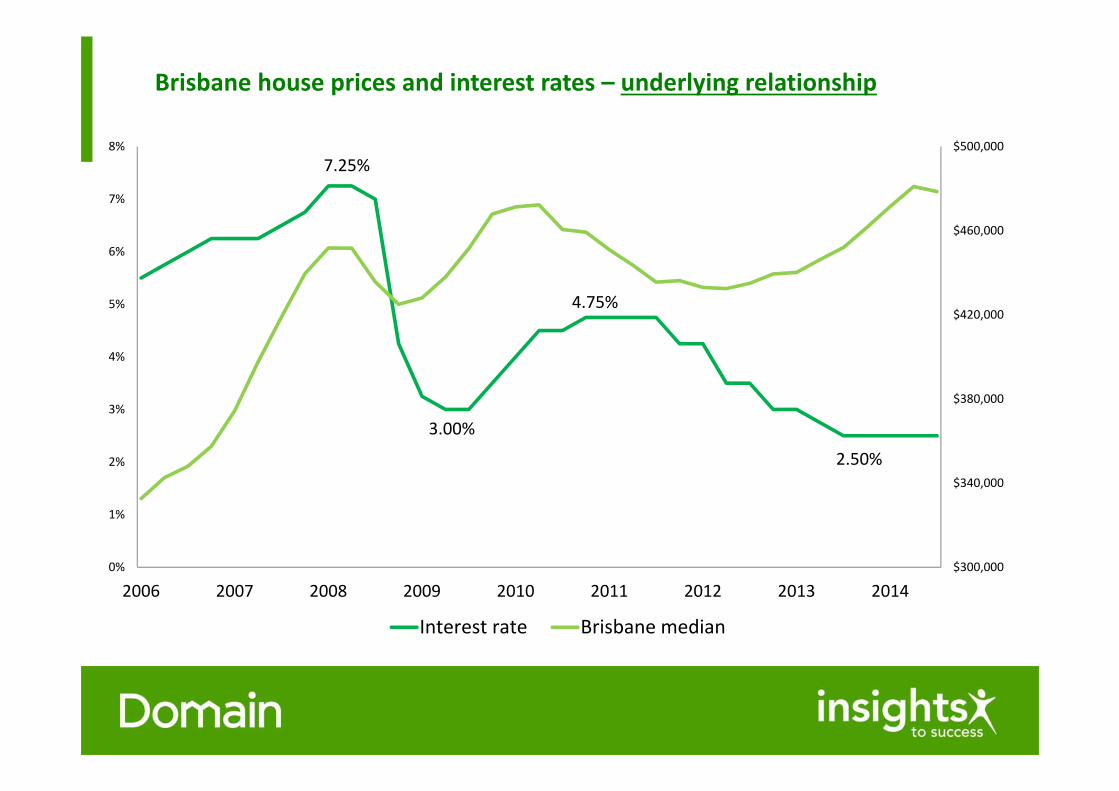
Brisbane house prices and interest rates – underlying relationship
7.25%
3.00%
4.75%
2.50%
$300,000
$340,000
$380,000
$420,000
$460,000
$500,000
0%
1%
2%
3%
4%
5%
6%
7%
8%
2006 2007 2008 2009 2010 2011 2012 2013 2014
Interest rate Brisbane median
Far north Queensland
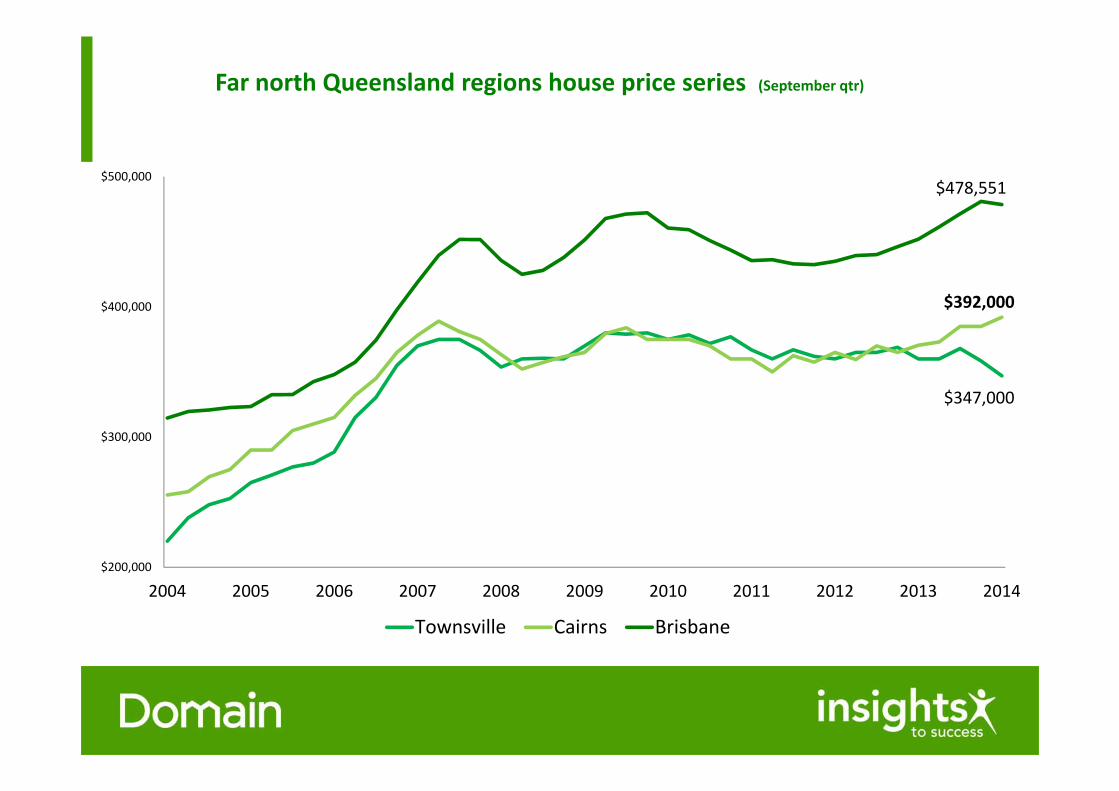
Far north Queensland regions house price series (September qtr)
$347,000
$392,000
$478,551
$200,000
$300,000
$400,000
$500,000
2004 2005 2006 2007 2008 2009 2010 2011 2012 2013 2014
Townsville Cairns Brisbane
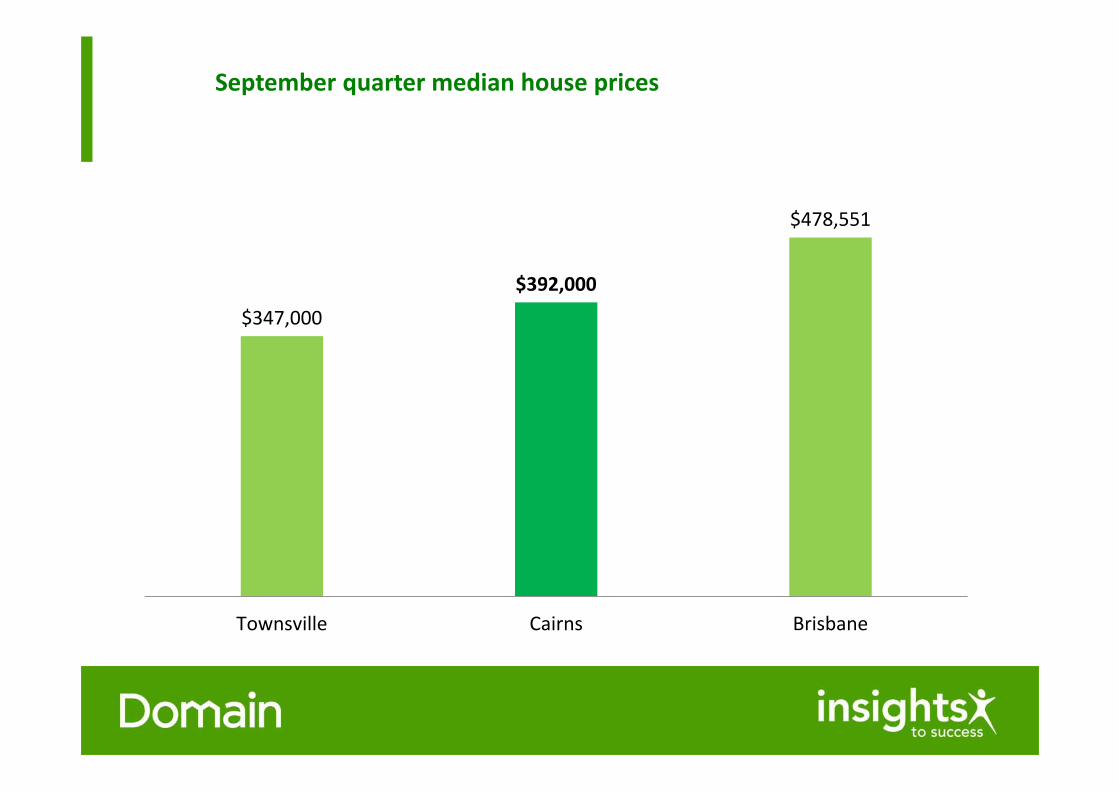
September quarter median house prices
$347,000
$392,000
$478,551
Townsville Cairns Brisbane
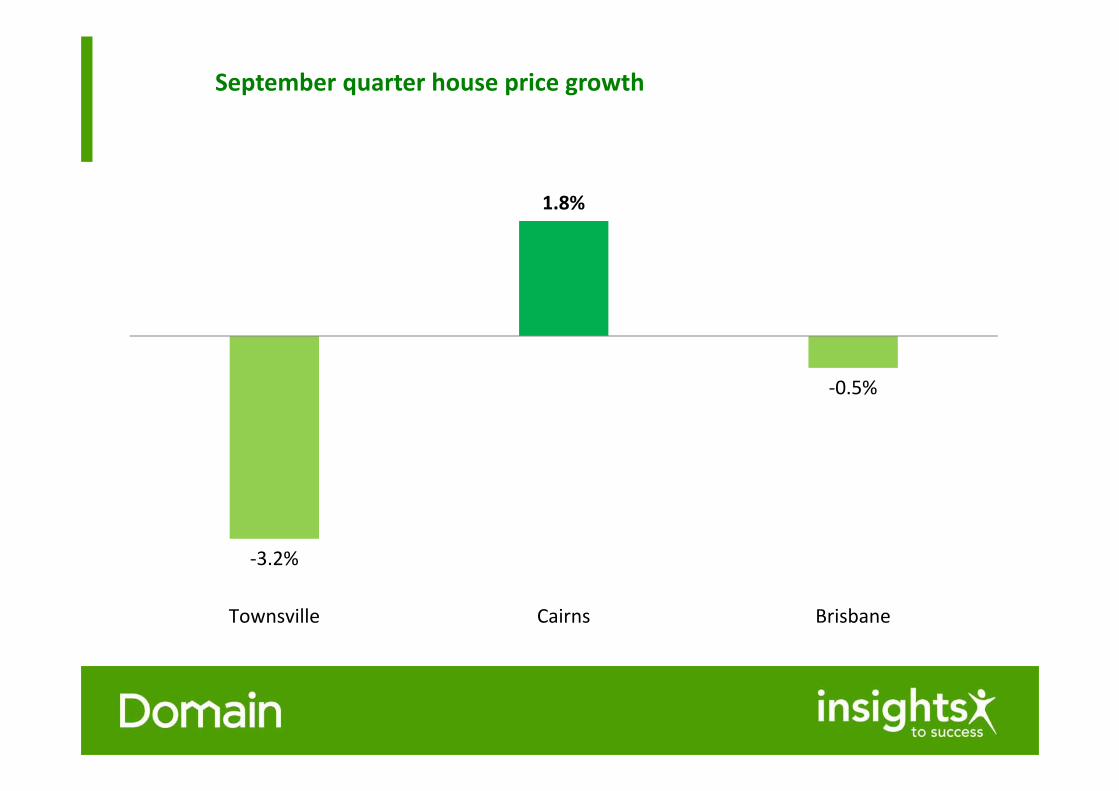
September quarter house price growth
‐3.2%
1.8%
‐0.5%
Townsville Cairns Brisbane
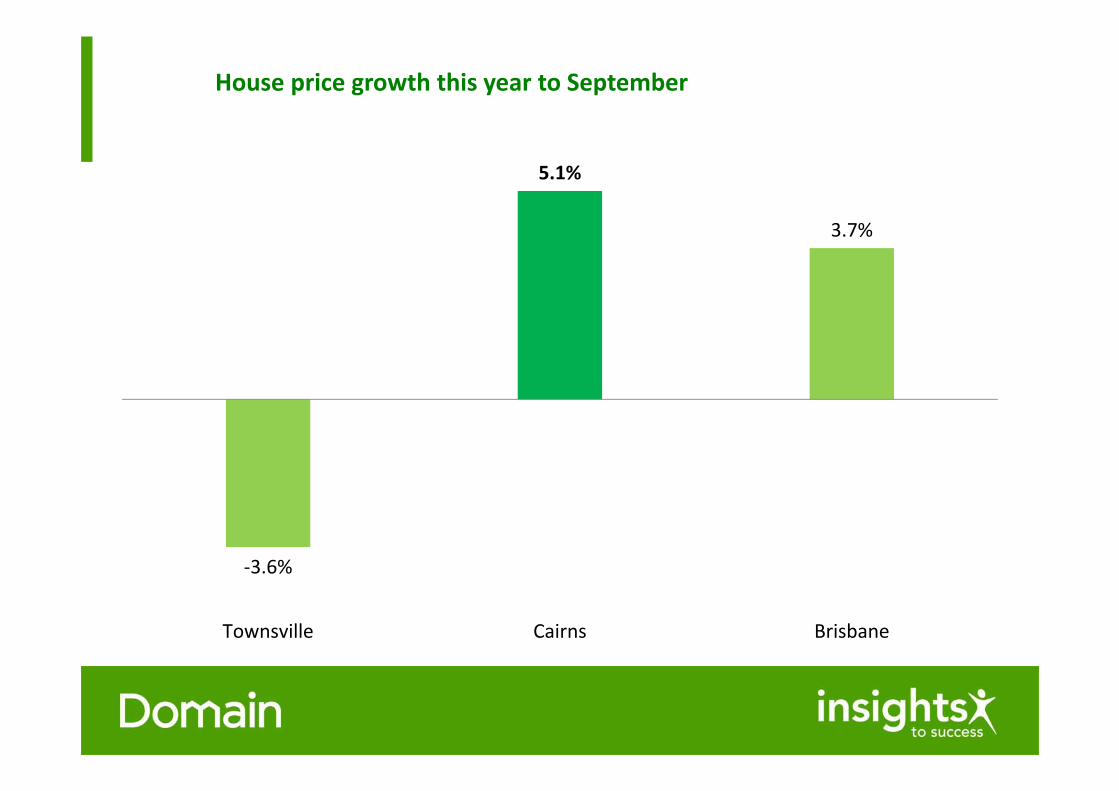
House price growth this year to September
‐3.6%
5.1%
3.7%
Townsville Cairns Brisbane
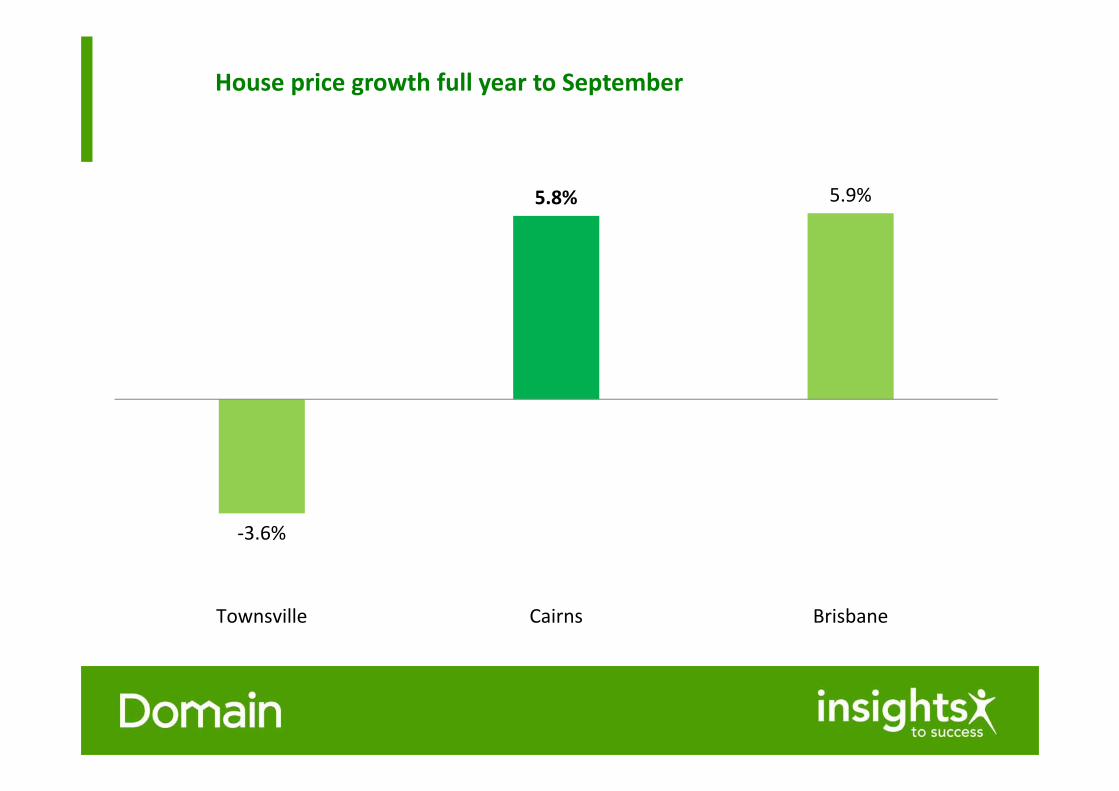
House price growth full year to September
‐3.6%
5.8% 5.9%
Townsville Cairns Brisbane
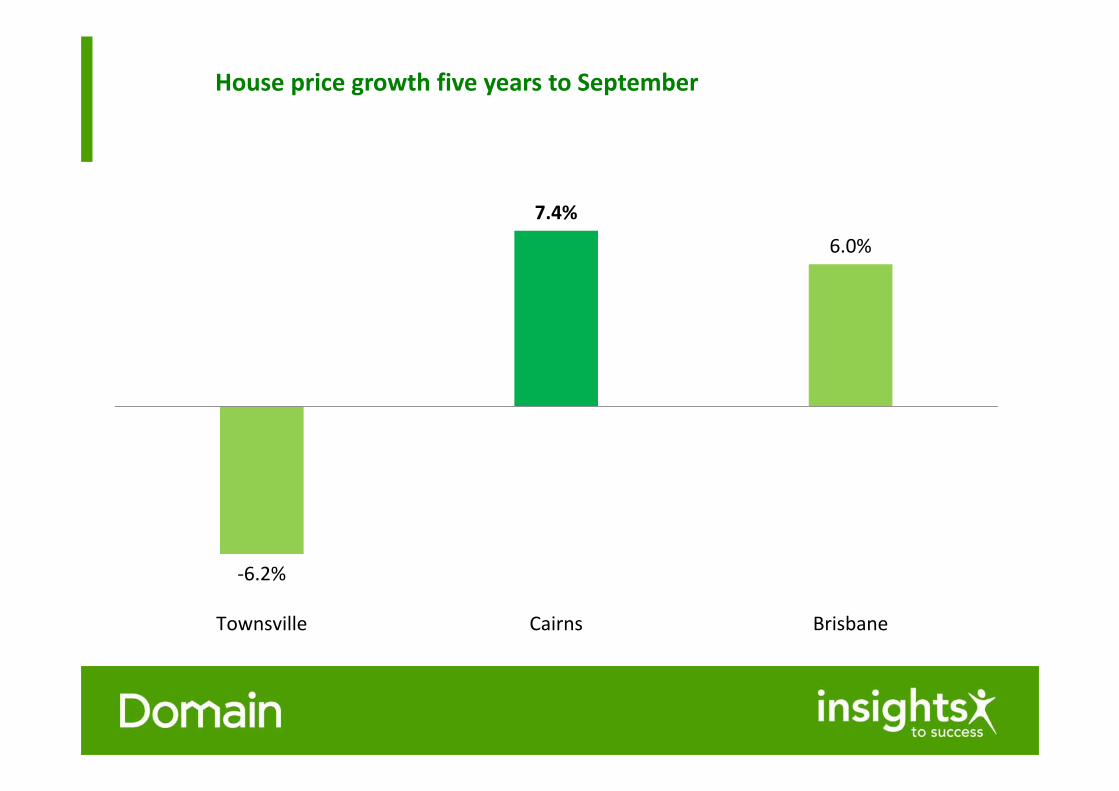
House price growth five years to September
‐6.2%
7.4%
6.0%
Townsville Cairns Brisbane
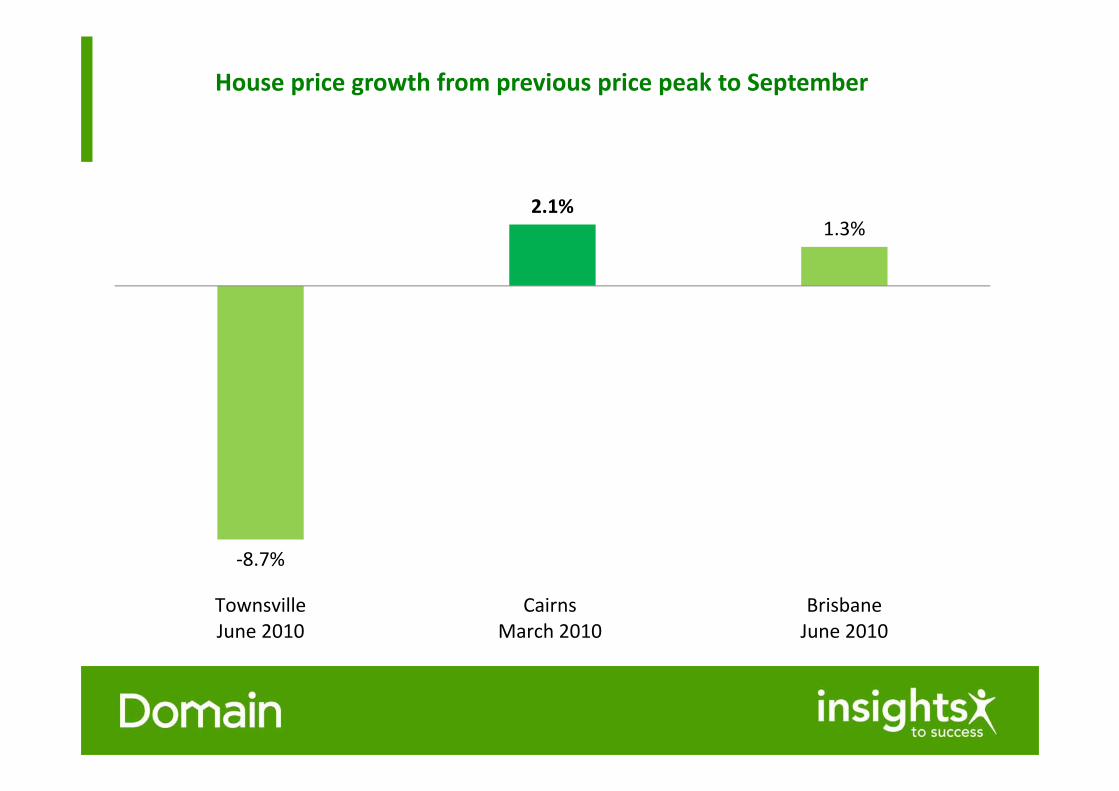
House price growth from previous price peak to September
‐8.7%
2.1%1.3%
TownsvilleJune 2010
CairnsMarch 2010
BrisbaneJune 2010
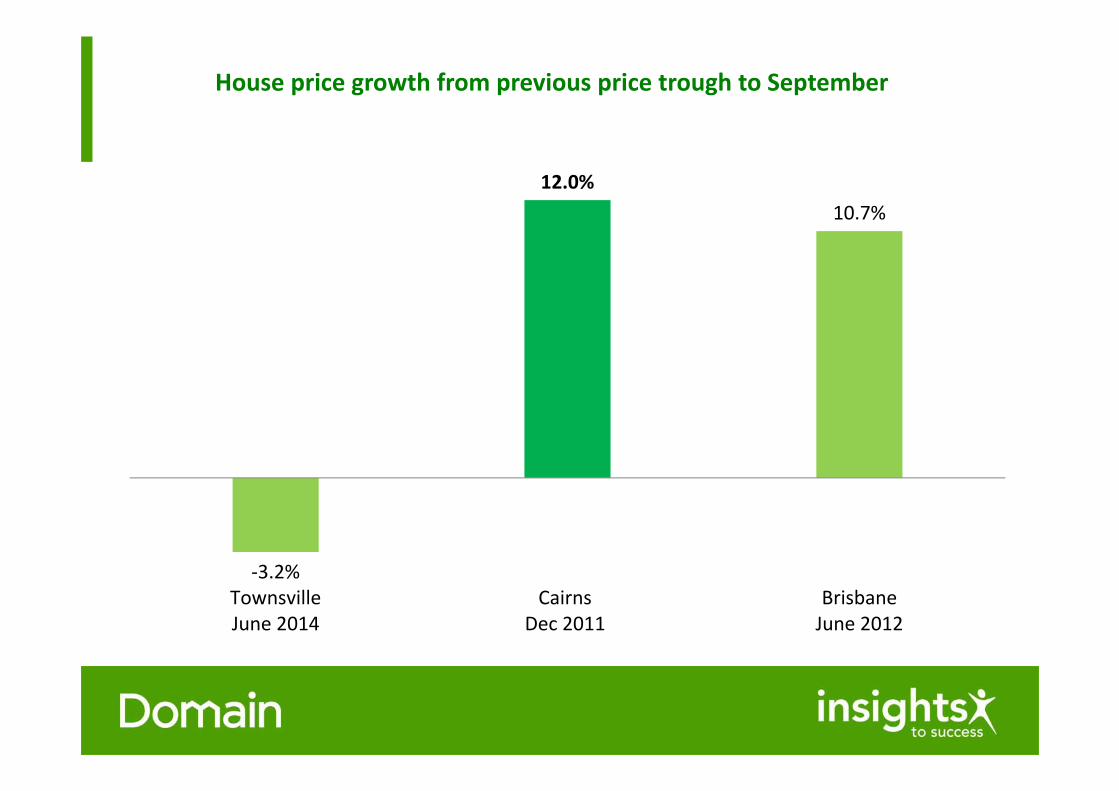
House price growth from previous price trough to September
‐3.2%
12.0%10.7%
TownsvilleJune 2014
CairnsDec 2011
BrisbaneJune 2012
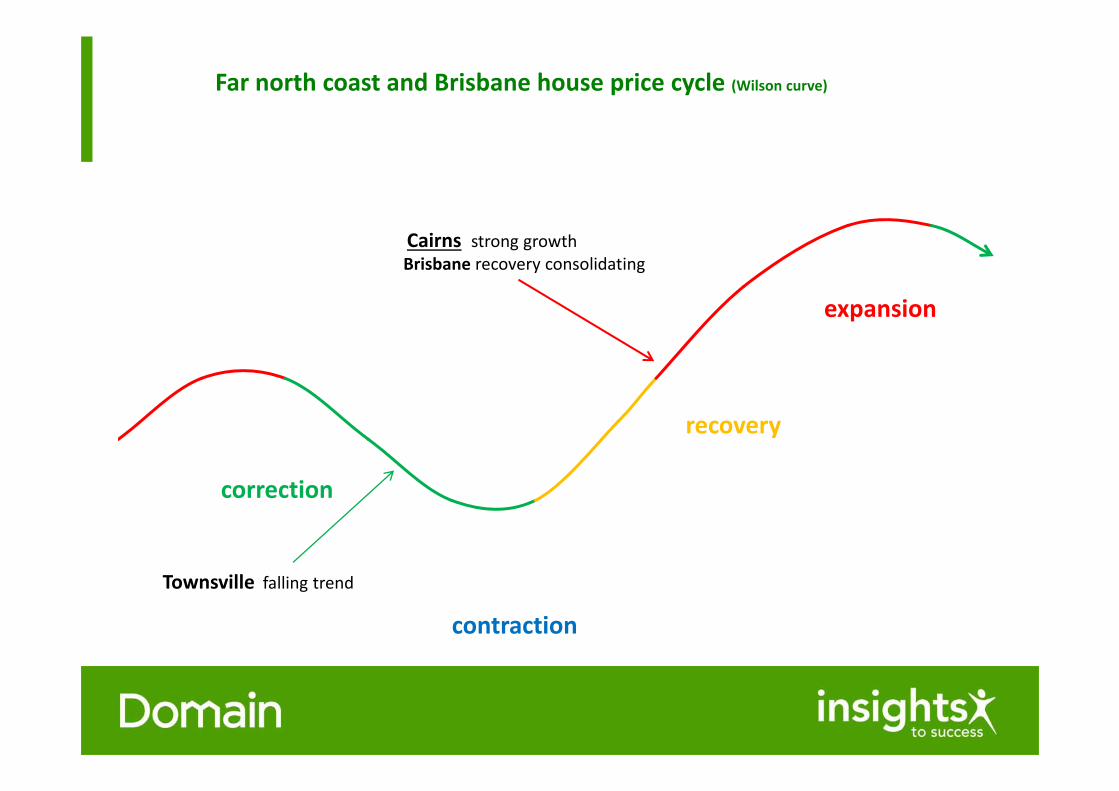
Far north coast and Brisbane house price cycle (Wilson curve)
correction
recovery
expansion
contraction
Cairns strong growthBrisbane recovery consolidating
Townsville falling trend
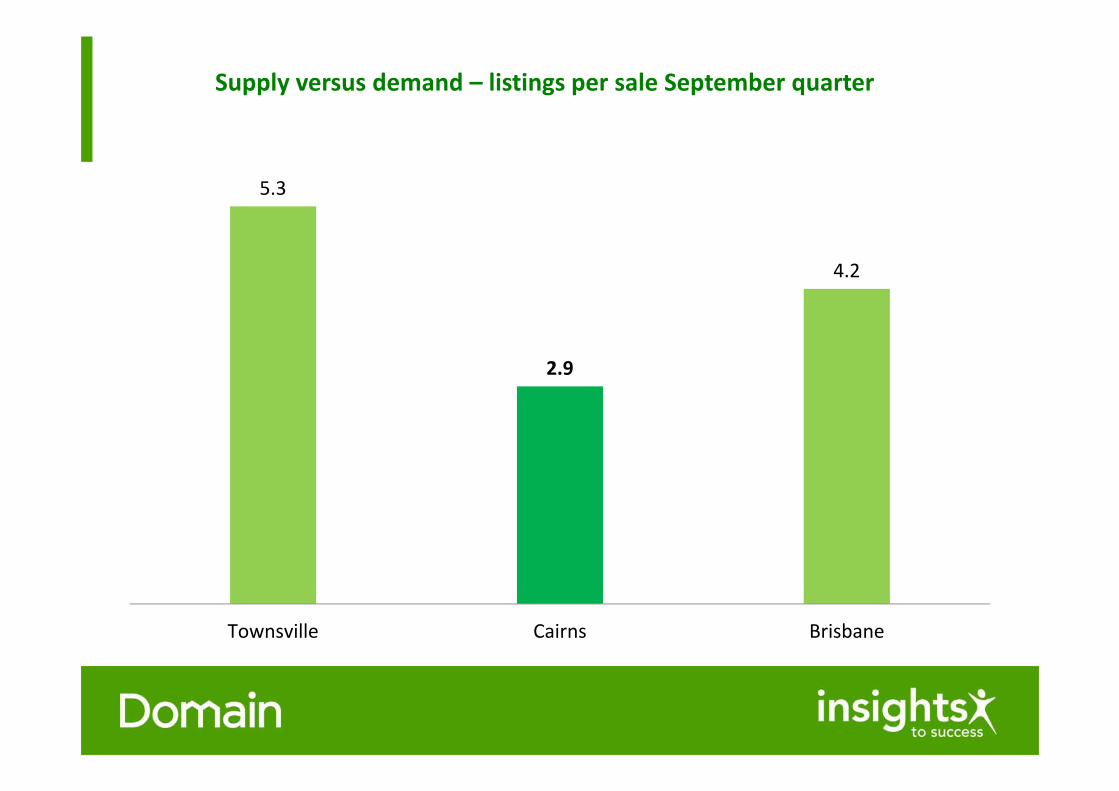
Supply versus demand – listings per sale September quarter
5.3
2.9
4.2
Townsville Cairns Brisbane
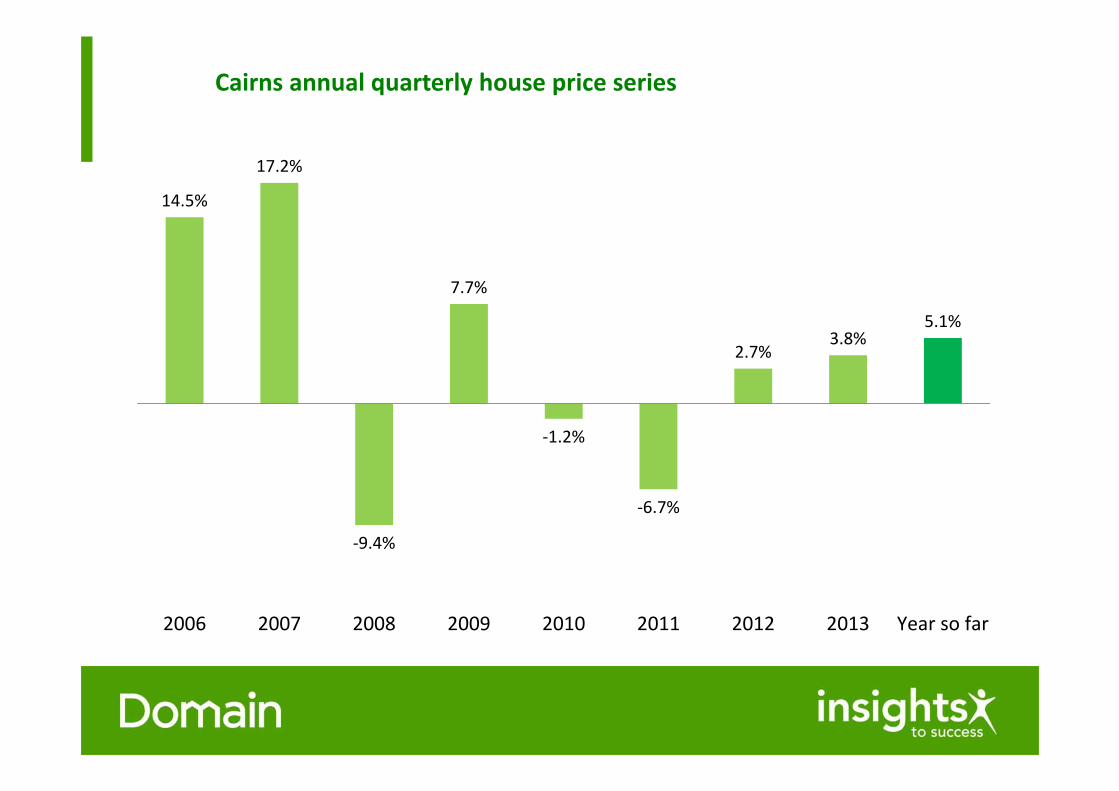
Cairns annual quarterly house price series
14.5%
17.2%
‐9.4%
7.7%
‐1.2%
‐6.7%
2.7%3.8%
5.1%
2006 2007 2008 2009 2010 2011 2012 2013 Year so far
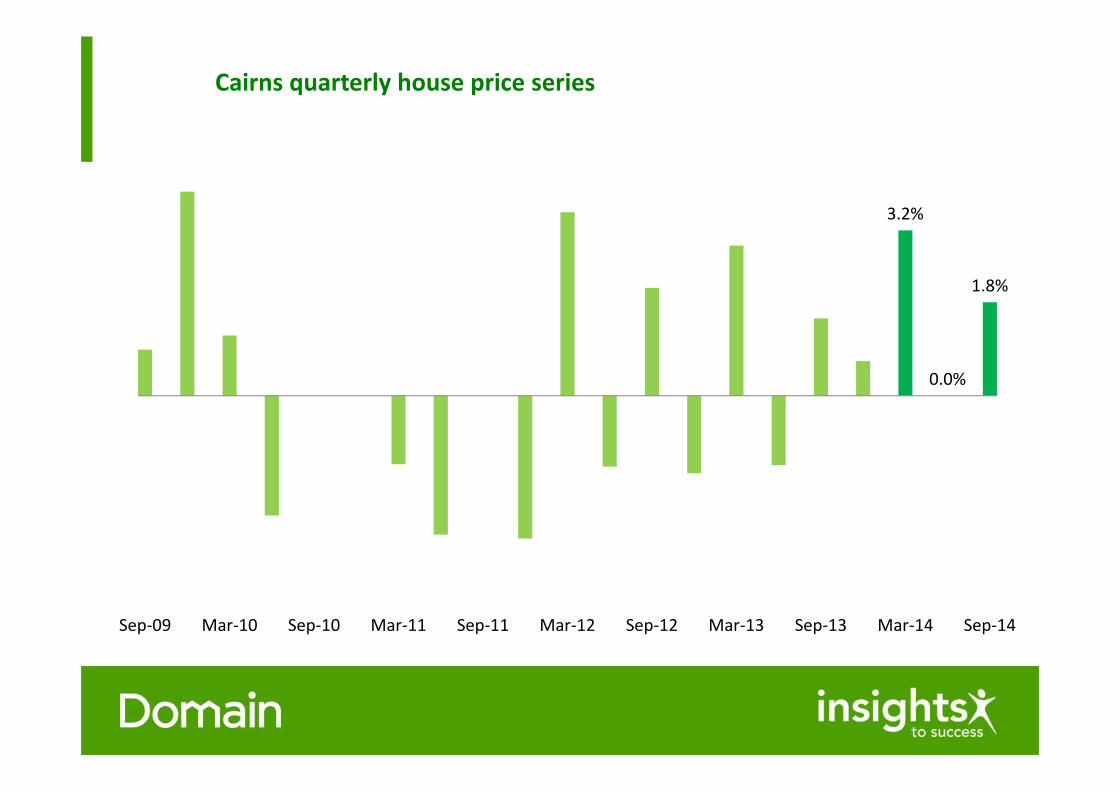
Cairns quarterly house price series
3.2%
0.0%
1.8%
Sep‐09 Mar‐10 Sep‐10 Mar‐11 Sep‐11 Mar‐12 Sep‐12 Mar‐13 Sep‐13 Mar‐14 Sep‐14
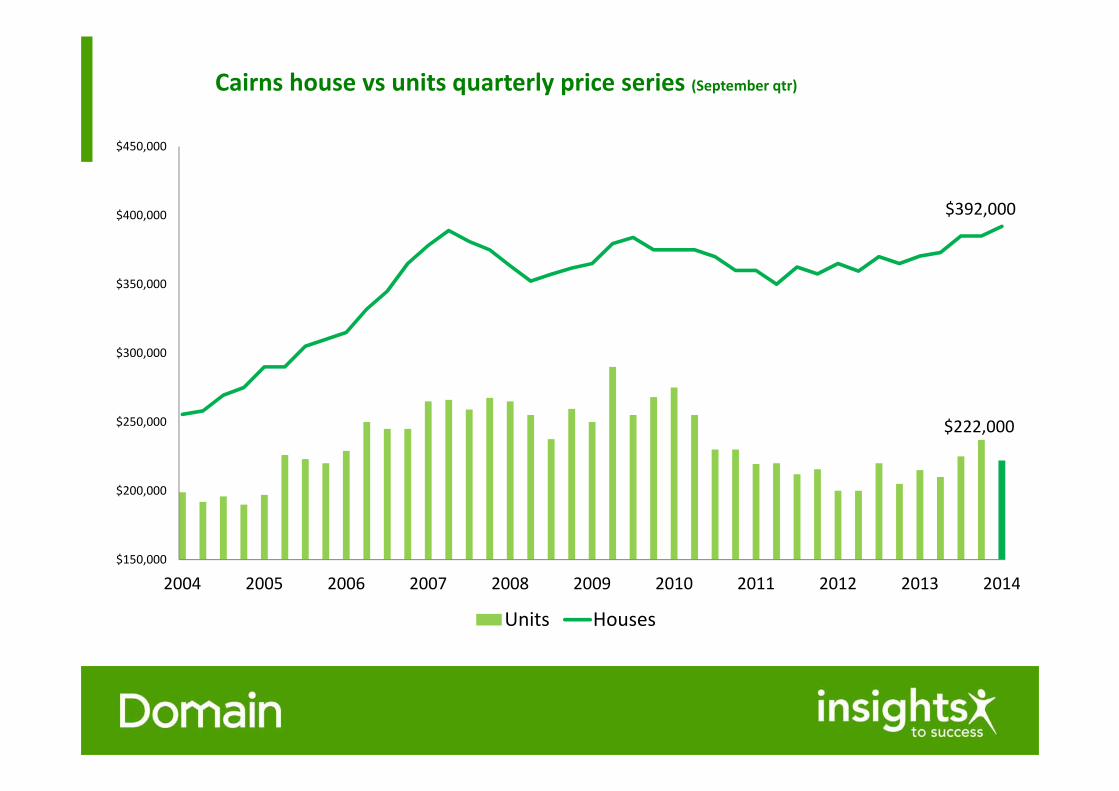
Cairns house vs units quarterly price series (September qtr)
$222,000
$392,000
$150,000
$200,000
$250,000
$300,000
$350,000
$400,000
$450,000
2004 2005 2006 2007 2008 2009 2010 2011 2012 2013 2014
Units Houses
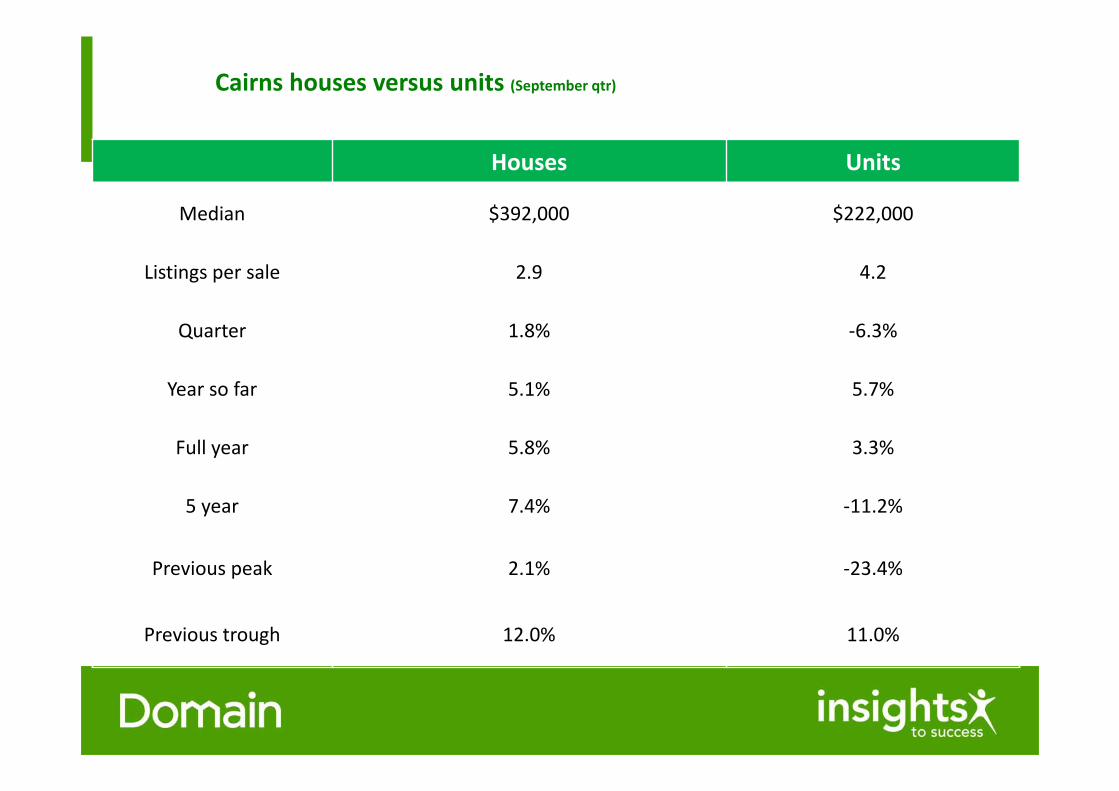
Cairns houses versus units (September qtr)
Houses Units
Median $392,000 $222,000
Listings per sale 2.9 4.2
Quarter 1.8% ‐6.3%
Year so far 5.1% 5.7%
Full year 5.8% 3.3%
5 year 7.4% ‐11.2%
Previous peak 2.1% ‐23.4%
Previous trough 12.0% 11.0%
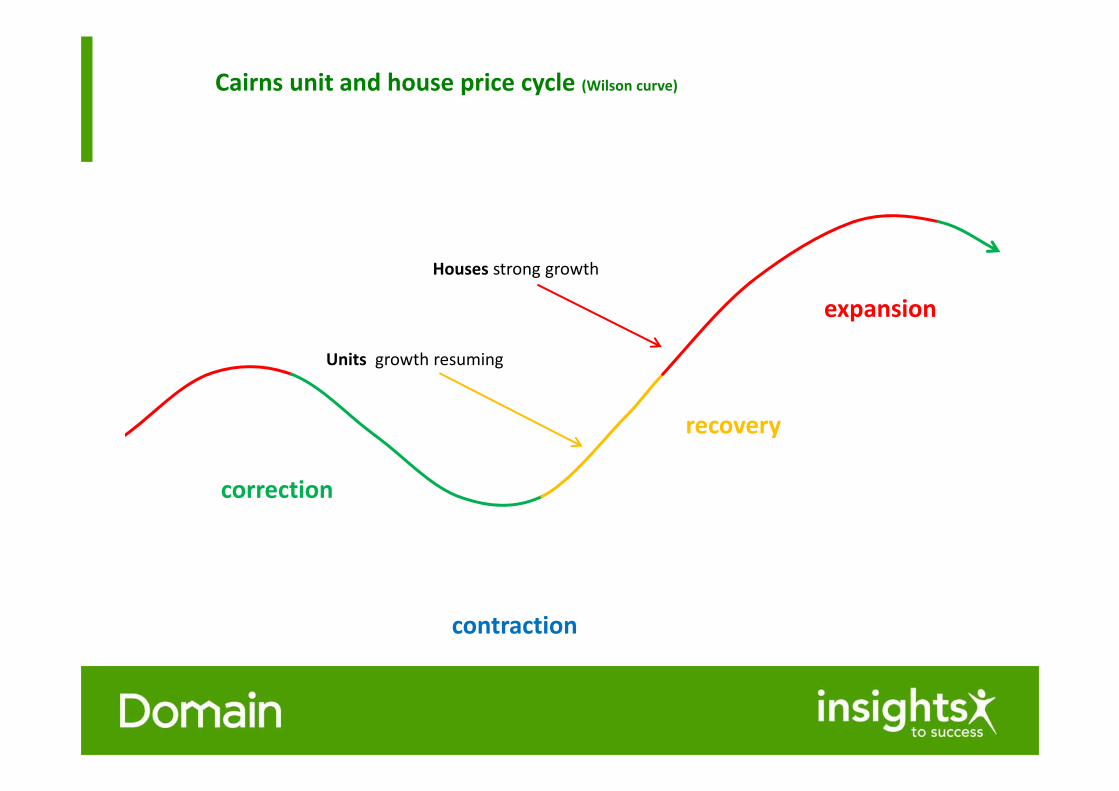
Cairns unit and house price cycle (Wilson curve)
correction
recovery
expansion
contraction
Houses strong growth
Units growth resuming
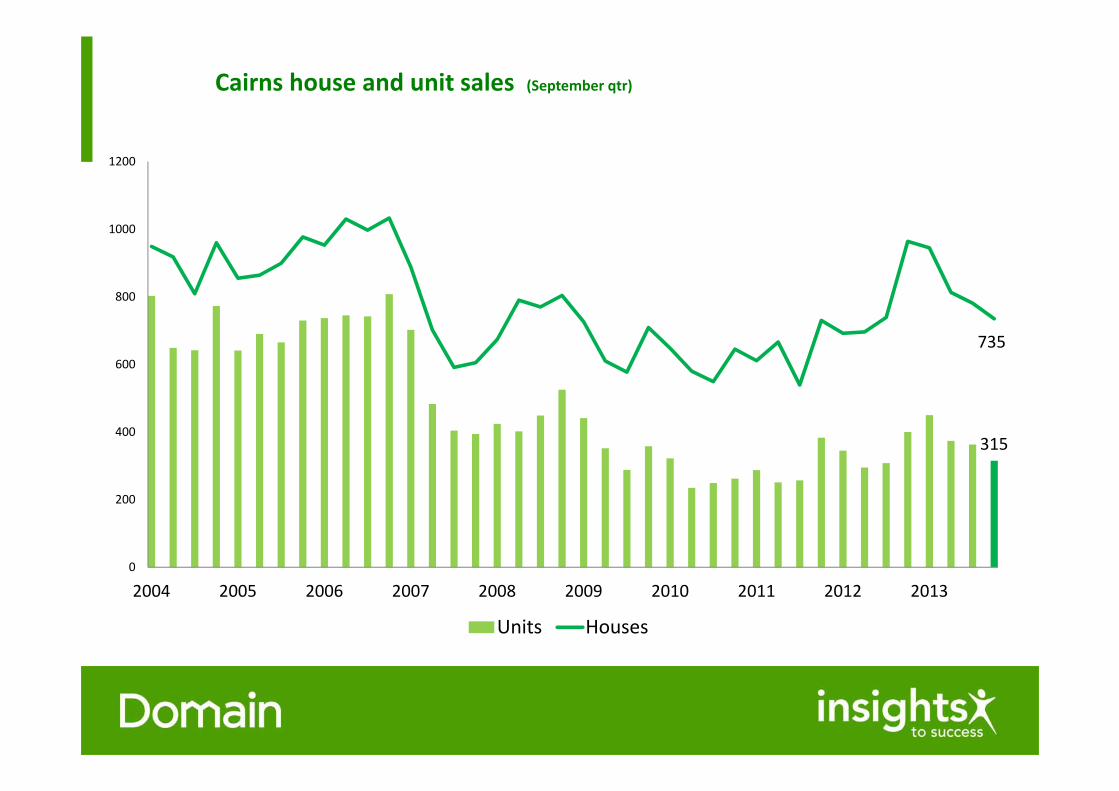
Cairns house and unit sales (September qtr)
315
735
0
200
400
600
800
1000
1200
2004 2005 2006 2007 2008 2009 2010 2011 2012 2013
Units Houses
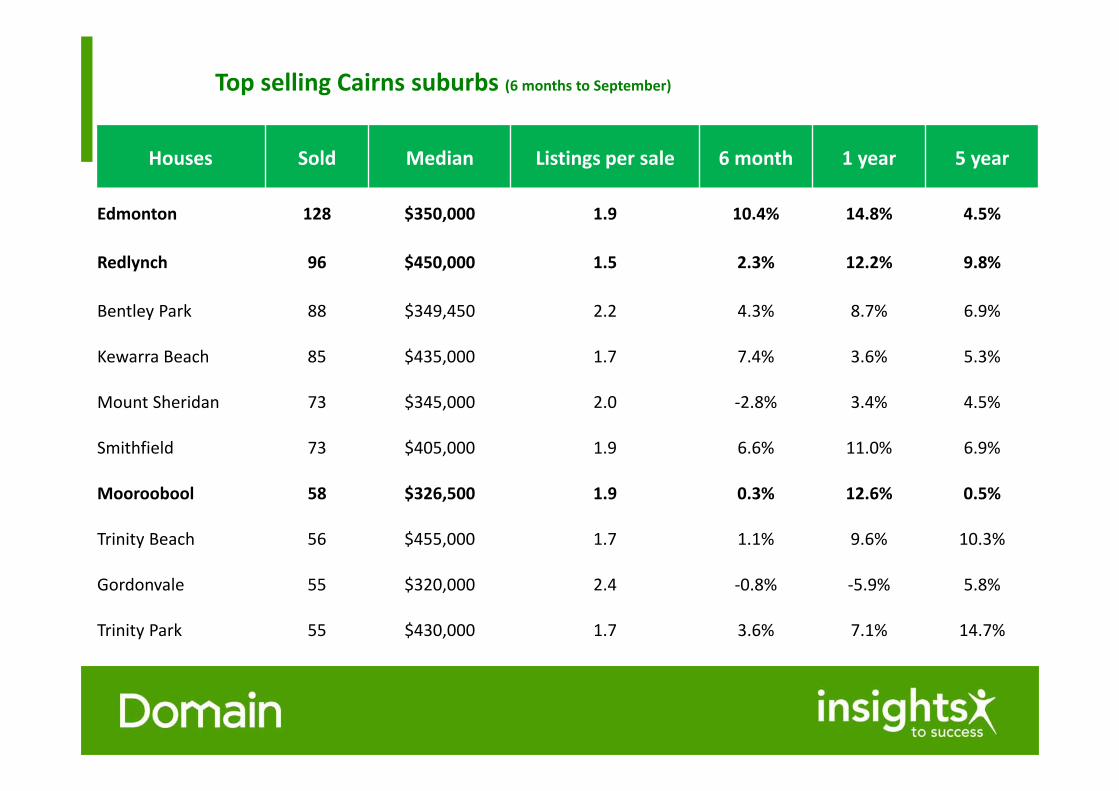
Top selling Cairns suburbs (6 months to September)
Houses Sold Median Listings per sale 6 month 1 year 5 year
Edmonton 128 $350,000 1.9 10.4% 14.8% 4.5%
Redlynch 96 $450,000 1.5 2.3% 12.2% 9.8%
Bentley Park 88 $349,450 2.2 4.3% 8.7% 6.9%
Kewarra Beach 85 $435,000 1.7 7.4% 3.6% 5.3%
Mount Sheridan 73 $345,000 2.0 ‐2.8% 3.4% 4.5%
Smithfield 73 $405,000 1.9 6.6% 11.0% 6.9%
Mooroobool 58 $326,500 1.9 0.3% 12.6% 0.5%
Trinity Beach 56 $455,000 1.7 1.1% 9.6% 10.3%
Gordonvale 55 $320,000 2.4 ‐0.8% ‐5.9% 5.8%
Trinity Park 55 $430,000 1.7 3.6% 7.1% 14.7%
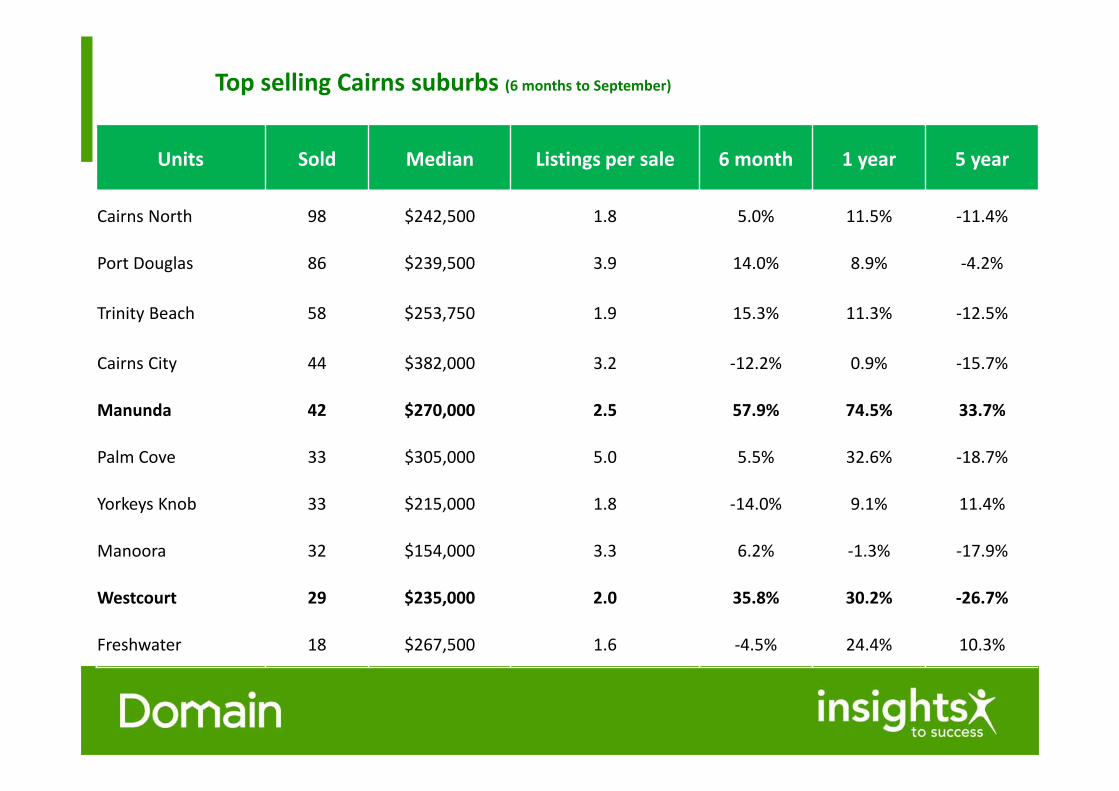
Top selling Cairns suburbs (6 months to September)
Units Sold Median Listings per sale 6 month 1 year 5 year
Cairns North 98 $242,500 1.8 5.0% 11.5% ‐11.4%
Port Douglas 86 $239,500 3.9 14.0% 8.9% ‐4.2%
Trinity Beach 58 $253,750 1.9 15.3% 11.3% ‐12.5%
Cairns City 44 $382,000 3.2 ‐12.2% 0.9% ‐15.7%
Manunda 42 $270,000 2.5 57.9% 74.5% 33.7%
Palm Cove 33 $305,000 5.0 5.5% 32.6% ‐18.7%
Yorkeys Knob 33 $215,000 1.8 ‐14.0% 9.1% 11.4%
Manoora 32 $154,000 3.3 6.2% ‐1.3% ‐17.9%
Westcourt 29 $235,000 2.0 35.8% 30.2% ‐26.7%
Freshwater 18 $267,500 1.6 ‐4.5% 24.4% 10.3%
Cairns rental market
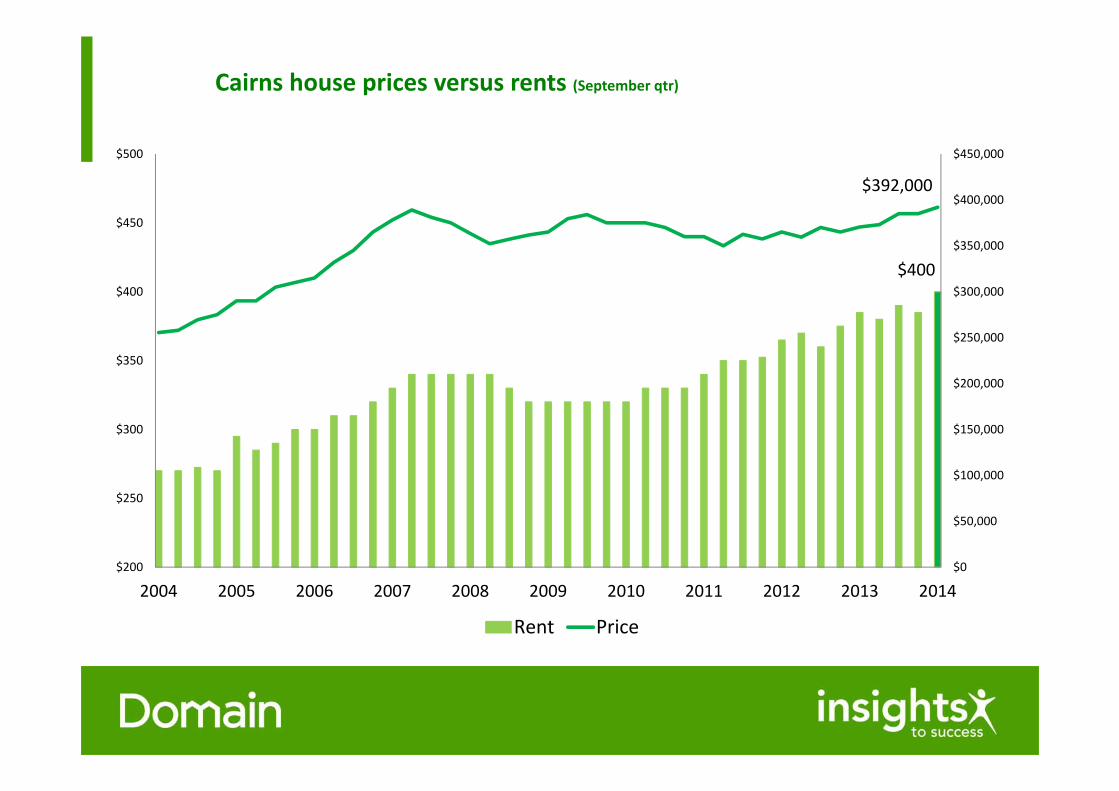
Cairns house prices versus rents (September qtr)
$400
$392,000
$0
$50,000
$100,000
$150,000
$200,000
$250,000
$300,000
$350,000
$400,000
$450,000
$200
$250
$300
$350
$400
$450
$500
2004 2005 2006 2007 2008 2009 2010 2011 2012 2013 2014
Rent Price
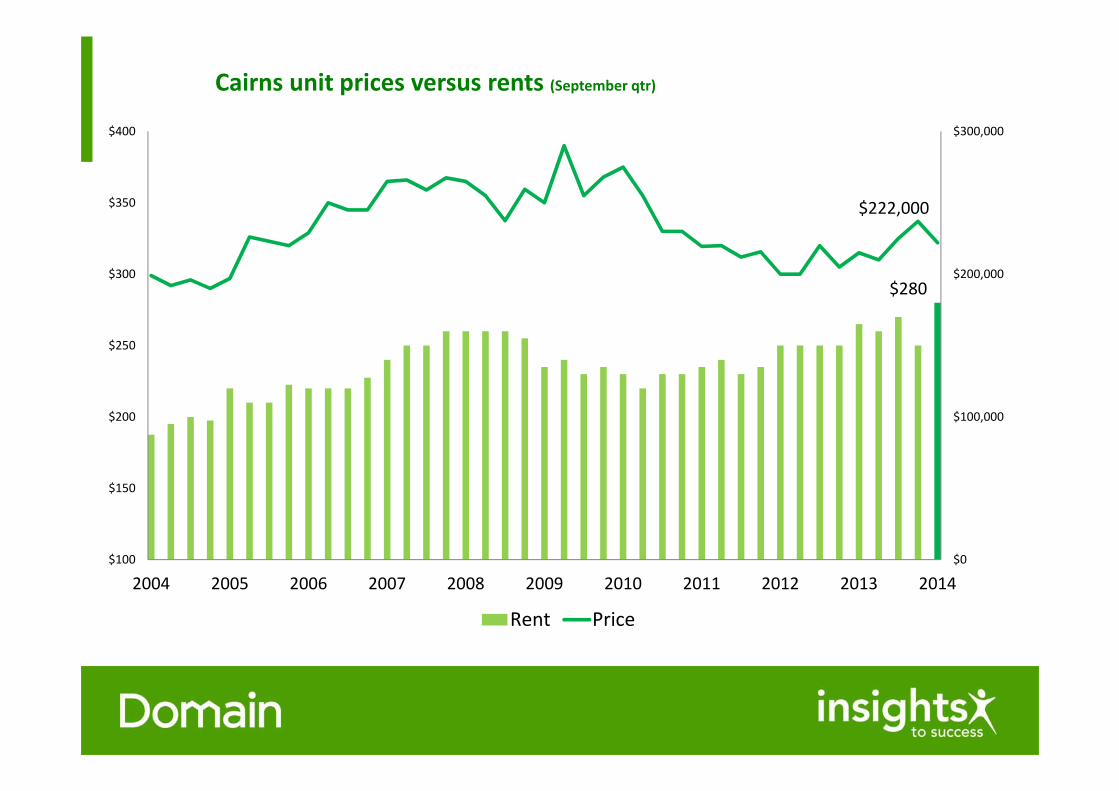
Cairns unit prices versus rents (September qtr)
$280
$222,000
$0
$100,000
$200,000
$300,000
$100
$150
$200
$250
$300
$350
$400
2004 2005 2006 2007 2008 2009 2010 2011 2012 2013 2014
Rent Price
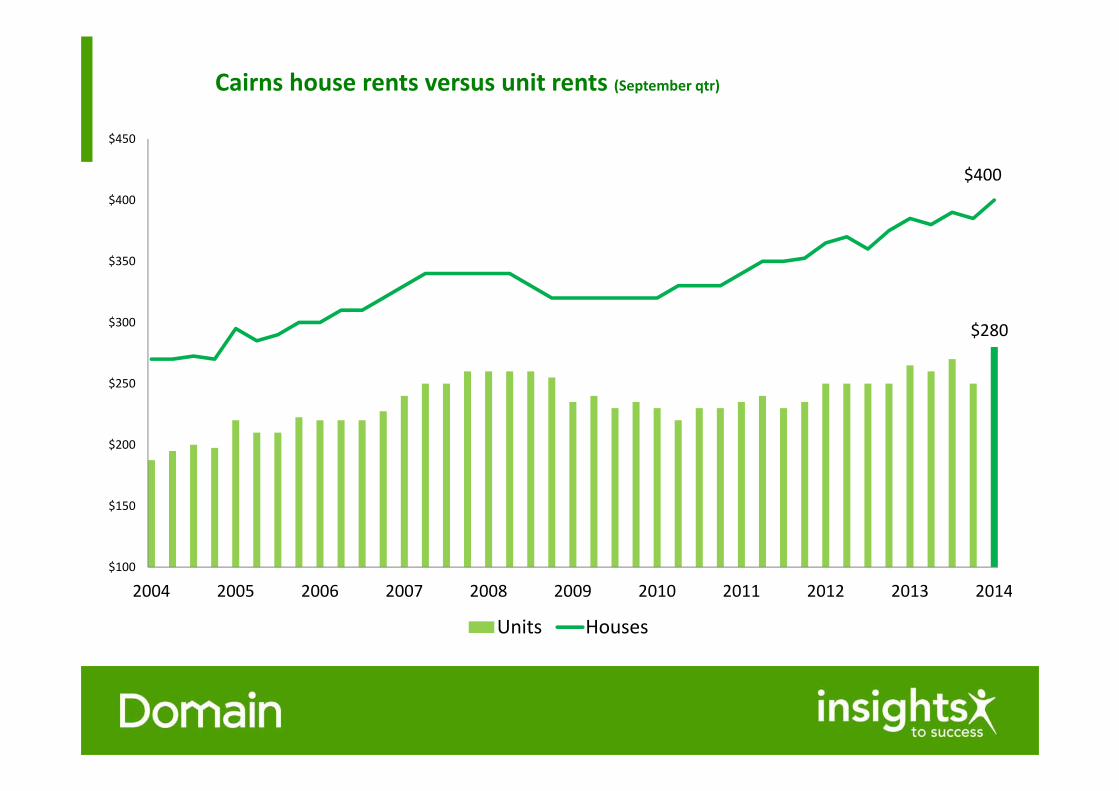
Cairns house rents versus unit rents (September qtr)
$280
$400
$100
$150
$200
$250
$300
$350
$400
$450
2004 2005 2006 2007 2008 2009 2010 2011 2012 2013 2014
Units Houses
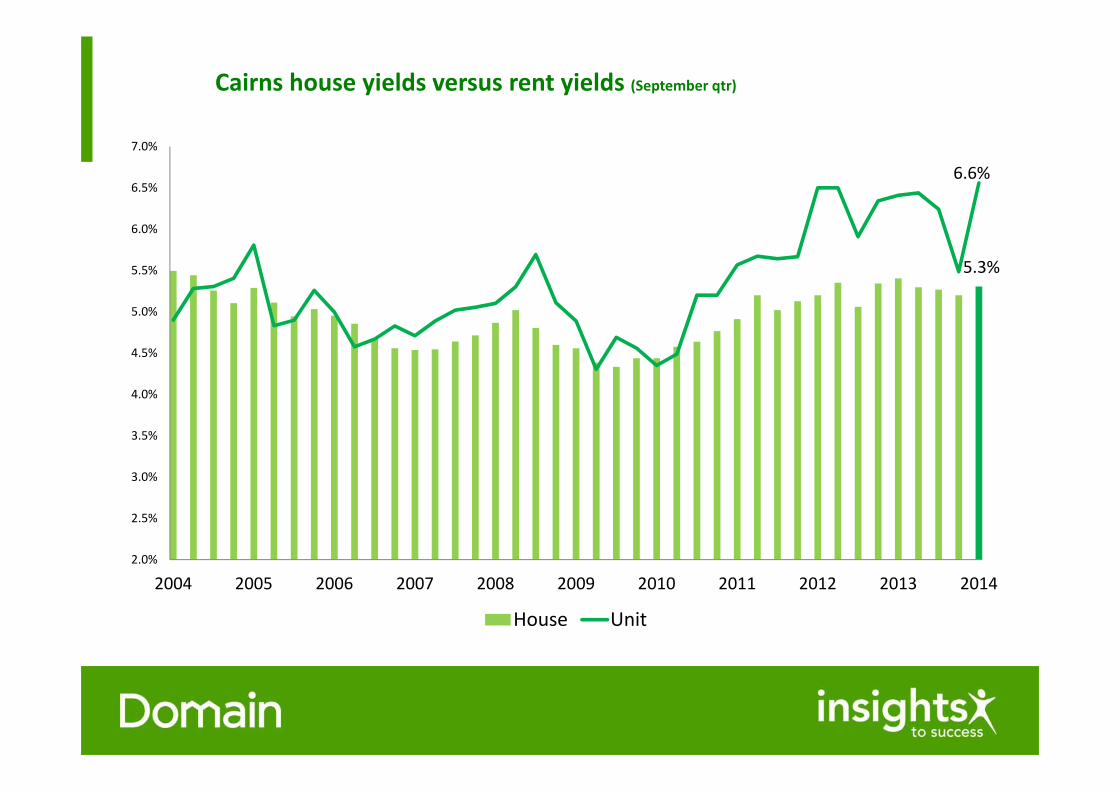
Cairns house yields versus rent yields (September qtr)
5.3%
6.6%
2.0%
2.5%
3.0%
3.5%
4.0%
4.5%
5.0%
5.5%
6.0%
6.5%
7.0%
2004 2005 2006 2007 2008 2009 2010 2011 2012 2013 2014
House Unit
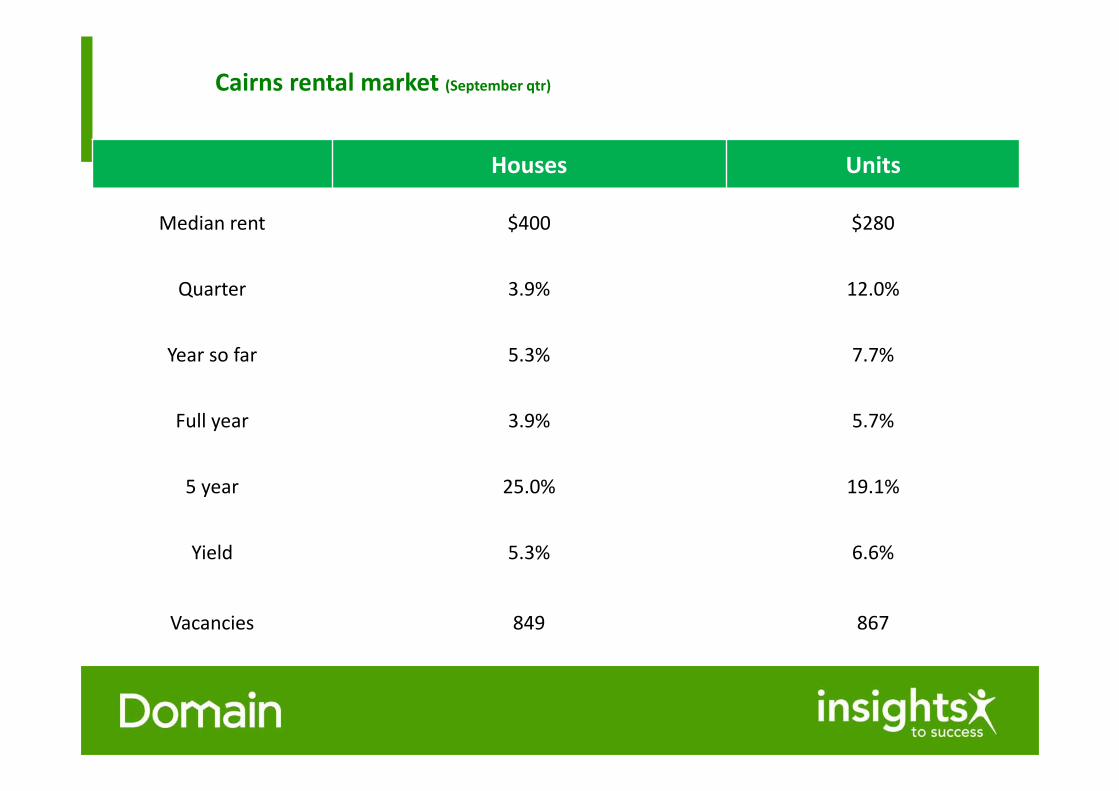
Cairns rental market (September qtr)
Houses Units
Median rent $400 $280
Quarter 3.9% 12.0%
Year so far 5.3% 7.7%
Full year 3.9% 5.7%
5 year 25.0% 19.1%
Yield 5.3% 6.6%
Vacancies 849 867
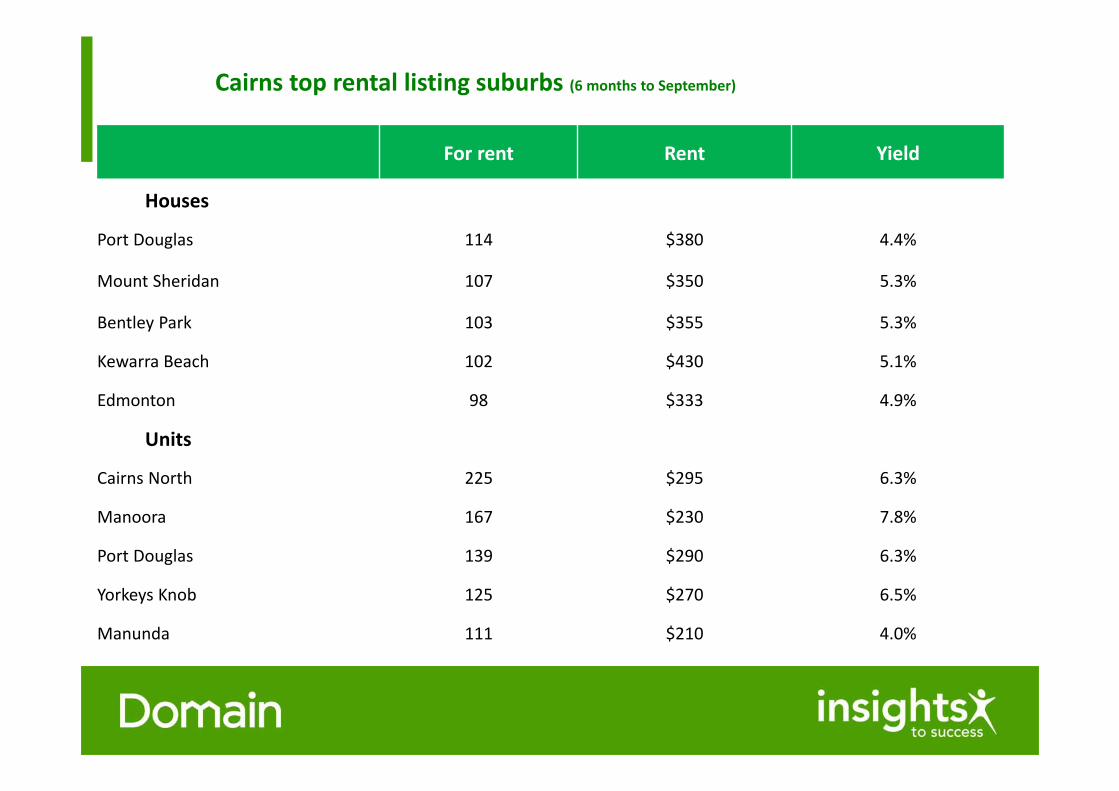
Cairns top rental listing suburbs (6 months to September)
For rent Rent Yield
Houses
Port Douglas 114 $380 4.4%
Mount Sheridan 107 $350 5.3%
Bentley Park 103 $355 5.3%
Kewarra Beach 102 $430 5.1%
Edmonton 98 $333 4.9%
Units
Cairns North 225 $295 6.3%
Manoora 167 $230 7.8%
Port Douglas 139 $290 6.3%
Yorkeys Knob 125 $270 6.5%
Manunda 111 $210 4.0%
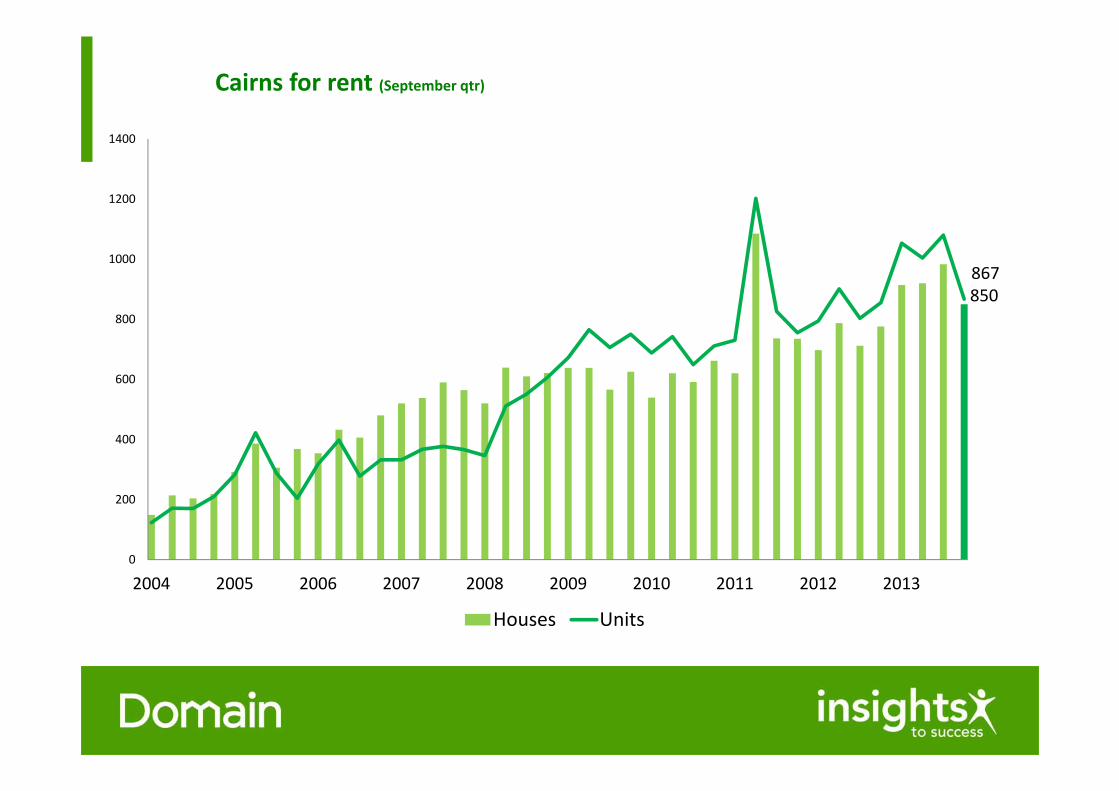
Cairns for rent (September qtr)
850867
0
200
400
600
800
1000
1200
1400
2004 2005 2006 2007 2008 2009 2010 2011 2012 2013
Houses Units

Cairns key market drivers
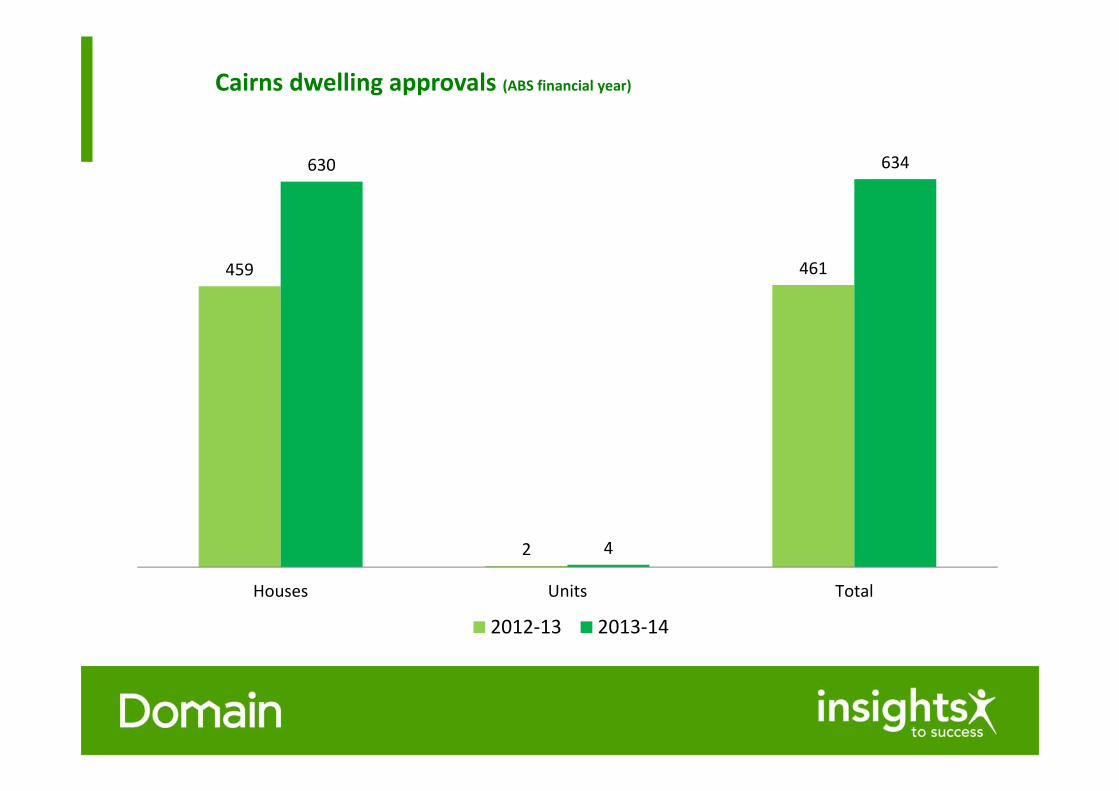
Cairns dwelling approvals (ABS financial year)
459
2
461
630
4
634
Houses Units Total
2012‐13 2013‐14
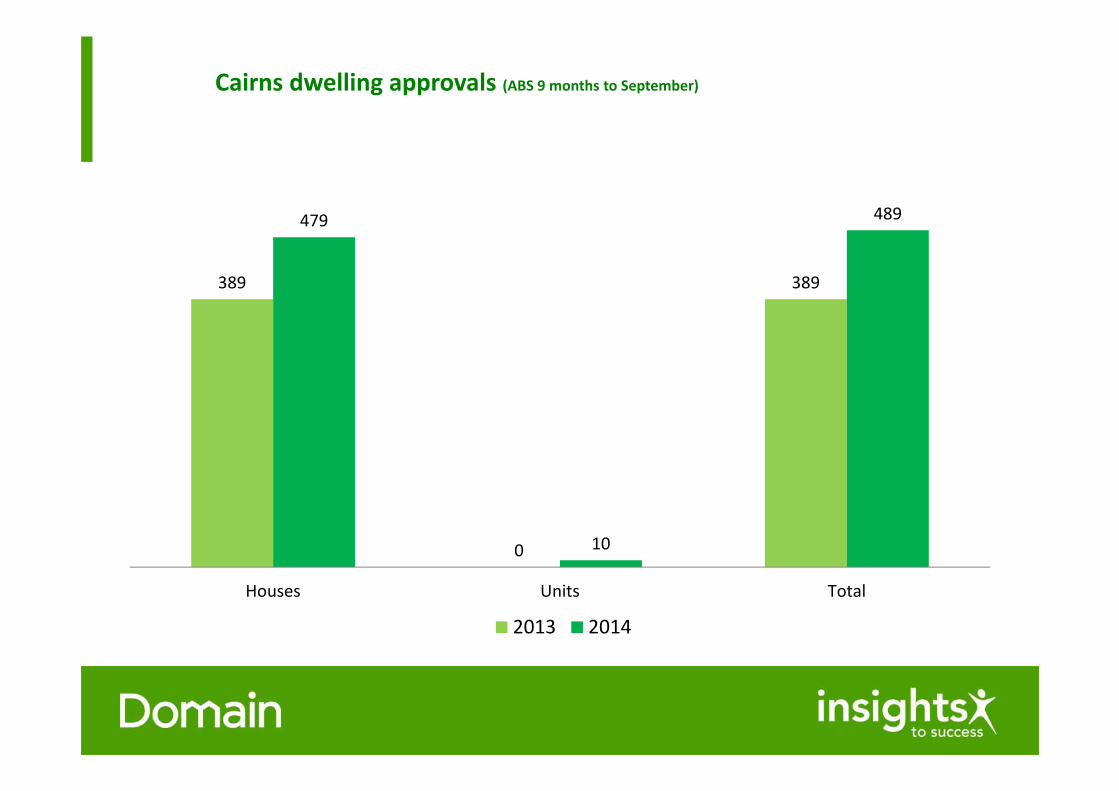
Cairns dwelling approvals (ABS 9 months to September)
389
0
389
479
10
489
Houses Units Total
2013 2014
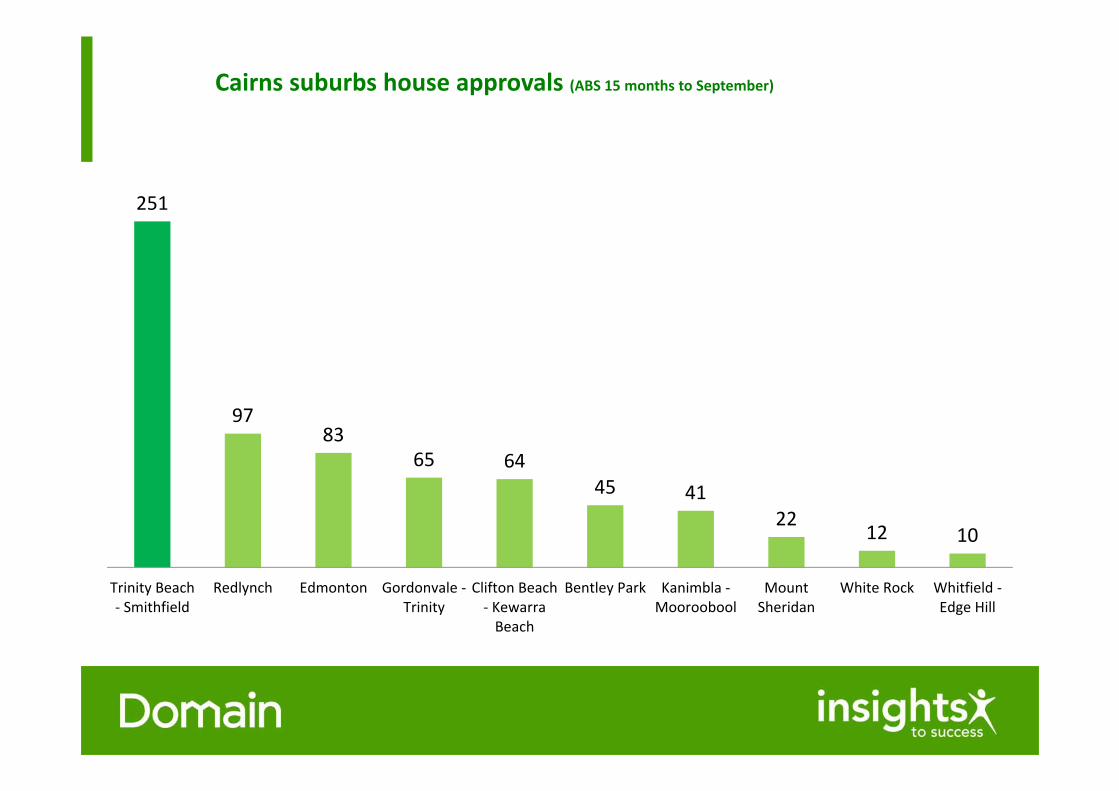
Cairns suburbs house approvals (ABS 15 months to September)
251
9783
65 6445 41
2212 10
Trinity Beach‐ Smithfield
Redlynch Edmonton Gordonvale ‐Trinity
Clifton Beach‐ KewarraBeach
Bentley Park Kanimbla ‐Mooroobool
MountSheridan
White Rock Whitfield ‐Edge Hill
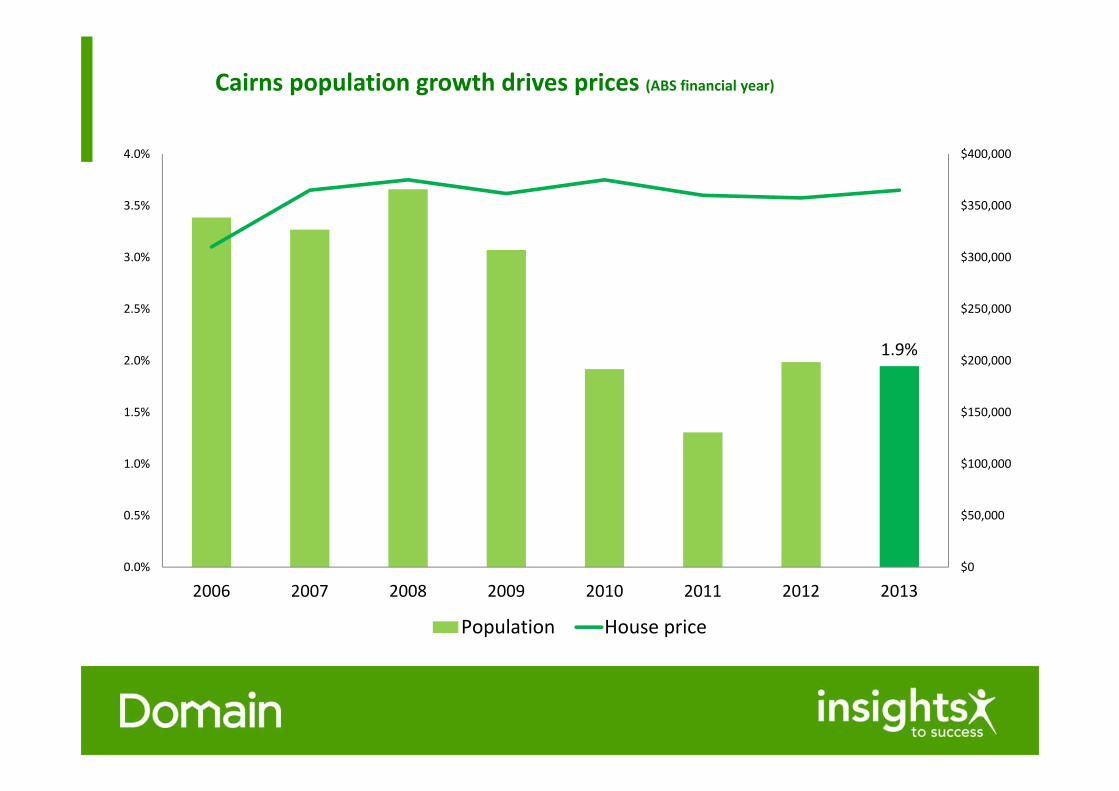
Cairns population growth drives prices (ABS financial year)
1.9%
$0
$50,000
$100,000
$150,000
$200,000
$250,000
$300,000
$350,000
$400,000
0.0%
0.5%
1.0%
1.5%
2.0%
2.5%
3.0%
3.5%
4.0%
2006 2007 2008 2009 2010 2011 2012 2013
Population House price
Cairns economic performance
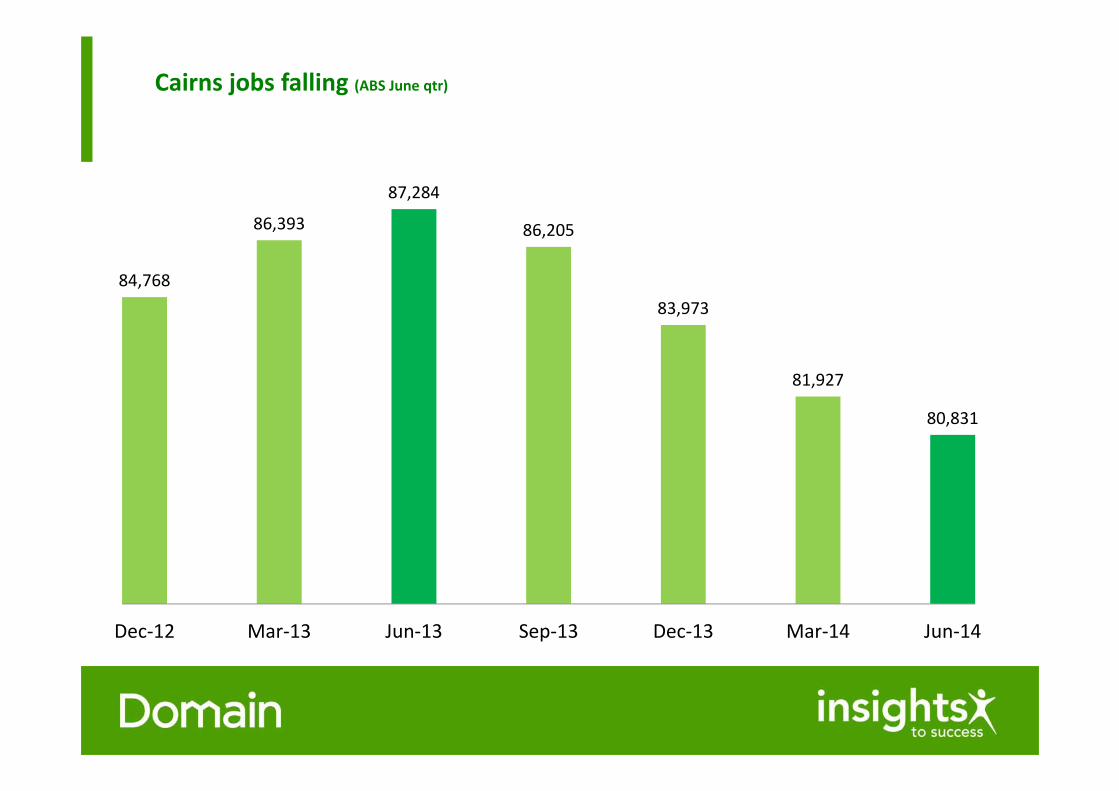
Cairns jobs falling (ABS June qtr)
84,768
86,393
87,284
86,205
83,973
81,927
80,831
Dec‐12 Mar‐13 Jun‐13 Sep‐13 Dec‐13 Mar‐14 Jun‐14
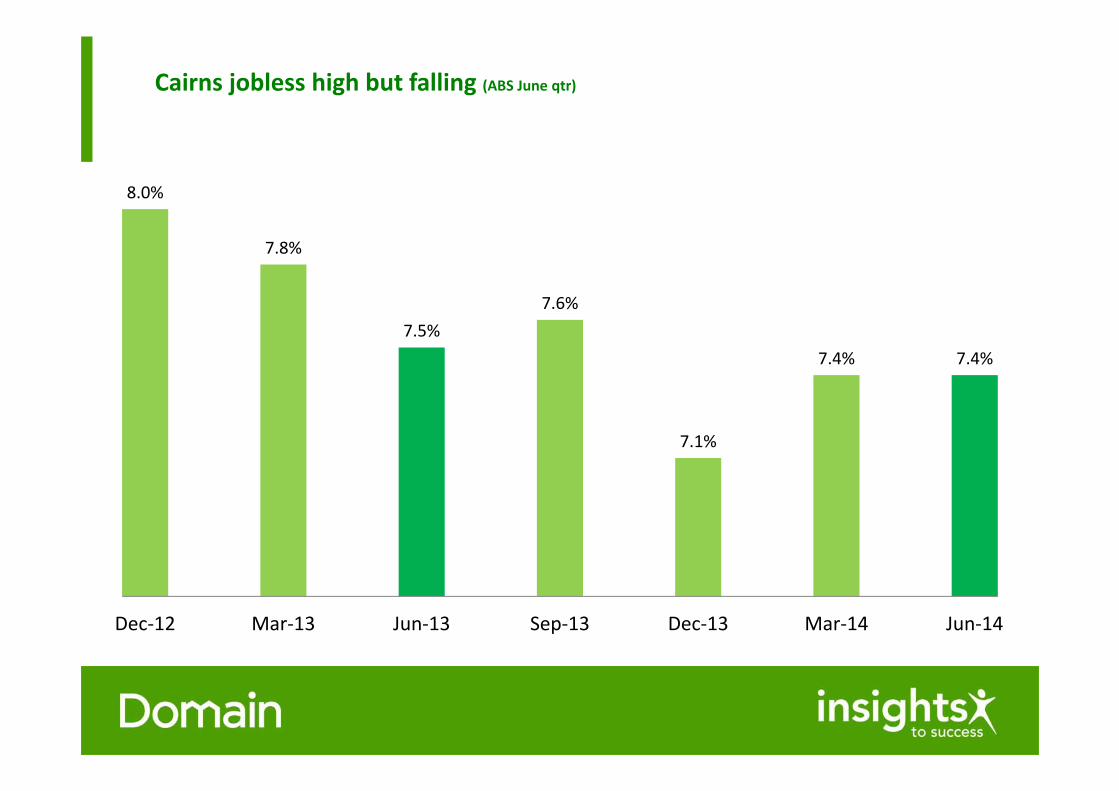
Cairns jobless high but falling (ABS June qtr)
8.0%
7.8%
7.5%7.6%
7.1%
7.4% 7.4%
Dec‐12 Mar‐13 Jun‐13 Sep‐13 Dec‐13 Mar‐14 Jun‐14
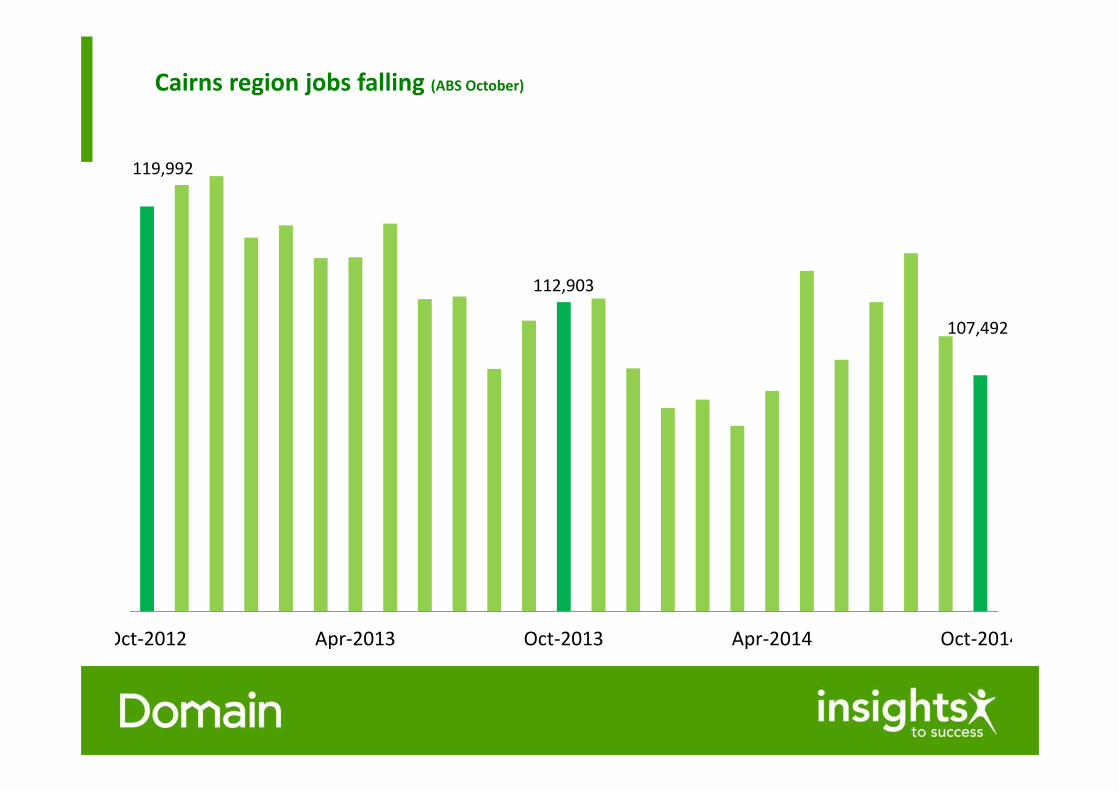
Cairns region jobs falling (ABS October)
119,992
112,903
107,492
Oct‐2012 Apr‐2013 Oct‐2013 Apr‐2014 Oct‐2014
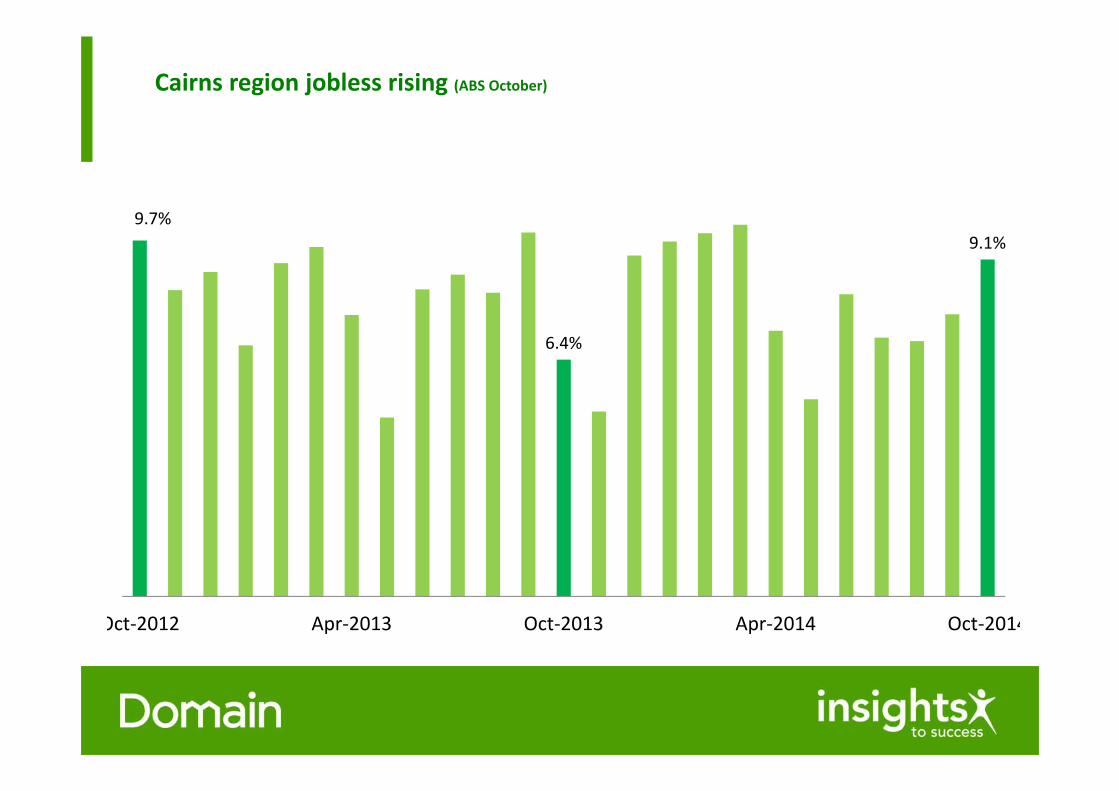
Cairns region jobless rising (ABS October)
9.7%
6.4%
9.1%
Oct‐2012 Apr‐2013 Oct‐2013 Apr‐2014 Oct‐2014
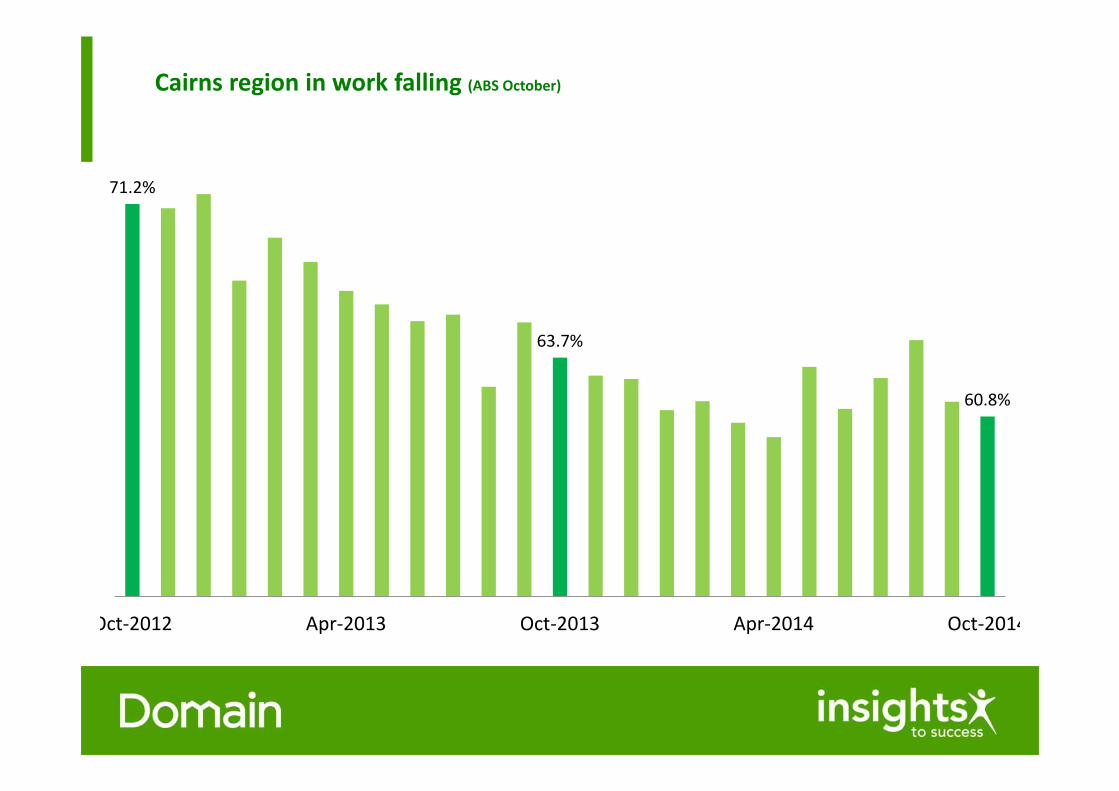
Cairns region in work falling (ABS October)
71.2%
63.7%
60.8%
Oct‐2012 Apr‐2013 Oct‐2013 Apr‐2014 Oct‐2014
National economic performance
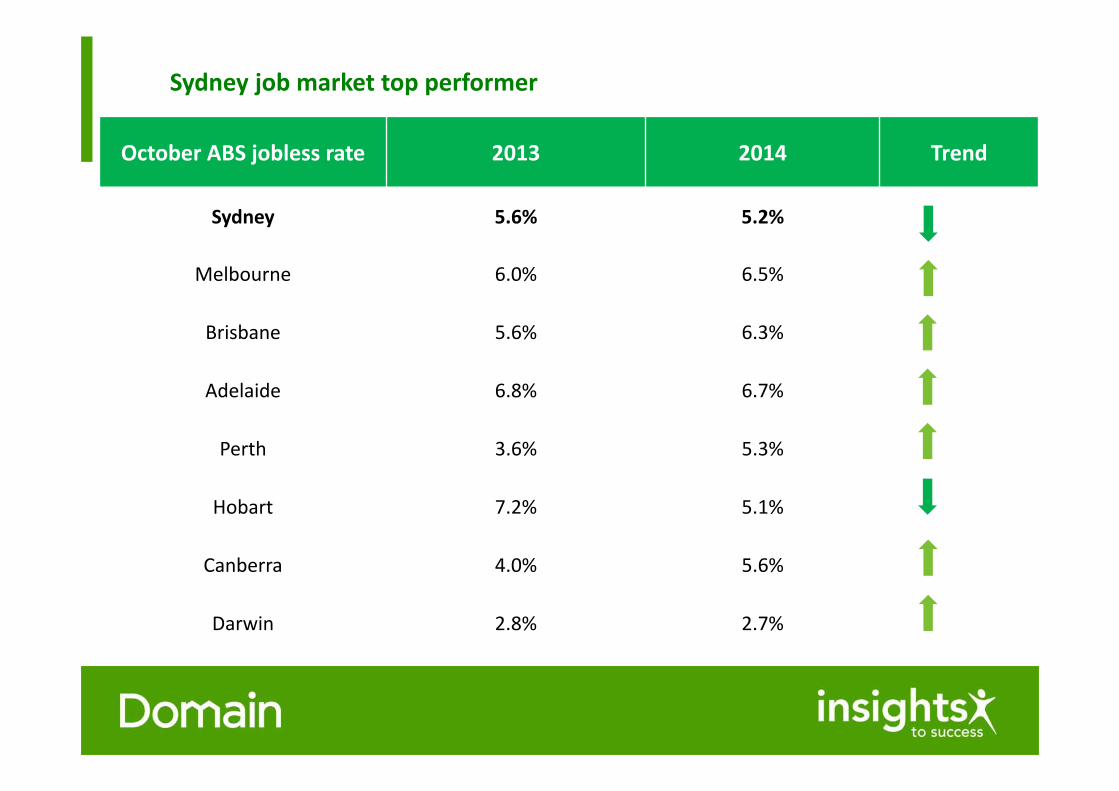
Sydney job market top performer
October ABS jobless rate 2013 2014 Trend
Sydney 5.6% 5.2%
Melbourne 6.0% 6.5%
Brisbane 5.6% 6.3%
Adelaide 6.8% 6.7%
Perth 3.6% 5.3%
Hobart 7.2% 5.1%
Canberra 4.0% 5.6%
Darwin 2.8% 2.7%
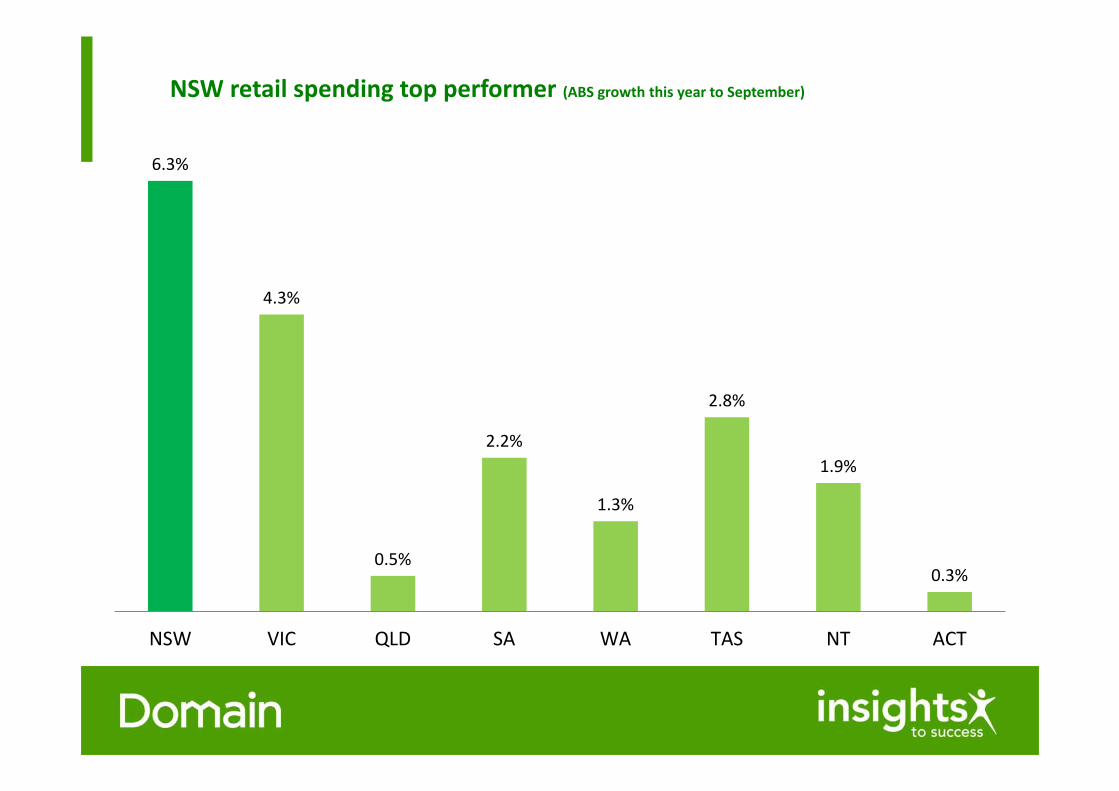
6.3%
4.3%
0.5%
2.2%
1.3%
2.8%
1.9%
0.3%
NSW VIC QLD SA WA TAS NT ACT
NSW retail spending top performer (ABS growth this year to September)

Economic outlook
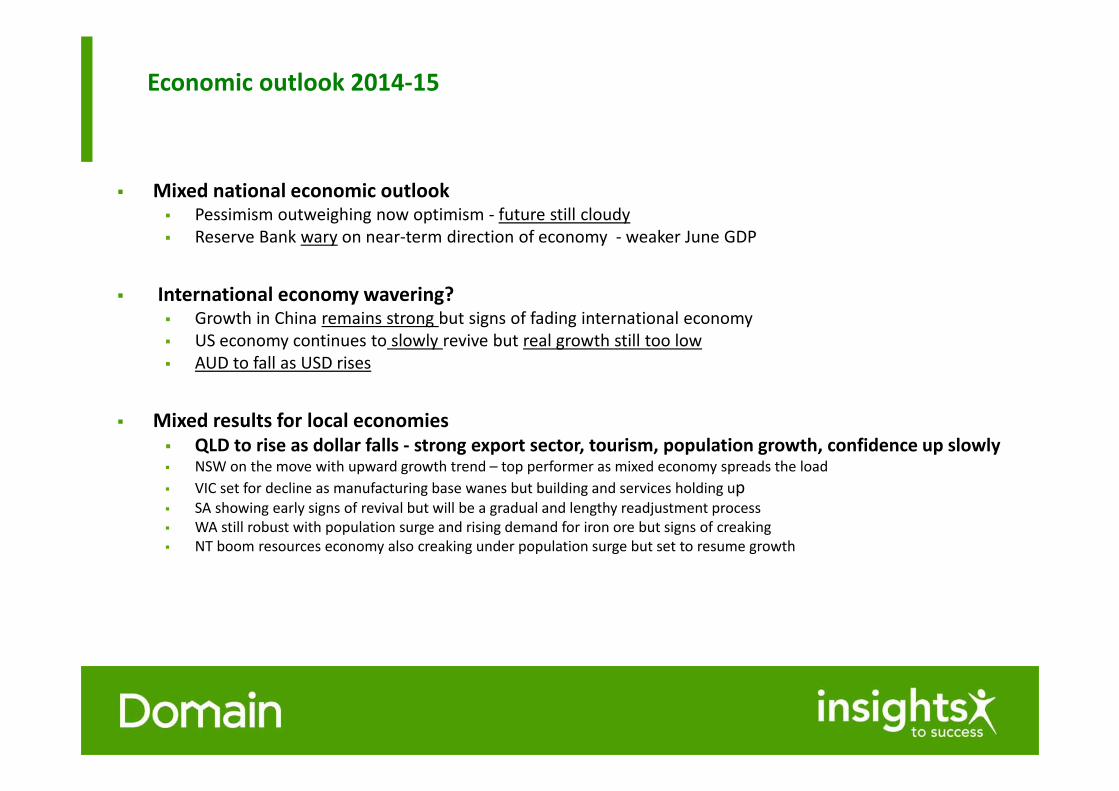
Economic outlook 2014‐15
Mixed national economic outlook Pessimism outweighing now optimism ‐ future still cloudy Reserve Bank wary on near‐term direction of economy ‐ weaker June GDP
International economy wavering? Growth in China remains strong but signs of fading international economy US economy continues to slowly revive but real growth still too low AUD to fall as USD rises
Mixed results for local economies QLD to rise as dollar falls ‐ strong export sector, tourism, population growth, confidence up slowly NSW on the move with upward growth trend – top performer as mixed economy spreads the load VIC set for decline as manufacturing base wanes but building and services holding up SA showing early signs of revival but will be a gradual and lengthy readjustment process WA still robust with population surge and rising demand for iron ore but signs of creaking NT boom resources economy also creaking under population surge but set to resume growth
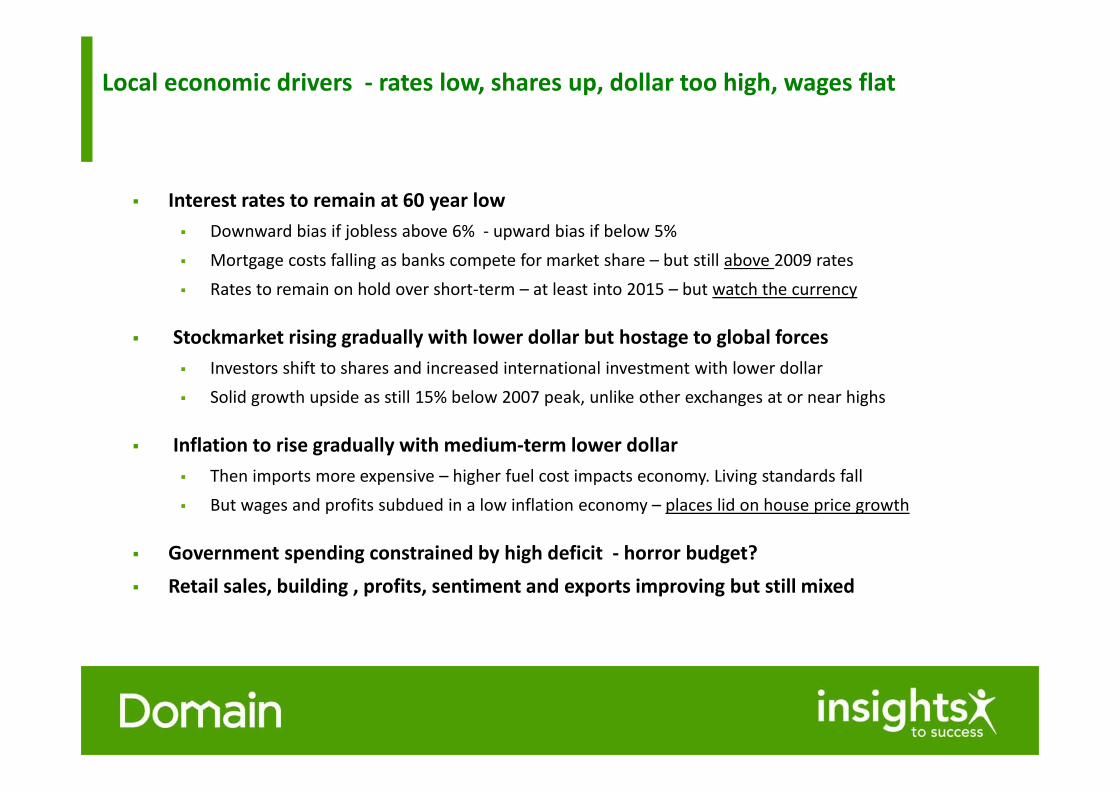
Local economic drivers ‐ rates low, shares up, dollar too high, wages flat
Interest rates to remain at 60 year low Downward bias if jobless above 6% ‐ upward bias if below 5% Mortgage costs falling as banks compete for market share – but still above 2009 rates Rates to remain on hold over short‐term – at least into 2015 – but watch the currency
Stockmarket rising gradually with lower dollar but hostage to global forces Investors shift to shares and increased international investment with lower dollar Solid growth upside as still 15% below 2007 peak, unlike other exchanges at or near highs
Inflation to rise gradually with medium‐term lower dollar Then imports more expensive – higher fuel cost impacts economy. Living standards fall But wages and profits subdued in a low inflation economy – places lid on house price growth
Government spending constrained by high deficit ‐ horror budget? Retail sales, building , profits, sentiment and exports improving but still mixed

Cairns housing market outlook
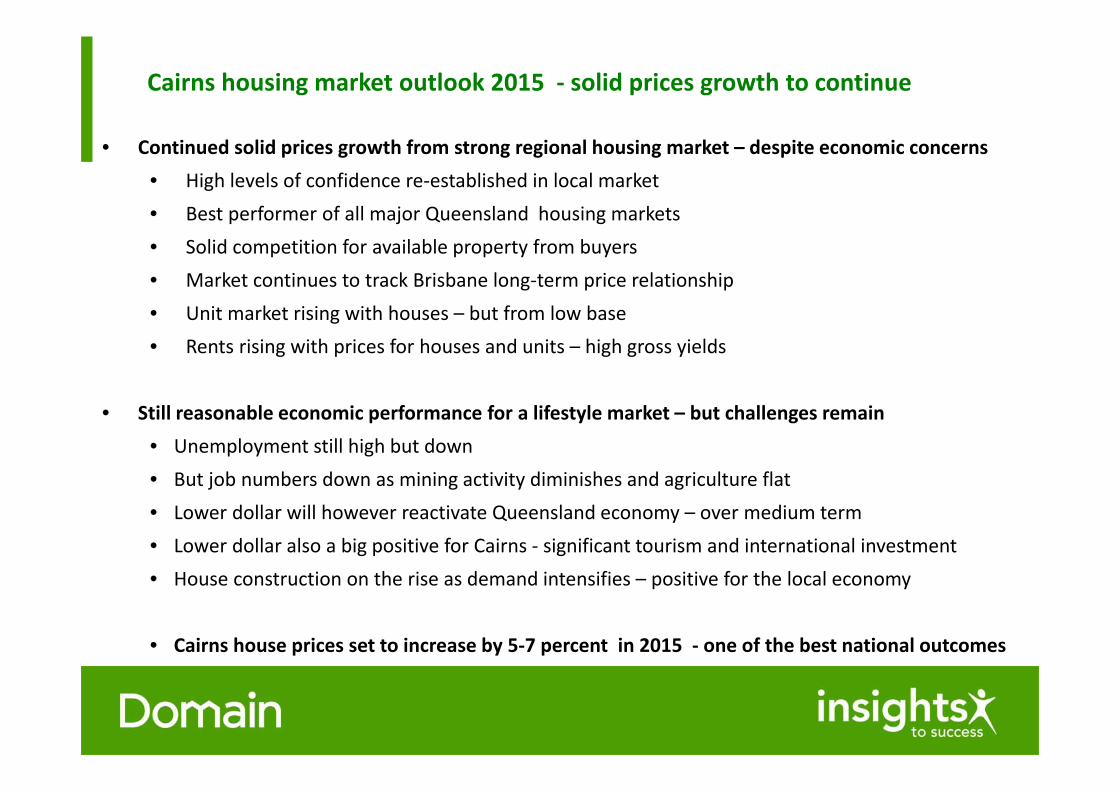
• Continued solid prices growth from strong regional housing market – despite economic concerns• High levels of confidence re‐established in local market• Best performer of all major Queensland housing markets• Solid competition for available property from buyers • Market continues to track Brisbane long‐term price relationship• Unit market rising with houses – but from low base • Rents rising with prices for houses and units – high gross yields
• Still reasonable economic performance for a lifestyle market – but challenges remain • Unemployment still high but down• But job numbers down as mining activity diminishes and agriculture flat• Lower dollar will however reactivate Queensland economy – over medium term• Lower dollar also a big positive for Cairns ‐ significant tourism and international investment • House construction on the rise as demand intensifies – positive for the local economy
• Cairns house prices set to increase by 5‐7 percent in 2015 ‐ one of the best national outcomes
Cairns housing market outlook 2015 ‐ solid prices growth to continue
National housing market outlook
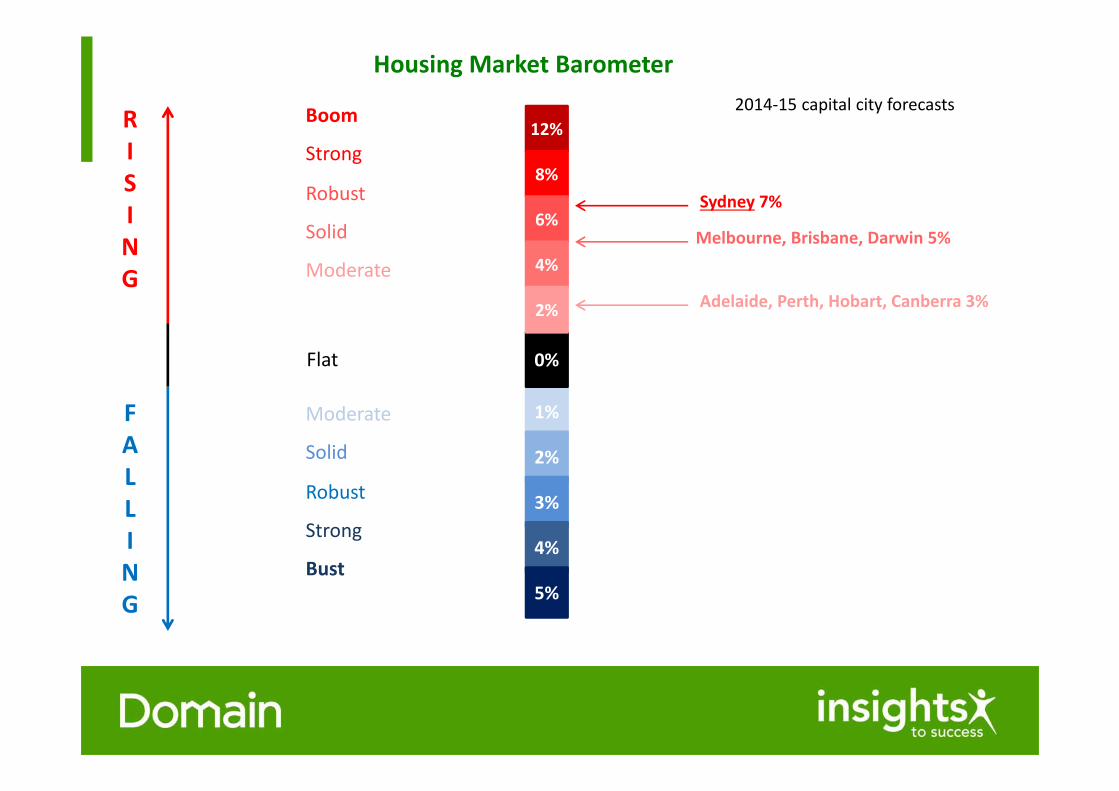
Housing Market Barometer
12%
2%
1%
0%
0%
Sydney 7%
Adelaide, Perth, Hobart, Canberra 3%
Melbourne, Brisbane, Darwin 5%
RISING
FALLING
2014‐15 capital city forecasts
5%
4% 8%
6%
4%
2%
2%
3%
4%
5%
Boom
Strong
Robust
Solid
Moderate
Moderate
Solid
Robust
Strong
Bust
Flat
The rising tide
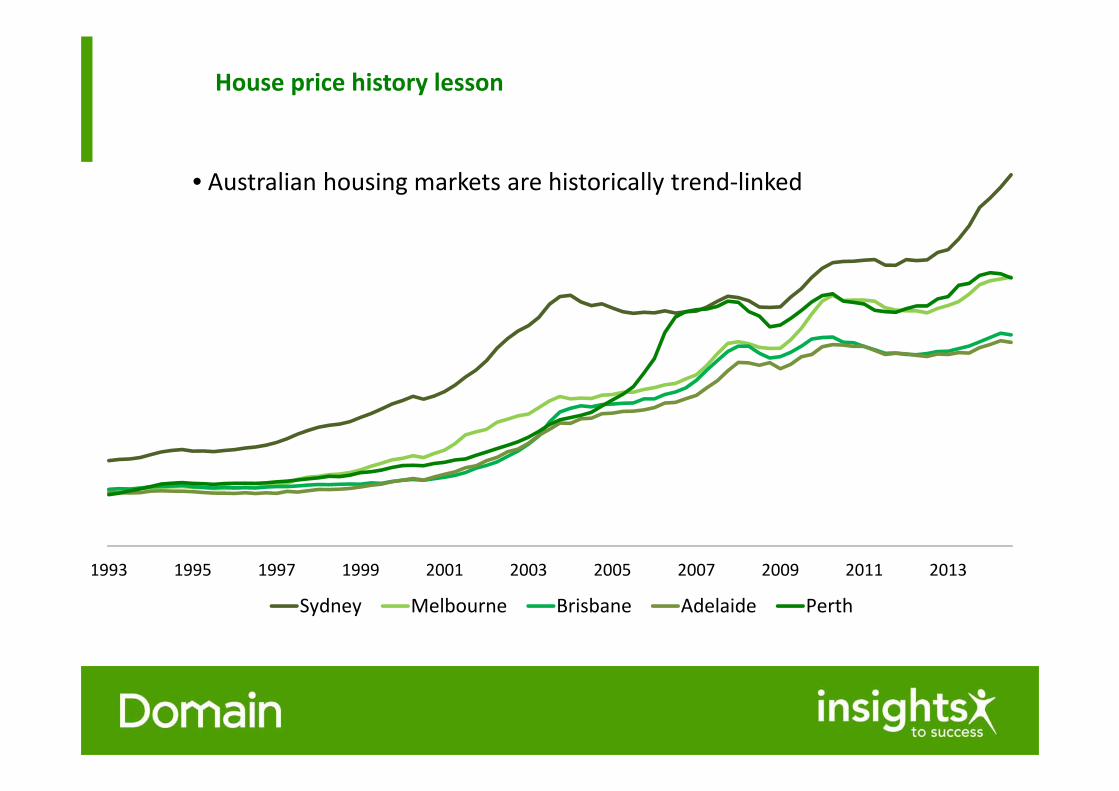
House price history lesson
• Australian housing markets are historically trend‐linked
1993 1995 1997 1999 2001 2003 2005 2007 2009 2011 2013
Sydney Melbourne Brisbane Adelaide Perth
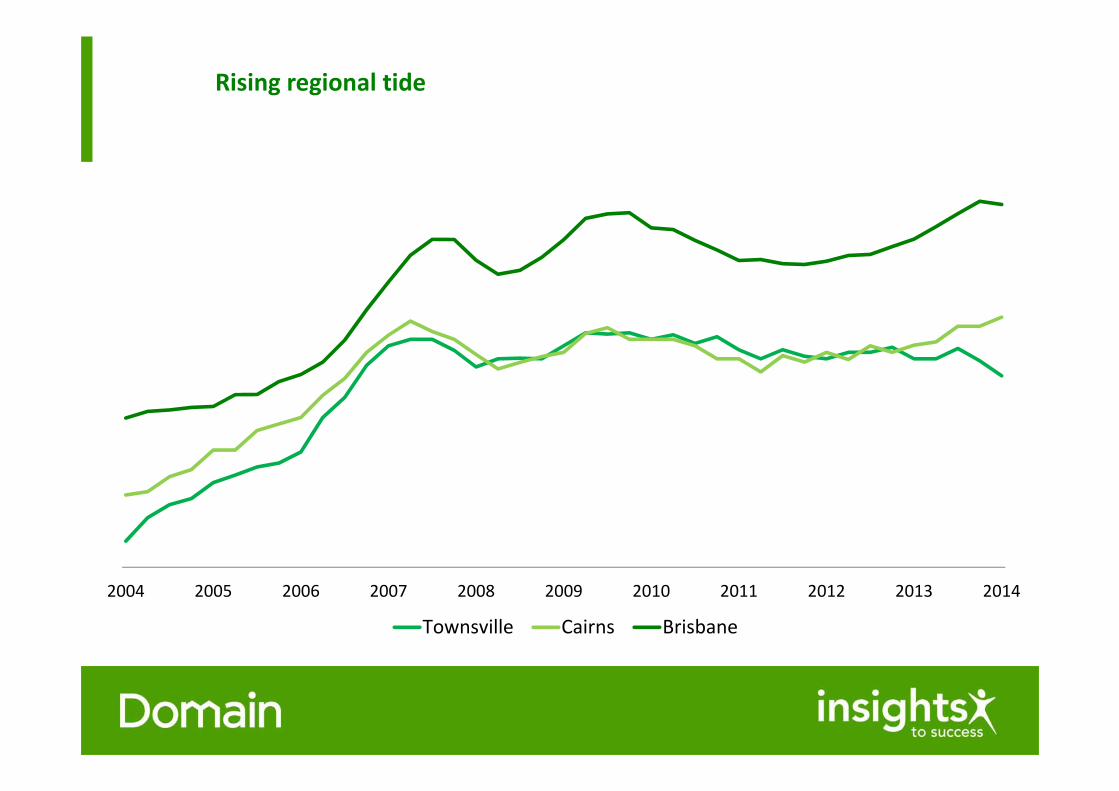
Rising regional tide
2004 2005 2006 2007 2008 2009 2010 2011 2012 2013 2014
Townsville Cairns Brisbane
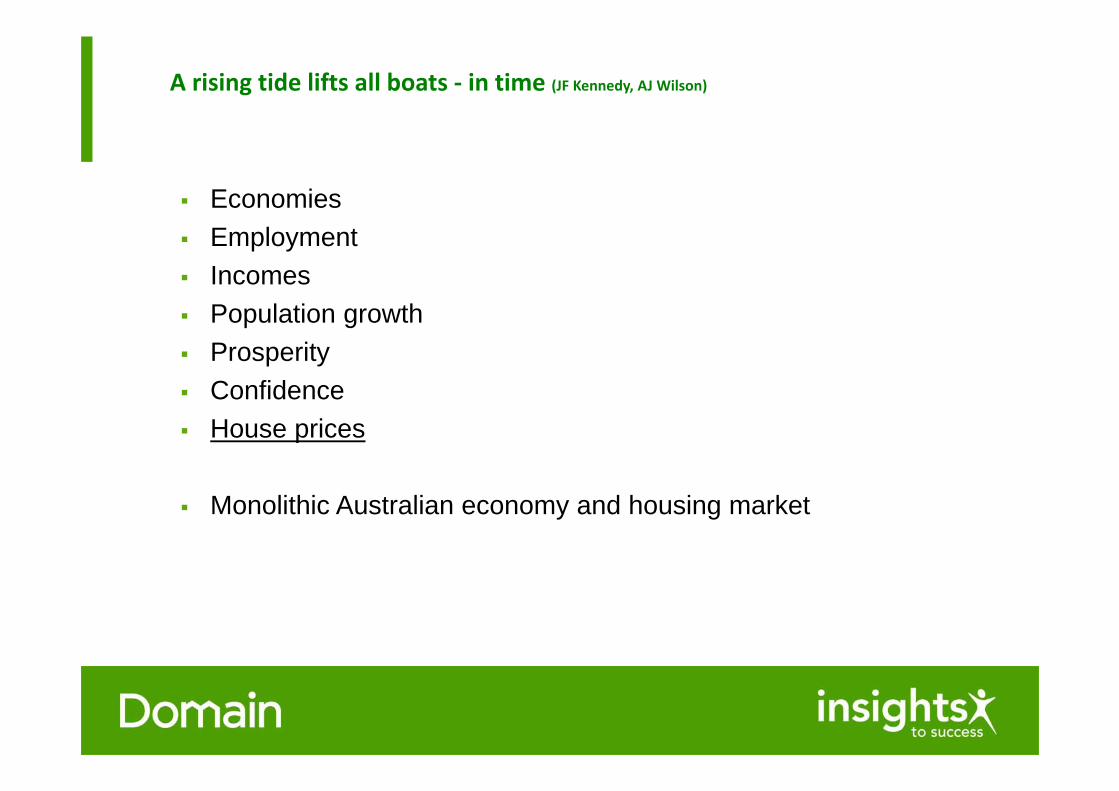
A rising tide lifts all boats ‐ in time (JF Kennedy, AJ Wilson)
Economies Employment Incomes Population growth Prosperity Confidence House prices
Monolithic Australian economy and housing market
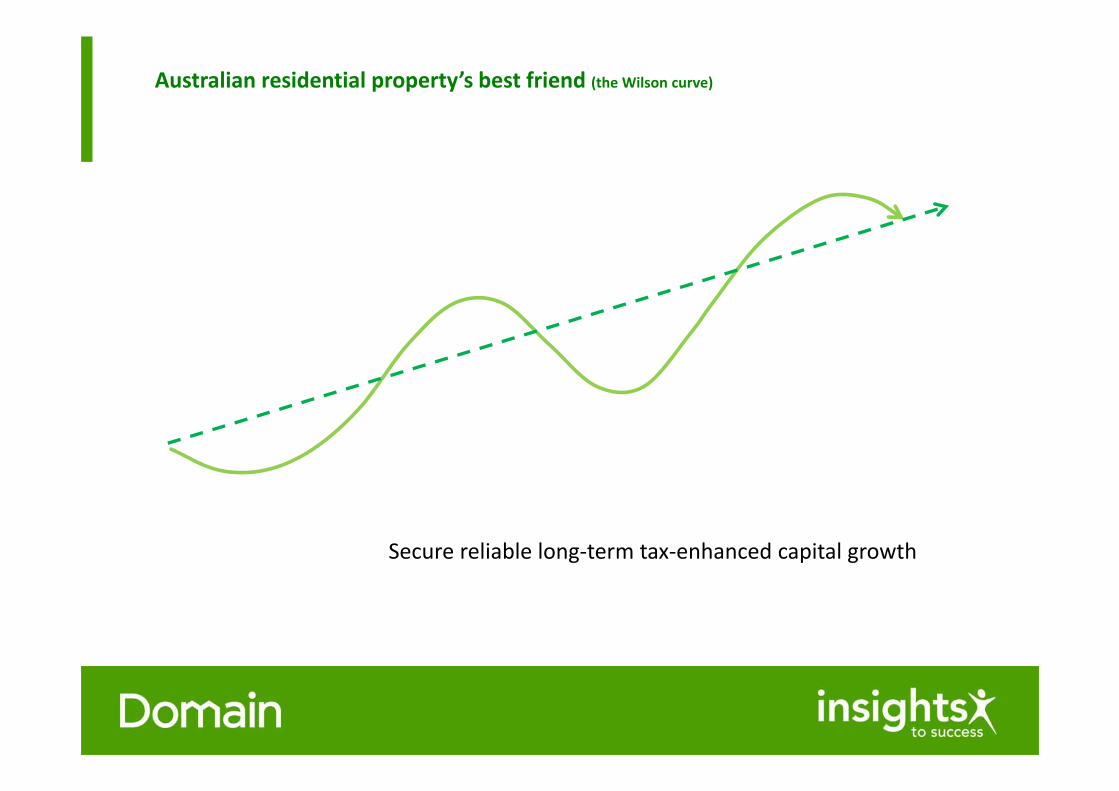
Australian residential property’s best friend (the Wilson curve)
Secure reliable long‐term tax‐enhanced capital growth
If you require any further information regarding Australian property market analysis I may be contacted by email at [email protected] or phone 0427 410 240
For all the real-time housing market insights follow me on twitter at @DocAndrewWilson
Listen to me on Radio 2UE Saturdays 12.30 to 1pm
Australian property market analysis

Thank you