aug technical workgroup of uncc · meter type mappings based on serial number –full data received...
TRANSCRIPT
DNV GL © 2018 12 October 2018 SAFER, SMARTER, GREENERDNV GL © 2018
12 October 2018
Tony Perchard & Andy Gordon
DIGITAL SOLUTIONS
AUG Technical Workgroup of UNCC
1
Early Engagement Meeting for 2018/19
DNV GL © 2018 12 October 2018
Agenda
▪ Introduction
▪ Data Status
▪ Analysis Update
– Review of Issues
– Proposed Changes to Methodology
– Additional Data/Information
▪ Industry Changes and Modifications
▪ Next Steps
2
DNV GL © 2018 12 October 2018
Introduction
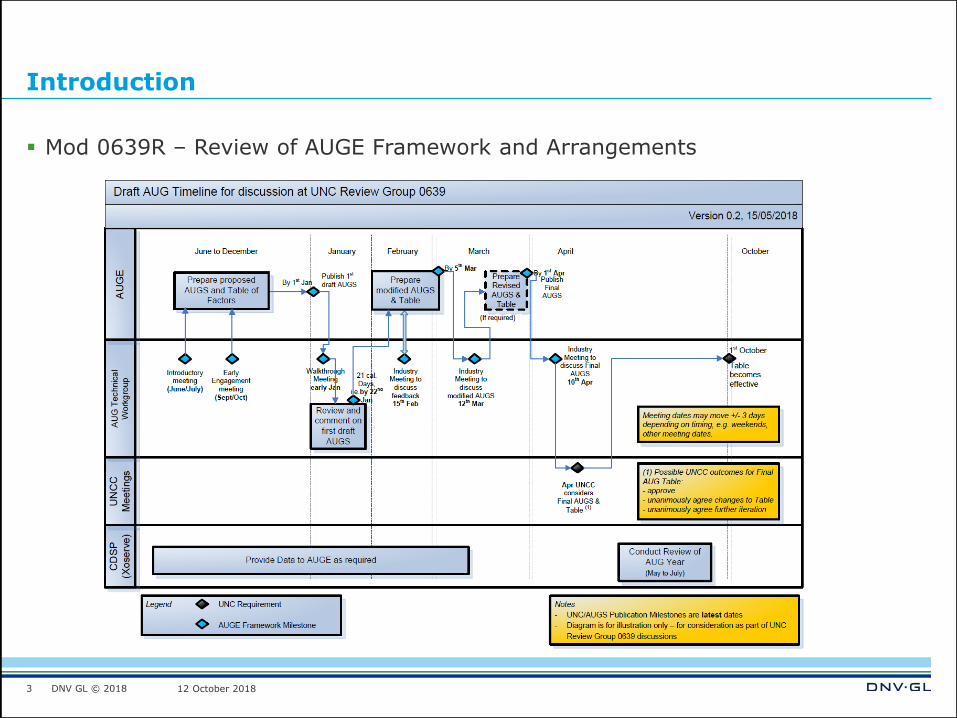
▪ Mod 0639R – Review of AUGE Framework and Arrangements
3
DNV GL © 2018 12 October 2018
Data Status
▪ Register of Data Requests Published on JoT
▪ Overdue Data Items
– Shipper Theft of Gas Data
– Actual Temperature Data
▪ Risks
– Supplier Theft of Gas Data not provided in time
4
DNV GL © 2018 12 October 2018
Analysis Update
▪ Update on each Issue
– Status of analysis and preliminary results
– Current thoughts on methodology impact
– Additional supporting data & information required
5
DNV GL © 2018 12 October 2018
Theft Analysis (Issue 8)
▪ Method as presented at the AUG Technical Workgroup meeting
▪ Generation of best estimate of Unbiased Leads
▪ Leads → Investigations → Detections
▪ Supply of data approved in principle at TIG (Theft Issues Group)
▪ Actual route for data authorisation/supply currently being defined
▪ Impact assessments
– received from Experian
– expected from Crimestoppers by Friday 28 Sep
▪ Next step – submit paper to TSG
6
DNV GL © 2018 12 October 2018
Theft Analysis (Issue 8)
▪ Summary of data requested:
– EUC/Product Class
– Meter Type (traditional/Smart/AMR) – from asset data/serial number
– Meter installation date - from asset data
– Source of lead (MAM, MRA, GT, TRAS, own analysis, tip-off)
– Lead investigated? (Yes/No)
– Theft detected? (Yes/No)
– Gas stolen (kWh)
– Theft type (tampering code)
– Start and end dates of theft
7
DNV GL © 2018 12 October 2018
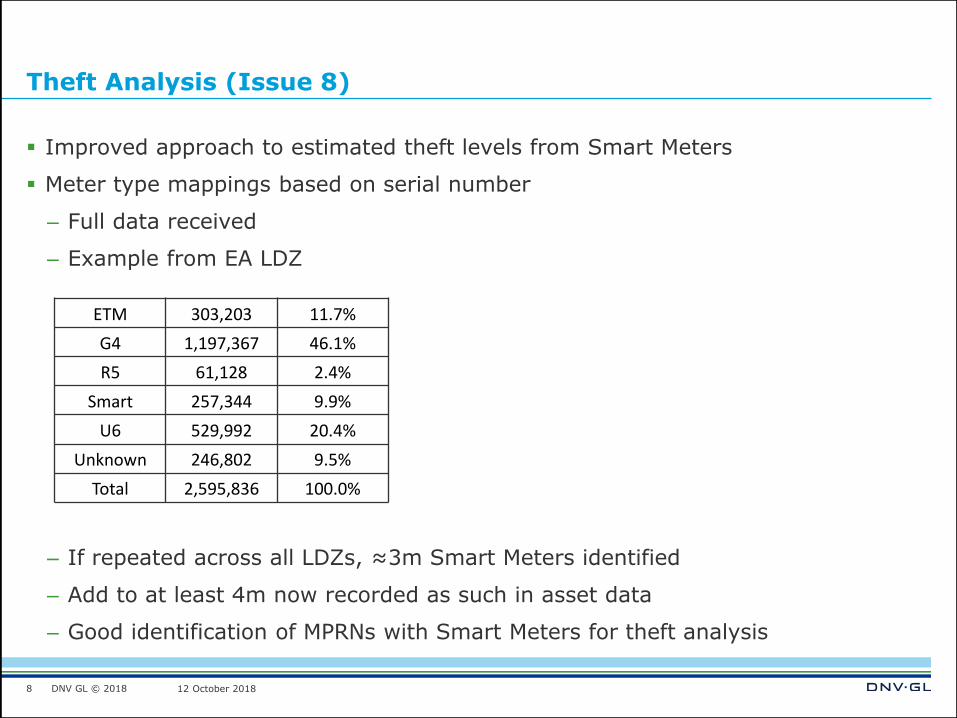
Theft Analysis (Issue 8)
▪ Improved approach to estimated theft levels from Smart Meters
▪ Meter type mappings based on serial number
– Full data received
– Example from EA LDZ
– If repeated across all LDZs, ≈3m Smart Meters identified
– Add to at least 4m now recorded as such in asset data
– Good identification of MPRNs with Smart Meters for theft analysis
8
ETM 303,203 11.7%
G4 1,197,367 46.1%
R5 61,128 2.4%
Smart 257,344 9.9%
U6 529,992 20.4%
Unknown 246,802 9.5%
Total 2,595,836 100.0%
DNV GL © 2018 12 October 2018
Theft from PC2 sites (Issue 14)
▪ Method as presented at the AUG Technical Workgroup meeting
▪ Same as used in previous years for PC4
– Split of Smart and traditional meters
▪ Will be applied when asset data analysis is carried out
– This is done a number of times throughout the year
– When new data received – latest estimates
9
DNV GL © 2018 12 October 2018
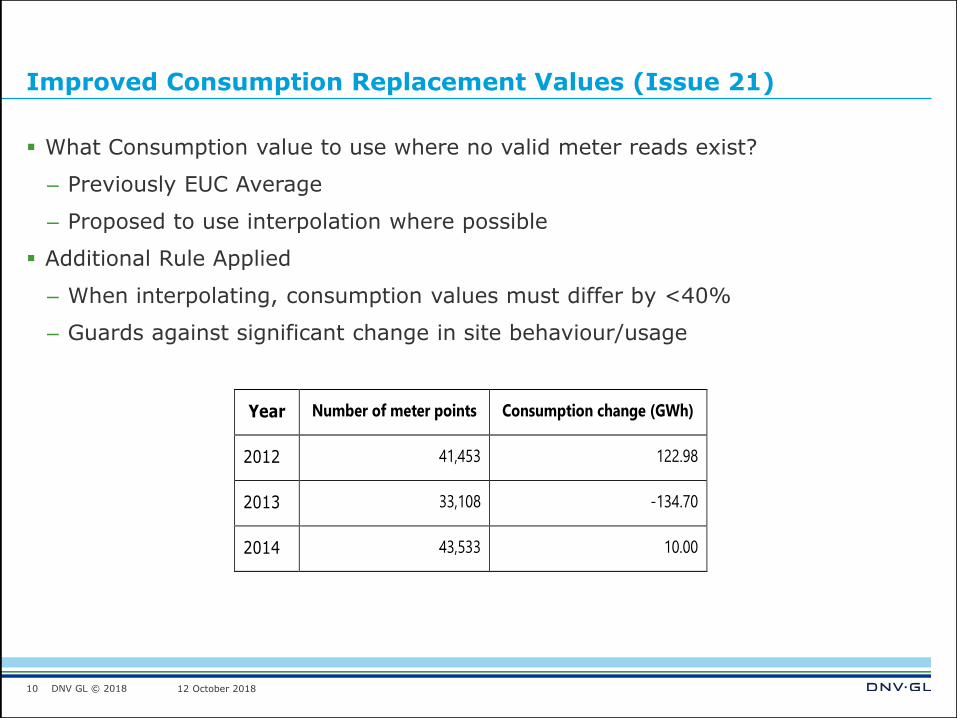
Improved Consumption Replacement Values (Issue 21)
▪ What Consumption value to use where no valid meter reads exist?
– Previously EUC Average
– Proposed to use interpolation where possible
▪ Additional Rule Applied
– When interpolating, consumption values must differ by <40%
– Guards against significant change in site behaviour/usage
10
Year Number of meter points Consumption change (GWh)
2012 41,453 122.98
2013 33,108 -134.70
2014 43,533 10.00
DNV GL © 2018 12 October 2018
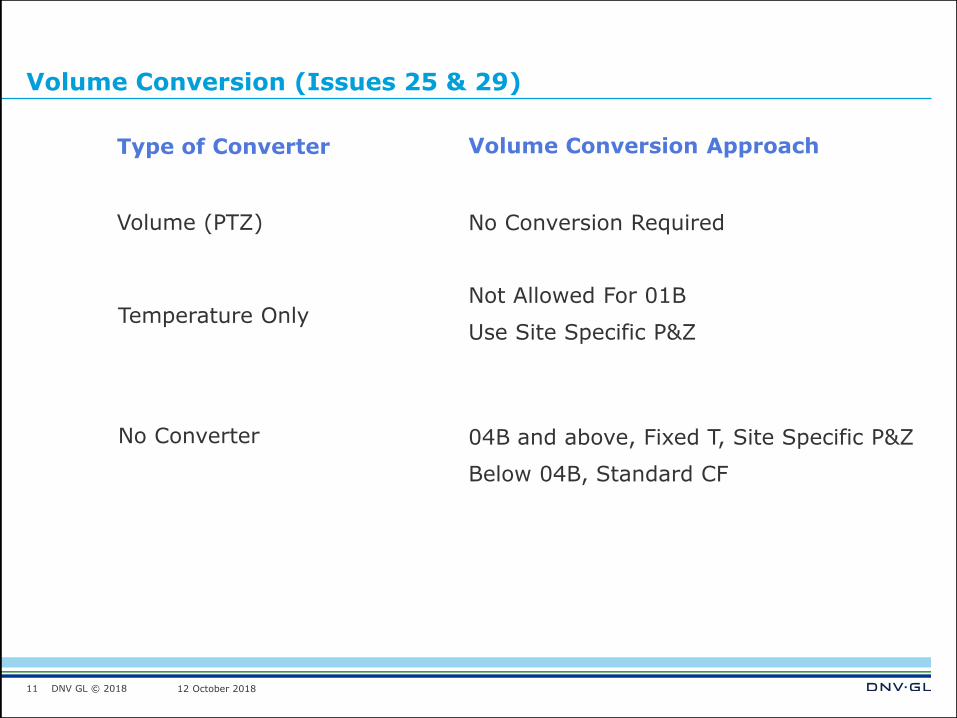
Volume Conversion (Issues 25 & 29)
11
Type of Converter Volume Conversion Approach
Volume (PTZ) No Conversion Required
Temperature OnlyNot Allowed For 01B
Use Site Specific P&Z
No Converter 04B and above, Fixed T, Site Specific P&Z
Below 04B, Standard CF

DNV GL © 2018 12 October 2018
Volume Conversion (Issues 25 & 29)
▪ Relies on accurate Pressure, Temperature & CV
▪ AUGE calculates factors based on Seasonal Normal Weather
12
𝑉𝐶𝐹 =𝑃𝑚𝑃𝑏
×𝑇𝑏𝑇𝑚
×𝑍𝑏𝑍𝑚
𝐸𝑛𝑒𝑟𝑔𝑦 = 𝑉𝑚 × 𝑉𝐶𝐹 × 𝐸𝐶𝐹
𝐶𝐹𝑝𝑟𝑒𝑠𝑠 =𝑃𝑚𝑃𝑏
=𝑃𝑚𝑠𝑙 + 𝑃𝑚𝑒𝑡𝑒𝑟 − 𝐴𝑚𝑒𝑡𝑒𝑟 × 𝐴𝐶𝐹
𝑃𝑏
𝑍𝑏𝑍𝑚
≅ 1 < 2𝑏𝑎𝑟
𝐶𝐹𝑡𝑒𝑚𝑝 =𝑇𝑏𝑇𝑚
=273.15 + 15
273.15 + 𝑇𝑚𝑒𝑡𝑒𝑟
DNV GL © 2018 12 October 2018
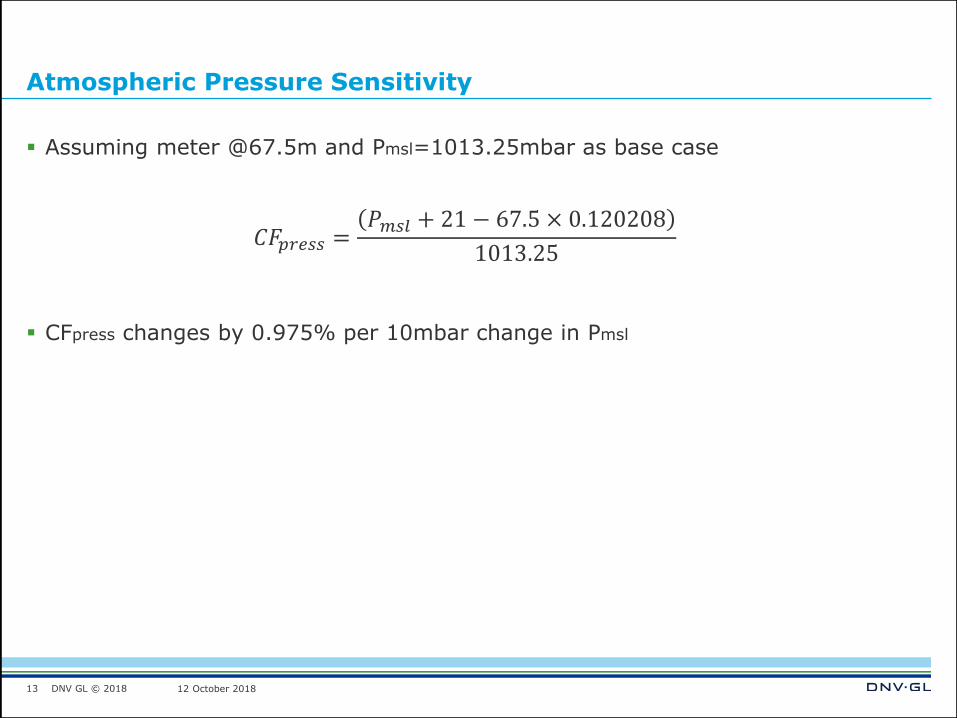
Atmospheric Pressure Sensitivity
▪ Assuming meter @67.5m and Pmsl=1013.25mbar as base case
▪ CFpress changes by 0.975% per 10mbar change in Pmsl
13
𝐶𝐹𝑝𝑟𝑒𝑠𝑠 =𝑃𝑚𝑠𝑙 + 21 − 67.5 × 0.120208
1013.25
DNV GL © 2018 12 October 2018
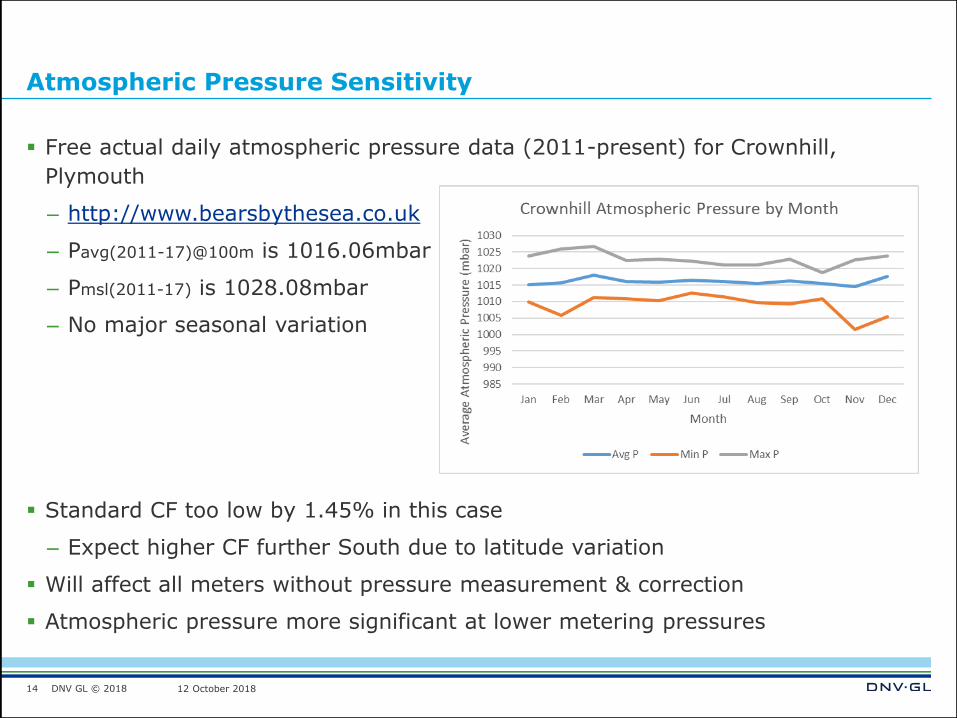
Atmospheric Pressure Sensitivity
▪ Free actual daily atmospheric pressure data (2011-present) for Crownhill,
Plymouth
– http://www.bearsbythesea.co.uk
– Pavg(2011-17)@100m is 1016.06mbar
– Pmsl(2011-17) is 1028.08mbar
– No major seasonal variation
▪ Standard CF too low by 1.45% in this case
– Expect higher CF further South due to latitude variation
▪ Will affect all meters without pressure measurement & correction
▪ Atmospheric pressure more significant at lower metering pressures
14

DNV GL © 2018 12 October 2018
Altitude Sensitivity (Pressure)
▪ Assuming meter @67.5m and Pmsl=1013.25mbar as base case
▪ CFpress changes by 0.117% per 10m change in altitude (A)
15
𝐶𝐹𝑝𝑟𝑒𝑠𝑠 =1013.25 + 21 − A × 0.120208
1013.25
DNV GL © 2018 12 October 2018
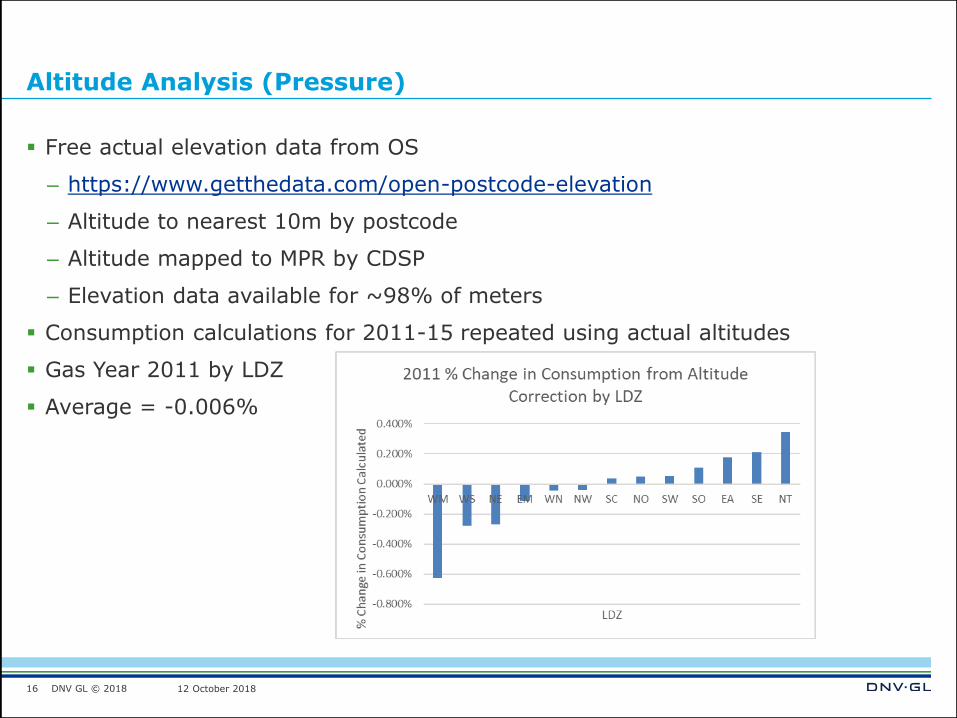
Altitude Analysis (Pressure)
▪ Free actual elevation data from OS
– https://www.getthedata.com/open-postcode-elevation
– Altitude to nearest 10m by postcode
– Altitude mapped to MPR by CDSP
– Elevation data available for ~98% of meters
▪ Consumption calculations for 2011-15 repeated using actual altitudes
▪ Gas Year 2011 by LDZ
▪ Average = -0.006%
16
DNV GL © 2018 12 October 2018
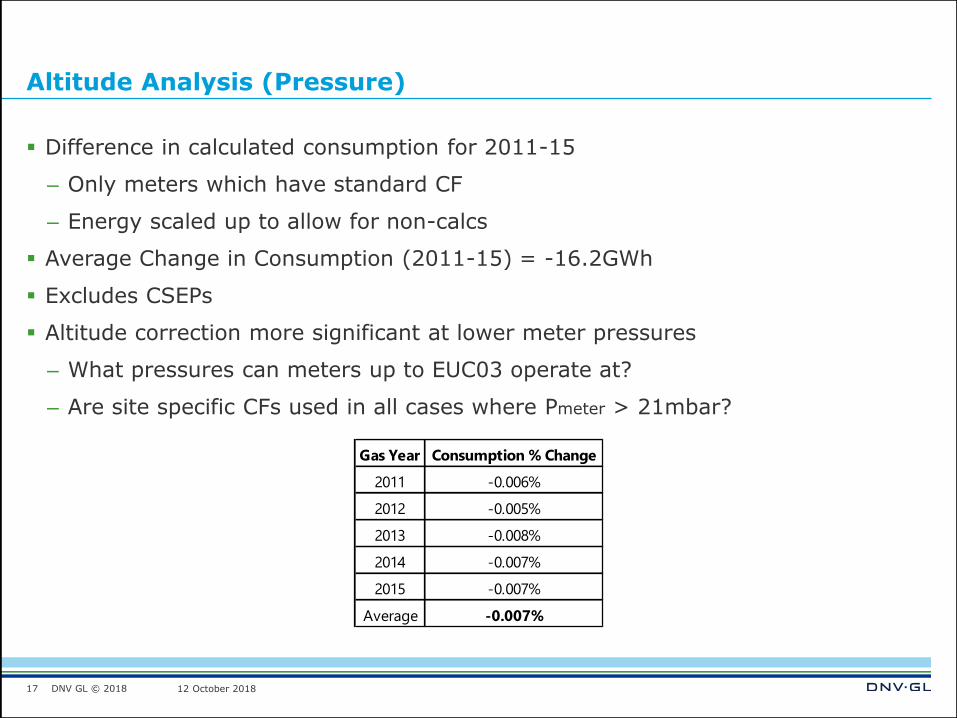
Altitude Analysis (Pressure)
▪ Difference in calculated consumption for 2011-15
– Only meters which have standard CF
– Energy scaled up to allow for non-calcs
▪ Average Change in Consumption (2011-15) = -16.2GWh
▪ Excludes CSEPs
▪ Altitude correction more significant at lower meter pressures
– What pressures can meters up to EUC03 operate at?
– Are site specific CFs used in all cases where Pmeter > 21mbar?
17
Gas Year Consumption % Change
2011 -0.006%
2012 -0.005%
2013 -0.008%
2014 -0.007%
2015 -0.007%
Average -0.007%
DNV GL © 2018 12 October 2018
Altitude Analysis (Temperature)
▪ GTER only include an adjustment for pressure variation with altitude
▪ Temperature also varies with altitude
– T decreases by ~0.65C per 100m
– CFtemp changes by ~0.023% per 10m change in Altitude (A)
– Change due to temperature is about 5x smaller than pressure but in opposite
direction
18
DNV GL © 2018 12 October 2018
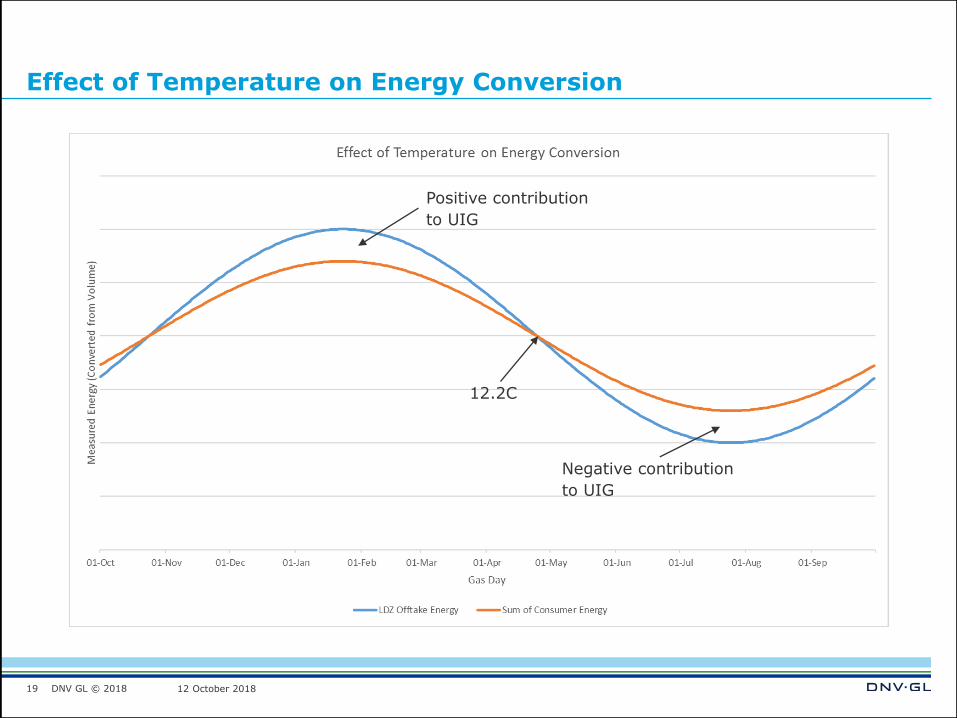
Effect of Temperature on Energy Conversion
19
12.2C
Positive contribution
to UIG
Negative contribution
to UIG
DNV GL © 2018 12 October 2018
Temperature Sensitivity
▪ CFtemp changes by 0.35% per 1°C change in Temperature
▪ Considerations
– CFtemp will depend on local weather conditions
– CFtemp will have a seasonal variation
– CFtemp will depend on meter location
– Affects meters without temperature measurement and conversion
▪ No robust source of meter temperature information
– Assumed average temperature of 12.2°C based on sample of real meter
temperatures
– No information on how 12.2°C derived
▪ Performed some “what if?” scenarios based on available temperature data and
some simple assumptions to get ROM estimate of effect
– Using NDM Allocations only
20
DNV GL © 2018 12 October 2018
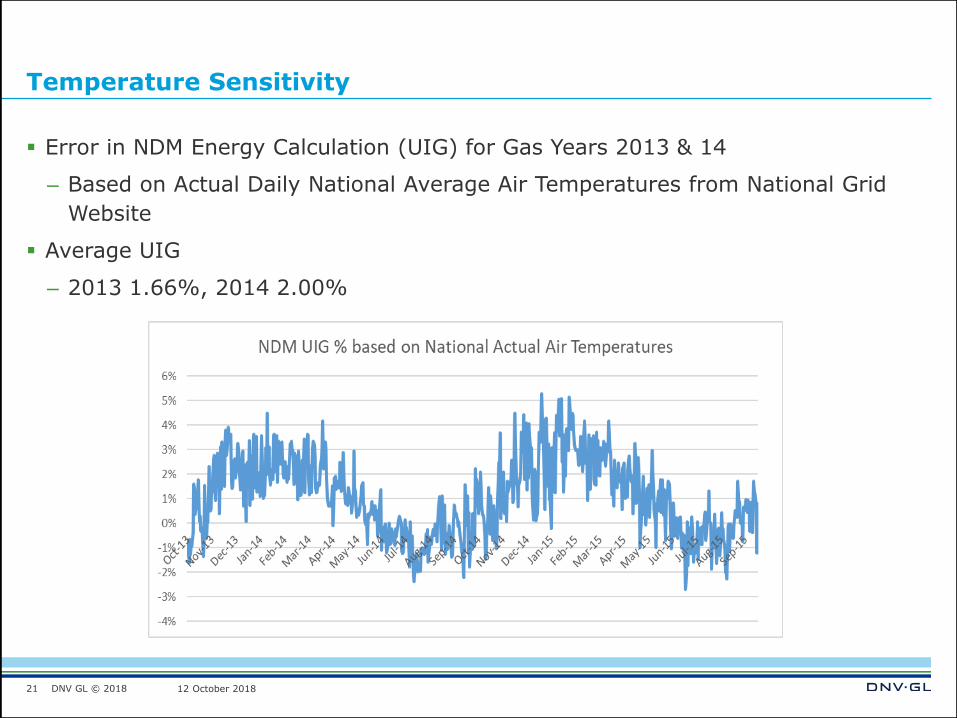
Temperature Sensitivity
▪ Error in NDM Energy Calculation (UIG) for Gas Years 2013 & 14
– Based on Actual Daily National Average Air Temperatures from National Grid
Website
▪ Average UIG
– 2013 1.66%, 2014 2.00%
21

DNV GL © 2018 12 October 2018
Meter Location
▪ Meter Location Information available for ~77% of Meters
▪ Divided into 3 categories
– Sheltered refers to location in an unheated space e.g. garage or cellar
22
DNV GL © 2018 12 October 2018
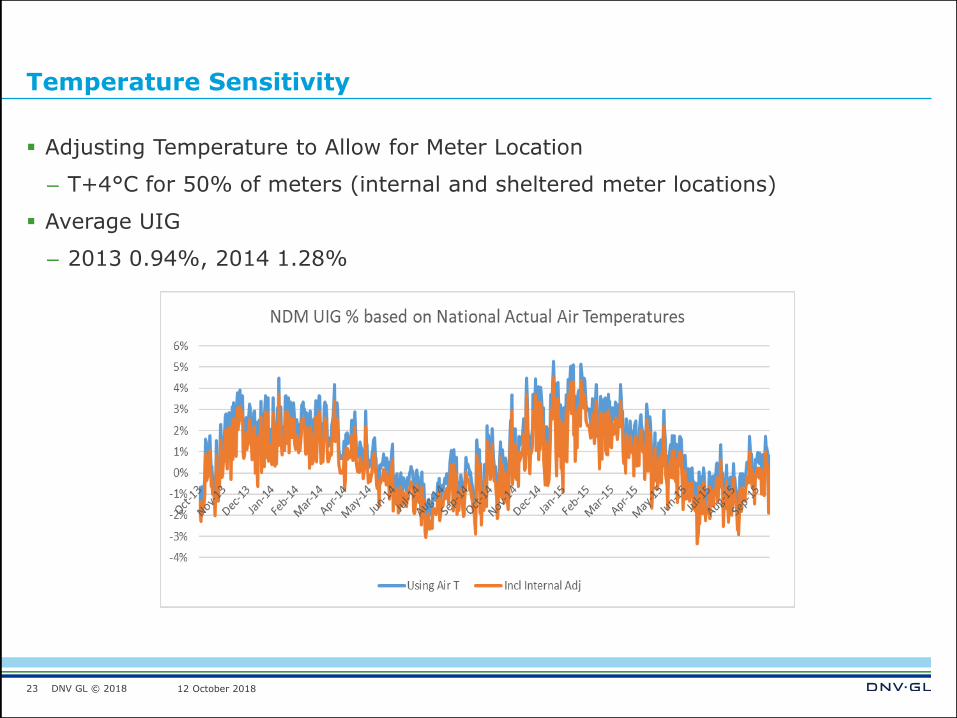
Temperature Sensitivity
▪ Adjusting Temperature to Allow for Meter Location
– T+4°C for 50% of meters (internal and sheltered meter locations)
▪ Average UIG
– 2013 0.94%, 2014 1.28%
23
DNV GL © 2018 12 October 2018
Temperature Sensitivity
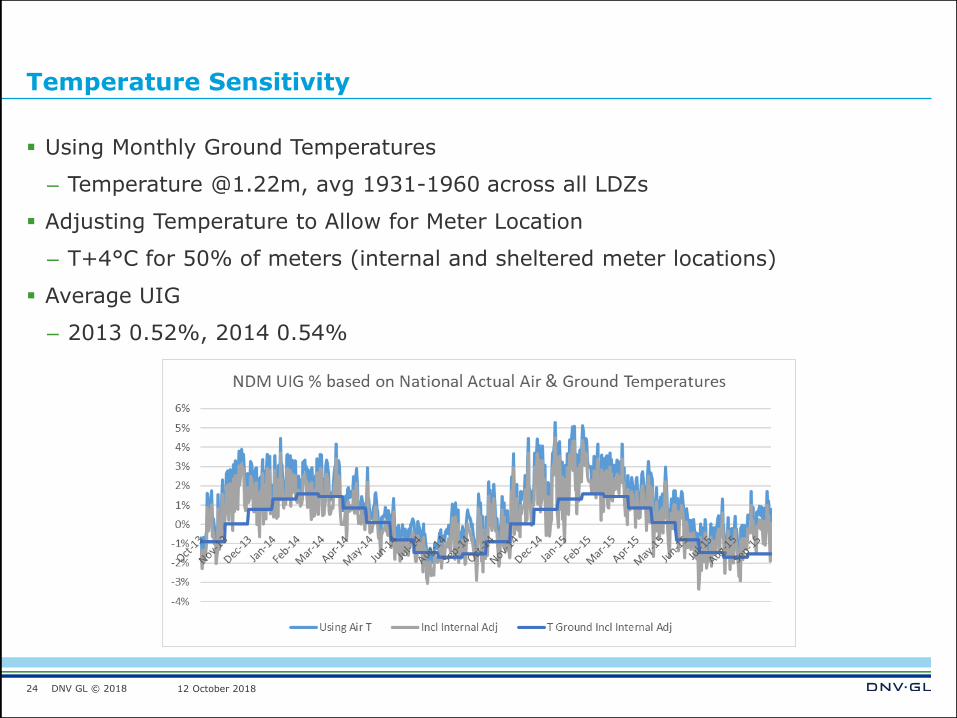
▪ Using Monthly Ground Temperatures
– Temperature @1.22m, avg 1931-1960 across all LDZs
▪ Adjusting Temperature to Allow for Meter Location
– T+4°C for 50% of meters (internal and sheltered meter locations)
▪ Average UIG
– 2013 0.52%, 2014 0.54%
24
DNV GL © 2018 12 October 2018
Average Temperature Comparisons - Summary
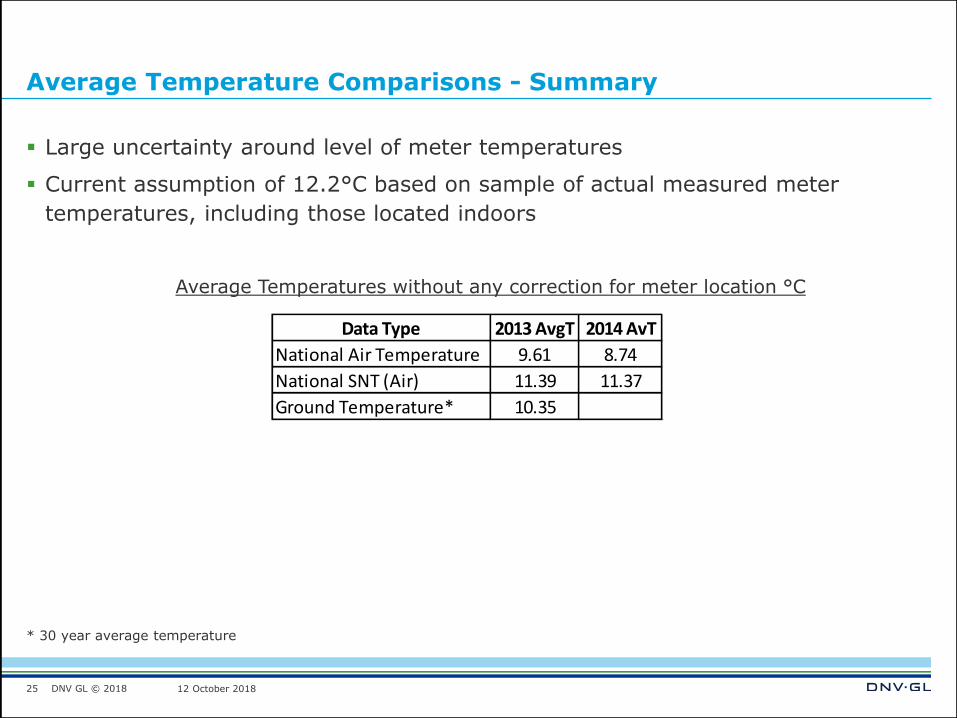
▪ Large uncertainty around level of meter temperatures
▪ Current assumption of 12.2°C based on sample of actual measured meter
temperatures, including those located indoors
25
Data Type 2013 AvgT 2014 AvT
National Air Temperature 9.61 8.74
National SNT (Air) 11.39 11.37
Ground Temperature* 10.35
* 30 year average temperature
Average Temperatures without any correction for meter location °C

DNV GL © 2018 12 October 2018
Average Temperature Comparisons - Summary
▪ Meter location adjustment required when calculating meter temperature
– Gas temperature is significantly higher for meters located indoors
26
Temperature of Service Line
(Black)
Temperature of Room
(Green)Temperature of Gas in
Meter
(Red)
Taken from “Misreading of Conventional Diaphragm Domestic Gas Meter”, Rene Hermkens, KIWA Technology, 2012
DNV GL © 2018 12 October 2018
LDZ Temperature Variation
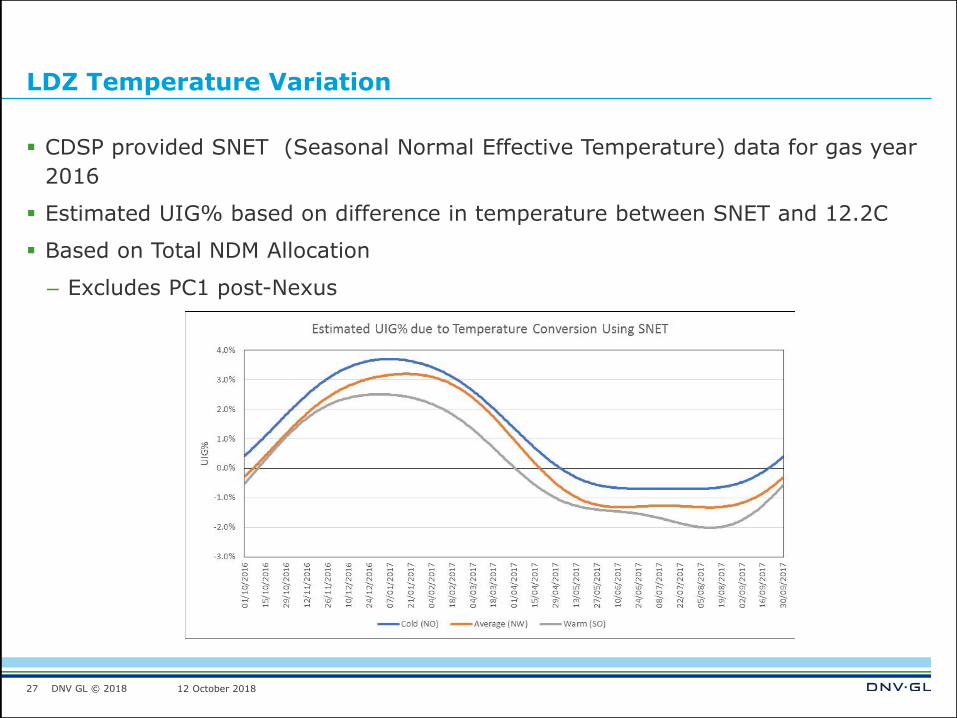
▪ CDSP provided SNET (Seasonal Normal Effective Temperature) data for gas year
2016
▪ Estimated UIG% based on difference in temperature between SNET and 12.2C
▪ Based on Total NDM Allocation
– Excludes PC1 post-Nexus
27
DNV GL © 2018 12 October 2018
LDZ Temperature Variation
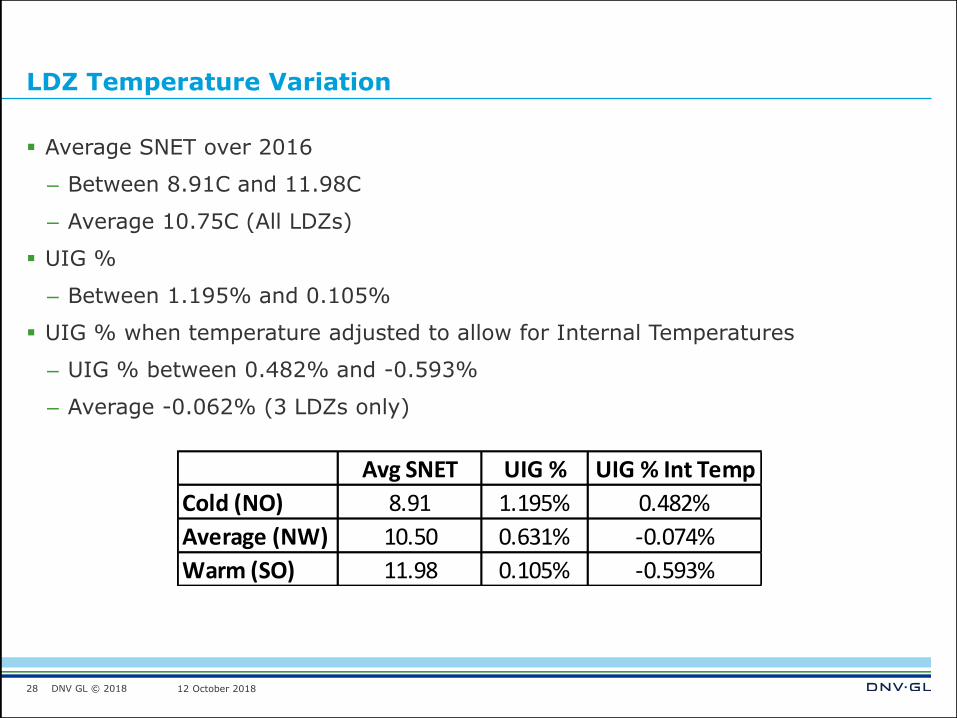
▪ Average SNET over 2016
– Between 8.91C and 11.98C
– Average 10.75C (All LDZs)
▪ UIG %
– Between 1.195% and 0.105%
▪ UIG % when temperature adjusted to allow for Internal Temperatures
– UIG % between 0.482% and -0.593%
– Average -0.062% (3 LDZs only)
28
Avg SNET UIG % UIG % Int Temp
Cold (NO) 8.91 1.195% 0.482%
Average (NW) 10.50 0.631% -0.074%
Warm (SO) 11.98 0.105% -0.593%
DNV GL © 2018 12 October 2018
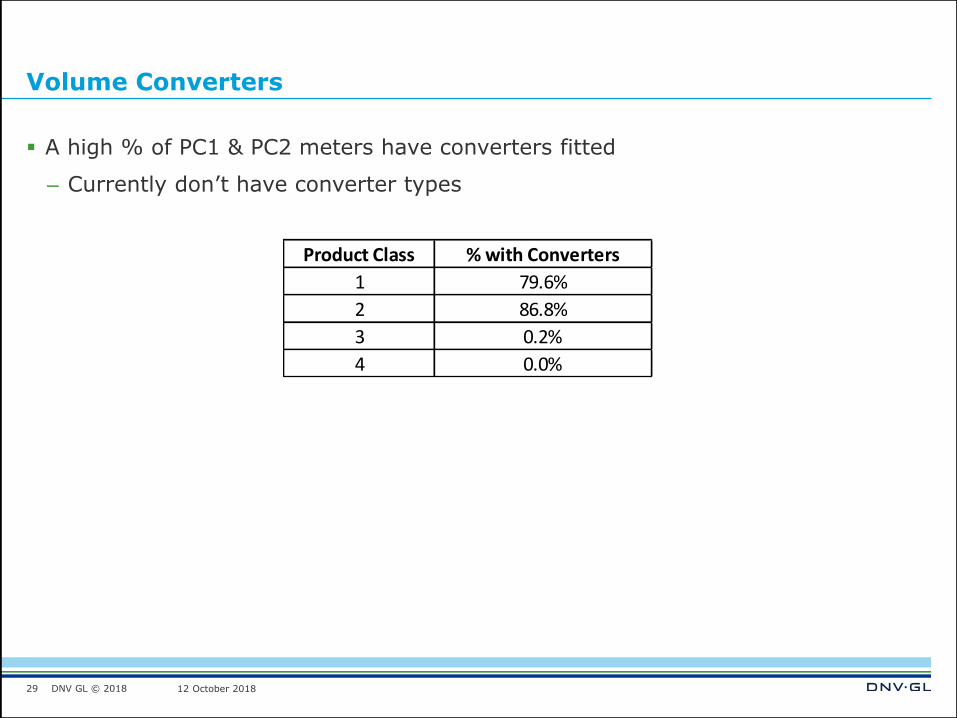
Volume Converters
▪ A high % of PC1 & PC2 meters have converters fitted
– Currently don’t have converter types
29
Product Class % with Converters
1 79.6%
2 86.8%
3 0.2%
4 0.0%
DNV GL © 2018 12 October 2018
Key Data
▪ Information to support assumptions regarding Meter temperatures
– “Summary Report for Domestic Gas Temperature Survey for Shippers”, 2000
– “The derivation of LDZ gas temperatures for the period 1996-2000”
▪ Information on presence of volume converters
– IGEM/GM/5 provides guidance on where volume conversions systems should be
used
– Usual practice to install PTZ converters above 2.93GWh/annum
– Details now received from CDSP
▪ Sample of actual meter temperatures
– Is this data available from existing conversion systems?
– Collect new data from sample of meters
– Could temperature be measured and collected from NDM sample sites?
30
DNV GL © 2018 12 October 2018
Proposed Methodology Update
▪ Additional Directly Calculated UG Component from Volume Conversion
– Can only be estimated with reliable meter temperature information
▪ UG from Volume Conversion will be split based on throughput
– Only for relevant meters
31

DNV GL © 2018 12 October 2018
Incorrect Site Specific CF (Issue 26)
▪ Updated meter asset data was received in September
▪ Initial analysis shows that there are still a small number of sites with suspicious
correction factors
– E.g. 0.02264
▪ The number appears to be very small, but the AUGE proposes to update the
calculation methodology to revert to using the standard correction factor when
the value in the asset data lies outside of a sensible range.
– Range boundaries – to be determined and will depend on meter pressure
information
32
DNV GL © 2018 12 October 2018
Standard CF for 04B and Above (Issue 27)
▪ Initial analysis of the latest meter asset data set shows approx. 10% are using
the standard correction factor.
▪ The average site specific correction factor is approx. 1.0453 which is 2% higher
than the standard factor.
▪ This suggests a potential impact of around 100GWh.
33
DNV GL © 2018 12 October 2018
Accuracy of Volume Converters (Issue 28)
▪ Standards
– IGEM/GM/5 Edition 3 “Electronic gas volume conversion systems”
– BS EN 12405: 2002 “Gas-volume electronic conversion devices”
– Pressure +/-0.5%, Temperature +/-2C
– Transco T/SP/PRS/26, “Specification for Gas-Volume Electronic Conversion
Devices”, August 2004
▪ Possible error due to incorrect config – sample data?
▪ National Grid policy T/PL/ME/16 “Policy for the Removal/Replacement of Obsolete
Volume Conversion Devices”
– Metering policy identifies obsolete converters
▪ Any reports from monitoring, validation?
34
DNV GL © 2018 12 October 2018
CV Inaccuracy (Issue30)
▪ Investigations ongoing, no results to present
35
DNV GL © 2018 12 October 2018
Movements Between Product Classes (Issue 31)
▪ The rate of movement between Product Classes is not constant over time
▪ Snapshots of Product Class populations over time
– Provided by Xoserve
– From Nexus go-live onwards
▪ Rate of change tracked over time
– Extrapolate to forecast year
▪ Used to derive best estimate of Product Class populations for forecast year
36

DNV GL © 2018 12 October 2018
Permanent UIG Post-Nexus (Issue 33)
▪ Analysis not started
– Post-Nexus data received
– Requested Pre-Nexus reconciliation data and simulated UIG
37
DNV GL © 2018 12 October 2018
New Issues Status
▪ Initial Analysis & Prioritisation Required
– UIG from Meter Change (Issue 35)
– Isolated Supply Points with Incrementing Reads (Issue 36)
– Discrepancies in Converted Reads (Issue 37)
38
DNV GL © 2018 12 October 2018
Industry Changes and Modifications
39
– 0654S Mandating the provision of NDM sample data
– 0658 CDSP to identify and develop improvements to LDZ settlement processes
– 0659S Improvements to the Composite Weather Variable
– 0664 Transfer of Sites with Low Read Submission Performance from Class 2 and
3 into Class 4
DNV GL © 2018 12 October 2018
Summary of Proposed Changes to Methodology
▪ Methodology Updates
– Alternative Replacement Values in Consumption Calculation
– Volume to Energy Conversion*
▪ Areas Under Investigation
– Theft
– Theft from PC2 Sites (ex DME/DMV)
– UG from Meter Change
– Incrementing Reads for Isolated Supply Point
– Discrepancies between Converted & Unconverted Meter Reads
40
* Methodology to be updated but change in factors subject to data availability
DNV GL © 2018 12 October 2018
Next Steps
▪ AUGE to publish draft AUG Statement – 1st Jan 2019
▪ Any Feedback?
41
DNV GL © 2018 12 October 2018
SAFER, SMARTER, GREENER
www.dnvgl.com
Thank you
42