audio-visual speech separation and dereverberation with a ... · audio-visual speech separation and...
TRANSCRIPT
1
Audio-Visual Speech Separation andDereverberation with a Two-Stage Multimodal
NetworkKe Tan, Yong Xu, Shi-Xiong Zhang, Meng Yu, and Dong Yu, Fellow, IEEE
Abstract—Background noise, interfering speech and roomreverberation frequently distort target speech in real listeningenvironments. In this study, we address joint speech separationand dereverberation, which aims to separate target speech frombackground noise, interfering speech and room reverberation. Inorder to tackle this fundamentally difficult problem, we proposea novel multimodal network that exploits both audio and visualsignals. The proposed network architecture adopts a two-stagestrategy, where a separation module is employed to attenuatebackground noise and interfering speech in the first stage anda dereverberation module to suppress room reverberation in thesecond stage. The two modules are first trained separately, andthen integrated for joint training, which is based on a new multi-objective loss function. Our experimental results show that theproposed multimodal network yields consistently better objectiveintelligibility and perceptual quality than several one-stage andtwo-stage baselines. We find that our network achieves a 21.10%improvement in ESTOI and a 0.79 improvement in PESQ overthe unprocessed mixtures. Moreover, our network architecturedoes not require the knowledge of the number of speakers.
Index Terms—Audio-visual, multimodal, speech separation anddereverberation, far-field, two-stage, deep learning.
I. INTRODUCTION
IN AN acoustic environment like a cocktail party, the humanauditory system is remarkably capable of following a single
target speech source in the presence of interfering speakers,background noise and room reverberation. Speech separation,also commonly known as the cocktail party problem, is thetask of separating target speech from background interfer-ence [6], [45]. Both interfering sounds from other sources andreverberation from surface reflections corrupt target speech,which can severely degrade speech intelligibility for humanlisteners, as well as the performance of computing systemsfor speech processing. Numerous research efforts have beenmade to improve the performance of speech separation fordecades. Inspired by the concept of time-frequency (T-F)masking in computational auditory scene analysis (CASA),speech separation has been recently formulated as supervisedlearning, where discriminative patterns within target speech orbackground interference are learned from training data [44].
K. Tan is with the Department of Computer Science and Engineer-ing, The Ohio State University, Columbus, OH, 43210-1277 USA (e-mail:[email protected]). This work was performed when K. Tan was an intern atTencent AI Lab, Bellevue, WA, USA.
Y. Xu, S.-X. Zhang, M. Yu and D. Yu are with Tencent AI Lab, Belle-vue, WA, USA (e-mails: [email protected], [email protected],[email protected], [email protected]).
Thanks to the use of deep learning, the performance of super-vised speech separation has been substantially elevated in thelast decade [49], [45]. Producing high-quality separated speechin adverse acoustic environments, however, still remains achallenging problem.
Speaker separation has attracted considerable research at-tention in the last several years, of which the goal isto extract multiple speech sources, one for each speaker.Speaker-independent speech separation, where none of thespeakers are required to be the same between training andtesting, is susceptible to the label ambiguity (or permuta-tion) problem [51], [14]. Notable approaches to speaker-independent speech separation include deep clustering [14]and permutation-invariant training (PIT) [57], which addressthe label ambiguity from different angles. Deep clusteringtreats speaker separation as spectral clustering, while PIT usesa dynamically calculated loss function for training. Many re-cent studies have extended these two approaches. For example,a dilated convolutional neural network (CNN) named TasNetis employed to perform time-domain speech separation in [27],where utterance-level PIT [24] is applied during training.An alternative way to resolve the label ambiguity is to usespeaker-discriminative acoustic cues of the target speaker asan auxiliary input for separation. In a recent study [46], apre-recorded short utterance from the target speaker is usedas an anchor for attentional control, which selects the targetspeaker to be separated. Analogously, a speaker-discriminativeembedding is produced by a speaker recognition network froma reference signal of the target speaker in [48]. The embeddingvector, along with the spectrogram of the noisy mixture, is thenfed into the separation network. A potential advantage of suchapproaches is that the knowledge of the number of speakersis not required.
Visual cues such as facial movements or lip movements ofa speaker can supplement the information from the speaker’svoice and thus facilitate speech perception, particularly innoisy environments [28], [29], [38]. Motivated by this finding,various algorithms have been developed to combine audio andvisual signals to perform speech separation in a multimodalmanner [36]. There is recent interest in using deep neuralnetworks (DNNs) to achieve this goal. Hou et al. [17] designedan audio-visual speech enhancement framework based onmulti-task learning. Their experimental results show that theaudio-visual enhancement framework consistently outperformsthe same architecture without visual inputs. A similar model isdeveloped in [9], where a CNN is trained to directly estimate
arX
iv:1
909.
0735
2v4
[ee
ss.A
S] 1
0 A
pr 2
020
2
the magnitude spectrogram of clean speech from noisy speechand the input video. Moreover, Gabbay et al. [8] employs avideo-to-speech method to synthesize speech, which is sub-sequently used to construct T-F masks for speech separation.Other related studies include [16], [54], [21].
Although the aforementioned deep learning based audio-visual approaches considerably elevate the separation per-formance over traditional audio-visual approaches, they donot address speaker generalization, which is a crucial issuein supervised speech separation. In other words, they havebeen only evaluated in a speaker-dependent way, in whichthe speakers are not allowed to change from training totesting. Recent studies [7], [1], [33], [30], [53] have developedalgorithms for speaker-independent speech separation. Ephratet al. [7] designed a multi-stream neural network based ondilated convolutions and bidirectional long short-term memory(BLSTM), which leads to significantly better performance thanseveral earlier speaker-dependent models. Afouras et al. [1]utilize two subnetworks to predict the magnitude spectrogramand the phase spectrogram of clean speech, respectively.In [33], a DNN is trained to predict whether audio and visualstreams are temporally synchronized, which is then used toproduce multisensory features for speech separation. Wu etal. [53] developed a time-domain audio-visual model for targetspeaker separation. Note that these studies address monauralspeech separation in close-talk scenarios.
In a real-world acoustic environment, speech signalsare usually distorted by reverberation from surface re-flections. Dereverberation has been actively studied fordecades [3], [32], [31], [11]. Although deep learning basedapproaches have significantly improved dereverberation per-formance in recent years [10], [52], [55], [58], reverberationremains a well-recognized challenge, especially when it iscombined with background noise, interfering speech, or both.Despite the promising progress on audio-visual speech sepa-ration, few of recent studies deal with both speech separationand dereverberation in a multimodal way. Given the impor-tance of separation and dereverberation to both human andmachine listeners (e.g. automatic speech recognition) in noisyand reverberant environments, we address speaker-independentmulti-channel speech separation and dereverberation in thisstudy, which aims to separate target speech from interferingspeech, background noise and room reverberation. Inspiredby recent works [22], [42], [58] on speech separation, webelieve that it is likely more effective to address separationand dereverberation in separate stages due to their intrinsicaldifferences. Hence, we first separate target reverberant speechfrom interfering speech and background noise using a dilatedCNN, and then employ a BLSTM to dereverberate the sep-arated speech signal. Subsequently, the two-stage model isjointly trained to optimize a new multi-objective loss function,which combines a mean squared error (MSE) loss in the T-F domain and a scale-invariant signal-to-noise ratio (SI-SNR)loss in the time domain. Our experimental results show thatthe proposed multimodal network improves extended short-time objective intelligibility (ESTOI) [20] by 21.10% andperceptual evaluation of speech quality (PESQ) [37] by 0.79over the unprocessed mixtures. Moreover, we find that the
0.01 m
0.02 m
0.03 m
0.04 m
0 1 2 3 4 5 6 7 8
Microphone Array
180°Wide-Angle Camera
Target Source
Interfering Source 2
Interfering Source 1
0° 180°
(a)
0°180°
InterferingSource 1
Target Source
Interfering Source 2
Image Captured by the 180°Wide-Angle Camera
LW
DOA = L / W × 180°
(b)
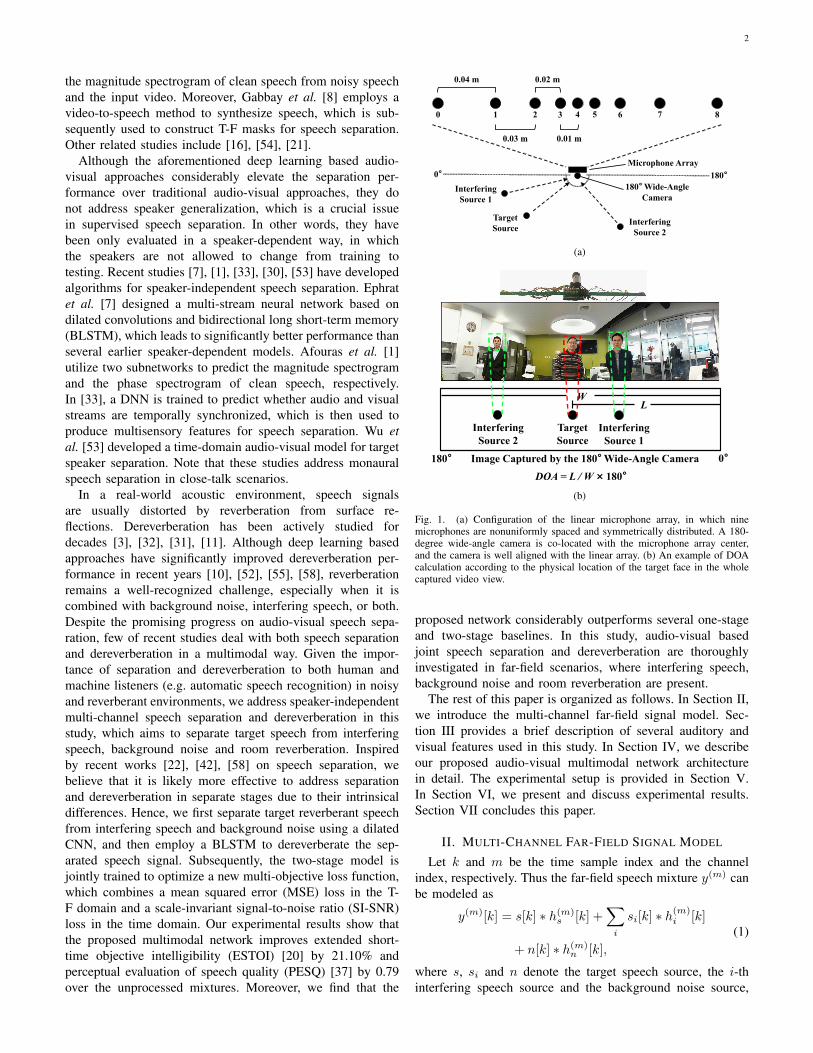
Fig. 1. (a) Configuration of the linear microphone array, in which ninemicrophones are nonuniformly spaced and symmetrically distributed. A 180-degree wide-angle camera is co-located with the microphone array center,and the camera is well aligned with the linear array. (b) An example of DOAcalculation according to the physical location of the target face in the wholecaptured video view.
proposed network considerably outperforms several one-stageand two-stage baselines. In this study, audio-visual basedjoint speech separation and dereverberation are thoroughlyinvestigated in far-field scenarios, where interfering speech,background noise and room reverberation are present.
The rest of this paper is organized as follows. In Section II,we introduce the multi-channel far-field signal model. Sec-tion III provides a brief description of several auditory andvisual features used in this study. In Section IV, we describeour proposed audio-visual multimodal network architecturein detail. The experimental setup is provided in Section V.In Section VI, we present and discuss experimental results.Section VII concludes this paper.
II. MULTI-CHANNEL FAR-FIELD SIGNAL MODEL
Let k and m be the time sample index and the channelindex, respectively. Thus the far-field speech mixture y(m) canbe modeled as
y(m)[k] = s[k] ∗ h(m)s [k] +
∑i
si[k] ∗ h(m)i [k]
+ n[k] ∗ h(m)n [k],
(1)
where s, si and n denote the target speech source, the i-thinterfering speech source and the background noise source,

3
respectively, and hs, hi and hn the room impulse responses(RIRs) corresponding to the target speech source, the i-thinterfering speech source and the background noise source,respectively. The convolution operation is represented by ∗.The objective of this study is to estimate the anechoic targetspeech signal from the M -channel far-field speech mixturey =
[y(1), y(2), . . . , y(M)
], as well as the visual streams of the
target and interfering speakers’ lip images. In this study, weuse a linear array of nine microphones as depicted in Fig. 1(a).We number the nine microphones from left to right as 0, 1,. . . , 8, respectively. Without loss of generality, we treat theclean speech signal picked up by microphone 0 as the targetsignal.
III. AUDITORY AND VISUAL FEATURES
In this study, we assume that all signals are sampled at16 kHz. A 32-ms square-root Hann window is employed tosegment a speech signal into a set of time frames, with a50% overlap between adjacent frames. We resample the visualstreams of face images from all videos to 25 frames-per-second(FPS), where face detection is performed using the tools in thedlib library1. From these preprocessed data, we extract threeauditory features and a visual feature for multimodal speechseparation and dereverberation.
A. Log-Power Spectrum
The log-power spectrum (LPS) of the noisy mixture re-ceived by microphone 0, which is a standard spectral rep-resentation, is computed on a 512-point short-time Fouriertransform (STFT), leading to 257-dimensional (257-D) LPSfeatures. An example of LPS features is shown in Fig. 2(a).
B. Interchannel Phase Difference
The interchannel phase difference (IPD) is an informativespatial cue which can reflect subtle changes in the direction-of-arrival (DOA) of a sound source. Given a pair of channelsm1 and m2, the IPD is defined as
φt,f = ∠Y (m2)t,f − ∠Y (m1)
t,f , (2)
where Y(m1)t,f and Y
(m2)t,f are the STFT values of the noisy
mixture in the T-F unit at time frame t and frequency bin f .In this study, we exploit the cosine value of the interchannelphase difference (cosIPD), i.e.
cosφt,f = cos(∠Y (m2)
t,f − ∠Y (m1)t,f
). (3)
Specifically, we concatenate the cosIPDs between five pairsof channels, i.e. (0, 8), (0, 4), (1, 4), (4, 6) and (4, 5),corresponding to five different microphone distances (seeFig. 1(a) for the microphone numbering). The IPD and cosIPDfeatures are illustrated in Figs. 2(b) and 2(c), respectively.
1http://dlib.net
0.0 1.2 2.4 3.6 4.8Time (s)
0
2
4
6
8
Freq
uenc
y (k
Hz)
6.5
6.0
5.5
5.0
4.5
4.0
3.5
3.0
(a) LPS
0.0 1.2 2.4 3.6 4.8Time (s)
0
2
4
6
8
Freq
uenc
y (k
Hz)
3
2
1
0
1
2
3
(b) IPD (wrapped into [−π, π])
0.0 1.2 2.4 3.6 4.8Time (s)
0
2
4
6
8
Freq
uenc
y (k
Hz)
1.0
0.5
0.0
0.5
1.0
(c) cosIPD
Fig. 2. (Color Online). Illustration of LPS, IPD and cosIPD features.
C. Angle Features
We derive an angle feature (AF) for the target speaker,which was first developed in [5]:
At,f =
M−1∑m=0
〈e(m)f ,
Y(m)t,f
Y(0)t,f
〉
‖e(m)f ‖ · ‖Y
(m)t,f
Y(0)t,f
‖, (4)
where M represents the number of microphones and e(m)f
the steering vector coefficient for the target speaker’s DOA atchannel m and frequency bin f . The inner product is denotedby 〈·, ·〉, and the vector norm by ‖·‖. Note that both e
(m)f
and Y(m)t,f /Y
(0)t,f are complex-valued, and they are treated as
2-D vectors in the operations 〈·, ·〉 and ‖·‖, where their realand imaginary parts are regarded as two vector components.The steering vector is calculated based on the geometry of themicrophone array and the arrival direction of the target speechsignal, which can be obtained by tracking the target speaker’sface from a video captured by a 180-degree wide-angle camerathat is co-located with the microphone array center, as shown
4
AFcosIPDLPS
1DConv,K=1
1DConv,K=1
3DResNet
3DResNet
3DResNet
Averaging
1DConvBlock
1DConvBlock
Upsampleto62.5FPS
1DConv,K=1
BLSTM
NoisyMagnitude(Channel0)
NoisyPhase(Channel0)
iSTFT
iSTFT
ReverberantTargetSpeech(Channel0)
SI-SNRLoss
AnechoicTargetSpeech
(Channel0)
CleanMagnitude(Channel0)
MSELoss
AudioStream
TargetSpeaker
InterferingSpeaker1
InterferingSpeakerN
……
EstimatedSpeech
SeparationStage
DereverberationStage
Dilated1DConvBlock,
r=1
…
Dilated1DConvBlockRepeat
ThreeRepeatsofDilated1DConvBlocks
SharedDilated1DConvBlock,
r=2
Dilated1DConvBlock,
r=64
Dilated1DConvBlock,
r=128
InferenceTraining
VisualStreams
SharedWeights
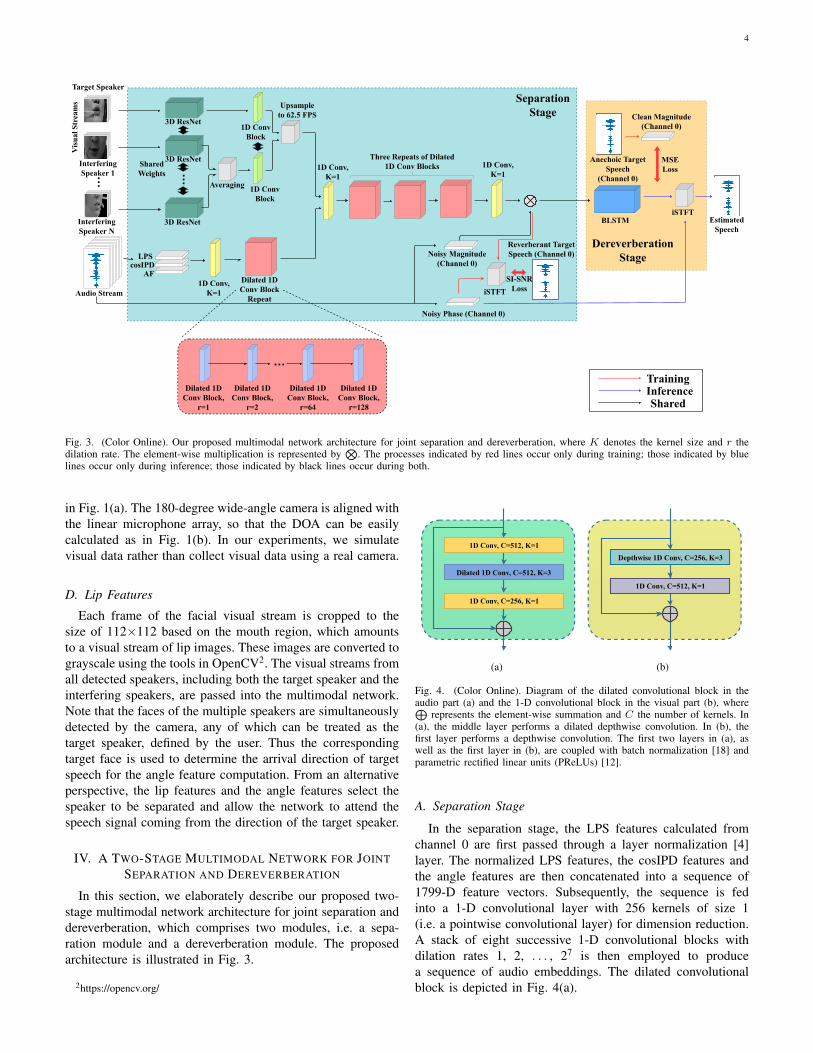
Fig. 3. (Color Online). Our proposed multimodal network architecture for joint separation and dereverberation, where K denotes the kernel size and r thedilation rate. The element-wise multiplication is represented by
⊗. The processes indicated by red lines occur only during training; those indicated by blue
lines occur only during inference; those indicated by black lines occur during both.
in Fig. 1(a). The 180-degree wide-angle camera is aligned withthe linear microphone array, so that the DOA can be easilycalculated as in Fig. 1(b). In our experiments, we simulatevisual data rather than collect visual data using a real camera.
D. Lip Features
Each frame of the facial visual stream is cropped to thesize of 112×112 based on the mouth region, which amountsto a visual stream of lip images. These images are converted tograyscale using the tools in OpenCV2. The visual streams fromall detected speakers, including both the target speaker and theinterfering speakers, are passed into the multimodal network.Note that the faces of the multiple speakers are simultaneouslydetected by the camera, any of which can be treated as thetarget speaker, defined by the user. Thus the correspondingtarget face is used to determine the arrival direction of targetspeech for the angle feature computation. From an alternativeperspective, the lip features and the angle features select thespeaker to be separated and allow the network to attend thespeech signal coming from the direction of the target speaker.
IV. A TWO-STAGE MULTIMODAL NETWORK FOR JOINTSEPARATION AND DEREVERBERATION
In this section, we elaborately describe our proposed two-stage multimodal network architecture for joint separation anddereverberation, which comprises two modules, i.e. a sepa-ration module and a dereverberation module. The proposedarchitecture is illustrated in Fig. 3.
2https://opencv.org/
1DConv,C=512,K=1
Dilated1DConv,C=512,K=3
1DConv,C=256,K=1
(a)
Depthwise1DConv,C=256,K=3
1DConv,C=512,K=1
(b)
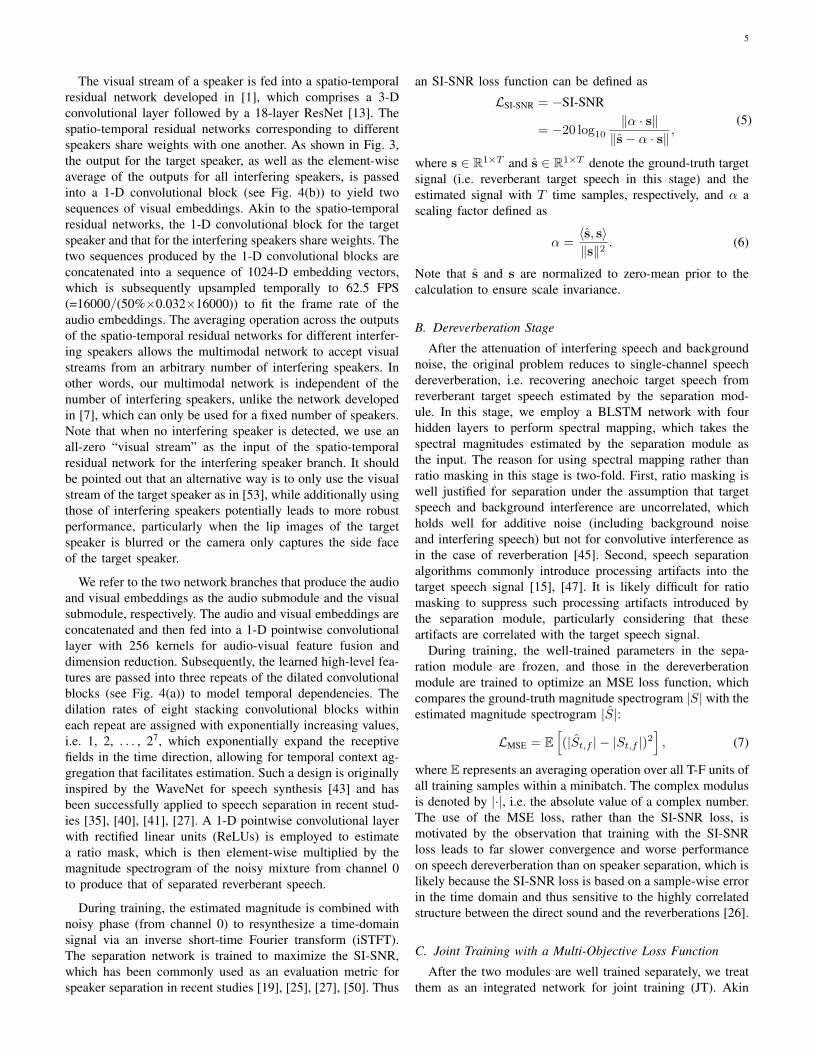
Fig. 4. (Color Online). Diagram of the dilated convolutional block in theaudio part (a) and the 1-D convolutional block in the visual part (b), where⊕
represents the element-wise summation and C the number of kernels. In(a), the middle layer performs a dilated depthwise convolution. In (b), thefirst layer performs a depthwise convolution. The first two layers in (a), aswell as the first layer in (b), are coupled with batch normalization [18] andparametric rectified linear units (PReLUs) [12].
A. Separation Stage
In the separation stage, the LPS features calculated fromchannel 0 are first passed through a layer normalization [4]layer. The normalized LPS features, the cosIPD features andthe angle features are then concatenated into a sequence of1799-D feature vectors. Subsequently, the sequence is fedinto a 1-D convolutional layer with 256 kernels of size 1(i.e. a pointwise convolutional layer) for dimension reduction.A stack of eight successive 1-D convolutional blocks withdilation rates 1, 2, . . . , 27 is then employed to producea sequence of audio embeddings. The dilated convolutionalblock is depicted in Fig. 4(a).
5
The visual stream of a speaker is fed into a spatio-temporalresidual network developed in [1], which comprises a 3-Dconvolutional layer followed by a 18-layer ResNet [13]. Thespatio-temporal residual networks corresponding to differentspeakers share weights with one another. As shown in Fig. 3,the output for the target speaker, as well as the element-wiseaverage of the outputs for all interfering speakers, is passedinto a 1-D convolutional block (see Fig. 4(b)) to yield twosequences of visual embeddings. Akin to the spatio-temporalresidual networks, the 1-D convolutional block for the targetspeaker and that for the interfering speakers share weights. Thetwo sequences produced by the 1-D convolutional blocks areconcatenated into a sequence of 1024-D embedding vectors,which is subsequently upsampled temporally to 62.5 FPS(=16000/(50%×0.032×16000)) to fit the frame rate of theaudio embeddings. The averaging operation across the outputsof the spatio-temporal residual networks for different interfer-ing speakers allows the multimodal network to accept visualstreams from an arbitrary number of interfering speakers. Inother words, our multimodal network is independent of thenumber of interfering speakers, unlike the network developedin [7], which can only be used for a fixed number of speakers.Note that when no interfering speaker is detected, we use anall-zero “visual stream” as the input of the spatio-temporalresidual network for the interfering speaker branch. It shouldbe pointed out that an alternative way is to only use the visualstream of the target speaker as in [53], while additionally usingthose of interfering speakers potentially leads to more robustperformance, particularly when the lip images of the targetspeaker is blurred or the camera only captures the side faceof the target speaker.
We refer to the two network branches that produce the audioand visual embeddings as the audio submodule and the visualsubmodule, respectively. The audio and visual embeddings areconcatenated and then fed into a 1-D pointwise convolutionallayer with 256 kernels for audio-visual feature fusion anddimension reduction. Subsequently, the learned high-level fea-tures are passed into three repeats of the dilated convolutionalblocks (see Fig. 4(a)) to model temporal dependencies. Thedilation rates of eight stacking convolutional blocks withineach repeat are assigned with exponentially increasing values,i.e. 1, 2, . . . , 27, which exponentially expand the receptivefields in the time direction, allowing for temporal context ag-gregation that facilitates estimation. Such a design is originallyinspired by the WaveNet for speech synthesis [43] and hasbeen successfully applied to speech separation in recent stud-ies [35], [40], [41], [27]. A 1-D pointwise convolutional layerwith rectified linear units (ReLUs) is employed to estimatea ratio mask, which is then element-wise multiplied by themagnitude spectrogram of the noisy mixture from channel 0to produce that of separated reverberant speech.
During training, the estimated magnitude is combined withnoisy phase (from channel 0) to resynthesize a time-domainsignal via an inverse short-time Fourier transform (iSTFT).The separation network is trained to maximize the SI-SNR,which has been commonly used as an evaluation metric forspeaker separation in recent studies [19], [25], [27], [50]. Thus
an SI-SNR loss function can be defined as
LSI-SNR = −SI-SNR
= −20 log10
‖α · s‖‖s− α · s‖
,(5)
where s ∈ R1×T and s ∈ R1×T denote the ground-truth targetsignal (i.e. reverberant target speech in this stage) and theestimated signal with T time samples, respectively, and α ascaling factor defined as
α =〈s, s〉‖s‖2
. (6)
Note that s and s are normalized to zero-mean prior to thecalculation to ensure scale invariance.
B. Dereverberation Stage
After the attenuation of interfering speech and backgroundnoise, the original problem reduces to single-channel speechdereverberation, i.e. recovering anechoic target speech fromreverberant target speech estimated by the separation mod-ule. In this stage, we employ a BLSTM network with fourhidden layers to perform spectral mapping, which takes thespectral magnitudes estimated by the separation module asthe input. The reason for using spectral mapping rather thanratio masking in this stage is two-fold. First, ratio masking iswell justified for separation under the assumption that targetspeech and background interference are uncorrelated, whichholds well for additive noise (including background noiseand interfering speech) but not for convolutive interference asin the case of reverberation [45]. Second, speech separationalgorithms commonly introduce processing artifacts into thetarget speech signal [15], [47]. It is likely difficult for ratiomasking to suppress such processing artifacts introduced bythe separation module, particularly considering that theseartifacts are correlated with the target speech signal.
During training, the well-trained parameters in the sepa-ration module are frozen, and those in the dereverberationmodule are trained to optimize an MSE loss function, whichcompares the ground-truth magnitude spectrogram |S| with theestimated magnitude spectrogram |S|:
LMSE = E[(|St,f | − |St,f |)2
], (7)
where E represents an averaging operation over all T-F units ofall training samples within a minibatch. The complex modulusis denoted by |·|, i.e. the absolute value of a complex number.The use of the MSE loss, rather than the SI-SNR loss, ismotivated by the observation that training with the SI-SNRloss leads to far slower convergence and worse performanceon speech dereverberation than on speaker separation, which islikely because the SI-SNR loss is based on a sample-wise errorin the time domain and thus sensitive to the highly correlatedstructure between the direct sound and the reverberations [26].
C. Joint Training with a Multi-Objective Loss Function
After the two modules are well trained separately, we treatthem as an integrated network for joint training (JT). Akin
6
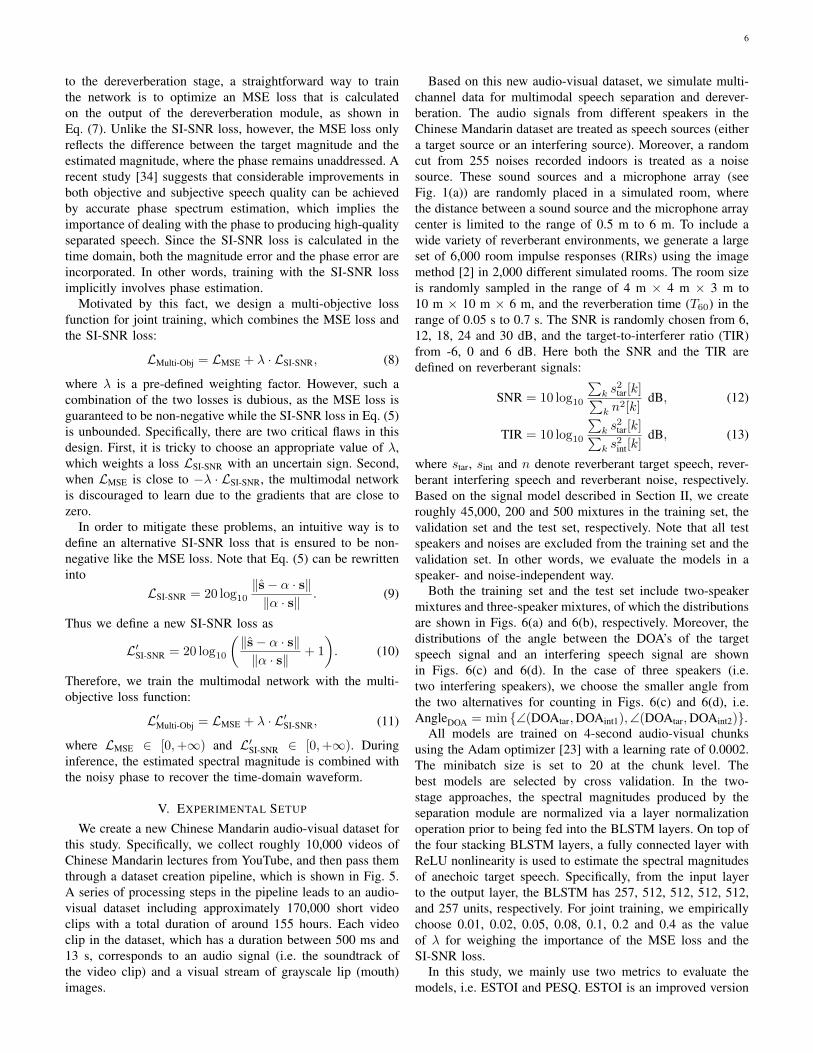
to the dereverberation stage, a straightforward way to trainthe network is to optimize an MSE loss that is calculatedon the output of the dereverberation module, as shown inEq. (7). Unlike the SI-SNR loss, however, the MSE loss onlyreflects the difference between the target magnitude and theestimated magnitude, where the phase remains unaddressed. Arecent study [34] suggests that considerable improvements inboth objective and subjective speech quality can be achievedby accurate phase spectrum estimation, which implies theimportance of dealing with the phase to producing high-qualityseparated speech. Since the SI-SNR loss is calculated in thetime domain, both the magnitude error and the phase error areincorporated. In other words, training with the SI-SNR lossimplicitly involves phase estimation.
Motivated by this fact, we design a multi-objective lossfunction for joint training, which combines the MSE loss andthe SI-SNR loss:
LMulti-Obj = LMSE + λ · LSI-SNR, (8)
where λ is a pre-defined weighting factor. However, such acombination of the two losses is dubious, as the MSE loss isguaranteed to be non-negative while the SI-SNR loss in Eq. (5)is unbounded. Specifically, there are two critical flaws in thisdesign. First, it is tricky to choose an appropriate value of λ,which weights a loss LSI-SNR with an uncertain sign. Second,when LMSE is close to −λ · LSI-SNR, the multimodal networkis discouraged to learn due to the gradients that are close tozero.
In order to mitigate these problems, an intuitive way is todefine an alternative SI-SNR loss that is ensured to be non-negative like the MSE loss. Note that Eq. (5) can be rewritteninto
LSI-SNR = 20 log10
‖s− α · s‖‖α · s‖
. (9)
Thus we define a new SI-SNR loss as
L′SI-SNR = 20 log10
(‖s− α · s‖‖α · s‖
+ 1
). (10)
Therefore, we train the multimodal network with the multi-objective loss function:
L′Multi-Obj = LMSE + λ · L′SI-SNR, (11)
where LMSE ∈ [0,+∞) and L′SI-SNR ∈ [0,+∞). Duringinference, the estimated spectral magnitude is combined withthe noisy phase to recover the time-domain waveform.
V. EXPERIMENTAL SETUP
We create a new Chinese Mandarin audio-visual dataset forthis study. Specifically, we collect roughly 10,000 videos ofChinese Mandarin lectures from YouTube, and then pass themthrough a dataset creation pipeline, which is shown in Fig. 5.A series of processing steps in the pipeline leads to an audio-visual dataset including approximately 170,000 short videoclips with a total duration of around 155 hours. Each videoclip in the dataset, which has a duration between 500 ms and13 s, corresponds to an audio signal (i.e. the soundtrack ofthe video clip) and a visual stream of grayscale lip (mouth)images.
Based on this new audio-visual dataset, we simulate multi-channel data for multimodal speech separation and derever-beration. The audio signals from different speakers in theChinese Mandarin dataset are treated as speech sources (eithera target source or an interfering source). Moreover, a randomcut from 255 noises recorded indoors is treated as a noisesource. These sound sources and a microphone array (seeFig. 1(a)) are randomly placed in a simulated room, wherethe distance between a sound source and the microphone arraycenter is limited to the range of 0.5 m to 6 m. To include awide variety of reverberant environments, we generate a largeset of 6,000 room impulse responses (RIRs) using the imagemethod [2] in 2,000 different simulated rooms. The room sizeis randomly sampled in the range of 4 m × 4 m × 3 m to10 m × 10 m × 6 m, and the reverberation time (T60) in therange of 0.05 s to 0.7 s. The SNR is randomly chosen from 6,12, 18, 24 and 30 dB, and the target-to-interferer ratio (TIR)from -6, 0 and 6 dB. Here both the SNR and the TIR aredefined on reverberant signals:
SNR = 10 log10
∑k s
2tar[k]∑
k n2[k]
dB, (12)
TIR = 10 log10
∑k s
2tar[k]∑
k s2int[k]
dB, (13)
where star, sint and n denote reverberant target speech, rever-berant interfering speech and reverberant noise, respectively.Based on the signal model described in Section II, we createroughly 45,000, 200 and 500 mixtures in the training set, thevalidation set and the test set, respectively. Note that all testspeakers and noises are excluded from the training set and thevalidation set. In other words, we evaluate the models in aspeaker- and noise-independent way.
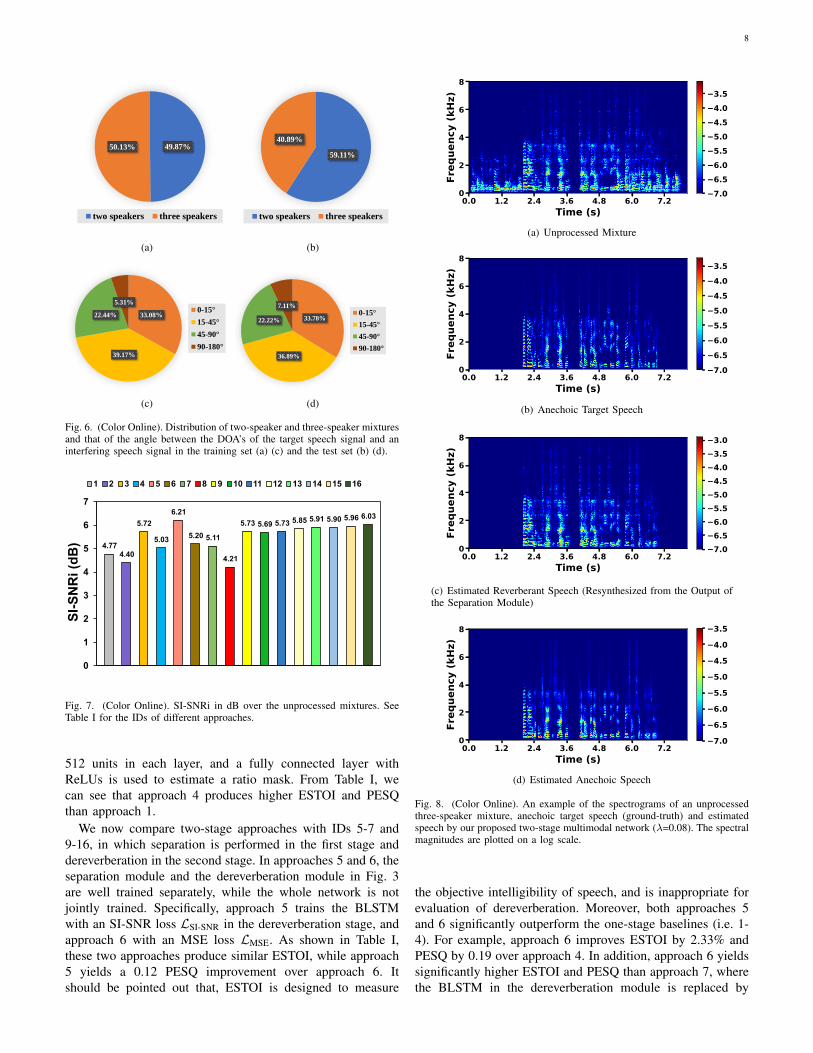
Both the training set and the test set include two-speakermixtures and three-speaker mixtures, of which the distributionsare shown in Figs. 6(a) and 6(b), respectively. Moreover, thedistributions of the angle between the DOA’s of the targetspeech signal and an interfering speech signal are shownin Figs. 6(c) and 6(d). In the case of three speakers (i.e.two interfering speakers), we choose the smaller angle fromthe two alternatives for counting in Figs. 6(c) and 6(d), i.e.AngleDOA = min {∠(DOAtar,DOAint1),∠(DOAtar,DOAint2)}.
All models are trained on 4-second audio-visual chunksusing the Adam optimizer [23] with a learning rate of 0.0002.The minibatch size is set to 20 at the chunk level. Thebest models are selected by cross validation. In the two-stage approaches, the spectral magnitudes produced by theseparation module are normalized via a layer normalizationoperation prior to being fed into the BLSTM layers. On top ofthe four stacking BLSTM layers, a fully connected layer withReLU nonlinearity is used to estimate the spectral magnitudesof anechoic target speech. Specifically, from the input layerto the output layer, the BLSTM has 257, 512, 512, 512, 512,and 257 units, respectively. For joint training, we empiricallychoose 0.01, 0.02, 0.05, 0.08, 0.1, 0.2 and 0.4 as the valueof λ for weighing the importance of the MSE loss and theSI-SNR loss.
In this study, we mainly use two metrics to evaluate themodels, i.e. ESTOI and PESQ. ESTOI is an improved version
7
Voice-Activity-Detector(VAD)BasedEndpoint
Detection
AudioandVideoSegmentationBasedonEndpointDetection
VideoStreamResampling(25FPS)
FaceDetection(AbandonSegmentswithNoFaceorMorethanOneFace)
SNREstimation(AbandonSegmentswithanSNRLowerthan17dB)
FaceTrackingLiveFaceDetection(SomeFalseExamplesLiketheStaticFacesinSlides)
MouthCroppingandConversiontoGrayscale
Step1 Step2 Step3 Step4
Step5Step6Step7Step8
Fig. 5. (Color Online). Diagram of our dataset creation pipeline. In Steps 4 and 5, data filtering is performed based on the number of detected faces and theestimated SNR, respectively.
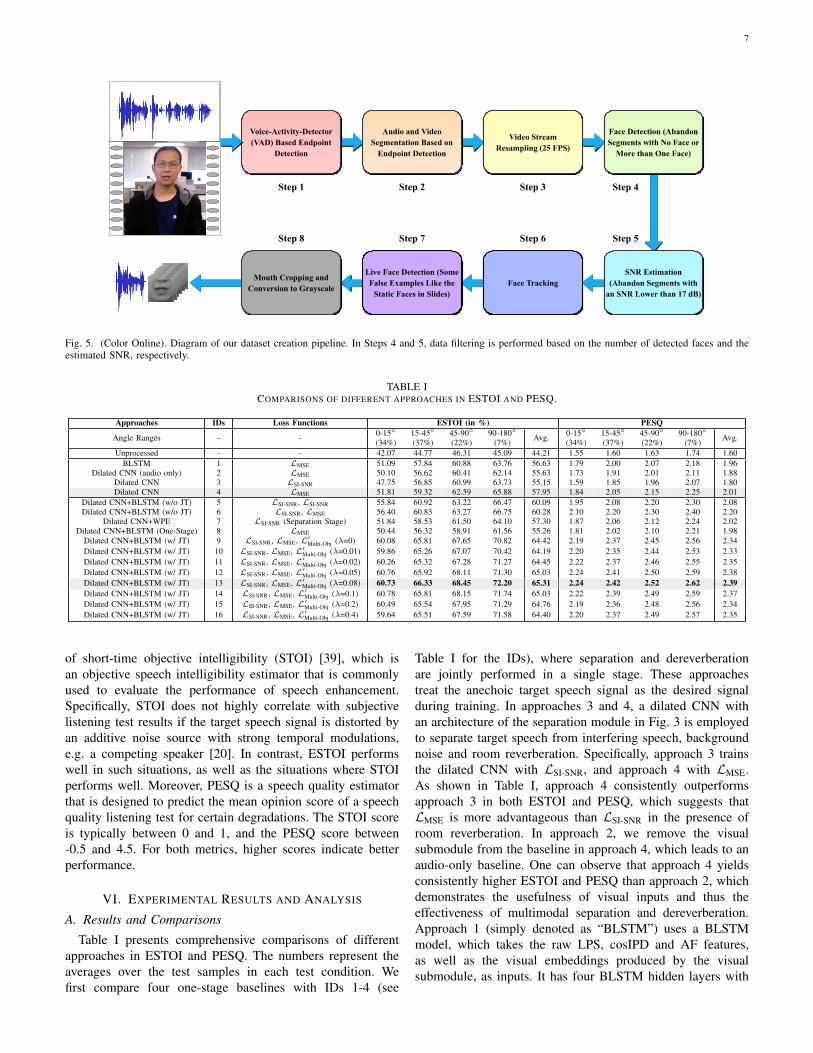
TABLE ICOMPARISONS OF DIFFERENT APPROACHES IN ESTOI AND PESQ.
Approaches IDs Loss Functions ESTOI (in %) PESQ
Angle Ranges - - 0-15◦ 15-45◦ 45-90◦ 90-180◦ Avg. 0-15◦ 15-45◦ 45-90◦ 90-180◦ Avg.(34%) (37%) (22%) (7%) (34%) (37%) (22%) (7%)Unprocessed - - 42.07 44.77 46.31 45.09 44.21 1.55 1.60 1.63 1.74 1.60
BLSTM 1 LMSE 51.09 57.84 60.88 63.76 56.63 1.79 2.00 2.07 2.18 1.96Dilated CNN (audio only) 2 LMSE 50.10 56.62 60.41 62.14 55.63 1.73 1.91 2.01 2.11 1.88
Dilated CNN 3 LSI-SNR 47.75 56.85 60.99 63.73 55.15 1.59 1.85 1.96 2.07 1.80Dilated CNN 4 LMSE 51.81 59.32 62.59 65.88 57.95 1.84 2.05 2.15 2.25 2.01
Dilated CNN+BLSTM (w/o JT) 5 LSI-SNR, LSI-SNR 55.84 60.92 63.22 66.47 60.09 1.95 2.08 2.20 2.30 2.08Dilated CNN+BLSTM (w/o JT) 6 LSI-SNR, LMSE 56.40 60.83 63.27 66.75 60.28 2.10 2.20 2.30 2.40 2.20
Dilated CNN+WPE 7 LSI-SNR (Separation Stage) 51.84 58.53 61.50 64.10 57.30 1.87 2.06 2.12 2.24 2.02Dilated CNN+BLSTM (One-Stage) 8 LMSE 50.44 56.32 58.91 61.56 55.26 1.81 2.02 2.10 2.21 1.98
Dilated CNN+BLSTM (w/ JT) 9 LSI-SNR, LMSE, L′Multi-Obj (λ=0) 60.08 65.81 67.65 70.82 64.42 2.19 2.37 2.45 2.56 2.34Dilated CNN+BLSTM (w/ JT) 10 LSI-SNR, LMSE, L′Multi-Obj (λ=0.01) 59.86 65.26 67.07 70.42 64.19 2.20 2.35 2.44 2.53 2.33Dilated CNN+BLSTM (w/ JT) 11 LSI-SNR, LMSE, L′Multi-Obj (λ=0.02) 60.26 65.32 67.28 71.27 64.45 2.22 2.37 2.46 2.55 2.35Dilated CNN+BLSTM (w/ JT) 12 LSI-SNR, LMSE, L′Multi-Obj (λ=0.05) 60.76 65.92 68.11 71.30 65.03 2.24 2.41 2.50 2.59 2.38Dilated CNN+BLSTM (w/ JT) 13 LSI-SNR, LMSE, L′Multi-Obj (λ=0.08) 60.73 66.33 68.45 72.20 65.31 2.24 2.42 2.52 2.62 2.39Dilated CNN+BLSTM (w/ JT) 14 LSI-SNR, LMSE, L′Multi-Obj (λ=0.1) 60.78 65.81 68.15 71.74 65.03 2.22 2.39 2.49 2.59 2.37Dilated CNN+BLSTM (w/ JT) 15 LSI-SNR, LMSE, L′Multi-Obj (λ=0.2) 60.49 65.54 67.95 71.29 64.76 2.19 2.36 2.48 2.56 2.34Dilated CNN+BLSTM (w/ JT) 16 LSI-SNR, LMSE, L′Multi-Obj (λ=0.4) 59.64 65.51 67.59 71.58 64.40 2.20 2.37 2.49 2.57 2.35
of short-time objective intelligibility (STOI) [39], which isan objective speech intelligibility estimator that is commonlyused to evaluate the performance of speech enhancement.Specifically, STOI does not highly correlate with subjectivelistening test results if the target speech signal is distorted byan additive noise source with strong temporal modulations,e.g. a competing speaker [20]. In contrast, ESTOI performswell in such situations, as well as the situations where STOIperforms well. Moreover, PESQ is a speech quality estimatorthat is designed to predict the mean opinion score of a speechquality listening test for certain degradations. The STOI scoreis typically between 0 and 1, and the PESQ score between-0.5 and 4.5. For both metrics, higher scores indicate betterperformance.
VI. EXPERIMENTAL RESULTS AND ANALYSIS
A. Results and Comparisons
Table I presents comprehensive comparisons of differentapproaches in ESTOI and PESQ. The numbers represent theaverages over the test samples in each test condition. Wefirst compare four one-stage baselines with IDs 1-4 (see
Table I for the IDs), where separation and dereverberationare jointly performed in a single stage. These approachestreat the anechoic target speech signal as the desired signalduring training. In approaches 3 and 4, a dilated CNN withan architecture of the separation module in Fig. 3 is employedto separate target speech from interfering speech, backgroundnoise and room reverberation. Specifically, approach 3 trainsthe dilated CNN with LSI-SNR, and approach 4 with LMSE.As shown in Table I, approach 4 consistently outperformsapproach 3 in both ESTOI and PESQ, which suggests thatLMSE is more advantageous than LSI-SNR in the presence ofroom reverberation. In approach 2, we remove the visualsubmodule from the baseline in approach 4, which leads to anaudio-only baseline. One can observe that approach 4 yieldsconsistently higher ESTOI and PESQ than approach 2, whichdemonstrates the usefulness of visual inputs and thus theeffectiveness of multimodal separation and dereverberation.Approach 1 (simply denoted as “BLSTM”) uses a BLSTMmodel, which takes the raw LPS, cosIPD and AF features,as well as the visual embeddings produced by the visualsubmodule, as inputs. It has four BLSTM hidden layers with
8
49.87%50.13%
two speakers three speakers
59.11%
40.89%
two speakers three speakers
33.08%
39.17%
22.44%
5.31%
0-15°
15-45°
45-90°
90-180°
33.78%
36.89%
22.22%
7.11%0-15°
15-45°
45-90°
90-180°
(a)
49.87%50.13%
two speakers three speakers
59.11%
40.89%
two speakers three speakers
33.08%
39.17%
22.44%
5.31%
0-15°
15-45°
45-90°
90-180°
33.78%
36.89%
22.22%
7.11%0-15°
15-45°
45-90°
90-180°
(b)
49.87%50.13%
two speakers three speakers
59.11%
40.89%
two speakers three speakers
33.08%
39.17%
22.44%
5.31%
0-15°
15-45°
45-90°
90-180°
33.78%
36.89%
22.22%
7.11%0-15°
15-45°
45-90°
90-180°
(c)
49.87%50.13%
two speakers three speakers
59.11%
40.89%
two speakers three speakers
33.08%
39.17%
22.44%
5.31%
0-15°
15-45°
45-90°
90-180°
33.78%
36.89%
22.22%
7.11%0-15°
15-45°
45-90°
90-180°
(d)
Fig. 6. (Color Online). Distribution of two-speaker and three-speaker mixturesand that of the angle between the DOA’s of the target speech signal and aninterfering speech signal in the training set (a) (c) and the test set (b) (d).
4.774.40
5.72
5.03
6.21
5.20 5.11
4.21
5.73 5.69 5.73 5.85 5.91 5.90 5.96 6.03
0
1
2
3
4
5
6
7
SI-
SN
Ri (
dB
)
1 2 3 4 5 6 7 8 9 10 11 12 13 14 15 16
Fig. 7. (Color Online). SI-SNRi in dB over the unprocessed mixtures. SeeTable I for the IDs of different approaches.
512 units in each layer, and a fully connected layer withReLUs is used to estimate a ratio mask. From Table I, wecan see that approach 4 produces higher ESTOI and PESQthan approach 1.
We now compare two-stage approaches with IDs 5-7 and9-16, in which separation is performed in the first stage anddereverberation in the second stage. In approaches 5 and 6, theseparation module and the dereverberation module in Fig. 3are well trained separately, while the whole network is notjointly trained. Specifically, approach 5 trains the BLSTMwith an SI-SNR loss LSI-SNR in the dereverberation stage, andapproach 6 with an MSE loss LMSE. As shown in Table I,these two approaches produce similar ESTOI, while approach5 yields a 0.12 PESQ improvement over approach 6. Itshould be pointed out that, ESTOI is designed to measure
0.0 1.2 2.4 3.6 4.8 6.0 7.2Time (s)
0
2
4
6
8
Freq
uenc
y (k
Hz)
7.06.56.05.55.04.54.03.5
(a) Unprocessed Mixture
0.0 1.2 2.4 3.6 4.8 6.0 7.2Time (s)
0
2
4
6
8
Freq
uenc
y (k
Hz)
7.06.56.05.55.04.54.03.5
(b) Anechoic Target Speech
0.0 1.2 2.4 3.6 4.8 6.0 7.2Time (s)
0
2
4
6
8Fr
eque
ncy
(kH
z)
7.06.56.05.55.04.54.03.53.0
(c) Estimated Reverberant Speech (Resynthesized from the Output ofthe Separation Module)
0.0 1.2 2.4 3.6 4.8 6.0 7.2Time (s)
0
2
4
6
8
Freq
uenc
y (k
Hz)
7.0
6.5
6.0
5.5
5.0
4.5
4.0
3.5
(d) Estimated Anechoic Speech
Fig. 8. (Color Online). An example of the spectrograms of an unprocessedthree-speaker mixture, anechoic target speech (ground-truth) and estimatedspeech by our proposed two-stage multimodal network (λ=0.08). The spectralmagnitudes are plotted on a log scale.
the objective intelligibility of speech, and is inappropriate forevaluation of dereverberation. Moreover, both approaches 5and 6 significantly outperform the one-stage baselines (i.e. 1-4). For example, approach 6 improves ESTOI by 2.33% andPESQ by 0.19 over approach 4. In addition, approach 6 yieldssignificantly higher ESTOI and PESQ than approach 7, wherethe BLSTM in the dereverberation module is replaced by
9
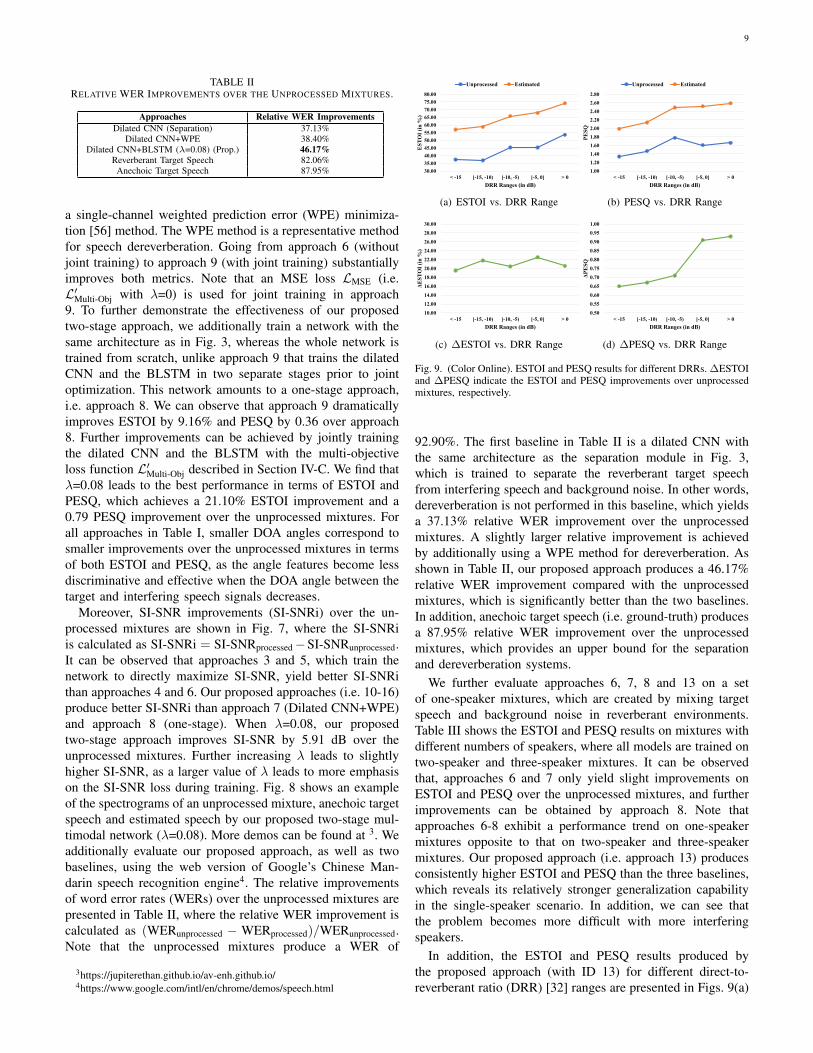
TABLE IIRELATIVE WER IMPROVEMENTS OVER THE UNPROCESSED MIXTURES.
Approaches Relative WER ImprovementsDilated CNN (Separation) 37.13%
Dilated CNN+WPE 38.40%Dilated CNN+BLSTM (λ=0.08) (Prop.) 46.17%
Reverberant Target Speech 82.06%Anechoic Target Speech 87.95%
a single-channel weighted prediction error (WPE) minimiza-tion [56] method. The WPE method is a representative methodfor speech dereverberation. Going from approach 6 (withoutjoint training) to approach 9 (with joint training) substantiallyimproves both metrics. Note that an MSE loss LMSE (i.e.L′Multi-Obj with λ=0) is used for joint training in approach9. To further demonstrate the effectiveness of our proposedtwo-stage approach, we additionally train a network with thesame architecture as in Fig. 3, whereas the whole network istrained from scratch, unlike approach 9 that trains the dilatedCNN and the BLSTM in two separate stages prior to jointoptimization. This network amounts to a one-stage approach,i.e. approach 8. We can observe that approach 9 dramaticallyimproves ESTOI by 9.16% and PESQ by 0.36 over approach8. Further improvements can be achieved by jointly trainingthe dilated CNN and the BLSTM with the multi-objectiveloss function L′Multi-Obj described in Section IV-C. We find thatλ=0.08 leads to the best performance in terms of ESTOI andPESQ, which achieves a 21.10% ESTOI improvement and a0.79 PESQ improvement over the unprocessed mixtures. Forall approaches in Table I, smaller DOA angles correspond tosmaller improvements over the unprocessed mixtures in termsof both ESTOI and PESQ, as the angle features become lessdiscriminative and effective when the DOA angle between thetarget and interfering speech signals decreases.
Moreover, SI-SNR improvements (SI-SNRi) over the un-processed mixtures are shown in Fig. 7, where the SI-SNRiis calculated as SI-SNRi = SI-SNRprocessed−SI-SNRunprocessed.It can be observed that approaches 3 and 5, which train thenetwork to directly maximize SI-SNR, yield better SI-SNRithan approaches 4 and 6. Our proposed approaches (i.e. 10-16)produce better SI-SNRi than approach 7 (Dilated CNN+WPE)and approach 8 (one-stage). When λ=0.08, our proposedtwo-stage approach improves SI-SNR by 5.91 dB over theunprocessed mixtures. Further increasing λ leads to slightlyhigher SI-SNR, as a larger value of λ leads to more emphasison the SI-SNR loss during training. Fig. 8 shows an exampleof the spectrograms of an unprocessed mixture, anechoic targetspeech and estimated speech by our proposed two-stage mul-timodal network (λ=0.08). More demos can be found at 3. Weadditionally evaluate our proposed approach, as well as twobaselines, using the web version of Google’s Chinese Man-darin speech recognition engine4. The relative improvementsof word error rates (WERs) over the unprocessed mixtures arepresented in Table II, where the relative WER improvement iscalculated as (WERunprocessed − WERprocessed)/WERunprocessed.Note that the unprocessed mixtures produce a WER of
3https://jupiterethan.github.io/av-enh.github.io/4https://www.google.com/intl/en/chrome/demos/speech.html
30.00
35.00
40.00
45.00
50.00
55.00
60.00
65.00
70.00
75.00
80.00
< -15 [-15, -10) [-10, -5) [-5, 0] > 0
ES
TO
I (i
n %
)
DRR Ranges (in dB)
Unprocessed Estimated
(a) ESTOI vs. DRR Range
1.00
1.20
1.40
1.60
1.80
2.00
2.20
2.40
2.60
2.80
< -15 [-15, -10) [-10, -5) [-5, 0] > 0
PE
SQ
DRR Ranges (in dB)
Unprocessed Estimated
(b) PESQ vs. DRR Range
10.00
12.00
14.00
16.00
18.00
20.00
22.00
24.00
26.00
28.00
30.00
< -15 [-15, -10) [-10, -5) [-5, 0] > 0
ΔE
ST
OI
(in
%)
DRR Ranges (in dB)
(c) ∆ESTOI vs. DRR Range
0.50
0.55
0.60
0.65
0.70
0.75
0.80
0.85
0.90
0.95
1.00
< -15 [-15, -10) [-10, -5) [-5, 0] > 0
ΔP
ES
Q
DRR Ranges (in dB)
(d) ∆PESQ vs. DRR Range
Fig. 9. (Color Online). ESTOI and PESQ results for different DRRs. ∆ESTOIand ∆PESQ indicate the ESTOI and PESQ improvements over unprocessedmixtures, respectively.
92.90%. The first baseline in Table II is a dilated CNN withthe same architecture as the separation module in Fig. 3,which is trained to separate the reverberant target speechfrom interfering speech and background noise. In other words,dereverberation is not performed in this baseline, which yieldsa 37.13% relative WER improvement over the unprocessedmixtures. A slightly larger relative improvement is achievedby additionally using a WPE method for dereverberation. Asshown in Table II, our proposed approach produces a 46.17%relative WER improvement compared with the unprocessedmixtures, which is significantly better than the two baselines.In addition, anechoic target speech (i.e. ground-truth) producesa 87.95% relative WER improvement over the unprocessedmixtures, which provides an upper bound for the separationand dereverberation systems.
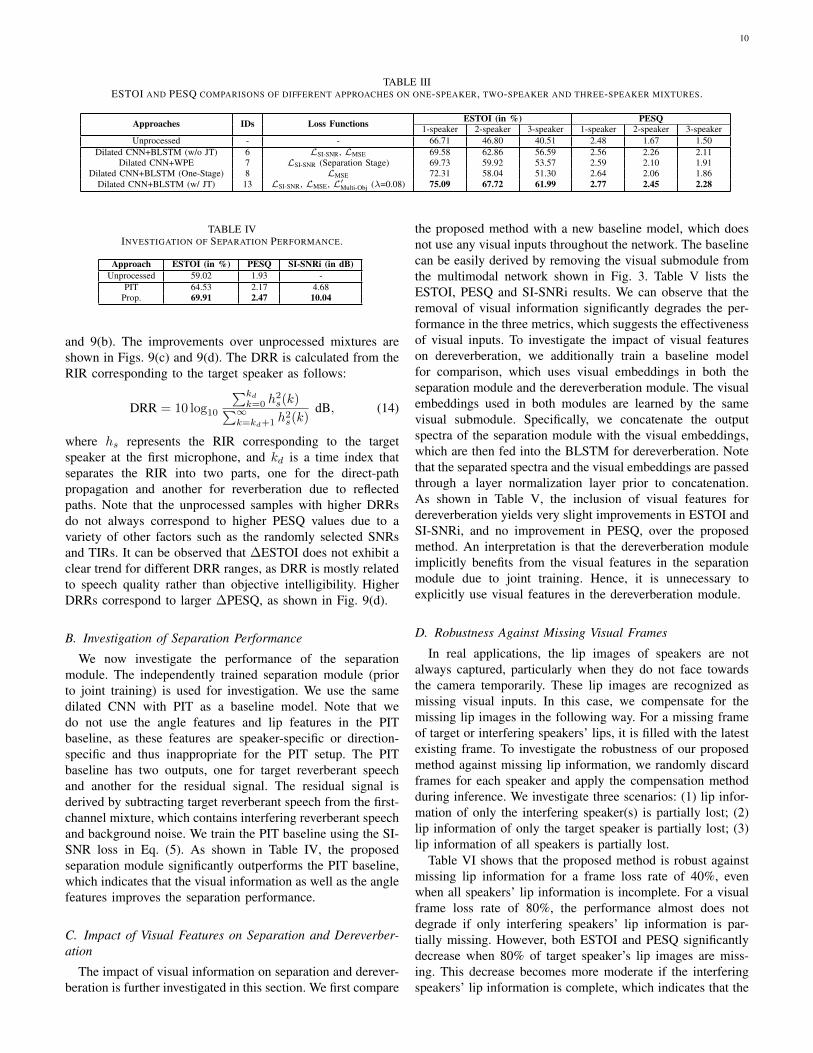
We further evaluate approaches 6, 7, 8 and 13 on a setof one-speaker mixtures, which are created by mixing targetspeech and background noise in reverberant environments.Table III shows the ESTOI and PESQ results on mixtures withdifferent numbers of speakers, where all models are trained ontwo-speaker and three-speaker mixtures. It can be observedthat, approaches 6 and 7 only yield slight improvements onESTOI and PESQ over the unprocessed mixtures, and furtherimprovements can be obtained by approach 8. Note thatapproaches 6-8 exhibit a performance trend on one-speakermixtures opposite to that on two-speaker and three-speakermixtures. Our proposed approach (i.e. approach 13) producesconsistently higher ESTOI and PESQ than the three baselines,which reveals its relatively stronger generalization capabilityin the single-speaker scenario. In addition, we can see thatthe problem becomes more difficult with more interferingspeakers.
In addition, the ESTOI and PESQ results produced bythe proposed approach (with ID 13) for different direct-to-reverberant ratio (DRR) [32] ranges are presented in Figs. 9(a)
10
TABLE IIIESTOI AND PESQ COMPARISONS OF DIFFERENT APPROACHES ON ONE-SPEAKER, TWO-SPEAKER AND THREE-SPEAKER MIXTURES.
Approaches IDs Loss Functions ESTOI (in %) PESQ1-speaker 2-speaker 3-speaker 1-speaker 2-speaker 3-speaker
Unprocessed - - 66.71 46.80 40.51 2.48 1.67 1.50Dilated CNN+BLSTM (w/o JT) 6 LSI-SNR, LMSE 69.58 62.86 56.59 2.56 2.26 2.11
Dilated CNN+WPE 7 LSI-SNR (Separation Stage) 69.73 59.92 53.57 2.59 2.10 1.91Dilated CNN+BLSTM (One-Stage) 8 LMSE 72.31 58.04 51.30 2.64 2.06 1.86
Dilated CNN+BLSTM (w/ JT) 13 LSI-SNR, LMSE, L′Multi-Obj (λ=0.08) 75.09 67.72 61.99 2.77 2.45 2.28
TABLE IVINVESTIGATION OF SEPARATION PERFORMANCE.
Approach ESTOI (in %) PESQ SI-SNRi (in dB)Unprocessed 59.02 1.93 -
PIT 64.53 2.17 4.68Prop. 69.91 2.47 10.04
and 9(b). The improvements over unprocessed mixtures areshown in Figs. 9(c) and 9(d). The DRR is calculated from theRIR corresponding to the target speaker as follows:
DRR = 10 log10
∑kdk=0 h
2s(k)∑∞
k=kd+1 h2s(k)
dB, (14)
where hs represents the RIR corresponding to the targetspeaker at the first microphone, and kd is a time index thatseparates the RIR into two parts, one for the direct-pathpropagation and another for reverberation due to reflectedpaths. Note that the unprocessed samples with higher DRRsdo not always correspond to higher PESQ values due to avariety of other factors such as the randomly selected SNRsand TIRs. It can be observed that ∆ESTOI does not exhibit aclear trend for different DRR ranges, as DRR is mostly relatedto speech quality rather than objective intelligibility. HigherDRRs correspond to larger ∆PESQ, as shown in Fig. 9(d).
B. Investigation of Separation Performance
We now investigate the performance of the separationmodule. The independently trained separation module (priorto joint training) is used for investigation. We use the samedilated CNN with PIT as a baseline model. Note that wedo not use the angle features and lip features in the PITbaseline, as these features are speaker-specific or direction-specific and thus inappropriate for the PIT setup. The PITbaseline has two outputs, one for target reverberant speechand another for the residual signal. The residual signal isderived by subtracting target reverberant speech from the first-channel mixture, which contains interfering reverberant speechand background noise. We train the PIT baseline using the SI-SNR loss in Eq. (5). As shown in Table IV, the proposedseparation module significantly outperforms the PIT baseline,which indicates that the visual information as well as the anglefeatures improves the separation performance.
C. Impact of Visual Features on Separation and Dereverber-ation
The impact of visual information on separation and derever-beration is further investigated in this section. We first compare
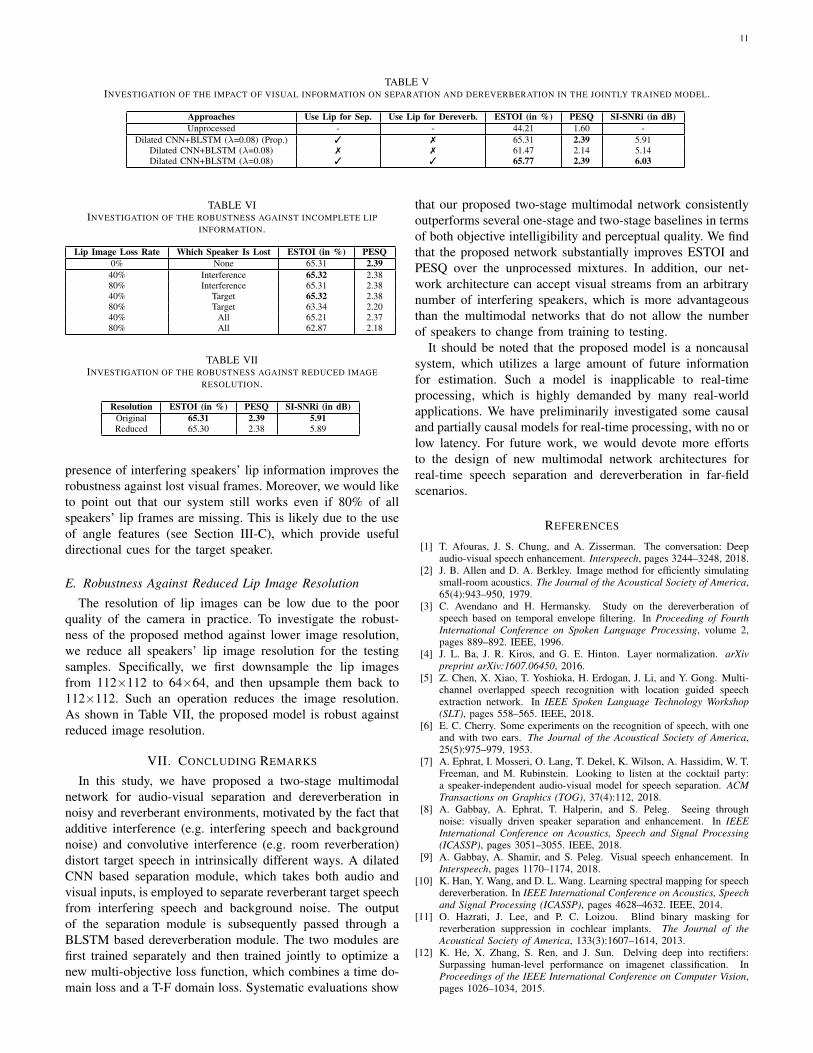
the proposed method with a new baseline model, which doesnot use any visual inputs throughout the network. The baselinecan be easily derived by removing the visual submodule fromthe multimodal network shown in Fig. 3. Table V lists theESTOI, PESQ and SI-SNRi results. We can observe that theremoval of visual information significantly degrades the per-formance in the three metrics, which suggests the effectivenessof visual inputs. To investigate the impact of visual featureson dereverberation, we additionally train a baseline modelfor comparison, which uses visual embeddings in both theseparation module and the dereverberation module. The visualembeddings used in both modules are learned by the samevisual submodule. Specifically, we concatenate the outputspectra of the separation module with the visual embeddings,which are then fed into the BLSTM for dereverberation. Notethat the separated spectra and the visual embeddings are passedthrough a layer normalization layer prior to concatenation.As shown in Table V, the inclusion of visual features fordereverberation yields very slight improvements in ESTOI andSI-SNRi, and no improvement in PESQ, over the proposedmethod. An interpretation is that the dereverberation moduleimplicitly benefits from the visual features in the separationmodule due to joint training. Hence, it is unnecessary toexplicitly use visual features in the dereverberation module.
D. Robustness Against Missing Visual Frames
In real applications, the lip images of speakers are notalways captured, particularly when they do not face towardsthe camera temporarily. These lip images are recognized asmissing visual inputs. In this case, we compensate for themissing lip images in the following way. For a missing frameof target or interfering speakers’ lips, it is filled with the latestexisting frame. To investigate the robustness of our proposedmethod against missing lip information, we randomly discardframes for each speaker and apply the compensation methodduring inference. We investigate three scenarios: (1) lip infor-mation of only the interfering speaker(s) is partially lost; (2)lip information of only the target speaker is partially lost; (3)lip information of all speakers is partially lost.
Table VI shows that the proposed method is robust againstmissing lip information for a frame loss rate of 40%, evenwhen all speakers’ lip information is incomplete. For a visualframe loss rate of 80%, the performance almost does notdegrade if only interfering speakers’ lip information is par-tially missing. However, both ESTOI and PESQ significantlydecrease when 80% of target speaker’s lip images are miss-ing. This decrease becomes more moderate if the interferingspeakers’ lip information is complete, which indicates that the
11
TABLE VINVESTIGATION OF THE IMPACT OF VISUAL INFORMATION ON SEPARATION AND DEREVERBERATION IN THE JOINTLY TRAINED MODEL.
Approaches Use Lip for Sep. Use Lip for Dereverb. ESTOI (in %) PESQ SI-SNRi (in dB)Unprocessed - - 44.21 1.60 -
Dilated CNN+BLSTM (λ=0.08) (Prop.) 3 7 65.31 2.39 5.91Dilated CNN+BLSTM (λ=0.08) 7 7 61.47 2.14 5.14Dilated CNN+BLSTM (λ=0.08) 3 3 65.77 2.39 6.03
TABLE VIINVESTIGATION OF THE ROBUSTNESS AGAINST INCOMPLETE LIP
INFORMATION.
Lip Image Loss Rate Which Speaker Is Lost ESTOI (in %) PESQ0% None 65.31 2.39
40% Interference 65.32 2.3880% Interference 65.31 2.3840% Target 65.32 2.3880% Target 63.34 2.2040% All 65.21 2.3780% All 62.87 2.18
TABLE VIIINVESTIGATION OF THE ROBUSTNESS AGAINST REDUCED IMAGE
RESOLUTION.
Resolution ESTOI (in %) PESQ SI-SNRi (in dB)Original 65.31 2.39 5.91Reduced 65.30 2.38 5.89
presence of interfering speakers’ lip information improves therobustness against lost visual frames. Moreover, we would liketo point out that our system still works even if 80% of allspeakers’ lip frames are missing. This is likely due to the useof angle features (see Section III-C), which provide usefuldirectional cues for the target speaker.
E. Robustness Against Reduced Lip Image Resolution
The resolution of lip images can be low due to the poorquality of the camera in practice. To investigate the robust-ness of the proposed method against lower image resolution,we reduce all speakers’ lip image resolution for the testingsamples. Specifically, we first downsample the lip imagesfrom 112×112 to 64×64, and then upsample them back to112×112. Such an operation reduces the image resolution.As shown in Table VII, the proposed model is robust againstreduced image resolution.
VII. CONCLUDING REMARKS
In this study, we have proposed a two-stage multimodalnetwork for audio-visual separation and dereverberation innoisy and reverberant environments, motivated by the fact thatadditive interference (e.g. interfering speech and backgroundnoise) and convolutive interference (e.g. room reverberation)distort target speech in intrinsically different ways. A dilatedCNN based separation module, which takes both audio andvisual inputs, is employed to separate reverberant target speechfrom interfering speech and background noise. The outputof the separation module is subsequently passed through aBLSTM based dereverberation module. The two modules arefirst trained separately and then trained jointly to optimize anew multi-objective loss function, which combines a time do-main loss and a T-F domain loss. Systematic evaluations show
that our proposed two-stage multimodal network consistentlyoutperforms several one-stage and two-stage baselines in termsof both objective intelligibility and perceptual quality. We findthat the proposed network substantially improves ESTOI andPESQ over the unprocessed mixtures. In addition, our net-work architecture can accept visual streams from an arbitrarynumber of interfering speakers, which is more advantageousthan the multimodal networks that do not allow the numberof speakers to change from training to testing.
It should be noted that the proposed model is a noncausalsystem, which utilizes a large amount of future informationfor estimation. Such a model is inapplicable to real-timeprocessing, which is highly demanded by many real-worldapplications. We have preliminarily investigated some causaland partially causal models for real-time processing, with no orlow latency. For future work, we would devote more effortsto the design of new multimodal network architectures forreal-time speech separation and dereverberation in far-fieldscenarios.
REFERENCES
[1] T. Afouras, J. S. Chung, and A. Zisserman. The conversation: Deepaudio-visual speech enhancement. Interspeech, pages 3244–3248, 2018.
[2] J. B. Allen and D. A. Berkley. Image method for efficiently simulatingsmall-room acoustics. The Journal of the Acoustical Society of America,65(4):943–950, 1979.
[3] C. Avendano and H. Hermansky. Study on the dereverberation ofspeech based on temporal envelope filtering. In Proceeding of FourthInternational Conference on Spoken Language Processing, volume 2,pages 889–892. IEEE, 1996.
[4] J. L. Ba, J. R. Kiros, and G. E. Hinton. Layer normalization. arXivpreprint arXiv:1607.06450, 2016.
[5] Z. Chen, X. Xiao, T. Yoshioka, H. Erdogan, J. Li, and Y. Gong. Multi-channel overlapped speech recognition with location guided speechextraction network. In IEEE Spoken Language Technology Workshop(SLT), pages 558–565. IEEE, 2018.
[6] E. C. Cherry. Some experiments on the recognition of speech, with oneand with two ears. The Journal of the Acoustical Society of America,25(5):975–979, 1953.
[7] A. Ephrat, I. Mosseri, O. Lang, T. Dekel, K. Wilson, A. Hassidim, W. T.Freeman, and M. Rubinstein. Looking to listen at the cocktail party:a speaker-independent audio-visual model for speech separation. ACMTransactions on Graphics (TOG), 37(4):112, 2018.
[8] A. Gabbay, A. Ephrat, T. Halperin, and S. Peleg. Seeing throughnoise: visually driven speaker separation and enhancement. In IEEEInternational Conference on Acoustics, Speech and Signal Processing(ICASSP), pages 3051–3055. IEEE, 2018.
[9] A. Gabbay, A. Shamir, and S. Peleg. Visual speech enhancement. InInterspeech, pages 1170–1174, 2018.
[10] K. Han, Y. Wang, and D. L. Wang. Learning spectral mapping for speechdereverberation. In IEEE International Conference on Acoustics, Speechand Signal Processing (ICASSP), pages 4628–4632. IEEE, 2014.
[11] O. Hazrati, J. Lee, and P. C. Loizou. Blind binary masking forreverberation suppression in cochlear implants. The Journal of theAcoustical Society of America, 133(3):1607–1614, 2013.
[12] K. He, X. Zhang, S. Ren, and J. Sun. Delving deep into rectifiers:Surpassing human-level performance on imagenet classification. InProceedings of the IEEE International Conference on Computer Vision,pages 1026–1034, 2015.
12
[13] K. He, X. Zhang, S. Ren, and J. Sun. Deep residual learning for imagerecognition. In Proceedings of the IEEE Conference on Computer Visionand Pattern Recognition, pages 770–778, 2016.
[14] J. R. Hershey, Z. Chen, J. Le Roux, and S. Watanabe. Deep clustering:Discriminative embeddings for segmentation and separation. In IEEEInternational Conference on Acoustics, Speech and Signal Processing(ICASSP), pages 31–35. IEEE, 2016.
[15] J. Heymann, L. Drude, and H.-U. Reinhold. Wide residual blstm networkwith discriminative speaker adaptation for robust speech recognition. InProceedings of the 4th International Workshop on Speech Processing inEveryday Environments (CHiME16), pages 12–17, 2016.
[16] J.-C. Hou, S.-S. Wang, Y.-H. Lai, J.-C. Lin, Y. Tsao, H.-W. Chang,and H.-M. Wang. Audio-visual speech enhancement using deep neuralnetworks. In Asia-Pacific Signal and Information Processing AssociationAnnual Summit and Conference (APSIPA), pages 1–6. IEEE, 2016.
[17] J.-C. Hou, S.-S. Wang, Y.-H. Lai, Y. Tsao, H.-W. Chang, and H.-M. Wang. Audio-visual speech enhancement using multimodal deepconvolutional neural networks. IEEE Transactions on Emerging Topicsin Computational Intelligence, 2(2):117–128, 2018.
[18] S. Ioffe and C. Szegedy. Batch normalization: Accelerating deep networktraining by reducing internal covariate shift. In International Conferenceon Machine Learning, pages 448–456, 2015.
[19] Y. Isik, J. Le Roux, Z. Chen, S. Watanabe, and J. R. Hershey. Single-channel multi-speaker separation using deep clustering. Interspeech,pages 545–549, 2016.
[20] J. Jensen and C. H. Taal. An algorithm for predicting the intelligibilityof speech masked by modulated noise maskers. IEEE/ACM Transactionson Audio, Speech, and Language Processing, 24(11):2009–2022, 2016.
[21] F. U. Khan, B. P. Milner, and T. Le Cornu. Using visual speech infor-mation in masking methods for audio speaker separation. IEEE/ACMTransactions on Audio, Speech, and Language Processing, 26(10):1742–1754, 2018.
[22] M. S. Khan, S. M. Naqvi, and J. Chambers. Two-stage audio-visualspeech dereverberation and separation based on models of the interauralspatial cues and spatial covariance. In 18th International Conference onDigital Signal Processing (DSP), pages 1–6. IEEE, 2013.
[23] D. P. Kingma and J. Ba. Adam: A method for stochastic optimization.In International Conference on Learning Representations (ICLR), 2015.
[24] M. Kolbæk, D. Yu, Z.-H. Tan, J. Jensen, M. Kolbaek, D. Yu, Z.-H. Tan, and J. Jensen. Multitalker speech separation with utterance-level permutation invariant training of deep recurrent neural networks.IEEE/ACM Transactions on Audio, Speech and Language Processing(TASLP), 25(10):1901–1913, 2017.
[25] Y. Luo, Z. Chen, and N. Mesgarani. Speaker-independent speechseparation with deep attractor network. IEEE/ACM Transactions onAudio, Speech, and Language Processing, 26(4):787–796, 2018.
[26] Y. Luo and N. Mesgarani. Real-time single-channel dereverberation andseparation with time-domain audio separation network. In Interspeech,pages 342–346, 2018.
[27] Y. Luo and N. Mesgarani. Conv-tasnet: Surpassing ideal time-frequencymagnitude masking for speech separation. IEEE/ACM Transactions onAudio, Speech, and Language Processing, 27(8):1256–1266, 2019.
[28] A. MacLeod and Q. Summerfield. Quantifying the contribution of visionto speech perception in noise. British Journal of Audiology, 21(2):131–141, 1987.
[29] D. W. Massaro and J. A. Simpson. Speech perception by ear and eye:A paradigm for psychological inquiry. Psychology Press, 2014.
[30] G. Morrone, S. Bergamaschi, L. Pasa, L. Fadiga, V. Tikhanoff, andL. Badino. Face landmark-based speaker-independent audio-visualspeech enhancement in multi-talker environments. In IEEE InternationalConference on Acoustics, Speech and Signal Processing (ICASSP), pages6900–6904. IEEE, 2019.
[31] T. Nakatani, T. Yoshioka, K. Kinoshita, M. Miyoshi, and B.-H. Juang.Speech dereverberation based on variance-normalized delayed linear pre-diction. IEEE Transactions on Audio, Speech, and Language Processing,18(7):1717–1731, 2010.
[32] P. A. Naylor and N. D. Gaubitch. Speech dereverberation. SpringerScience & Business Media, 2010.
[33] A. Owens and A. A. Efros. Audio-visual scene analysis with self-supervised multisensory features. In Proceedings of the EuropeanConference on Computer Vision (ECCV), pages 631–648, 2018.
[34] K. Paliwal, K. Wojcicki, and B. Shannon. The importance of phase inspeech enhancement. Speech Communication, 53(4):465–494, 2011.
[35] D. Rethage, J. Pons, and X. Serra. A wavenet for speech denoising.In IEEE International Conference on Acoustics, Speech and SignalProcessing (ICASSP), pages 5069–5073. IEEE, 2018.
[36] B. Rivet, W. Wang, S. M. Naqvi, and J. A. Chambers. Audiovisualspeech source separation: An overview of key methodologies. IEEESignal Processing Magazine, 31(3):125–134, 2014.
[37] A. W. Rix, J. G. Beerends, M. P. Hollier, and A. P. Hekstra. Perceptualevaluation of speech quality (pesq)-a new method for speech qualityassessment of telephone networks and codecs. In IEEE InternationalConference on Acoustics, Speech, and Signal Processing, volume 2,pages 749–752. IEEE, 2001.
[38] L. D. Rosenblum. Speech perception as a multimodal phenomenon.Current Directions in Psychological Science, 17(6):405–409, 2008.
[39] C. H. Taal, R. C. Hendriks, R. Heusdens, and J. Jensen. An algorithm forintelligibility prediction of time–frequency weighted noisy speech. IEEETransactions on Audio, Speech, and Language Processing, 19(7):2125–2136, 2011.
[40] K. Tan, J. Chen, and D. L. Wang. Gated residual networks with dilatedconvolutions for supervised speech separation. In IEEE InternationalConference on Acoustics, Speech and Signal Processing (ICASSP), pages21–25. IEEE, 2018.
[41] K. Tan, J. Chen, and D. L. Wang. Gated residual networks withdilated convolutions for monaural speech enhancement. IEEE/ACMTransactions on Audio, Speech, and Language Processing, 27(1):189–198, 2019.
[42] K. Tan and D. L. Wang. A two-stage approach to noisy cochannelspeech separation with gated residual networks. In Interspeech, pages3484–3488, 2018.
[43] A. van den Oord, S. Dieleman, H. Zen, K. Simonyan, O. Vinyals,A. Graves, N. Kalchbrenner, A. Senior, and K. Kavukcuoglu. Wavenet:A generative model for raw audio. In 9th ISCA Speech SynthesisWorkshop, pages 125–125, 2016.
[44] D. L. Wang and G. J. Brown, editors. Computational auditory sceneanalysis: Principles, algorithms, and applications. Wiley-IEEE press,2006.
[45] D. L. Wang and J. Chen. Supervised speech separation based on deeplearning: An overview. IEEE/ACM Transactions on Audio, Speech, andLanguage Processing, 26(10):1702–1726, 2018.
[46] J. Wang, J. Chen, D. Su, L. Chen, M. Yu, Y. Qian, and D. Yu. Deepextractor network for target speaker recovery from single channel speechmixtures. In Interspeech, pages 307–311, 2018.
[47] P. Wang, K. Tan, and D. L. Wang. Bridging the gap between monauralspeech enhancement and recognition with distortion-independent acous-tic modeling. In Interspeech, 2019.
[48] Q. Wang, H. Muckenhirn, K. Wilson, P. Sridhar, Z. Wu, J. Hershey, R. A.Saurous, R. J. Weiss, Y. Jia, and I. L. Moreno. Voicefilter: Targeted voiceseparation by speaker-conditioned spectrogram masking. Interspeech,2019.
[49] Y. Wang and D. L. Wang. Towards scaling up classification-basedspeech separation. IEEE Transactions on Audio, Speech, and LanguageProcessing, 21(7):1381–1390, 2013.
[50] Z.-Q. Wang, K. Tan, and D. L. Wang. Deep learning based phase recon-struction for speaker separation: A trigonometric perspective. In IEEEInternational Conference on Acoustics, Speech and Signal Processing(ICASSP), pages 71–75. IEEE, 2019.
[51] C. Weng, D. Yu, M. L. Seltzer, and J. Droppo. Deep neural networks forsingle-channel multi-talker speech recognition. IEEE/ACM Transactionson Audio, Speech and Language Processing (TASLP), 23(10):1670–1679, 2015.
[52] B. Wu, K. Li, M. Yang, and C.-H. Lee. A reverberation-time-awareapproach to speech dereverberation based on deep neural networks.IEEE/ACM Transactions on Audio, Speech, and Language Processing,25(1):102–111, 2016.
[53] J. Wu, Y. Xu, S.-X. Zhang, L.-W. Chen, M. Yu, L. Xie, and D. Yu.Time domain audio visual speech separation. In IEEE Automatic SpeechRecognition and Understanding Workshop (ASRU), 2019.
[54] Z. Wu, S. Sivadas, Y. K. Tan, M. Bin, and R. S. M. Goh. Multi-modalhybrid deep neural network for speech enhancement. arXiv preprintarXiv:1606.04750, 2016.
[55] X. Xiao, S. Zhao, D. H. H. Nguyen, X. Zhong, D. L. Jones, E. S. Chng,and H. Li. Speech dereverberation for enhancement and recognitionusing dynamic features constrained deep neural networks and featureadaptation. EURASIP Journal on Advances in Signal Processing,2016(1):4, 2016.
[56] T. Yoshioka and T. Nakatani. Generalization of multi-channel linearprediction methods for blind mimo impulse response shortening. IEEETransactions on Audio, Speech, and Language Processing, 20(10):2707–2720, 2012.
[57] D. Yu, M. Kolbæk, Z.-H. Tan, and J. Jensen. Permutation invarianttraining of deep models for speaker-independent multi-talker speech

13
separation. In IEEE International Conference on Acoustics, Speech andSignal Processing (ICASSP), pages 241–245. IEEE, 2017.
[58] Y. Zhao, Z.-Q. Wang, and D. L. Wang. Two-stage deep learningfor noisy-reverberant speech enhancement. IEEE/ACM transactions onAudio, Speech, and Language Processing, 27(1):53–62, 2019.