athletic black book - docs.hedgeye.comdocs.hedgeye.com/he_athleticbb_dec2014.pdf · athletic black...
TRANSCRIPT
ATHLETIC BLACK BOOK NIKE, UNDER ARMOUR, ADIDAS, FOOT LOCKER, HIBBETT, DICK’S, FINISH LINE
DEC 18, 2014
BRIAN MCGOUGH ALEC RICHARDS
HEDGEYE 2
DISCLAIMER Hedgeye Risk Management is a registered investment advisor, registered with the State of Connecticut. Hedgeye Risk Management is not a broker dealer and does not provide investment advice for individuals. This research does not constitute an offer to sell, or a solicitation of an offer to buy any security. This research is presented without regard to individual investment preferences or risk parameters; it is general information and does not constitute specific investment advice. This presentation is based on information from sources believed to be reliable. Hedgeye Risk Management is not responsible for errors, inaccuracies or omissions of information. The opinions and conclusions contained in this report are those of Hedgeye Risk Management, and are intended solely for the use of Hedgeye Risk Management’s clients and subscribers. In reaching these opinions and conclusions, Hedgeye Risk Management and its employees have relied upon research conducted by Hedgeye Risk Management’s employees, which is based upon sources considered credible and reliable within the industry. Hedgeye Risk Management is not responsible for the validity or authenticity of the information upon which it has relied. TERMS OF USE This report is intended solely for the use of its recipient. Re-distribution or republication of this report and its contents are prohibited. For more detail please refer to the appropriate sections of the Hedgeye Services Agreement and the Terms of Use at www.hedgeye.com
LEGAL
HEDGEYE 3
1
2
3
KEY CONCLUSIONS
ECONOMIC CYCLE TRUMPS THE SNEAKER CYCLE There is no doubt that a sneaker cycle exists – or rather – used to exist. But now that the industry is maturing in the US, the economic cycle trumps all.
INNOVATION COMES IN ALL SHAPES AND SIZES Product innovation is critical in this space, but we think that Nike will soon start to innovate in other areas that will turn this industry upside down.
BRICK & MORTAR RETAIL MIGHT NEVER GROW AGAIN By our math, we need to 6% footwear growth in a given year for B&M stores to grow.
HEDGEYE 4
4
5
6
KEY CONCLUSIONS
SURVEY SAYS… Our consumer survey show how disadvantaged the traditional retailers are, and how ill equipped they are to handle this change. Nike is done placating those that won’t evolve. Evolution costs money.
CONTENT WINS Perhaps a cliché, but in this instance, it really matters. Brands can capture almost 20 points in higher gross margins by changing up the online experience and offering a better alternative to the 40-year-old model. Nike is the clear winner, and should drive its online sales from 6% of total today to 18% in five years. That’s an extra $7bn in sales at a 70% gross margin.
BUT IT’S STILL A ZERO SUM GAME Best ideas on the short side include FL, HIBB, and DKS. We think that all of these names will show a meaningful falloff in margins, asset utilization and earnings over the next 2-3 years.
HEDGEYE 5
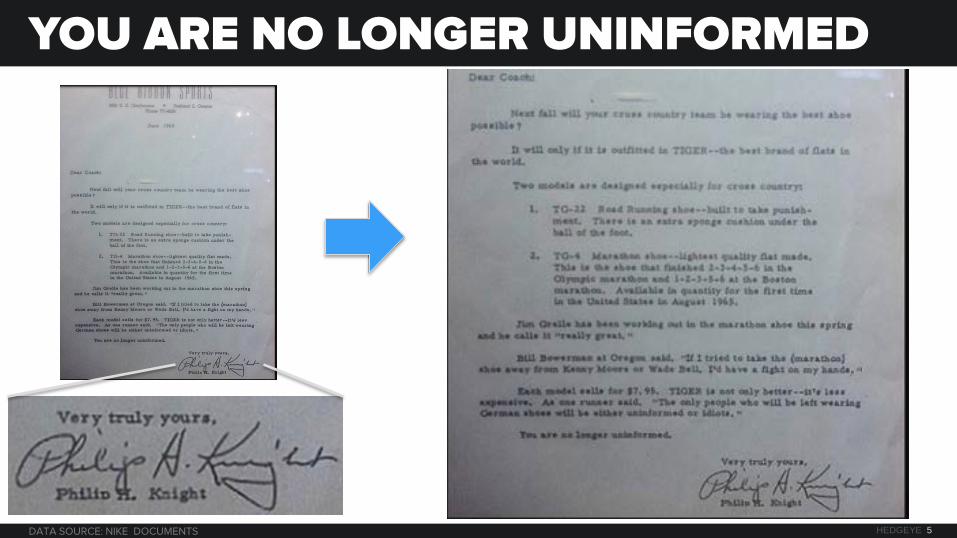
YOU ARE NO LONGER UNINFORMED
DATA SOURCE: NIKE DOCUMENTS
ATHLETIC FOOTWEAR & APPAREL SIZE AND SCOPE
HEDGEYE 7
OLD FORMAT = $800/SQUARE FT NEW FORMAT = $1,300 SQ FT
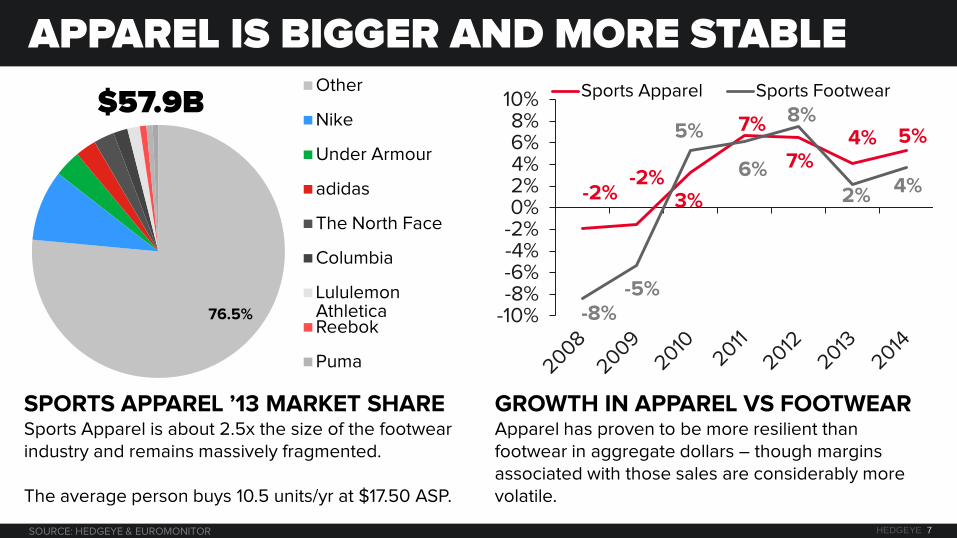
APPAREL IS BIGGER AND MORE STABLE
SPORTS APPAREL ’13 MARKET SHARE Sports Apparel is about 2.5x the size of the footwear industry and remains massively fragmented. The average person buys 10.5 units/yr at $17.50 ASP.
GROWTH IN APPAREL VS FOOTWEAR Apparel has proven to be more resilient than footwear in aggregate dollars – though margins associated with those sales are considerably more volatile.
SOURCE: HEDGEYE & EUROMONITOR
76.5%
Other
Nike
Under Armour
adidas
The North Face
Columbia
Lululemon Athletica Reebok
Puma
$57.9B
-2% -2%
3%
7%
7% 4% 5%
-8% -5%
5%
6%
8%
2% 4%
-10% -8% -6% -4% -2% 0% 2% 4% 6% 8%
10% Sports Apparel Sports Footwear
HEDGEYE 8
OLD FORMAT = $800/SQUARE FT NEW FORMAT = $1,300 SQ FT
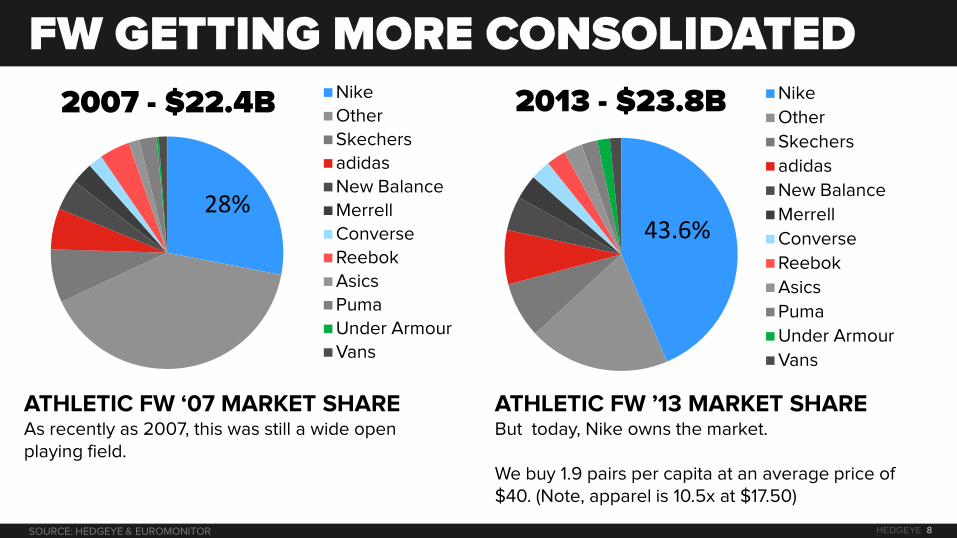
FW GETTING MORE CONSOLIDATED
28%
2007 - $22.4B Nike
Other
Skechers
adidas
New Balance
Merrell
Converse
Reebok
Asics
Puma
Under Armour
Vans
ATHLETIC FW ‘07 MARKET SHARE As recently as 2007, this was still a wide open playing field.
ATHLETIC FW ’13 MARKET SHARE But today, Nike owns the market. We buy 1.9 pairs per capita at an average price of $40. (Note, apparel is 10.5x at $17.50)
SOURCE: HEDGEYE & EUROMONITOR
43.6%
2013 - $23.8B Nike
Other
Skechers
adidas
New Balance
Merrell
Converse
Reebok
Asics
Puma
Under Armour
Vans
HEDGEYE 9
OLD FORMAT = $800/SQUARE FT NEW FORMAT = $1,300 SQ FT
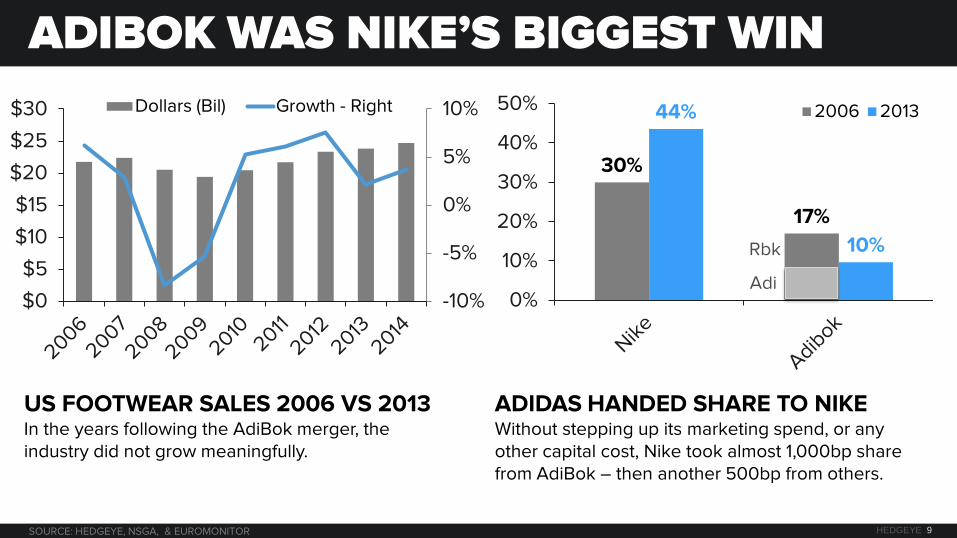
ADIBOK WAS NIKE’S BIGGEST WIN
US FOOTWEAR SALES 2006 VS 2013 In the years following the AdiBok merger, the industry did not grow meaningfully.
ADIDAS HANDED SHARE TO NIKE Without stepping up its marketing spend, or any other capital cost, Nike took almost 1,000bp share from AdiBok – then another 500bp from others.
SOURCE: HEDGEYE, NSGA, & EUROMONITOR
-10%
-5%
0%
5%
10%
$0
$5
$10
$15
$20
$25
$30 Dollars (Bil) Growth - Right
30%
17%
44%
10%
0%
10%
20%
30%
40%
50% 2006 2013
Adi
Rbk
HEDGEYE 10
OLD FORMAT = $800/SQUARE FT NEW FORMAT = $1,300 SQ FT
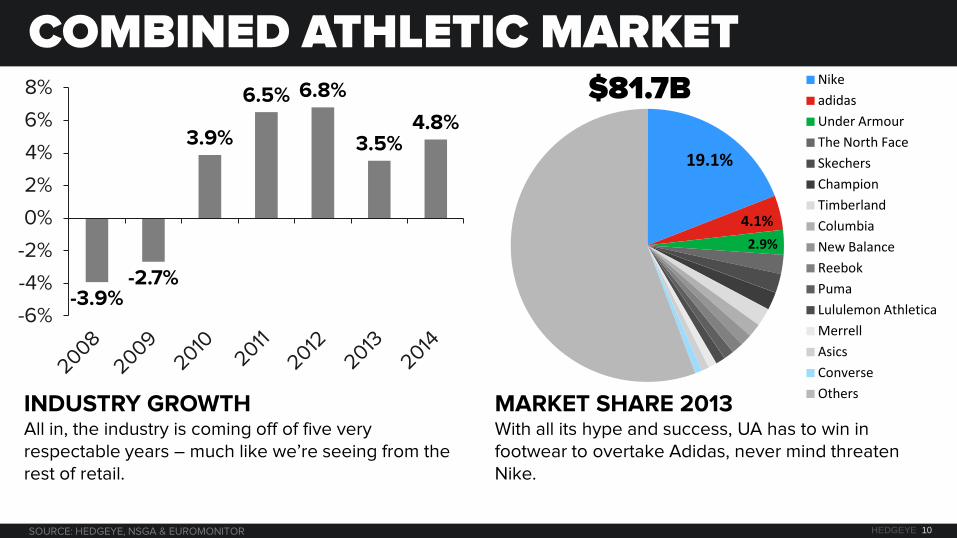
COMBINED ATHLETIC MARKET
INDUSTRY GROWTH All in, the industry is coming off of five very respectable years – much like we’re seeing from the rest of retail.
MARKET SHARE 2013 With all its hype and success, UA has to win in footwear to overtake Adidas, never mind threaten Nike.
SOURCE: HEDGEYE, NSGA & EUROMONITOR
19.1%
4.1% 2.9%
Nike adidas Under Armour The North Face Skechers Champion Timberland Columbia New Balance Reebok Puma Lululemon Athletica Merrell Asics Converse Others
$81.7B
-3.9% -2.7%
3.9%
6.5% 6.8%
3.5% 4.8%
-6%
-4%
-2%
0%
2%
4%
6%
8%
HEDGEYE 11
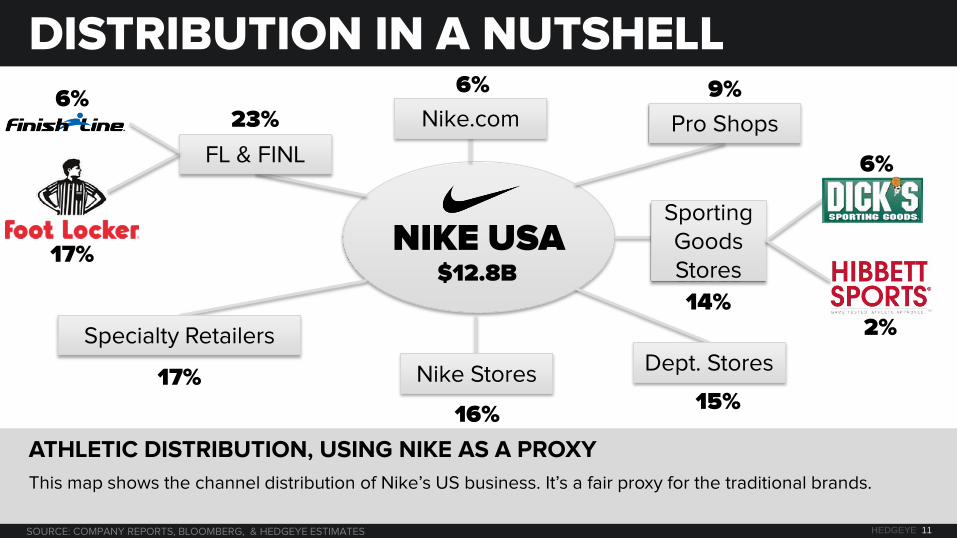
DISTRIBUTION IN A NUTSHELL
ATHLETIC DISTRIBUTION, USING NIKE AS A PROXY
This map shows the channel distribution of Nike’s US business. It’s a fair proxy for the traditional brands.
NIKE USA
Nike Stores
16%
Nike.com
6%
$12.8B
FL & FINL
23% 6%
17%
Specialty Retailers
17% Dept. Stores
Sporting Goods Stores
14% 2%
6%
15%
Pro Shops
9%
SOURCE: COMPANY REPORTS, BLOOMBERG, & HEDGEYE ESTIMATES
THE ‘MYTH’ OF THE SNEAKER CYCLE
HEDGEYE 13
-10%
-5%
0%
5%
10%
15%
20%
25%
30%
35%
40% DOLLARS UNITS ASP
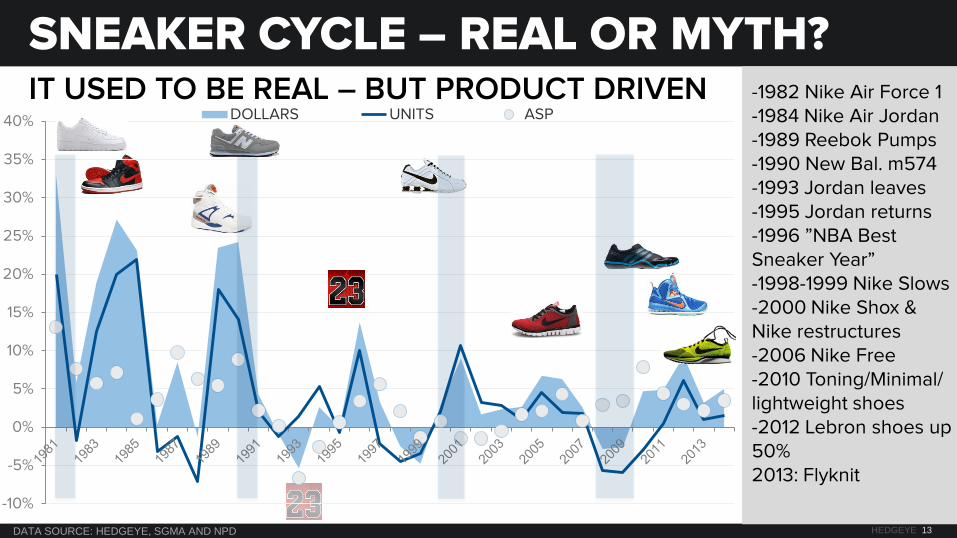
IT USED TO BE REAL – BUT PRODUCT DRIVEN
SNEAKER CYCLE – REAL OR MYTH? -1982 Nike Air Force 1 -1984 Nike Air Jordan -1989 Reebok Pumps -1990 New Bal. m574 -1993 Jordan leaves -1995 Jordan returns -1996 ”NBA Best Sneaker Year” -1998-1999 Nike Slows -2000 Nike Shox & Nike restructures -2006 Nike Free -2010 Toning/Minimal/ lightweight shoes -2012 Lebron shoes up 50% 2013: Flyknit
DATA SOURCE: HEDGEYE, SGMA AND NPD
HEDGEYE 14
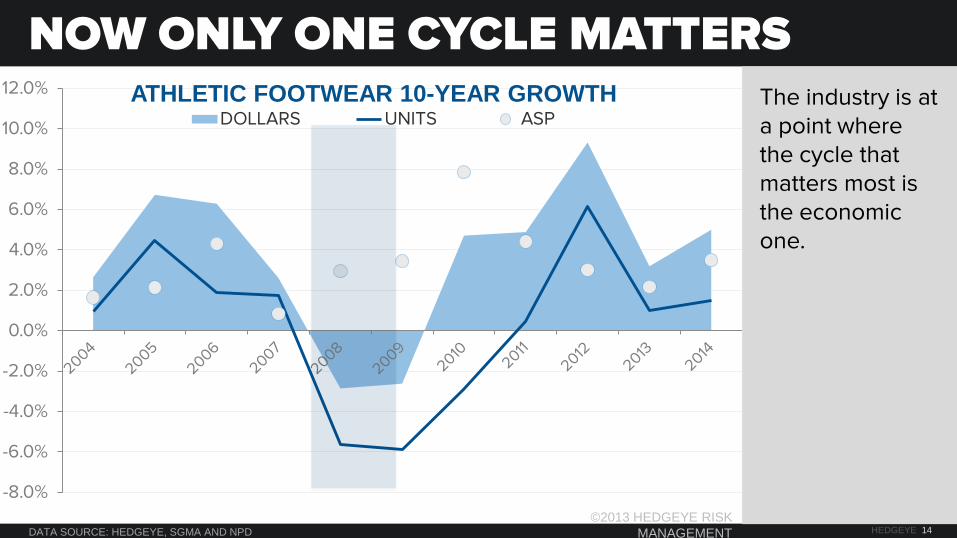
NOW ONLY ONE CYCLE MATTERS The industry is at a point where the cycle that matters most is the economic one.
DATA SOURCE: HEDGEYE, SGMA AND NPD
-8.0%
-6.0%
-4.0%
-2.0%
0.0%
2.0%
4.0%
6.0%
8.0%
10.0%
12.0% ATHLETIC FOOTWEAR 10-YEAR GROWTH DOLLARS UNITS ASP
©2013 HEDGEYE RISK MANAGEMENT
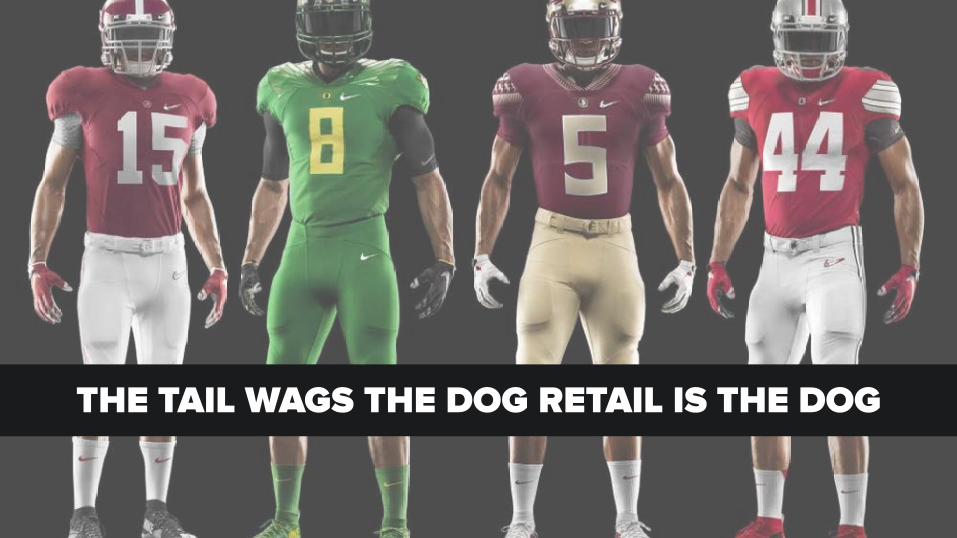
THE TAIL WAGS THE DOG RETAIL IS THE DOG
HEDGEYE 16
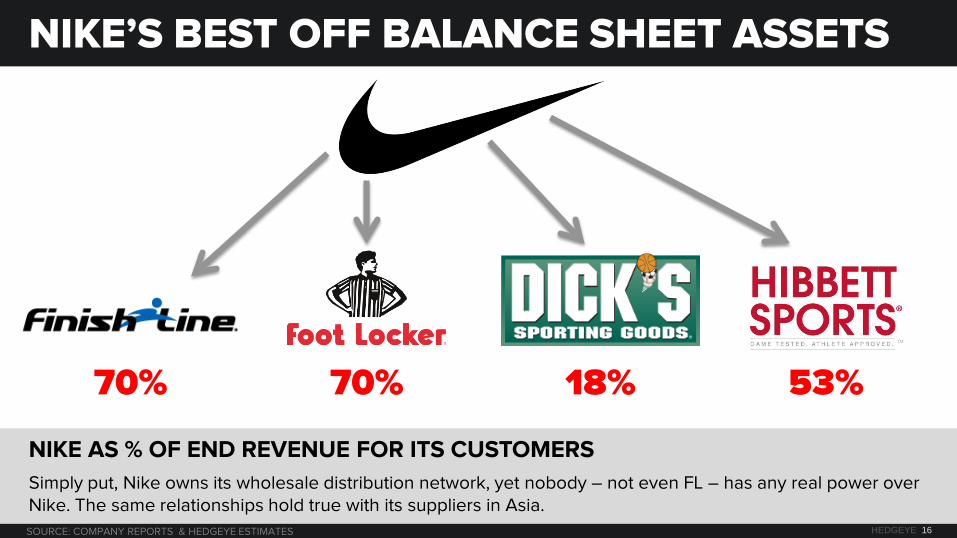
NIKE’S BEST OFF BALANCE SHEET ASSETS
NIKE AS % OF END REVENUE FOR ITS CUSTOMERS
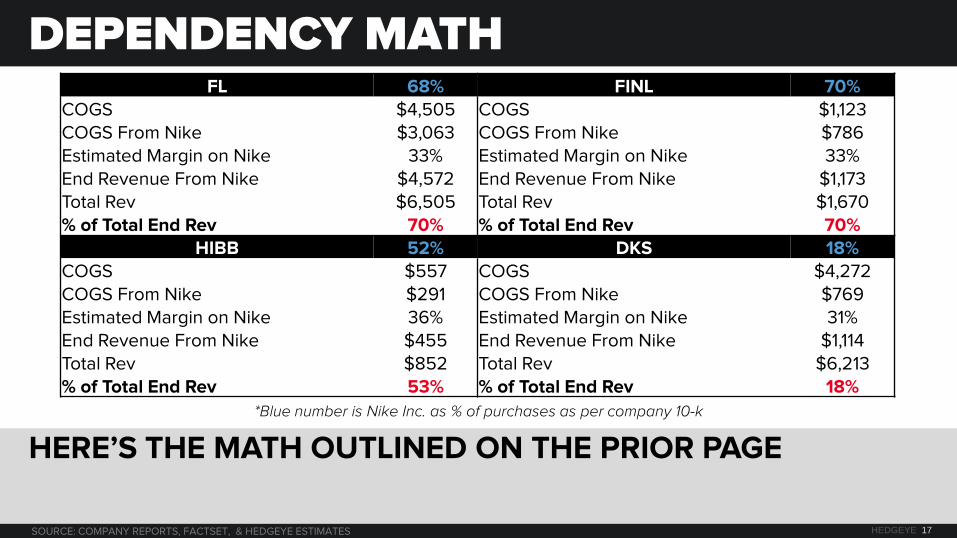
Simply put, Nike owns its wholesale distribution network, yet nobody – not even FL – has any real power over Nike. The same relationships hold true with its suppliers in Asia.
70% 70% 18% 53%
SOURCE: COMPANY REPORTS & HEDGEYE ESTIMATES
HEDGEYE 17
FL 68% FINL 70%
COGS $4,505 COGS $1,123
COGS From Nike $3,063 COGS From Nike $786
Estimated Margin on Nike 33% Estimated Margin on Nike 33%
End Revenue From Nike $4,572 End Revenue From Nike $1,173
Total Rev $6,505 Total Rev $1,670
% of Total End Rev 70% % of Total End Rev 70%
HIBB 52% DKS 18%
COGS $557 COGS $4,272
COGS From Nike $291 COGS From Nike $769
Estimated Margin on Nike 36% Estimated Margin on Nike 31%
End Revenue From Nike $455 End Revenue From Nike $1,114
Total Rev $852 Total Rev $6,213
% of Total End Rev 53% % of Total End Rev 18%
DEPENDENCY MATH
HERE’S THE MATH OUTLINED ON THE PRIOR PAGE
*Blue number is Nike Inc. as % of purchases as per company 10-k
SOURCE: COMPANY REPORTS, FACTSET, & HEDGEYE ESTIMATES
HEDGEYE 18
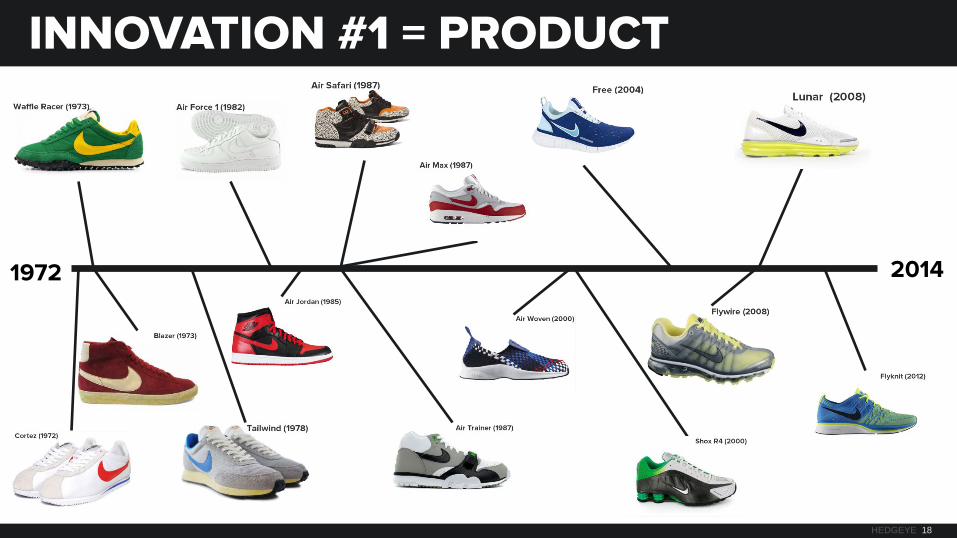
1972
INNOVATION #1 = PRODUCT
2014
HEDGEYE 19
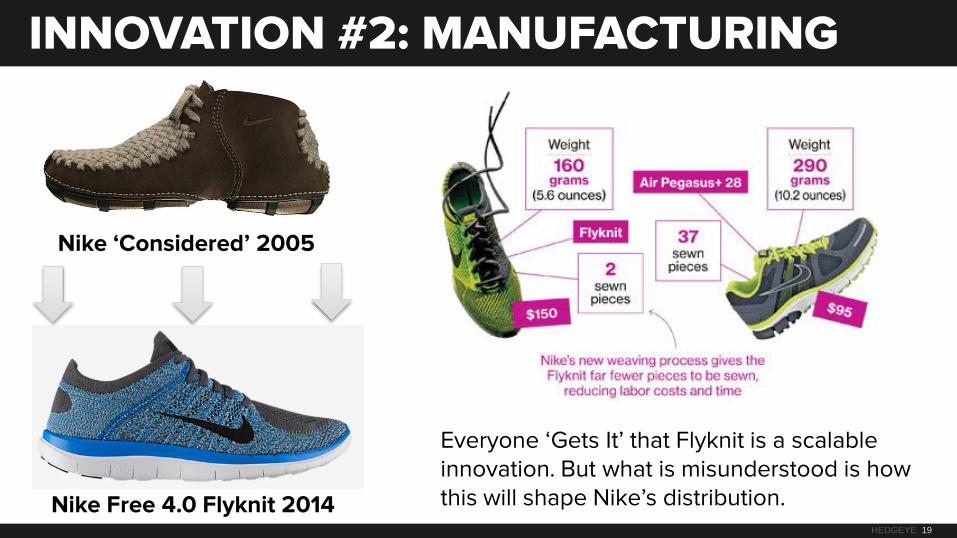
INNOVATION #2: MANUFACTURING
Nike ‘Considered’ 2005
Nike Free 4.0 Flyknit 2014
Everyone ‘Gets It’ that Flyknit is a scalable innovation. But what is misunderstood is how this will shape Nike’s distribution.
HEDGEYE 20
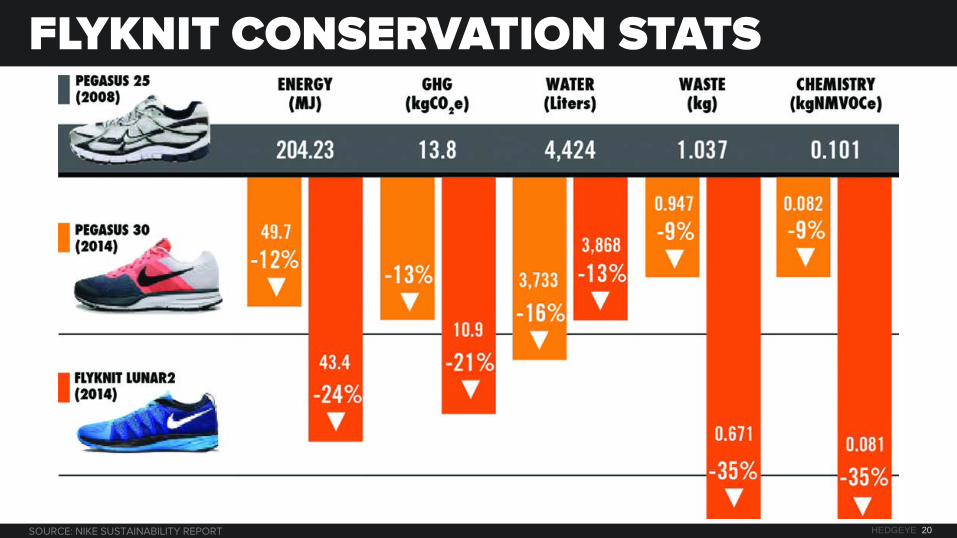
FLYKNIT CONSERVATION STATS
SOURCE: NIKE SUSTAINABILITY REPORT
QUESTION Why is it that footwear and
apparel retail is one of the few industries that is operating
today as it did 30 years ago?
HEDGEYE 22
•
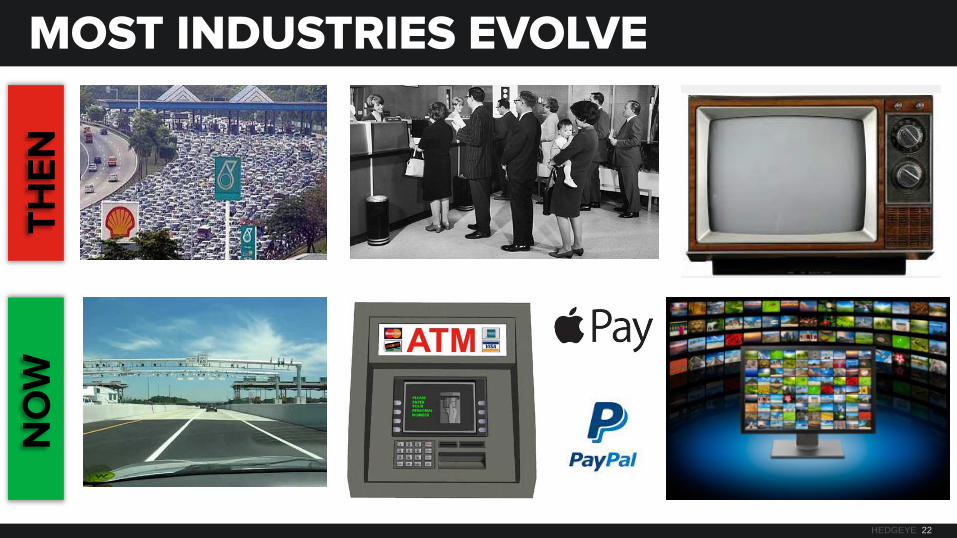
MOST INDUSTRIES EVOLVE T
HE
N
NO
W
HEDGEYE 23
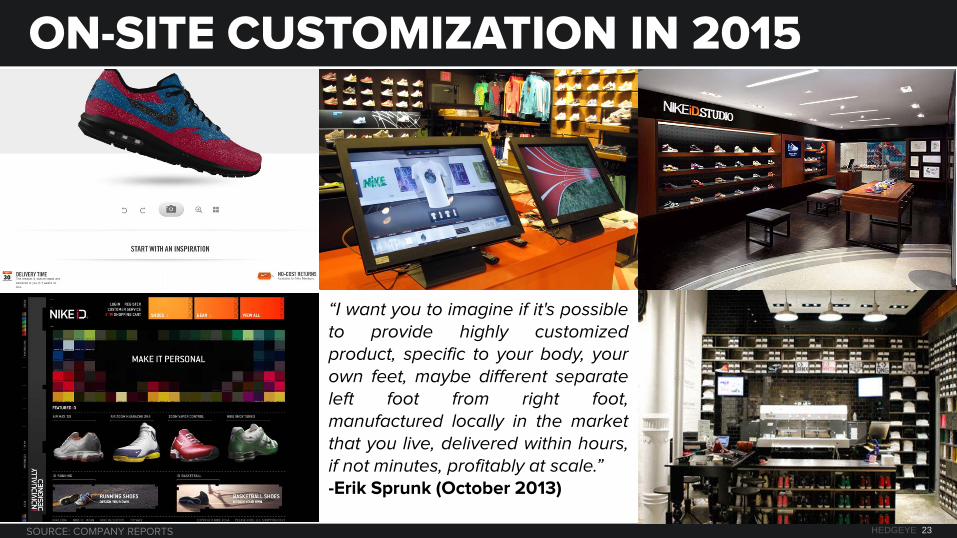
ON-SITE CUSTOMIZATION IN 2015
“I want you to imagine if it's possible to provide highly customized product, specific to your body, your own feet, maybe different separate left foot from right foot, manufactured locally in the market that you live, delivered within hours, if not minutes, profitably at scale.” -Erik Sprunk (October 2013)
SOURCE: COMPANY REPORTS
HEDGEYE 24
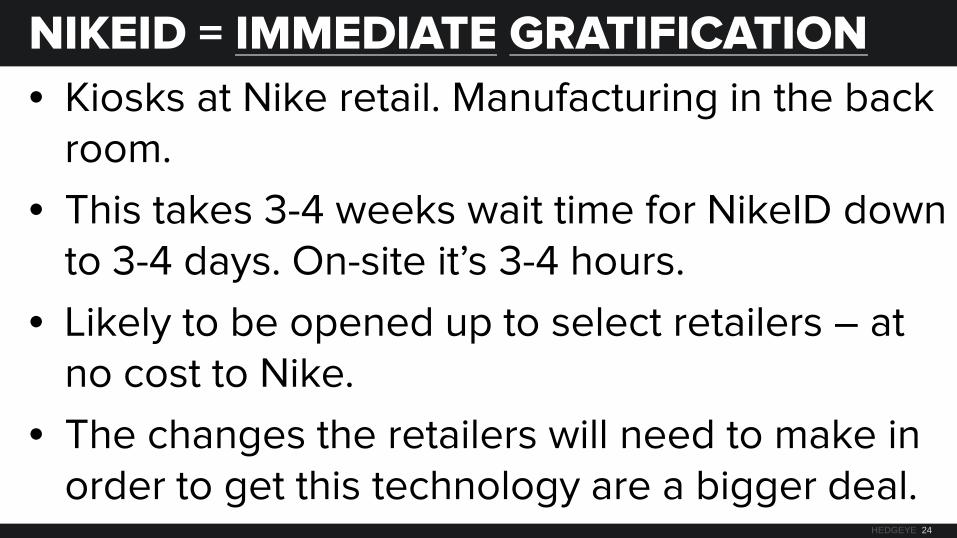
• Kiosks at Nike retail. Manufacturing in the back room.
• This takes 3-4 weeks wait time for NikeID down to 3-4 days. On-site it’s 3-4 hours.
• Likely to be opened up to select retailers – at no cost to Nike.
• The changes the retailers will need to make in order to get this technology are a bigger deal.
NIKEID = IMMEDIATE GRATIFICATION
HOW THIS IMPACTS DISTRIBUTION
HEDGEYE 26
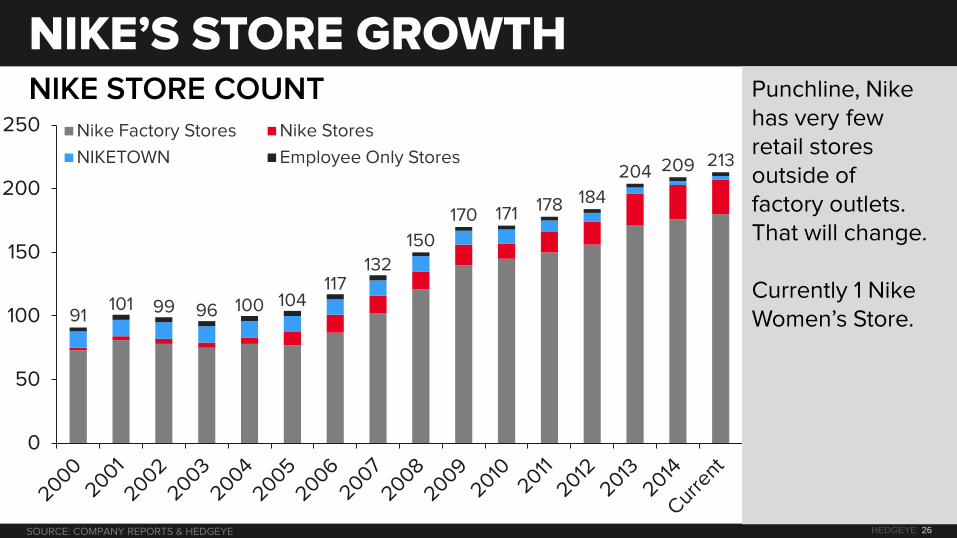
NIKE STORE COUNT
NIKE’S STORE GROWTH
91 101 99 96 100 104
117 132
150
170 171 178 184
204 209 213
0
50
100
150
200
250 Nike Factory Stores Nike Stores
NIKETOWN Employee Only Stores
Punchline, Nike has very few retail stores outside of factory outlets. That will change. Currently 1 Nike Women’s Store.
SOURCE: COMPANY REPORTS & HEDGEYE
HEDGEYE 27
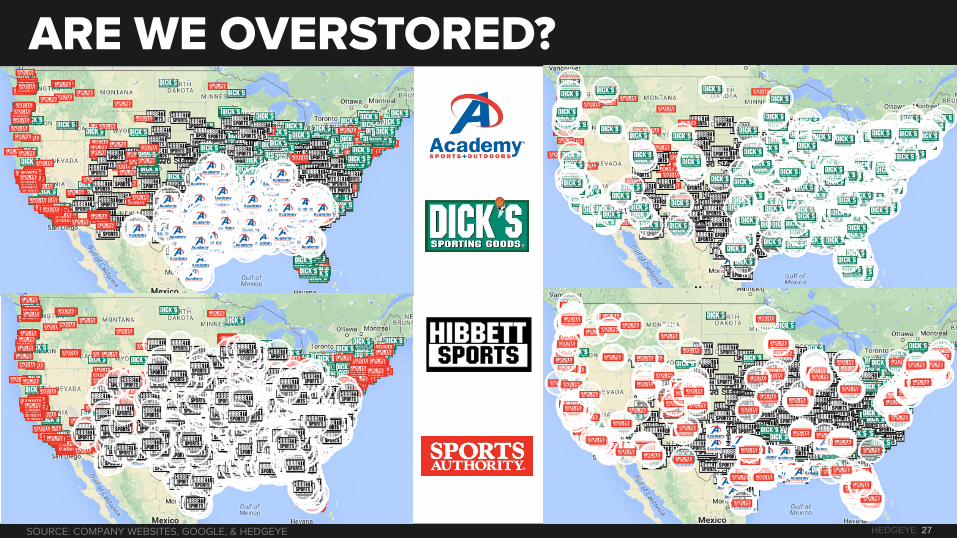
ARE WE OVERSTORED?
SOURCE: COMPANY WEBSITES, GOOGLE, & HEDGEYE
HEDGEYE 28
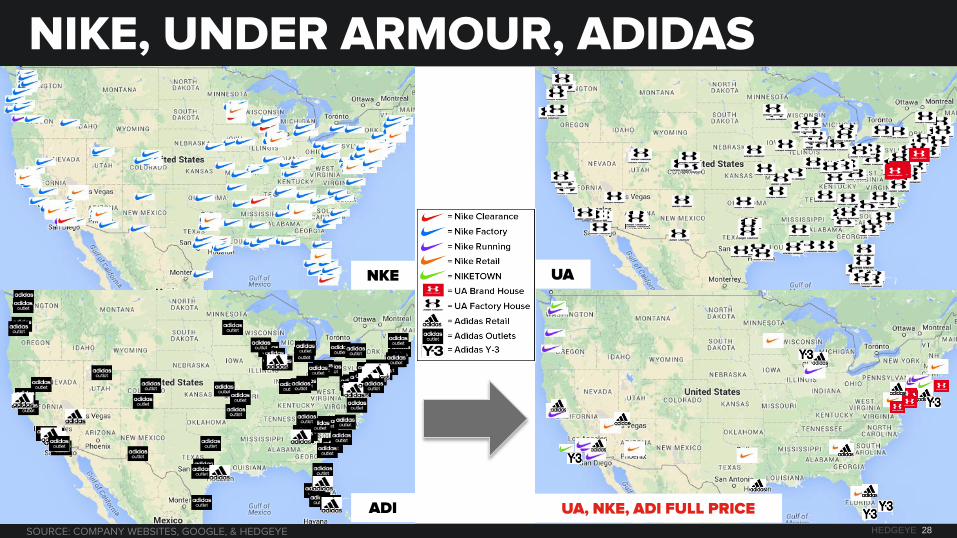
NIKE, UNDER ARMOUR, ADIDAS
UA, NKE, ADI FULL PRICE ADI
NKE UA
SOURCE: COMPANY WEBSITES, GOOGLE, & HEDGEYE
HEDGEYE 29
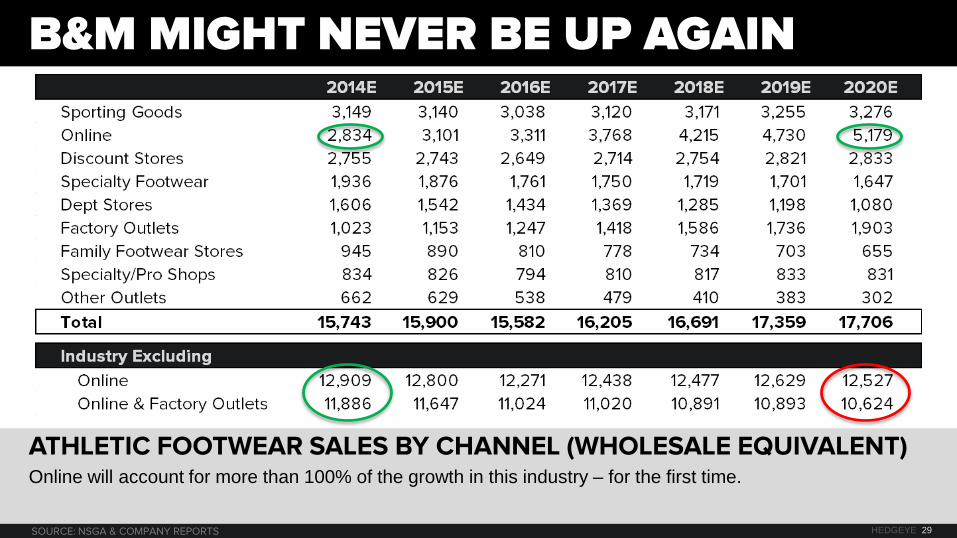
B&M MIGHT NEVER BE UP AGAIN
Online will account for more than 100% of the growth in this industry – for the first time. ATHLETIC FOOTWEAR SALES BY CHANNEL (WHOLESALE EQUIVALENT)
SOURCE: NSGA & COMPANY REPORTS
HEDGEYE 30
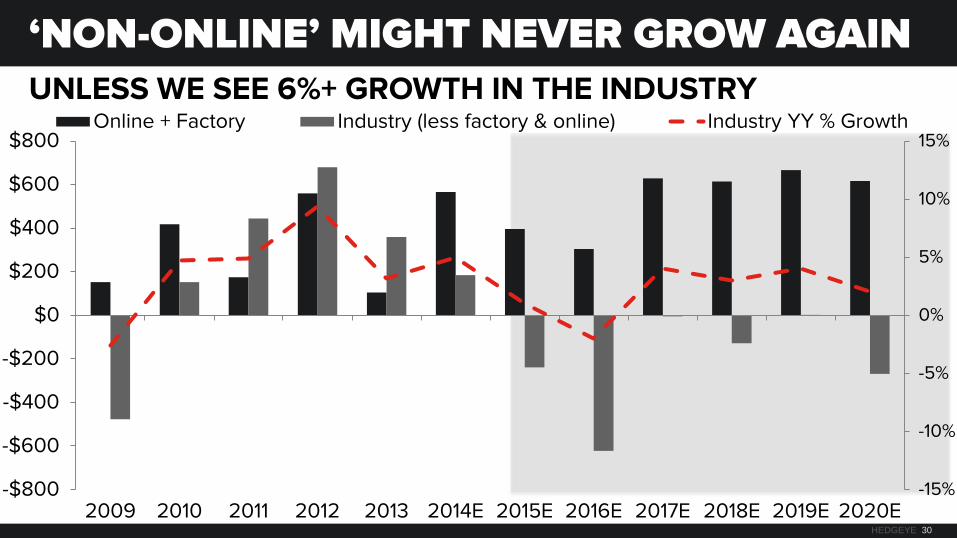
‘NON-ONLINE’ MIGHT NEVER GROW AGAIN UNLESS WE SEE 6%+ GROWTH IN THE INDUSTRY
-15%
-10%
-5%
0%
5%
10%
15%
-$800
-$600
-$400
-$200
$0
$200
$400
$600
$800
2009 2010 2011 2012 2013 2014E 2015E 2016E 2017E 2018E 2019E 2020E
Online + Factory Industry (less factory & online) Industry YY % Growth
HEDGEYE 31
$11,000
$12,000
$13,000
$14,000
$15,000
$16,000
$17,000
$18,000
2008 2009 2010 2011 2012 2013 2014 2015 2016 2017 2018 2019 2020
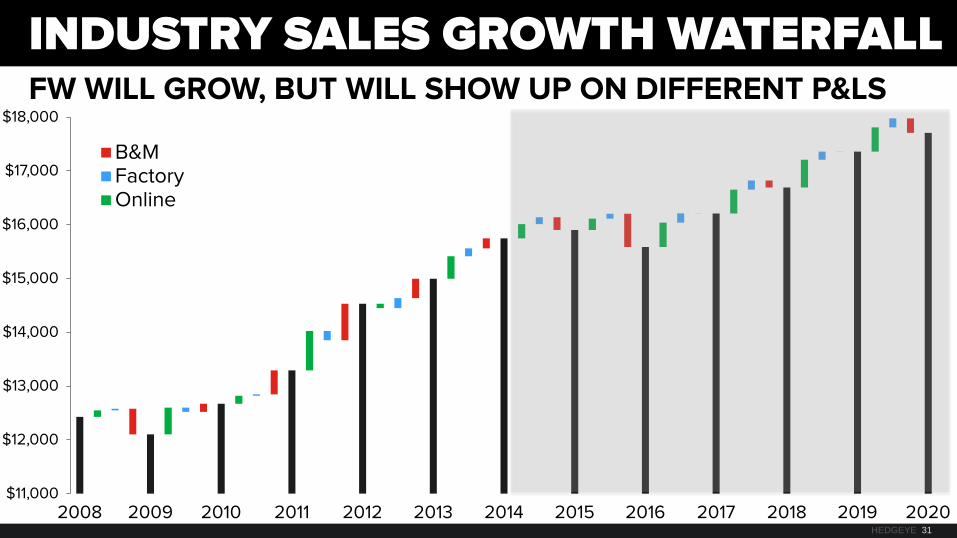
B&M Factory Online
INDUSTRY SALES GROWTH WATERFALL FW WILL GROW, BUT WILL SHOW UP ON DIFFERENT P&LS
HEDGEYE 32
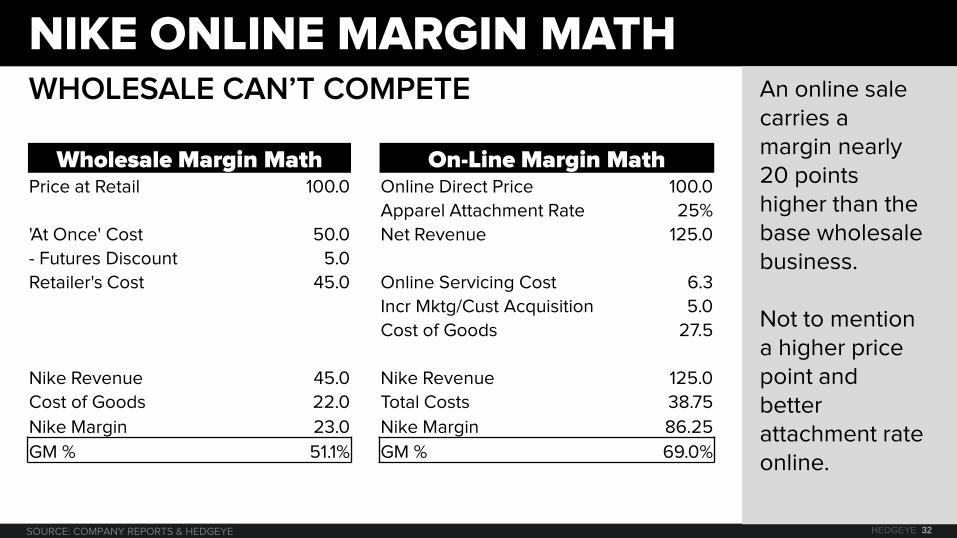
WHOLESALE CAN’T COMPETE
NIKE ONLINE MARGIN MATH An online sale carries a margin nearly 20 points higher than the base wholesale business. Not to mention a higher price point and better attachment rate online.
SOURCE: COMPANY REPORTS & HEDGEYE
Wholesale Margin Math On-Line Margin Math Price at Retail 100.0 Online Direct Price 100.0
Apparel Attachment Rate 25%
'At Once' Cost 50.0 Net Revenue 125.0
- Futures Discount 5.0
Retailer's Cost 45.0 Online Servicing Cost 6.3
Incr Mktg/Cust Acquisition 5.0
Cost of Goods 27.5
Nike Revenue 45.0 Nike Revenue 125.0
Cost of Goods 22.0 Total Costs 38.75
Nike Margin 23.0 Nike Margin 86.25
GM % 51.1% GM % 69.0%
HEDGEYE 33
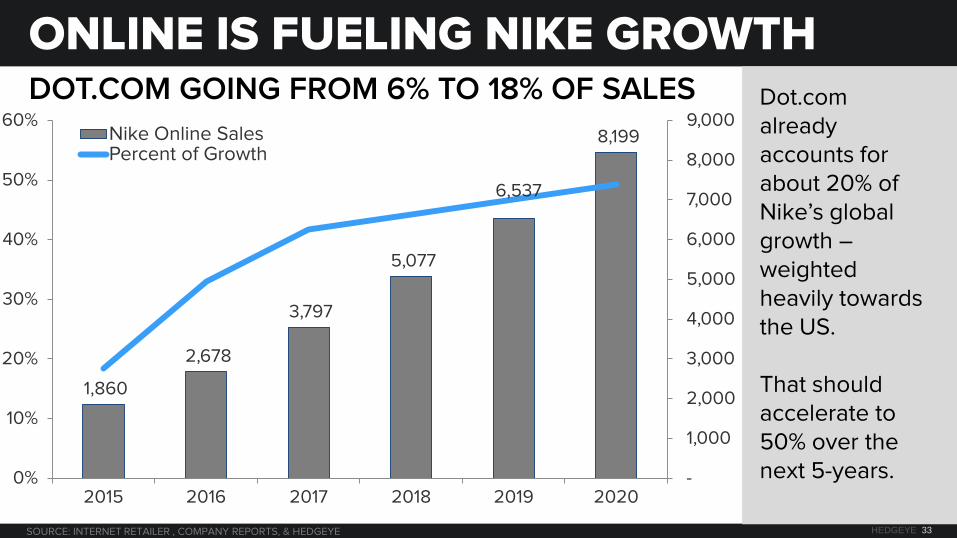
DOT.COM GOING FROM 6% TO 18% OF SALES
ONLINE IS FUELING NIKE GROWTH Dot.com already accounts for about 20% of Nike’s global growth – weighted heavily towards the US. That should accelerate to 50% over the next 5-years.
1,860
2,678
3,797
5,077
6,537
8,199
-
1,000
2,000
3,000
4,000
5,000
6,000
7,000
8,000
9,000
0%
10%
20%
30%
40%
50%
60%
2015 2016 2017 2018 2019 2020
Nike Online Sales Percent of Growth
SOURCE: INTERNET RETAILER , COMPANY REPORTS, & HEDGEYE
HEDGEYE 34
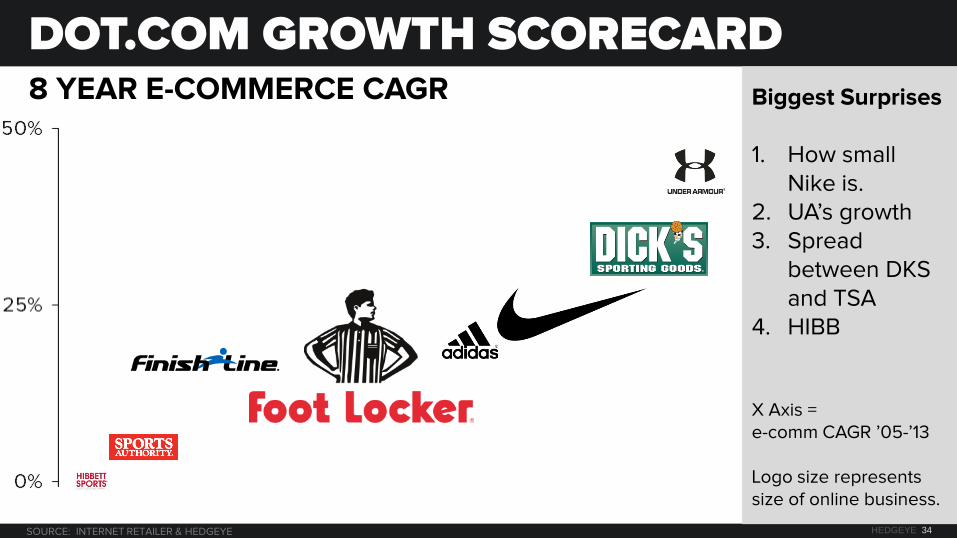
8 YEAR E-COMMERCE CAGR
DOT.COM GROWTH SCORECARD Biggest Surprises 1. How small
Nike is. 2. UA’s growth 3. Spread
between DKS and TSA
4. HIBB X Axis = e-comm CAGR ’05-’13 Logo size represents size of online business.
SOURCE: INTERNET RETAILER & HEDGEYE

HEDGEYE 35
MOST IMPORTANT CATEGORIES OUTPERFORMING THE GROUP
ON-LINE % GOING UP IN KEY CATEGORIES
Casual footwear accounts for about 27% of the industry. Running ≈ 28% Training ≈ 18% Basketball ≈ 15%
DATA SOURCE: HEDGEYE, SGMA AND NPD
0.0%
5.0%
10.0%
15.0%
20.0%
25.0% Casual Running Training Basketball

HEDGEYE 36
$0
$1,000
$2,000
$3,000
$4,000
$5,000
$6,000
$7,000
$0
$100
$200
$300
$400
$500
$600
$700
$800
$900 Amazon (Apparel & Foot) - Right Axis Zappos (Apparel & Foot) - Right Axis Foot Locker Nike Dick's Sporting Goods The Finish Line Under Armour adidas The Sports Authority Hibbett
US ONLINE SALES ($MM)
E-COMMERCE LANDSCAPE How can FL not be worried about this chart? Nike is accelerating… +70% last Q. Amazon and Zappos doing significant sales in the category.
SOURCE: INTERNET RETAILER, EUROMONITOR, COMPANY REPORTS, & HEDGEYE
ONLINE DEEP DIVE (SURVEY)

HEDGEYE 38
COMPARED TO A YEAR AGO ARE YOU TAKING MORE OR LESS OF PHYSICAL STORE PURCHASES ONLINE IN THE FOLLOWING CATEGORIES?
ONLINE CATEGORY SHIFT All three athletic categories are higher than industry mean as it relates to shift online.
DATA SOURCE: HEDGEYE RISK MANAGEMENT
15% 13%
20%
13%
16%
20% 19% 17%
20%
5%
8%
12% 13%
23%
18%
22%
17% 17%
31%
0%
5%
10%
15%
20%
25%
30%
35%
HEDGEYE 39
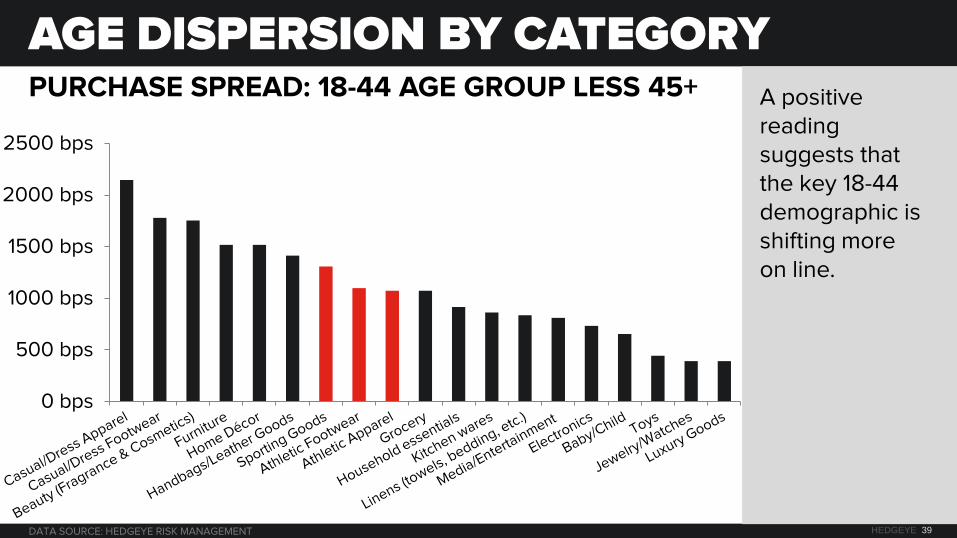
PURCHASE SPREAD: 18-44 AGE GROUP LESS 45+
AGE DISPERSION BY CATEGORY A positive reading suggests that the key 18-44 demographic is shifting more on line.
DATA SOURCE: HEDGEYE RISK MANAGEMENT
0 bps
500 bps
1000 bps
1500 bps
2000 bps
2500 bps
HEDGEYE 40
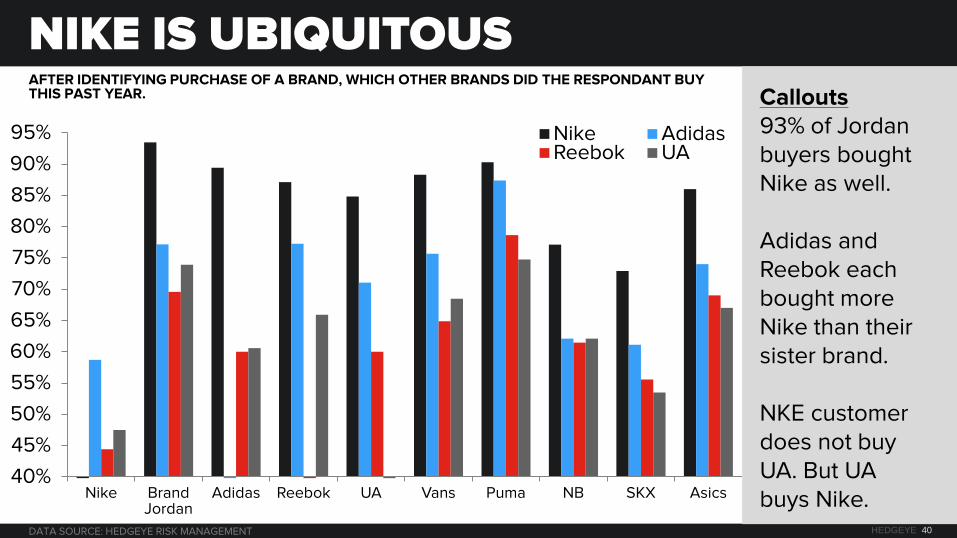
AFTER IDENTIFYING PURCHASE OF A BRAND, WHICH OTHER BRANDS DID THE RESPONDANT BUY THIS PAST YEAR.
NIKE IS UBIQUITOUS Callouts 93% of Jordan buyers bought Nike as well. Adidas and Reebok each bought more Nike than their sister brand. NKE customer does not buy UA. But UA buys Nike.
DATA SOURCE: HEDGEYE RISK MANAGEMENT
40%
45%
50%
55%
60%
65%
70%
75%
80%
85%
90%
95%
Nike Brand Jordan
Adidas Reebok UA Vans Puma NB SKX Asics
Nike Adidas Reebok UA
HEDGEYE 41
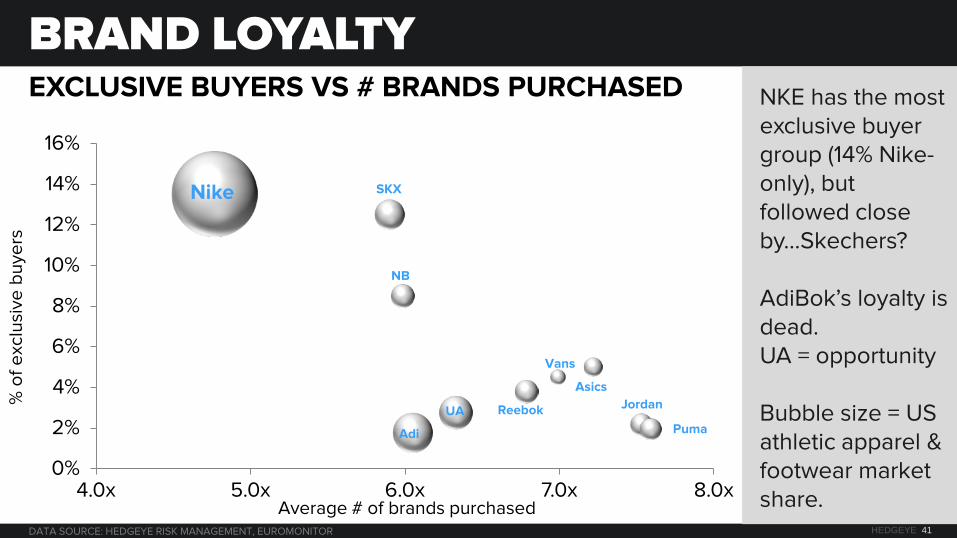
EXCLUSIVE BUYERS VS # BRANDS PURCHASED
BRAND LOYALTY NKE has the most exclusive buyer group (14% Nike-only), but followed close by…Skechers? AdiBok’s loyalty is dead. UA = opportunity Bubble size = US athletic apparel & footwear market share.
DATA SOURCE: HEDGEYE RISK MANAGEMENT, EUROMONITOR
Nike
Jordan
Adi
Reebok UA
Vans
Puma
NB
SKX
Asics
0%
2%
4%
6%
8%
10%
12%
14%
16%
4.0x 5.0x 6.0x 7.0x 8.0x Average # of brands purchased
% o
f e
xclu
sive
bu
yers
HEDGEYE 42
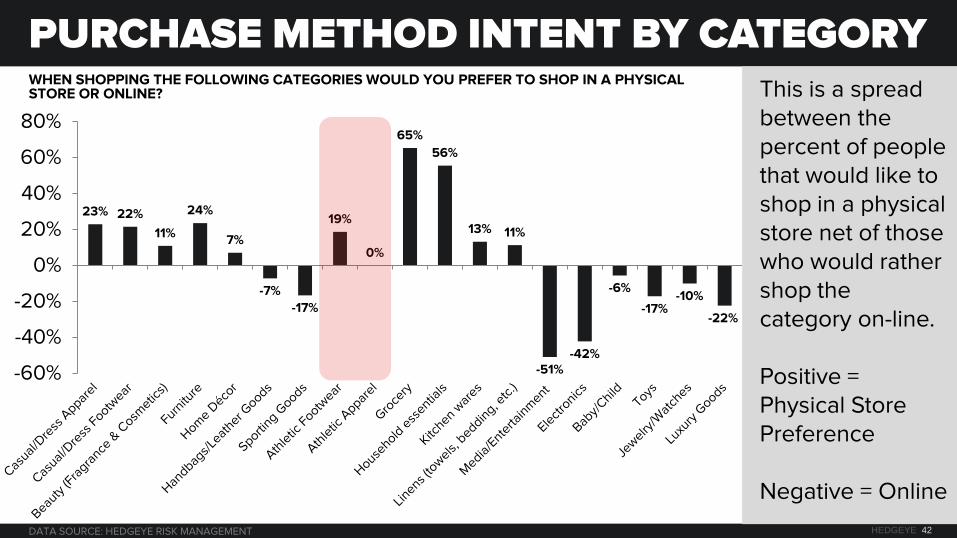
WHEN SHOPPING THE FOLLOWING CATEGORIES WOULD YOU PREFER TO SHOP IN A PHYSICAL STORE OR ONLINE?
PURCHASE METHOD INTENT BY CATEGORY This is a spread between the percent of people that would like to shop in a physical store net of those who would rather shop the category on-line. Positive = Physical Store Preference Negative = Online
DATA SOURCE: HEDGEYE RISK MANAGEMENT
23% 22%
11%
24%
7%
-7%
-17%
19%
0%
65%
56%
13% 11%
-51% -42%
-6%
-17% -10%
-22%
-60%
-40%
-20%
0%
20%
40%
60%
80%
HEDGEYE 43
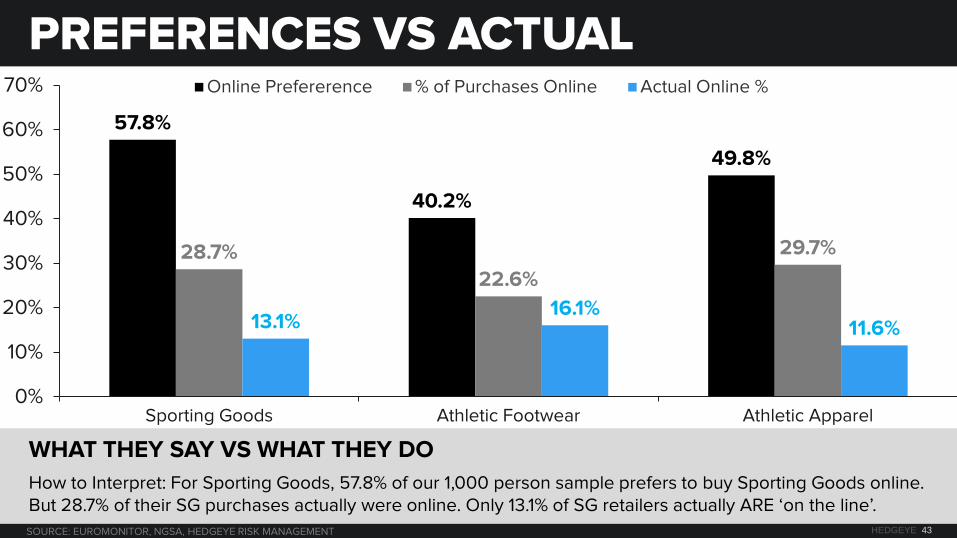
PREFERENCES VS ACTUAL
WHAT THEY SAY VS WHAT THEY DO
How to Interpret: For Sporting Goods, 57.8% of our 1,000 person sample prefers to buy Sporting Goods online. But 28.7% of their SG purchases actually were online. Only 13.1% of SG retailers actually ARE ‘on the line’.
57.8%
40.2%
49.8%
28.7%
22.6%
29.7%
13.1% 16.1%
11.6%
0%
10%
20%
30%
40%
50%
60%
70%
Sporting Goods Athletic Footwear Athletic Apparel
Online Prefererence % of Purchases Online Actual Online %
SOURCE: EUROMONITOR, NGSA, HEDGEYE RISK MANAGEMENT
HEDGEYE 44
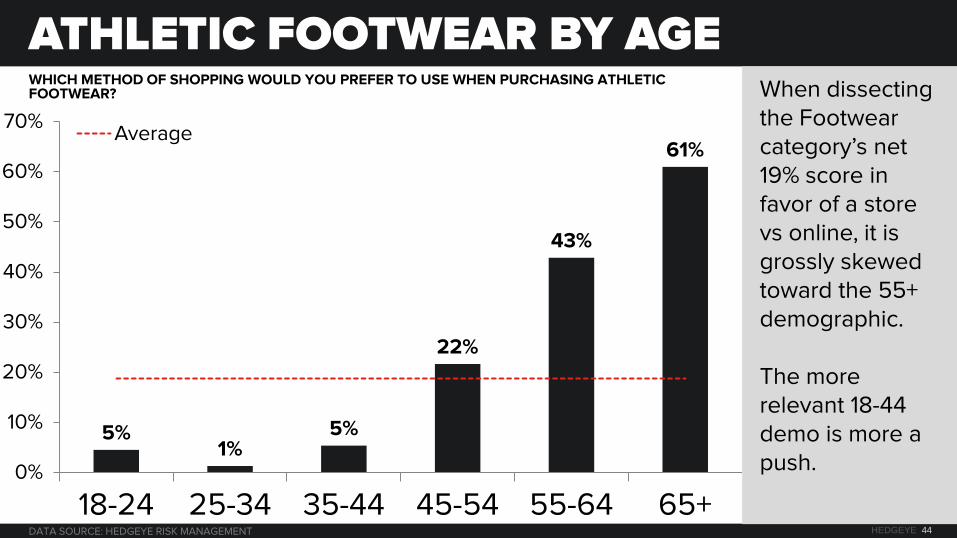
WHICH METHOD OF SHOPPING WOULD YOU PREFER TO USE WHEN PURCHASING ATHLETIC FOOTWEAR?
ATHLETIC FOOTWEAR BY AGE When dissecting the Footwear category’s net 19% score in favor of a store vs online, it is grossly skewed toward the 55+ demographic. The more relevant 18-44 demo is more a push.
DATA SOURCE: HEDGEYE RISK MANAGEMENT
5% 1%
5%
22%
43%
61%
0%
10%
20%
30%
40%
50%
60%
70%
18-24 25-34 35-44 45-54 55-64 65+
Average
HEDGEYE 45
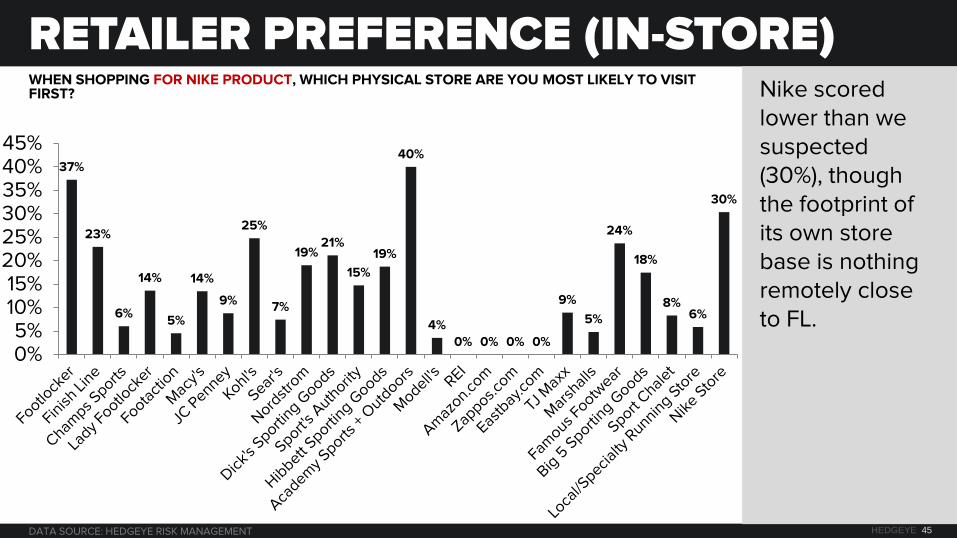
WHEN SHOPPING FOR NIKE PRODUCT, WHICH PHYSICAL STORE ARE YOU MOST LIKELY TO VISIT FIRST?
RETAILER PREFERENCE (IN-STORE) Nike scored lower than we suspected (30%), though the footprint of its own store base is nothing remotely close to FL.
DATA SOURCE: HEDGEYE RISK MANAGEMENT
37%
23%
6%
14%
5%
14%
9%
25%
7%
19% 21%
15%
19%
40%
4%
0% 0% 0% 0%
9%
5%
24%
18%
8% 6%
30%
0% 5%
10% 15%
20% 25% 30% 35% 40% 45%
HEDGEYE 46
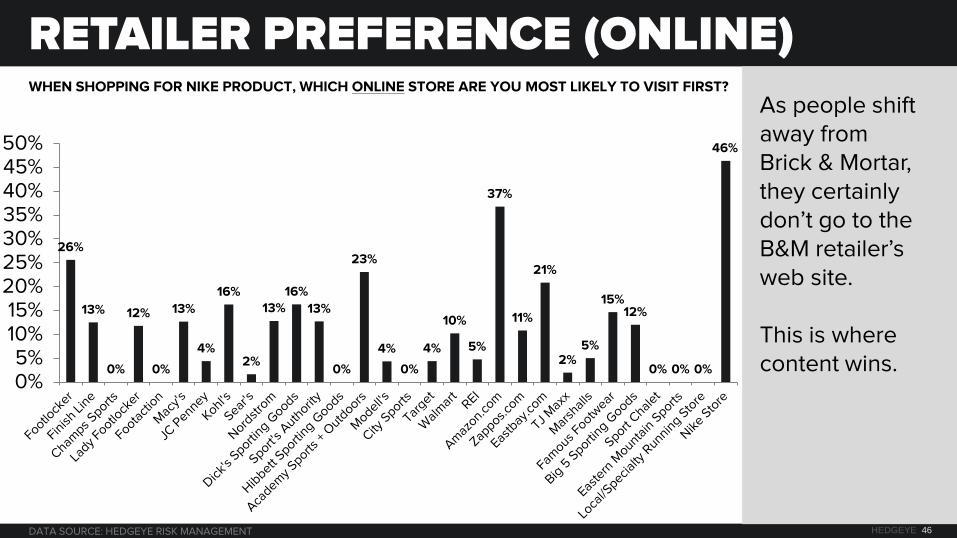
WHEN SHOPPING FOR NIKE PRODUCT, WHICH ONLINE STORE ARE YOU MOST LIKELY TO VISIT FIRST?
RETAILER PREFERENCE (ONLINE)
As people shift away from Brick & Mortar, they certainly don’t go to the B&M retailer’s web site. This is where content wins.
DATA SOURCE: HEDGEYE RISK MANAGEMENT
26%
13%
0%
12%
0%
13%
4%
16%
2%
13% 16%
13%
0%
23%
4%
0%
4%
10%
5%
37%
11%
21%
2% 5%
15% 12%
0% 0% 0%
46%
0% 5%
10% 15%
20% 25% 30% 35% 40% 45% 50%
HEDGEYE 47
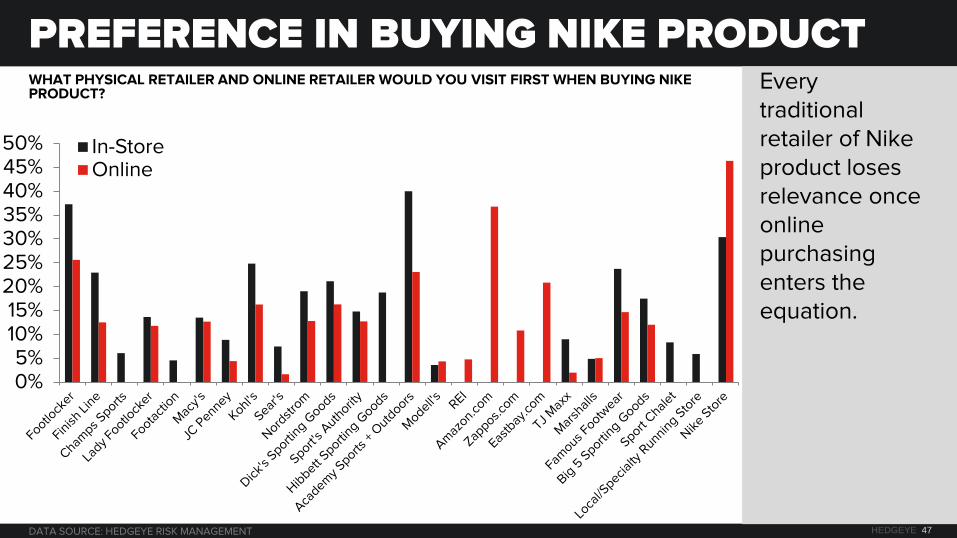
WHAT PHYSICAL RETAILER AND ONLINE RETAILER WOULD YOU VISIT FIRST WHEN BUYING NIKE PRODUCT?
PREFERENCE IN BUYING NIKE PRODUCT Every traditional retailer of Nike product loses relevance once online purchasing enters the equation.
DATA SOURCE: HEDGEYE RISK MANAGEMENT
0% 5%
10% 15%
20% 25% 30% 35% 40% 45% 50% In-Store
Online
HEDGEYE 48
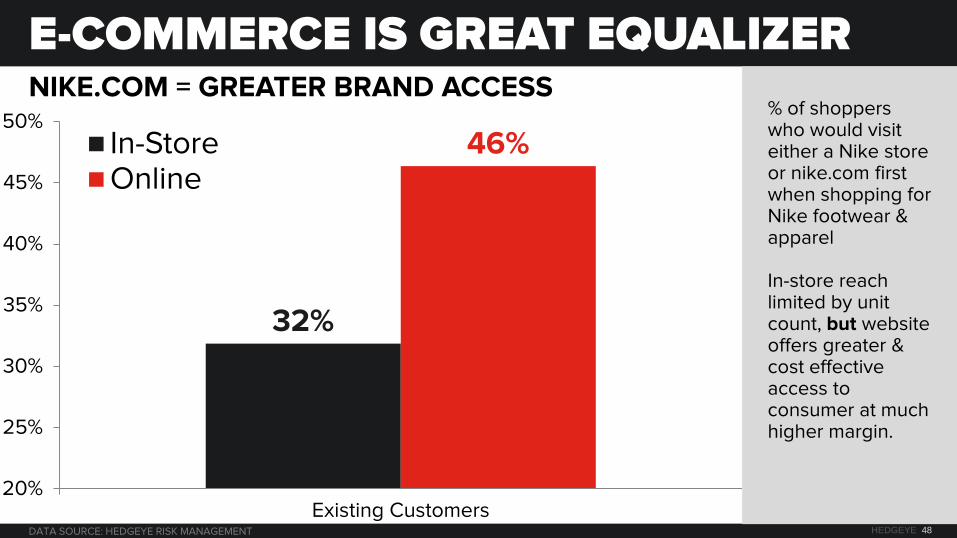
NIKE.COM = GREATER BRAND ACCESS
E-COMMERCE IS GREAT EQUALIZER
% of shoppers who would visit either a Nike store or nike.com first when shopping for Nike footwear & apparel In-store reach limited by unit count, but website offers greater & cost effective access to consumer at much higher margin.
DATA SOURCE: HEDGEYE RISK MANAGEMENT
32%
46%
20%
25%
30%
35%
40%
45%
50%
Existing Customers
In-Store Online
HEDGEYE 49
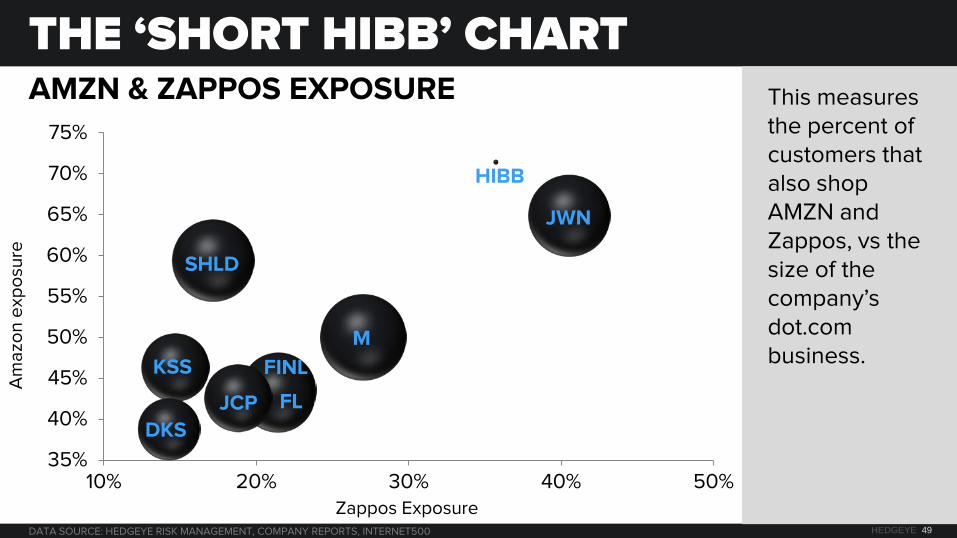
AMZN & ZAPPOS EXPOSURE
THE ‘SHORT HIBB’ CHART This measures the percent of customers that also shop AMZN and Zappos, vs the size of the company’s dot.com business.
DATA SOURCE: HEDGEYE RISK MANAGEMENT, COMPANY REPORTS, INTERNET500
FL
FINL
M
JCP
KSS
SHLD
JWN
DKS
HIBB
35%
40%
45%
50%
55%
60%
65%
70%
75%
10% 20% 30% 40% 50% Zappos Exposure
Am
azo
n e
xpo
sure
HEDGEYE 50
OLD FORMAT = $800/SQUARE FT NEW FORMAT = $1,300 SQ FT
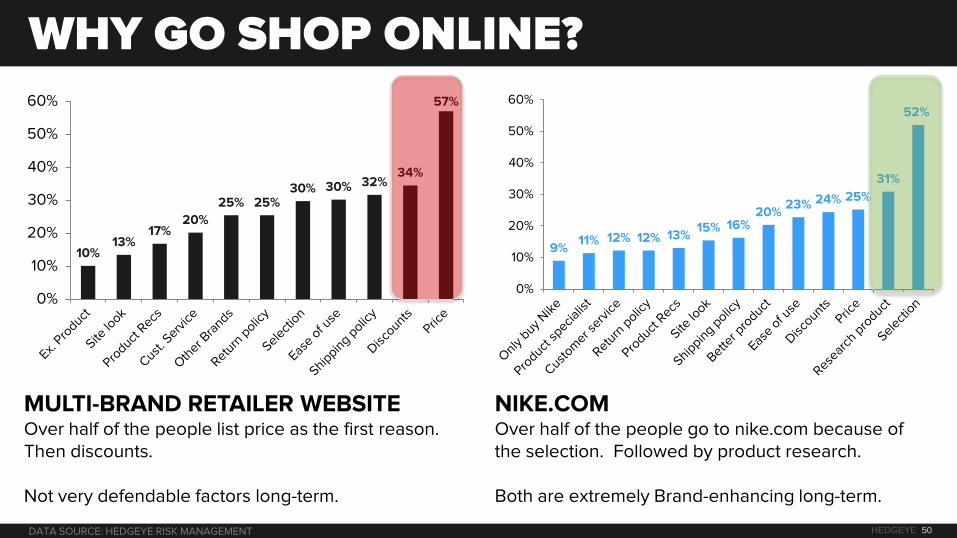
WHY GO SHOP ONLINE?
MULTI-BRAND RETAILER WEBSITE Over half of the people list price as the first reason. Then discounts. Not very defendable factors long-term.
NIKE.COM Over half of the people go to nike.com because of the selection. Followed by product research. Both are extremely Brand-enhancing long-term.
DATA SOURCE: HEDGEYE RISK MANAGEMENT
10% 13%
17% 20%
25% 25% 30% 30% 32%
34%
57%
0%
10%
20%
30%
40%
50%
60%
9% 11% 12% 12% 13%
15% 16% 20%
23% 24% 25%
31%
52%
0%
10%
20%
30%
40%
50%
60%

HEDGEYE 51
WHEN MAKING PURCHASES ONLINE, WHICH CATEGORIES ARE YOU MORE INCLINED TO BUY FROM THE BRAND’S WEBSITE VERSUS A SEPARATE RETAILER?
WHEN DO YOU GO TO BRAND SITE? A high percentage means a strong desire to visit the Brand’s website. Low percentage means more inclined to visit online retailer.
DATA SOURCE: HEDGEYE RISK MANAGEMENT
17%
21%
16%
26%
19%
27%
18%
22%
17%
14% 14% 15% 15%
13%
16%
15%
18%
17%
24%
10% 12% 14% 16% 18%
20% 22% 24% 26% 28%
RECENT ONLINE TRENDS
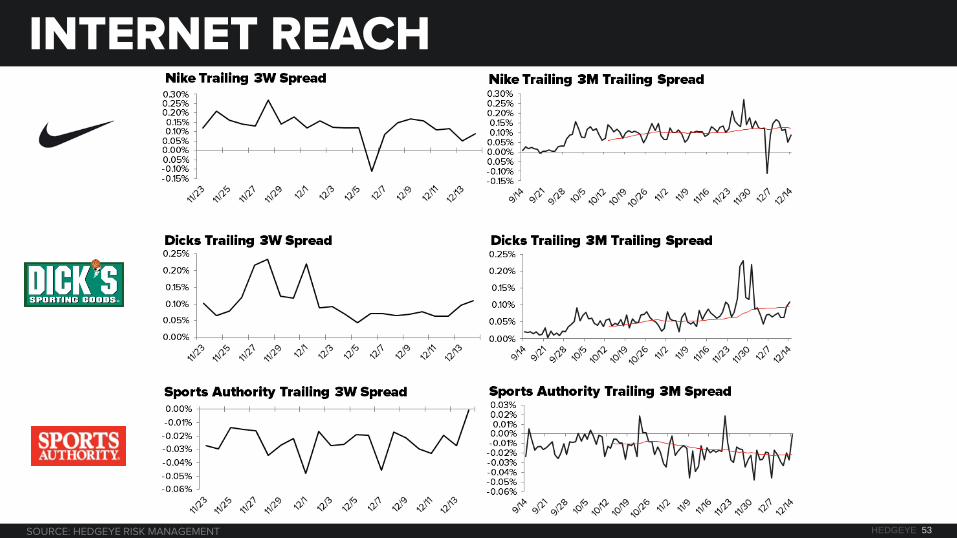
HEDGEYE 53
INTERNET REACH
SOURCE: HEDGEYE RISK MANAGEMENT
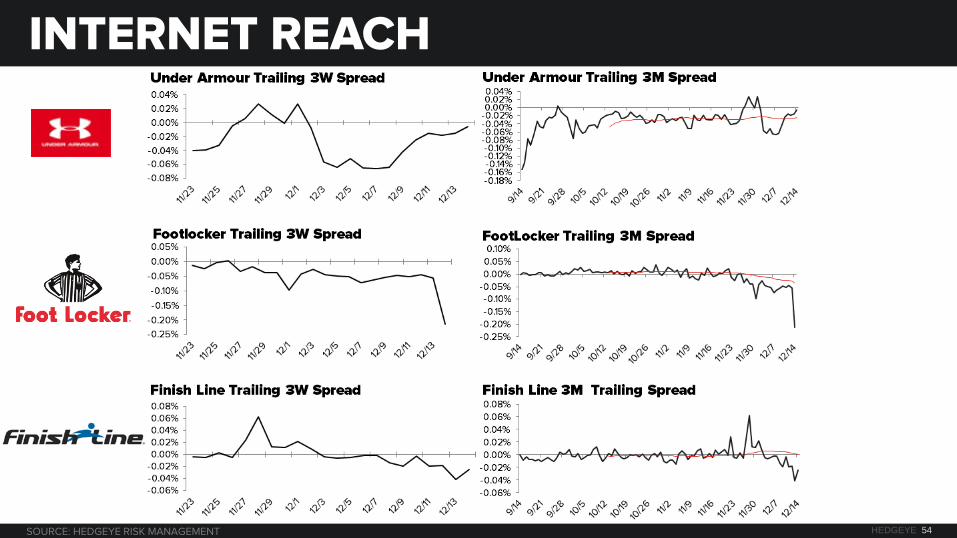
HEDGEYE 54
INTERNET REACH
SOURCE: HEDGEYE RISK MANAGEMENT
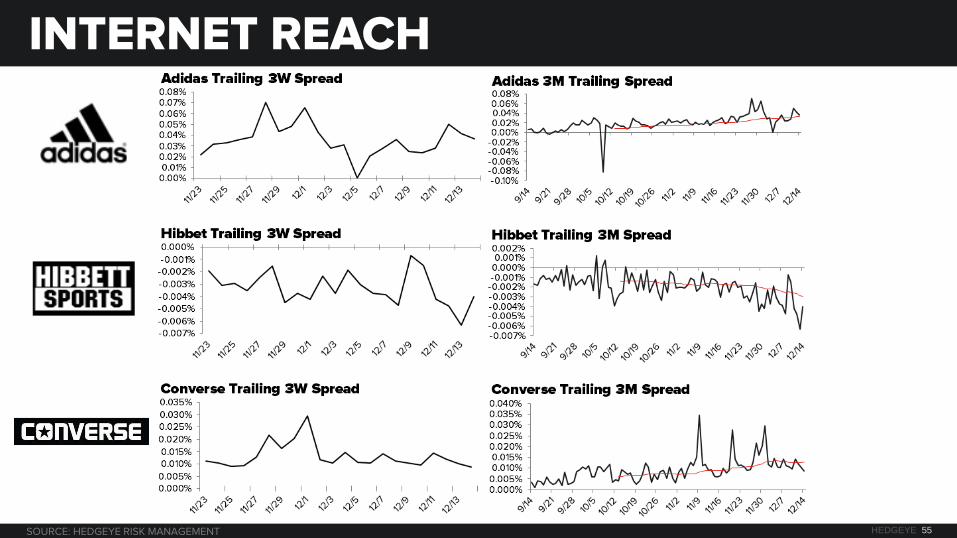
HEDGEYE 55
INTERNET REACH
SOURCE: HEDGEYE RISK MANAGEMENT
ATHLETE ENDORSEMENT TRENDS
HEDGEYE 57
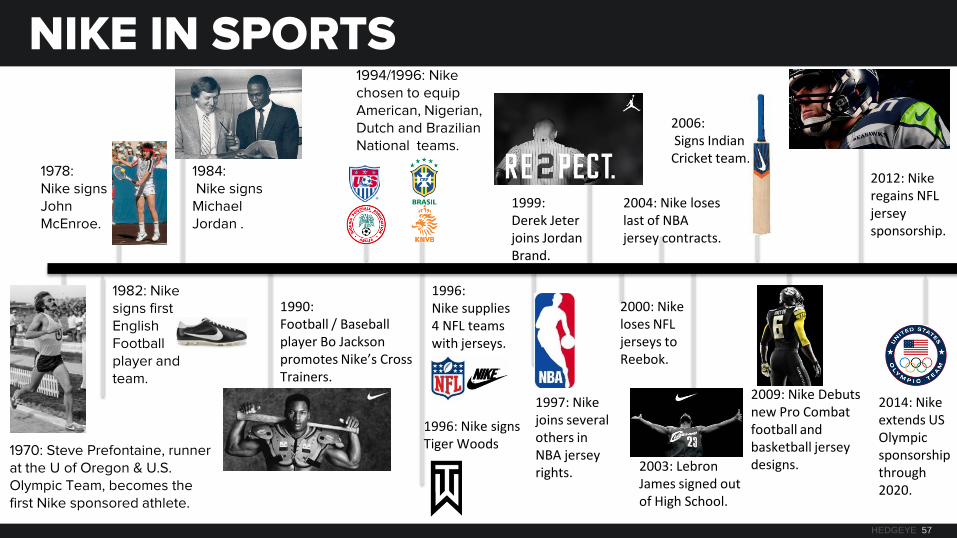
NIKE IN SPORTS
1978: Nike signs John McEnroe.
1982: Nike signs first English Football player and team.
1984: Nike signs Michael Jordan .
1990: Football / Baseball player Bo Jackson promotes Nike’s Cross Trainers.
1999: Derek Jeter joins Jordan Brand.
1996: Nike supplies 4 NFL teams with jerseys.
1994/1996: Nike chosen to equip American, Nigerian, Dutch and Brazilian National teams.
2000: Nike loses NFL jerseys to Reebok.
2003: Lebron James signed out of High School.
2012: Nike regains NFL jersey sponsorship.
2009: Nike Debuts new Pro Combat football and basketball jersey designs.
2014: Nike extends US Olympic sponsorship through 2020.
1996: Nike signs Tiger Woods
2006: Signs Indian Cricket team.
2004: Nike loses last of NBA jersey contracts.
1997: Nike joins several others in NBA jersey rights.
1970: Steve Prefontaine, runner at the U of Oregon & U.S. Olympic Team, becomes the first Nike sponsored athlete.
HEDGEYE 58
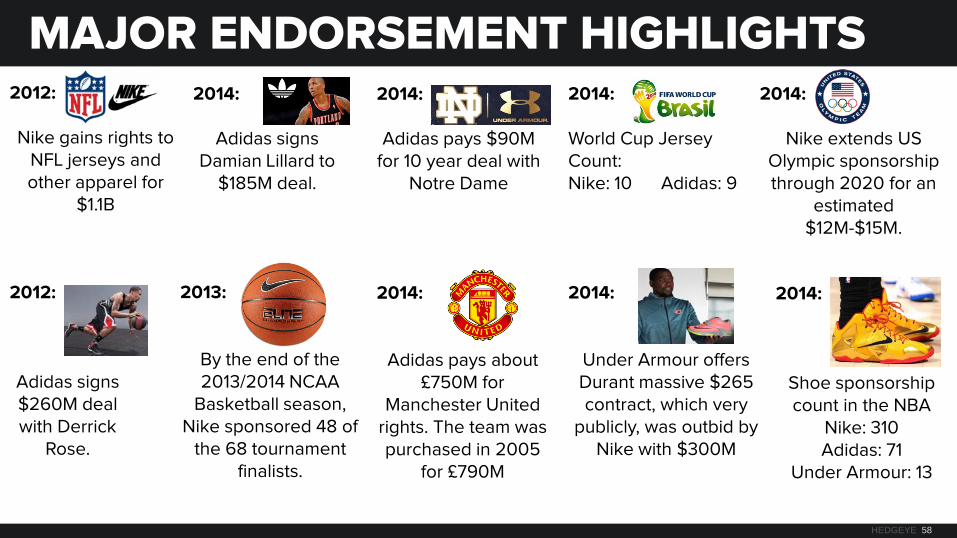
2014:
Adidas signs Damian Lillard to
$185M deal.
2014:
Under Armour offers Durant massive $265 contract, which very
publicly, was outbid by Nike with $300M
2012:
Adidas signs $260M deal with Derrick
Rose.
2014:
Adidas pays $90M for 10 year deal with
Notre Dame
2014:
Shoe sponsorship count in the NBA
Nike: 310 Adidas: 71
Under Armour: 13
2014:
Adidas pays about £750M for
Manchester United rights. The team was purchased in 2005
for £790M
MAJOR ENDORSEMENT HIGHLIGHTS 2012:
Nike gains rights to
NFL jerseys and other apparel for
$1.1B
2014:
Nike extends US Olympic sponsorship through 2020 for an
estimated $12M-$15M.
2014: World Cup Jersey Count: Nike: 10 Adidas: 9
2013:
By the end of the 2013/2014 NCAA
Basketball season, Nike sponsored 48 of
the 68 tournament finalists.

HEDGEYE 59
NKE DWARFS UA, BUT THE GAP IS CLOSING
ENDORSEMENT MINIMUMS
No two ways about it – UA is starting to play with the big boys and spend even bigger dollars.
$1 $44 $54 $76 $78 $168 $170 $158 $273
$1,642
$2,794
$3,828
$4,202
$3,790
$4,444
$3,828 $3,603
$4,704
0%
1%
2%
3%
4%
5%
6%
7%
$0
$500
$1,000
$1,500
$2,000
$2,500
$3,000
$3,500
$4,000
$4,500
$5,000
2006 2007 2008 2009 2010 2011 2012 2013 2014
UnderArmour Nike UA as % of NKE (right)
HEDGEYE 60
OLD FORMAT = $800/SQUARE FT NEW FORMAT = $1,300 SQ FT
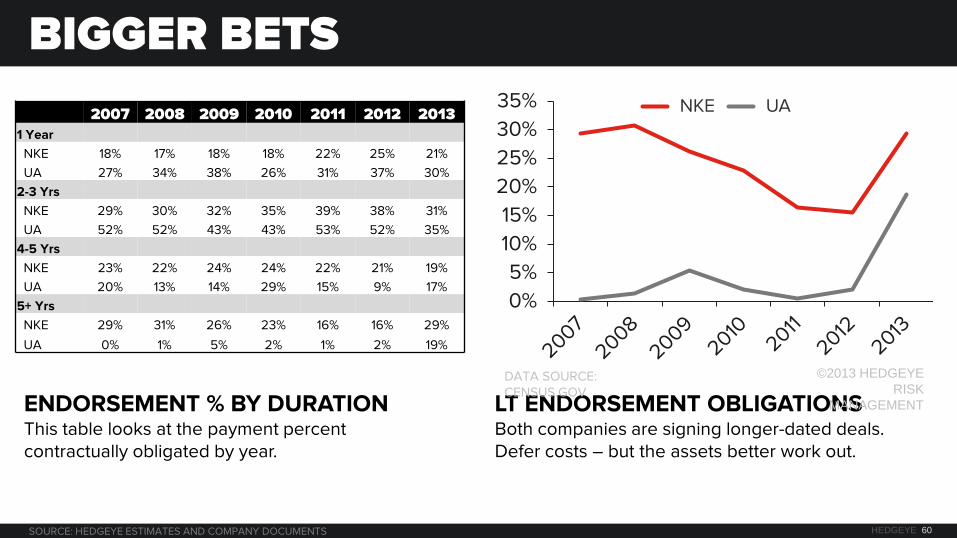
BIGGER BETS
ENDORSEMENT % BY DURATION This table looks at the payment percent contractually obligated by year.
LT ENDORSEMENT OBLIGATIONS Both companies are signing longer-dated deals. Defer costs – but the assets better work out.
SOURCE: HEDGEYE ESTIMATES AND COMPANY DOCUMENTS
0%
5%
10%
15%
20%
25%
30%
35% NKE UA
©2013 HEDGEYE RISK
MANAGEMENT
DATA SOURCE: CENSUS.GOV
2007 2008 2009 2010 2011 2012 2013 1 Year
NKE 18% 17% 18% 18% 22% 25% 21%
UA 27% 34% 38% 26% 31% 37% 30%
2-3 Yrs
NKE 29% 30% 32% 35% 39% 38% 31%
UA 52% 52% 43% 43% 53% 52% 35%
4-5 Yrs
NKE 23% 22% 24% 24% 22% 21% 19%
UA 20% 13% 14% 29% 15% 9% 17%
5+ Yrs
NKE 29% 31% 26% 23% 16% 16% 29%
UA 0% 1% 5% 2% 1% 2% 19%
HEDGEYE 61
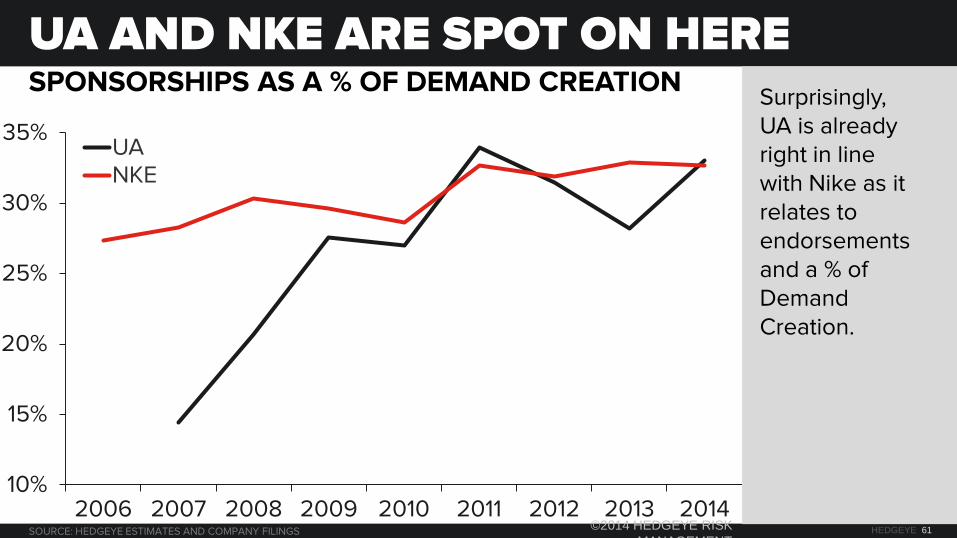
SPONSORSHIPS AS A % OF DEMAND CREATION
UA AND NKE ARE SPOT ON HERE Surprisingly, UA is already right in line with Nike as it relates to endorsements and a % of Demand Creation.
SOURCE: HEDGEYE ESTIMATES AND COMPANY FILINGS
10%
15%
20%
25%
30%
35%
2006 2007 2008 2009 2010 2011 2012 2013 2014
UA NKE
©2014 HEDGEYE RISK MANAGEMENT

COMPANY CAPSULES
HEDGEYE 63
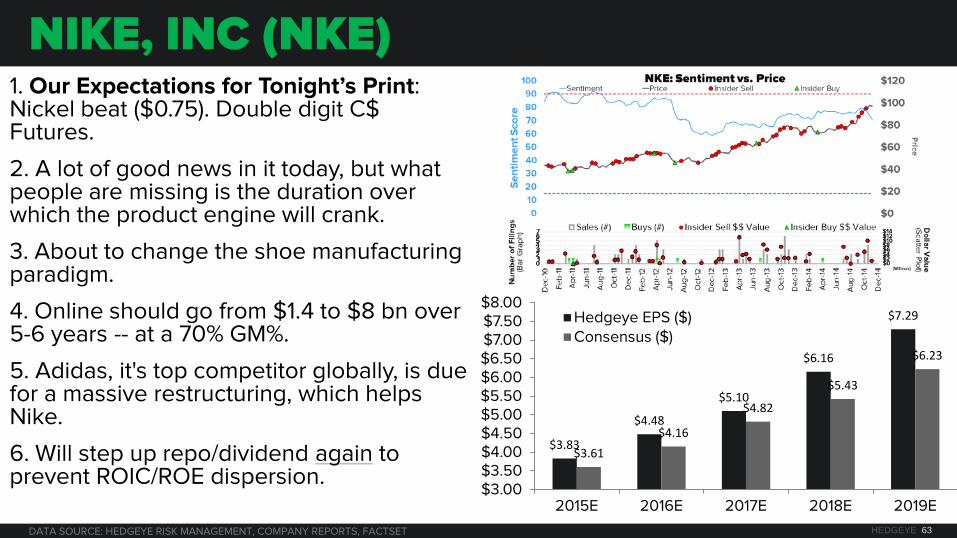
NIKE, INC (NKE) 1. Our Expectations for Tonight’s Print: Nickel beat ($0.75). Double digit C$ Futures.
2. A lot of good news in it today, but what people are missing is the duration over which the product engine will crank.
3. About to change the shoe manufacturing paradigm.
4. Online should go from $1.4 to $8 bn over 5-6 years -- at a 70% GM%.
5. Adidas, it's top competitor globally, is due for a massive restructuring, which helps Nike.
6. Will step up repo/dividend again to prevent ROIC/ROE dispersion.
DATA SOURCE: HEDGEYE RISK MANAGEMENT, COMPANY REPORTS, FACTSET
$3.83
$4.48
$5.10
$6.16
$7.29
$3.61 $4.16
$4.82
$5.43
$6.23
$3.00 $3.50 $4.00 $4.50 $5.00 $5.50 $6.00 $6.50 $7.00 $7.50 $8.00
2015E 2016E 2017E 2018E 2019E
Hedgeye EPS ($) Consensus ($)
HEDGEYE 64
OLD FORMAT = $800/SQUARE FT NEW FORMAT = $1,300 SQ FT
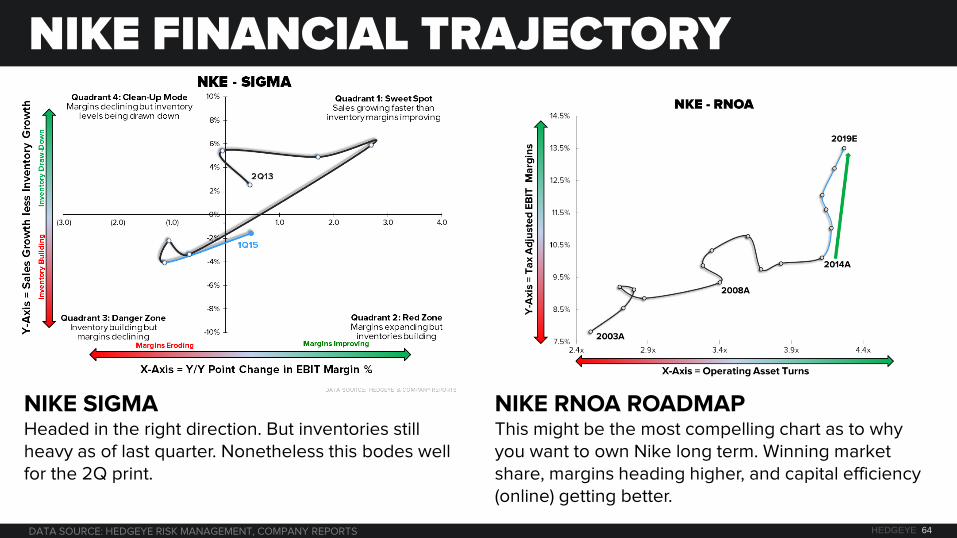
NIKE FINANCIAL TRAJECTORY
NIKE SIGMA Headed in the right direction. But inventories still heavy as of last quarter. Nonetheless this bodes well for the 2Q print.
NIKE RNOA ROADMAP This might be the most compelling chart as to why you want to own Nike long term. Winning market share, margins heading higher, and capital efficiency (online) getting better.
DATA SOURCE: HEDGEYE RISK MANAGEMENT, COMPANY REPORTS
HEDGEYE 65
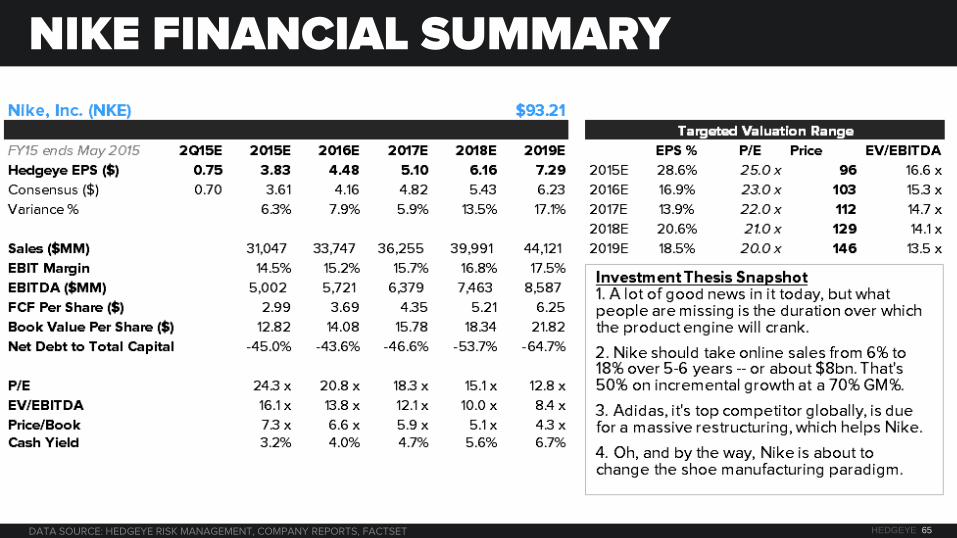
NIKE FINANCIAL SUMMARY
DATA SOURCE: HEDGEYE RISK MANAGEMENT, COMPANY REPORTS, FACTSET
HEDGEYE 66
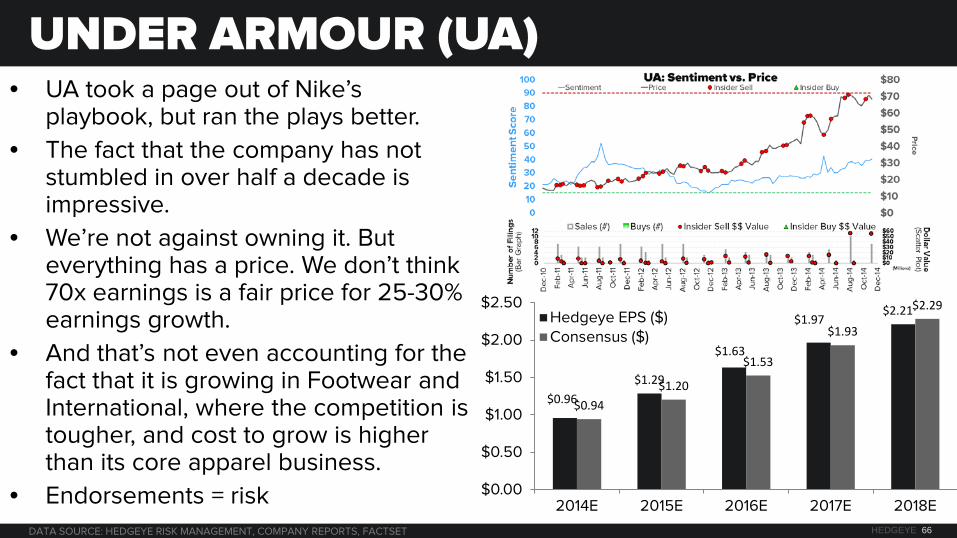
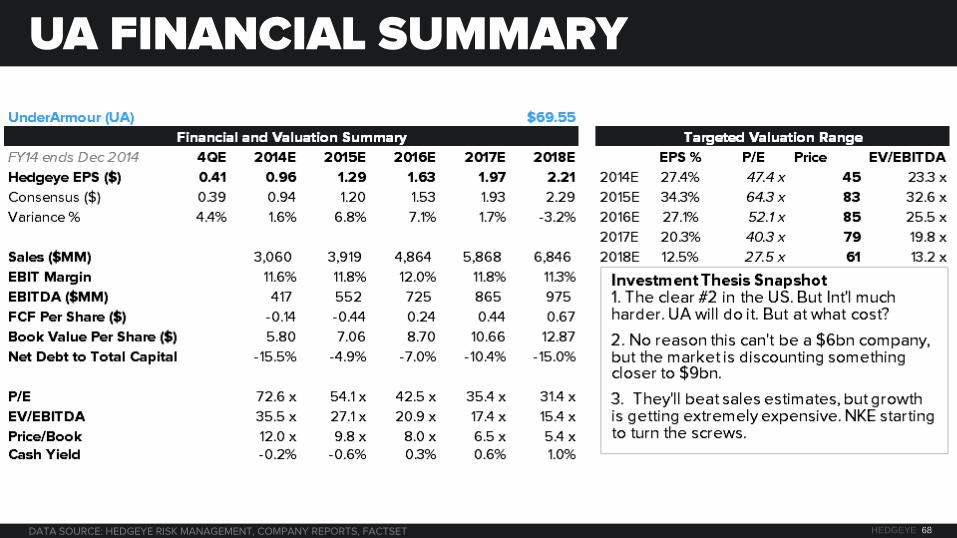
UNDER ARMOUR (UA) • UA took a page out of Nike’s
playbook, but ran the plays better.
• The fact that the company has not stumbled in over half a decade is impressive.
• We’re not against owning it. But everything has a price. We don’t think 70x earnings is a fair price for 25-30% earnings growth.
• And that’s not even accounting for the fact that it is growing in Footwear and International, where the competition is tougher, and cost to grow is higher than its core apparel business.
• Endorsements = risk
DATA SOURCE: HEDGEYE RISK MANAGEMENT, COMPANY REPORTS, FACTSET
$0.96 $1.29
$1.63
$1.97 $2.21
$0.94 $1.20
$1.53
$1.93
$2.29
$0.00
$0.50
$1.00
$1.50
$2.00
$2.50
2014E 2015E 2016E 2017E 2018E
Hedgeye EPS ($) Consensus ($)
HEDGEYE 67
OLD FORMAT = $800/SQUARE FT NEW FORMAT = $1,300 SQ FT
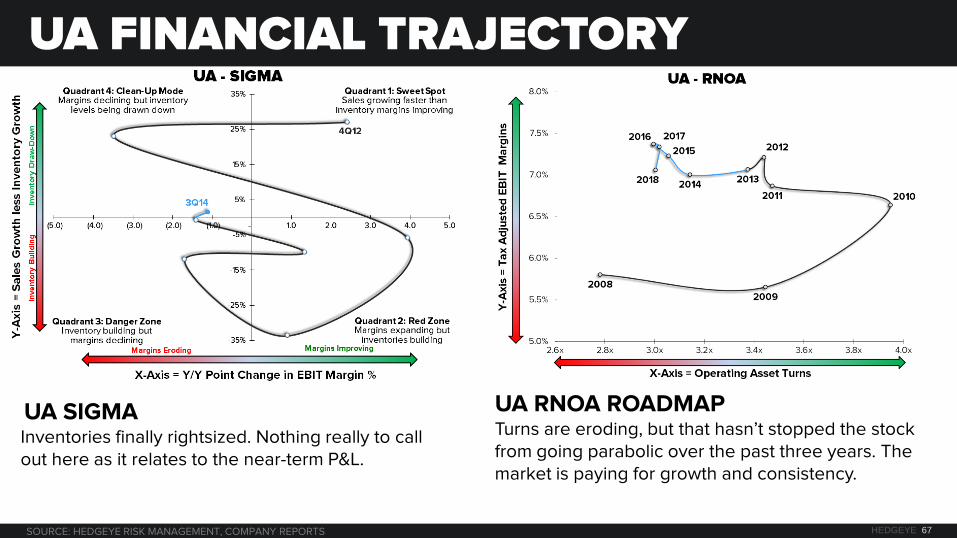
UA FINANCIAL TRAJECTORY
UA SIGMA Inventories finally rightsized. Nothing really to call out here as it relates to the near-term P&L.
UA RNOA ROADMAP Turns are eroding, but that hasn’t stopped the stock from going parabolic over the past three years. The market is paying for growth and consistency.
SOURCE: HEDGEYE RISK MANAGEMENT, COMPANY REPORTS
HEDGEYE 68
UA FINANCIAL SUMMARY
DATA SOURCE: HEDGEYE RISK MANAGEMENT, COMPANY REPORTS, FACTSET
HEDGEYE 69
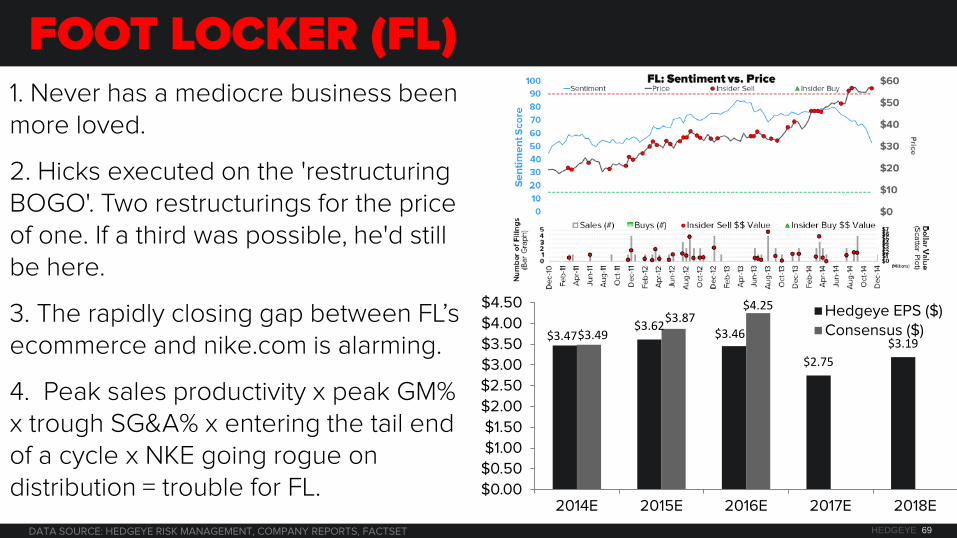
FOOT LOCKER (FL) 1. Never has a mediocre business been more loved.
2. Hicks executed on the 'restructuring BOGO'. Two restructurings for the price of one. If a third was possible, he'd still be here.
3. The rapidly closing gap between FL’s ecommerce and nike.com is alarming.
4. Peak sales productivity x peak GM% x trough SG&A% x entering the tail end of a cycle x NKE going rogue on distribution = trouble for FL.
DATA SOURCE: HEDGEYE RISK MANAGEMENT, COMPANY REPORTS, FACTSET
$3.47 $3.62 $3.46
$2.75 $3.19
$3.49 $3.87
$4.25
$0.00
$0.50
$1.00
$1.50
$2.00
$2.50
$3.00
$3.50
$4.00
$4.50
2014E 2015E 2016E 2017E 2018E
Hedgeye EPS ($) Consensus ($)
HEDGEYE 70
OLD FORMAT = $800/SQUARE FT NEW FORMAT = $1,300 SQ FT
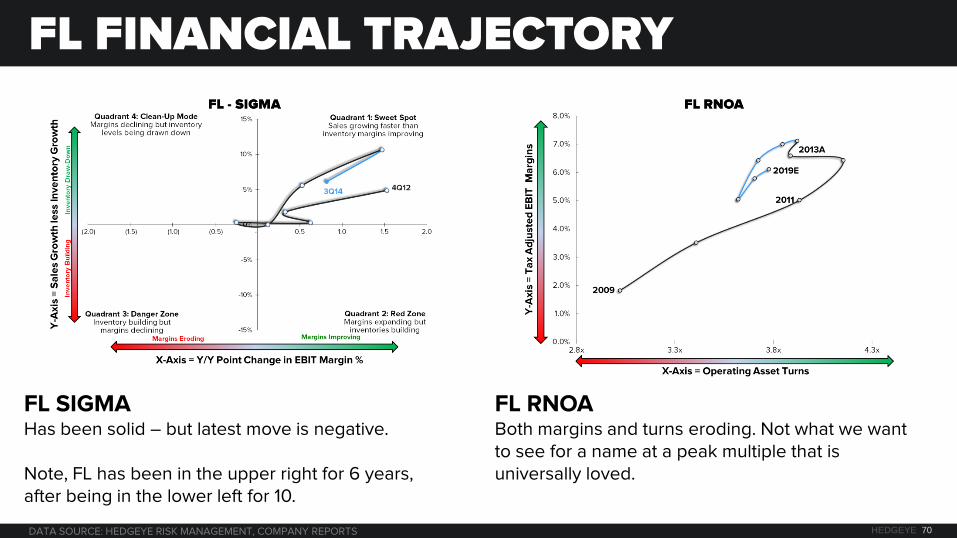
FL FINANCIAL TRAJECTORY
FL SIGMA Has been solid – but latest move is negative. Note, FL has been in the upper right for 6 years, after being in the lower left for 10.
FL RNOA Both margins and turns eroding. Not what we want to see for a name at a peak multiple that is universally loved.
DATA SOURCE: HEDGEYE RISK MANAGEMENT, COMPANY REPORTS
HEDGEYE 71
FL FINANCIAL SUMMARY
DATA SOURCE: HEDGEYE RISK MANAGEMENT, COMPANY REPORTS, FACTSET
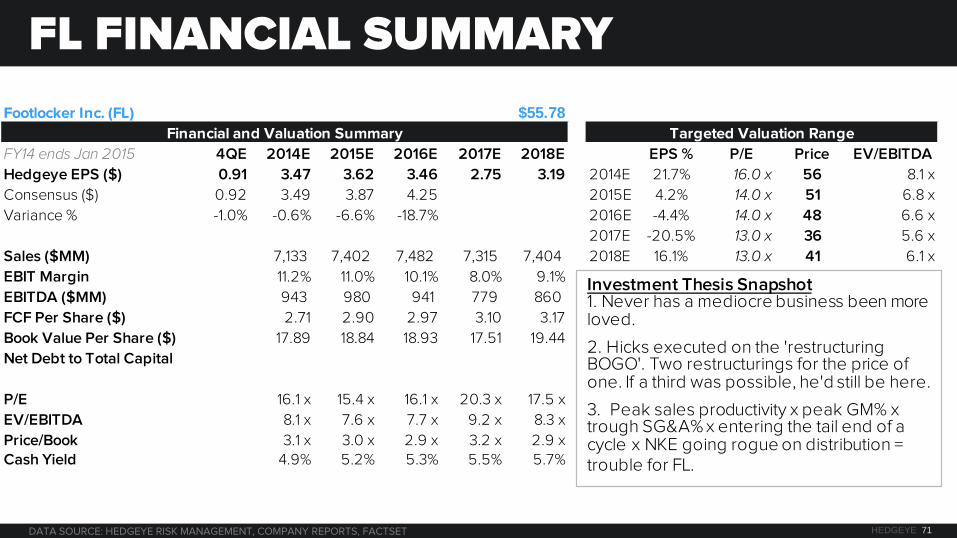
Footlocker Inc. (FL) $55.78
FY14 ends Jan 2015 4QE 2014E 2015E 2016E 2017E 2018E EPS % P/E Price EV/EBITDA
Hedgeye EPS ($) 0.91 3.47 3.62 3.46 2.75 3.19 2014E 21.7% 16.0 x 56 8.1 x
Consensus ($) 0.92 3.49 3.87 4.25 2015E 4.2% 14.0 x 51 6.8 x
Variance % -1.0% -0.6% -6.6% -18.7% 2016E -4.4% 14.0 x 48 6.6 x
2017E -20.5% 13.0 x 36 5.6 x
Sales ($MM) 7,133 7,402 7,482 7,315 7,404 2018E 16.1% 13.0 x 41 6.1 x
EBIT Margin 11.2% 11.0% 10.1% 8.0% 9.1%
EBITDA ($MM) 943 980 941 779 860
FCF Per Share ($) 2.71 2.90 2.97 3.10 3.17
Book Value Per Share ($) 17.89 18.84 18.93 17.51 19.44
Net Debt to Total Capital
P/E 16.1 x 15.4 x 16.1 x 20.3 x 17.5 x
EV/EBITDA 8.1 x 7.6 x 7.7 x 9.2 x 8.3 x
Price/Book 3.1 x 3.0 x 2.9 x 3.2 x 2.9 xCash Yield 4.9% 5.2% 5.3% 5.5% 5.7%
Targeted Valuation RangeFinancial and Valuation Summary
Investment Thesis Snapshot1. Never has a mediocre business been more loved.
2. Hicks executed on the 'restructuring BOGO'. Two restructurings for the price of one. If a third was possible, he'd still be here.
3. Peak sales productivity x peak GM% x trough SG&A% x entering the tail end of a cycle x NKE going rogue on distribution = trouble for FL.
HEDGEYE 72
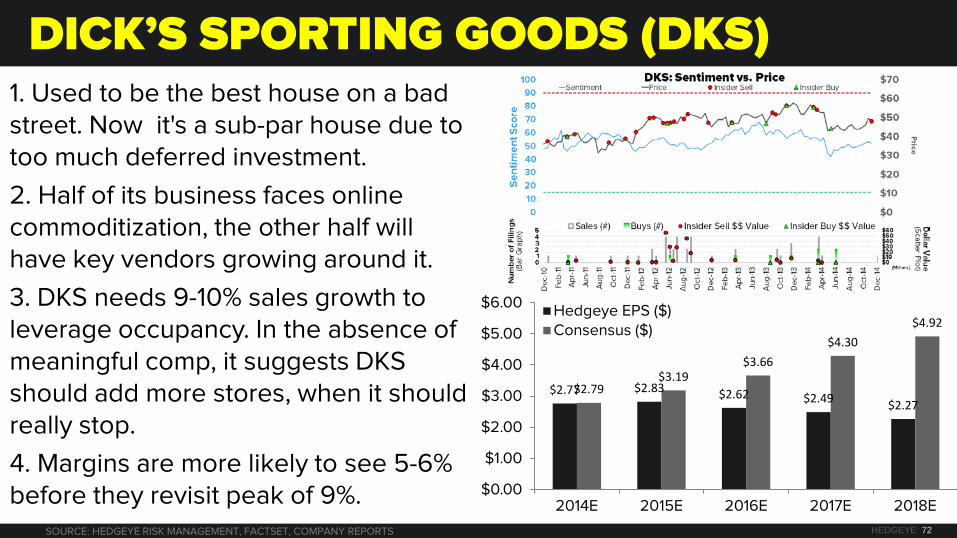
DICK’S SPORTING GOODS (DKS) 1. Used to be the best house on a bad street. Now it's a sub-par house due to too much deferred investment.
2. Half of its business faces online commoditization, the other half will have key vendors growing around it.
3. DKS needs 9-10% sales growth to leverage occupancy. In the absence of meaningful comp, it suggests DKS should add more stores, when it should really stop.
4. Margins are more likely to see 5-6% before they revisit peak of 9%.
$2.77 $2.83 $2.62 $2.49 $2.27 $2.79
$3.19 $3.66
$4.30 $4.92
$0.00
$1.00
$2.00
$3.00
$4.00
$5.00
$6.00
2014E 2015E 2016E 2017E 2018E
Hedgeye EPS ($) Consensus ($)
SOURCE: HEDGEYE RISK MANAGEMENT, FACTSET, COMPANY REPORTS
HEDGEYE 73
OLD FORMAT = $800/SQUARE FT NEW FORMAT = $1,300 SQ FT
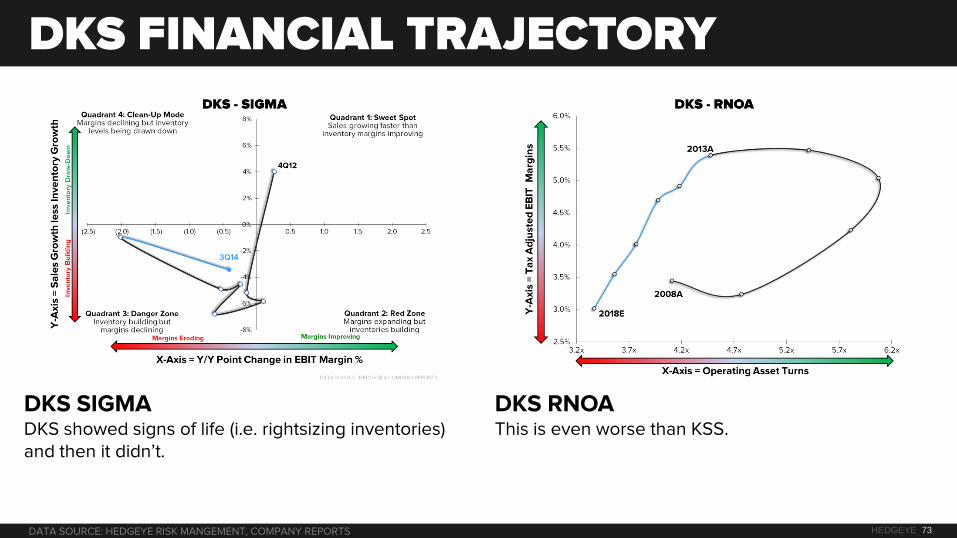
DKS FINANCIAL TRAJECTORY
DKS SIGMA DKS showed signs of life (i.e. rightsizing inventories) and then it didn’t.
DKS RNOA This is even worse than KSS.
DATA SOURCE: HEDGEYE RISK MANGEMENT, COMPANY REPORTS
HEDGEYE 74
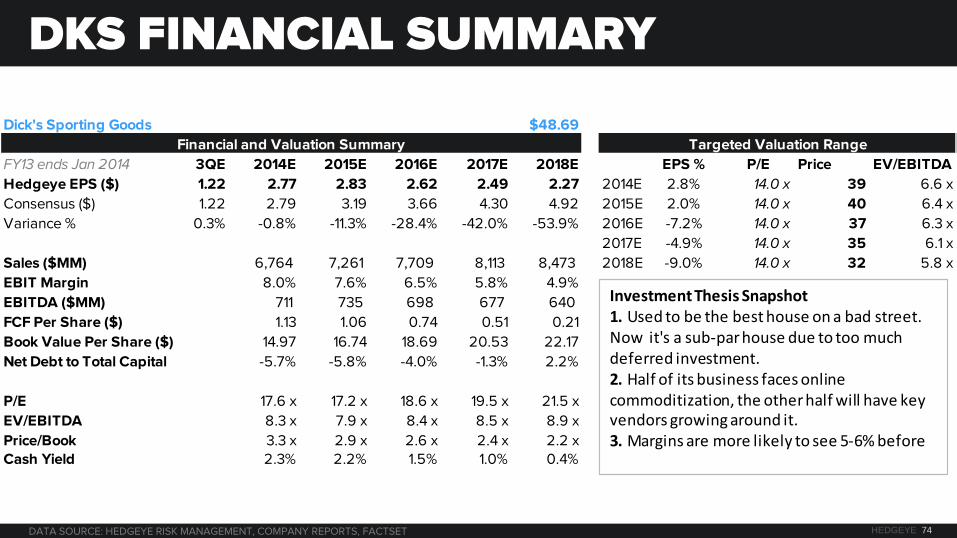
DKS FINANCIAL SUMMARY
DATA SOURCE: HEDGEYE RISK MANAGEMENT, COMPANY REPORTS, FACTSET
Dick's Sporting Goods $48.69
FY13 ends Jan 2014 3QE 2014E 2015E 2016E 2017E 2018E EPS % P/E Price EV/EBITDA
Hedgeye EPS ($) 1.22 2.77 2.83 2.62 2.49 2.27 2014E 2.8% 14.0 x 39 6.6 x
Consensus ($) 1.22 2.79 3.19 3.66 4.30 4.92 2015E 2.0% 14.0 x 40 6.4 x
Variance % 0.3% -0.8% -11.3% -28.4% -42.0% -53.9% 2016E -7.2% 14.0 x 37 6.3 x
2017E -4.9% 14.0 x 35 6.1 x
Sales ($MM) 6,764 7,261 7,709 8,113 8,473 2018E -9.0% 14.0 x 32 5.8 x
EBIT Margin 8.0% 7.6% 6.5% 5.8% 4.9%
EBITDA ($MM) 711 735 698 677 640
FCF Per Share ($) 1.13 1.06 0.74 0.51 0.21
Book Value Per Share ($) 14.97 16.74 18.69 20.53 22.17
Net Debt to Total Capital -5.7% -5.8% -4.0% -1.3% 2.2%
P/E 17.6 x 17.2 x 18.6 x 19.5 x 21.5 x
EV/EBITDA 8.3 x 7.9 x 8.4 x 8.5 x 8.9 x
Price/Book 3.3 x 2.9 x 2.6 x 2.4 x 2.2 xCash Yield 2.3% 2.2% 1.5% 1.0% 0.4%
Financial and Valuation Summary Targeted Valuation Range
Investment Thesis Snapshot1. Used to be the best house on a bad street. Now it's a sub-par house due to too much deferred investment.2. Half of its business faces online commoditization, the other half will have key vendors growing around it.3. Margins are more likely to see 5-6% before
HEDGEYE 75
HIBBETT SPORTS (HIBB)
DATA SOURCE: HEDGEYE RISK MANAGEMENT, COMPANY REPORTS, FACTSET
2.80 2.88 2.79
2.37
2.75 2.76 3.03
3.46
4.11
4.80
$2.00
$3.00
$4.00
$5.00
2015E 2016E 2017E 2018E 2019E
Hedgeye EPS ($) Consensus ($)
DATA SOURCE: CENSUS GOV
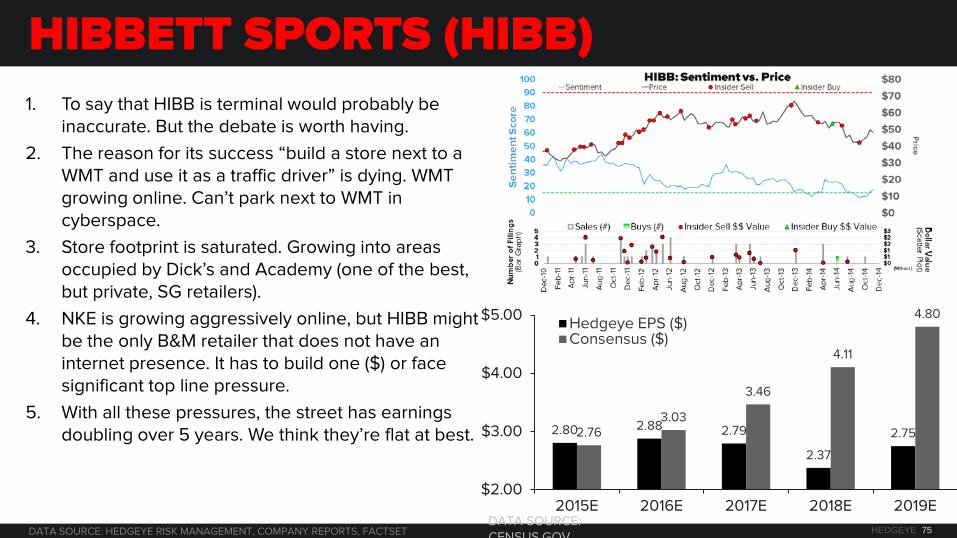
1. To say that HIBB is terminal would probably be inaccurate. But the debate is worth having.
2. The reason for its success “build a store next to a WMT and use it as a traffic driver” is dying. WMT growing online. Can’t park next to WMT in cyberspace.
3. Store footprint is saturated. Growing into areas occupied by Dick’s and Academy (one of the best, but private, SG retailers).
4. NKE is growing aggressively online, but HIBB might be the only B&M retailer that does not have an internet presence. It has to build one ($) or face significant top line pressure.
5. With all these pressures, the street has earnings doubling over 5 years. We think they’re flat at best.
HEDGEYE 76
OLD FORMAT = $800/SQUARE FT NEW FORMAT = $1,300 SQ FT
HIBB FINANCIAL TRAJECTORY
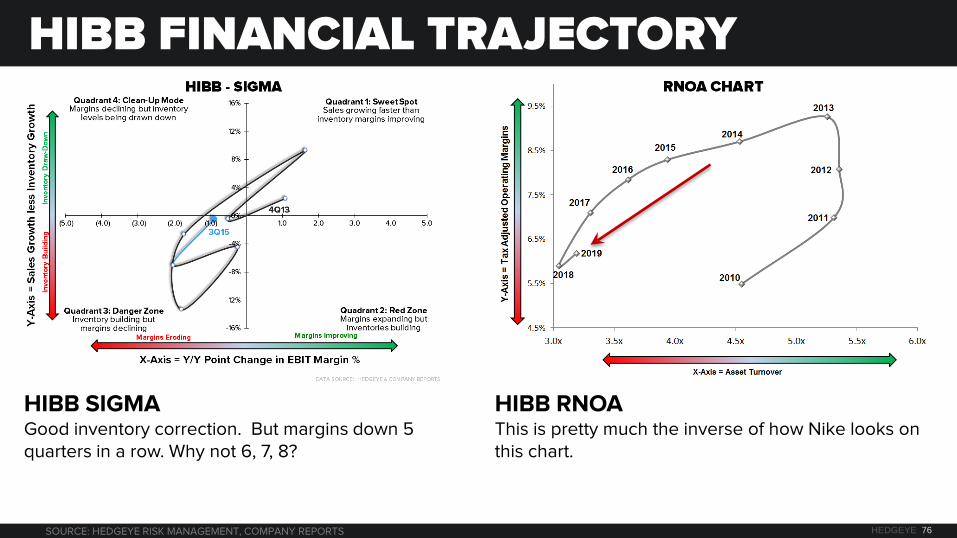
HIBB SIGMA Good inventory correction. But margins down 5 quarters in a row. Why not 6, 7, 8?
HIBB RNOA This is pretty much the inverse of how Nike looks on this chart.
SOURCE: HEDGEYE RISK MANAGEMENT, COMPANY REPORTS
HEDGEYE 77
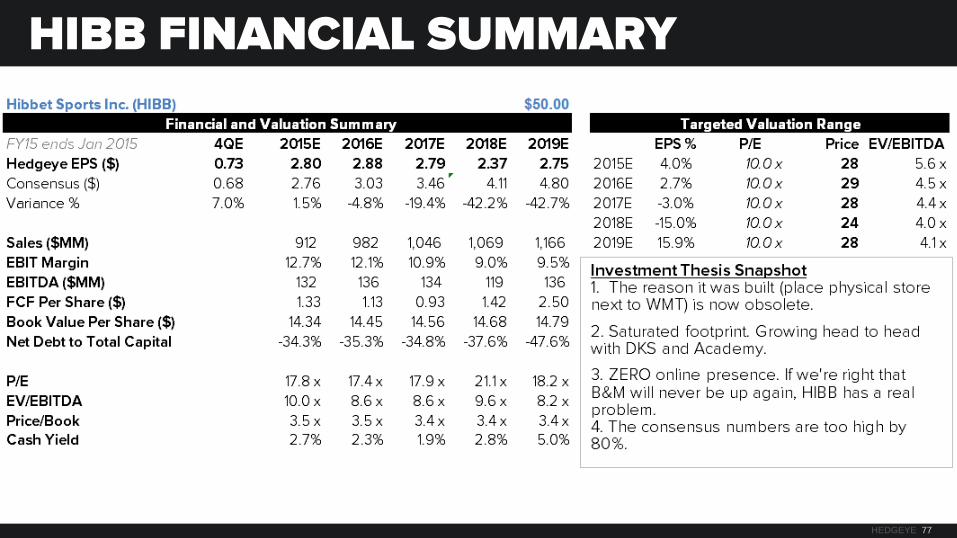
HIBB FINANCIAL SUMMARY
HEDGEYE 78
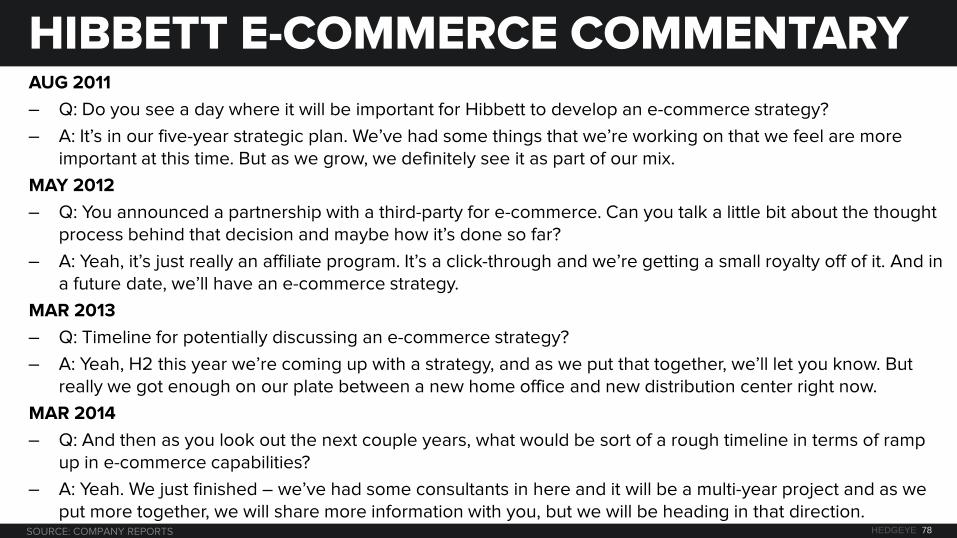
AUG 2011
– Q: Do you see a day where it will be important for Hibbett to develop an e-commerce strategy?
– A: It’s in our five-year strategic plan. We’ve had some things that we’re working on that we feel are more important at this time. But as we grow, we definitely see it as part of our mix.
MAY 2012
– Q: You announced a partnership with a third-party for e-commerce. Can you talk a little bit about the thought process behind that decision and maybe how it’s done so far?
– A: Yeah, it’s just really an affiliate program. It’s a click-through and we’re getting a small royalty off of it. And in a future date, we’ll have an e-commerce strategy.
MAR 2013
– Q: Timeline for potentially discussing an e-commerce strategy?
– A: Yeah, H2 this year we’re coming up with a strategy, and as we put that together, we’ll let you know. But really we got enough on our plate between a new home office and new distribution center right now.
MAR 2014
– Q: And then as you look out the next couple years, what would be sort of a rough timeline in terms of ramp up in e-commerce capabilities?
– A: Yeah. We just finished – we’ve had some consultants in here and it will be a multi-year project and as we put more together, we will share more information with you, but we will be heading in that direction.
HIBBETT E-COMMERCE COMMENTARY
SOURCE: COMPANY REPORTS
HEDGEYE 79
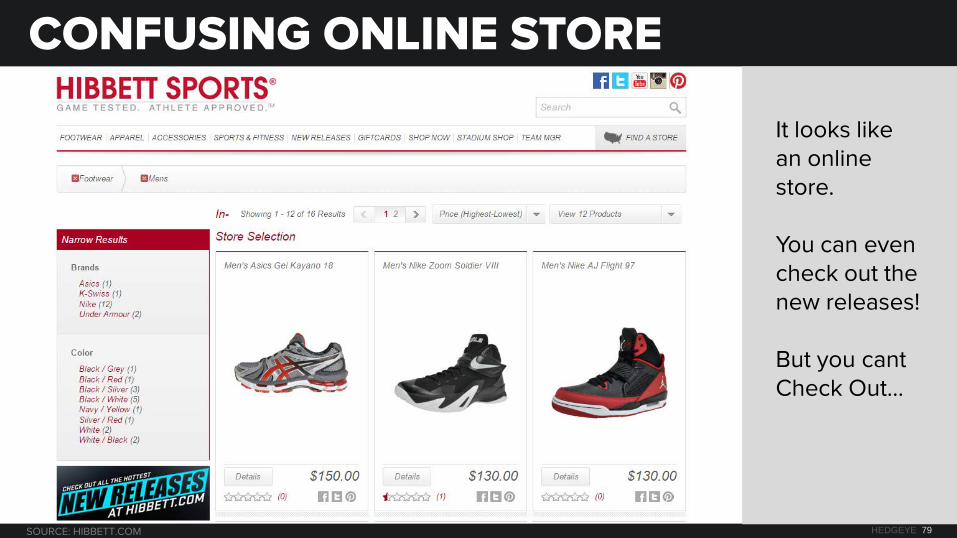
CONFUSING ONLINE STORE
It looks like an online store. You can even check out the new releases! But you cant Check Out…
SOURCE: HIBBETT.COM
HEDGEYE 80
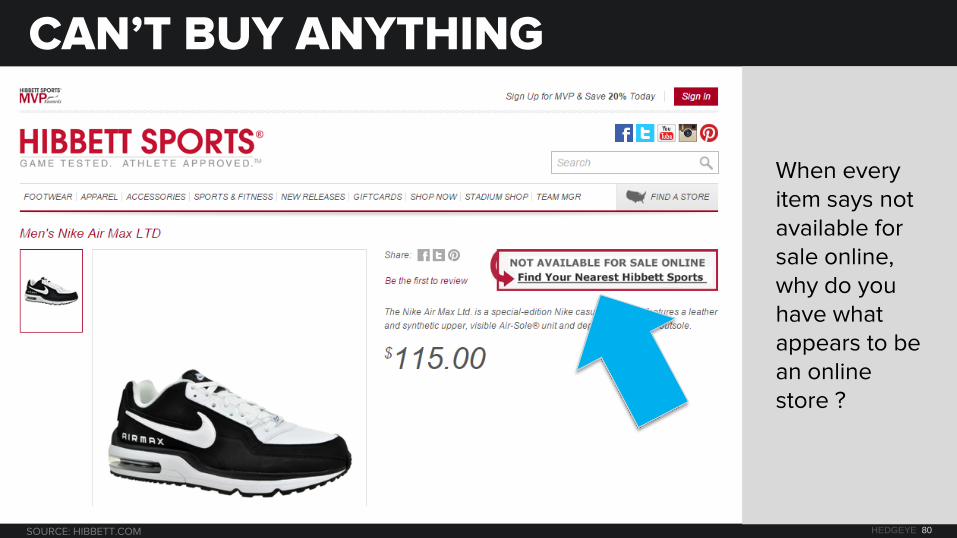
CAN’T BUY ANYTHING
When every item says not available for sale online, why do you have what appears to be an online store ?
SOURCE: HIBBETT.COM
HEDGEYE 81
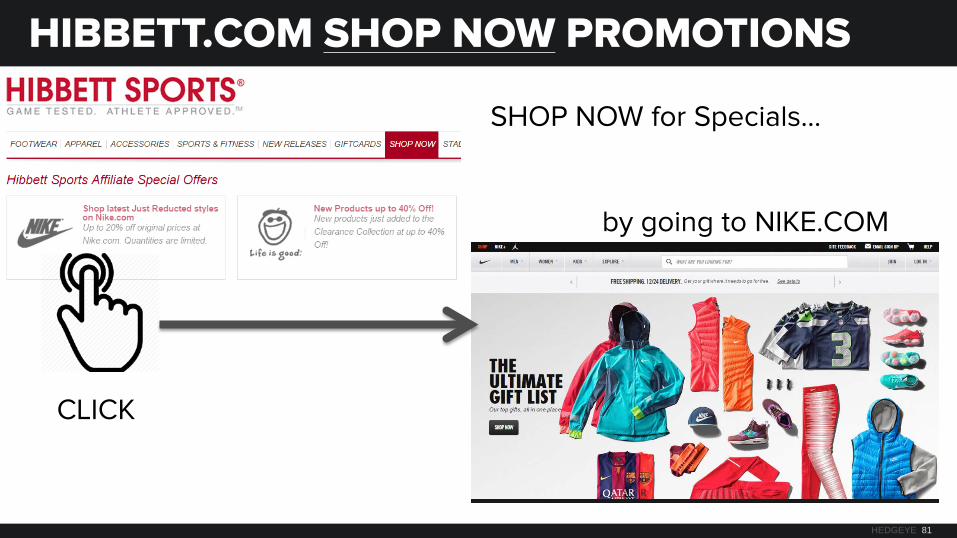
HIBBETT.COM SHOP NOW PROMOTIONS
SHOP NOW for Specials…
by going to NIKE.COM
CLICK
HEDGEYE 82
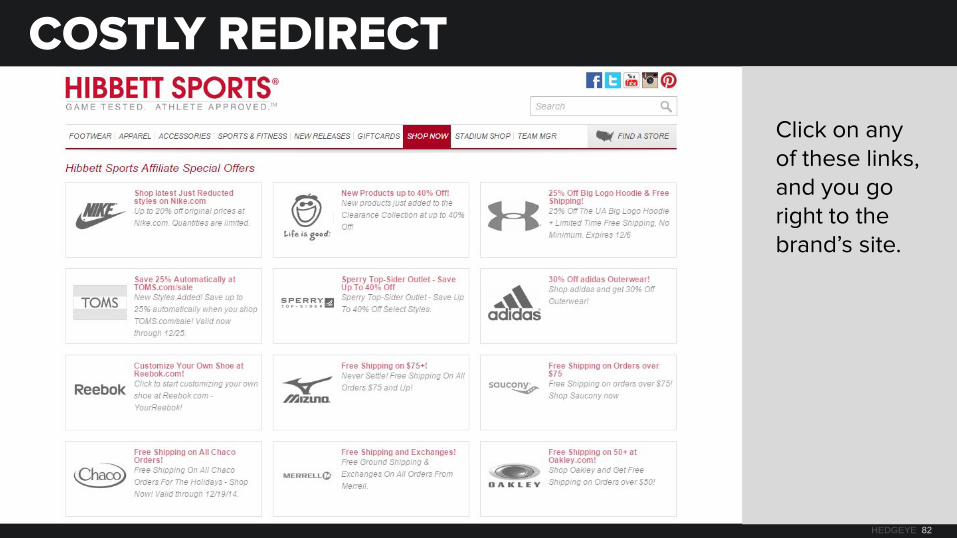
COSTLY REDIRECT
Click on any of these links, and you go right to the brand’s site.
HEDGEYE 83
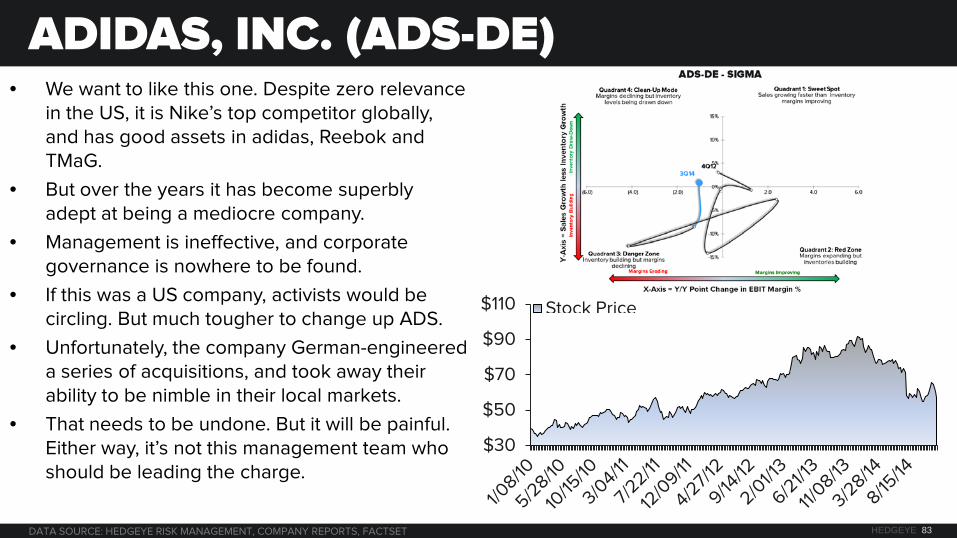
ADIDAS, INC. (ADS-DE) • We want to like this one. Despite zero relevance
in the US, it is Nike’s top competitor globally, and has good assets in adidas, Reebok and TMaG.
• But over the years it has become superbly adept at being a mediocre company.
• Management is ineffective, and corporate governance is nowhere to be found.
• If this was a US company, activists would be circling. But much tougher to change up ADS.
• Unfortunately, the company German-engineered a series of acquisitions, and took away their ability to be nimble in their local markets.
• That needs to be undone. But it will be painful. Either way, it’s not this management team who should be leading the charge.
DATA SOURCE: HEDGEYE RISK MANAGEMENT, COMPANY REPORTS, FACTSET
$30
$50
$70
$90
$110 Stock Price
CHART APPENDIX
HEDGEYE 85
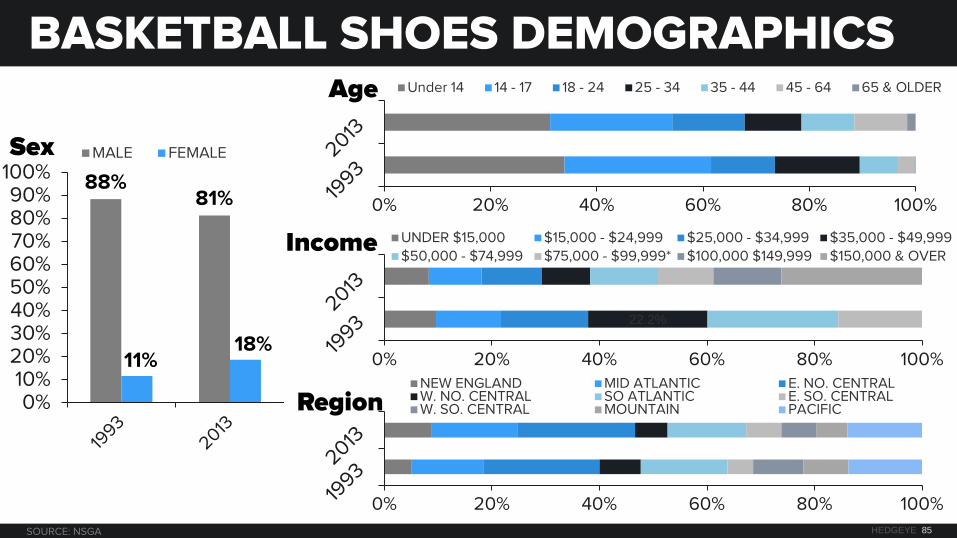
BASKETBALL SHOES DEMOGRAPHICS
0% 20% 40% 60% 80% 100%
Under 14 14 - 17 18 - 24 25 - 34 35 - 44 45 - 64 65 & OLDER
22.2%
0% 20% 40% 60% 80% 100%
UNDER $15,000 $15,000 - $24,999 $25,000 - $34,999 $35,000 - $49,999
$50,000 - $74,999 $75,000 - $99,999* $100,000 $149,999 $150,000 & OVER
0% 20% 40% 60% 80% 100%
NEW ENGLAND MID ATLANTIC E. NO. CENTRAL W. NO. CENTRAL SO ATLANTIC E. SO. CENTRAL W. SO. CENTRAL MOUNTAIN PACIFIC
88% 81%
11% 18%
0% 10% 20% 30% 40% 50% 60% 70% 80% 90%
100% MALE FEMALE Sex
Age
Income
Region
SOURCE: NSGA
HEDGEYE 86
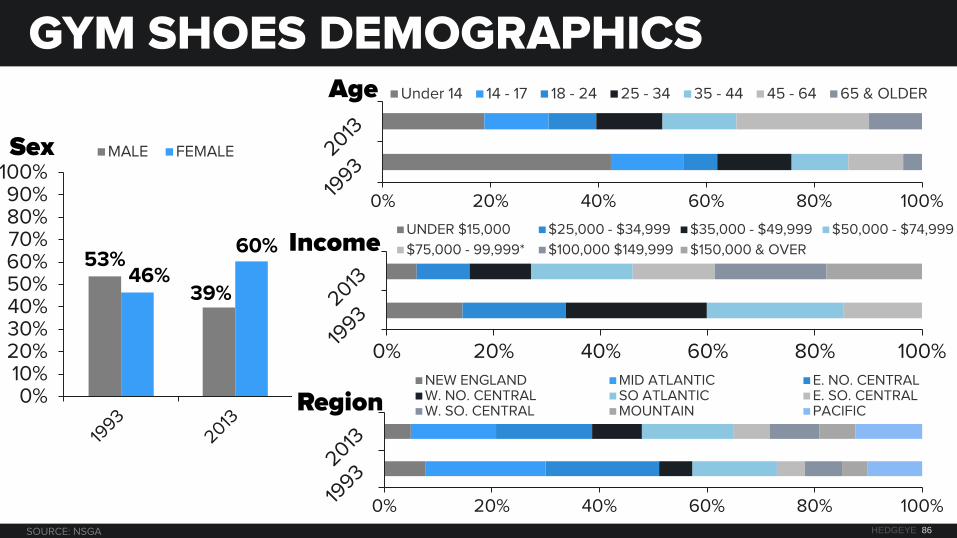
GYM SHOES DEMOGRAPHICS
0% 20% 40% 60% 80% 100%
Under 14 14 - 17 18 - 24 25 - 34 35 - 44 45 - 64 65 & OLDER
0% 20% 40% 60% 80% 100%
UNDER $15,000 $25,000 - $34,999 $35,000 - $49,999 $50,000 - $74,999
$75,000 - 99,999* $100,000 $149,999 $150,000 & OVER
0% 20% 40% 60% 80% 100%
NEW ENGLAND MID ATLANTIC E. NO. CENTRAL W. NO. CENTRAL SO ATLANTIC E. SO. CENTRAL W. SO. CENTRAL MOUNTAIN PACIFIC
53%
39% 46%
60%
0% 10% 20% 30% 40% 50% 60% 70% 80% 90%
100% MALE FEMALE Sex
Age
Income
Region
SOURCE: NSGA
HEDGEYE 87
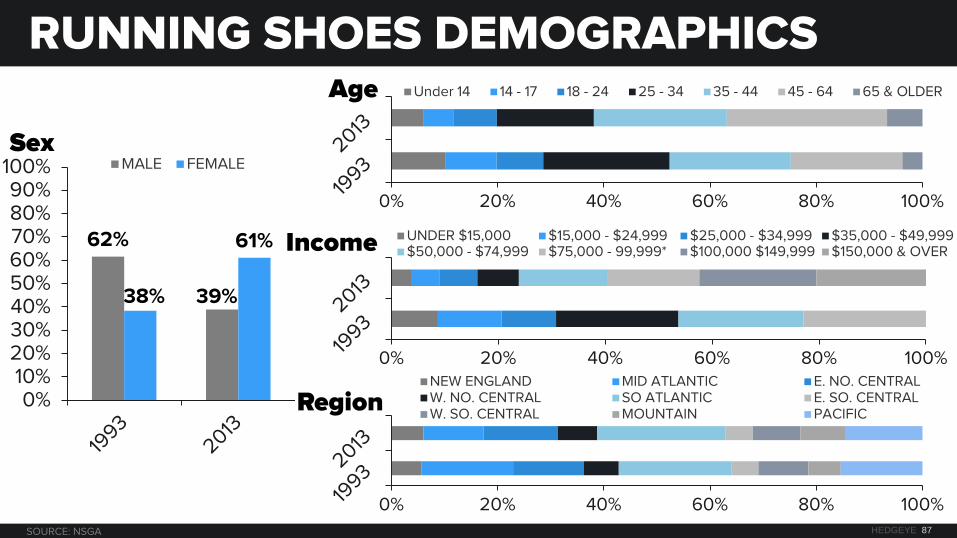
RUNNING SHOES DEMOGRAPHICS
0% 20% 40% 60% 80% 100%
Under 14 14 - 17 18 - 24 25 - 34 35 - 44 45 - 64 65 & OLDER
0% 20% 40% 60% 80% 100%
UNDER $15,000 $15,000 - $24,999 $25,000 - $34,999 $35,000 - $49,999 $50,000 - $74,999 $75,000 - 99,999* $100,000 $149,999 $150,000 & OVER
0% 20% 40% 60% 80% 100%
NEW ENGLAND MID ATLANTIC E. NO. CENTRAL W. NO. CENTRAL SO ATLANTIC E. SO. CENTRAL W. SO. CENTRAL MOUNTAIN PACIFIC
62%
39% 38%
61%
0% 10% 20% 30% 40% 50% 60% 70% 80% 90%
100% MALE FEMALE Sex
Age
Income
Region
SOURCE: NSGA

HEDGEYE 88
QUESTIONS?