at their own pace - ericcourse material at their own pace. within the classroom it also offers...
TRANSCRIPT

At Their Own Pace
Interim Findings from an Evaluation of a Computer-Assisted, Modular Approach to Developmental Math
Alissa Gardenhire John Diamond
Camielle Headlam Michael J. Weiss
June 2016

This study was funded by Grant R305A130125-15 to MDRC from the U.S. Department of Education’s Institute of Education Sciences. Dissemination of MDRC publications is supported by the following funders that help finance MDRC’s public policy outreach and expanding efforts to communicate the results and implica-tions of our work to policymakers, practitioners, and others: The Annie E. Casey Foundation, Charles and Lynn Schusterman Family Foundation, The Edna McConnell Clark Foundation, Ford Foundation, The George Gund Foundation, Daniel and Corinne Goldman, The Harry and Jeanette Weinberg Foundation, Inc., The JBP Foundation, The Joyce Foundation, The Kresge Foundation, Laura and John Arnold Foundation, Sandler Foundation, and The Starr Foundation. In addition, earnings from the MDRC Endowment help sustain our dissemination efforts. Con-tributors to the MDRC Endowment include Alcoa Foundation, The Ambrose Monell Foundation, Anheuser-Busch Foundation, Bristol-Myers Squibb Foundation, Charles Stewart Mott Founda-tion, Ford Foundation, The George Gund Foundation, The Grable Foundation, The Lizabeth and Frank Newman Charitable Foundation, The New York Times Company Foundation, Jan Nichol-son, Paul H. O’Neill Charitable Foundation, John S. Reed, Sandler Foundation, and The Stupski Family Fund, as well as other individual contributors. The findings and conclusions in this report do not necessarily represent the official positions or policies of the funders. For information about MDRC and copies of our publications, see our website: www.mdrc.org. Copyright © 2016 by MDRC®. All rights reserved.

iii
Overview
Community colleges nationwide are looking for solutions to help students complete developmental (remedial) math — a known barrier to graduation. Some are offering computer-assisted, modular developmental math courses that allow students to earn credits incrementally and move through the curriculum at their own pace.
One of these modularized courses, ModMath, was created at Tarrant County College (TCC) near Fort Worth, Texas. It reorganizes the content of TCC’s two semester-long developmental math courses into a set of six modules, each of which is five weeks long. The four primary components of the ModMath intervention are: a diagnostic assessment that places students in a starting module; individual registration into three modules per course section each semester; computer-based instruc-tion delivered online through an instructional software program; and personalized, on-demand assis-tance in class from an instructor and class aide.
MDRC is evaluating ModMath’s implementation and its effects on students’ academic outcomes using a randomized controlled trial. This report contains implementation findings and some findings on early impacts for the first three semesters of students enrolled in the study:
• ModMath was well implemented and differed from traditional developmental math courses in both the nature of its instruction and its credit-earning structure.
• After one semester in the program, students randomly assigned to ModMath (the program group) were, on average, closer to completing the developmental math sequence than were stu-dents randomly assigned to traditional, lecture-based courses (the control group). This relatively greater progress was the result of program group students getting credit for completing one or two modules but not the equivalent of an entire course.
• However, this advantage did not translate into other measures of progress. For example, pro-gram group students were not more likely to pass the halfway mark in the developmental math sequence than the control group. More than 70 percent of the students in the study, in either group, were unable to pass this benchmark in the first semester.
• ModMath had a small negative effect on the percentage of students who completed the devel-opmental math sequence during their first semester (0.4 percent of program group students compared with 1.9 percent of the control group).
While this report contains final findings regarding the implementation of ModMath, it contains only preliminary findings on the program’s effects. Data were only available for students who enrolled in the first three semesters of what were ultimately four semesters of enrollment, and the report only follows them for one semester. The final report from this study will draw upon additional data and provide additional evidence about the effect ModMath may have on student outcomes.


v
Contents
Overview iii List of Exhibits vii Preface ix Acknowledgments xi Executive Summary ES-1 Chapter 1 Introduction 1
What Is ModMath? 4 Overview of the Evidence 7 Research Questions 10 Organization of This Report 11
2 Study Design, Data Sources, and Sample Characteristics 13 Study Design 13 Data Sources 14 Student Characteristics 16 Instructor Characteristics 16 Summary 18
3 Implementation Findings 21 Summary of Findings and Organization of the Chapter 21 Diagnostic Assessment 21 Modular Courses 23 Computer-Assisted Instruction 25 On-Demand, Personalized Assistance 30 Summary 32
4 Early Impact Findings 33 Early Effects on Academic Performance 33 Early Effects on Short-Term Progress in Math 34 Early Effects on Progress in Other Courses 38 Possible Mechanisms 38 Summary 39
5 Conclusion 41 Background and Summary of Findings 41 Implications of These Early Findings 41 Limitations of This Study’s Findings 43 Next Steps 43

vi
Appendix A Additional Analyses 45 References 65

vii
List of Exhibits
Table
ES.1 Content Alignment of ModMath Modules and Lecture-Based Developmental Math Courses ES-3
ES.2 Early Math Enrollment and Progress ES-7
1.1 A Logic Model for ModMath: Components, Practices, Mechanisms, and Outcome Measures 5
1.2 Content Alignment of ModMath Modules and Lecture-Based Developmental Math Courses 6
2.1 Characteristics of Students in the Study 17
2.2 Characteristics of Developmental Math Instructors 19
3.1 Components of ModMath Compared with Traditional Developmental Math at Tarrant County College 22
3.2 Student Survey Results: Course Difficulty 24
3.3 Student Survey Results: Instruction and Assistance 26
4.1 Early Math Enrollment and Progress 36
A.1 Student Characteristics at Study Enrollment 51
A.2 TSI Placement Levels of the Program and Control Groups 55
A.3 Student Survey Results 56
A.4 Student Survey Results Among Program Group Students 58
A.5 Students Placed Using MyMathTest and Other Placement Tests 59
A.6 Early Student Progress in ModMath 60
A.7 Early Math Enrollment and Progress 61
A.8 Early Credits Attempted and Earned 62
A.9 Early Student Math Progress Under Alternate Assumptions for Students Who Did Not Pass Any Math Classes 64
viii
Figure
4.1 Percentage of the Developmental Math Sequence Complete After Passing Each Math Class 35
Box
1.1 About Tarrant County College 3
1.2 Building Self-Confidence in Developmental Math Students 8
1.3 Is ModMath an Acceleration Strategy? 9

ix
Preface
Developmental education has been a major target of postsecondary reform in states and com-munity colleges for decades. In recent years, for example, some states have even begun requir-ing their community colleges to do away with developmental offerings, or have begun allowing students to opt out of developmental courses regardless of their assessment scores. Other col-leges are moving toward a model in which remedial students enroll in a college-level course and receive additional support in an extra lab period, never enrolling into a developmental math course.
Despite all this attention to the issue, in 2011 MDRC reviewed the literature on devel-opmental education and found only limited evidence of effective reforms. Since then, MDRC has worked to build a rigorous and reliable body of evidence about effective developmental ed-ucation reforms. Many of these studies have explored reforms to the instruction of developmen-tal math specifically, as it is widely considered the most significant barrier to college comple-tion for students who are placed in developmental courses. ModMath, at Tarrant County Col-lege near Fort Worth, Texas, is one such approach. It offers computer-assisted, modular devel-opmental math instruction that allows students to earn credits incrementally and work through course material at their own pace. Within the classroom it also offers students personalized, on-demand attention that gives them the academic and emotional support they need to learn math.
This is the first of what will be two reports on ModMath. It finds that so far the program has been implemented well and that it is producing experiences for students that are meaning-fully different from more traditional, lecture-based math courses. At this early stage the findings on the program’s impacts are mixed: After one semester in the program, ModMath students had moved further through the developmental math sequence than non-ModMath students, but they remained far from successfully completing the requirements. After one semester, well under half of the students in both ModMath and traditional, lecture-based courses have made it to the halfway mark in the developmental math sequence — and the halfway mark is the equivalent of passing a single semester’s worth of developmental math.
The second and final report from this study is due in 2018. It should reveal whether the incremental progress ModMath students have begun to make does ultimately lead more of them to complete developmental math, and more importantly, whether it leads more of them to com-plete college-level math and either graduate or move on to a four-year college.
Gordon L. Berlin President, MDRC


xi
Acknowledgments
The authors would like to thank our partners at Tarrant County College (TCC) for their collabo-ration and invaluable assistance. In particular, we would like to recognize Karen Pace, Maureen Feste, Greta Harris-Hardland, Tai Vo, Gary Smith, Gay Gregory, Condoa Parrent, and Jackie Hon, who were all instrumental to study operations. Dr. Rosemary Reynolds, Robert Lorick, Carol Bracken, Kira Barrington, James Brown, and Arjun Banjade provided support to our data team in the collection, processing, and analysis of institutional data. We also would like to thank the many instructors, students, academic advisers, and other TCC staff members who participat-ed in focus groups and observations for their contribution to this study. Each person from TCC who touched the study in some way made our work possible.
We are also grateful to our MDRC colleagues who provided support, guidance, and con-structive criticism throughout the study. Mary Visher, Lashawn Richburg-Hayes, Robert Ivry, and Elizabeth Zachry Rutschow reviewed drafts of the report and offered helpful critiques throughout the writing process. Emma Fernandez and Barrett Montgomery assisted in the report coordination and fact-checking. We also thank the publications staff for their assistance, especial-ly Joshua Malbin, who edited the report, and Stephanie Cowell, who prepared it for publication.
The Authors


ES-1
Executive Summary
My name is Theresa and I’m now in Mod 2.1 I started at the bottom, now I’m here. I’ve taken many, many remedial [math] classes and haven’t gotten any-where, because after a while I realized that I didn’t have the core that I needed to move on. I’m almost finished with my college career here at TCC and the only thing that’s holding me back [is] the math requirements.
—ModMath student
Community colleges nationwide are looking for solutions to help students like Theresa com-plete developmental math, because it is a barrier to college completion for large numbers of them. More than half of entering community college students place into developmental math, but many of them fail to complete the developmental sequence and even fewer enroll in and pass a college-level math course, which is often a requirement to get a degree.2 In response, many colleges have made changes that tend to fall into one or more of three broad categories:
• Curricular reforms that change the content of the curriculum, for example, by eliminating courses to reduce redundancy in the sequence or replacing preal-gebra with statistics in order to help students learn the math most relevant to their larger academic goals and careers
• Structural reforms that change course offerings or reduce the time spent in the developmental math sequence, for example, by dividing courses into modules or discrete units, compressing 16-week courses into 8 weeks, or pairing developmental courses with college-level ones (a practice known as mainstreaming)
• Pedagogical or instructional reforms that change how developmental math content is delivered, for example, by introducing computer-assisted instruc-tion or learning associated with real-world career paths or contexts
One strategy is to offer computerized, modular courses where students can move through the curriculum at their own pace. ModMath — created and implemented by Tarrant County College (TCC) near Fort Worth, Texas — is one such approach that aims to change both pedagogy and course-credit structure. ModMath encompasses four basic components: di-agnostic assessment; the division of courses into modules; computer-assisted instruction; and
1This student’s name was changed to protect his or her identity. 2Thomas Bailey, Dong Wook Jeong, and Sung-Woo Cho, “Referral, Enrollment, and Completion in De-
velopmental Education Sequences in Community Colleges,” Economics of Education Review 29, 2 (2010): 255-270.

ES-2
on-demand, personalized assistance. At the core of ModMath is a structural change that divides TCC’s two semester-long developmental math courses into six five-week modules or “mods.” MDRC, a nonprofit, nonpartisan education and social policy research organization, is evaluat-ing ModMath’s implementation and its effects on students’ academic outcomes using a ran-domized controlled trial.
This report addresses three primary questions about how ModMath was implemented and three questions about its early impacts on student outcomes.
1. To what degree were ModMath services and activities implemented as planned?
2. How are the services and activities experienced by program group students different from those experienced by control group students?
3. Are students randomly assigned to ModMath (the program group) more en-gaged in learning math than students randomly assigned to traditional, lec-ture-based courses (the control group)?
4. What is the effect on students’ math placement levels of using MyMathTest compared with other placement tests?
5. What is the effect on students’ likelihood of completing the developmental math course sequence of being offered the opportunity to enroll in Mod-Math?3
6. What positive spillover effects or negative side effects on students’ credit ac-cumulation are caused by offering them the opportunity to enroll in Mod-Math?
The implementation research has revealed that the four components of ModMath were implemented well and that they have created a substantially different experience for the pro-gram group from that of the control group. The early impact findings are mixed — program group students made more progress in the developmental math sequence than control group students, but were not more likely to pass the halfway mark in the sequence and were slightly less likely to complete all of it. The remainder of this executive summary describes the interven-tion and provides more details on the findings.
3Note that this is the primary or “confirmatory” research question as described in Peter Z. Schochet, Tech-
nical Methods Report: Statistical Power for Regression Discontinuity Designs in Education Evaluations, NCEE 2008-4026 (Washington, DC: National Center for Education Evaluation and Regional Assistance, Insti-tute of Education Sciences, U.S. Department of Education, 2008).

ES-3
What Is ModMath? TCC, a community college serving about 50,000 students in the Fort Worth area, created ModMath in 2006 to address the needs of students who need remediation in math. ModMath divides TCC’s two semester-long developmental math courses (Math 0361: Developmental Math 1 and Math 0362: Intermediate Algebra) into six five-week modules or “mods,” covering the entire developmental math course sequence.4 The mods align with the college’s traditional, lecture-based developmental math courses in structure and content as indicated in Table ES.1.
The four primary components of the ModMath intervention are diagnostic assessment; the division of courses into modules; computer-based instruction; and personalized, on-demand assistance.
4For clarity, this report refers to the six ModMath modules as Mods 1, 2, 3, 4, 5, and 6. The official course numbers designated by Tarrant County College are Math 0114, Math 0115, Math 0116, Math 0117, Math 0118, and Math 0119, respectively.
Table ES.1
Content Alignment of ModMath Modules and Lecture-Based Developmental Math Courses
Module 1 Simple algebraic operations Math 0361: Developmental Math 1 Module 2 Basic geometric measurements
Basic algebraic expressions Graphing
Module 3 Exponents Polynomials
Module 4 Rational expressions and equations Functions Variation equations
Math 0362: Intermediate Algebra
Module 5 Linear and absolute value equations Linear and absolute value inequalities Radical expressions
Module 6 Radical expressions and equations Real and complex numbers Quadratic equations and functions
SOURCE: ModMath program coordinator, Tarrant County College.

ES-4
Diagnostic Assessment
TCC determines remediation needs primarily using the Texas Success Initiative (TSI) Assessment, a test used by colleges across Texas to assess students’ college readiness in math, reading, and writing.5 In addition to the TSI Assessment, students who are interested in enrol-ling in ModMath are given a special placement exam using Pearson Education’s MyMathTest software, which places them in their starting modules. TCC faculty members used the Pearson software to develop a ModMath placement exam aligned with TCC’s developmental math cur-riculum and ModMath’s six modules. At TCC, this placement exam was also called MyMathTest.6 MyMathTest is intended to be more precise than TCC’s standard placement ex-am, and to place students in modules that closely match their demonstrated math knowledge. Students can start in any of the six mods, depending on their placement scores on MyMathTest.
Modular Courses
ModMath students typically register for three mods each semester, and earn one non-degree-applicable developmental math credit for each mod they pass. Discrete mods provide students the opportunity to earn one credit at a time, so that they can make incremental progress throughout the semester (unlike the all-or-nothing approach of a traditional semester-long class, in which students fail to earn any credits if they fail a course, even if they master one-third or more of the material). Students who fail a mod are allowed to repeat it immediately in the next five-week session, without waiting for the next semester. For ease of scheduling, all six mods are offered during each class section.
Computer-Assisted Instruction
ModMath’s course content is delivered using an instructional software program called MyMathLab. Students work at their own pace through the course content using instructional videos, PowerPoint presentations, or an online or hard-copy version of the textbook. Students can access all of these means of instruction anywhere they can access the Internet — at home, in the library, at the campus math lab, etc. Since instruction is self-paced, students who work quickly and efficiently have the opportunity to accelerate and complete the course work for more than three modules (the equivalent of one course) in a single semester.
5Not all students take the TSI Assessment — some students may have the test waived or be exempt from it
on the basis of other test scores, or on the basis of other factors, such as their status as veterans. In some in-stances, students may also be placed in developmental math using alternative placement test scores.
6Unless otherwise specified, in this report MyMathTest refers not to the Pearson software platform but to the specific math placement test developed by the TCC faculty to place students in ModMath modules.

ES-5
On-Demand, Personalized Assistance
Each ModMath class is led by an instructor who is assisted by an instructional aide. The instructor and aide walk around the room providing one-on-one help to students who need or request it. This personalized assistance is intended to allow the instructional staff to provide in-dividual academic and emotional support to students.
Study Design The evaluation study discussed in this report employs a randomized controlled trial research design to estimate the effect of offering students the opportunity to enroll in ModMath, com-pared with a “business-as-usual” control condition that generally means the offer of a tradition-al, lecture-based course.7 Students who were eligible for and interested in participating in ModMath were randomly assigned either to a program group, who could enroll in ModMath, or a control group, who could enroll in the college’s regular developmental math courses, primari-ly traditional, lecture-based courses.8 TCC and MDRC recruited 1,403 students to participate in the evaluation during the spring 2014, fall 2014, spring 2015, and fall 2015 semesters.
Data Sources Multiple quantitative data sources were used to characterize study participants and to measure the early effects of ModMath, including student baseline questionnaires, math placement rec-ords, student transcript records, and student and instructor surveys. Researchers also conducted field research activities during the spring 2014 and fall 2014 semesters to complement the find-ings emerging from the quantitative data. Field research was used to explore the development and implementation of ModMath and to gauge students’ and instructors’ experiences with ModMath and other developmental math classes at TCC. Field research activities included stu-dent focus groups, instructor focus groups, a focus group with academic advisers, interviews with TCC staff members, and observations of ModMath and non-ModMath classrooms.
Study Findings The implementation research revealed that the four components of ModMath were implemented well, with fidelity to the model. Moreover the classroom experiences of the program group were
7For ease of reading, this report will refer to “the effects of ModMath” rather than “the effects of the op-
portunity to enroll in ModMath.” 8The majority of students assigned to the control group enrolled in TCC’s traditional, lecture-based devel-
opmental math courses — Math 0361: Developmental Math 1 and Math 0362: Developmental Math 2. How-ever, students in the control group may also have enrolled in other types of developmental math course offer-ings at TCC, including computer-assisted lecture courses and Math Emporium.

ES-6
substantially different from those of the control group. The impact study showed that, at least for the first three of the four cohorts in the study,9 the short-term effects of ModMath were mixed:
• On the positive side, program group students were 10 percentage points clos-er to completing the developmental math sequence than control group stu-dents — 25 percent of the way through it compared with 15 percent. Pro-gram group students also registered at higher rates for math courses and passed math courses at higher rates, as shown in Table ES.2. These differ-ences are statistically significant.
• However, these advantages did not translate into other measures of progress. For example, program group students were not more likely to pass the half-way mark in the developmental math sequence than the control group. More than 70 percent of students in the study, in either group, were unable to pass this benchmark in the first semester.
• ModMath had a very small but statistically significant and negative impact on the percentage of students who completed the entire developmental math sequence during their first semester, 0.4 percent for the program group com-pared with 1.9 percent for the control group.
Implications of These Early Findings For some interventions, a lack of impacts can sometimes be attributed to weak or poor imple-mentation of the program or to a lack of contrast between the program and control conditions. This study rules out these factors as explanations for the mixed findings on ModMath’s early impacts. Interviews with and survey data from students, instructors, and administrators, as well as classroom observations, confirm that all of the components of ModMath were delivered and that program group students had a very different experience from the control group. Further, most ModMath students reported that they liked this computer-assisted, modular approach to learning math, and said that they felt a sense of accomplishment as they passed each mod.
At this stage, it is still too early to conclude whether or not ModMath will make a dif-ference in the percentage of students who make it through the developmental sequence, the speed at which they do so, or the rate at which they succeed in college-level math. While the study shows that ModMath had a positive effect on the average amount of the developmental math sequence a student completed in the first semester, this effect appears to reflect the many students who succeeded in passing one or two mods, an opportunity that was not available to
9A “cohort” is the group of students who joined the program in the same semester.

ES-7
Table ES.2
Early Math Enrollment and Progress
Tarrant County College Spring 2014, Fall 2014, Spring 2015
First-Semester Outcome Program
Group Control Group Difference
Standard Error
. . . . Average percentage of the developmental . . . . math sequence completed 25.1 15.0 10.0 *** 1.6 . . . . Enrolled in math class shown or higher math (%) . . . .
__Any math class (course or mod) 87.9 80.8 7.1 *** 2.4 __Second half of the developmental sequence 6.5 5.8 0.7 1.7 __College-level math 0.4 0.0 0.4 0.3 . . . . Passed math class shown or higher math (%) . . . .
__Any math class (course or mod) 71.2 28.3 42.9 *** 3.1 __First half of the developmental sequence 24.5 28.0 -3.5 3.0 __Second half of the developmental sequence 0.4 1.9 -1.6 ** 0.7 __College-level math 0.0 0.0 0.0 0.0 . . . . Sample size (total = 869) 504 365 . .
SOURCE: MDRC calculations using transcript data from TCC.
NOTES: Rounding may cause slight discrepancies in sums and differences. __Estimates are adjusted by cohort. __A two-tailed t-test was applied to differences between research groups. Statistical significance levels are indi-cated as: *** = 1 percent; ** = 5 percent; * = 10 percent.
their counterparts in traditional 16-week math courses. In other words, students in the ModMath group were able to make more incremental progress, but it remains to be seen whether these “small wins” will get them across the finish line more often or more quickly than the control group.
There are at least two additional reasons why the results from longer-term follow-up with the full sample will be important. First, most of the students in the study placed at the be-ginning of the developmental math sequence. These students’ odds of passing each course — let alone the entire sequence and a college-level math course — are not good. Because many students may withdraw from or fail courses, requiring multiple attempts to pass, the process of completing the math sequence can take many semesters to play out. Outcomes in the first se-mester may say little about what lies ahead.

ES-8
Second, ModMath was explicitly designed by the college’s math faculty to encourage persistence and success by means of the mechanism referred to in the research literature and this report as “small wins.”10 Students often arrive in their developmental math courses discouraged and demoralized by their low placement test scores and by their past struggles with math in high school or college, and full of anxiety about once again trying to learn math. In sharp contrast with their control group counterparts, ModMath, students learn right away that they can experi-ence success quickly and relatively easily in three ways: (1) when they demonstrate subject mastery in lesson checks and quizzes; (2) when they earn credit as frequently as every five weeks for passing mods; and (3) when they have the chance to return to math and pick up where they left off in the developmental sequence, without significant repetition, if they fail a mod or need to stop attending for any reason.
These small accomplishments and sense of forward momentum may strengthen stu-dents’ engagement in math, improve their attitudes toward math and their own abilities general-ly, and, through this heightened self-confidence, encourage them to persist and do better. In fact, program group students reported being somewhat more engaged and having more positive atti-tudes toward their math classes than did control group students. Again, it remains to be seen whether these higher levels of engagement among program group students translate to greater persistence in math, higher rates of completion in developmental math, and higher rates of completion in college-level math.
Next Steps While this report contains final findings and conclusions regarding the implementation of ModMath, the findings it contains on the program’s effects on student outcomes are prelimi-nary. Data were only available for three of the four participating cohorts, and only for one se-mester of follow-up. The final report from this study will provide additional evidence about ModMath’s effect on student outcomes. It will incorporate the fourth — and largest — cohort of students and follow the full sample for several more semesters.
10Karl E. Weick posits the “small wins” concept in “Small Wins: Redefining the Scale of Social Prob-
lems,” American Psychologist 39, 1 (1984): 40-49.

1
Chapter 1
Introduction
My name is Theresa and I’m now in Mod 2. I started at the bottom, now I’m here. I’ve taken many, many remedial [math] classes and haven’t gotten any-where, because after a while I realized that I didn’t have the core that I needed to move on. I’m almost finished with my college career here at [Tarrant] and the only thing that’s holding me back [is] the math requirements.
—ModMath student
Lack of success in math is a problem for community college students nationwide. For many, math is the primary obstacle keeping them from completing a college credential.1 Entering community college students who are assessed to be unprepared for college-level math are placed into developmental (remedial) math courses, and some, like the student quoted above, move through their other academic requirements yet remain stuck in math. In fact, only about a third of students who are referred to developmental math complete the sequence.2 There are various reasons for these low completion rates. Some studies attribute failure rates to the pre-vailing pedagogy in math classes, characterized by lectures and rote, procedural learning, which may make it harder for students to master math concepts and may also reduce their motivation.3 Students also come to community college with different learning styles, many of which are not accommodated in traditional lecture classes.
Learning math and passing math courses may be especially challenging for community college students who have previously experienced difficulty with the subject, and their past math experiences may influence their confidence in their ability to learn and use math concepts in college courses. Some developmental math students arrive with genuine anxieties about their ability to learn math. One of them in this study, for example, said “I got here and had some real big fears about taking math, because I was never really good at it.” Many people entering com-munity college are nontraditional students, and they arrive on campus with their real lives in tow.4 In addition to managing course work, these students must balance employment, family caregiving demands, and other social commitments. Math is not always first on their minds, as quotes from these two students illustrate:
1Attewell, Lavin, Domina, and Levey (2006). 2Bailey, Jeong, and Cho (2010). 3Hodara (2011); Hammerman and Goldberg (2003); Hiebert and Grouws (2007); Golfin, Hull, and Ruffin
(2005). 4Nontraditional students include those who are 24 and older, those who have dependents, those who work
full time, and those who are attending college only part time.
2
There’s so many other things that I have to do, like I work and ... I live with my grandparents, so I have to watch my grandpa whenever my grandma goes.
—Developmental math student
I have a lot of things to do, like I just had a baby that is 4 months, and then I have four classes, and I work, and I’m married now.
—Developmental math student
Any one of these factors could easily take up the time students need to focus on math course work. Combinations of them create high barriers to success in developmental math for community college students across the nation.
In response, colleges have made a range of changes in how developmental math is taught and in how the sequence of courses is structured, often with the goal of accelerating stu-dents’ progress through the sequence.5 These strategies tend to fall into one or more of three broad categories:
• Curricular reforms that change the content of the curriculum, for example, by eliminating courses to reduce redundancy in the sequence or replacing preal-gebra with statistics in order to help students learn the math most relevant to their larger academic goals and careers6
• Structural reforms that change course offerings or reduce the time spent in the developmental math sequence, for example, by dividing courses into modules or discrete units, compressing 16-week courses into 8 weeks, or pairing developmental courses with college-level ones (a practice known as mainstreaming)7
• Pedagogical or instructional reforms that change how developmental math content is delivered, for example, by introducing computer-assisted instruc-tion or learning associated with real-world career paths or contexts8
5Rutschow and Schneider (2011); Quint, Jaggars, Byndloss, and Magazinnik (2013); Bracco, Austin, Bu-
gler, and Finkelstein (2015); Edgecombe (2011). 6Rutschow, Diamond, and Serna-Wallender (2015); Cullinane and Treisman (2010); Rutschow and
Schneider (2011); Edgecombe (2011). 7Rutschow and Schneider (2011); Bracco, Austin, Bugler, and Finkelstein (2015); Epper and Baker
(2009); Edgecombe (2011). 8Bracco, Austin, Bugler, and Finkelstein (2015); Epper and Baker (2009); Rutschow and Schneider
(2011).

3
ModMath spans the last two categories. The invention of a small group of experienced math faculty members in the Tarrant County College (TCC) system, ModMath is a computer-assisted, modular approach to developmental math instruction. (For more on Tarrant County College, see Box 1.1.) These faculty members came together in the fall of 2006 to brainstorm how to help more students complete TCC’s developmental math course sequence and pass into college-level math — a requirement for most majors. ModMath reflects the insights of TCC faculty members who were in the classroom daily with developmental math students. They saw students who struggled to keep up with the subject matter when it became difficult and fell be-hind as a result. They saw students who were bored and disengaged in class because some ma-terial was too easy, but who were not ready for the next math class according to their placement exam scores. They taught students with learning styles not well served by the traditional lecture format and noticed that too few students mastered the math they were taught and moved on to — let alone succeeded in — college-level math courses. And many saw that their students were pulled away from school for nonacademic reasons like health problems, caregiving responsibili-ties, and conflicts with work. They designed ModMath to change the mode of delivery radically from a traditional, lecture-based approach to a computer-assisted, self-paced approach with fre-quent assessments that encourage students to master each concept before moving on the next. The first classes were offered in the fall of 2008 and have continued to be offered each semester through the release of this report.
In the spring of 2013, MDRC released a report titled Fast Forward: A Case Study of Two Community College Programs Designed to Accelerate Students Through Developmental Math, which describes the history and early implementation of ModMath in detail.9 The current report builds on this earlier case study with early findings from an evaluation of the program as
9Fong and Visher (2013).
Box 1.1
About Tarrant County College
With an annual enrollment of about 50,000 students, Tarrant County College District is one of the largest college systems in Texas. Students may enroll in courses across the col-lege’s six campuses, which are located in Fort Worth, Arlington, and Hurst, Texas. The college also offers online courses.
Currently, the ModMath developmental math program only operates at the college’s Northeast Campus in Hurst and North Richland Hills, between Fort Worth and Dallas. The Northeast Campus offers a range of associate’s degree programs that prepare students to enter professional careers or transfer to four-year institutions. When the study began, the Northeast Campus served approximately 15,000 students, with about 1,200 enrolled in developmental math.

4
implemented starting in the spring of 2014 at one campus in the TCC system. It includes im-plementation findings that provide an in-depth look at the components of ModMath and com-pare the experiences and perceptions of its students with those of students in other developmen-tal math course offerings — typically traditional, lecture-based developmental math settings. This report also presents early findings from a randomized controlled trial intended to estimate ModMath’s impact students’ academic outcomes. (In a randomized controlled trial, study par-ticipants are randomly assigned either to a program group who are eligible to participate in the intervention — in this case, who are given the opportunity to enroll in ModMath — or to a con-trol group who are not.) Impact findings are based on the academic outcomes after one semester for the first three of a total of four cohorts enrolled in the study.10
What Is ModMath? ModMath has four basic components: diagnostic assessment; the division of courses into small-er “modules”; computer-assisted instruction; and on-demand, personalized assistance. Table 1.1 depicts the ModMath theory of change or logic model. The first two columns describe each component of the program and how it is put into practice at TCC. The last two columns list the intended student outcomes, and the middle column explains the mechanisms through which each set of practices may lead to improved outcomes for ModMath students. Each of the four components is described below.
Diagnostic Assessment
Many entering TCC students take a standard placement exam called the Texas Success Initiative Assessment.11 Students who earn below certain benchmark scores on the mathematics portion of the exam are referred to developmental math. Developmental math students enrolled in ModMath take an additional exam called MyMathTest, which is used to determine their start-ing modules.12 MyMathTest is intended to be more precise than TCC’s standard placement ex-am and to place students into modules that closely match their demonstrated math knowledge.
10A “cohort” is the group of students who joined the program in the same semester. 11Not all students take the Texas Success Initiative Assessment — some students may have the test waived
or be exempt from it on the basis of other test scores or on the basis of other factors, such as their status as vet-erans. In some instances, students may also be placed in developmental math using alternative placement test scores.
12MyMathTest is derived from a suite of math instruction tools of the same name from Pearson Education. Pearson is a British-owned education publishing and assessment company that creates products sold to schools, corporations, and students. Sixty percent of its sales are in North America, but it operates in more than 70 countries. Pearson’s MyMathTest platform allowed the TCC faculty to create a customized placement exam by selecting from the software’s bank of test problems those questions that aligned with TCC’s developmental math curriculum. In this report, MyMathTest refers not to the Pearson software platform but to the specific math placement test developed by the TCC faculty.

Table 1.1
A Logic Model for ModMath: Components, Practices, Mechanisms, and Outcome Measures
Component Practices and Features Mechanisms Student Outcome Measures
Diagnostic assessment (MyMathTest)
• Fine-tuned for module placement
• Aligned with course content
• Accurate placement resulting in close alignment of content with students’ prior math knowledge
Short-Term Academic Progress
• Developmental math course pass rates
• Proportion of the developmental math sequence completed
• College-level math pass rates
• Credits earned in subjects other than math
Long-Term Academic Progress
• College-level credits earned
• Total credits earned
• Persistence • Degree/certificate
attainment • Transfer rates to
four-year colleges
Modular courses
• Semester-long course divided into three five-week modules
• Modules worth one developmental math credit each
• Modules aligned with the standard curriculum
• One credit for each mod passed, giving students a sense of progress
• The ability to repeat a failed or abandoned mod in the next five-week session rather than waiting until the next semester to repeat the whole course, resulting in increased persistence
Computer-based instruction (MyMathLab)
• 100 percent of class time in a computer lab
• Various content delivery methods for instruction (video, PowerPoint presentation, textbook)
• Frequent assessments • Extra support available via
software
• Self-paced learning • Possibility of completing up to six
modules in a single semester • Variety of content delivery methods
and frequent assessments that facilitate mastery
• Requirement to demonstrate mastery of material before moving on
Personalized, on-demand assistance
• An instructor and aide staffing each class, circulating and providing one-on-one assis-tance
• Increased one-on-one instructor-student interactions, allowing more academic and emotional support
5

6
Table 1.2
Content Alignment of ModMath Modules and Lecture-Based Developmental Math Courses
Module 1 Simple algebraic operations Math 0361: Developmental Math 1 Module 2 Basic geometric measurements
Basic algebraic expressions Graphing
Module 3 Exponents Polynomials
Module 4 Rational expressions and equations Functions Variation equations
Math 0362: Intermediate Algebra
Module 5 Linear and absolute value equations Linear and absolute value inequalities Radical expressions
Module 6 Radical expressions and equations Real and complex numbers Quadratic equations and functions
SOURCE: ModMath program coordinator, Tarrant County College.
Students can start ModMath in any of the six modules, depending on their placement scores on MyMathTest.
Modular Courses
At the core of ModMath is a structural change that divides TCC’s two semester-long developmental math courses (Math 0361 and Math 0362) into six modules or “mods” of five weeks each that together cover the entire developmental math course sequence. The mods align with the college’s two traditional, lecture-based developmental math courses as shown in Table 1.2.
All six mods are offered in any ModMath class section (called the “one-room school-house” by college staff members). ModMath students register for three mods each semester, and students earn one non-degree-applicable developmental math credit for each mod they pass. This ability to earn credits incrementally, one unit at a time, may give students a sense of ac-complishment, generally referred to in the research literature as “small wins,” since they receive credit for smaller chunks of work and retain the credit even if they are unable to complete an entire semester’s worth (as expected in the traditional, lecture-based courses).13 In addition, stu-
13Weick (1984) posits the “small wins” concept.

7
dents who fail a mod have the chance to repeat it immediately in the following five-week ses-sion, without waiting for the next semester. Each mod credit earned is independent from the others, so if students stop attending class mid-semester, they can return and start with the last mod not yet completed rather than repeating the mods they have already passed.
Computer-Assisted Instruction
ModMath’s course content is delivered using Pearson’s instructional software program MyMathLab. Throughout each class period, students work individually through module content using instructional videos, PowerPoint slides, or an online or hard-copy version of the textbook. These various pedagogical resources are intended to make it easier for students to master math concepts, as they can select the modes most suitable to their learning styles. On any given day, students enrolled in the same class section may work on distinct math topics, depending on their starting modules and the pace at which they work. Students must demonstrate mastery of each concept by passing an assessment before moving on to the next. Since instruction is self-paced and computer-based, students who progress quickly can complete more than three mods in a single semester.
On-Demand, Personalized Assistance
Each ModMath class typically has 24 students and is led by an instructor who is assist-ed by an instructional aide. The instructor and aide walk around the classroom providing help to students who need or request it. Compared with traditional lecture-based courses, this highly personalized structure gives the instructional staff more opportunities to provide one-on-one academic and emotional support to students. Students may have less anxiety and more engage-ment in math as a result, helping them progress through the sequence (see Box 1.2).
Overview of the Evidence Other popular reforms in developmental math instruction have shown consistent impacts. “Mainstreaming” — placing developmental students directly into college-level courses while giving them supplemental instruction — has shown some evidence of positive impacts,14 as have compression models, where two semester-length courses are compressed into one semes-ter.15 (See Box 1.3 for more on how ModMath fits into the trend to shorten the time students spend in developmental math.) Learning communities (which bring together small groups of students who take two or more linked courses) have shown rigorous evidence of small but
14Jenkins et al. (2010); Logue, Watanabe-Rose, and Douglas (forthcoming). 15Edgecombe, Jaggars, Baker, and Bailey (2013).

8
positive effects.16 However, evaluations of programs similar to ModMath have had very mixed results. Some programs show positive impacts, some negative, and some show no effects. Add-ing to this uncertainty is the fact that much of the research has been methodologically weak and therefore inconclusive.
There are a few important exceptions. A randomized controlled study of the Open Learning Initiative compared that web-based course to traditional lecture-based classroom in-struction.17 The course was compared on its own and as a hybrid approach that included time with an instructor. No differences were found in test scores when the course was compared on its own. However, the study found that when the Open Learning Initiative was combined with an instructor, students learned a full semester’s worth of material in half as much time and
16Weiss et al. (2015); Weiss, Visher, Weissman, and Wathington (2015). 17The Open Learning Initiative curriculum consists of web-based courses that are designed so that students
can learn without an instructor. Sometimes instructors use it to supplement their teaching.
Box 1.2
Building Self-Confidence in Developmental Math Students
According to the faculty members who created it, there were a number of reasons why ModMath had the potential to build students’ confidence in math and propel them through the course sequence more effectively than traditional lecture courses. First, the various pedagogical resources used in ModMath could make it easier for students to master math concepts, as they could select the instructional modes most suitable to their learning styles (videos, PowerPoint presentations, the textbook, or the instructor in class). Second, the self-paced nature of computer-assisted instruction may increase comprehension, as stu-dents must master each concept before moving on to the next. Third, the built-in “mastery experiences” students had to complete to pass a mod could give them a sense of accom-plishment and confidence, as could the modular design that allowed them to earn credits incrementally.
Finally, these incremental accomplishments, or “small wins,” can motivate students who are likely to have struggled to learn math in the past. According to the theory of “small wins,” breaking up large problems — in this case a developmental math course — into smaller, more manageable ones encourages people to develop workable solutions. In this case students are encouraged to master one math concept at a time and are rewarded right away for doing so, which can keep them from feeling overwhelmed when a problem seems difficult.

9
performed as well as or better than students in traditional, full-semester programs.18 A different study found both increased math achievement and reduced math-related anxiety for students in “computer-mediated” instruction.19
18Lovett, Meyer, and Thille (2008). 19Taylor (2008).
Box 1.3
Is ModMath an Acceleration Strategy?
Many colleges are operating programs to shorten the time students spend in developmen-tal education, so that they can move on to college-level courses and succeed there. These “acceleration” strategies include changing the way teaching and learning occurs in the classroom, strengthening the quality and preparation of faculty members, condensing 16-week courses into 8 weeks so that two can be attempted in a single semester, shortening or even eliminating the sequence of developmental courses, allowing students to enroll con-currently in developmental courses and college-level courses (known as “mainstream-ing”), and more. All of these programs are designed to help students move through devel-opmental education at least as quickly as “business as usual,” and some are also intended to result in greater mastery of math, so that students can not only get through their devel-opmental courses more quickly, they can also have a good chance at succeeding in col-lege-level math and other courses.
Is ModMath an acceleration strategy? The math faculty members who designed ModMath would say that it is because it offers students the opportunity to move through the material as quickly as they want to and can. For example, in theory students can complete all three modules of the first course and then attempt up to three additional modules of the second course, all in one semester. If they passed all six modules, they would complete the entire developmental sequence in just one semester rather than two. In contrast, a student taking the traditional, 16-week lecture-based course cannot complete that course in less than 16 weeks, let alone move on to the second course in the same semester. ModMath’s design-ers also insisted that acceleration without mastery is meaningless. They believed that ModMath’s guided, self-paced structure with frequent quizzes and diagnostic testing along the way would ensure that students had mastered the relevant content before mov-ing on to the next module.
ModMath clearly does offer students the chance to go more quickly through the develop-mental math sequence. One of the questions addressed by this study is whether students actually do progress more quickly. Chapter 4 presents some preliminary answers, but de-finitive results will not be available until the final report is released.

10
In contrast, another relatively rigorous study found no differences in outcomes between students who were taught using a computer-assisted approach and those who had traditional instruction.20 Still other studies found that computer-assisted math instruction methods had neg-ative effects. For example, two studies found that students using this method were more likely to withdraw.21
Research Questions Given the mixed evidence on computer-assisted approaches to teaching math, com-
bined with its increasing popularity in community colleges, more reliable evidence is sorely needed regarding the effectiveness of the approach. This study contributes to that store of relia-ble evidence by rigorously testing ModMath, a homegrown, computer-assisted, modular pro-gram. It addresses three primary questions about how ModMath was implemented, and three questions about its impact on students’ outcomes.
1. To what degree were ModMath services and activities implemented as planned?
2. How are the services experienced by program group students different from those experienced by control group students?
3. Are students randomly assigned to ModMath (the program group) more engaged in learning math than students randomly assigned to traditional, lecture-based courses (the control group)?
4. What is the effect on students’ math placement levels of using MyMathTest com-pared with other placement tests?
5. What is the effect on students’ likelihood of completing the developmental math course sequence of being offered the opportunity to enroll in ModMath?22
6. What positive spillover effects or negative side effects on students credit accumula-tion are caused by offering them the opportunity to enroll in ModMath?
Organization of This Report Chapter 2 describes the methods and data used for the study in greater detail. Chapter 3 covers the implementation of the program, including results from a student survey. Chapter 4 presents
20Zhu and Polianskaia (2007). 21Zavarella and Ignash (2009); Ashby, Sadera, and McNary (2011). 22Note that this is the primary or “confirmatory” research question, as described in Schochet (2008).

11
early findings regarding ModMath’s impacts on student outcomes. Chapter 5 analyzes the find-ings and presents considerations for the final report and beyond.


13
Chapter 2
Study Design, Data Sources, and Sample Characteristics
This chapter describes the study design used to evaluate ModMath and the qualitative and quantitative data sources used in this report. It also describes the students who participated in the study and the instructors who taught the ModMath classes (the program condition) and the lecture-based developmental math classes (the control condition).
Study Design The study employs a randomized controlled trial research design to estimate the causal effect of offering students the opportunity to enroll in ModMath compared with a “business-as-usual” control condition that generally means the offer of a traditional, lecture-based course.1 In this study, students who were eligible for the study and who were interested in participating were randomly assigned either to a program group, who could enroll in ModMath, or a control group, who could enroll in the college’s regular developmental math courses, primarily traditional, lecture-based courses. As a result of random assignment, the program and control groups were expected to be very similar to each other with respect to observable characteristics (for example, gender) and unobservable characteristics (for example, tenacity) at the outset of the evaluation. Differences between the later outcomes of the two groups provide an unbiased estimate of the effect of the program — ModMath.
With help from MDRC, Tarrant County College (TCC) recruited students with developmental math needs for the study in four semesters: spring 2014, fall 2014, spring 2015, and fall 2015.2 Developmental math students were recruited with posters, e-mails, and targeted information sessions. In addition, in the fall of 2014 TCC set up a developmental math advising room, where students could learn from math department staff members about the developmental math course offerings available, including ModMath. Students who agreed to participate in the study signed an informed consent form and completed a short survey (the baseline information form, described further below). After a student completed the consent form and baseline information form, he or she was randomly assigned to the program group or the control group.
1For ease of reading, this report will refer to “the effects of ModMath” rather than “the effects of the
opportunity to enroll in ModMath.” 2Students were recruited for the study in the two to three months leading up to each semester, before they
had registered for classes.

14
A total of 1,403 students from the four cohorts were randomly assigned, with approximately 59 percent assigned to the ModMath program group and 41 percent assigned to the control group.3
Data Sources Multiple data sources were used to characterize study participants and to measure the early effects of ModMath:
• Baseline information form. The baseline information form asked students for information on their demographic characteristics, family and educational backgrounds, and experiences with math. These data were used to characterize the students participating in the study, to confirm that the program and control groups were similar in their observable characteristics (as they should have been, since they were randomly assigned), and to establish preintervention subgroups for future analysis.
• Texas Success Initiative (TSI) placement records. The TSI is used across Texas to determine whether incoming students are ready for college-level course work in reading, writing, and math. At the beginning of the study, MDRC analyzed students’ TSI placement records to estimate their levels of remedial need in reading, writing, and math. This report analyzes TSI placement records from fall 2012 through spring 2015.4
• MyMathTest placement scores. As described in Chapter 1, MyMathTest was administered to students who were randomly assigned to the program group; their test scores were analyzed to compare their placement using MyMathTest with their placement using other tests.5
• Student transcript records. Students’ transcript records were analyzed to determine which courses they enrolled in and passed. These data, discussed in more detail in Chapter 4, were used to estimate the early effects of
3A majority of students were assigned to the program group to ensure that there were sufficient ModMath
students to fill course sections. 4Note that the Texas Success Initiative (TSI) can refer to both a standard placement test report as well as a
specific type of placement test — also known as the Texas Success Initiative Assessment, or TSIA. TSI records analyzed for this report included TSIA placement scores as well as other scores such as ACCUPLACER and COMPASS.
5During the first semester of recruitment, in spring 2014, MyMathTest was also administered to control group students. Administrators grew concerned about the burden this practice was placing on students, however, so MyMathTest was only administered to program group students beginning with the second study cohort.

15
ModMath on students’ academic progress. Transcript records from spring 2014 through spring 2015 were analyzed for this report.
• A student survey. Students were surveyed about their developmental math experiences during their first semester in the study, whether they were still enrolled or not. Student survey data were used along with qualitative data to illuminate program students’ experiences in ModMath classrooms and to reveal how those experiences differed from the experiences of their control group counterparts (see Chapter 3 for a discussion of these analyses, and see Appendix Tables A.3 and A.4 for extended survey results). The same survey was put into the field four times, once for each cohort. A total of 1,386 students were surveyed, of whom 1,012 responded — a response rate of 73 percent.
• An instructor survey. Developmental math instructors were surveyed about their demographic characteristics, educational and professional backgrounds, and teaching experiences, both for descriptive purposes and to see whether the characteristics of ModMath instructors were different from those of instructors who teach traditional math. All instructors who taught at least one developmental class between spring 2014 and fall 2015 were surveyed. Of 51 instructors surveyed, 42 responded, a response rate of 82 percent.
Researchers also conducted the following field research activities during the spring 2014 and fall 2014 semesters to complement the findings emerging from the quantitative data, to explore the development and implementation of ModMath, and to gauge students’ and instructors’ experiences with ModMath and other developmental math classes.
• Student focus groups. Researchers conducted four focus groups with program group students and one with control group students. These groups ranged in size from 4 to 20 participants. Students were recruited for focus groups through e-mail invitations, classroom announcements, and word-of-mouth.
• Instructor focus groups. One focus group was conducted with ModMath instructors, one with traditional developmental math instructors, and one containing both ModMath and traditional developmental math instructors. These focus groups included a total of 17 participants.
• Academic adviser focus group. One focus group was conducted with seven academic advisers.

16
• Interviews with staff members. Eight interviews were conducted with various TCC staff members involved in the ModMath program, including the staff members who coordinated the program, math department chairs at the Northeast Campus, and senior college administrators. A total of 12 individuals participated in the interviews.
• Classroom observations. Researchers informally observed ModMath classrooms 10 times and non-ModMath classrooms 5 times.
Information from the various field activities was coded and analyzed to assess ModMath’s implementation and to determine how program and control group members’ experiences differed (the “service contrast”).
Student Characteristics As described above, upon joining the study, students completed a questionnaire covering information about their demographic characteristics, family and educational backgrounds, and experiences with math. Students in the study had a racial and gender composition similar to that of TCC’s overall student body. As shown in Table 2.1, about 36 percent of students in the study were male, compared with 42 percent of TCC’s student population overall. The study sample was 46 percent white, 28 percent Hispanic, and 20 percent black; TCC’s population was 42 percent white, 29 percent Hispanic, and 19 percent black.6 These measures suggest that students participating in the study were typical of the TCC student population.
Many students in the study had characteristics associated with a low likelihood of academic success.7 A third of the students were the first in their families to attend college. Only 43 percent planned to enroll in school full time during the first study semester. Nearly three-quarters said that they planned to work during the upcoming semester, with about 44 percent planning to work full time. In addition, more than half of students reported that they had failed a math class in the past. Appendix Table A.1 presents all data reported by students on the baseline information form.
Instructor Characteristics As mentioned above, developmental math instructors were surveyed about their demographic characteristics, educational and professional backgrounds, and teaching experiences to gauge
6Data for TCC’s student population were obtained from the Integrated Postsecondary Education Data
System and are not shown in the table. These data are based on students enrolled for the fall 2014 semester. 7Engle (2007).

17
Table 2.1
Characteristics of Students in the Study
Tarrant County College Spring 2014, Fall 2014, Spring 2015, Fall 2015
Characteristic (%) Full
Sample . Male 35.7 . Age .
__18 and under 22.0 __19-24 38.4 __25-34 21.7 __35-44 10.4 __45 and over 7.5 . Race/ethnicitya .
__Hispanic 28.3 __White 45.7 __Black 19.6 __Other 6.5 . Completed 12th grade 87.3 . First person in family to attend college 33.7 . Planned enrollment this semester . __Less than part time (fewer than 6 credits) 17.8 __Part time (6 to 12 credits) 39.0 __Full time (12 credits or more) 43.2 . Planning to work this semester . __No 18.9 __Yes, part time (less than 30 hours a week) 31.0 __Yes, full time (30 hours a week or more) 43.6 __Missing 6.6 . Failed a math class in the past 53.5 __Missing 6.7 . Sample size 1,389
SOURCE: MDRC calculations using data from the baseline survey of TCC students.
NOTES: Rounding may cause slight discrepancies in sums and differences. __"Missing" shows the percentage of survey respondents who did not answer the question. Missing values are only reported for items with more than 5 percent missing. __aRespondents who said they were Hispanic and chose a race are included only in the "Hispanic" category. Respondents who said they were not Hispanic and chose more than one race are included in the "other" category. The "other" category also includes respondents who chose Asian, American Indian, or Pacific Islander.

18
whether the instructors teaching ModMath might differ from other instructors, particularly in ways that could affect students’ academic outcomes. For example, if ModMath classes were taught by more experienced instructors, and if instructor experience were associated with effectiveness, then students in ModMath classes might be more likely than traditional students to pass developmental math not because the ModMath program itself is more effective, but because its instructors had more experience.
Table 2.2 shows that the two groups of instructors were similar in many regards. Most instructors in both groups were white, with an average age of around 48 or 49. Instructors in both groups reported having taught for an average of 17 years, and having taught developmental math specifically for 10 years. Both groups were also roughly equally likely to have received different types of professional development within the past two years.
In other ways, however, the groups were somewhat different. For example, ModMath instructors were less likely to be male (36 percent) than other instructors (47 percent). ModMath instructors were also somewhat more involved in the math department than other instructors: They were more likely to have served as math department administrators (17 percent versus 11 percent of other instructors), or to have served on a committee on math curriculum, evaluation, or assessment (32 percent versus 26 percent).
No statistically significant differences were observed between the two groups of instructors (probably in part because only a limited number of instructors were surveyed). As additional data become available, later reports on this research study may explore whether some of the small differences observed between the two groups of instructors contributed to differences in academic outcomes between students in the program and control groups.
Summary This research study is using a mixed-methods, randomized controlled trial design. Multiple sources of quantitative and qualitative data were used to characterize the students participating in the study and the instructors teaching them. Data were also gathered to assess the potential effects of ModMath on students’ academic progress, to describe their experiences in the program, and to gauge the implementation of the program itself. The next two chapters discuss program implementation and students’ experiences in their math courses, followed by the early effects of ModMath on students’ academic outcomes.

19
Table 2.2
Characteristics of Developmental Math Instructors
Tarrant County College Spring 2014, Fall 2014, Spring 2015, Fall 2015
Characteristic Sample
Size ModMath
Instructors Other
Instructors Difference Standard
Error . . . . . Male (%) 41 36 47 -11 15.7 . . . . . Age (years) 28 48 49 0 6.6 __Missing (%) 42 22 47 -26 * 14.4 . . . . . Race/ethnicitya (%) . . . . .
__Hispanic 42 0 5 -5 4.8 __White 42 83 74 9 13.0 __Asian 42 0 5 -5 4.8 __Black 42 4 5 -1 6.8 __American Indian 42 4 0 4 4.8 __Missing 42 9 11 -2 9.3 . . . . . Years of teaching experience . . . . .
__Developmental math 41 10 10 0 3.5 __All subjects 42 17 17 -1 4.0 . . . . . Adjunct or full faculty member (%) . . . . .
__Adjunct 42 61 68 -8 15.2 __Full faculty member 42 35 32 3 15.0 __Other 42 4 0 4 4.8 . . . . . Highest degree earned (%) . . . . .
__Bachelor's 42 9 11 -2 9.3 __Master's 42 83 79 4 12.5 __Doctorate 42 9 11 -2 9.3 . . . . . Current or former . . . . .
math department administrator (%) 42 17 11 7 11.1 . . . . . For degrees earned, . . . . .
majors or concentrationsb (%) . . . . .
__Mathematics/statistics/economics 42 87 84 3 11.1 __Education (focused on math education) 42 35 42 -7 15.4 __Education (other focus) 42 17 5 12 10.1 __Engineering/computer science/science 42 48 32 16 15.4 __Other 42 17 5 12 10.1 . . . . . Participated in a committee for math . . . . .
curriculum, evaluation, or assessment (%) 41 32 26 6 14.6 . . . . . Participated in . . . . .
a campus-level committee (%) 42 26 32 -5 14.3
(continued)

20
Table 2.2 (continued)
Characteristic Sample
Size ModMath
Instructors Other
Instructors Difference Standard
Error . . . . . Within the past two years, received . . . . .
professional development inb (%) . . . . .
__Math content knowledge 41 68 63 5 15.2 __Computer-assisted instruction 41 59 47 12 15.9 __Teaching methods/pedagogy 39 81 78 3 13.3 . . . . . Average instructor agreement regarding . . . . .
students (1 = very true, 4 = not very true) . . . . .
__They can understand the material. 42 2 2 0 0.2 __They will succeed in college algebra. 40 2 2 0 0.2 __They don't study enough. 42 2 2 0 0.2 . . . . . Sample size (total survey respondents) 42 23 19 . .
SOURCE: MDRC calculations using data from a survey of TCC developmental math instructors.
NOTES: Rounding may cause slight discrepancies in sums and differences. __A two-tailed t-test was applied to differences between research groups. Statistical significance levels are indicated as: *** = 1 percent; ** = 5 percent; * = 10 percent. __"Missing" shows the percentage of survey respondents who did not answer the question. Missing values are only reported for items with more than 5 percent missing. __aRespondents who said they were Hispanic and chose a race are included only in the "Hispanic" category. __bDistributions may not sum to 100 percent because categories are not mutually exclusive.

21
Chapter 3
Implementation Findings
This chapter presents findings regarding the implementation of ModMath. The implementation research aimed to describe how the program operated, to determine whether the program was implemented as intended by its designers, and to describe differences between the experiences of the program and control groups. All of these are factors that can affect a program’s impacts. Table 1.1 described several hypotheses about how the program could lead to improved academic outcomes for students, and this chapter explores whether these hypothesized mechanisms are in fact at work.
Summary of Findings and Organization of the Chapter Overall, the study is a fair test of the ModMath model. The program’s components were implemented with reasonable fidelity to the model and the experience of the ModMath program group was different from the experience of the non-ModMath control group in the ways the designers anticipated. Table 3.1 provides an overview of the differences between ModMath and traditional developmental math courses at Tarrant County College (TCC). The remainder of the chapter describes how each core component of ModMath was implemented at TCC: diagnostic assessment; the division of courses into modules; computer-assisted instruction; and on-demand, personalized assistance. Each section covers the ModMath mechanisms that could lead to improved outcomes and the differences between the experiences of program and control group students.
Diagnostic Assessment As discussed in Chapter 1, students entering TCC are referred to one of two developmental math levels (Math 0361: Developmental Math 1 or Math 0362: Intermediate Algebra) based on their scores on the Texas Success Initiative (TSI) Assessment. Students who place into either level of developmental math are eligible to take ModMath instead of Math 0361 or Math 0362. In addition to the TSI Assessment, ModMath students take MyMathTest, a more fine-grained assessment, to determine which of the six ModMath modules they should start with.
MyMathTest was used as planned at TCC to place students in modules. At least 75 percent of program group students took MyMathTest at the beginning of their first semesters in

22
Table 3.1
Components of ModMath Compared with Traditional Developmental Math at Tarrant County College
ModMath Traditional Developmental Math Course structure
• Five-week, one-credit modules • Students register for three mods
each semester
• 16-week, three-credit course • Students register for one course each
semester Class composition
• Students in multiple modules • Typically 24 available seats per
class
• Students in the same course • Typically 33 available seats per class
Staffing • Instructor and aide • Instructor only Placement • Placement determined by
MyMathTest • Most students place into Mod 1
• Placement determined by TSI Assessment • Most students place into Developmental
Math I Pedagogy • Computer-assisted instruction
• Individually tailored, self-paced instruction (with guidance from pacing calendar and instructor)
• MyMathLab computer software always used for instruction and homework
• Lecture-based instruction • Instructor-led whole group instruction • MyMathLab software used for homework
but in-class usage varies
Learning support
• Instructor and aide provide on-demand, one-on-one assistance
• Instructor provides assistance but one-on-one opportunities are limited in class
SOURCE: MDRC field research.
the study,1 and ModMath faculty members generally reported that the exam was aligned with the ModMath curriculum and placed students in the right modules.
To determine whether MyMathTest made a difference in student placement, program group students’ MyMathTest scores were compared with their scores on other placement tests used by TCC, including the TSI Assessment.2 MyMathTest generally placed students in similar
1More than 75 percent of program group students may have taken MyMathTest — placement test data
were not available for all students. 2Placement data from tests other than MyMathTest were not yet available for students in the fall 2015
study cohort as of the writing of this report; percentages in this paragraph refer only to the first three study cohorts. In cases where a recent TSI Assessment test score was unavailable, students’ earlier scores on other tests such as COMPASS and ACCUPLACER were used instead. Among students in the first three study cohorts, information on their placement using non-MyMathTest placement tests was unavailable for

23
ways as other tests. About 84 percent of students placed at the beginning of the math course sequence under both testing approaches: Mod 1 using MyMathTest or Math 0361 (Developmental Math 1) using other placement tests.3 Since these students probably needed remediation in all of the content covered by the developmental math curriculum, the opportunity to use MyMathTest did not make much of a difference. MyMathTest, however, did appear to alter placement for approximately 16 percent of students: About 12 percent of students seem to have placed higher using MyMathTest than they did on the college’s standard placement exams and 4 percent of students seem to have placed lower. It is possible that this 16 percent of students started at a level more appropriate to their abilities.4 (See Appendix Table A.4 for more information on this analysis.)
Although the placement test data indicate that MyMathTest did not alter math placement for most students, the student survey indicates that program group students were more likely to feel that their classes were appropriately difficult than control group students. As shown in Table 3.2, 71 percent of program group students reported that their classes were appropriately difficult, compared with 51 percent of control group students. Similarly, more control group students reported that their math classes were a bit too hard or much too hard than program group students. These survey data should be considered carefully, however, as students’ perception of difficulty may reflect where they were in the curriculum at the time they were surveyed, rather than their initial placement.
Modular Courses Analysis of transcript, course-catalog, interview, and classroom-observation data indicates that ModMath classes were offered as planned in discrete five-week, one-credit modules. Students enrolled in three modules each semester, and all ModMath class sections functioned as “one-room schoolhouses” — each class section could contain students working in all six mods. approximately 30 percent of students; in cases where placement information was available, it was sometimes dated several semesters before the start of the study.
3According to available placement data from tests other than MyMathTest, many students placed three levels down from college readiness, indicating that they should enroll in an adult basic education course rather than Math 0361. However, among control group students for whom complete testing data were available, more than 80 percent of the students who placed at this level enrolled in Math 0361. Therefore, for the purposes of estimating whether MyMathTest placed students in a similar manner as other placement tests, students placing into adult basic education are treated like students placing into Math 0361.
4It is relevant that TCC used to offer three developmental math courses and nine ModMath modules. Just before the start of the study, however, the lowest developmental math level was cut from the sequence due to a series of policy changes. As a result, more students may have begun the developmental math sequence in what now became the lowest course or module. It could be that the fine-grained assessment of MyMathTest was more applicable to the original course offerings than the course offerings that remained during this study. If that is the case, then a more fine-tuned placement test may have less bearing on students’ outcomes than described by the theory of change.

24
Table 3.2
Student Survey Results: Course Difficulty
Tarrant County College Spring 2014, Fall 2014, Spring 2015, Fall 2015
Response (%) Sample
Size Program
Group Control Group Difference
Standard Error
. . . . . Level of difficulty of current math class . . . . . __Much too easy 985 2.7 2.6 0.0 1.1 __A bit too easy 985 6.9 6.9 0.0 1.7 __Just about right 985 70.9 50.8 20.1 *** 3.1 __A bit too hard 985 14.9 29.6 -14.7 *** 2.6 __Much too hard 985 4.6 10.1 -5.5 *** 1.6 . . . . . Sample size (total survey respondents) 1,012 620 392 . .
SOURCE: MDRC calculations using data from a survey of TCC students.
NOTES: Rounding may cause slight discrepancies in sums and differences. __Estimates are adjusted by cohort. __A two-tailed t-test was applied to differences between research groups. Statistical significance levels are indicated as: *** = 1 percent; ** = 5 percent; * = 10 percent.
During the study semesters, ModMath classes typically met either twice per week for 80 minutes each session or three times per week for 55 minutes each session. They met in computer-lab-like classrooms that held up to 24 students.5
ModMath students who worked quickly and efficiently had the opportunity to complete more than three mods in one semester; however, even if they did, they could earn only three developmental math credits. If a student did accelerate and attempt more than three mods, the program coordinator changed the student’s registration to reflect the student’s progress. For example, if a student was registered for Mods 1, 2, and 3 but she completed Mods 1, 2, 3, and 4 in a single semester, her registration might be changed to Mods 1, 3, and 4. This change acknowledged the student’s acceleration by indicating her ending module so she could continue the developmental math sequence where she left off, in Mod 5, the following semester. Such acceleration was rare, however: Transcript data available for the first three cohorts of students in the study show that only 1 percent of program group students attempted more than three mods in a semester. Although few program group students completed more than three modules in a
5Traditional lecture-based classes met with the same frequency and duration as ModMath classes. The
study only operated during the fall and spring semesters noted in Chapter 2. Classes offered during the summer or in other semesters may have met according to different schedules.

25
semester, ModMath could still be considered a method of “acceleration” if it allows students to complete their developmental math requirements faster than they would have in traditional lecture-based math. The impact research component of this evaluation will explore this possibility. (See Chapter 4 for additional information.)
In addition to providing an opportunity for acceleration, the structure of ModMath allowed students to repeat failed mods immediately, in the next five-week session, as planned. This scenario was more common: Approximately 24 percent of program group students either failed or withdrew from a module and subsequently reattempted the same module during the same semester. Repeating a mod was documented on a student’s transcript the same way as acceleration. For example, if a student was registered for Mods 1, 2, and 3 but failed Mod 1 in the first five-week session, he would be guided to repeat Mod 1 immediately and his registration would be changed to Mods 1, 1, and 2. If this student passed Mod 1 in the second five-week session, he would progress to Mod 2 in the third. Students did earn and retain credit for each module that they passed, even if they passed fewer than three mods in a semester.
In interviews, faculty members and administrators explained the benefits of this structure. As one instructor said, “Even if [students] only end up with one [credit] at the end of the semester, it’s better than none. [We] try to keep them moving.” The modular course and credit structure of ModMath was seen as being important to student progress. By earning one credit at a time, students were experiencing “small wins,” making incremental progress toward the larger goal of completing the entire developmental math course sequence.
The structure of ModMath provided program group students with a notably different course experience from control group students. Control group students did not have the same opportunities to complete additional course work or repeat material within a semester. They took semester-long (16-week) courses, each worth three developmental math credits. Students in these traditional, lecture-based developmental math courses therefore could not accelerate and complete additional course work nor repeat failed material in the same semester. Students could only earn three developmental math credits if they passed the course or zero if they failed.
Computer-Assisted Instruction In ModMath, instruction is delivered primarily using the MyMathLab instructional software package. Computer-assisted instruction was implemented as planned. ModMath classes were held in small, computer-lab-like classrooms that each held 24 computer workstations. As shown in Table 3.3, 95 percent of program group students reported spending time on computers in class, and of those who used computers in class, 98 percent indicated that they always had

26
Table 3.3
Student Survey Results: Instruction and Assistance
Tarrant County College Spring 2014, Fall 2014, Spring 2015, Fall 2015
Response (%) Sample
Size Program
Group Control Group Difference
Standard Error
. . . . . Spent time on a computer in math class 1,000 94.7 58.4 36.4 *** 2.3 . . . . . Among those who used a computer . . . . .
__Always had access to a computer in class 806 98.1 71.6 . . __Software useda . . . . .
____MyMathLab 806 99.8 99.1 . . ____Other software 806 0.8 1.4 . . . . . . . In your most recent math class, the instructor . . . . .
spent a considerable amount or most of . . . . .
the class perioda . . . . . __Lecturing 993 23.4 79.4 -56.1 *** 2.7 __Working with small groups of students 992 22.7 24.9 -2.2 2.8 __Working with students individually 992 67.6 31.6 36.0 *** 3.1 __Giving announcements not related to math 989 12.4 14.3 -1.9 2.2 . . . . . In your most recent math class, the students . . . . .
spent a considerable amount or most of . . . . .
the class perioda . . . . .
__Working alone on math exercises 992 80.5 53.7 26.8 *** 2.9 __Working in small groups on math exercises 991 7.3 12.9 -5.6 *** 1.9 __Working as a class on math exercises 990 15.1 60.5 -45.4 *** 2.7 __Chatting, texting, or on personal business 991 4.1 6.2 -2.1 1.4 __Using computers, calculators, or technology 993 80.4 57.8 22.6 *** 2.9 __Having problems with technology 993 2.5 5.9 -3.4 *** 1.2 . . . . . Sample size (total survey respondents) 1,012 620 392 . .
SOURCE: MDRC calculations using data from a survey of TCC students.
NOTES: Rounding may cause slight discrepancies in sums and differences. __Estimates are adjusted by cohort. __A two-tailed t-test was applied to differences between research groups. Statistical significance levels are indicated as: *** = 1 percent; ** = 5 percent; * = 10 percent. __Values shown in italics are calculated for a subset of the full sample. __aDistributions may not sum to 100 percent because categories are not mutually exclusive.

27
access to a computer. As expected, 100 percent of program group survey respondents who used a computer reported that they used MyMathLab software in class, and there were few reports of technical difficulties with software or computers.
Using MyMathLab, ModMath students worked individually through the course content of each mod — which is divided into sections and units — by watching videos and PowerPoint presentations of lessons or by working through the material in an online or hard-copy version of the textbook.6 The use of these materials varied; some students used predominately one mode of instruction while others used all three. As one student said, “You just get on the computer and kind of work at your own pace and all of the materials are there.... There’s examples, there’s videos to watch, you can look at the book.” As ModMath students worked through the material, they were advised by their instructors to take notes and work through the problems presented in the videos, the PowerPoint presentations, or the textbook. As in any course, some students reported following these guidelines and taking detailed notes while others reported skimming the material in an effort to move quickly to quizzes, homework assignments, and exams.
MyMathLab contains three help features — View an Example, Help Me Solve, and Ask an Instructor. Students often used these help features when working through difficult problems or concepts before asking their instructors or aides for assistance. In general, students found these features to be useful but said that they could make homework assignments almost too easy. ModMath instructors noted that some students use the help features as a “crutch” and said that they often warned students about relying too much on the help features for assistance.
A surprisingly high percentage of control group students (58 percent) reported that they used computers in class, and of those who used computers 99 percent indicated that they used MyMathLab, as shown in Table 3.3. These high percentages probably reflect the fact that all developmental math students at TCC use MyMathLab for homework, including students enrolled in traditional, lecture-based courses. Nonetheless, students in ModMath and students in non-ModMath classes had dramatically different in-class experiences. Program group students spent the majority of their class periods working individually on computers, while students enrolled in traditional, lecture-based courses spent the majority of their class periods engaged in whole-group lectures led by their instructors.
6It is important to note that the instructional resources in MyMathLab, such as the videos and PowerPoint
presentations, are available to all developmental math students; however, the extent to which teachers encouraged students to use these materials varied from instructor to instructor. Interviews revealed that some non-ModMath instructors strongly encouraged students to use the videos and PowerPoint presentations for extra support outside of class, while others did not even mention them. It is unknown to what extent control group students actually used the instructional resources in MyMathLab.

28
Mastery
As indicated in Table 1.1, computer-assisted instruction in ModMath may improve academic outcomes by improving students’ content mastery. MyMathLab contains frequent assessments, and students are supposed to show that they have mastered each math unit before they progress to the next. After each lesson, students took a “lesson check” (similar to a quiz), and then moved on to the assigned homework for that section. After every two lessons, students encountered a unit quiz. Midway through the mod, they took a midterm exam, followed by a final exam at the end of the mod.
At each step in the assessment sequence (lesson, lesson check, homework, unit quiz, practice exam, actual exam) students only moved on to the next step if they had passed the previous one. This process of frequent assessments may have pushed students to master content before they moved on to new material.7 Although MyMathLab was set up in this manner, the software did not prevent students from moving forward if they chose to do so.
Nevertheless, the majority of program group students reported that they completed their homework assignments before taking their exams. Many instructors claimed that their doing so improved their learning and performance. ModMath students may be more likely to complete homework in a timely manner because unlike students in lecture-based classes, they can work on homework while in class — they do not have to follow the traditional structure of lesson in class and homework at home. As a result, instructors felt, students take a more active role in their own learning. As one instructor said, “I like [mods] because [students] actually do the homework to take the tests. In regular classes, maybe they do, maybe they don’t, and they [ModMath students] do better.”
Self-Paced Learning and Acceleration
Computer-assisted learning may also lead to improved student outcomes because it allows students to work at their own pace. In practice, ModMath was for the most part individually tailored, and students did work at their own pace through the course material. (Pacing was regulated to some extent by instructors.)
Self-pacing should allow ModMath students to complete more than three modules in a semester. As noted earlier in this chapter, such acceleration was indeed possible but not prevalent. In fact, focus group participants often said that the benefit of self-pacing was that it allowed them to slow down. As one student commented, with the video lessons, “You get to
7The study was unable to determine whether program group students actually mastered the curriculum any
better than control group students, because the ModMath and non-ModMath courses did not share any common exams.

29
stop the teacher and keep going over and over [the material] until you get it, and you won’t move on, and you won’t get left behind because the teacher or class is moving on.”
Although ModMath students progressed through the material at their own pace, they were expected to complete each module within the allotted five weeks in order to receive developmental math credit. Classroom observations and focus groups revealed that ModMath students were given a pacing calendar that detailed the amount of work they needed to accomplish each day in order to complete the course in the allotted time. While students did not follow the schedule fastidiously, some students used the calendar to monitor their progress and adjust their level of effort accordingly. The pacing calendar was implemented when instructors noticed that too many students were going slower than expected. However, it may have had the unintended consequence of slowing some students down who might have otherwise completed more than three modules in a semester.
Instructors may also play a role in monitoring students’ progress through the material, some more than others. The ModMath program coordinator, who also teaches ModMath classes, commented that some instructors “go around and say to a student, ‘Where are you today? Can I help you? You need to get up to this level.’ But there are some instructors who either aren’t comfortable or won’t do that.” Although the program coordinator said that some instructors do not monitor pace, many students in focus groups said that their instructors would nudge them to work faster if they were behind or would have them complete additional practice if they felt students were not ready to move on. For example, one student explained:
Our instructor, she goes through and kinda checks where everybody’s at; she pulls up a sheet just to see if you’re falling behind or not. And she tries to check on everyone as she’s going around. Like, she’ll start in the front or back, like, “Where you at?” So that’s her way. Sometimes when I know she’s coming around, I’m like, “I better do my homework tonight.”
Though ModMath is self-paced and individually tailored, instruction is very much a team effort of the student and instructor. MDRC’s field research found that there was a substantial difference between ModMath and traditional, lecture-based developmental math courses in the delivery of instruction. Lecture-based developmental math courses were held in traditional classrooms, most of which had approximately 33 seats. As a result, lecture-based classes frequently contained more students than ModMath classes, which had a maximum capacity of 24, as noted. Classroom observations revealed that, as expected, students in lecture-based classrooms did not learn the course content primarily from individual work on MyMathLab, as ModMath students did. Instead, their primary source of instruction was whole-group lectures and problem solving led by their instructors. This difference in instruction was confirmed by the student survey, as shown in Table 3.3: 23 percent of program group students reported that their instructors spent considerable time lecturing, compared with 79 percent of

30
control group students. In addition, 15 percent of program group students reported that they worked as a class on math exercises, compared with 61 percent of control group students.
On-Demand, Personalized Assistance While computer-based instruction seems to imply impersonal learning with little teacher-student interaction, the opposite is true of ModMath. On-demand, personalized assistance is an important component of ModMath that was well implemented at TCC. Each ModMath class was staffed with an instructor and an aide, as planned.8 The instructor and aide acted as “floating facilitators,” circulating throughout the classroom to provide one-on-one supplemental instruction and assistance to students. This individual support was discussed in both student and staff focus groups and confirmed by classroom observations. Many program group students reported that they used the instructor and aide as their primary sources of support when they experienced difficulty with the material. ModMath students often received assistance within minutes of raising their hands to signal that they need help. As one student explained:
[In mods] we can have time to ask the instructor the questions that we have, and then we have our time to do our work, so that it’s not sitting there, waiting and listening to a lecture the whole class period, when you actually have questions and get the answers to your questions quickly.
In addition, the instructor and aide would check on individual students when no hands were raised, providing unsolicited help. At times, students would just wait for the instructor or aide to come near before requesting assistance.
Students enrolled in traditional developmental math courses did not receive the same amount of on-demand, personalized support. Most lecture-based classes were taught by only one instructor; there was no instructional assistant or aide present. Students in lecture-based courses did ask questions, but the instructors often addressed their responses to the whole class. Control group students also reported that some class time was dedicated to group or individual work. During these times, students in lecture-based courses could potentially ask questions without having to speak in front of the whole class. Responses to the student survey confirm that there was a difference in in-class assistance and support. As shown in Table 3.3, 68 percent
8This study does not include a cost analysis, but implementation research points to some of the likely
additional costs over traditional math that TCC faced in running ModMath. These additional costs stem from two primary sources: the smaller class sizes in ModMath relative to the lecture courses (24 seats versus 33 seats) and the additional staff person in the form of a classroom aide in addition to the instructor. Ultimately, if ModMath shows no long-term positive effects, then any cost differential would favor the traditional instructional approach. It is too early to know whether the marginal impacts described in this interim report warrant further study of costs.

31
of program group students reported that their instructors spent a considerable amount of time working individually with students, compared with only 32 percent of control group students.
On-demand support allowed instructors to interact with students more one-on-one, creating more opportunities for them to provide academic and emotional support to struggling students. ModMath focus group participants frequently contrasted their experiences in ModMath with their previous experiences in lecture-based courses. For example, one student said, “It’s so much easier than lectures because I don’t feel pressure to just hurry up and just understand it.... I don’t really like asking questions in front of a big group of people because I’m scared I’m gonna ask a stupid question.”
ModMath instructors made similar observations about the benefits of on-demand, personalized assistance. They reported that in addition to academic support, ModMath allows them to get to know students better and to provide the emotional support that developmental math students may need to persist through the curriculum. Since they are able to form relationships with ModMath students, instructors are more likely to know when a student is thinking about withdrawing from the class, which makes them better able to intervene. As one instructor said:
You get to know them better than you do in a lecture since you’re one-on-one individually speaking with them, so I find I’m much more able to encourage them or keep them from giving up or getting discouraged.... In a mod they’ll tell you, “I feel like I’m giving up. I can’t do this.” You have a much better chance to say, “You can do this.”
This emotional support, combined with personalized academic instruction, may help ModMath students gain the confidence they need to complete their course work and persist through the developmental math sequence.
Student Engagement and Confidence
The majority of ModMath students who participated in focus groups liked ModMath. ModMath focus group participants who had previously failed a traditional, lecture-based developmental math course believed that they could do better in ModMath. As one student who failed a number of remedial math courses in the past explained, “I was really upset that I had to start at the bottom [mod], but I will say I passed my first mod with an A, which I’ve never done, so something must be working.”
Faculty members, advisers, and administrators also believed that ModMath was a good option for students who had struggled with math previously. As mentioned above, ModMath gave students a chance to experience “small wins,” which may have motivated them to persist. Faculty members asserted that unlike students in lecture-based courses, ModMath students must

32
be responsible for their own learning and complete their homework. They also mentioned that the structure of the courses gives students the academic foundation — and, in turn, the confidence — that they need to succeed.
Instructors especially noted that ModMath may be a good alternative for students who have repeatedly failed traditional, lecture-based math. One developmental math instructor in a lecture-based course reflected on a student whom she advised to take ModMath:
I had an 0304 [lecture-based developmental math] student that, she started with me with 0302 [another lecture based developmental math course]. Then she took me in 0304 and she did not pass my 0304 class. I told her ... you need to go to mods. I think that’s going to be the best thing for you, because she got stuck in the middle of 0304 and of course, we had to keep going and so she was never able to get that. I said you need to go to mods because you’ll stay in that section until you get it and then you’ll move forward. She did. She went to mods and she moved forward. I think it’s a good thing. Obviously, maybe it doesn’t work for everyone, but I think it’s a good thing.
Summary In general, ModMath was implemented as planned and the program provided a notably different developmental math experience for students compared with TCC’s traditional lecture-based courses. The next chapter discusses the impact of ModMath on students’ academic outcomes.

33
Chapter 4
Early Impact Findings
The evaluation of ModMath was designed to answer a series of questions about the academic performance of students randomly assigned to ModMath relative to students randomly assigned to traditional lecture classes, and about the mechanisms through which the program was expected to work. This chapter presents early answers to those questions. However, the results presented here cover academic outcomes after one semester for only a portion of the students in the study.1 A subsequent report will present impact findings for the complete study sample and will follow students for a longer period.
Early Effects on Academic Performance Early impact findings paint a mixed picture of ModMath’s effect on students’ academic progress. By the end of one semester of ModMath, program group students were further along the developmental math sequence and had accumulated more developmental math credits than their control group counterparts. However, program group students were not more likely than students in the control group to have completed the first half of the developmental sequence (Mod 3 for program group students, Math 0361 for control group students). Additionally, there is some evidence that students in ModMath were slightly less likely than control students to fully complete their developmental math requirements during the first semester — a potentially negative effect of the program. ModMath could have different effects on this outcome for students who had different initial placement levels. These potential differences will be explored in a later report.
Short-term comparisons of program and control students’ progress are complicated by the fact that students in the two groups were enrolled in very different kinds of math classes that offered credits in different ways. A subsequent report will analyze longer-term outcomes — such as students’ rates of enrollment and success in college-level math courses — to provide more direct points of comparison between the two groups of students.
Early Effects on Short-Term Progress in Math MDRC researchers prespecified “percentage of developmental math sequence complete” as a primary short-term outcome of interest for the study, to make it possible to compare the math
1Findings presented in this chapter are based on analysis of transcript records for the 869 students who entered the study in spring 2014, fall 2014, and spring 2015. These three cohorts represent about 62 percent of the total study sample.

34
progress of students in the two research groups. This outcome was calculated by determining each student’s progress through the developmental math sequence, then averaging those values together for program and control group students, respectively. For example, a program group student who completed Mod 1 but not Mod 2 would be considered to have completed one-sixth of the developmental sequence, or about 17 percent. A student who completed Mod 2 but not Mod 3 would be considered to have completed two-sixths of the sequence, or about 33 percent. For control group students, a student who completed Math 0361 would have completed half of the sequence, or 50 percent, while a student who completed Math 0362 would have fully completed the sequence. Figure 4.1 illustrates the approach. The calculation was performed only on the basis of the classes that students completed, not on the basis of their placement — that is, a student who placed out of Mod 1 and into Mod 2 but then did not finish the module would be considered to have completed none of the developmental sequence, not one-sixth.2
By this reckoning, after one semester in the study students offered ModMath were, on average, 10 percentage points closer to completing the developmental math sequence than their control group counterparts. After one semester, students offered ModMath had completed 25 percent of the developmental math sequence on average, representing a point midway between Mods 1 and 2.3 In contrast, students offered traditional courses were only 15 percent of the way through the math sequence on average, representing a point between completing no classes (0 percent progress) and completing Math 0361 (50 percent progress). Control group students’ average progress reflects the fact that most students did not complete any math classes. Table 4.1 shows the developmental math progress of program and control group students.
As described in Chapter 3, 84 percent of students for whom there were data available placed at the very beginning of the developmental math sequence (Mod 1 for ModMath students or Math 0361 for traditional developmental students), regardless of which placement test was used. Placement test results and initial placement levels were therefore not very different between the two groups of students. So how did program group students get ahead of the control group students?
2For alternative calculations, see Appendix Table A.9. 3For the exact percentage of the program group who completed each mod, see Appendix Table A.6.

35
Figure 4.1
Percentage of the Developmental Math Sequence Complete After Passing Each Math Class
First, program group students were more likely to enroll in a math class (or module) during their first semester in the study.4 Eighty-one percent of control group students enrolled in math (see Table 4.1) compared with 88 percent of program group students — an increase of 7 percentage points. In other words, assignment to ModMath caused an estimated 36 more of the 504 students in the program group to enroll in math. It is difficult to know whether this increase in enrollment can be attributed to the ModMath program itself rather than students’ interests before they enrolled in the study. Students were recruited for the study in part based on their interest in ModMath, and they may therefore have been less interested in enrolling in a lecture course. In addition, because ModMath promotes closer contact with students, math department staff members may have made extra efforts to ensure that ModMath students completed enrollment. In any case, the higher level of enrollment among the program group probably contributed to their greater progress in the developmental math sequence after one semester.
4ModMath add/drop deadlines differed from those of other, semester-long developmental math courses:
The ModMath add/drop deadline for the first five-week session occurred earlier in the semester. This narrowed window of time to add or drop courses may have affected enrollment rates.
Traditional Developmental Class Passed
Mod Passed
Math 0362 (100.0%)
Mod 6 (100.0%)
Mod 5 (83.3%)
Mod 4 (66.7%)
Math 0361 (50.0%)
Mod 3 (50.0%)
Mod 2 (33.3%)
Mod 1 (16.7%)

36
Table 4.1
Early Math Enrollment and Progress
Tarrant County College Spring 2014, Fall 2014, Spring 2015
First-Semester Outcome Program
Group Control Group Difference
Standard Error
. . . . Average percentage of the developmental . . . . math sequence completed 25.1 15.0 10.0 *** 1.6 . . . . Enrolled in math class shown or higher math (%) . . . .
__Any math class (course or mod) 87.9 80.8 7.1 *** 2.4 __Second half of the developmental sequence 6.5 5.8 0.7 1.7 __College-level math 0.4 0.0 0.4 0.3 . . . . Math credits attempted 2.5 2.4 0.1 0.1 __Regular credits 0.0 0.0 0.0 0.0 __Developmental credits 2.5 2.4 0.1 0.1 . . . . Passed math class shown or higher math (%) . . . .
__Any math class (course or mod) 71.2 28.3 42.9 *** 3.1 __First half of the developmental sequence 24.5 28.0 -3.5 3.0 __Second half of the developmental sequence 0.4 1.9 -1.6 ** 0.7 __College-level math 0.0 0.0 0.0 0.0 . . . . Math credits earned 1.4 0.8 0.5 *** 0.1 __Regular credits 0.0 0.0 0.0 0.0 __Developmental credits 1.4 0.8 0.5 *** 0.1 . . . . Sample size (total = 869) 504 365 . .
SOURCE: MDRC calculations using transcript data from Tarrant County College.
NOTES: Rounding may cause slight discrepancies in sums and differences. __Estimates are adjusted by cohort. __A two-tailed t-test was applied to differences between research groups. Statistical significance levels are indicated as: *** = 1 percent; ** = 5 percent; * = 10 percent.
Second, program group students were much more likely to complete at least one math class than their control group counterparts: 71 percent of program group students completed at least one class, compared with only 28 percent of control group students.5 This increase occurred at least partly because ModMath’s 5-week modules are shorter than traditional 16-
5Among students who enrolled in a math class, most program group students enrolled in a ModMath
module and most control group students enrolled in Math 0361 or Math 0362.

37
week lecture courses. ModMath students therefore have the opportunity to pass and complete smaller portions of the developmental math sequence, five weeks at a time. Students offered the traditional courses are in an all-or-nothing situation — they must pass and complete an entire 16 weeks’ worth of material at once in order to make any progress at all. This difference in class structure probably led to a substantial difference in the number of students who were able to make formal progress in the developmental sequence during the first semester and accumulate some credits.6
ModMath’s positive effect on getting students to complete at least one math class is encouraging. However, this success is tempered by the fact that only 25 percent of program group students made it through the halfway point of the developmental sequence by the end of the semester. Students in the traditional math sequence had a similar likelihood of success — 28 percent of control group students made it through the halfway point. The difference between the two groups is not statistically significant (that is, it could have occurred by chance), nor is it practically significant. Rather, it shows that there is so far no evidence that ModMath is having a discernable effect on helping students cross the halfway point, and that ModMath’s positive effect on completing a greater percentage of the developmental math sequence reflects the many students who managed to complete one or two mods, but who otherwise would not have completed a 16-week course.
Additionally, there is some evidence that ModMath may have slightly lowered the proportion of students who fully completed the developmental sequence during their first semester. Only 0.4 percent of program group students accomplished this goal, compared with 1.9 percent of students in the control group. This statistically significant 1.6 percentage point difference (representing around eight people in the program group) suggests that the traditional pathway may be a better option for students who initially place into the higher-level math course (Math 0362) under the Texas Success Initiative Assessment.7 This potentially negative aspect of ModMath will be further explored in the final report of this study, when data from the full sample of 1,403 students are available for a longer follow-up period.
Table 4.1 also presents math credits attempted and earned, an indicator of academic progress highly related to the math outcomes discussed above. Program group students earned on average 0.5 more developmental math credits than control group students, which again
6Note that this analysis does not account for program or control group students who may have made
unobservable progress within a particular math class, although they were unable to complete the class in a single semester. As an example, consider that control group students who failed to pass Math 0361 may nonetheless have learned some of the material, making them more likely to pass the course on a subsequent attempt. A later report for this research study will analyze data over a longer follow-up period, making it easier to capture such progress.
7The difference is in fact 1.6 percentage points, not 1.5 percentage points as the values in the previous sentence might imply. The apparent discrepancy is due to rounding.

38
suggests that program group students made greater average progress toward completing the developmental sequence.
Early Effects on Progress in Other Courses The ModMath program could have caused students to perform either better or worse in their nonmath classes. For example, the program could have given students skills that they could apply to their other classes, improving their likelihood of success there. Conversely, the program could have caused students to spend less time studying for their other classes, lowering their chances of success in those classes.
After one semester, students in the program group had attempted and earned a similar number of nonmath credits as students in the control group, although program group students did earn slightly more nonmath developmental credits than students in the control group (0.6 nonmath developmental credits compared with 0.4 credits among control group students). This difference could be because students applied skills they learned in ModMath to other courses, or it may be that the five-week structure of the mods helped students be successful in other developmental course work. ModMath’s effects on students’ progress in nonmath courses will be explored further in a future report.8
Possible Mechanisms As noted in Chapter 1, one theoretical benefit of ModMath’s self-paced learning is that students could complete the equivalent of more than one traditional course in a single semester — that is, they could complete four or more modules in a single semester. As discussed in Chapter 3, however, students almost never did so during the first semester of the study. A number of factors could have contributed to this reality, including students’ abilities, their desire to progress through the material more slowly than expected, and their adherence to a pacing calendar developed by instructors to keep them on track to complete each mod in the allotted five weeks.
Another hypothesized benefit of ModMath is that program students who failed a module could reenroll in that mod a second or third time in the same semester, working on the material until they were able to pass the module on a later attempt. Students did repeat mods in this way fairly often: 24 percent of the program group failed a module during the study’s first semester, then reenrolled and passed the same module later in the same semester. In a traditional semester-long course, students do not have the opportunity to retake material within a single semester (though they could retake the course in a subsequent semester).
8See Appendix Table A.8 for more.

39
Finally, the structure of ModMath appears to help students by allowing them to receive credit for incremental progress in a way they cannot in a traditional class. While more than 70 percent of both the program and control groups failed to pass the halfway point in the developmental sequence, many of these students in the program group were still able to complete Mod 1 or Mod 2 and earn one or two developmental credits.9 In contrast, many students in the control group made no progress and earned no developmental math credits. The effects of these “small wins” for the ModMath students will be further explored in the final report.
Summary The early impact findings are mixed. ModMath appears to help students make greater progress on average, but program group students were no more likely than control group students to pass the first half of the developmental sequence, and were slightly less likely to complete the full sequence. It remains to be seen what ModMath’s effects will be in subsequent semesters. A later report will incorporate data for an additional 534 students who were randomly assigned during the fall 2015 semester. The report will also follow all 1,403 students over a longer time period — up to two years for some students — to explore whether the greater average progress achieved by program group students in the first semester translates into positive long-term impacts on completing the developmental math sequence and on success in college-level math.
9Among students in the program group, 24 percent completed Mod 1 and an additional 23 percent
completed Mod 2. See Appendix Table A.6 for more.


41
Chapter 5
Conclusion
Background and Summary of Findings Although community colleges have invested a lot over the last decade into reforming developmental math programs, many students who are referred to developmental math still do not succeed. It is still true that one of the greatest obstacles community college students face in completing their degrees is the need to progress through developmental math and pass the college-level math course required for many majors. This study is investigating whether a homegrown program called ModMath that was developed by the math faculty at a college in Texas can help more students overcome this barrier. The results so far show that for the first three of the four cohorts in the study, ModMath’s short-term effects were mixed.
• On the positive side, program group students were 10 percentage points closer to completing the developmental math sequence than control group students: 25 percent of the way through the sequence compared with 15 percent. This difference is statistically significant.
• However, this advantage did not translate into other measures of progress. For example, the program group students were not more likely to pass the halfway mark in the developmental math sequence than the control group. More than 70 percent of students in the study, in either group, were unable to pass this benchmark in the first semester.
• ModMath had a very small but statistically significant and negative impact on the percentage of students who completed the entire developmental math sequence during their first semester: 0.4 percent of the program group compared with 1.9 percent of the control group.
Implications of These Early Findings For some interventions, a lack of impacts can be attributed to weak or poor implementation of the program or to a lack of contrast between the program and control conditions. This study rules out these factors as explanations for the mixed findings on ModMath’s early impacts. Interviews with and survey data from students, instructors, and administrators, as well as classroom observations, confirm that all of the components of ModMath were delivered as intended and that program group students had a very different experience from the control

42
group. Further, most students reported that they liked this computer-assisted, modular approach to learning math, and said that they felt a sense of accomplishment as they passed each mod.
At this stage, it is still too early to conclude whether ModMath will affect the percentage of students who make it through the developmental sequence, the speed at which they do so, or the rate at which they succeed in college-level math. While the study shows that ModMath had a positive effect on the average amount of the developmental math sequence a student completed in the first semester, this effect appears to reflect the many students who succeeded in passing one or two mods, an opportunity that was not available to their counterparts in traditional 16-week math courses. In other words, students in the program group were able to make more incremental progress, but it remains to be seen whether these “small wins” get them across the finish line more often or more quickly than the control group.
There are at least two additional reasons why the results from longer-term follow-up with the full sample will be important. First, most of the students in the study were placed at the beginning of the developmental math sequence. Whether they are aware of it or not, their odds of passing each course — let alone the entire sequence and a college-level math course — are not good. As is well documented in national studies of developmental students, many will withdraw or fail, and attempt the course again and again. This process can take many semesters to play out, and outcomes in the first semester may say little about what lies ahead.
Second, ModMath was explicitly designed by the college’s math faculty to encourage persistence and success by means of the mechanism referred to in the research literature and this report as “small wins.” Students often arrive in their developmental math courses discouraged by their low placement test scores, demoralized by their past struggles with math in high school or college, and full of anxiety about once again trying to learn math. In sharp contrast with their control group counterparts, ModMath students discover right away that they can experience success quickly and relatively easily in three ways: (1) when they demonstrate subject mastery in lesson checks and quizzes; (2) when they earn credit as frequently as every five weeks for passing mods; and (3) when they have the chance to return to math and pick up where they left off in the developmental sequence, without significant repetition, if they fail a mod or need to stop attending for any reason.
These small accomplishments and sense of forward momentum may strengthen students’ engagement in math, improve their attitudes toward math and their own abilities generally, and, through this heightened self-confidence, encourage them to persist and do better. In fact, program group students reported being more engaged and having more positive attitudes toward their math classes than did control group students. Again, it remains to be seen whether these higher levels of engagement among program group students translate to greater

43
persistence in math, higher rates of completion in developmental math, and higher rates of completion in college-level math.
Limitations of This Study’s Findings The findings presented in this report are limited in several important regards. First, there were no standard learning measures available across both program and control groups (for example, a common final exam). As a result, this study does not directly assess students’ math learning and content mastery, nor does it draw direct comparisons of learning or mastery between the program group and the control group. Instead, the study uses measures like passing courses or mods and accumulating credits as proxies for students’ learning.
Second, the findings presented in this study may not represent what would happen with all community college students. The program effects and impacts discussed here are expected to represent what would happen with other Tarrant County College students who are similar to the students in the study sample, but they may not necessarily represent what would happen if the program were attempted with other groups of students. In addition, it is important to note that students were recruited for this research study on the basis of their interest in ModMath. As a result, the findings presented here do not necessarily reveal whether ModMath would be well suited for students with a strong preference for traditionally structured lecture classes. Such students could experience ModMath differently, and might therefore have different outcomes.
Third, while the implementation findings shared in this report are considered final, the impact findings presented in Chapter 4 are preliminary. They cover only one semester of follow-up, and only three of the four cohorts (approximately 62 percent) of the full study sample. A future report will include data for the full study sample, and will follow the students for a longer period of time.
Next Steps The final report from this study will provide additional evidence about ModMath’s effect on student outcomes. It will incorporate the fourth — and largest — cohort of students and follow the full sample for several more semesters.


Appendix A
Additional Analyses


47
Study Attrition A total of 1,408 students were initially randomly assigned for this study: 828 students were randomly assigned to the program group and 580 students were randomly assigned to the con-trol group. Out of this sample, 1 student was removed from the study due to a missing in-formed-consent form. An additional 4 students asked to be withdrawn from the study. The overall rate of attrition was 0.4 percent and the rate of differential attrition (the difference be-tween program group attrition and control group attrition) was 0.3 percent. After attrition, a fi-nal study sample of 1,403 students remained, with 826 students in the program group and 577 students in the control group.
Program and Control Group Similarity at Enrollment Data on program and control group students were collected immediately before random as-signment using the baseline information form. These data included information on students’ demographic characteristics, family and educational backgrounds, and experiences with math. Students in the two research groups were similar in all measured characteristics. See Appendix Table A.1 for the results of this comparison. An omnibus F-test for joint significance was also run; the results indicated that the two groups were not significantly different in their measured characteristics.
The Texas Success Initiative (TSI) placement test scores of the program and control groups at the beginning of their first semester in the study were also compared.1 The analysis confirms that the two groups of students were similar in most regards. Approximately 80 per-cent of students in both groups were at college level in reading and writing, with most of the remaining students placing two levels down in each subject area. In math, around 4 percent of the program group and 5 percent of the control group placed one level down from college read-iness, while 13 percent of the program group and 16 percent of the control group placed two levels down. In the traditional math sequence, students placing one level down would be ex-pected to enroll in Math 0362, while students placing two levels down would be expected to enroll in Math 0361. Around 44 percent of both groups placed three levels down from college readiness in math, indicating that in the absence of the ModMath program, they would be ex-pected to enroll in the adult basic education math boot camp.2 See Appendix Table A.2 for these results.
1Depending on the date that students were randomly assigned, these tests were not necessarily adminis-
tered before random assignment. 2Despite their apparent placement into the adult basic education boot camp, more than three-quarters of
these students enrolled in either Mod 1 or Math 0361.

48
Program and Control Group Student Survey Responses Appendix Tables A.3 and A.4 summarize the responses to the student survey conducted during students’ first semester in the program.3
Students’ Placement Under MyMathTest Compared with Other Tests The research team compared students’ placements using MyMathTest with their placements using other tests — such as ACCUPLACER, COMPASS, and the TSI Assessment — to de-termine whether MyMathTest tended to place students higher or lower than other placement tests. Data were compared for a total of 304 students for whom both MyMathTest and TSI placement information were available. This group included program group students from three study cohorts and control group students from the first study cohort.4 It should be noted that TSI math placement data were unavailable for approximately 30 percent of the study sample, as shown in Appendix Table A.2. It is also important to note that even among students for whom these data were available, the data were from several semesters before the beginning of the study. As a result of these data-quality issues, the conclusions discussed in this section are somewhat tentative.
The analysis suggests that MyMathTest placed most students at the same level as other tests would have placed them. Results from the analysis are shown in Appendix Table A.5.5 Out of 304 students, 256 (84 percent) were placed at Module 1 by MyMathTest, and either two or three levels down from college readiness by other tests. MyMathTest may have made no differ-ence in these students’ placement — other tests may have assigned them either to Math 0361 or the adult basic education boot camp (although as noted in a footnote above, most students in the study whose test scores placed them in the boot camp actually enrolled in either Mod 1 or Math 0361). Another 35 students (12 percent) were placed in either Module 2 or 3 by MyMathTest, and either two or three levels down from college readiness by other tests. MyMathTest appears to have placed these students slightly higher than other tests may have placed them; other tests would have assigned them to Math 0361. The last 13 students (4 percent) were placed in Mod-ule 1, 2, or 3 by MyMathTest and only one level down from college readiness by other tests.
3The survey contained a limited number of questions that were either not intended for analysis (for exam-
ple, that were intended to help identify which research group a student was in), or the wording of which con-fused students, yielding unreliable responses. These questions are excluded from the tables.
4MyMathTest was initially administered to both program and control group students; beginning with the second study cohort, however, it was administered only to program group students.
5Data were also available for an additional 27 students who were designated as “college-ready” in TSI da-ta. Of these 27 students, 21 were placed at Module 1 by MyMathTest. These students may have decided to en-roll in developmental math to build their math skills even though they were not required take any developmen-tal math classes.

49
MyMathTest may have placed these students lower than other tests would have; other tests would have placed them into Math 0362.
Program Group Enrollment in and Completion of Modules Appendix Table A.6 shows the percentage of the program group who enrolled in and completed each module during the first study semester.
Sample Sizes and Standard Deviations for Table 4.1 Outcomes Appendix Table A.7 shows additional information for outcomes presented in Table 4.1, includ-ing sample sizes and standard deviations for each outcome. Tables in this report that include sample sizes and standard deviations for each outcome are intended for researchers — such as those from the What Works Clearinghouse — who wish to compare the impacts presented here with other results in the research literature.6
Effects on Nonmath Credits Attempted and Earned In addition to earning more developmental math credits than control group students, program group students also attempted and earned slightly more nonmath developmental credits, on av-erage, than control group students (although the two groups earned similar numbers of nonmath credits if both developmental and college-level credits are included). The reasons for these im-pacts are unclear. It may be that the modular structure of ModMath helped students to enroll and succeed in developmental courses in which they would not have otherwise enrolled. Ap-pendix Table A.8 shows these results.
Analyses Using Different Assumptions for Students Who Passed No Math Classes Table 4.1 presents the average percentage of the developmental sequence completed by students in the program and control groups. In this calculation, students who did not complete any clas-ses are assumed to have completed 0 percent of the sequence. This assumption may not fully reflect the progression of students who placed at a higher level of math but then failed to pass any courses. Rather than counting these students as having completed 0 percent of the sequence, it may be more appropriate to count them as having completed proportions of the sequence cor-responding to their placement levels. Using this approach, a student who placed into Math 0362
6The What Works Clearinghouse is an initiative of the U.S. Department of Education’s Institute of Educa-tion Sciences. It reviews educational research like this study. More information is available on the What Works Clearinghouse website: http://ies.ed.gov/ncee/wwc.

50
but did not complete the course would be counted as having completed 50 percent of the math sequence rather than 0 percent.
The research team conducted two variations of this analysis of “no-progress” students. For the first variation, no-progress students were assumed to have completed the proportion of the sequence corresponding to their scores on the test that was actually used to place them (MyMathTest for program group students and TSI placement records for control group stu-dents). For the second variation, no-progress students in the program and control groups were both assumed to have completed the proportion of the sequence corresponding to the scores in their TSI placement records. Approximately 6 percent to 7 percent of both the program and con-trol group students were found to be ready for college math using their TSI placement records or were exempt from developmental math requirements. These students were counted as having completed 100 percent of the developmental math sequence in both variations of the analysis. As is discussed elsewhere in this report, many students were either missing math placement data or were placed at the beginning of the developmental math sequence by both MyMathTest and their TSI placement records. For these students, any variation will yield the same result.
Under the alternative assumptions, ModMath has a smaller impact on developmental math progress, but the impact remains between 7.5 percentage points and 8.2 percentage points. Appendix Table A.9 shows these results. The diminished impact is likely due to the fact that substantially more control students than program students did not pass any math classes. As a result, the alternative assumptions cause the control group’s math progress to rise more than the program group’s. Regardless of the assumption used, however, it is clear that the program in-creased students’ math progress for the reasons described in the body of this report.

Appendix Table A.1
Student Characteristics at Study Enrollment
Tarrant County College Spring 2014, Fall 2014, Spring 2015, Fall 2015
Program Group Control Group
Characteristic Sample
Size Mean Standard
Deviation Sample
Size Mean Standard
Deviation Difference P-Value . . . . . . . . . Male (%) 816 36.3 48.1 . 570 34.8 47.7 1.5 0.5583 . . . . . . . . . Age (%) . . . . . . . . .
__19 or under 819 22.0 41.6 . 570 21.9 41.2 0.1 0.9570 __19-24 819 38.1 48.6 . 570 39.0 48.8 -0.9 0.7417 __25-34 819 22.2 41.5 . 570 21.0 40.9 1.2 0.5945 __35-44 819 9.9 29.9 . 570 11.0 31.4 -1.0 0.5336 __45-59 819 7.1 25.7 . 570 6.6 25.0 0.5 0.7189 __Over 60 819 0.6 7.8 . 570 0.5 7.2 0.1 0.8129 . . . . . . . . . Race/ethnicitya (%) . . . . . . . . . __Hispanic 792 28.7 45.3 . 553 27.5 44.7 1.2 0.6292 __White 792 46.1 49.9 . 553 45.2 49.8 0.8 0.7596 __Black 792 19.3 39.4 . 553 20.0 40.1 -0.7 0.7418 __Asian 792 2.5 15.7 . 553 3.7 18.7 -1.2 0.2159 __Pacific Islander 792 1.0 10.0 . 553 0.7 8.5 0.3 0.6133 __American Indian 792 0.4 6.1 . 553 0.2 4.3 0.2 0.4687 __Other 792 2.0 14.1 . 553 2.7 16.3 -0.6 0.4386 . . . . . . . . . Marital status (%) . . . . . . . . .
__Married and living with one's spouse 819 15.0 35.7 . 570 16.0 36.7 -1.0 0.6161 __Married and living apart from one's spouse 819 2.4 15.1 . 570 2.2 14.9 0.2 0.7727 __Unmarried and living with a partner 819 13.3 34.0 . 570 14.3 35.1 -1.0 0.5898 __Unmarried and not living with a partner 819 59.6 49.1 . 570 58.4 49.4 1.2 0.6440 __Missing 819 9.6 29.5 . 570 9.1 28.8 0.5 0.7399 . . . . . . . . . Has children under 18 (%) 808 28.2 45.0 . 565 30.5 46.1 -2.3 0.3618
(continued)
51

Appendix Table A.1 (continued)
Program Group Control Group
Characteristic Sample
Size Mean Standard
Deviation Sample
Size Mean Standard
Deviation Difference P-Value . . . . . . . . . Household eligible for Pell benefits (%) 819 35.0 47.7 . 570 38.8 48.8 -3.7 0.1557 __Missing 819 49.5 50.0 . 570 48.5 50.0 1.1 0.6889 . . . . . . . . . Parents pay majority of expenses (%) 819 27.9 45.0 . 570 28.3 45.0 -0.4 0.8791 __Missing 819 9.6 29.4 . 570 8.7 28.3 0.8 0.5903 . . . . . . . . . Planning to work this semester (%) . . . . . . . . .
__No 819 19.1 39.4 . 570 18.7 38.9 0.3 0.8702 __Yes, part time (less than 30 hours a week) 819 29.8 45.8 . 570 32.6 46.9 -2.8 0.2652 __Yes, full time (30 hours a week or more) 819 44.5 49.7 . 570 42.2 49.4 2.3 0.3902 __Missing 819 6.6 24.8 . 570 6.5 24.7 0.1 0.9156 . . . . . . . . . Planned enrollment this semester (%) . . . . . . . . .
__Less than part time (fewer than 6 credits) 804 17.3 37.8 . 558 18.5 38.8 -1.2 0.5624 __Part time (6 to 12 credits) 804 38.8 48.8 . 558 39.3 48.9 -0.5 0.8497 __Full time (12 credits or more) 804 44.0 49.7 . 558 42.2 49.4 1.7 0.5267 . . . . . . . . . Has failed a math class in the past (%) 819 53.0 50.0 . 570 54.2 49.8 -1.2 0.6699 __Missing 819 6.4 24.4 . 570 7.2 25.9 -0.8 0.5633 . . . . . . . . . First person in family to attend college (%) 802 33.0 47.0 . 559 34.8 47.7 -1.8 0.4917 . . . . . . . . . Usually speaks a language other than English at home (%) 812 19.4 39.6 . 570 21.4 40.9 -2.0 0.3675 . . . . . . . . . Highest grade completed (%) . . . . . . . . .
__8th grade or lower 807 1.9 13.5 . 560 0.9 9.4 1.0 0.1362 __9th grade 807 2.0 13.9 . 560 1.0 10.3 1.0 0.1518 __10th grade 807 4.0 19.5 . 560 4.6 21.1 -0.6 0.5918 __11th grade 807 5.5 22.7 . 560 5.1 22.2 0.3 0.7939 __12th grade 807 86.6 33.9 . 560 88.4 32.3 -1.7 0.3498
(continued)
52
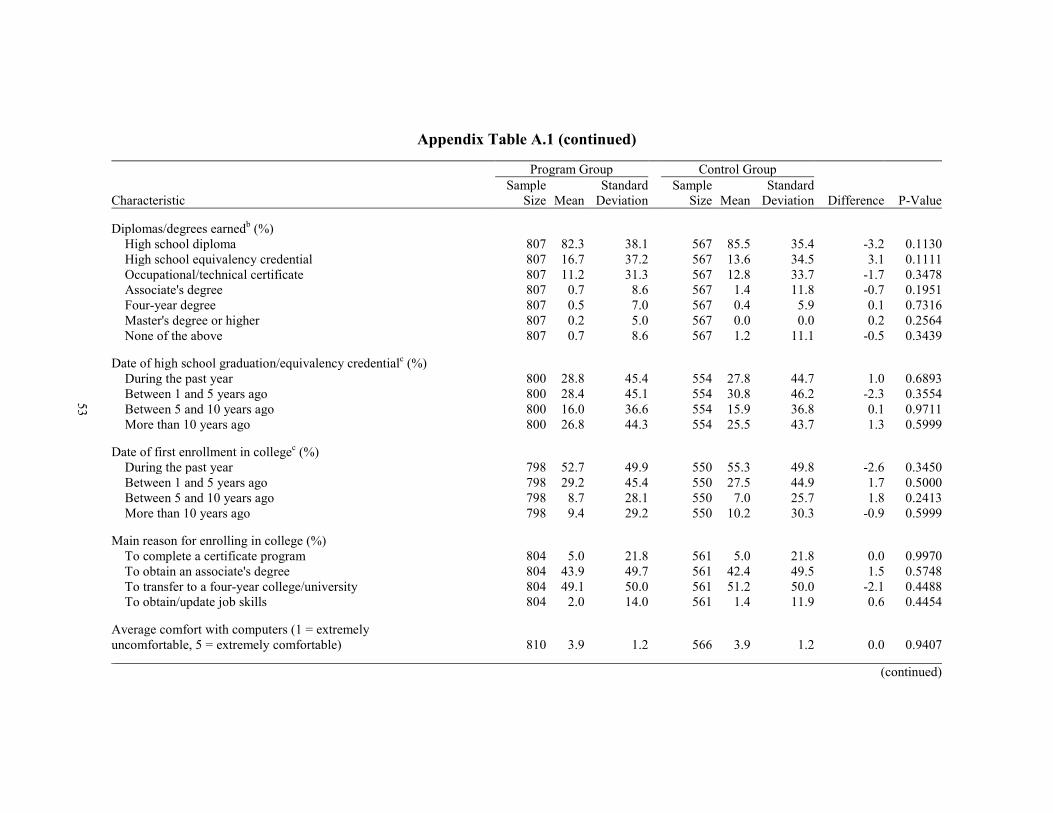
Appendix Table A.1 (continued)
Program Group Control Group
Characteristic Sample
Size Mean Standard
Deviation Sample
Size Mean Standard
Deviation Difference P-Value . . . . . . . . . Diplomas/degrees earnedb (%) . . . . . . . . .
__High school diploma 807 82.3 38.1 . 567 85.5 35.4 -3.2 0.1130 __High school equivalency credential 807 16.7 37.2 . 567 13.6 34.5 3.1 0.1111 __Occupational/technical certificate 807 11.2 31.3 . 567 12.8 33.7 -1.7 0.3478 __Associate's degree 807 0.7 8.6 . 567 1.4 11.8 -0.7 0.1951 __Four-year degree 807 0.5 7.0 . 567 0.4 5.9 0.1 0.7316 __Master's degree or higher 807 0.2 5.0 . 567 0.0 0.0 0.2 0.2564 __None of the above 807 0.7 8.6 . 567 1.2 11.1 -0.5 0.3439 . . . . . . . . . Date of high school graduation/equivalency credentialc (%) . . . . . . . . .
__During the past year 800 28.8 45.4 . 554 27.8 44.7 1.0 0.6893 __Between 1 and 5 years ago 800 28.4 45.1 . 554 30.8 46.2 -2.3 0.3554 __Between 5 and 10 years ago 800 16.0 36.6 . 554 15.9 36.8 0.1 0.9711 __More than 10 years ago 800 26.8 44.3 . 554 25.5 43.7 1.3 0.5999 . . . . . . . . . Date of first enrollment in collegec (%) . . . . . . . . .
__During the past year 798 52.7 49.9 . 550 55.3 49.8 -2.6 0.3450 __Between 1 and 5 years ago 798 29.2 45.4 . 550 27.5 44.9 1.7 0.5000 __Between 5 and 10 years ago 798 8.7 28.1 . 550 7.0 25.7 1.8 0.2413 __More than 10 years ago 798 9.4 29.2 . 550 10.2 30.3 -0.9 0.5999 . . . . . . . . . Main reason for enrolling in college (%) . . . . . . . . .
__To complete a certificate program 804 5.0 21.8 . 561 5.0 21.8 0.0 0.9970 __To obtain an associate's degree 804 43.9 49.7 . 561 42.4 49.5 1.5 0.5748 __To transfer to a four-year college/university 804 49.1 50.0 . 561 51.2 50.0 -2.1 0.4488 __To obtain/update job skills 804 2.0 14.0 . 561 1.4 11.9 0.6 0.4454 . . . . . . . . . Average comfort with computers (1 = extremely . . . . . . . . .
uncomfortable, 5 = extremely comfortable) 810 3.9 1.2 . 566 3.9 1.2 0.0 0.9407
(continued)
53

Appendix Table A.1 (continued)
Program Group Control Group
Characteristic Sample
Size Mean Standard
Deviation Sample
Size Mean Standard
Deviation Difference P-Value . . . . . . . . . Average frequency reported (1 = hardly ever, . . . . . . . . . 5 = nearly always) . . . . . . . . .
__I concentrate hard in mathematics. 803 3.9 1.0 . 564 3.9 1.0 0.0 0.6226 __I work until I have corrected my mistakes. 816 4.2 1.0 . 570 4.2 1.0 0.0 0.9582 __I try different ideas when solving math. 813 3.8 1.1 . 570 3.9 1.0 -0.1 0.0827 . . . . . . . . . Average agreement with statements (1 = strongly disagree, . . . . . . . . .
5 = strongly agree) . . . . . . . . .
__I am interested in learning new things in math. 817 4.1 0.9 . 569 4.1 0.9 0.0 0.8178 __In math, you get rewards for your efforts. 808 3.6 1.0 . 561 3.6 1.0 0.0 0.4259 __Learning math is enjoyable. 807 3.1 1.2 . 564 3.2 1.2 -0.1 0.2030 __Solving a math problem is satisfying. 814 4.3 0.9 . 569 4.3 0.9 0.0 0.4965 . . . . . . . . . Sample size (total = 1,389) 819 . . . 570 . . . .
SOURCE: MDRC calculations using data from the baseline survey of Tarrant County College (TCC) students.
NOTES: Rounding may cause slight discrepancies in sums and differences. __Estimates are adjusted by cohort. __Missing values are only shown for items with more than 5 percent missing. __aRespondents who said they were Hispanic and chose a race are included only in the "Hispanic" category. Respondents who said they were not Hispanic and chose more than one race are included in the "other" category. __bDistributions may not sum to 100 percent because categories are not mutually exclusive. __cValues of exactly 5 years are included in the category "between 1 and 5 years ago." Similarly, values of exactly 10 years are included in the category "between 5 and 10 years ago."
54

55
Table A.2
TSI Placement Levels of the Program and Control Groups
Tarrant County College Spring 2014, Fall 2014, Spring 2015
Placement (%) Program
Group Control Group Difference
Standard Error
. . . . TSI math placement . . . . __Ready for college or exempta 5.9 6.6 -0.7 1.7 __Placed 1 level below college readiness 4.1 4.7 -0.6 1.4 __Placed 2 levels below college readiness 13.2 16.3 -3.1 2.4 __Placed 3 levels below college readiness 44.1 44.9 -0.8 3.4 __TSI math requirements not met, status unknown 29.8 24.7 5.1 * 3.1 . . . . TSI reading placement . . . .
__Ready for college or exempta 80.3 77.3 3.0 2.8 __Placed 1 level below college readiness 3.2 1.9 1.3 1.1 __Placed 2 levels below college readiness 11.4 15.4 -4.0 * 2.3 __Placed 3 levels below college readiness 0.6 0.3 0.3 0.5 __TSI reading requirements not met, status unknown 1.6 2.2 -0.6 0.9 . . . . TSI writing placement . . . .
__Ready for college or exempta 77.6 76.9 0.7 2.9 __Placed 1 level below college readiness 1.0 2.1 -1.1 0.8 __Placed 2 levels below college readiness 17.3 16.2 1.1 2.6 __Placed 3 levels below college readiness 0.2 0.9 -0.7 0.5 __TSI writing requirements not met, status unknown 1.0 1.1 -0.1 0.7 . . . . No placement data available 2.9 2.8 0.1 1.1 . . . . Sample size (total = 869) 504 365 . .
SOURCE: MDRC calculations using placement test data from TCC.
NOTES: Rounding may cause slight discrepancies in sums and differences. __Estimates are adjusted by cohort. __A two-tailed t-test was applied to differences between research groups. Statistical significance levels are indi-cated as: *** = 1 percent; ** = 5 percent; * = 10 percent. __aIncludes students who were found to be ready for college, who received waivers from testing requirements, who were exempt from testing requirements, or who had previously completed testing requirements.

56
Appendix Table A.3
Student Survey Results
Tarrant County College Spring 2014, Fall 2014, Spring 2015, Fall 2015
Response Sample
Size Program
Group Control Group Difference
Standard Error
. . . . . Withdrew from or failed a math class previously (%) 1,000 38.1 40.6 -2.5 3.1 . . . . . Spent time on a computer in math class (%) 1,000 94.7 58.4 36.4 *** 2.3 . . . . . Among those who used a computer (%) . . . . . __Always had access to a computer in class 806 98.1 71.6 . . __Software useda . . . . .
____MyMathLab 806 99.8 99.1 . . ____Other software 806 0.8 1.4 . . . . . . . Had access to the book for this class (%) 998 79.1 84.5 -5.4 ** 2.5 . . . . . Among those who had access to the book . . . . .
__Average days a week used in class 808 1.1 1.4 . . __Average hours a week used outside class 808 2.3 3.1 . . . . . . . In your most recent math class, the instructor . . . . .
spent a considerable amount or most of . . . . .
the class perioda (%) . . . . .
__Lecturing 993 23.4 79.4 -56.1 *** 2.7 __Working with small groups of students 992 22.7 24.9 -2.2 2.8 __Working with students individually 992 67.6 31.6 36.0 *** 3.1 __Giving announcements not related to math 989 12.4 14.3 -1.9 2.2 . . . . . In your most recent math class, the students . . . . . spent a considerable amount or most of . . . . .
the class perioda (%) . . . . .
__Working alone on math exercises 992 80.5 53.7 26.8 *** 2.9 __Working in small groups on math exercises 991 7.3 12.9 -5.6 *** 1.9 __Working as a class on math exercises 990 15.1 60.5 -45.4 *** 2.7 __Chatting, texting, or on personal business 991 4.1 6.2 -2.1 1.4 __Using computers, calculators, or other technology 993 80.4 57.8 22.6 *** 2.9 __Having problems with technology 993 2.5 5.9 -3.4 *** 1.2 . . . . . Average hours per week spent outside class . . . . .
__On math 994 7.0 6.6 0.4 0.4 __Using math software 993 7.1 6.6 0.5 0.4 . . . . . Average frequency reported (1 = hardly ever, . . . . .
5 = nearly always) . . . . .
__You concentrate hard in mathematics. 991 4.3 4.2 0.1 0.1 __You work until mistakes are corrected. 991 4.5 4.4 0.1 ** 0.1 __If you can't do a problem, you keep trying. 991 4.2 4.1 0.0 0.1
(continued)
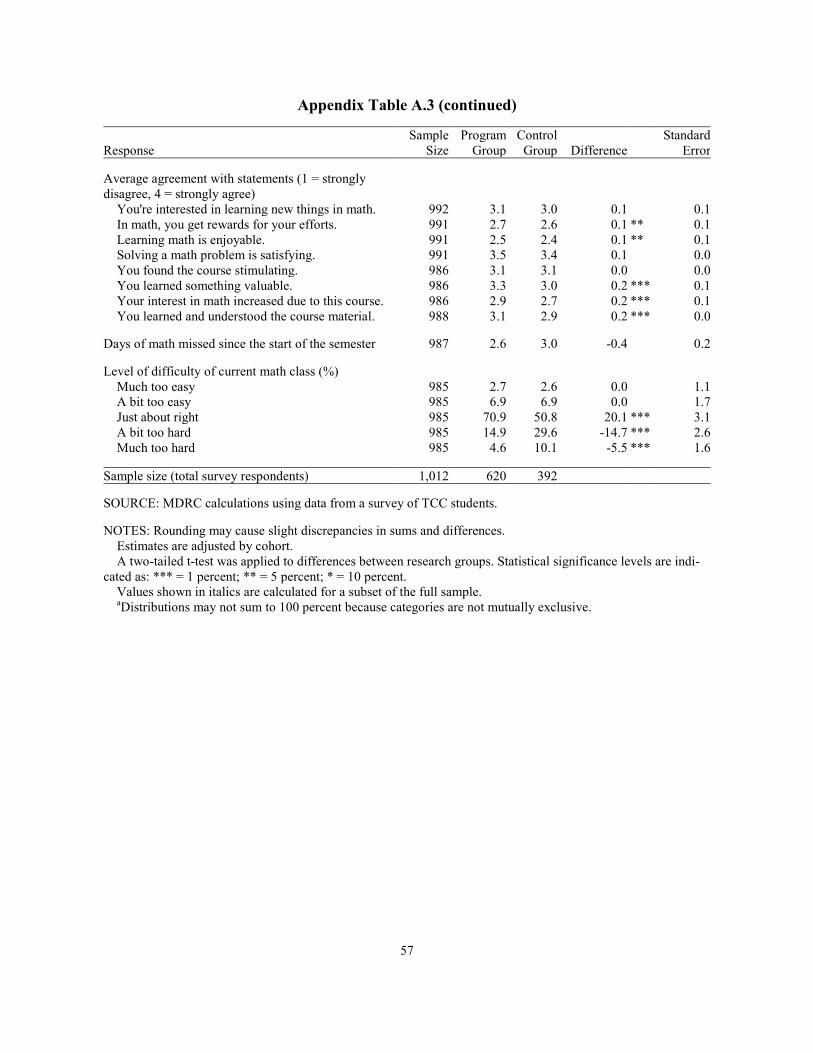
57
Appendix Table A.3 (continued)
Response Sample
Size Program
Group Control Group Difference
Standard Error
. . . . . Average agreement with statements (1 = strongly . . . . .
disagree, 4 = strongly agree) . . . . .
__You're interested in learning new things in math. 992 3.1 3.0 0.1 0.1 __In math, you get rewards for your efforts. 991 2.7 2.6 0.1 ** 0.1 __Learning math is enjoyable. 991 2.5 2.4 0.1 ** 0.1 __Solving a math problem is satisfying. 991 3.5 3.4 0.1 0.0 __You found the course stimulating. 986 3.1 3.1 0.0 0.0 __You learned something valuable. 986 3.3 3.0 0.2 *** 0.1 __Your interest in math increased due to this course. 986 2.9 2.7 0.2 *** 0.1 __You learned and understood the course material. 988 3.1 2.9 0.2 *** 0.0 . . . . . Days of math missed since the start of the semester 987 2.6 3.0 -0.4 0.2 . . . . . Level of difficulty of current math class (%) . . . . .
__Much too easy 985 2.7 2.6 0.0 1.1 __A bit too easy 985 6.9 6.9 0.0 1.7 __Just about right 985 70.9 50.8 20.1 *** 3.1 __A bit too hard 985 14.9 29.6 -14.7 *** 2.6 __Much too hard 985 4.6 10.1 -5.5 *** 1.6 . . . . . Sample size (total survey respondents) 1,012 620 392 . .
SOURCE: MDRC calculations using data from a survey of TCC students.
NOTES: Rounding may cause slight discrepancies in sums and differences. __Estimates are adjusted by cohort. __A two-tailed t-test was applied to differences between research groups. Statistical significance levels are indi-cated as: *** = 1 percent; ** = 5 percent; * = 10 percent. __Values shown in italics are calculated for a subset of the full sample. __aDistributions may not sum to 100 percent because categories are not mutually exclusive.

58
Appendix Table A.4
Student Survey Results Among Program Group Students
Tarrant County College
Spring 2014, Fall 2014, Spring 2015, Fall 2015
Response Sample
Size Program
Group . . Enrolled in ModMath 614 92.5 . . Among those enrolled in ModMath (%) . .
__Believe ModMath is the most effective type of class to help you learn math 562 79.7 . . Among those who think ModMath is the most effective, reason whya (%) . .
__Prefer working on computers 448 39.1 __Prefer working at my own pace 448 78.6 __Like getting on-demand help from the computer 448 56.5 __Like that the teacher can help 448 66.7 __Able to fail one mod and not restart course 448 61.6 __Other 448 1.1 . . Among those who think another type of course is the most effective, reason whya (%) . .
__Felt comfortable in the class 113 23.0 __The pacing of the class was good 113 24.8 __The class activities/homework fit my style 113 44.2 __Prefer having a teacher lecture the class 113 28.3 __Other 113 15.9 . . Among those enrolled in ModMath (%) . . __Given opportunity to take the final before end of the session 558 87.5 . . Among those given opportunity to take the final early (%) . .
__Took the final before the end of the session 487 65.3 . . Among those who took the final early (%) . .
__Passed the final 317 75.4 . . Among those who took the final early and passed (%) . . __Went on to the next module immediately 239 73.6 . . Among those who did not take the final early, most important reason why (%) . .
__I didn't think I was ready 239 69.5 __My teacher didn't think I was ready 239 2.5 __I didn't know it was an option 239 13.8 __I missed class the day of the final 239 2.1 __Other 239 12.1 . . Sample size (program group survey respondents) 620 .
SOURCE: MDRC calculations using data from a survey of TCC students.
NOTES: Rounding may cause slight discrepancies in sums and differences. __Values shown in italics are calculated for a subset of the full sample. __aDistributions may not sum to 100 percent because categories are not mutually exclusive.

59
Appendix Table A.5
Tarrant County CollegeSpring 2014, Fall 2014, Spring 2015
Other Test Placement,Levels Down From College Readiness
MyMathTest 3 Levels Down 2 Levels Down 1 Level Down TotalPlacement (ABE) (Math 0361) (Math 0362) Students
Mod 1 209 47 8 264Mod 2 25 8 2 35Mod 3 1 1 3 5Mod 4 or higher 0 0 0 0
Total students 235 56 13 304
Students Placed Using MyMathTest and Other Placement Tests
SOURCE: MDRC calculations using placement test data from TCC.
NOTE: Placement shown only for students with data. Students who were determined to be ready for college using non-MyMathTest placement tests such as the TSI are excluded from this table. MyMathTest did not identify any students as being ready for college. ABE = adult basic education.

60
Appendix Table A.6
Early Student Progress in ModMath
Tarrant County College Spring 2014, Fall 2014, Spring 2015
First-Semester Outcome Program
Group . Highest mod enrolled in (%) . __None 16.5 __Mod 1 14.3 __Mod 2 33.5 __Mod 3 30.2 __Mod 4 4.2 __Mod 5 1.4 __Mod 6 0.0 . Number of mods enrolled in 1.8 . Highest mod passed (%) .
__None 30.2 __Mod 1 23.6 __Mod 2 23.0 __Mod 3 18.3 __Mod 4 4.0 __Mod 5 1.0 __Mod 6 0.0 . Number of mods passed 1.4 . Sample size 504
SOURCE: MDRC calculations using transcript data from TCC.
NOTE: Rounding may cause slight discrepancies in sums and differences.

Appendix Table A.7
Early Math Enrollment and Progress
Tarrant County College Spring 2014, Fall 2014, Spring 2015
Program Group Control Group
First-Semester Outcome Sample
Size Mean Standard
Deviation Sample
Size Mean Standard
Deviation Difference P-Value . . . . . . . . . Average percentage of the developmental math sequence completed 504 25.1 21.4 . 365 15.0 25.0 10.0 0.0000 . . . . . . . . . Enrolled in math class shown or higher math (%) . . . . . . . . .
__Any math class (course or mod) 504 87.9 32.9 . 365 80.8 39.2 7.1 0.0040 __Second half of the developmental sequence 504 6.5 24.8 . 365 5.8 23.3 0.7 0.6704 __College-level math 504 0.4 6.3 . 365 0.0 0.0 0.4 0.2491 . . . . . . . . . Math credits attempted 504 2.5 1.0 . 365 2.4 1.2 0.1 0.1775 __Regular credits 504 0.0 0.2 . 365 0.0 0.0 0.0 0.2491 __Developmental credits 504 2.5 1.1 . 365 2.4 1.2 0.1 0.2338 . . . . . . . . . Passed math class shown or higher math (%) . . . . . . . . .
__Any math class (course or mod) 504 71.2 45.4 . 365 28.3 45.2 42.9 0.0000 __First half of the developmental sequence 504 24.5 43.0 . 365 28.0 45.1 -3.5 0.2459 __Second half of the developmental sequence 504 0.4 6.3 . 365 1.9 13.7 -1.6 0.0246 __College-level math 504 0.0 0.0 . 365 0.0 0.0 0.0 . . . . . . . . . . Math credits earned 504 1.4 1.1 . 365 0.8 1.4 0.5 0.0000 __Regular credits 504 0.0 0.0 . 365 0.0 0.0 0.0 . __Developmental credits 504 1.4 1.1 . 365 0.8 1.4 0.5 0.0000 . . . . . . . . . Sample size (total = 869) 504 . . . 365 . . . .
SOURCE: MDRC calculations using transcript data from TCC.
NOTES: Rounding may cause slight discrepancies in sums and differences. __Estimates are adjusted by cohort.
61

Appendix Table A.8
Early Credits Attempted and Earned
Tarrant County College Spring 2014, Fall 2014, Spring 2015
Program Group Control Group
First-Semester Outcome Sample
Size Mean Standard
Deviation Sample
Size Mean Standard
Deviation Difference P-Value . . . . . . . . . Registered (%) 504 94.0 24.0 . 365 90.0 29.9 4.0 0.0295 . . . . . . . . . Total credits attempted 504 8.7 4.1 . 365 8.4 4.3 0.3 0.3455 __Regular credits 504 5.5 3.8 . 365 5.5 3.8 0.0 0.9065 __Developmental credits 504 3.2 1.8 . 365 2.9 1.7 0.3 0.0142 . . . . . . . . . Total credits earned 504 5.9 4.3 . 365 5.2 4.4 0.7 0.0162 __Regular credits 504 3.9 3.7 . 365 4.0 3.7 0.0 0.8852 __Developmental credits 504 2.0 1.7 . 365 1.2 1.7 0.8 0.0000 . . . . . . . . . Math credits attempted 504 2.5 1.0 . 365 2.4 1.2 0.1 0.1775 __Regular credits 504 0.0 0.2 . 365 0.0 0.0 0.0 0.2491 __Developmental credits 504 2.5 1.1 . 365 2.4 1.2 0.1 0.2338 . . . . . . . . . Math credits earned 504 1.4 1.1 . 365 0.8 1.4 0.5 0.0000 __Regular credits 504 0.0 0.0 . 365 0.0 0.0 0.0 . __Developmental credits 504 1.4 1.1 . 365 0.8 1.4 0.5 0.0000 . . . . . . . . . Nonmath credits attempted 504 6.2 3.8 . 365 6.0 3.8 0.2 0.5174 __Regular credits 504 5.5 3.8 . 365 5.5 3.8 0.0 0.8720 __Developmental credits 504 0.7 1.5 . 365 0.5 1.1 0.2 0.0224 . . . . . . . . . Nonmath credits earned 504 4.5 3.8 . 365 4.4 3.8 0.2 0.5221 __Regular credits 504 3.9 3.7 . 365 4.0 3.7 0.0 0.8852 __Developmental credits 504 0.6 1.3 . 365 0.4 1.0 0.2 0.0107 . . . . . . . . . Sample size (total = 869) 504 . . . 365 . . . .
SOURCE: MDRC calculations using transcript data from TCC.
NOTES: Rounding may cause slight discrepancies in sums and differences. __Estimates are adjusted by cohort.
62

Appendix Table A.9
Early Student Math Progress Under Alternate Assumptions for Students Who Did Not Pass Any Math Classes
Tarrant County College
Spring 2014, Fall 2014, Spring 2015
Program Group Control Group
Assumption Regarding Percentage of the Developmental Sequence Completed
Sample Size Mean
Standard Deviation
Sample Size Mean
Standard Deviation Difference P-Value
. . . . . . . . . Use 0 percent 504 29.0 27.2 . 365 20.3 31.9 8.8 0.0000 . . . . . . . . . Use MyMathTest placement for program group students, use . . . . . . . . .
TSI placement for control group students 504 29.1 27.1 . 365 21.6 32.0 7.5 0.0002 . . . . . . . . . Use TSI placement for all students 504 29.8 27.1 . 365 21.6 32.0 8.2 0.0001 . . . . . . . . . Sample size (total = 869) 504 . . . 365 . . . .
SOURCE: MDRC calculations using placement test data from TCC.
NOTES: Rounding may cause slight discrepancies in sums and differences. __Estimates are adjusted by cohort. __Students designated as "college-ready" using the TSI are counted as having completed 100 percent of the developmental sequence.
63


65
References
Ashby, Jean, William A. Sadera, and Scot W. McNary. 2011. “Comparing Student Success Between Developmental Math Courses Offered Online, Blended and Face-to-Face.” Journal of Interactive Online Learning 10, 3: 128-140.
Bailey, Thomas, Dong Wook Jeong, and Sung-Woo Cho. 2010. “Referral, Enrollment, and Completion in Developmental Education Sequences in Community Colleges.” Economics of Education Review 29, 2: 255-270.
Bracco, Kathy Reeves, Kim Austin, Daniel Bugler, and Neal Finkelstein. 2015. Reforming Developmental Education to Better Support Students’ Postsecondary Success in the Common Core Era. San Francisco: WestEd.
Center for Community College Student Engagement. 2012. A Matter of Degrees: Promising Practices for Community College Student Success (A First Look). Austin, TX: The University of Texas at Austin, Community College Leadership Program.
Cullinane, Jenna, and Philip Uri Treisman. 2010. Improving Developmental Mathematics Education in Community Colleges: A Prospectus and Early Progress Report on the Statway Initiative. New York: National Center for Postsecondary Research.
Edgecombe, Nikki. 2011. Accelerating the Academic Achievement of Students Referred to Developmental Education. New York: Community College Research Center, Teachers College, Columbia University.
Edgecombe, Nikki, Shanna Smith Jaggars, Elaine DeLott Baker, and Thomas Bailey. 2013. Acceleration Through a Holistic Support Model: An Implementation and Outcomes Analysis of FastStart@CCD. New York: Community College Research Center, Teachers College, Columbia University.
Engle, Jennifer. 2007. “Postsecondary Access and Success for First-Generation College Students.” American Academic 3, 1: 25-48.
Epper, Rhonda M., and Elaine DeLott Baker. 2009. Technology Solutions for Developmental Math: An Overview of Current and Emerging Practices. Menlo Park, CA: The William and Flora Hewlett Foundation and the Bill and Melinda Gates Foundation.
Fong, Kelly, and Mary Visher. 2013. Fast Forward: A Case Study of Two Community College Programs Designed to Accelerate Students Through Developmental Math. New York: MDRC.
Golfin, Peggy, Darrell Hull, and Monya Ruffin. 2005. Strengthening Mathematics Skills at the Postsecondary Level: Promising Practices in Community Colleges, Businesses, and the Military. Washington, DC: U.S. Department of Education, Office of Vocational and Adult Education.
Hammerman, Natalie, and Robert Goldberg. 2003. “Strategies for Developmental Mathematics at the College Level.” Mathematics and Computer Education 37, 1: 79-95.

66
Hiebery, James, and Douglas A. Grouws. 2007. “The Effects of Classroom Mathematics Teaching on Students’ Learning.” Pages 371-404 in F.K. Lester (ed.), Second Handbook of Research on Mathematics Teaching and Learning. Greenwich, CT: Information Age Publishing.
Hodara, Michelle. 2011. Reforming Mathematics Classroom Pedagogy: Evidence-Based Findings and Recommendations for the Developmental Math Classroom. New York: Community College Research Center, Teachers College, Columbia University.
Jenkins, Davis, Cecilia Speroni, Clive Belfield, Shanna Smith Jaggars, and Nikki Edgecombe. 2010. “A Model for Accelerating Academic Success of Community College Remedial English Students: Is the Accelerated Learning Program (ALP) Effective and Affordable?” CCRC Working Paper 21. New York: Community College Research Center, Teachers College, Columbia University.
Logue, Alexandra W., Mari Watanabe-Rose, and Daniel Douglas. Forthcoming. “Should Students Assessed as Needing Remedial Mathematics Take College-Level Quantitative Courses Instead? A Randomized Controlled Trial.” Educational Evaluation and Policy Analysis.
Lovett, Marsha, Oded Myer, and Candace Thille. 2008. “The Open Learning Initiative: Measuring the Effectiveness of the OLI Statistics Course in Accelerating Student Learning.” Journal of Interactive Media in Education.
Quint, Janet, Shanna S. Jaggars, D. Crystal Byndloss, and Asya Magazinnik. 2013. Bringing Developmental Education to Scale: Lessons from the Developmental Education Initiative. New York: MDRC.
Rutschow, Elizabeth Zachry, John Diamond, and Elena Serna-Wallender. 2015. Laying the Foundations: Early Findings from the New Mathways Project. New York: MDRC.
Rutschow, Elizabeth Zachry, and Emily Schneider. 2011. Unlocking the Gate: What We Know About Improving Developmental Education. New York: MDRC.
Schochet, Peter Z. 2008. Technical Methods Report: Statistical Power for Regression Discontinuing Designs in Education Evaluations. NCEE 2008-4026. Washington, DC: National Center for Education Evaluation and Regional Assistance, Institute of Education Sciences, U.S. Department of Education.
Taylor, Judy M. 2008. “The Effects of a Computerized-Algebra Program on Mathematics Achievement of College and University Freshmen Enrolled in a Developmental Mathematics Course.” Journal of College Reading and Learning 39, 1: 35-53.
Weick, Karl E. 1984. “Small Wins: Redefining the Scale of Social Problems.” American Psychologist 39, 1: 40-49.
Weiss, Michael J., Alexander Mayer, Dan Cullinan, Alyssa Ratledge, Colleen Sommo, and John Diamond. 2015. “A Random Assignment Evaluation of Learning Communities at Kingsborough Community College: Seven Years Later.” Journal of Research on Educational Effectiveness 8, 2: 189-217.

67
Weiss, Michael J., Mary G. Visher, Evan Weissman, and Heather Wathington. 2015. “The Impact of Learning Communities for Students in Developmental Education: A Synthesis of Findings from Randomized Trials at Six Community Colleges.” Educational Evalution and Policy Analysis 37, 4: 520-541.
Zavarella, Carol A., and Jan M. Ignash. 2009. “Instructional Delivery in Developmental Mathematics: Impact on Retention.” Journal of Developmental Education 32, 3: 2-13.
Zhu, Qi, and Galina Polianskaia. 2007. “A Comparison of Traditional Lecture and Computer-Mediated Instruction in Developmental Mathematics.” Research and Teaching in Developmental Education 24, 1: 63-82.

About MDRC
MDRC is a nonprofit, nonpartisan social and education policy research organization dedicated to learning what works to improve the well-being of low-income people. Through its research and the active communication of its findings, MDRC seeks to enhance the effectiveness of so-cial and education policies and programs.
Founded in 1974 and located in New York City and Oakland, California, MDRC is best known for mounting rigorous, large-scale, real-world tests of new and existing policies and programs. Its projects are a mix of demonstrations (field tests of promising new program approaches) and evaluations of ongoing government and community initiatives. MDRC’s staff bring an unusual combination of research and organizational experience to their work, providing expertise on the latest in qualitative and quantitative methods and on program design, development, implementa-tion, and management. MDRC seeks to learn not just whether a program is effective but also how and why the program’s effects occur. In addition, it tries to place each project’s findings in the broader context of related research — in order to build knowledge about what works across the social and education policy fields. MDRC’s findings, lessons, and best practices are proac-tively shared with a broad audience in the policy and practitioner community as well as with the general public and the media.
Over the years, MDRC has brought its unique approach to an ever-growing range of policy are-as and target populations. Once known primarily for evaluations of state welfare-to-work pro-grams, today MDRC is also studying public school reforms, employment programs for ex-offenders and people with disabilities, and programs to help low-income students succeed in college. MDRC’s projects are organized into five areas:
• Promoting Family Well-Being and Children’s Development
• Improving Public Education
• Raising Academic Achievement and Persistence in College
• Supporting Low-Wage Workers and Communities
• Overcoming Barriers to Employment
Working in almost every state, all of the nation’s largest cities, and Canada and the United Kingdom, MDRC conducts its projects in partnership with national, state, and local govern-ments, public school systems, community organizations, and numerous private philanthropies.