aswath damodaran - new york...
TRANSCRIPT
THE COST OF CAPITAL: MISUNDERSTOOD, MISESTIMATED AND MISUSED!
Aswath Damodaran

2
What is the cost of capital?
¨ Most pracCConers in finance either have had to esCmate or seen others esCmate a cost of capital? Which of the following best describes what the cost of capital?
a. It is the cost of raising funding (from both debt and equity) to run a business
b. It the hurdle rate to use in deciding whether to invest money in individual projects
c. It is a key determinant of whether a company should invest or return cash to its stockholders.
d. It is the discount rate that you use to esCmate the value of the business.
e. It is one tool for esCmaCng the right mix of debt and equity for a business.
f. It is all of the above.

THE ULTIMATE MULTI-‐PURPOSE TOOL: AN OPPORTUNITY COST & OPTIMIZING TOOL

4
The Cost of Capital is everywhere in finance
¨ In corporate finance: In corporate finance, the cost of capital plays a central role in investment analysis, capital structure and dividend policy, helping to determine whether and where a business should invest, how much it should borrow and how much it should return to stockholders.
¨ In valuation: In valuation, the cost of capital operates as the primary mechanism for measuring and adjusting for risk in the expected cash flows.
5
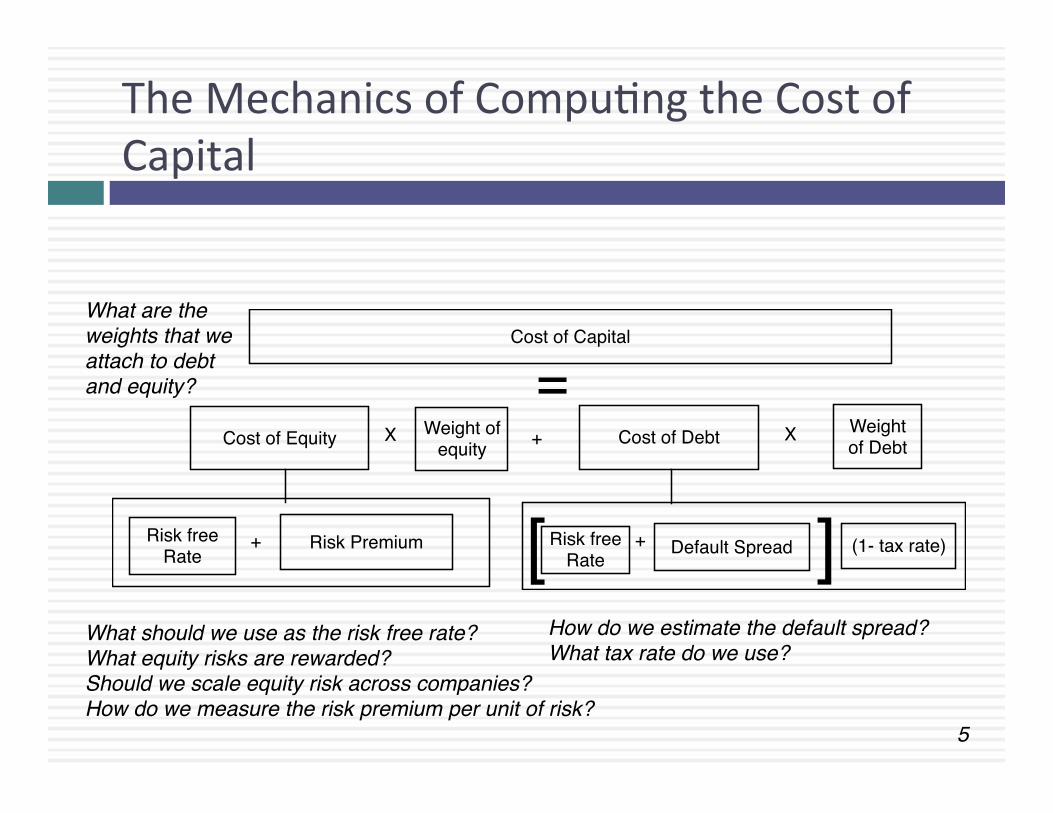
The Mechanics of CompuCng the Cost of Capital
Cost of Equity Weight of equity Cost of Debt Weight
of Debt
Risk free Rate
Risk Premium Risk free Rate Default Spread (1- tax rate)
Cost of Capital
X + X
+ +[ ]
=
What should we use as the risk free rate?What equity risks are rewarded?Should we scale equity risk across companies?How do we measure the risk premium per unit of risk?
How do we estimate the default spread?What tax rate do we use?
What are the weights that we attach to debt and equity?

6
In investment analysis: The cost of capital as a hurdle rate & opportunity cost
The cost of capital for an investment
Should reflect the risk of the investment, not the entity taking the investment.Should use a debt ratio that is reflective of the investment's cash flows.
The Hurdle Rate
Accounting TestReturn on invested capital (ROIC) > Cost of Capital
Time Weighted CF TestNPV of the Project > 0
Time Weighted % ReturnIRR > Cost of Capital
No risk subsidiesIf you use the cost of capital of the company as your hurdle rate for all investments, risky investments (and businesses) will be subsidized by safe investments.(and businesses).
No debt subsidiesIf you fund an investment disprportionately with debt, you are using the company's debt capacity to subsidize the investment.
7
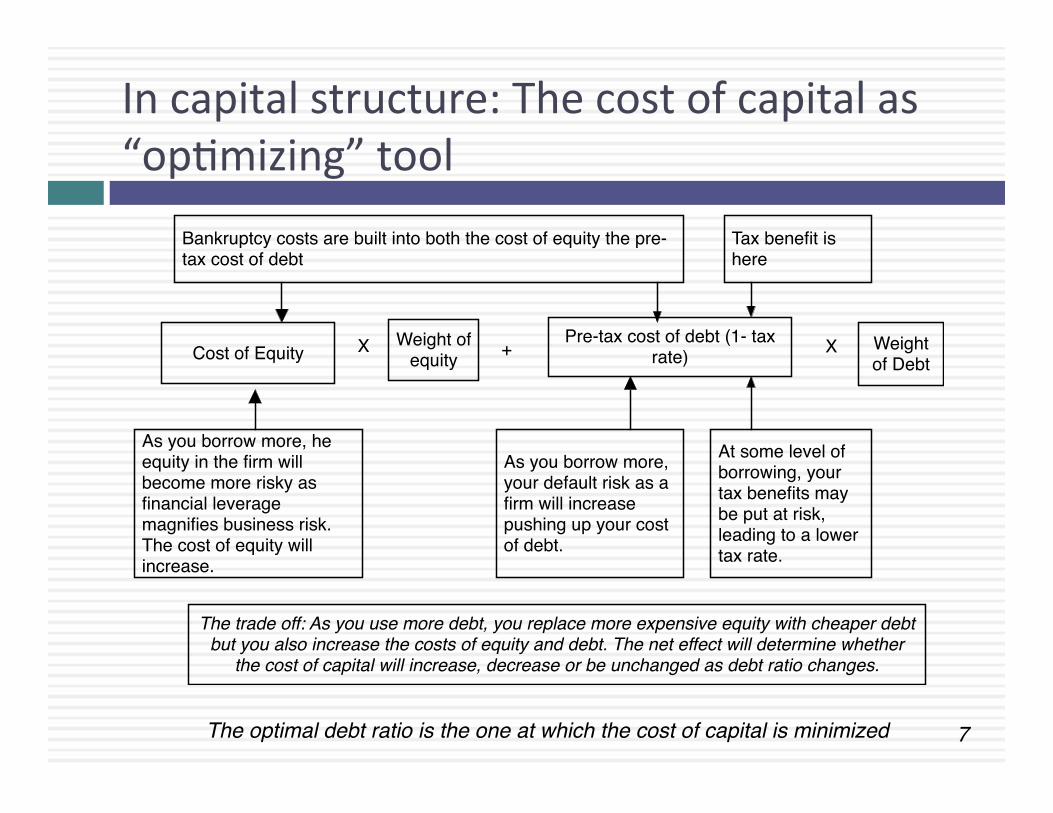
In capital structure: The cost of capital as “opCmizing” tool
The optimal debt ratio is the one at which the cost of capital is minimized
As you borrow more, he equity in the firm will become more risky as financial leverage magnifies business risk. The cost of equity will increase.
Cost of EquityWeight of
equityPre-tax cost of debt (1- tax
rate)Weight of Debt
X + X
As you borrow more, your default risk as a firm will increase pushing up your cost of debt.
At some level of borrowing, your tax benefits may be put at risk, leading to a lower tax rate.
Bankruptcy costs are built into both the cost of equity the pre-tax cost of debt
Tax benefit ishere
The trade off: As you use more debt, you replace more expensive equity with cheaper debt but you also increase the costs of equity and debt. The net effect will determine whether
the cost of capital will increase, decrease or be unchanged as debt ratio changes.

8
In dividend policy: It is the divining rod for returning cash
0.00%
5.00%
10.00%
15.00%
20.00%
25.00%
30.00%
35.00%
40.00%
45.00%
Australia, NZ and Canada
Developed Europe Emerging Markets Japan United States Global
Excess Return (ROC minus Cost of Capital) for firms with market capitaliza<on> $50 million: Global in 2014
<-‐5%
-‐5% -‐ 0%
0 -‐5%
5 -‐10%
>10%

9
In valuaCon: It is the mechanism for adjusCng for risk..
Assets Liabilities
Assets in Place Debt
Equity
Discount rate reflects the cost of raising both debt and equity financing, in proportion to their use
Growth Assets
Figure 5.6: Firm Valuation
Cash flows considered are cashflows from assets, prior to any debt paymentsbut after firm has reinvested to create growth assets
Present value is value of the entire firm, and reflects the value of all claims on the firm.

10
A Template for Risk AdjusCng Value
Expected Cash Flows Risk-adjusted Discount Rate Value
Company Specific Risks get reflected in the
expected cash flows
Discount rate is adjusted for only the risk that cannot be diversified away (macro economic risk) by marginal
investor
get discounted at to get Adjusted Value
Discrete risks (distress, nationalization, regulatory approval etc.) are brought in
through probabilities and value consequences.
And probability adjusted to arrive at
For a public company
Company Specific Risks get reflected in the
expected cash flowsDiscount rate is adjusted (upwards) to reflect all risk that the investor in the private business is exposed to.
Discrete risks (distress, nationalization, regulatory approval etc.) are brought in
through probabilities and value consequences.
Business Macro Risk Exposure
Country Macro Risk Exposure
Beta Country Risk Premium
Probability of discrete event
Value if event occursImplicit in
numbersExplicit (Senario
analysis or Simulation)
Beta adjusted for total risk
Risk premium adjusted for company-specific risk
For a private business
Can be
X

11
What the cost of capital is not..
1. It is not the cost of equity: There is a Cme and a place to use the cost of equity and a Cme a place for the cost of capital. You cannot use them interchangeably.
2. It is not a return that you would like to make: Both companies and investors mistake their “hopes” fore expectaCons. The fact that you would like to make 15% is nice but it is not your cost of capital.
3. It is not a receptacle for all your hopes and fears: Some analysts take the “risk adjusCng” in the discount rate too far, adjusCng it for any and all risks in the company and their “percepCon” of those risks.
4. It is not a mechanism for reverse engineering a desired value: A cost of capital is not that discount rate that yields a value you would like to see.
5. It is not the most important input in your valuaCon: The discount rate is an input into a discounted cash flow valuaCon but it is definitely not the most criCcal.
6. It is not a constant across Cme, companies or even in your company’s valuaCon.

I. THE RISK FREE RATE
Feel the urge to normalize?

13
The Risk Free Rate
You have been asked to esCmate the risk free rate for a Swiss mulCnaConal, which gets 10% of its revenues in Switzerland (in Swiss Francs), 30% of its revenues in the EU (in Euros), 40% of its revenues in the US (in US $) and 20% of its revenues in India (in Indian rupees). The risk free rates are 0.5% in Swiss Francs, 1% in Euros, 2.5% in US $ and 6% in Indian Rupees. What risk free rate will you use in your valuaCon? a. The simple average of the risk free rates b. The weighted average of the risk free rates c. The Swiss franc rate, since it is a Swiss company d. The lowest of the rates, since it has to be risk free e. The highest of the rates, to be conservaCve f. None of the above

14
The “Low” Risk Free Rate
¨ The US 10-‐year T.Bond rate today is about 2.1%. That rate is a. Too low b. Too high c. Just right ¨ If you have low risk free rates, you will get high values for
assets in a discounted cash flow valuaCon. a. True b. False ¨ Since you are esCmaCng intrinsic value, you should therefore
use a normal risk free rate. a. True b. False

15
What is the risk free rate?
¨ On a riskfree asset, the actual return is equal to the expected return. Therefore, there is no variance around the expected return.
¨ For an investment to be riskfree, then, it has to have ¤ No default risk ¤ No reinvestment risk
¤ Following up, here are three broad implicaCons: 1. Time horizon maners: Thus, the riskfree rates in valuaCon will depend
upon when the cash flow is expected to occur and will vary across Cme. 2. Currency maners: The risk free rate will vary across currencies. 3. Not all government securiCes are riskfree: Some governments face
default risk and the rates on bonds issued by them will not be riskfree.

16
Risk free rate by currency
-‐2.00%
0.00%
2.00%
4.00%
6.00%
8.00%
10.00%
12.00%
14.00%
Japane
se Yen
Czech Ko
runa
Swiss Franc
Euro
Danish Krone
Sw
edish
Krona
Taiwanese $
Hungarian Forin
t Bu
lgarian Lev
Kuna
Thai Baht
BriCsh Pou
nd
Romanian Leu
Norwegian Kron
e HK
$
Israeli She
kel
Polish Zloty
Canadian $
Korean W
on
US $
Singapore $
Phillipine Pe
so
Pakistani Rup
ee
Vene
zuelan Bolivar
Vietnamese Do
ng
Australian $
Malyasia
n Ringgit
Chinese Yuan
NZ $
Chilean Peso
Iceland Kron
a Pe
ruvian Sol
Mexican Peso
Colombian Peso
Indo
nesia
n Ru
piah
Indian Rup
ee
Turkish
Lira
South African Rand
Kenyan Shilling
Reai
Naira
Russian Ru
ble
Riskfree Rates: January 2015
Risk free Rate

17
The risk free rate is “too low”!
¨ In January 2015, the 10-‐year treasury bond rate in the United States was 2.17%, a historic low. Assume that you were valuing a company in US dollars then, but were wary about the risk free rate being too low. Which of the following should you do? a. Replace the current 10-‐year bond rate with a more reasonable
normalized riskfree rate (the average 10-‐year bond rate over the last 30 years has been about 5-‐6%)
b. Use the current 10-‐year bond rate as your riskfree rate but make sure that your other assumpCons (about growth and inflaCon) are consistent with the riskfree rate
c. Something else…

18
Why is the risk free rate so low?

19
The Fed Effect: Smaller than you think!

20
When the risk free rate changes, the rest of your inputs will as well!

21
Risk free Rate: There are choices but you have to be consistent..
Option Inputs Riskfree Rate ERP Cost of
equity Expected growth rate Value
Normalize
Used 20-‐year averages for T.Bond rate and nominal GDP growth + Historical ERP (1928-‐2015)
4.14% 4.60% 8.74% 4.77% $2,519
Intrinsic
Used inLlation rate + real growth rate from last year as both risk free rate and nominal growth rate for the future. Estimated an intrinsic ERP from Baa default spread on 3/27/15.
3.08% 5.11% 8.19% 3.08% $1,957
Leave alone Used current T.Bond rate and implied ERP. Set nominal growth rate = current T.Bond rate.
2.00% 5.79% 7.79% 2.00% $1,727
Leave alone for now & then normalize
Used leave alone inputs for next 5 years & normalized after year
5.
2.00% 5.79% 7.79% 2.00% $2,296 4.14% 4.60% 8.74% 4.77%
The value of a business with expected cash flows to equity of $100 million next year

22
The Mismatch Effect
Mismatches
Normalize risk free rate, but leave all else alone 4.14% 5.79% 9.93% 2.00% $1,261
Normalize ERP and growth rate, but leave risk free rate alone 2.00% 4.60% 6.60% 4.77% $5,464

II. THE EQUITY RISK PREMIUM
Using history as a crutch?

24
The Equity Risk Premium
¨ If you use an equity risk premium in your valuaCons, how do you obtain this number?
a. I use a company-‐wide standard b. I use historical risk premium c. I use a service (D&P, Ibbotson) d. I make up a number e. None of the above ¨ If you use a historical risk premium, which of the following
are you assuming? a. That equity risk premiums revert back to historic norms b. That the historical risk premium is reasonably precise. c. That equity risk premiums don’t change much over Cme.

25
What is the Equity Risk Premium?
¨ IntuiCvely, the equity risk premium measures what investors demand over and above the riskfree rate for invesCng in equiCes as a class. Think of it as the market price for taking on average equity risk.
¨ It should depend upon ¤ The risk aversion of investors ¤ The perceived risk of equity as an investment class
¨ Unless you believe that investor risk aversion and/or that the perceived risk of equity as a class does not change over Cme, the equity risk premium is a dynamic number (not a staCc one).

26
The Historical Risk Premium
¨ The historical premium is the premium that stocks have historically earned over riskless securiCes.
¨ While the users of historical risk premiums act as if it is a fact (rather than an esCmate), it is sensiCve to ¤ How far back you go in history… ¤ Whether you use T.bill rates or T.Bond rates ¤ Whether you use geometric or arithmeCc averages.
¨ For instance, looking at the US: Arithmetic Average Geometric Average Stocks - T. Bills Stocks - T. Bonds Stocks - T. Bills Stocks - T. Bonds1928-2014 8.00% 6.25% 6.11% 4.60% 2.17% 2.32% 1965-2014 6.19% 4.12% 4.84% 3.14% 2.42% 2.74% 2005-2014 7.94% 4.06% 6.18% 2.73% 6.05% 8.65%

27
And why you should not trust it!
¨ Pick your premium: Analysts can pick and choose the risk premium from the table that best reflects their biases and argue with legal jusCficaCon that it is a historical risk premium.
¨ Noisy esCmates: Even with long Cme periods of history, the risk premium that you derive will have substanCal standard error. For instance, if you go back to 1928 (about 80 years of history) and you assume a standard deviaCon of 20% in annual stock returns, you arrive at a standard error of greater than 2%:
Standard Error in Premium = 20%/√80 = 2.26% ¨ IntuiCvely wrong: The historical risk premium will decrease axer
bad market years and increase axer good ones. For instance, axer the 2008 market crisis, the historical risk premium dropped from 4.4% to 3.88%.

28
Risk Premium for a Mature Market? Broadening the sample to 1900-‐2013
Aswath Damodaran
28
Country Geometric Average ERP Arithmetic Average ERP Std ErrorAustralia 5.60% 7.50% 1.90%Austria 2.50% 21.50% 14.40%Belgium 2.30% 4.40% 2.00%Canada 3.50% 5.10% 1.70%Denmark 2.00% 3.60% 1.70%Finland 5.10% 8.70% 2.80%France 3.00% 5.30% 2.10%Germany 5.00% 8.40% 2.70%Ireland 2.60% 4.50% 1.80%Italy 3.10% 6.50% 2.70%Japan 5.10% 9.10% 3.00%Netherlands 3.20% 5.60% 2.10%New Zealand 3.90% 5.50% 1.70%Norway 2.30% 5.30% 2.60%South Africa 5.40% 7.10% 1.80%Spain 1.90% 3.90% 1.90%Sweden 3.00% 5.30% 2.00%Switzerland 2.10% 3.60% 1.60%U.K. 3.70% 5.00% 1.60%U.S. 4.40% 6.50% 1.90%Europe 3.10% 4.40% 1.50%World-ex U.S. 2.80% 3.90% 1.40%World 3.20% 4.50% 1.50%

29
The simplest way of esCmaCng an addiConal country risk premium: The country default spread
¨ Default spread for country: In this approach, the country equity risk premium is set equal to the default spread for the country, esCmated in one of three ways: ¤ The default spread on a dollar denominated bond issued by the country.
(In January 2015, that spread was 1.55% for the Brazilian $ bond) ¤ The sovereign CDS spread for the country. In January 2015, the ten year
CDS spread for Brazil was 2.86%. ¤ The default spread based on the local currency raCng for the country.
Brazil’s sovereign local currency raCng is Baa2 and the default spread for a Baa2 rated sovereign was about 1.90% in January 2015.
¨ Add the default spread to a “mature” market premium: This default spread is added on to the mature market premium to arrive at the total equity risk premium for Brazil, assuming a mature market premium of 5.75%. ¤ Country Risk Premium for Brazil = 1.90% ¤ Total ERP for Brazil = 5.75% + 1.90% = 7.65%
Aswath Damodaran
29

30
A melded approach to esCmaCng the addiConal country risk premium
¨ Country raCngs measure default risk. While default risk premiums and equity risk premiums are highly correlated, one would expect equity spreads to be higher than debt spreads.
¨ Another is to mulCply the bond default spread by the relaCve volaClity of stock and bond prices in that market. Using this approach for Brazil in January 2015, you would get: ¤ Country Equity risk premium = Default spread on country bond* σCountry
Equity / σCountry Bond n Standard DeviaCon in Bovespa (Equity) = 21% n Standard DeviaCon in Brazil government bond = 14% n Default spread on C-‐Bond = 1.90%
¤ Brazil Country Risk Premium = 1.90% (21%/14%) = 2.85% ¤ Brazil Total ERP = Mature Market Premium + CRP = 5.75% + 2.85% = 8.60%
Aswath Damodaran
30

Black #: Total ERPRed #: Country risk premiumAVG: GDP weighted average
ERP
: Jan
201
5
Angola 10.25% 4.50% Botswana 7.03% 1.28% Burkina Faso 15.50% 9.75% Cameroon 14.00% 8.25% Cape Verde 14.00% 8.25% Congo (DR) 15.50% 9.75% Congo (Republic) 11.15% 5.40% Côte d'Ivoire 12.50% 6.75% Egypt 17.00% 11.25% Ethiopia 12.50% 6.75% Gabon 11.15% 5.40% Ghana 14.00% 8.25% Kenya 12.50% 6.75% Morocco 9.50% 3.75% Mozambique 12.50% 6.75% Namibia 9.05% 3.30% Nigeria 11.15% 5.40% Rwanda 14.00% 8.25% Senegal 12.50% 6.75% South Africa 8.60% 2.85% Tunisia 11.15% 5.40% Uganda 12.50% 6.75% Zambia 12.50% 6.75% Africa 11.73% 5.98%
Bangladesh 11.15% 5.40% Cambodia 14.00% 8.25% China 6.65% 0.90% Fiji 12.50% 6.75% Hong Kong 6.35% 0.60% India 9.05% 3.30% Indonesia 9.05% 3.30% Japan 6.80% 1.05% Korea 6.65% 0.90% Macao 6.50% 0.75% Malaysia 7.55% 1.80% MauriCus 8.15% 2.40% Mongolia 14.00% 8.25% Pakistan 17.00% 11.25% Papua New Guinea 12.50% 6.75% Philippines 8.60% 2.85% Singapore 5.75% 0.00% Sri Lanka 12.50% 6.75% Taiwan 6.65% 0.90% Thailand 8.15% 2.40% Vietnam 12.50% 6.75% Asia 7.26% 1.51%
Australia 5.75% 0.00% Cook Islands 12.50% 6.75% New Zealand 5.75% 0.00% Australia & NZ 5.75% 0.00%
Abu Dhabi 6.50% 0.75% Bahrain 8.60% 2.85% Israel 6.80% 1.05% Jordan 12.50% 6.75% Kuwait 6.50% 0.75% Lebanon 14.00% 8.25% Oman 6.80% 1.05% Qatar 6.50% 0.75% Ras Al Khaimah 7.03% 1.28% Saudi Arabia 6.65% 0.90% Sharjah 7.55% 1.80% UAE 6.50% 0.75% Middle East 6.85% 1.10%
Albania 12.50% 6.75% Montenegro 11.15% 5.40% Armenia 10.25% 4.50% Poland 7.03% 1.28% Azerbaijan 9.05% 3.30% Romania 9.05% 3.30% Belarus 15.50% 9.75% Russia 8.60% 2.85% Bosnia 15.50% .75% Serbia 12.50% 6.75% Bulgaria 8.60% 2.85% Slovakia 7.03% 1.28% CroaCa 9.50% 3.75% Slovenia 9.50% 3.75% Czech Repub 6.80% 1.05% Ukraine 20.75% 15.00% Estonia 6.80% 1.05% E. Europe 9.08% 3.33% Georgia 11.15% 5.40% Hungary 9.50% 3.75% Kazakhstan 8.60% 2.85% Latvia 8.15% 2.40% Lithuania 8.15% 2.40% Macedonia 11.15% 5.40% Moldova 15.50% 9.75%
Andorra 8.15% 2.40% Italy 8.60% 2.85% Austria 5.75% 0.00% Jersey 6.35% 0.60% Belgium 6.65% 0.90% Liechtenstein 5.75% 0.00% Cyprus 15.50% 9.75% Luxembourg 5.75% 0.00% Denmark 5.75% 0.00% Malta 7.55% 1.80% Finland 5.75% 0.00% Netherlands 5.75% 0.00% France 6.35% 0.60% Norway 5.75% 0.00% Germany 5.75% 0.00% Portugal 9.50% 3.75% Greece 17.00% 11.25% Spain 8.60% 2.85% Guernsey 6.35% 0.60% Sweden 5.75% 0.00% Iceland 9.05% 3.30% Switzerland 5.75% 0.00% Ireland 8.15% 2.40% Turkey 9.05% 3.30% Isle of Man 6.35% 0.60% UK 6.35% 0.60%
W. Europe 6.88% 1.13%
ArgenCna 17.00% 11.25% Belize 19.25% 13.50% Bolivia 11.15% 5.40% Brazil 8.60% 2.85% Chile 6.65% 0.90% Colombia 8.60% 2.85% Costa Rica 9.50% 3.75% Ecuador 15.50% 9.75% El Salvador 11.15% 5.40% Guatemala 9.50% 3.75% Honduras 15.50% 9.75% Mexico 7.55% 1.80% Nicaragua 15.50% 9.75% Panama 8.60% 2.85% Paraguay 10.25% 4.50% Peru 7.55% 1.80% Suriname 11.15% 5.40% Uruguay 8.60% 2.85% Venezuela 17.00% 11.25% LaJn America 9.95% 4.20%
Canada 5.75% 0.00% US 5.75% 0.00% North America 5.75% 0.00%

32
EsCmaCng the ERP for a company
¨ LocaCon based CRP: The standard approach in valuaCon is to anach a country risk premium to a company based upon its country of incorporaCon. Thus, if you are an Indian company, you are assumed to be exposed to the Indian country risk premium. A developed market company is assumed to be unexposed to emerging market risk.
¨ OperaCon-‐based CRP: There is a more reasonable modified version. The country risk premium for a company can be computed as a weighted average of the country risk premiums of the countries that it does business in, with the weights based upon revenues or operaCng income. If a company is exposed to risk in dozens of countries, you can take a weighted average of the risk premiums by region.
Aswath Damodaran
32

33
ERP ComputaCons for Coca Cola and Disney 33
Region/ Country Proportion of Disney’s Revenues ERP
US& Canada 82.01% 5.50%Europe 11.64% 6.72%Asia-‐Pacific 6.02% 7.27%LaCn America 0.33% 9.44%Disney 100.00% 5.76%
Coca Cola: ERP in 2012
Disney: ERP in November 2013

34
A forward-‐looking ERP?
Base year cash flow (last 12 mths)Dividends (TTM): 38.57+ Buybacks (TTM): 61.92
= Cash to investors (TTM): 100.50Earnings in TTM: 114.74
Expected growth in next 5 yearsTop down analyst estimate of earnings
growth for S&P 500 with stable payout: 5.58%
106.10 112.01 118.26 124.85 131.81 Beyond year 5Expected growth rate = Riskfree rate = 2.17%
Expected CF in year 6 = 131.81(1.0217)
Risk free rate = T.Bond rate on 1/1/15= 2.17%
r = Implied Expected Return on Stocks = 7.95%
S&P 500 on 1/1/15= 2058.90
E(Cash to investors)
Minus
Implied Equity Risk Premium (1/1/15) = 7.95% - 2.17% = 5.78%
Equals
100.5 growing @ 5.58% a year
2058.90 = 106.10(1+ r)
+112.91(1+ r)2
+118.26(1+ r)3
+124.85(1+ r)4
+131.81(1+ r)5
+131.81(1.0217)(r −.0217)(1+ r)5

35
Implied Premiums in the US: 1960-‐2014
Aswath Damodaran
35
0.00%
1.00%
2.00%
3.00%
4.00%
5.00%
6.00%
7.00%
1960196119621963196419651966196719681969197019711972197319741975197619771978197919801981198219831984198519861987198819891990199119921993199419951996199719981999200020012002200320042005200620072008200920102011201220132014
Impl
ied
Prem
ium
Year
Implied Premium for US Equity Market: 1960-2014

36
The Anatomy of a Crisis: Implied ERP from September 12, 2008 to January 1, 2009
Aswath Damodaran
36

37
An Updated Equity Risk Premium: Dynamics and Determinant
Aswath Damodaran
37
¨ At this link, you will find the latest monthly ERP esCmate that I have for the S&P 500.
¨ If I hold all else constant (same cash flows, same risk free rate) and lower the index value by 10%, what effect will it have on the ERP?
a. Increase b. Decrease ¨ If I hold all else constant (same cash flows, same risk free rate) and lower
the cash flow by 10%, what effect will it have on the ERP? a. Increase b. Decrease ¨ If I hold all else constant (same cash flows, same risk free rate) increase
the risk free rate by 1%, what effect will it have on the ERP? a. Increase b. Decrease

38
Implied Premium versus Risk Free Rate
Aswath Damodaran
38
0.00%
5.00%
10.00%
15.00%
20.00%
25.00%
1961
1962
1963
1964
1965
1966
1967
1968
1969
1970
1971
1972
1973
1974
1975
1976
1977
1978
1979
1980
1981
1982
1983
1984
1985
1986
1987
1988
1989
1990
1991
1992
1993
1994
1995
1996
1997
1998
1999
2000
2001
2002
2003
2004
2005
2006
2007
2008
2009
2010
2011
2012
2013
2014
Implied ERP and Risk free Rates
Implied Premium (FCFE)
T. Bond Rate
Expected Return on Stocks = T.Bond Rate + Equity Risk Premium
Since 2008, the expected return on stocks has stagnated at about 8%, but the risk free rate has dropped dramatically.

39
Equity Risk Premiums and Bond Default Spreads
Aswath Damodaran
39
0.00
1.00
2.00
3.00
4.00
5.00
6.00
7.00
8.00
9.00
0.00%
1.00%
2.00%
3.00%
4.00%
5.00%
6.00%
7.00%
ERP
/ Baa
Spr
ead
Pre
miu
m (
Sp
read
)
Figure 16: Equity Risk Premiums and Bond Default Spreads
ERP/Baa Spread Baa - T.Bond Rate ERP

40
Equity Risk Premiums and Cap Rates (Real Estate)
Aswath Damodaran
40
-‐8.00%
-‐6.00%
-‐4.00%
-‐2.00%
0.00%
2.00%
4.00%
6.00%
8.00%
1980
1981
1982
1983
1984
1985
1986
1987
1988
1989
1990
1991
1992
1993
1994
1995
1996
1997
1998
1999
2000
2001
2002
2003
2004
2005
2006
2007
2008
2009
2010
2011
2012
2013
2014
Figure 17: Equity Risk Premiums, Cap Rates and Bond Spreads
ERP
Baa Spread
Cap Rate premium
41
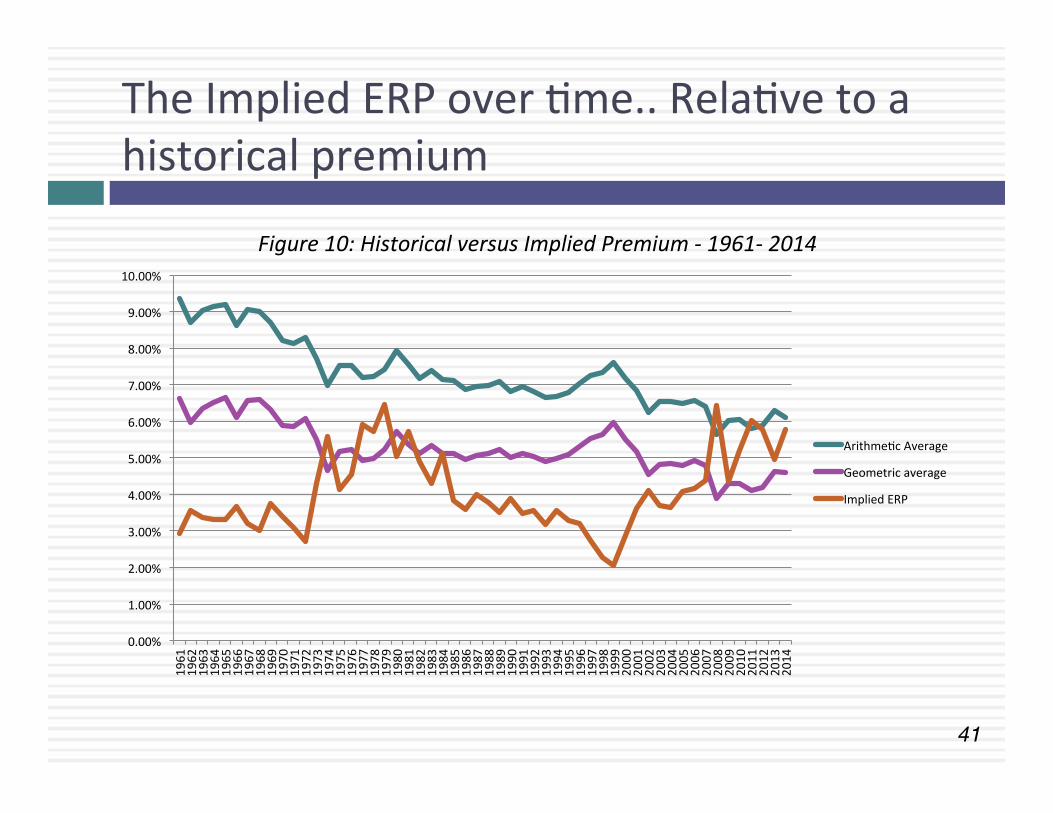
The Implied ERP over Cme.. RelaCve to a historical premium
0.00%
1.00%
2.00%
3.00%
4.00%
5.00%
6.00%
7.00%
8.00%
9.00%
10.00%
1961
1962
1963
1964
1965
1966
1967
1968
1969
1970
1971
1972
1973
1974
1975
1976
1977
1978
1979
1980
1981
1982
1983
1984
1985
1986
1987
1988
1989
1990
1991
1992
1993
1994
1995
1996
1997
1998
1999
2000
2001
2002
2003
2004
2005
2006
2007
2008
2009
2010
2011
2012
2013
2014
Figure 10: Historical versus Implied Premium -‐ 1961-‐ 2014
ArithmeCc Average
Geometric average
Implied ERP

42
Why implied premiums maner?
¨ Many appraisers and analysts use historical risk premiums (and arithmeCc averages at that) as risk premiums to compute cost of equity. If you use the arithmeCc average premium (for stocks over T.Bills) for 1928-‐2014 of 8% to value stocks in January 2014, given the implied premium of 5.75%, what are they likely to find?
a. The values they obtain will be too low (most stocks will look overvalued)
b. The values they obtain will be too high (most stocks will look under valued)
c. There should be no systemaCc bias as long as they use the same premium to value all stocks.
Aswath Damodaran
42

43
Which equity risk premium should you use?
If you assume this Premium to use
Premiums revert back to historical norms and your Cme period yields these norms
Historical risk premium
Market is correct in the aggregate or that your valuaCon should be market neutral
Current implied equity risk premium
Marker makes mistakes even in the aggregate but is correct over Cme
Average implied equity risk premium over Cme.
Aswath Damodaran
43

III. MEASURING RELATIVE RISK
It should not be Greek to you!
45
MPT, Betas and RelaCve Risk Measures
¨ Much of discount rate assessment is built on modern por}olio theory and its assumpCons about how to measure risk. If you do not believe in MPT (and beta or betas), which of the following should you do?
a. Don’t use discounted cash flow valuaCon b. Don’t adjust for risk in your discounted cash flow
valuaCons (use a risk free rate or a constant return) c. Come up with an alternaCve measure of relaCve
risk that beners fits your thinking about risk.

46
Beta Mythology
¨ Which of the following does beta measure? a. The total risk in an investment b. The porCon of the risk in an investment that is due to micro reasons
(management quality, brand name etc.) c. The porCon of the risk in an investment that is due to macro factors
(interest rates, inflaCon). ¨ If you don’t like beta, which of the following reasons would you put first? a. Investors are not all diversified. b. It is a measure of price risk and does not fit into an intrinsic valuaCon. c. If you use it, you are assuming that markets are efficient. d. The beta esCmate can be very noisy (lots of standard error) e. None of the above.

Relative Risk MeasureHow risky is this asset, relative to the average
risk investment?
The CAPM BetaRegression beta of
stock returns at firm versus stock returns on market
index
Price Variance ModelStandard deviation, relative to the
average across all stocks
Accounting Earnings VolatilityHow volatile is your company's
earnings, relative to the average company's earnings?
Accounting Earnings BetaRegression beta of changes
in earnings at firm versus changes in earnings for
market index
Sector-average BetaAverage regression beta
across all companies in the business(es) that the firm
operates in.
Proxy measuresUse a proxy for risk (market cap, sector).
Debt cost basedEstimate cost of equity based upon cost of debt and relative
volatility
Balance Sheet RatiosRisk based upon balance
sheet ratios (debt ratio, working capital, cash, fixed assets) that measure risk
Implied Beta/ Cost of equityEstimate a cost of equity for firm or sector based upon price today and expected
cash flows in future
Composite Risk MeasuresUse a mix of quantitative (price,
ratios) & qualitative analysis (management quality) to
estimate relative risk
APM/ Multi-factor ModelsEstimate 'betas' against
multiple macro risk factors, using past price data
MPT Quadrant
Price based, Model Agnostic Quadrant
Accounting Risk Quadrant
Intrinsic Risk Quadrant
Aswath Damodaran47
Measuring Relative Risk

48
The CAPM Beta
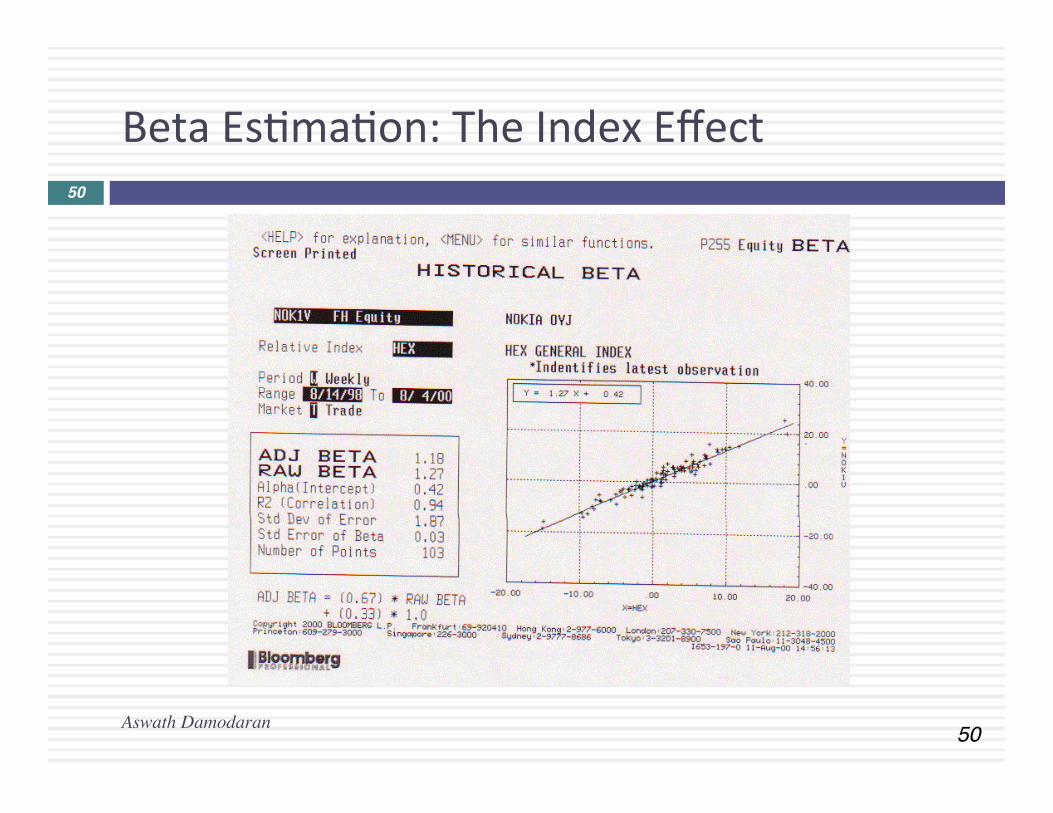
¨ The standard procedure for esCmaCng betas is to regress stock returns (Rj) against market returns (Rm) -‐ Rj = a + b Rm where a is the intercept and b is the slope of the regression.
¨ The slope of the regression corresponds to the beta of the stock, and measures the riskiness of the stock.
¨ This beta has three problems: ¤ It has high standard error ¤ It reflects the firm’s business mix over the period of the regression, not the current mix
¤ It reflects the firm’s average financial leverage over the period rather than the current leverage.
Aswath Damodaran
48

49
Beta EsCmaCon: Using a Service (Bloomberg)
Aswath Damodaran
50
Beta EsCmaCon: The Index Effect
Aswath Damodaran
50

51
In a perfect world… we would esCmate the beta of a firm by doing the following
Start with the beta of the business that the firm is in
Adjust the business beta for the operating leverage of the firm to arrive at the unlevered beta for the firm.
Use the financial leverage of the firm to estimate the equity beta for the firmLevered Beta = Unlevered Beta ( 1 + (1- tax rate) (Debt/Equity))
Aswath Damodaran
51

52
Bonom-‐up Betas
Step 1: Find the business or businesses that your firm operates in.
Step 2: Find publicly traded firms in each of these businesses and obtain their regression betas. Compute the simple average across these regression betas to arrive at an average beta for these publicly traded firms. Unlever this average beta using the average debt to equity ratio across the publicly traded firms in the sample.Unlevered beta for business = Average beta across publicly traded firms/ (1 + (1- t) (Average D/E ratio across firms))
If you can, adjust this beta for differencesbetween your firm and the comparablefirms on operating leverage and product characteristics.
Step 3: Estimate how much value your firm derives from each of the different businesses it is in.
While revenues or operating income are often used as weights, it is better to try to estimate the value of each business.
Step 4: Compute a weighted average of the unlevered betas of the different businesses (from step 2) using the weights from step 3.Bottom-up Unlevered beta for your firm = Weighted average of the unlevered betas of the individual business
Step 5: Compute a levered beta (equity beta) for your firm, using the market debt to equity ratio for your firm. Levered bottom-up beta = Unlevered beta (1+ (1-t) (Debt/Equity))
If you expect the business mix of your firm to change over time, you can change the weights on a year-to-year basis.
If you expect your debt to equity ratio to change over time, the levered beta will change over time.
Possible Refinements
Aswath Damodaran
52

53
Why bonom-‐up betas?
¨ The standard error in a bonom-‐up beta will be significantly lower than the standard error in a single regression beta. Roughly speaking, the standard error of a bonom-‐up beta esCmate can be wrinen as follows:
Std error of bonom-‐up beta =
¨ The bonom-‐up beta can be adjusted to reflect changes in the firm’s business mix and financial leverage. Regression betas reflect the past.
¨ You can esCmate bonom-‐up betas even when you do not have historical stock prices. This is the case with iniCal public offerings, private businesses or divisions of companies.
€
Average Std Error across BetasNumber of firms in sample
Aswath Damodaran
53

54
Unlevered Betas for businesses
Aswath Damodaran
€
Unlevered Beta(1 - Cash/ Firm Value)
Business Comparable firms Sample size
Median Beta
Median D/E
Median Tax rate
Company Unlevered
Beta
Median Cash/ Firm Value
Business Unlevered
Beta
Media Networks
US firms in broadcasCng business 26 1.43 71.09% 40.00% 1.0024 2.80% 1.0313
Parks & Resorts
Global firms in amusement park business 20 0.87 46.76% 35.67% 0.6677 4.95% 0.7024
Studio Entertainment US movie firms 10 1.24 27.06% 40.00% 1.0668 2.96% 1.0993
Consumer Products
Global firms in toys/games producCon & retail 44 0.74 29.53% 25.00% 0.6034 10.64% 0.6752
InteracCve Global computer gaming firms 33 1.03 3.26% 34.55% 1.0085 17.25% 1.2187

55
EsCmaCng Bonom Up Betas & Costs of Equity: Disney
Aswath Damodaran
Business Revenues EV/Sales Value of Business
Propor<on of Disney
Unlevered beta Value Propor<on
Media Networks $20,356 3.27 $66,580 49.27% 1.03 $66,579.81 49.27%
Parks & Resorts $14,087 3.24 $45,683 33.81% 0.70 $45,682.80 33.81%
Studio Entertainment $5,979 3.05 $18,234 13.49% 1.10 $18,234.27 13.49%
Consumer Products $3,555 0.83 $2,952 2.18% 0.68 $2,951.50 2.18%
InteracCve $1,064 1.58 $1,684 1.25% 1.22 $1,683.72 1.25%
Disney OperaCons $45,041 $135,132 100.00% 0.9239 $135,132.11
Business Unlevered beta Value of business D/E ra<o Levered beta Cost of Equity Media Networks 1.0313 $66,580 10.03% 1.0975 9.07% Parks & Resorts 0.7024 $45,683 11.41% 0.7537 7.09% Studio Entertainment 1.0993 $18,234 20.71% 1.2448 9.92% Consumer Products 0.6752 $2,952 117.11% 1.1805 9.55% InteracCve 1.2187 $1,684 41.07% 1.5385 11.61% Disney OperaCons 0.9239 $135,132 13.10% 1.0012 8.52%

III. THE GARNISHING
Here a premium, there a premium..

57
Premiums in Discount Rates
¨ Do you use a small cap premium in esCmaCng cost of equity for smaller companies?
a. Yes b. No ¨ If you do use a small cap premium, why do you use it? a. Because small cap stocks have historically earned higher
returns than large cap stocks. b. Because small companies are riskier than large cap
companies. c. Because small cap companies are less liquid than large cap
companies. d. Because it is the standard pracCce.
58
The Build up Approach
¨ For many analysts, the risk free rate and equity risk premium are just the starCng points to get to a cost of equity. The required return that you obtain is then augmented with premiums for “other” risks to arrive at a built up cost of equity.
¨ The jusCficaCons offered for these premiums are varied but can be broadly classified into: ¤ Historical premium: The historical data jusCfies adding a premium (for small capitalizaCon, illiquidity)
¤ IntuiCon: There are risks that are being missed that have to be built in
¤ Reasonableness: The discount rate that I am ge�ng looks too low.

59
The Most Added Premium: The Small Cap Premium

60
Historical premiums are noisy..

61
Historical data can hide trends..

62
And the market does not seem to be pricing it in..
The implied ERP for the S&P 500 was 5.78%. If there is a small cap premium, where is it?

63
The fig leaf of illiquidity
¨ Test 1: If illiquidity is what you are concerned about with the company you are valuing, why use market capitalizaCon as a proxy for illiquidity?
¨ Test 2: Assuming that you believe that market capitalizaCon is a reasonable proxy for illiquidity, why do you assume that illiquidity has the same impact at every company you value, for every buyer and across Cme periods?
¨ Test 3: Assuming that you size is a proxy for liquidity and that you can make the case that illiquidity does not vary across companies, why is it not changing in your company as it grows over Cme?
¨ Test 4: Assuming that you are okay with size being a proxy for illiquidity and are willing to argue that it is a constant across companies and Cme, why are you then applying an illiquidity discount to the value that you obtained in your DCF?

64
But, but.. My company is risky..
¨ EsCmaCon versus Economic uncertainty ¤ EsCmaCon uncertainty reflects the possibility that you could have the “wrong
model” or esCmated inputs incorrectly within this model. ¤ Economic uncertainty comes the fact that markets and economies can change over
Cme and that even the best models will fail to capture these unexpected changes. ¨ Micro uncertainty versus Macro uncertainty
¤ Micro uncertainty refers to uncertainty about the potenCal market for a firm’s products, the compeCCon it will face and the quality of its management team.
¤ Macro uncertainty reflects the reality that your firm’s fortunes can be affected by changes in the macro economic environment.
¨ Discrete versus conCnuous uncertainty ¤ Discrete risk: Risks that lie dormant for periods but show up at points in Cme.
(Examples: A drug working its way through the FDA pipeline may fail at some stage of the approval process or a company in Venezuela may be naConalized)
¤ ConCnuous risk: Risks changes in interest rates or economic growth occur conCnuously and affect value as they happen.

65
Risk and Cost of Equity: The role of the marginal investor
¨ Not all risk counts: While the noCon that the cost of equity should be higher for riskier investments and lower for safer investments is intuiCve, what risk should be built into the cost of equity is the quesCon.
¨ Risk through whose eyes? While risk is usually defined in terms of the variance of actual returns around an expected return, risk and return models in finance assume that the risk that should be rewarded (and thus built into the discount rate) in valuaCon should be the risk perceived by the marginal investor in the investment
¨ The diversificaCon effect: Most risk and return models in finance also assume that the marginal investor is well diversified, and that the only risk that he or she perceives in an investment is risk that cannot be diversified away (i.e, market or non-‐diversifiable risk). In effect, it is primarily economic, macro, conCnuous risk that should be incorporated into the cost of equity.
Aswath Damodaran
65

66
The Cost of Equity (for diversified investors)
0.
200.
400.
600.
800.
1,000.
1,200.
1,400.
1,600.
1,800.
2,000.
<4% 4-‐5% 5-‐6% 6-‐7% 7-‐8% 8-‐9% 9-‐10% 10-‐11% 11-‐12% 12-‐13% 13-‐14% 14-‐15% >15%
250. 213.
628.
852.
1,463.
1,865.
926.
474.
225. 141.
90. 70.
681.
Cost of equity for Publicly traded US firms -‐ January 2015
Distribution Statistics 10th percentile 5.45% 25th percentile 7.05% Median 8.33% 75th percentile 9.69% 90th percentile 13.43%

67
If the “buyer” is not diversified..
80 unitsof firm specificrisk
20 units of market risk
Private owner of businesswith 100% of your weatlthinvested in the business
Publicly traded companywith investors who are diversified
Is exposedto all the riskin the firm
Demands acost of equitythat reflects thisrisk
Eliminates firm-specific risk in portfolio
Demands acost of equitythat reflects only market risk
Market Beta measures justmarket risk
Total Beta measures all risk= Market Beta/ (Portion of the total risk that is market risk)
Private Owner versus Publicly Traded Company Perceptions of Risk in an Investment

IV. DEBT AND ITS COST

69
Costs of debt and capital
¨ Which of the following is the best way to esCmate cost of debt? a. Take the exisCng interest expense and divide by the book value of debt.
(Book interest rate) b. Look at the sector average cost of borrowing. c. Find a traded bond (if you can find one) issued by the company and use
the interest rate on the bond. ¨ In compuCng your cost of capital, the debt raCo that you should use is a. Book Debt/ (Book Debt + Book Equity) b. Market Debt/ (Market Debt + Market Equity) c. Book Debt/ (Book Debt + Market Equity) d. A target debt raCo ¨ In valuing a company, the cost of capital that you use has to be a. Constant over Cme b. Can change over Cme

70
What is debt?
¨ General Rule: Debt generally has the following characterisCcs: ¤ Commitment to make fixed payments in the future ¤ The fixed payments are tax deducCble ¤ Failure to make the payments can lead to either default or loss of control of the firm to the party to whom payments are due.
¨ As a consequence, debt should include ¤ Any interest-‐bearing liability, whether short term or long term.
¤ Any lease obligaCon, whether operaCng or capital.

71
The Cost of Debt
¨ The cost of debt is the rate at which you can borrow at currently, It will reflect not only your default risk but also the level of interest rates in the market.
¨ The two most widely used approaches to esCmaCng cost of debt are: ¤ Looking up the yield to maturity on a straight bond outstanding from
the firm. The limitaCon of this approach is that very few firms have long term straight bonds that are liquid and widely traded
¤ Looking up the raCng for the firm and esCmaCng a default spread based upon the raCng. While this approach is more robust, different bonds from the same firm can have different raCngs. You have to use a median raCng for the firm
¨ When in trouble (either because you have no raCngs or mulCple raCngs for a firm), esCmate a syntheCc raCng for your firm and the cost of debt based upon that raCng.
72
And the weights should be market value..
¨ The weights used in the cost of capital computaCon should be market values.
¨ There are three specious arguments used against market value ¤ Book value is more reliable than market value because it is not as volaCle:
While it is true that book value does not change as much as market value, this is more a reflecCon of weakness than strength
¤ Using book value rather than market value is a more conservaCve approach to esCmaCng debt raCos: For most companies, using book values will yield a lower cost of capital than using market value weights.
¤ Since accounCng returns are computed based upon book value, consistency requires the use of book value in compuCng cost of capital: While it may seem consistent to use book values for both accounCng return and cost of capital calculaCons, it does not make economic sense.
¤ Even if your company is a private business, where no market values are available, you are bener off using “industry average” debt raCos or iterated debt raCos instead of book value debt raCos.

73
As your company changes, so should your cost of capital
¨ The belief that you get one shot at esCmaCng the cost of capital in a DCF valuaCon and that it cannot change over the course of your forecasts is misplaced.
¨ The cost of capital can and should change over Cme, as your company changes. Put differently, if you are forecasCng that your company will grow over Cme to become a larger, more profitable, lower growth company, your inputs should change with your ¤ Debt raCo rising to that of a mature company ¤ RelaCve risk measure (Beta) converging on one ¤ Cost of debt reflecCve of your profitability & size
¨ If your cost of capital changes, you have to compute the present value using a compounded cost of capital.

74
Disney’s Cost of Capital: By Division
¨ Disney’s cost of debt, based upon it’s A raCng in November 2013, wad 3.75% and its marginal tax rate was 36.1%. ¤ Axer-‐tax cost of debt = 3.75% (1-‐.361) = 2.40%
¨ The cost of capital, by division, for Disney is below.
Aswath Damodaran
!!Cost!of!equity!
Cost!of!debt!
Marginal!tax!rate!
After6tax!cost!of!debt!
Debt!ratio!
Cost!of!capital!
Media!Networks! 9.07%! 3.75%! 36.10%! 2.40%! 9.12%! 8.46%!Parks!&!Resorts! 7.09%! 3.75%! 36.10%! 2.40%! 10.24%! 6.61%!Studio!Entertainment! 9.92%! 3.75%! 36.10%! 2.40%! 17.16%! 8.63%!Consumer!Products! 9.55%! 3.75%! 36.10%! 2.40%! 53.94%! 5.69%!Interactive! 11.65%! 3.75%! 36.10%! 2.40%! 29.11%! 8.96%!Disney!Operations! 8.52%! 3.75%! 36.10%! 2.40%! 11.58%! 7.81%!
Used risk free rate of 2.75% and Disney’s weighted average ERP of 5.75% in estimating cost of equity

75
Investment Analysis
Aswath Damodaran
75
¨ Assume now that you are the CFO of Disney. You are considering an investment in a new theme park. What cost of capital would you use in evaluaCng the theme park?
¨ Would your answer be different if the theme park were in Rio De Janeiro and your analysis were in US dollars?
¨ What if the park is in Rio but your analysis is in $R?
¤ Now assume that you are planning to divest yourself of ESPN. What cost of capital would you use to value ESPN?

76
AcquisiCon ValuaCon
¨ Now assume that Disney is planning to buy Twiner, a firm that by itself cannot service any debt and has a cost of equity of 12%. Disney is planning to borrow half the money for the deal at an axer-‐tax cost of debt of 2.4%. What cost of capital would you use to value Twiner?
a. Disney’s cost of capital (7.81%) b. Disney’s cost of equity (8.52%) c. Twiner’s cost of equity and capital (12%) d. An equally weighted average of Twiner’s cost of equity
and Disney’s cost of debt. (7.2%) e. None of the above f. Any of the above, depending on my agenda.

IN CONCLUSION
Less rules, more first principles

78
Lesson 1: It’s important, but not that important..
¨ The cost of capital is a driver of value but it is not as much of a driver as you think.
¨ This is parCcularly true, with young growth companies and when there is a great deal of uncertainty about the future.
¨ As a general rule, we spend far too much Cme on the cost of capital and far too linle on cash flows and growth rates.

79
Lesson 2: There are many ways of esCmaCng cost of capital, but most of them are wrong or inconsistent
¨ It is true that there are compeCng risk and return models, that a wide variety of esCmaCon pracCces exist for esCmaCng inputs to these model and that there are mulCple data sources for each input.
¨ That does not imply that you have license to mix and match models, pracCces and data sources to get whatever number you want.
¨ Many esCmates of cost of capital are just plain wrong, because they are based on bad data, ignore basic staCsCcal rules or just don’t pass the common sense test.
¨ Other esCmates of cost of capital are internally inconsistent, because they mix and match models and pracCces that were never meant to be mixed.

80
Lesson 3: Just because a pracCce is established does not make it right
¨ There is a valuaCon establishment and it likes wriCng rules that lay out the templates for established or acceptable pracCce.
¨ Those rules are then enforced by legal and regulatory systems that insist that everyone follow the rules.
¨ At some point, the strongest raConale for why we do what we do is that everyone does it and has always done it.
¨ In the legal and regulatory se�ngs, this gets reinforced by the fact that it is easier to defend a bad pracCce of long standing than it is to argue for a bener pracCce.

81
Lesson 4: Watch out for agenda-‐driven (or bias-‐driven) costs of capital
¨ Much as we would like to pose as objecCve analysts with no interest in ClCng the value of a company of an asset one way or the other, once we are paid to do valuaCons, bias will follow.
¨ The strongest determinant of what pracCces you will use to get a cost of capital is that bias that you have to push the value up (or down). ¤ If your bias is upwards (to make value higher), you will find every raConale you can for reducing your cost of capital.
¤ If your bias is downwards (to make value lower), you will find every raConale you can for increasing your cost of capital.