aswath damodaran1 dreaming the impossible dream? market timing aswath damodaran
TRANSCRIPT

Aswath Damodaran 1
Dreaming the impossible dream?
Market Timing
Aswath Damodaran
Aswath Damodaran 2
The Payoff to Market Timing
In a 1986 article, a group of researchers raised the shackles of many an active portfolio manager by estimating that as much as 93.6% of the variation in quarterly performance at professionally managed portfolios could be explained by the mix of stocks, bonds and cash at these portfolios.
In a different study in 1992, Shilling examined the effect on your annual returns of being able to stay out of the market during bad months. He concluded that an investor who would have missed the 50 weakest months of the market between 1946 and 1991 would have seen his annual returns almost double from 11.2% to 19%.
Ibbotson examined the relative importance of asset allocation and security selection of 94 balanced mutual funds and 58 pension funds, all of which had to make both asset allocation and security selection decisions. Using ten years of data through 1998, Ibbotson finds that about 40% of the differences in returns across funds can be explained by their asset allocation decisions and 60% by security selection.
Aswath Damodaran 3
The Cost of Market Timing
In the process of switching from stocks to cash and back, you may miss the best years of the market. In his article on market timing in 1975, Bill Sharpe suggested that unless you can tell a good year from a bad year 7 times out of 10, you should not try market timing. This result is confirmed by Chua, Woodward and To, who use Monte Carlo simulations on the Canadian market and confirm you have to be right 70-80% of the time to break even from market timing.
These studies do not consider the additional transactions costs that inevitably flow from market timing strategies, since you will trade far more extensively with these strategies. At the limit, a stock/cash switching strategy will mean that you will have to liquidate your entire equity portfolio if you decide to switch into cash and start from scratch again the next time you want to be in stocks.
A market timing strategy will also increase your potential tax liabilities. You will have to pay capital gains taxes when you sell your stocks, and over your lifetime as an investor, you will pay far more in taxes.
Aswath Damodaran 4
Market Timing Approaches
Non-financial indicators, which can range the spectrum from the absurd to the reasonable.
Technical indicators, such as price charts and trading volume.
Mean reversion indicators, where stocks and bonds are viewed as mispriced if they trade outside what is viewed as a normal range.
Macro economic variables, such as the level of interest rates or the state of the economy.
Fundamentals such as earnings, cash flows and growth.
Aswath Damodaran 5
I. Non-financial Indicators
Spurious indicators that may seem to be correlated with the market but have no rational basis.
Feel good indicators that measure how happy are feeling - presumably, happier individuals will bid up higher stock prices.
Hype indicators that measure whether there is a stock price bubble.
Aswath Damodaran 6
1. Spurious Indicators
There are a number of indicators such as who wins the Super Bowl that claim to predict stock market movements.
There are three problems with these indicators:• We disagree that chance cannot explain this
phenomenon. When you have hundreds of potential indicators that you can use to time markets, there will be some that show an unusually high correlation purely by chance.
• A forecast of market direction (up or down) does not really qualify as market timing, since how much the market goes up clearly does make a difference.
• You should always be cautious when you can find no economic link between a market timing indicator and the market.
Aswath Damodaran 7
2. Feel Good Indicators
When people feel optimistic about the future, it is not just stock prices that are affected by this optimism. Often, there are social consequences as well, with styles and social mores affected by the fact that investors and consumers feel good about the economy.
It is not surprising, therefore, that people have discovered linkages between social indicators and Wall Street. You should expect to see a high correlation between demand at highly priced restaurants at New York City (or wherever young investment bankers and traders go) and the market.
The problem with feel good indicators, in general, is that they tend to be contemporaneous or lagging rather than leading indicators.
Aswath Damodaran 8
3. Hype Indicators
An example: The “cocktail party chatter” indicator tracks three measures – the time elapsed at a party before talk turns to stocks, the average age of the people discussing stocks and the fad component of the chatter. According to the indicator, the less time it takes for the talk to turn to stocks, the lower the average age of the market discussants and the greater the fad component, the more negative you should be about future stock price movements.
As investors increasingly turn to social media, researchers are probing the data that is coming from these forums to see if they can used to get a sense of market mood. A study of ten million tweets in 2008 found that a relationship between the collective mood on the tweets predicted stock price movements.
There are limitations with these indicators• Defining what constitutes abnormal can be tricky in a world where
standards and tastes are shifting. • Even if we decide that there is an abnormally high interest in the
market today and you conclude (based upon the hype indicators) that stocks are over valued, there is no guarantee that stocks will not get more overvalued before the correction occurs.
Aswath Damodaran 9
II. Technical Indicators
Past prices• Price reversals or momentum• The January Indicator
Trading Volume Market Volatility Other price and sentiment indicators
Aswath Damodaran 10
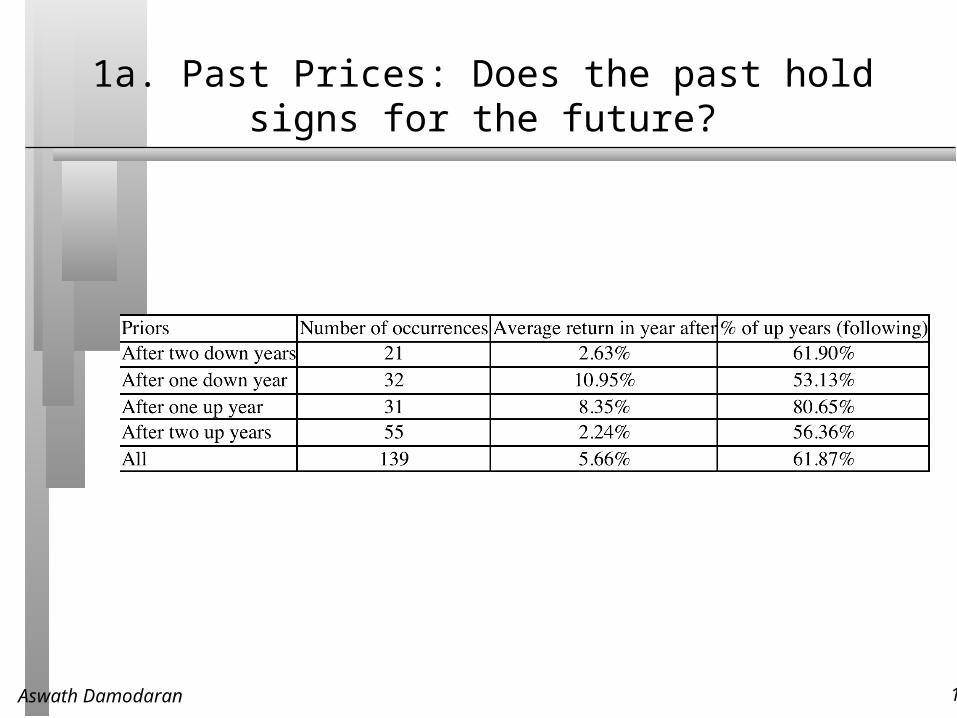
1a. Past Prices: Does the past hold signs for the future?
Aswath Damodaran 11
1b. The January Indicator
As January goes, so goes the year – if stocks are up, the market will be up for the year, but a bad beginning usually precedes a poor year.
According to the venerable Stock Trader’s Almanac that is compiled every year by Yale Hirsch, this indicator has worked 88% of the time.
Note, though that if you exclude January from the year’s returns and compute the returns over the remaining 11 months of the year, the signal becomes much weaker and returns are negative only 50% of the time after a bad start in January. Thus, selling your stocks after stocks have gone down in January may not protect you from poor returns.
Aswath Damodaran 12
2a. Trading Volume
Price increases that occur without much trading volume are viewed as less likely to carry over into the next trading period than those that are accompanied by heavy volume.
At the same time, very heavy volume can also indicate turning points in markets. For instance, a drop in the index with very heavy trading volume is called a selling climax and may be viewed as a sign that the market has hit bottom. This supposedly removes most of the bearish investors from the mix, opening the market up presumably to more optimistic investors. On the other hand, an increase in the index accompanied by heavy trading volume may be viewed as a sign that market has topped out.
Another widely used indicator looks at the trading volume on puts as a ratio of the trading volume on calls. This ratio, which is called the put-call ratio is often used as a contrarian indicator. When investors become more bearish, they sell more puts and this (as the contrarian argument goes) is a good sign for the future of the market.
Aswath Damodaran 13
2b. Money Flow
Money flow is the difference between uptick volume and downtick volume, as predictor of market movements. An increase in the money flow is viewed as a positive signal for future market movements whereas a decrease is viewed as a bearish signal.
Using daily money flows from July 1997 to June 1998, Bennett and Sias find that money flow is highly correlated with returns in the same period, which is not surprising. While they find no predictive ability with short period returns – five day returns are not correlated with money flow in the previous five days – they do find some predictive ability for longer periods. With 40-day returns and money flow over the prior 40 days, for instance, there is a link between high money flow and positive stock returns.
Chan, Hameed and Tong extend this analysis to global equity markets. They find that equity markets show momentum – markets that have done well in the recent past are more likely to continue doing well,, whereas markets that have done badly remain poor performers. However, they find that the momentum effect is stronger for equity markets that have high trading volume and weaker in markets with low trading volume.
Aswath Damodaran 14
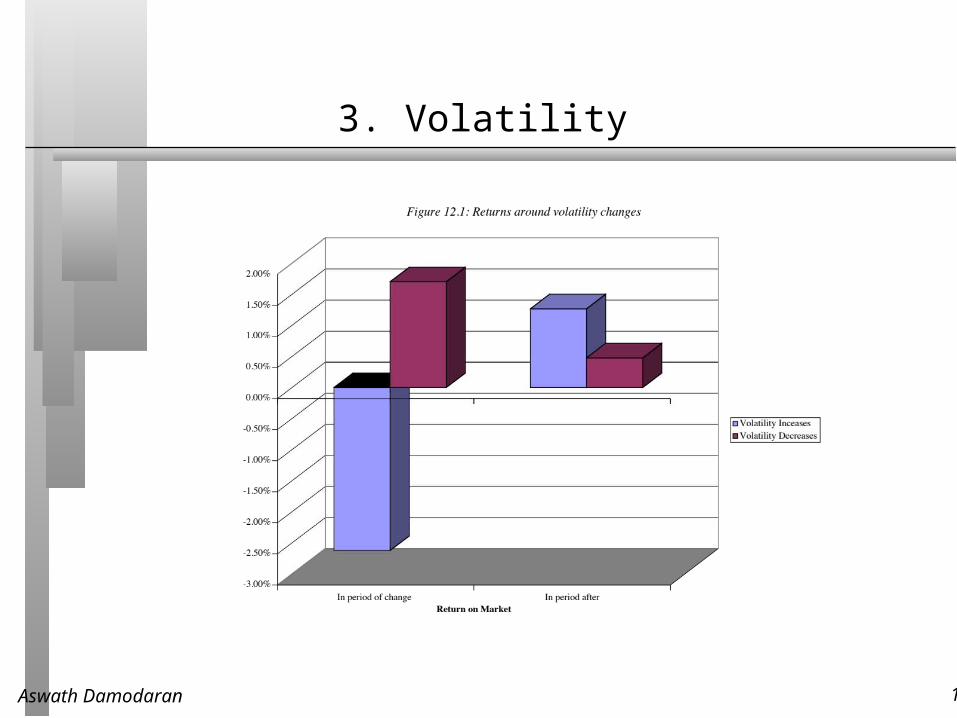
3. Volatility
Aswath Damodaran 15
4. Other Indicators
Price indicators include many of the pricing patterns that we discussed in chapter 8. Just as support and resistance lines and trend lines are used to determine when to move in and out of individual stocks, they are also used to decide when to move in and out of the stock market.
Sentiment indicators try to measure the mood of the market. One widely used measure is the confidence index which is defined to be the ratio of the yield on BBB rated bonds to the yield on AAA rated bonds. If this ratio increases, investors are becoming more risk averse or at least demanding a higher price for taking on risk, which is negative for stocks.
Another indicator that is viewed as bullish for stocks is aggregate insider buying of stocks. When this measure increases, according to its proponents, stocks are more likely to go up. Other sentiment indicators include mutual fund cash positions and the degree of bullishness among investment advisors/newsletters. These are often used as contrarian indicators – an increase in cash in the hands of mutual funds and more bearish market views among mutual funds is viewed as bullish signs for stock prices.
Aswath Damodaran 16
III. Mean Reversion Measures
These approaches are based upon the assumption that assets have a normal range that they trade at, and that any deviation from the normal range is an indication that assets are mispriced.
With stocks, the normal range is defined in terms of PE ratios.
With bonds, the normal range is defined in terms of interest rates.
Aswath Damodaran 17
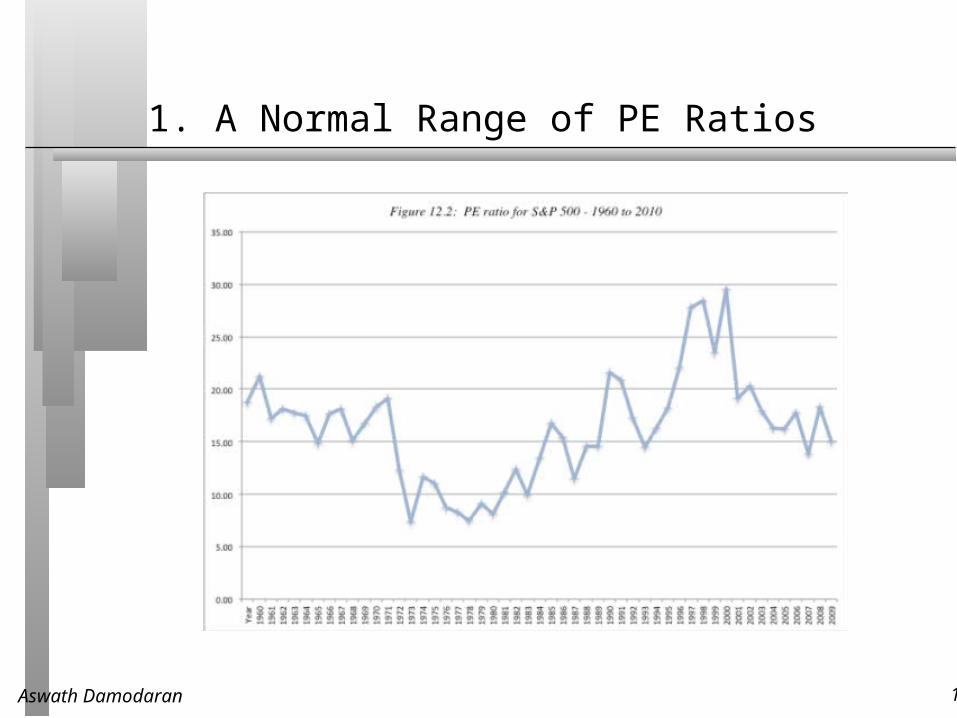
1. A Normal Range of PE Ratios
Aswath Damodaran 18
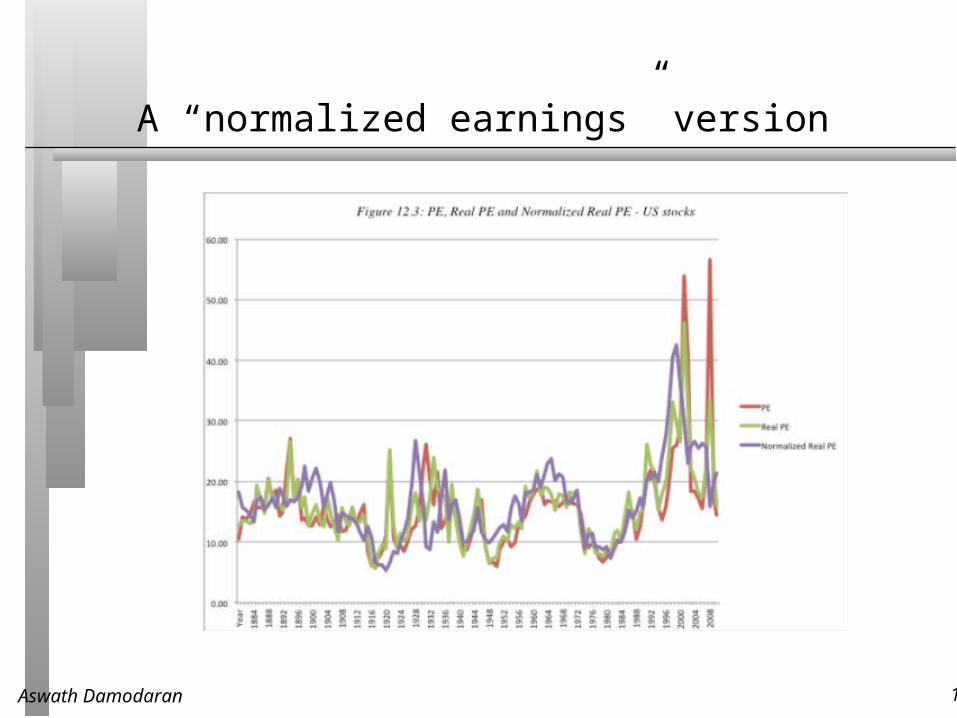
A “normalized earnings” version
Aswath Damodaran 19
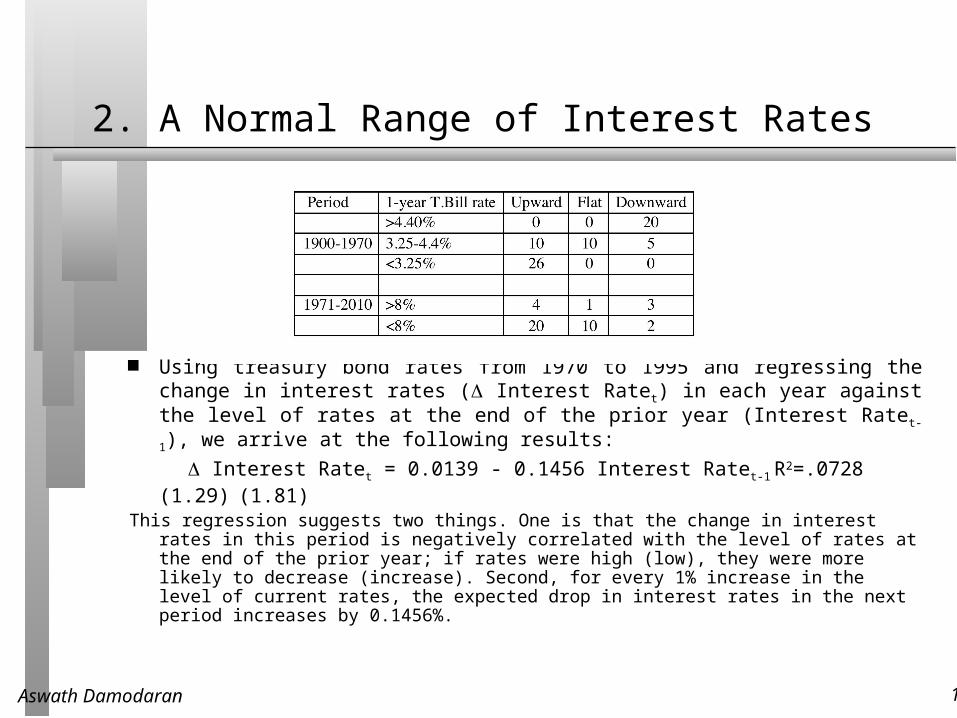
2. A Normal Range of Interest Rates
Using treasury bond rates from 1970 to 1995 and regressing the change in interest rates ( Interest Ratet) in each year against the level of rates at the end of the prior year (Interest Ratet-1), we arrive at the following results:
Interest Ratet = 0.0139 - 0.1456 Interest Ratet-1 R2=.0728(1.29) (1.81)
This regression suggests two things. One is that the change in interest rates in this period is negatively correlated with the level of rates at the end of the prior year; if rates were high (low), they were more likely to decrease (increase). Second, for every 1% increase in the level of current rates, the expected drop in interest rates in the next period increases by 0.1456%.
Aswath Damodaran 20
IV. Fundamentals
The simplest way to use fundamentals is to focus on macroeconomic variables such as interest rates, inflation and GNP growth and devise investing rules based upon the levels or changes in macro economic variables.• Intrinsic valuation models: Just as you value
individual companies, you can value the entire market.
• Relative valuation models: You can value markets relative to how they were priced in prior periods or relative to other markets.
Aswath Damodaran 21
Macroeconomic Variables
Over time, a number of rules of thumb have been devised that relate stock returns to the level of interest rates or the strength of the economy.
For instance, we are often told that it is best to buy stocks when• Treasury bill rates are low• Treasury bond rates have dropped• GNP growth is strong
Aswath Damodaran 22
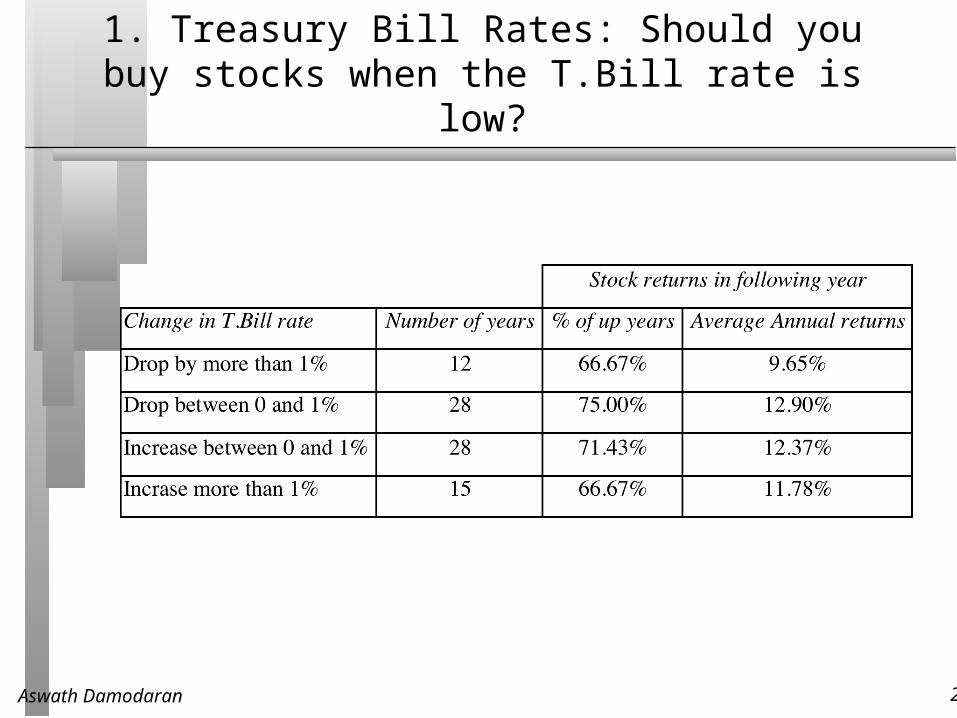
1. Treasury Bill Rates: Should you buy stocks when the T.Bill rate is
low?
Aswath Damodaran 23
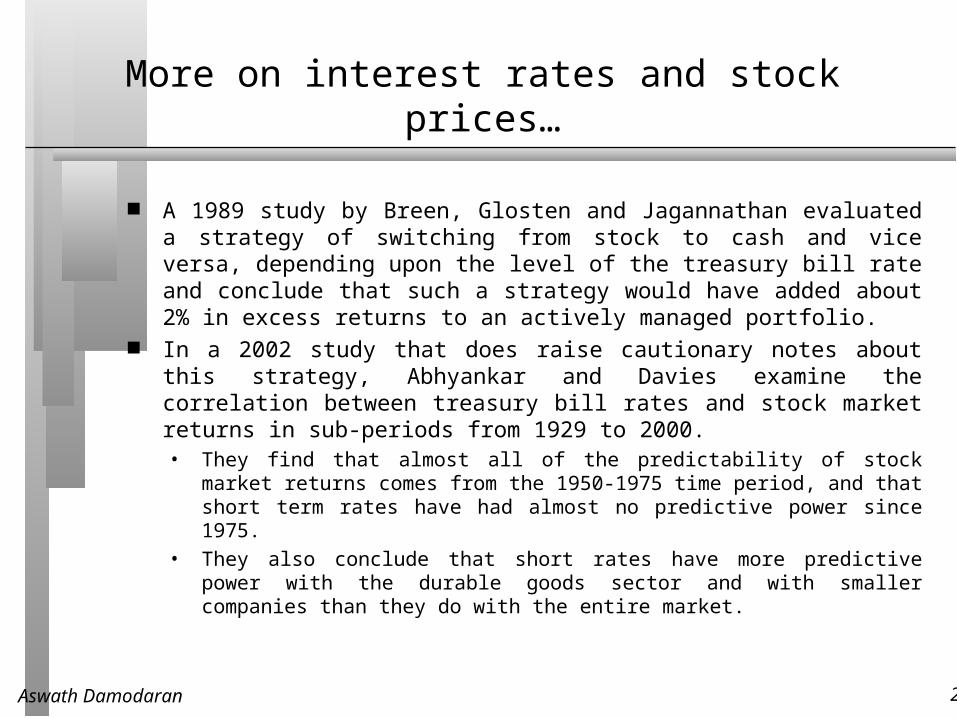
More on interest rates and stock prices…
A 1989 study by Breen, Glosten and Jagannathan evaluated a strategy of switching from stock to cash and vice versa, depending upon the level of the treasury bill rate and conclude that such a strategy would have added about 2% in excess returns to an actively managed portfolio.
In a 2002 study that does raise cautionary notes about this strategy, Abhyankar and Davies examine the correlation between treasury bill rates and stock market returns in sub-periods from 1929 to 2000. • They find that almost all of the predictability of stock
market returns comes from the 1950-1975 time period, and that short term rates have had almost no predictive power since 1975.
• They also conclude that short rates have more predictive power with the durable goods sector and with smaller companies than they do with the entire market.
Aswath Damodaran 24
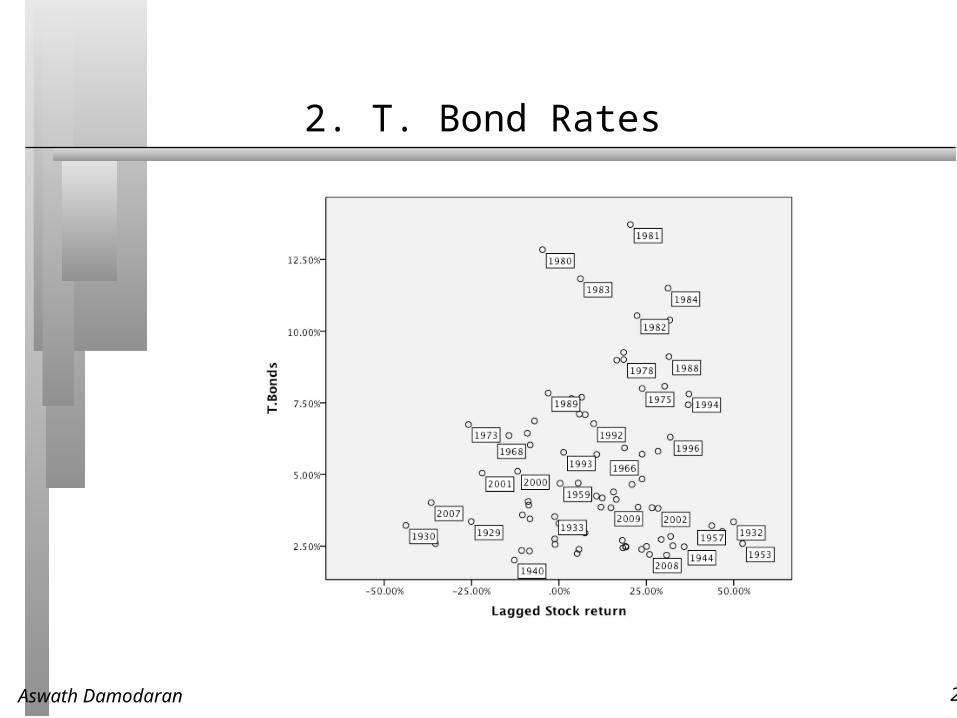
2. T. Bond Rates
Aswath Damodaran 25
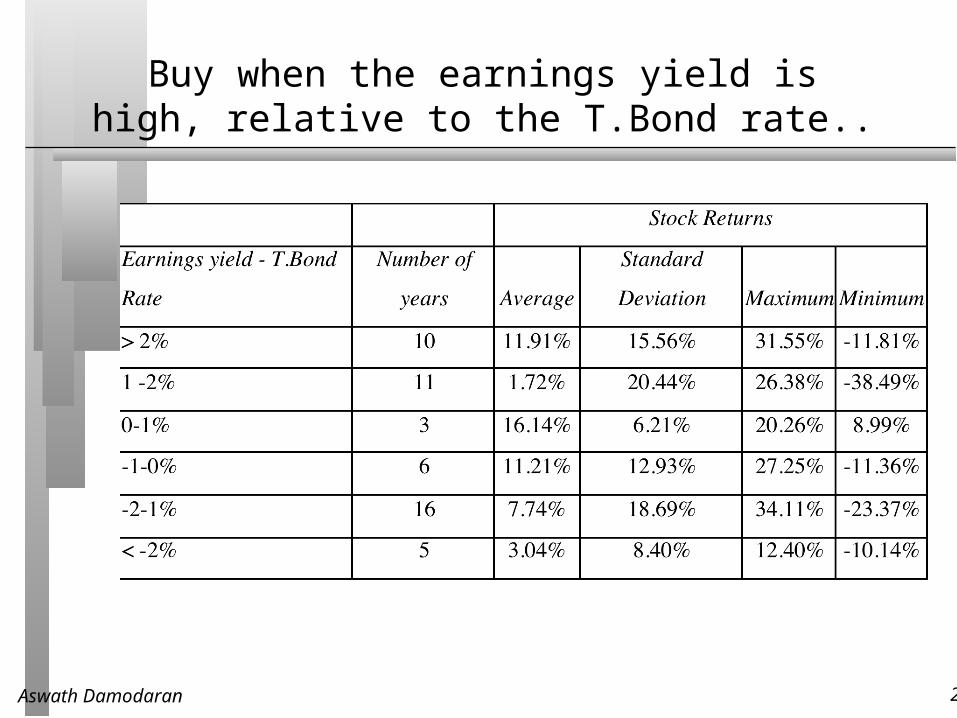
Buy when the earnings yield is high, relative to the T.Bond rate..
Aswath Damodaran 26
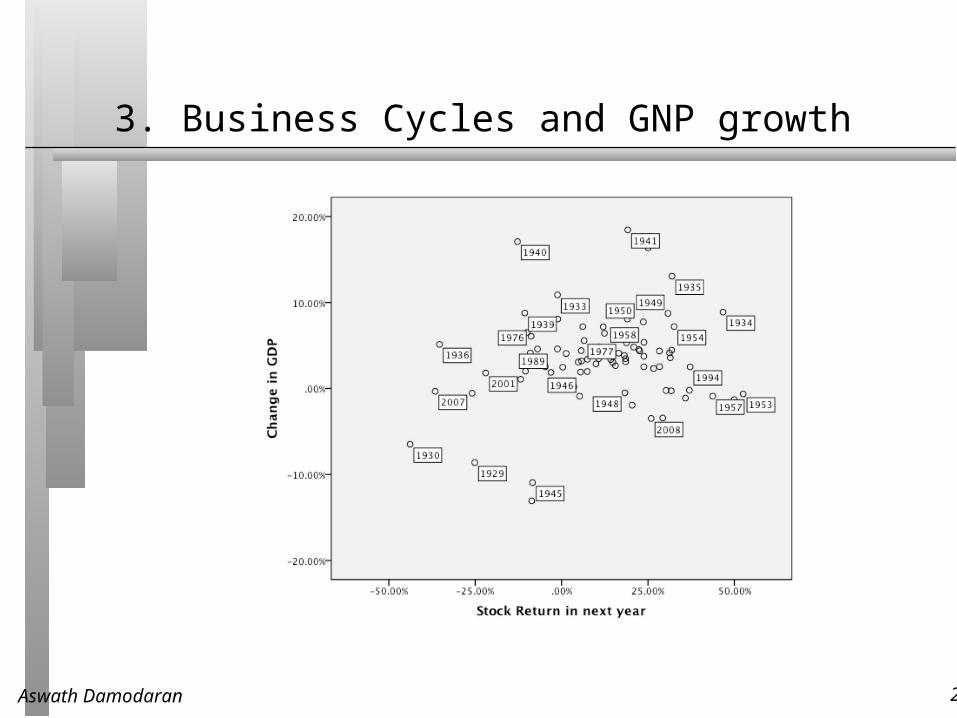
3. Business Cycles and GNP growth
Aswath Damodaran 27
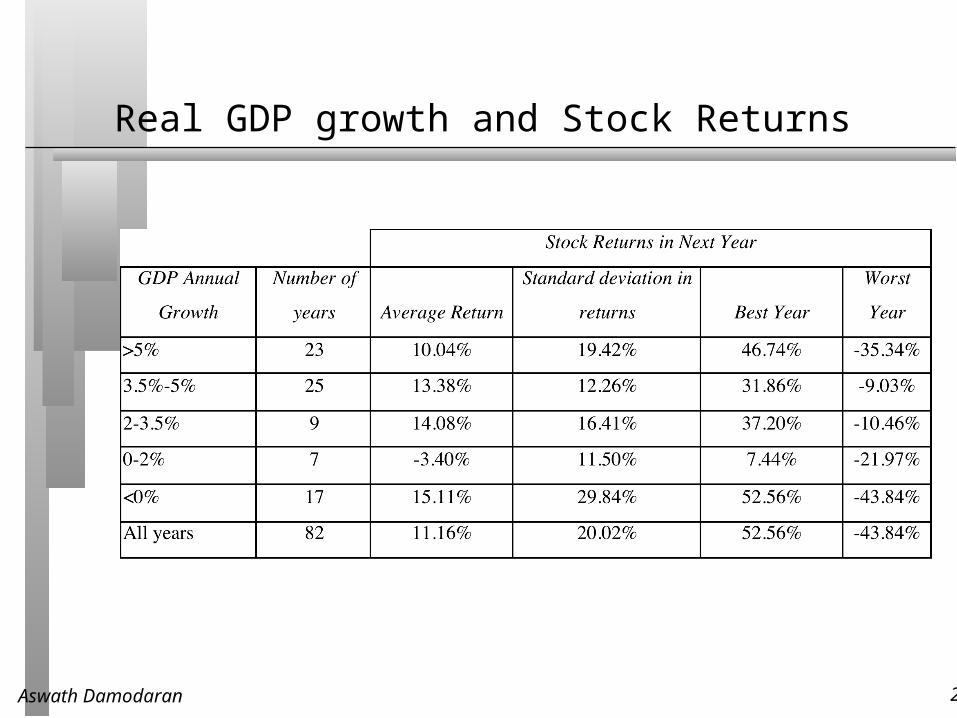
Real GDP growth and Stock Returns
Aswath Damodaran 28
Intrinsic Value: Valuing the S&P 500
On January 1, 2011, the S&P 500 was trading at 1257.64 and the dividends plus buybacks on the index amounted to 53.96 over the previous year.
On the same date, analysts were estimating an expected growth rate of 6.95% in earnings for the index for the following five years. Beyond year 5, the expected growth rate is expected to be 3.29%, the nominal growth rate in the economy (set equal to the risk free rate).
The treasury bond rate was 3.29% and we will use a market risk premium of 5%, leading to a cost of equity of 8.29%. (The beta for the S&P 500 is assumed to be one)
Aswath Damodaran 29
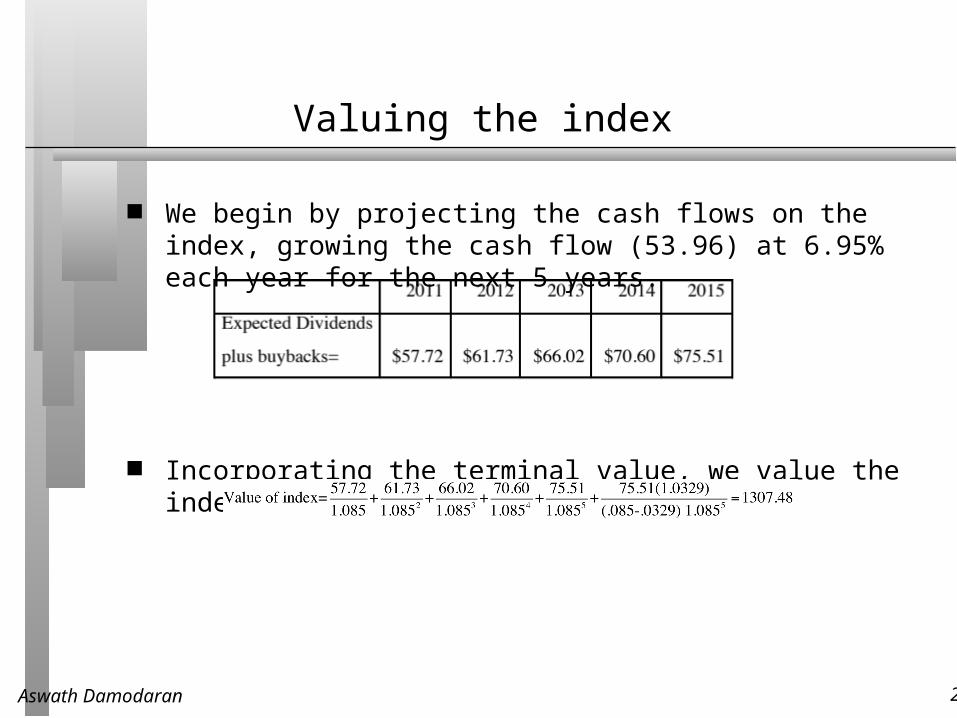
Valuing the index
We begin by projecting the cash flows on the index, growing the cash flow (53.96) at 6.95% each year for the next 5 years.
Incorporating the terminal value, we value the index at 1307.48.
Aswath Damodaran 30
How well do intrinsic valuation models work?
Generally speaking, the odds of succeeding increase as the quality of your inputs improves and your time horizon lengthens. Eventually, markets seem to revert back to intrinsic value but eventually can be a long time coming.
There is, however, a significant cost associated with using intrinsic valuation models when they find equity markets to be overvalued. If you take the logical next step of not investing in stocks when they are overvalued, you will have to invest your funds in either other securities that you believe are fairly valued (such as short term government securities) or in other asset classes. In the process, you may end up out of the stock market for extended periods while the market is, in fact, going up.
The problem with intrinsic value models is their failure to capture permanent shifts in attitudes towards risk or investor characteristics. This is because so many of the inputs for these models come from looking at the past.
Aswath Damodaran 31
Relative Valuation Models
In relative value models, you examine how markets are priced relative to other markets and to fundamentals.
While it shares some characteristics with intrinsic valuation models, this approach is less rigid, insofar as it does not require that you work within the structure of a discounted cashflow model.
Instead, you either make comparisons of markets over time (the S&P in 2010 versus the S&P in 1990) or different markets at the same point in time (U.S. stocks in 2010 versus European stocks in 2002).
Aswath Damodaran 32
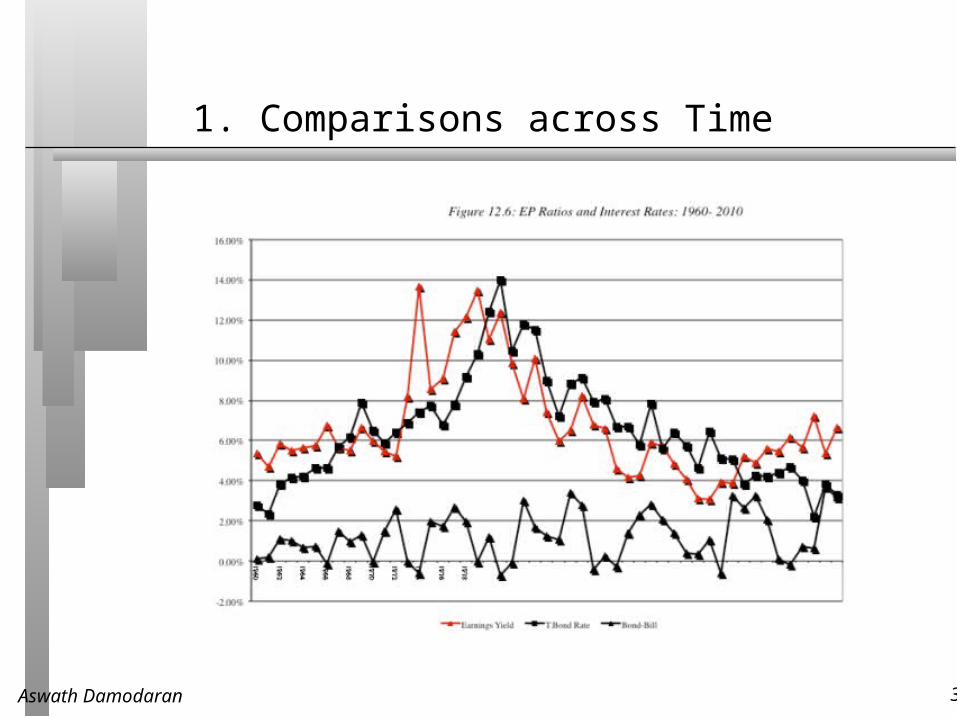
1. Comparisons across Time
Aswath Damodaran 33
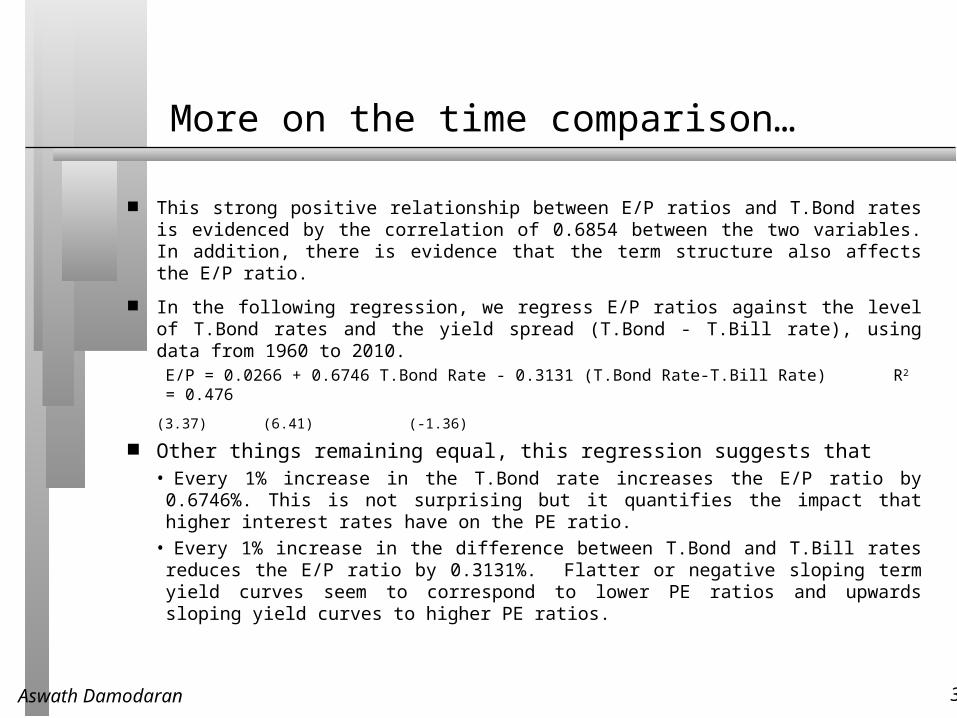
More on the time comparison…
This strong positive relationship between E/P ratios and T.Bond rates is evidenced by the correlation of 0.6854 between the two variables. In addition, there is evidence that the term structure also affects the E/P ratio.
In the following regression, we regress E/P ratios against the level of T.Bond rates and the yield spread (T.Bond - T.Bill rate), using data from 1960 to 2010.E/P = 0.0266 + 0.6746 T.Bond Rate - 0.3131 (T.Bond Rate-T.Bill Rate)R2 = 0.476
(3.37) (6.41) (-1.36) Other things remaining equal, this regression suggests that
• Every 1% increase in the T.Bond rate increases the E/P ratio by 0.6746%. This is not surprising but it quantifies the impact that higher interest rates have on the PE ratio.• Every 1% increase in the difference between T.Bond and T.Bill rates reduces the E/P ratio by 0.3131%. Flatter or negative sloping term yield curves seem to correspond to lower PE ratios and upwards sloping yield curves to higher PE ratios.
Aswath Damodaran 34
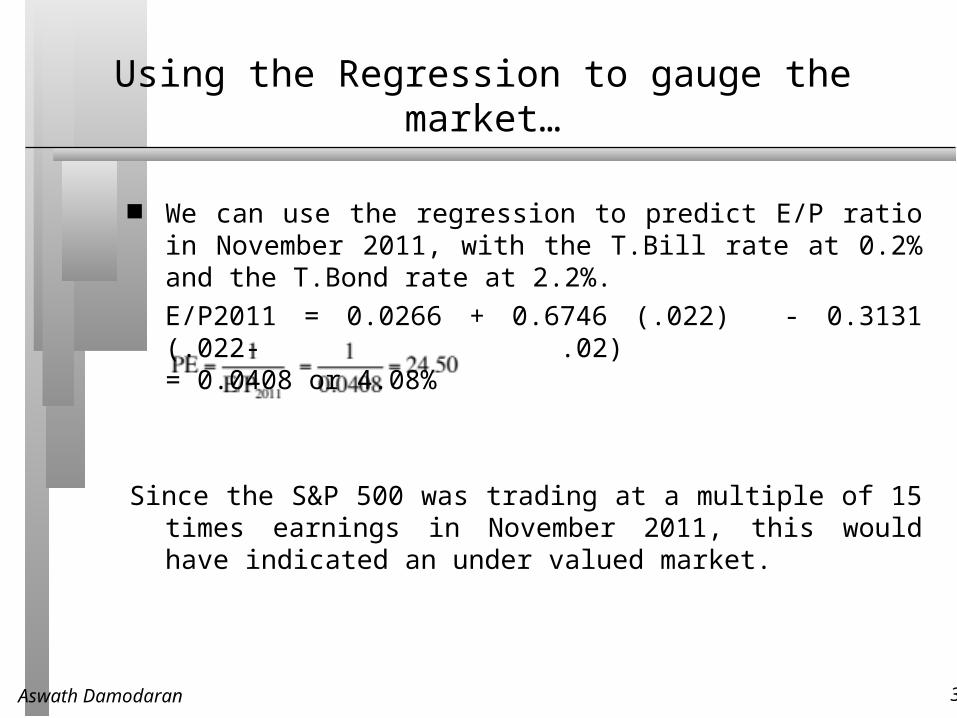
Using the Regression to gauge the market…
We can use the regression to predict E/P ratio in November 2011, with the T.Bill rate at 0.2% and the T.Bond rate at 2.2%.E/P2011 = 0.0266 + 0.6746 (.022) - 0.3131 (.022- .02) = 0.0408 or 4.08%
Since the S&P 500 was trading at a multiple of 15 times earnings in November 2011, this would have indicated an under valued market.
Aswath Damodaran 35
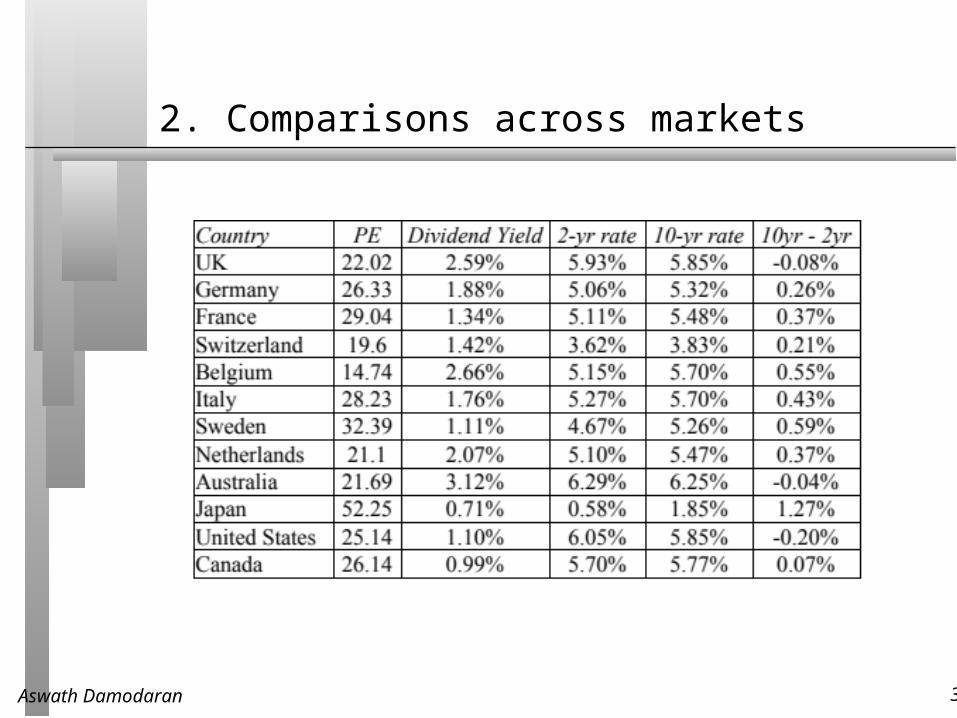
2. Comparisons across markets
Aswath Damodaran 36
A closer look at PE ratios
A naive comparison of PE ratios suggests that Japanese stocks, with a PE ratio of 52.25, are overvalued, while Belgian stocks, with a PE ratio of 14.74, are undervalued.
There is, however, a strong negative correlation between PE ratios and 10-year interest rates (-0.73) and a positive correlation between the PE ratio and the yield spread (0.70).
A cross-sectional regression of PE ratio on interest rates and expected growth yields the following.PE = 42.62 – 360.9 (10-year rate) + 846.6 (10-year – 2-
year ) R2=59%(2.78) (-1.42) (1.08)
Aswath Damodaran 37
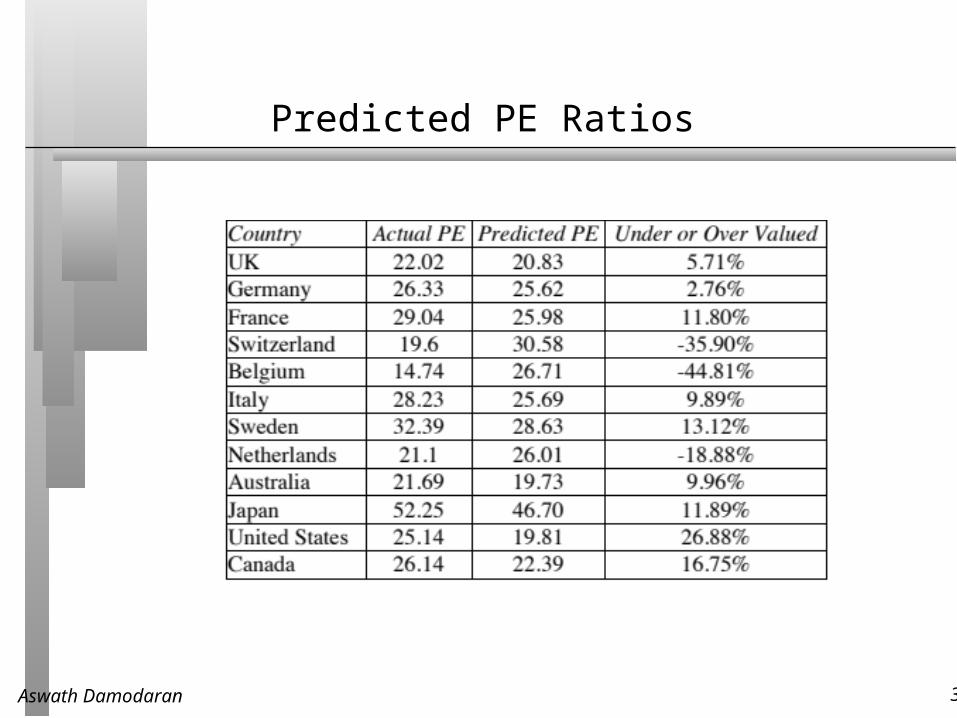
Predicted PE Ratios
Aswath Damodaran 38
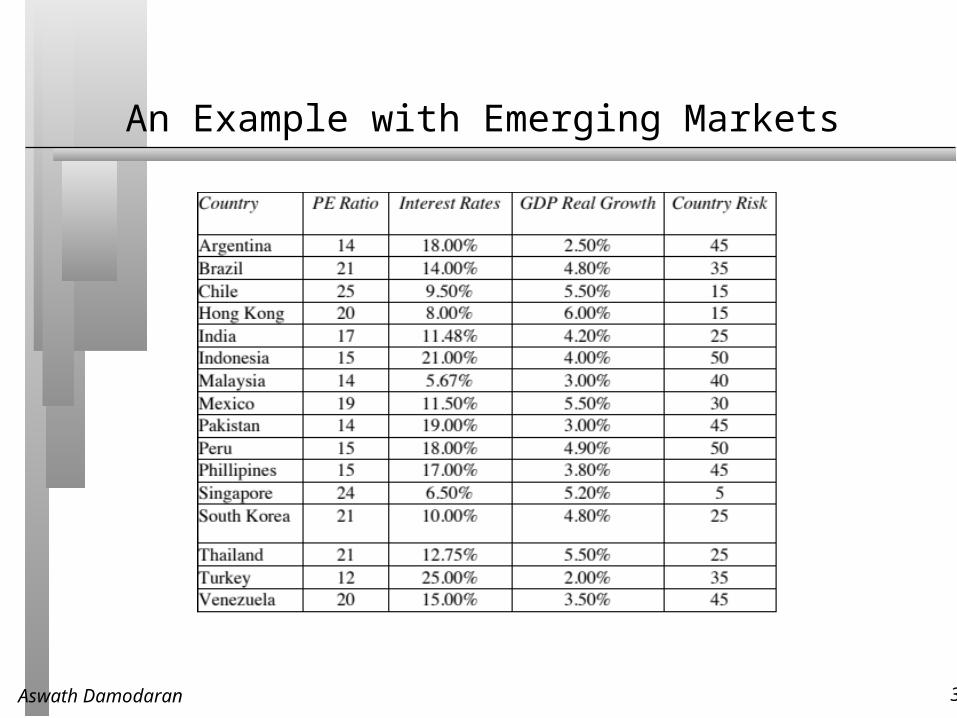
An Example with Emerging Markets
Aswath Damodaran 39
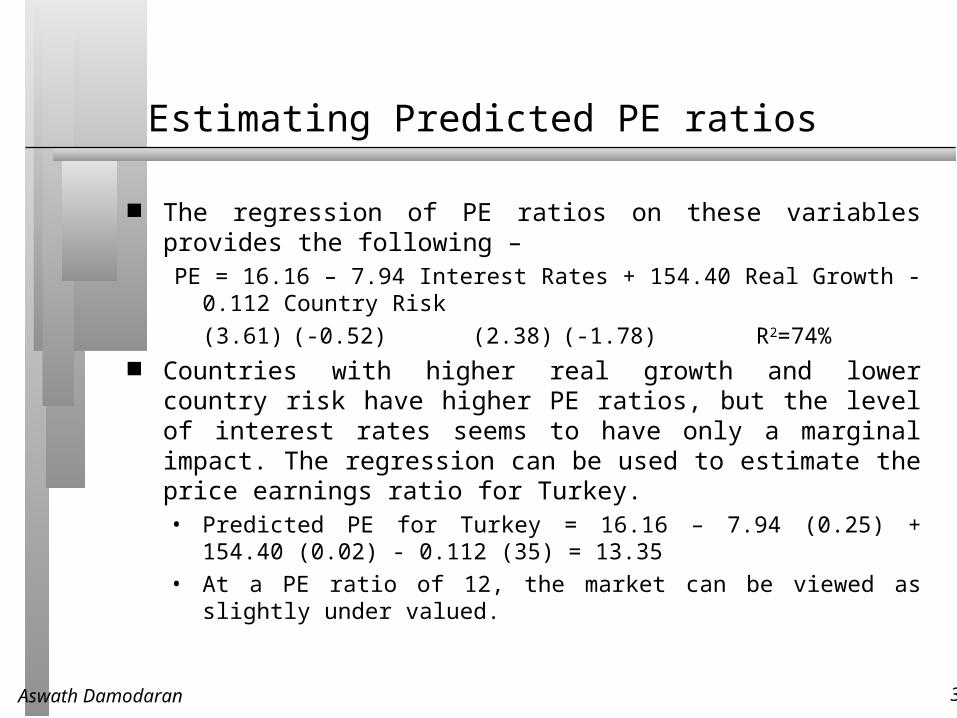
Estimating Predicted PE ratios
The regression of PE ratios on these variables provides the following –PE = 16.16 – 7.94 Interest Rates + 154.40 Real Growth -
0.112 Country Risk(3.61) (-0.52) (2.38) (-1.78) R2=74%
Countries with higher real growth and lower country risk have higher PE ratios, but the level of interest rates seems to have only a marginal impact. The regression can be used to estimate the price earnings ratio for Turkey.• Predicted PE for Turkey = 16.16 – 7.94 (0.25) + 154.40
(0.02) - 0.112 (35) = 13.35• At a PE ratio of 12, the market can be viewed as
slightly under valued.
Aswath Damodaran 40
Determinants of Success at using Fundamentals in Market Timing
This approach has two limitations: Since you are basing your analysis by looking at the
past, you are assuming that there has not been a significant shift in the underlying relationship. As Wall Street would put it, paradigm shifts wreak havoc on these models.
Even if you assume that the past is prologue and that there will be reversion back to historic norms, you do not control this part of the process..
How can you improve your odds of success? • You can try to incorporate into your analysis those
variables that reflect the shifts that you believe have occurred in markets.
• You can have a longer time horizon, since you improve your odds on convergence.
Aswath Damodaran 41
The Evidence on Market Timing
Mutual Fund Managers constantly try to time markets by changing the amount of cash that they hold in the fund. If they are bullish, the cash balances decrease. If they are bearish, the cash balances increase.
Investment Newsletters often take bullish or bearish views about the market.
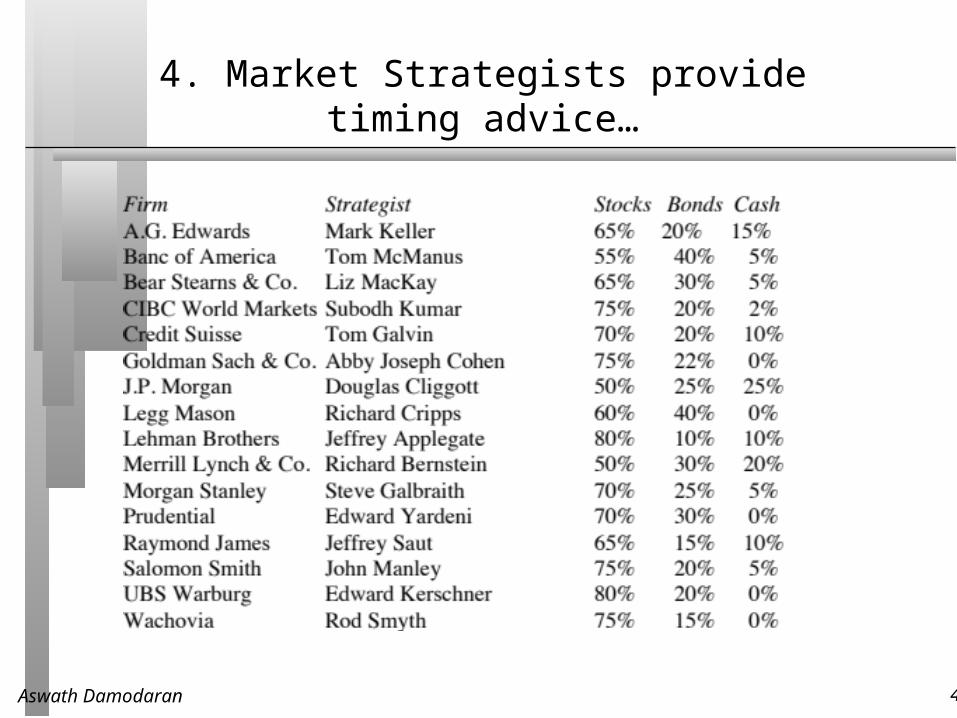
Market Strategists at investment banks make their forecasts for the overall market.
Aswath Damodaran 42
1. Mutual Fund Managers
While most mutual funds don’t claim to do market timing, they implicitly do so by holding more of the fund in cash (when they are bearish) or less in cash (when they are bullish).
Some mutual funds do try to time markets. They are called tactical asset allocation funds.
Aswath Damodaran 43
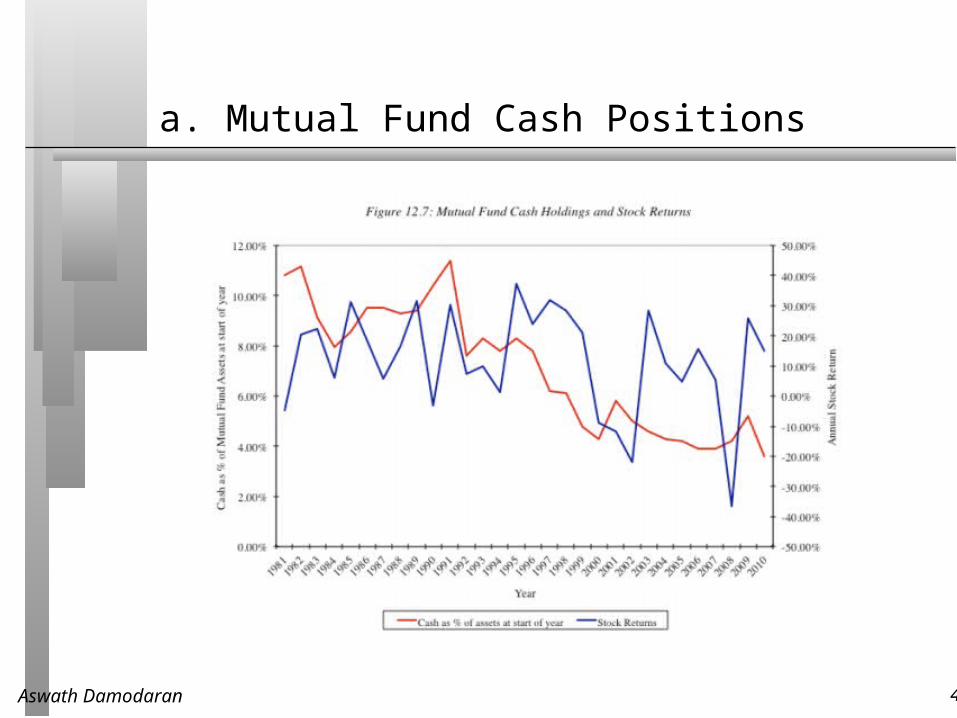
a. Mutual Fund Cash Positions
Aswath Damodaran 44
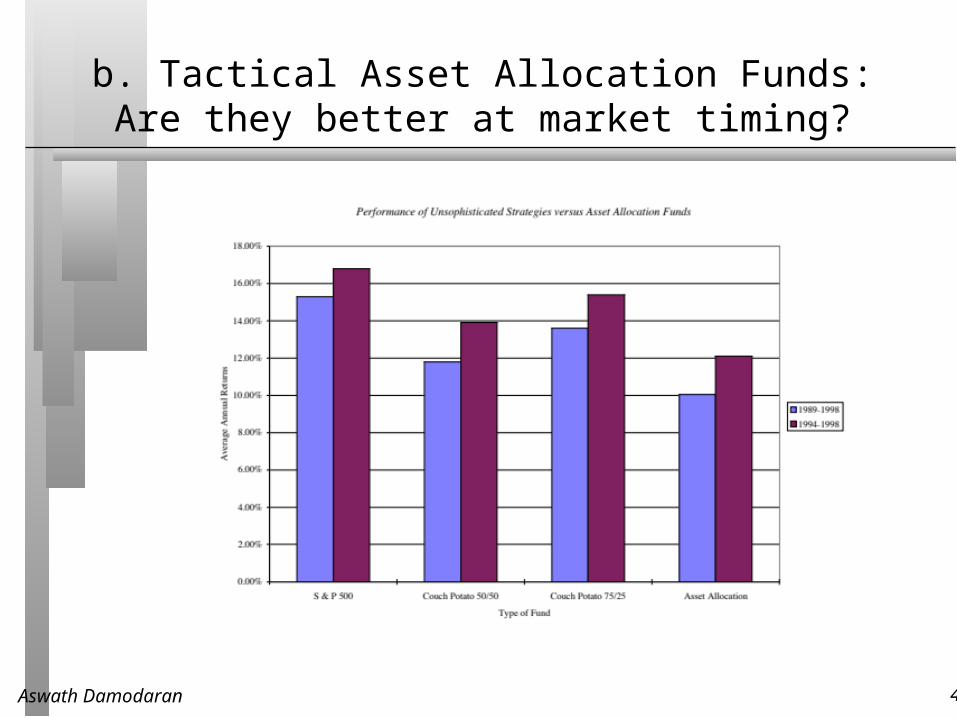
b. Tactical Asset Allocation Funds: Are they better at market timing?
Aswath Damodaran 45
2. Hedge Funds
A paper looking at the ability of hedge funds to time markets in their focus groups (which may be commodities, currencies, fixed income or arbitrage) found some evidence (albeit not overwhelming) of market timing payoff in bond and currency markets but none in equity markets.
In contrast, a more recent and comprehensive evaluation of just 221 market timing hedge funds found evidence that a few of these funds are able to time both market direction and volatility, and generate abnormal returns as a consequence.
There is also evidence that what separates successful hedge funds from those that fail is their capacity to adjust market exposure ahead of market liquidity changes, reducing exposure prior to periods of high illiquidity. The funds that do this best outperform funds that are don’t make the adjustment by 3.6-4.9% a year after adjusting for risk.
Aswath Damodaran 46
3. Investment Newsletters
Campbell and Harvey (1996) examined the market timing abilities of investment newsletters by examining the stock/cash mixes recommended in 237 newsletters from 1980 to 1992. • If investment newsletters are good market timers, you should
expect to see the proportion allocated to stocks increase prior to the stock market going up. When the returns earned on the mixes recommended in these newsletters is compared to a buy and hold strategy, 183 or the 237 newsletters (77%) delivered lower returns than the buy and hold strategy.
• One measure of the ineffectuality of the market timing recommendations of these investment newsletters lies in the fact that while equity weights increased 58% of the time before market upturns, they also increased by 53% before market downturns.
• There is some evidence of continuity in performance, but the evidence is much stronger for negative performance than for positive. In other words, investment newsletters that give bad advice on market timing are more likely to continue to give bad advice than are newsletters that gave good advice to continue giving good advice.
Aswath Damodaran 47
Some hope? Professional Market Timers
Professional market timers provide explicit timing recommendations only to their clients, who then adjust their portfolios accordingly - shifting money into stocks if they are bullish and out of stocks if they are bearish.
A study by Chance and Hemler (2001) looked at 30 professional market timers who were monitored by MoniResearch Corporation, a service monitors the performance of such advisors, and found evidence of market timing ability.
It should be noted that the timing calls were both short term and frequent. One market timer had a total of 303 timing signals between 1989 and 1994, and there were, on average, about 15 signals per year across all 30 market timers. Notwithstanding the high transactions costs associated with following these timing signals, following their recommendations would have generated excess returns for investors.
Aswath Damodaran 48
4. Market Strategists provide timing advice…
Aswath Damodaran 49
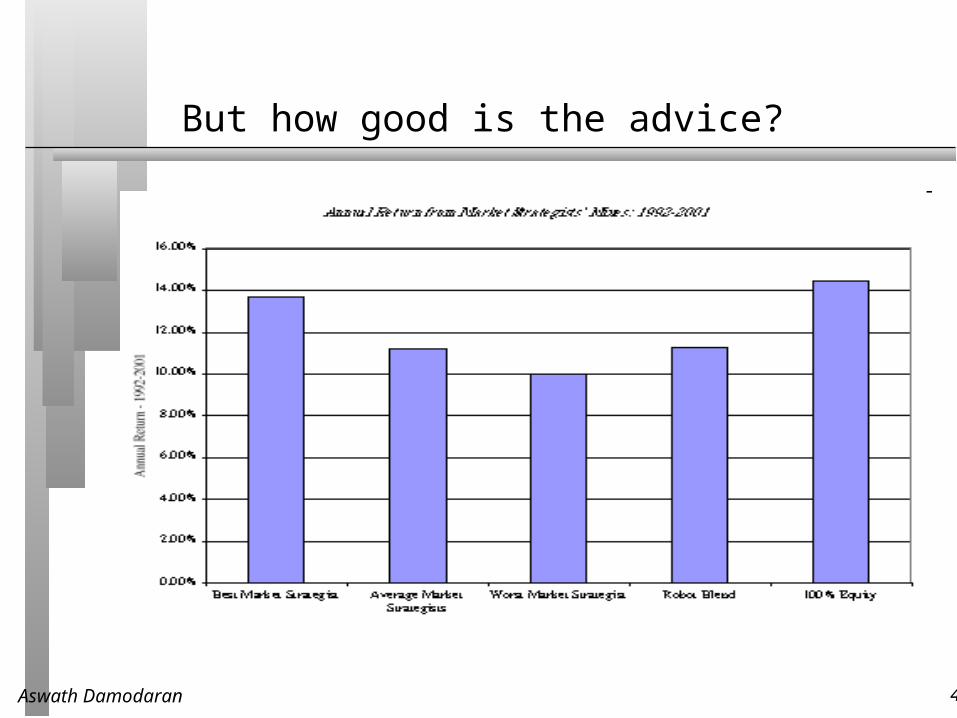
But how good is the advice?
Aswath Damodaran 50
Market timing Strategies
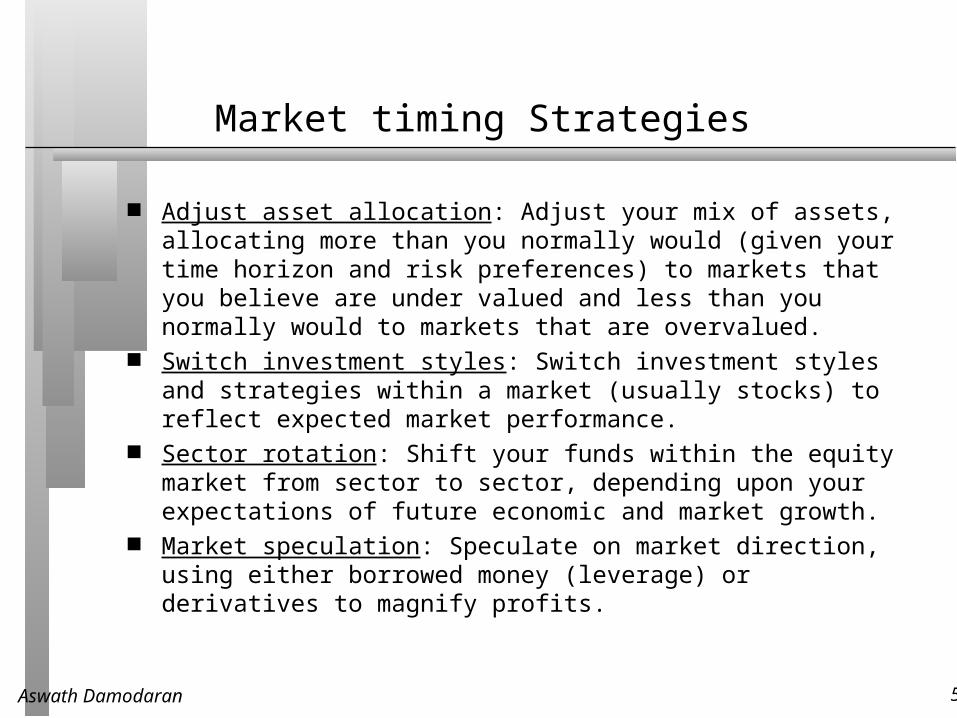
Adjust asset allocation: Adjust your mix of assets, allocating more than you normally would (given your time horizon and risk preferences) to markets that you believe are under valued and less than you normally would to markets that are overvalued.
Switch investment styles: Switch investment styles and strategies within a market (usually stocks) to reflect expected market performance.
Sector rotation: Shift your funds within the equity market from sector to sector, depending upon your expectations of future economic and market growth.
Market speculation: Speculate on market direction, using either borrowed money (leverage) or derivatives to magnify profits.
Aswath Damodaran 51
1. Asset Allocation Changes
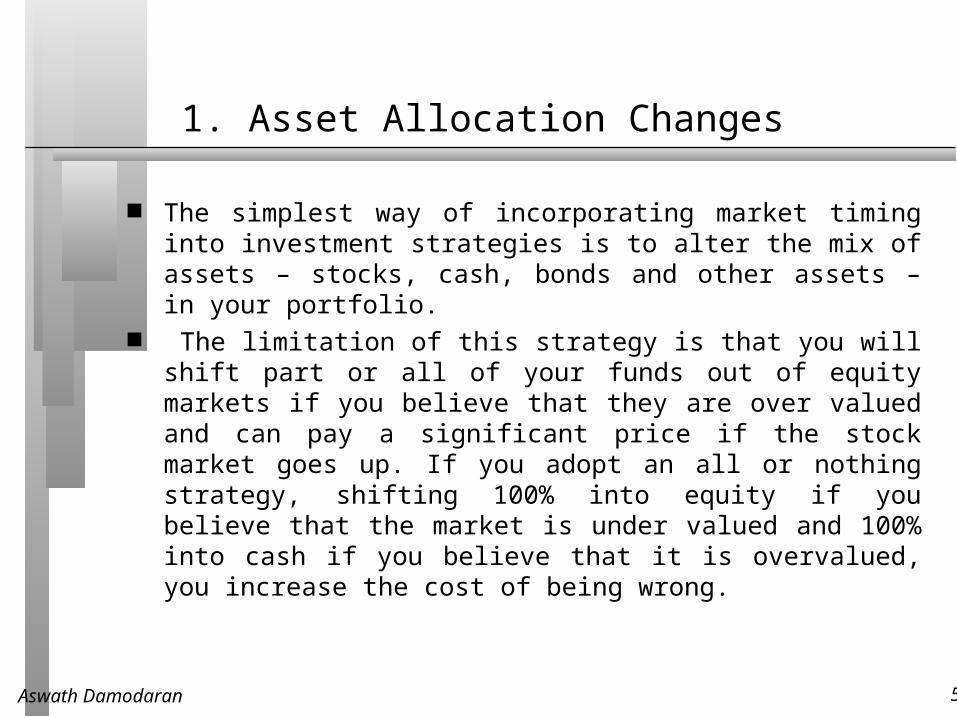
The simplest way of incorporating market timing into investment strategies is to alter the mix of assets – stocks, cash, bonds and other assets – in your portfolio.
The limitation of this strategy is that you will shift part or all of your funds out of equity markets if you believe that they are over valued and can pay a significant price if the stock market goes up. If you adopt an all or nothing strategy, shifting 100% into equity if you believe that the market is under valued and 100% into cash if you believe that it is overvalued, you increase the cost of being wrong.
Aswath Damodaran 52
2. Style Switching
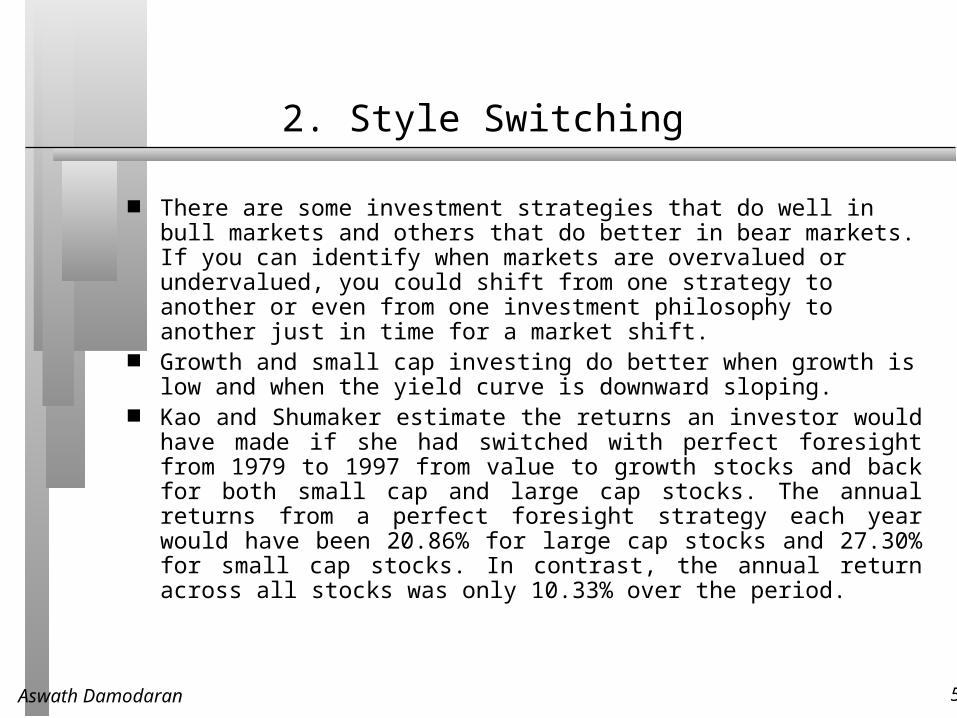
There are some investment strategies that do well in bull markets and others that do better in bear markets. If you can identify when markets are overvalued or undervalued, you could shift from one strategy to another or even from one investment philosophy to another just in time for a market shift.
Growth and small cap investing do better when growth is low and when the yield curve is downward sloping.
Kao and Shumaker estimate the returns an investor would have made if she had switched with perfect foresight from 1979 to 1997 from value to growth stocks and back for both small cap and large cap stocks. The annual returns from a perfect foresight strategy each year would have been 20.86% for large cap stocks and 27.30% for small cap stocks. In contrast, the annual return across all stocks was only 10.33% over the period.
Aswath Damodaran 53
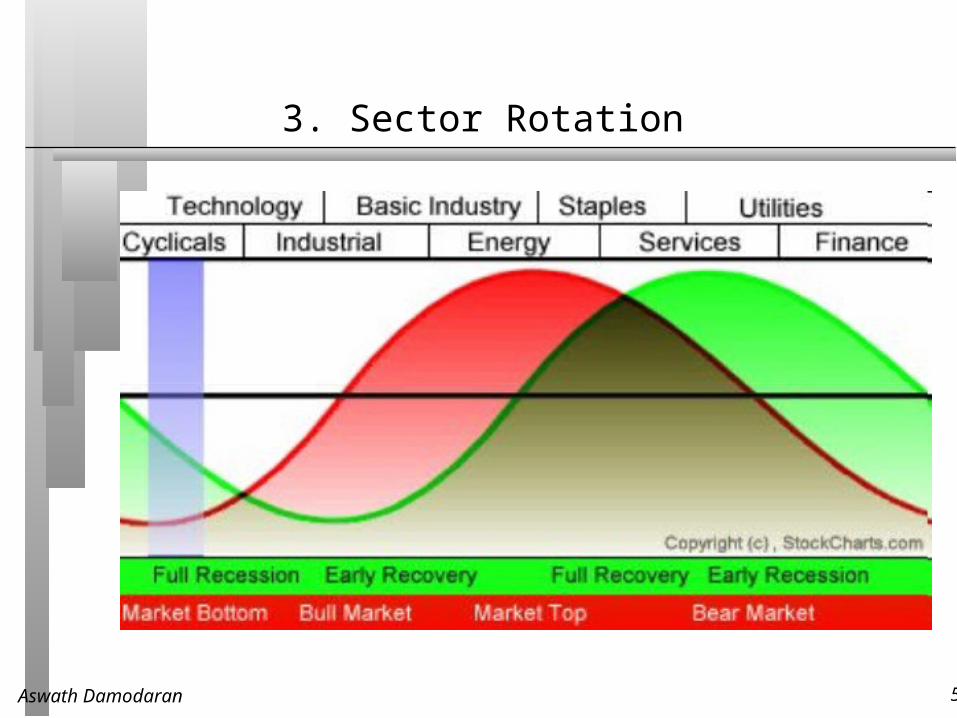
3. Sector Rotation
Aswath Damodaran 54
4. Speculation
The most direct way to take advantage of your market timing abilities is to buy assets in a market that you believe is under valued and sell assets in one that you believe is over valued.
It is a high risk, high return strategy. If you are successful, you will earn an immense amount of money. If you are wrong, you could lose it all.
Aswath Damodaran 55
Market Timing Instruments
Futures contracts: There are futures contracts on every asset class: commodities, currencies, fixed income, equities and even real estate, allowing you to go either long or short on whichever asset classes that you choose.
Options contracts: Options provide many of the same advantages that futures contracts offer, allowing investors to make large positive or negative bets, with liquidity and low costs.
Exchange Traded Funds (ETFs): Like futures contracts, ETFs do not require you to pay a time premium to make a market bet. Unlike options or futures, which have finite lives, you can hold an ETF for any period you choose.
Aswath Damodaran 56
Connecting Market Timing to Security Selection
You can be both a market timer and security selector. The same beliefs about markets that led you to become a security selector may also lead you to become a market timer. In fact, there are many investors who combine asset allocation and security selection in a coherent investment strategy.
There are, however, two caveats to an investment philosophy that includes this combination. • To the extent that you have differing skills as a market
timer and as a security selector, you have to gauge where your differential advantage lies, since you have limited time and resources to direct towards your task of building a portfolio.
• You may find that your attempts at market timing are under cutting your asset selection and that your overall returns suffer as a consequence. If this is the case, you should abandon market timing and focus exclusively on security selection.