associate professor mehmet saraÇ department of business ... - mehmet sarac (t).pdf · namık kemal...
TRANSCRIPT
Associate Professor Mehmet SARAÇ
Department of Business Administration
Sakarya University, Turkey
E-mail: [email protected]
Feyyaz ZEREN, PhD
Department of Business Administration
Namık Kemal University, Tekirdağ, Turkey
E-mail:[email protected]
IS GOLD INVESTMENT AN EFFECTIVE HEDGE AGAINST
INFLATION AND U.S. DOLLAR? EVIDENCE FROM TURKEY
Abstract. Gold is regarded as “safe haven” for most investors due to its
stable movement over the long run. This paper examines whether gold is an
effective hedge instrument against the inflation and the currency risk of Turkish
Lira against U.S. Dollar using the monthly data from February 1986 to June 2013.
We in this study employ new generation Kapetanios (2005) unit root and Maki
(2012) cointegration tests allowing unknown number of breaks that are determined
endogenously. This method is regarded as superior to previous cointegration tests
because it considers all economic crises over the long run and all developments
that cause the radical changes in the economy. Our findings show that gold is
indeed an effective investment tool to hedge against the risks of inflation and
currency risks. We therefore conclude that it is always rational to include gold for
a well-diversified portfolio.
Keywords: Gold, Inflation Risk, Currency Risk, Hedging, Portfolio,
Cointegration.
JEL Classification: G11, F31
1. Introduction
Gold, the representative of precious metals, has always been regarded as
the “safe haven” for most investors. Apart from occasional downfalls, it has shown
a stable rise over the long run. It has especially out-competed every national
currency for decades. A research by World Gold Council compared changes in the
purchasing power indexes (PPI) of gold and Sterling over 90 years period, namely,
from 1900 to 1990. PPI of gold rose up to 150 from 130, with an average annual
change of 0,16%, while that of Sterling fell to 2.4 from 100, with an average
annual change of -4.06% (El-Diwany, 2004). Nominal gold price rose by almost
Mehmet Saraç, Feyyaz Zeren
_________________________________________________________________
100% from the beginning of the financial crisis in July of 2007 (Central Bank of
Republic of Turkey, 2013).
The basic rule of portfolio management suggests that portfolio with
negative or low correlation assets could reduce risks and maintain a sound return
rate. Because gold has usually shown upward moves during the bad times of
economy, it is commonly regarded as a hedge tool to be included in portfolios. In
other words, it seems to be the most reliable tool to cope with the volatility in stock
market and currency. Gold is superior over the other assets as it is a precious metal
with functions that a currency has; among all the functions, the purchasing power
is the most important one (Wang et.al., 2010).
Despite the descriptive data and common ideas suggest that gold is a sound
hedge tool, this hypothesis is still require advanced econometric analyses. This
paper attempts to show whether gold an effective hedge instrument against the
inflation and the currency risk of Turkish Lira against U.S. Dollar using the
monthly data from February 1986 to June 2013. What makes this study distinct
from the previous research is the utilization of Kapetanios stationarity test (2005)
and Maki cointegration tests (2012) that allow unknown multiple number of breaks
obtained endogenously. This method is regarded as superior to previous unit root
and cointegration tests where either no break is assumed or number of breaks is
specified a priori because it considers all economic crises over the long run and all
developments that cause the radical changes in the economy.
2. Literature Review
Wang et.al. (2011) investigated whether gold can be used as a hedge
instrument against inflation in the U.S. and Japan. They found that gold has
significantly reacted against inflation in both countries. Beckman and Czudac
(2013) examined the same effect for Japan, United States, England and Euro zone
and found similar results. A similar study by Ghosh et.al. (2004) based on the U.S.
data showed that gold is the most effective hedging tool both in short and long
term.
Among those studies that consider structural breaks, Worthington and
Pahlavani (2007) used the U.S. data and Shahbaz et.al. Pakistani data. Both studies
found that gold is an effective hedge instrument against inflation.
Chua and Woorward (1986) examined six industrial countries and found
gold as an effective hedge tool only in the U.S. Baur and Mcdermott (2010) tested
the hyptothesis in the context of the stock markets and concluded that gold can be
used as a hedge tool in the developed European countries whereas the hypothesis
cannot be accepted for Australia, Canada, Japan and BRIC countries. Baur and
Lucey (2010) did a similar work for the U.S., England and Germany to examine
Is Gold Investment an Effective Hedge against Inflation and U.S. dollar?
Evidence from Turkey
________________________________________________________________
the changing relationship and found that gold is reliable hedge instrument against
the stock market volatility in the short run.
Aksoy and Topçu (2013) examined the hedging behavior of gold against
inflation and stock market index using Turkish markets data and concluded that
gold is a reliable instrument against both parameters. Likewise, Öztürk and
Açıkalın (2008) proved that gold is cointegrated with both currency and inflation,
and, thus, it is a reliable investment.
Reboredo (2013) investigated the tendency of gold to move together with
currency for Canada, England, Japan, Norway, Swiss and the Euro zone. He found
that it is useful to include gold and currency in a portfolio for an effective
diversification. Joy’s (2011) study, using the data of sixteen countries including
both developed and emerging ones, found that gold is a reliable investment tool to
cope with the currency risk. Another study that examined whether gold is a hedge
tool against U.S. dollar currency is done by Capie et.al. (2005). They too verified
that gold is reliable investment tool.
Ciner et.al. (2013) examined the hedging function of gold using time-
varying tests for the U.S. and England and found that gold is a sound hedging tool
against the currency.
Hoang (2012), contrary to the others, found no relationship between gold
prices and inflation in his research based on French markets. Similarly, Lawrance’s
(2003) research on London markets showed no relationship between these two
parameters. Dee et.al. (2013) studied the Chinese markets and found that gold is
not statistically related with stock market and inflation in the short run, whereas it
is significantly related with the two parameters in the long run.
Wang et.al. (2013) used non-linear cointegration test on the U.S. and
Japanese markets and showed that there is no cointegration between the gold prices
and inflation both in short and long run.
As can be noted, most studies proved that gold is an effective investment
tool to avoid the risks in currency, stock market and inflation.
3. The Model
Kapetanios (2005) improved Zivot Andrew (1992) and Lumsdaine-Papell
(2003) tests and developed a new technique that tests stationarity hypothesis with
unknown number of breaks in lieu of conventional unit rool test. Because the
appropriate number of breaks is endogenously obtained through this method, the
constraint that requires a priori specification of number of breaks has been

Mehmet Saraç, Feyyaz Zeren
_________________________________________________________________
eliminated. The only a priori information required is the maximum number of
breaks. The mathematical model is expressed as follows:
Here the null hypothesis is for the existence of unit root while alternative
hypothesis for the stationarity of the series.
H0: α = 1
H𝐴: α: < 1
The process of this method is as follows: first, a single break is sought
through the entire sample and t statistics for α = 1 hypothesis is obtained.
Secondly, the structural break date is selected for the sum of least-squares of
residuals model and, by adding the first break date previously estimated to the
model, the second break date is sought through the remaining parts. Then, t
statistics for α = 1 hypothesis are obtained and break date is found by summing the
least-squares of residuals. This process is continued until obtaining m number of
breaks. The optimal number of break is the one with the minimum t statistics.
Maki (2012) adopted the unknown number of breaks approach for
cointegration tests. He criticized Gregory-Hansen (1996) test for allowing single
break and for a priori specification. He also criticized Hatemi-J (2008) test for
allowing maximum two breaks. Instead, he suggested a new model with unknown
number of breaks determined endogenously. According to this model, the null
hypothesis states that there is no cointegration between the variables while
alternative hypothesis states that there are as many cointegrations with structural
breaks as produced by the model. This method is considered less computationally
intensive than methods that are widely used in literature (Maki, 2012). One of the
following models is selected for this test:

Is Gold Investment an Effective Hedge against Inflation and U.S. dollar?
Evidence from Turkey
________________________________________________________________
We in this study prefer model 4 that allows variation in trend and
independent variables.
Maki cointegration test is conducted as follows: first, the selected model is
estimated for each possible structural break. Through this process, unit root test
statistics are obtained to be applied to residuals (Çağlı and Mandacı, 2013) Then
the model with the minimum residual sum of squares is specified as the first break
point. After the first structural break is employed in the model, the second, third,
and the other breaks are utilized in the model upto the maximum number of breaks
specified at the outset. Among such estimated models, the one with the least t
statistic indicates the appropriate number of breaks. In other words, the appropriate
number of breaks is the one that exist in the model with the minimum t statistic
(Yılancı, 2013).
4. Data
We used monthly data for the period from February 1986 to June 2013,
resulting in 329 observations. Gold prices, inflation and currency data were
obtained from the electronic data delivery system of The Central Bank of Turkey.
The consumer price index (CPI) was used to represent the inflation, as in the case
in most previous studies. The series were converted to natural logarithms before
entering the analysis. The descriptive statistics of these three variables are shown
in Table 1. The distributions of the variables are left-skewed and Jarque-Bera
values indicate that the series are not normally distributed.

Mehmet Saraç, Feyyaz Zeren
_________________________________________________________________
Table 1
Descriptive Statistics
LNGold LNCPI LNDollar
Mean 0.67 14.99 -2.06
Maximum 4.63 18.18 0.62
Minimum -4.98 9.33 -7.41
Standart Deviation 3.02 2.95 2.78
Skewness -0.41 -0.57 -0.63
Kurtosis 1.72 1.81 1.80
Jarque-Bera 31.61 36.96 41.12
Chart 1 illustrates that the variables have constantly moved together. These
findings verify the previous studies that include no breaks or single break.
Figure 1
Line Chart of the Series
We in this paper first apply the conventional augmented Dickey-Fuller
(ADF) (1979) and Phillips-Perron (PP) unit root tests and Engle Granger
cointegration tests (1987) all of which allow no structural breaks. Then, we employ
Lumsdaine Papell unit-root (2003) and Hatemi-J (2008) cointegration test with two
structural breaks that are determined endogenously, followed by Kapetanios (2005)
-8
-4
0
4
8
12
16
20
86 88 90 92 94 96 98 00 02 04 06 08 10 12
LNGOLD LNCPI LNDOLLAR

Is Gold Investment an Effective Hedge against Inflation and U.S. dollar?
Evidence from Turkey
________________________________________________________________
unit-root test and Maki (2012) cointegration tests that allow more than two
structural breaks that are determined endogenously. We thereby attempt to show
that allowing more than two breaks in such a long period would lead to better
measurement.
5. Empirical Results
Though some studies directly assume the linearity of the series that they
use, it is widely accepted that testing the linearity of series prior to unit root and
cointegration tests is a more accurate approach. We use linearity test of Harvey
et.al. (2008) to see whether the series are linear. As seen from Table 2, all the
series are linear and there would be no problem with using linear unit root and
cointegration tests.
Table 2
Results of Linearity Test of Harvey
W-Lam W 10% W 5% W 1%
Gold 1.51* 7.69 7.74 7.86
CPI 20.48* 74.27 74.47 74.82
Dollar 43.89* 58.29 58.53 58.96
Conventional Tests Allowing No Structural Breaks. In order to reveal the
superiority of new generation tests allowing structural breaks we first conduct the
conventional ADF and PP unit-root and Engle Granger cointegration tests. Table 3
and Table 4 show the respective results.
Table 3
Results of ADF and PP Unit Root Tests
ADF PP
Level 1st Difference Level 1st Difference
Gold 0.18 (0.99) -4.89 (0.00)*** -0.78 (0.96) -13.38 (0.00)***
CPI 0.07 (0.99) -3.28 (0.07)* -1.48 (083) -9.80 (0.00)***
Dollar 0.63 (0.99) -10.83 (0.00)*** -1.92 (0.64) -12.21 (0.00)***
Table 4
Results of Engle Granger Cointegration Tests
Test Statistic Probability
Gold-CPI -8.81* 0.00
Gold-Dollar 99.17* 0.00 Note: Probability values represent Mackinnon (1996) cointegration Probability values.
Mehmet Saraç, Feyyaz Zeren
_________________________________________________________________
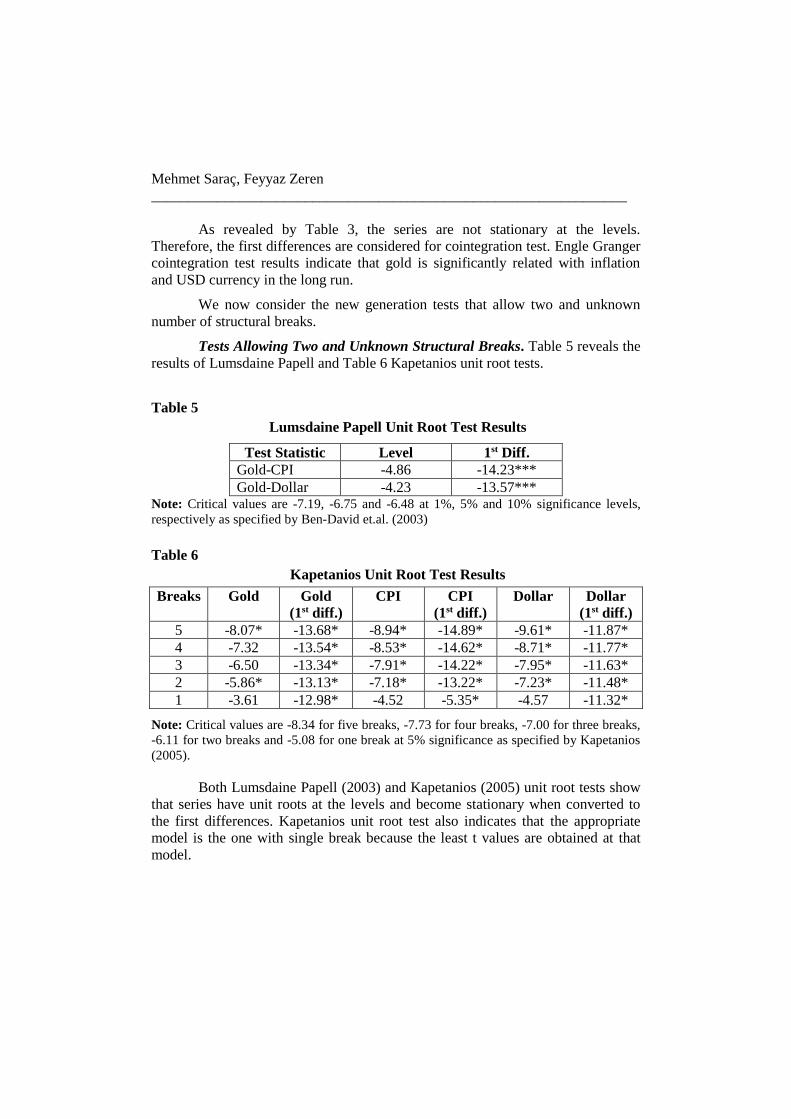
As revealed by Table 3, the series are not stationary at the levels.
Therefore, the first differences are considered for cointegration test. Engle Granger
cointegration test results indicate that gold is significantly related with inflation
and USD currency in the long run.
We now consider the new generation tests that allow two and unknown
number of structural breaks.
Tests Allowing Two and Unknown Structural Breaks. Table 5 reveals the
results of Lumsdaine Papell and Table 6 Kapetanios unit root tests.
Table 5
Lumsdaine Papell Unit Root Test Results
Test Statistic Level 1st Diff.
Gold-CPI -4.86 -14.23***
Gold-Dollar -4.23 -13.57*** Note: Critical values are -7.19, -6.75 and -6.48 at 1%, 5% and 10% significance levels,
respectively as specified by Ben-David et.al. (2003)
Table 6
Kapetanios Unit Root Test Results
Breaks Gold Gold
(1st diff.)
CPI CPI
(1st diff.)
Dollar Dollar
(1st diff.)
5 -8.07* -13.68* -8.94* -14.89* -9.61* -11.87*
4 -7.32 -13.54* -8.53* -14.62* -8.71* -11.77*
3 -6.50 -13.34* -7.91* -14.22* -7.95* -11.63*
2 -5.86* -13.13* -7.18* -13.22* -7.23* -11.48*
1 -3.61 -12.98* -4.52 -5.35* -4.57 -11.32*
Note: Critical values are -8.34 for five breaks, -7.73 for four breaks, -7.00 for three breaks,
-6.11 for two breaks and -5.08 for one break at 5% significance as specified by Kapetanios
(2005).
Both Lumsdaine Papell (2003) and Kapetanios (2005) unit root tests show
that series have unit roots at the levels and become stationary when converted to
the first differences. Kapetanios unit root test also indicates that the appropriate
model is the one with single break because the least t values are obtained at that
model.
Is Gold Investment an Effective Hedge against Inflation and U.S. dollar?
Evidence from Turkey
________________________________________________________________
Table 7
Hatemi-J Cointegration Test Results
Test Statistic Critical Value First Break Second Break
Gold-CPI -14.71* -6.50 September 1993 July 1997
Gold-Dollar -16.87* -6.50 February 1990 January 1997
Table 8
Maki Cointegration Test Results
Test Statistic Critical Value Break Dates
Gold-
CPI -10.31*** -7.41
June 1990; June 1994; January 2000;
February 2005; September 2008
Gold-
Dollar -9.86*** -7.41
December 1992; August 1999; January
2001; April 2006, October 2008
Note: Critical value for five breaks at 5% significance level is specified by Maki (2012).
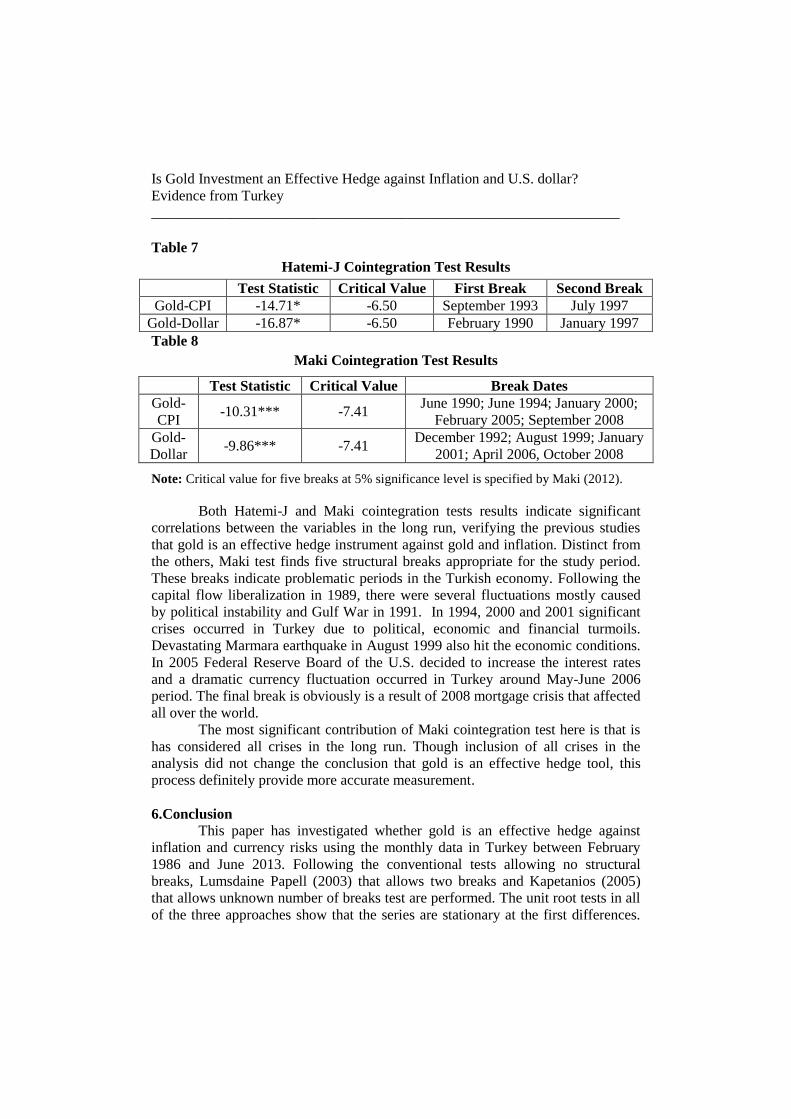
Both Hatemi-J and Maki cointegration tests results indicate significant
correlations between the variables in the long run, verifying the previous studies
that gold is an effective hedge instrument against gold and inflation. Distinct from
the others, Maki test finds five structural breaks appropriate for the study period.
These breaks indicate problematic periods in the Turkish economy. Following the
capital flow liberalization in 1989, there were several fluctuations mostly caused
by political instability and Gulf War in 1991. In 1994, 2000 and 2001 significant
crises occurred in Turkey due to political, economic and financial turmoils.
Devastating Marmara earthquake in August 1999 also hit the economic conditions.
In 2005 Federal Reserve Board of the U.S. decided to increase the interest rates
and a dramatic currency fluctuation occurred in Turkey around May-June 2006
period. The final break is obviously is a result of 2008 mortgage crisis that affected
all over the world.
The most significant contribution of Maki cointegration test here is that is
has considered all crises in the long run. Though inclusion of all crises in the
analysis did not change the conclusion that gold is an effective hedge tool, this
process definitely provide more accurate measurement.
6.Conclusion This paper has investigated whether gold is an effective hedge against
inflation and currency risks using the monthly data in Turkey between February
1986 and June 2013. Following the conventional tests allowing no structural
breaks, Lumsdaine Papell (2003) that allows two breaks and Kapetanios (2005)
that allows unknown number of breaks test are performed. The unit root tests in all
of the three approaches show that the series are stationary at the first differences.
Mehmet Saraç, Feyyaz Zeren
_________________________________________________________________
Finally, the existence of meaningful cointegration between the three variables have
been tested through Engle Granger allowing no structural break, Hatemi-J (2008)
allowing two breaks and Maki (2012) allowing unknown number of breaks. All the
three methods indicate significant cointegrations, implying the gold is an effective
investment tool to cope with the inflation and currency risks. The new generation
unit root and cointegration tests, namely Kapetanios (2005) and Maki (2012)
respectively, strengthen the results in previous tests. This result also supports the
findings Öztürk and Açıkalın (2008) and Aksoy and Topçu (2013) all of which
applied Engle Granger tests on the data in Turkey. However, our tests provide
more accurate measurement as they consider all the crises occurred during this
period.
In brief, this study provides even stronger evidence from Turkey that gold
should be included in the portfolios for an effective diversification.
REFERENCES
[1] Aksoy, M., Topçu, N. (2013), Altın ile Hisse Senedi ve Enflasyon Arasındaki
İlişki”, Atatürk Üniversitesi İktisadi ve İdari Bilimler Dergisi, Cilt: 27, Sayı: 1, pp.
59-79;
[2] Baur, D., Lucey, B.M. (2010), Is Gold a Hedge or a Safe Haven? An
Analysis of Stocks, Bonds and Gold; The Financial Review, 45, pp. 217–229;
[3]Baur, D., McDermott, T.K. (2010), Is Gold a Safe Haven? International
Evidence; Journal of Banking & Finance 34, pp. 1886–1898;
[4] Beckman, J., Czudac, R. (2013), Gold as an İnflation Hedge in a Time-
Varying Coefficient Framework; North American Journal of Economics and
Finance, 24, pp. 208– 222;
[5] Ben-David, D., Lumsdaine, R.L., Papell, D.H. (2003), Unit Roots, Postwar
Slowdowns and Long-Run Growth: Evidence from Two Structural Breaks;
Empirical Economics, 28(2), pp. 303- 319;
[6] Capie, F., Mills, T.C., Wood, G. (2005), Gold as a Hedge against the Dollar; Int. Fin.Markets, Inst. and Money, 15 pp. 343–352;
[7] Chua, J., Woodward, R.S. (1982), Gold as an Inflation Hedge: A
Comparative Study of Six Major Industrial Countries; Journal of Business
Finance & Accounting 9 (2), pp. 191–197;
[8] Ciner, C., Gurdgiev, C., Lucey, B.M. (2013), Hedges and Safe Havens: An
Examination of Stocks, Bonds, Gold, Oil and Exchange Rates; International
Review of Financial Analysis, Volume 29, September 2013, pp. 202–211;

Is Gold Investment an Effective Hedge against Inflation and U.S. dollar?
Evidence from Turkey
________________________________________________________________
[9] Çağlı, E.Ç., Mandacı, P.E. (2013), The Long-Run Relationship between the
Spot and Futures Markets under Multiple Regime-Shifts: Evidence From
Turkish Derivatives Exchange; Expert Systems with Applications, 40 ;
pp. 4206–4212;
[10] Dee, J., Li, L., Zheng, Z. (2013), Is Gold a Hedge or a Safe
Haven?Evidence from Inflation and Stock Market ; International Journal of
Development and Sustainability, Vol: 2 Number 1;
[11] Dickey, D.A., Fuller, W.A. (1979), Distribution of the Estimators for
Autoregressive Time Series with a Unit Root; Journal of the American Statistical
Society, 75, pp. 427–431;
[12] El-Diwany, (2004), The Problem with Interest; Kreatoc Inc., London;
[13] Engle, R.F., Granger, C.W.J. (1987), Cointegration and Error Correction:
Representation, Estimation and Testing; Econometrica 55, pp. 251–276;
[14] Harvey, D.I., Leybourne, S.J., Xiao, B. (2008), A Powerful Test for
Linearity when the Order of Integration is Unknown; Regime-Switching Models
in Economics and Finance, Volume 12, Issue 3;
[15] Hatemi-J, A. (2008), Tests for Cointegration with Two Unknown Regime
Shifts with an Application to Financial Market Integration; Empirical
Economics, 35 (3), pp. 497-505;
[16] Hoang, T.H.V. (2012), Has Gold been a Hedge against Inflation in France
from 1949 to 2011 ?”; Empirical Evidence of the French specificity, Association
Française de Cliometrie, Working Paper, No: 5;
[17] Joy, M. (2011), Gold and the US Dollar: Hedge or Haven ?”; Finance
Research Letters, 8 pp. 120–131;
[18] Kapetanios, G. (2005), Unit-Root Testing against the Alternative
Hypothesis of up to M Structural Breaks; U of London Queen Mary Economics
Working Paper No. 469;
[19] Lawrance, C. (2003), Why is Gold Different from other Assets ?”. An
Empirical Investigation London: World Gold Council, London;
[20] MacKinnon, J. G. (1996). Numerical Distribution Functions for Unit Root
and Cointegration Tests. Journal of Applied Econometrics, 11(6), pp. 601–618;
[21] Maki, D. (2012), Tests for Cointegration Allowing for an Unknown Number
of Breaks; Economic Modelling 29, pp. 2011–2015;
[22] Phillips, P.C.B., Perron, P. (1988), Testing for a Unit Root in Time Series
Regressions. Biometrica 75, pp. 335–346;
[23] Reboredo, J.C. (2013), Is Gold a Safe Haven or a Hedge for The US
Dollar? Implications for Risk Management; Journal of Banking & Finance 37
pp. 2665 2676;
Mehmet Saraç, Feyyaz Zeren
_________________________________________________________________
[24] Shahbaz, M., Tahir, M.I., Ali, I. (2013), Is Gold Investment a Hedge
against Inflation in Pakistan? A Cointegtaion and Causality Analysis in the
Presence of Structural Breaks; Munich Personal RePEc Archive;
[25] Öztürk, F., Açıkalın, S. (2008), Is Gold a Hedge against Turkish Lira?; SEE Journal of Economics and Business;
[26] Türkiye Cumhuriyeti Merkez Bankası Veri Tabanı;
[27] Wang, K.M., Lee, Y.M., Thi, T.B.N. (2011), Time and Place where Gold
Acts as an Inflation Hedge: An Application of Long-Run and Short-Run
Threshold Model; Economic Modelling, 28 pp. 806–819;
[28] Wang, K.M., Lee, Y.M., Thi, T.B.N. (2013), Does Gold Act as Inflation
Hedge in the USA and Japan ?; Transformations in Business & Economics, Vol.
12, No 2 (29), pp.20-43;
[29] Worthington, A.C., Pahlavani, M. (2007), Gold Investment as an
Inflationary Hedge: Cointegration Evidence with Allowance for Endogenous
Structural Breaks; Applied Financial Economics Letters, 3, pp. 259–262;
[30] Yılancı, V. (2013), Financial Econometrics Education is Given by Associate
Professor Veli Yılancı in 1-5 June 2013 in Sakarya University.