assessment of urban pluvial flood risk and efficiency of ...1 1 assessment of urban pluvial flood...
TRANSCRIPT
General rights Copyright and moral rights for the publications made accessible in the public portal are retained by the authors and/or other copyright owners and it is a condition of accessing publications that users recognise and abide by the legal requirements associated with these rights.
Users may download and print one copy of any publication from the public portal for the purpose of private study or research.
You may not further distribute the material or use it for any profit-making activity or commercial gain
You may freely distribute the URL identifying the publication in the public portal If you believe that this document breaches copyright please contact us providing details, and we will remove access to the work immediately and investigate your claim.
Downloaded from orbit.dtu.dk on: May 30, 2020
Assessment of Urban Pluvial Flood Risk and Efficiency of Adaptation Options ThroughSimulations – A New Generation of Urban Planning Tools
Löwe, Roland; Urich, Christian; Sto. Domingo, Niña Donna Farpale; Mark, Ole; Deletic, Ana; Arnbjerg-Nielsen, Karsten
Published in:Journal of Hydrology
Link to article, DOI:10.1016/j.jhydrol.2017.05.009
Publication date:2017
Document VersionPeer reviewed version
Link back to DTU Orbit
Citation (APA):Löwe, R., Urich, C., Sto. Domingo, N. D. F., Mark, O., Deletic, A., & Arnbjerg-Nielsen, K. (2017). Assessment ofUrban Pluvial Flood Risk and Efficiency of Adaptation Options Through Simulations – A New Generation ofUrban Planning Tools. Journal of Hydrology, 550, 355–367. https://doi.org/10.1016/j.jhydrol.2017.05.009

1
Assessment of Urban Pluvial Flood Risk and 1
Efficiency of Adaptation Options Through 2
Simulations – A New Generation of Urban Planning 3
Tools 4
Roland Löwea,d,*, Christian Urichb,d, Nina Sto. Domingoc, Ole Markc, Ana Deleticb, 5 Karsten Arnbjerg-Nielsena,d 6 *correspondence to:[email protected], +45-45251462 7 aDepartment of Environmental Engineering, Technical University of Denmark (DTU Environment), 8 Miljøvej B115, Kgs. Lyngby, 2800, Denmark, [email protected], [email protected] 9 bDepartment of Civil Engineering, 23 College Walk, Monash University, Clayton, VIC, 3800, 10 Australia, [email protected], [email protected] 11 cDHI Water and Environment, Agern Allé 5, Hørsholm, 2970, Denmark, [email protected], 12 [email protected] 13 dCooperative Research Centre (CRC) for Water Sensitive Cities, Clayton, VIC 3800, Australia 14
15
ABSTRACT 16
We present a new framework for flexible testing of flood risk adaptation strategies in 17 a variety of urban development and climate scenarios. This framework couples the 18 1D-2D hydrodynamic simulation package MIKE Flood with the agent-based urban 19 development model DAnCE4Water and provides the possibility to systematically test 20 various flood risk adaptation measures ranging from large infrastructure changes 21 over decentralised water management to urban planning policies. We have tested the 22 framework in a case study in Melbourne, Australia considering 9 scenarios for urban 23 development and climate and 32 potential combinations of flood adaptation 24 measures. We found that the performance of adaptation measures strongly depended 25 on the considered climate and urban development scenario and the other 26 implementation measures implemented, suggesting that adaptive strategies are 27 preferable over one-off investments. Urban planning policies proved to be an 28 efficient means for the reduction of flood risk, while implementing property buyback 29 and pipe increases in a guideline-oriented manner was too costly. Random variations 30 in location and time point of urban development could have significant impact on 31 flood risk and would in some cases outweigh the benefits of less efficient adaptation 32 strategies. The results of our setup can serve as an input for robust decision making 33 frameworks and thus support the identification of flood risk adaptation measures that 34 are economically efficient and robust to variations of climate and urban layout. 35
36
KEYWORDS 37
Flood risk; urban development; climate change; agent-based modelling; 38 hydrodynamic modelling; robust decision making 39
2
1 INTRODUCTION 40
The implementation of flood adaptation measures often involves very long planning 41 horizons of 30 and more years, because measures are either time-consuming to 42 implement, or require large investments, or both. Commonly, adaptation measures 43 would be selected based on predictions of flood risk over the planning horizon. 44 However, this approach is problematic, because typically only little is known about 45 the future. For example, studies in various locations have shown that flood risk is 46 strongly affected by climate change and urban growth and anticipated to increase 47 over the next century (Ehret et al., 2008; Hinkel et al., 2014; Muis et al., 2015; 48 Muller, 2007; Semadeni-Davies et al., 2008; Zhou et al., 2012; Zhu et al., 2007). 49 However, projections of sea levels and rainfall are subject to large uncertainties (Hall 50 et al., 2014; Madsen et al., 2014; Sun et al., 2007; Sunyer et al., 2014). Similarly, 51 spatial and temporal projections of urban development depend on uncertain 52 projections of population growth and economic development (Cohen, 2004; Granger 53 and Jeon, 2007) and future societal preferences are virtually unknown. 54
In such a context, flood adaptation options or, more generally, policies based on 55 predictions of the future conditions can prove to be very fragile (Walker et al., 2001) 56 and necessary investments may well be postponed for fear of making irreversible 57 choices (Aerts et al., 2014). As proposed already by (Walker et al., 2001), new 58 decision tools therefore point in the direction of testing adaptation options for a 59 variety of potential future developments and assessing their robustness (Gersonius et 60 al., 2012; Kwakkel et al., 2015; Prudhomme et al., 2010). Such scenario based 61 evaluations have become quite common in the assessment of flood risks (Huong and 62 Pathirana, 2013; Muis et al., 2015; Poelmans et al., 2011; Sekovski et al., 2015), but 63 are difficult to apply for design purposes due to the simulation effort involved and 64 are therefore usually performed only for few selected scenarios (Zhou et al., 2012) or 65 apply very simplified models (Kwakkel et al., 2015; Zhu et al., 2007). 66
In this article, we demonstrate the development and application of a tool which 67 allows for a systematic assessment of flood adaptation options in urban environments 68 for a variety of potential futures. We have linked the urban development model 69 DAnCE4Water (Urich and Rauch, 2014) with the 1D-2D hydrodynamic modelling 70 engine MIKE FLOOD (DHI, 2013) to allow dynamic linkages between climate 71 change impacts, city development, and adaptation options. DAnCE4Water applies an 72 agent-based approach to simulate the evolution of the urban form at parcel level 73 detail and thus directly provides information on the shape and location of urban 74 features such as buildings or streets. This approach allows for a consideration of 75 spatio-temporal interdependencies between flood hazard, exposure and vulnerability 76 as suggested by (Merz et al., 2014) as these may lead to undesired surprises in flood 77 risk management (Merz et al., 2015). Further, the effect of, e.g., zoning policies can 78 directly be modelled in an easily understandable manner. The agent-based approach 79 was therefore preferred over the raster based black box methods applied in most 80 other hydrological studies considering urban development or land use change 81 (Barreira González et al., 2015; Hoymann, 2010; Muis et al., 2015; Poelmans and 82 Van Rompaey, 2010; Sekovski et al., 2015). In line with a general development in 83 the field of urban modelling (Batty, 2009), the purpose of this setup is not to predict 84 future developments, but to perform exploratory analysis and to support dialogue 85 between stakeholders. 86

3
Urban flood adaptation measures can take effect on runoff formation, transport and 87 retention in the drainage network, as well as surface flow paths. A tool for assessing 88 the effect of adaptation measures thus needs to be able to consider all of these 89 effects. For this reason, we chose to apply a coupled 1D-2D hydrodynamic model for 90 the assessment of flood hazards. Despite their complexity, such models have been 91 shown to be applicable also for large urban catchments (Henonin et al., 2015; Russo 92 et al., 2015) and in an automated manner (Meneses et al., 2015). 93
The aim of this paper is 94
1. to illustrate the new tool for systematic testing of flood risk adaptation 95 options, 96
2. to demonstrate that it is possible to assess various adaptation options for a 97 variety of future pathways using a detailed urban development and 98 hydrodynamic modelling approach, 99
3. to highlight opportunities for further development of such a setup, and 100 4. to demonstrate the benefits of systematically screening adaptation options for 101
a variety of potential futures. 102
103
2 MATERIAL AND METHODS 104 2.1 GENERAL SETUP 105 Our aim was to provide a new tool that supports the systematic assessment of a 106 variety of flood adaptation options under a variety of potential urban development 107 and climate scenarios. Figure 1 illustrates the modelling setup we applied. In this 108 setup, the urban development modelling platform DAnCE4Water (Urich and Rauch, 109 2014) was integrated with the hydrodynamic model MIKE FLOOD using ArcPy 110 (ESRI, 2012) and the GDAL libraries (GDAL Development Team, 2014) through 111 Python. 112
We tested so-called pathways defined by different combinations of: 113
• Scenarios, manifested in varying external drivers such as 114 o different population growth rates and 115 o climate scenarios, 116
• Flood adaptation strategies such as 117 o infrastructural measures to be implemented or 118 o land use management strategies. 119
The urban development model then performed a simulation along the pathway over a 120 planning horizon from the year 2010 until 2060. Every 10 years, the current urban 121 development state was transferred to the hydrodynamic model and the current flood 122 risk was assessed using design rains derived according to the considered climate 123 scenario. 124
Each pathway thus consisted of 6 flood risk assessments that varied depending on the 125 number of households currently present in the catchment, the type and location of 126 buildings, the current state of the climate and the flood adaptation options currently 127 implemented. We refer to Section 2.3 for a detailed description of the urban 128 development and climate scenarios we considered, as well as the implemented flood 129 adaptation options. 130

4
Note that the setup illustrated in Figure 1 allows for conditioning the urban 131 development model on results from the hydrodynamic simulation. This opens up the 132 possibility to optimize adaptation options along a pathway as suggested by (Kwakkel 133 et al., 2015). 134
Further, while our work was focused on flood risk assessment and the development 135 of adaptation options in a highly uncertain future, the work presented here can be 136 embedded into a more general urban planning context. The urban development and 137 the flood adaptation options implemented along a pathway impact other factors of 138 the water household and urban liveability. Such factors can be assessed by linking 139 other model blocks to the urban development model and including their results in a 140 cost benefit assessment. Examples of such extensions are the consideration of effects 141 on urban heat, the provision of ecosystem services or the efficiency of transport 142 connections. In the terminology of (Merz et al., 2010), such a simulation setup aims 143 to extend the problem domain (level 4) for flood risk management because 144 adaptation options are designed to fulfil multiple purposes rather than the sole 145 reduction of flood risk. 146
147 Figure 1. Schematic coupling between urban development model (DAnCE4Water) and 1D-2D 148 hydrodynamic model (MIKE FLOOD). 149 150 2.2 CASE STUDY CATCHMENT 151 We have tested the flood risk assessment tool in an urban case study in Australia. 152 The Scotchman’s Creek catchment covers an area of 300 ha of mostly residential 153 land use in the south-eastern suburbs of Melbourne, Australia. The catchment has 154 undergone strong urban development over the last decades. It was applied in 155 previous studies that investigated the implementation of water sensitive urban design 156 (WSUD) infrastructures (Bach et al., 2015, 2013). 157

5
Figure 2 provides an overview of the catchment together with the simulated flood 158 areas for a design rain with return period 100 years. Flood risk in the catchment is 159 dominated by pluvial flooding, mainly as a result of urbanization in low-lying areas 160 of the catchment. A 1D-2D hydraulic model was set up for our case study. Details on 161 the available dataset are provided in the supporting material. As input for the 162 hydraulic simulations we applied design rainfalls that were extracted from Australian 163 guidelines (Australia Institution of Engineers, 1987; French and Jones, 2012). 164
165 Figure 2. Scotchman’s Creek catchment in Melbourne, Australia with flooded area for 100yr return 166 period. 167 168 2.3 PATHWAYS 169 To test the performance of flood risk adaptation strategies for a variety of potential 170 futures, we need to define realistic ranges for future climate and urban development 171 as well as adaptation strategies to consider. We therefore defined 3 potential 172 population growth and 3 climate scenarios, resulting in 9 different scenarios for 173 future development. These were subsequently used to test a total of 32 potential 174 combinations of adaptation strategies. Each candidate strategy was tested for each of 175 the 9 future scenarios, leading to 288 potential pathways. 176
2.3.1 Future Scenarios 177 We have considered a planning horizon of 50 years starting in 2010 and ending in 178 2060. Changes of flood risk in the catchment are subject mainly to two unknowns. 179 Firstly, it is unclear how many people will live in the catchment in the future, where 180 they will settle and to what extent their properties and infrastructure will be 181 vulnerable to flooding. As the location and type of urban development can at least in 182

6
principle be directed by policies, we have considered these factors as adaptation 183 options described in Section 2.3.2. The degree of population growth, on the other 184 hand, is strongly influenced by external factors such as economic development or 185 immigration. As an example for the application of our framework, we derived ranges 186 of potential population developments for the catchment informed by the population 187 projections for greater Melbourne downscaled to the Monash Local Government 188 Area (The State of Victoria - Department of Transport Planning and Local 189 Infrastructure, 2014). We defined three population growth scenarios in which the 190 number of households in the catchment increased by rates of 0.4, 0.8 and 1.2% per 191 year. 192 Secondly, the characteristics of future rainfall are unknown. (CSIRO and Bureau of 193 Meteorology, 2015) project a change of maximum daily rain intensities by 2080 in 194 South Australia between -5 and 5% considering only natural variability and between 195 2% and 22% under emission scenario RCP8.5. Changes in extreme rain intensities 196 for short durations can be subject to even larger variation as demonstrated by 197 (Arnbjerg-Nielsen, 2012). We have therefore considered three climate scenarios 198 covering a large range of potential climates with annual increases in design rain 199 intensity of 0, 0.5 and 1%. 200 Both, population growth and climate change are expected to occur continuously over 201 the planning horizon. We assumed a linear increase of design rain intensities over the 202 planning horizon and exponential population growth as illustrated in Figure 3. 203 204
205 Figure 3. Examples for the evolvement of drivers for flood risk over a planning horizon. Left – design 206 rain intensity as a result of climate change, right – no. of households in the catchment as a result of 207 population growth. 208 209
2.3.2 Adaptation Strategies 210 We have considered a number of structural and non-structural measures that aim at 211 reducing flood risk in the catchment. To illustrate the potential of the coupled 212 software framework, we considered a spectrum of options ranging from the 213 implementation of urban planning policies to classical engineering solutions. 214

7
The considered options were: 215
1. Master plans controlling the form of urban development. 216 In the business as usual scenario (BAU) urban development continued as 217 observed in the past with uncontrolled urban sprawl where population growth 218 is largely accommodated by the development of new detached single-unit 219 houses. Opposed to the BAU scenario, the water sensitive city (WSC) 220 scenario favours a more compact urban form and implements multi-storey 221 buildings and apartment blocks along transport corridors as illustrated in 222 Figure 4 for a scenario simulated until the year 2060. 223
2. Flood zoning. 224 This strategy focused on reducing the exposure to flood hazards through a 225 buyback of properties. During any year of the planning horizon, buildings 226 which were at risk of flooding more often than once in 100 years in the status 227 situation in 2010 would be assigned a chance of 3% to be bought back in the 228 year under consideration. 229
3. Large scale implementation of rainwater harvesting facilities (RWHT). 230 We considered four scenarios, where rainwater tanks were implemented 231 randomly throughout the catchment in the urban development model. For 232 each year during the planning horizon any building without rainwater 233 harvesting would have a chance of either 0, 1, 3 or 5% to have a rainwater 234 tank implemented. The volume of each RWHT unit was assumed to be 235 approximately 2 m3. 236
4. Increase in pipe capacity. 237 In this strategy the dimension of the stormwater pipes was increased until 238 flooding no longer occurred more than once in 10 years anywhere in the 239 catchment in the status situation in 2010. 240
The adaptation options represent four typical measures implemented in flood risk 241 management, i.e. master planning control of future development, gradual 242 implementation of measures throughout the catchment, development zoning allowing 243 dynamic feedback mechanisms from increasing hazards into city development, and a 244 one-off investment in increasing infrastructure. Adaptation options 1 to 3 were 245 implemented as rules in the urban development model (see supporting material), 246 while adaptation 4 was implemented by considering a modified hydraulic model in 247 the simulations. 248
For cost-benefit assessment, we considered the positive effect of reduced drinking 249 water demand in option 3, while no benefits apart from the reduction of flood risk 250 were considered for the other options. Details on the model implementation, as well 251 as the derivation of investment cost and benefits of the different adaptation measures 252 are provided in the supporting material. 253

8
254 Figure 4. Simulated urban form for the year 2060 for business as usual (BAU) and water sensitive 255 cities (WSC) master plans assuming a growth rate of 1.2% / year 256 257
2.3.3 Simulation of Pathways 258 A total of 288 pathways were considered, resulting from 32 potential combinations 259 of adaptation options and 9 scenarios. Urban development was simulated separately 260 for each pathway except for those pathways involving an increase in pipe capacity, 261 because this adaptation option was implemented independently from the urban 262 development model. Flood risk was assessed every 10 years along each pathway for 263 seven design storms with return periods ranging from 1 to 100 years, i.e., a total of 264 12,096 hydrodynamic simulations were performed. 265
266 2.4 URBAN DEVELOPMENT 267 Driven by external drivers such as population growth and climate change, 268 DAnCE4Water’s urban and infrastructure development component evolves the urban 269 environment at parcel level detail under different adaptation options (Urich and 270 Rauch, 2014). Similar to UrbanSim (Waddell, 2002), the model uses an agent-based 271 approach that simulates key actors and their interactions within the urban 272 environment. Such approaches can, in principle, resemble closely the way 273 stakeholders think and incorporate decision making at multiple levels (Matthews et 274 al., 2007) and are thus useful to facilitate dialog between different stakeholders. 275
In our case, DAnCE4Water simulates city councils that introduce zoning regulations 276 and upgrade the drainage system in response to increased flood risk, residential 277 developers that build new buildings according to the zoning regulations, location 278 preferences and pre-defined development patterns, and newly added (based on the 279

9
population projections) or relocated households that according to their preferences 280 choose to occupy a newly developed building and install rainwater harvesting tanks. 281
The urban development model was set up to replicate typical urban development 282 patterns within the catchment. For the relevant simulation period between 2010 – 283 2060 two main development processes have been identified based on an analysis of 284 aerial photos and census data from the Australian Bureau of Statistics for 1996, 2006, 285 2011 (Wong, 2014): 286
• the redevelopment of single family houses with 2-3 town houses depending 287 on the parcel size (parcel splitting), and 288
• the combination of adjacent parcels to develop multi-storey apartment 289 buildings. 290
Due to the small size of the catchment, no significant preference for the 291 redevelopment of existing properties was identified, i.e., after defining population 292 growth rate and zoning regulations, the model randomly selected parcels where to 293 develop new buildings and randomly assigned households to the newly developed 294 buildings. This implies that two urban development scenarios with equal growth rate 295 and zoning regulations would not yield the exact same results, because buildings 296 could be developed at different locations and / or different time points along the 297 pathway. 298
Our approach for modelling urban development assumes that development is only 299 manifested through the two processes named above and that development patterns do 300 not change along the planning horizon. Further, we did not consider interactions 301 between, for example, developments of the urban form and economy. While this 302 level of simplification is a short-coming of our approach that needs to be addressed 303 to gain a better understanding of the uncertainties related to the planning of urban 304 water systems, this also implies that only few input data are required, which is 305 different from most micro-simulation agent-based models used to predict urban 306 development (Batty, 2009). However, the level of detailed required to simulate urban 307 development patterns is still discussed in the literature (Crooks et al., 2008; Mikovits 308 et al., 2015a). For a detailed description of the implemented urban development 309 model and the underlying assumptions we refer to the supporting material. 310
311 2.5 FLOOD RISK ASSESSMENT 312 Flood risk was calculated by integrating the potential damages from flooding over 313 the catchment area. Below, we discuss the quantification of these parameters. 314
2.5.1 Simulation of Flood Hazards - Implementation of Urban Development 315 and Flood Adaptation in the Hydrodynamic Model 316
Flood hazards were assessed using the 1D-2D hydrodynamic modelling package 317 MIKEFLOOD (DHI, 2013). Urban development and flood adaptation options could 318 affect the simulated flood hazards in multiple ways: 319
• by changing the portion of rainfall that is converted to (fast) runoff, 320 • by modifying the stormwater pipe network, or 321 • by modifying the surface flow paths. 322

10
We have implemented changes of the hydrodynamic model due to urban 323 development and the implementation of flood adaptation strategies as shown in Table 324 1. 325
Buildings and streets were considered in the computation of impervious area 326 percentages for the subcatchments of the hydrodynamic model and as features in the 327 terrain model. Elevations in the terrain model were increased by 10m in pixels 328 containing buildings and reduced by 0.1m in pixels containing streets. Urban 329 development and flood zoning changed the number and location of buildings 330 simulated by DAnCE4Water and in this way affected the hydrodynamic simulation. 331 A conversion of building types to, e.g., multi-storey buildings was not explicitly 332 considered in the hydrodynamic simulation, but would lead to a lower building 333 density in the catchment and thus affect the impervious area and the number of 334 buildings exposed to flood risk. Changes of the street layout were not simulated in 335 the urban development model in this work, but would otherwise be implemented 336 similarly to modifications of the building layer. 337
The implementation of rainwater harvesting facilities on a property was in this work 338 considered by considering the roof area of a building with rainwater tank as pervious 339 area during runoff computation. Modifications of the pipe network were 340 implemented manually in a separate hydraulic model. Subsequently, this modified 341 “template” pipe network was used to replace the existing pipe network in simulations 342 involving the adaptation strategy “increase in pipe capacity“. 343 Table 1. States of the urban development model which are modified as a result of urban development 344 and the implementation of planning policies and their implementation in the 1D-2D hydraulic model. 345 346
Modification
Output Urban Development Model
Runoff model Pipe network
Terrain model
Addition / removal of buildings
Polygon layer containing building footprints
Recomputation of impervious area according to building footprint
- Increase elevation of cells containing buildings by +10m
Change of building type ( apartment blocks)
Different building footprint, also leads to fewer buildings in urban development simulation
Recomputation of impervious area according to building footprint
- Increase elevation of cells containing buildings by +10m
Modifications of street layout
Street layout currently not modified by urban development
- - -

11
model Implementation of rain water harvesting tanks
Flag rainwater harvesting yes / no in building attributes
Consider building area as pervious area
- -
Modification of pipe diameters
- Transfer predesigned pipe layout to hydraulic model
-
347
2.5.2 Evaluation of Flood Risk 348 The 1D-2D hydrodynamic simulations resulted in raster layers of water depths 349 simulated in the different pixels for different time points during a rain event. For 350 illustrative purposes, we evaluated direct tangible flood damages in a unit cost 351 approach (Handmer et al., 2003) by overlaying simulated flood areas, building and 352 road layers. We refer to the supporting material for details. 353
For design of flood adaptation an estimator for expected annual flood damages 354 (𝐸𝐸𝐷𝑡) occurring in any year 𝑡 is commonly derived as the integral over the damages 355 𝐷𝑡(𝑝𝑡) occurring for events with annual exceedance probability 𝑝𝑡 (Stedinger, 1997). 356 As illustrated in Figure 5, flood risk changes over time as a result of changing 357 hazards, exposure and vulnerabilities. Expected risk over the planning horizon then 358 needs to be derived as the integral of expected annual damages over time (USACE, 359 1992). Assuming that expected damages are evaluated on an annual basis and 360 considering a planning horizon of 50 years between 2010 and 2060, we obtain: 361
𝐸𝐷 = ∑ ∫ 𝐷𝑡(𝑝𝑡)𝑑𝑝𝑡10
2060𝑡=2010 . Eq. 1
362 Figure 5. Schematic example for the change of expected annual damage (EAD) over a planning 363 horizon for non-stationary conditions 364

12
We assessed Eq. 1 numerically for each considered scenario by computing expected 365 annual damages (𝐸𝐸𝐷𝑡) in 10 year intervals along the planning horizon and 366 assuming a linear change of 𝐸𝐸𝐷𝑡 in between the sampling points. The rainfall was 367 modified according to the considered climate scenario and the hydraulic model was 368 updated based on the urban development simulated until the considered time point. 369 𝐸𝐸𝐷𝑡 were computed using the midpoint rule as described in (Olsen et al., 2015; 370 USACE, 1989), based on simulated flood damages for 7 design rain storms with 371 annual occurrence probabilities from 0.01 to 1. Flood damages for annual occurrence 372 probabilities smaller than 0.01 were assumed to correspond to the damages simulated 373 for an event occurring with 𝑝 = 0.01. 374
In order to compare future reductions in flood risk to current cost of investment of an 375 adaptation project, discounting of expected annual damages is commonly used in 376 cost benefit analysis. This leads to the expected, discounted damage over the 377 planning horizon 𝐸𝐷∗ as shown in Eq. 2: 378
𝐸𝐷∗ = � 𝐸𝐸𝐷𝑡1
(1 + 𝑟)𝑡−2010
2060
𝑡=2010
Eq. 2
We applied a discounting rate of 𝑟 = 0.014 in our work as suggested by (Stern, 379 2007), but we note that the choice of discount rate is subject to scientific and ethical 380 discussion (Mendelsohn, 2006; Olsen et al., 1998; Stern, 2016) and needs to be made 381 in a local political context. 382 2.6 COST-BENEFIT ASSESSMENT 383 In a planning context, investments into flood adaptation need to be compared against 384 benefits obtained through the implementation of an adaptation strategy. We have 385 therefore implemented a cost-benefit assessment to illustrate the applicability of our 386 setup. We emphasize that this assessment was rudimentary, as the main focus of our 387 work is on the illustration of the simulation setup. 388
To assess the efficiency of a flood adaptation strategy (or combination of strategies) 389 𝑠, we have computed the net present value 𝑁𝑁𝑉𝑠 for a specific urban development 390 and climate scenario by comparing the reduction in flood damage against the 391 investment cost 𝐼𝑠,𝑡 and additional benefits 𝐵𝑠,𝑡 occurring over the planning horizon. 392 The approach is illustrated in Eq. 3 using the same discount rate as in Eq. 2. The 393 reduction in flood damage was computed by comparing flood risk 𝐸𝐷𝑟𝑟𝑟∗ without 394 flood risk adaptation against the reduced flood risk 𝐸𝐷𝑠∗ when the strategy was 395 implemented. Computations were performed based on 2011 prices and it was 396 assumed that no inflation would occur over the planning horizon. 397
𝑁𝑁𝑉𝑠 = 𝐸𝐷𝑟𝑟𝑟∗ − 𝐸𝐷𝑠∗ + � �𝐵𝑠,𝑡 − 𝐼𝑠,𝑡�1
(1 + 𝑟)𝑡−2010
𝑡=2060
𝑡=2010
Eq. 3
For non-stationary climate and urban development conditions, the reduction in risk 398 obtained for a specific flood adaptation measure needs to be computed against a 399 baseline accounting for specific climate and urban development conditions (Stern, 400 2007; Zhou et al., 2012). Similarly, in our work 𝑁𝑁𝑉𝑠 was assessed separately for 401 each scenario defined by a specific urban development rate and climate change 402

13
factor. 𝐸𝐷𝑠∗, 𝐵𝑠,𝑡 and 𝐼𝑠,𝑡 were computed for the specific scenario assuming that the 403 adaptation measure was implemented, while 𝐸𝐷𝑟𝑟𝑟∗ was the flood damage for the 404 specific scenario without implementation of any flood adaptation. 405
406
3 RESULTS 407 3.1 EXPECTED ANNUAL DAMAGE FOR DIFFERENT ADAPTATION STRATEGIES 408 Figure 6 illustrates how the simulated expected annual damage 𝐸𝐸𝐷𝑡 changed over 409 the planning horizon as a result of changing design rain intensities and urban growth. 410 We illustrated results for the business as usual scenario (BAU) without 411 implementation of any adaptation strategies and for a separate implementation of 412 each of the 4 considered adaptation strategies: implementation of rainwater 413 harvesting tanks (RWHT), implementation of water sensitive city master plans 414 supporting the development of apartment blocks (WSC), flood zoning and increase 415 of the pipe networks capacity. 416
417 Figure 6. 𝐸𝐸𝐷𝑡 (Eq. 1) for the 9 considered scenarios and different combinations of adaptation 418 options. 419 In all cases, flood risk was most affected by climate change. However, population 420 growth could very much amplify the increase in flood risk and for the BAU scenario 421 𝐸𝐸𝐷𝑡 in 𝑡 = 2060 could be up to 2 times higher for a population growth rate of 422 1.2% than for a population growth rate of 0.8%. A similar effect could be observed 423 when adaptation options were implemented in the models. The only exception was 424 the implementation of a WSC master plan, where population growth was largely 425 balanced by the development of apartment blocks. The smaller number of buildings 426 developed in this case would lead to a reduced flood risk as a result of reduced 427 exposure. 428
The implementation of rainwater harvesting tanks had only minimal influence on the 429 simulated flood risk, while the implementation of a water sensitive cities master plan 430 (WSC), the implementation of flood zoning measures and the increase of pipe 431 capacity all seemed similarly efficient in reducing flood risk. When implementing 432 flood zoning measures, 𝐸𝐸𝐷𝑡 values would approach 0 in the scenario with lowest 433 population growth rate and without climate change, as buildings were gradually 434 removed from flood risk areas. Particularly for the scenarios with strong population 435

14
growth, flood risk would increase over the planning horizon despite the 436 implementation of flood zoning measures. The zoning policy did not account for 437 potential future increases in flood area, so developments occurred in areas that would 438 later become subject to flood risk. 439
Figure 7 depicts the expected damage 𝐸𝐷∗ over the planning horizon (Eq. 2) 440 computed for all pathways where an adaptation measure was implemented. For 441 example, Figure 7 left compares the 𝐸𝐷∗ values for all pathways where urban 442 development followed a business as usual pattern (BAU) against those where a water 443 sensitive cities (WSC) master plan was implemented. Similar trends as in Figure 6 444 can be observed. However, it becomes more clear that an increase of pipe capacity 445 would in our case lead to the most efficient reduction in flood risk, with the lowest 446 mean and the smallest spread of 𝐸𝐷∗ over the different possible pathways. Similarly, 447 flood zoning could efficiently reduce flood risk, while the implementation of a WSC 448 master plan in various scenarios would lead to larger expected damages than for the 449 aforementioned measures. 450
The implementation of rainwater harvesting measures appeared to have little effect 451 on the expected damage values. In fact, median damages were slightly larger for the 452 pathways involving a RWHT implementation rate of 1% than for those without 453 RWHT, and for pathways involving a RWHT implementation rate of 5% than for 454 those with a rate of 3%. The reduction of flood risk due to the reduced amount of 455 urban runoff was in multiple cases outweighed by random variations in the simulated 456 urban development and / or the implementation of zoning measures. For example, if 457 properties in flood prone areas were relocated at the beginning of the planning 458 horizon in one scenario, but not in another, this would have a larger effect on flood 459 risk than the reduction in runoff resulting from rainwater harvesting measures. 460
This is illustrated in Figure 8, where the simulated building footprints and 10-year 461 flood areas are depicted for the year 2040 in a simulation considering flood zoning 462 and implementation rates of RWHT of 3 and 5%. Flood zoning was implemented as 463 a gradual resettling of properties flooded in a 100 year event by random selection. In 464 the pathway considering a RWHT implementation rate of 5%, fewer buildings were 465 removed from the flood prone area by 2040 than in the pathway considering a rate of 466 3%. This lead to a larger expected damage 𝐸𝐷∗ despite the implementation of 467 RWHT. 468

15
469 Figure 7. Boxplot of expected damage 𝐸𝐷∗ over the planning horizon (Eq. 2) derived from simulation 470 results over all scenarios and combination of adaptation measures where the considered measure was 471 or was not implemented. 472
473 Figure 8. Building footprints and flood area for a 10 year event in the year 2040 for two scenarios 474 considering a population growth rate of 1.2% and an annual increase in rain intensity of 1.0%. Urban 475 development was followed the WSC master plan and flood zoning was applied to new and existing 476 properties. Rain water harvesting facilities were installed at rates of 3% (left) and 5% (right). 477 Buildings developed before 2011 were marked grey if they still existed in 2040 in both simulations 478 and orange otherwise. Buildings newly developed in the simulation after 2011 were marked red. 479

16
Table 2 details the insights obtained from the analysis of Figure 7. The median and 480 the standard deviation of the expected damage values 𝐸𝐷∗ were derived from the 481 simulation results for the different scenarios of population growth and climate 482 change and depicted for all the combinations of adaptation measures. Analysing the 483 results for the combination BAU master plan, no flood zoning and no increase in 484 pipe capacity, as well as for the combination WSC master plan, no flood zoning and 485 no increase in pipe capacity, it became clear that the implementation of RWHT did 486 actually lead to a significant reduction in many pathways, particularly if not 487 combined with other adaptation measures. 488
An increase in pipe capacity would lead to somewhat greater reductions in flood risk 489 than the implementation of flood zoning measures, because the latter would take 490 effect only gradually over the planning horizon. Similarly, the implementation of a 491 WSC master plan would lead to somewhat smaller reductions in flood risk, because 492 this measure would take effect only gradually over the planning horizon and 493 reductions of flood risk would occur only somewhat randomly in space as a side-494 effect of a more compact urban development. 495 Table 2. Mean and standard deviation of expected annual damage 𝐸𝐷∗ (Eq. 2) derived for the 9 496 different climate and population growth scenarios for the different adaptation options considered. 497 Master- plan
BAU
Flood-zoning NO YES
Pipe Increase NO YES NO YES
RWHT rate [%/year]
0 1 3 5 0 1 3 5 0 1 3 5 0 1 3 5
Mean ED* [106 AUD] 30.2 28.2 27.2 25.6 7.9 6.9 6.8 6.1 11.5 11.2 10.0 9.7 5.1 4.9 4.4 4.4
Stdv ED* [106 AUD]
15.7 15.5 14.6 13.6 4.8 4.2 4.2 3.7 5.8 5.1 5.1 4.6 3.0 2.9 2.9 2.7
Master-plan
WSC
Mean ED* [106 AUD] 19.1 18.2 17.6 17.6 5.6 5.2 5.0 4.8 8.9 8.7 7.7 8.0 3.5 3.5 3.1 3.1
Stdv ED* [106 AUD] 8.5 9.0 7.6 8.2 3.0 3.0 2.8 2.8 4.3 3.6 3.1 3.9 2.2 1.9 1.6 1.7
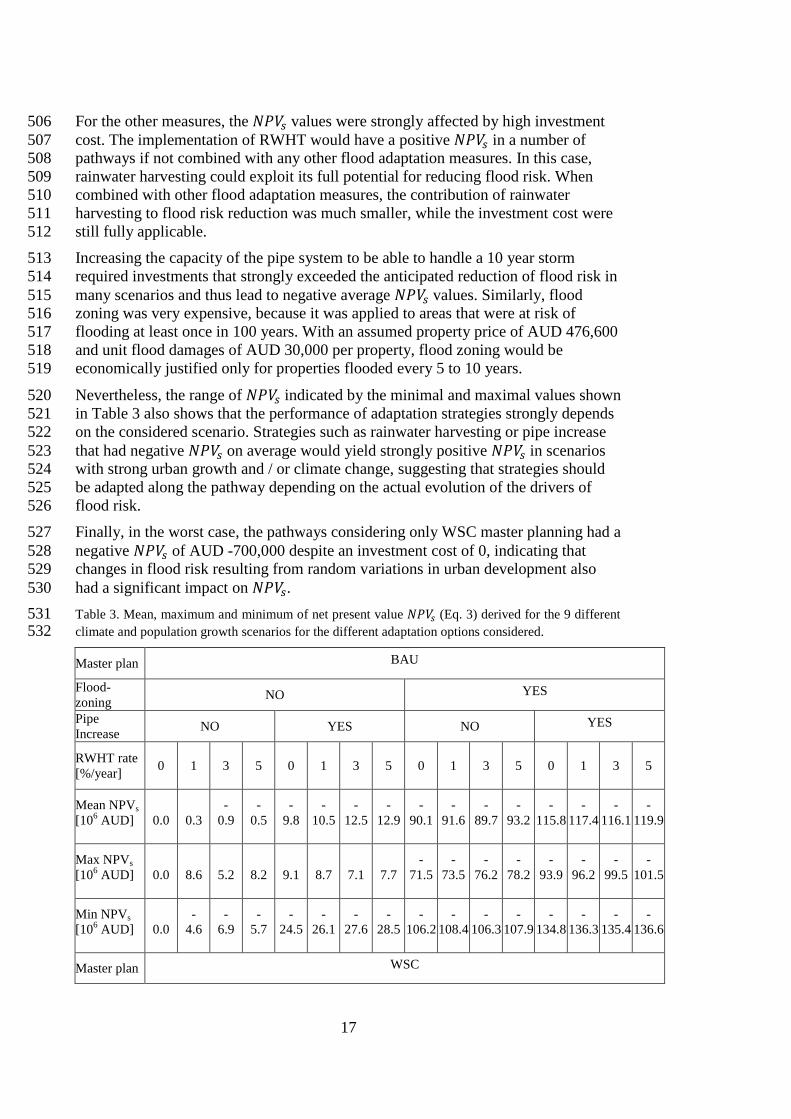
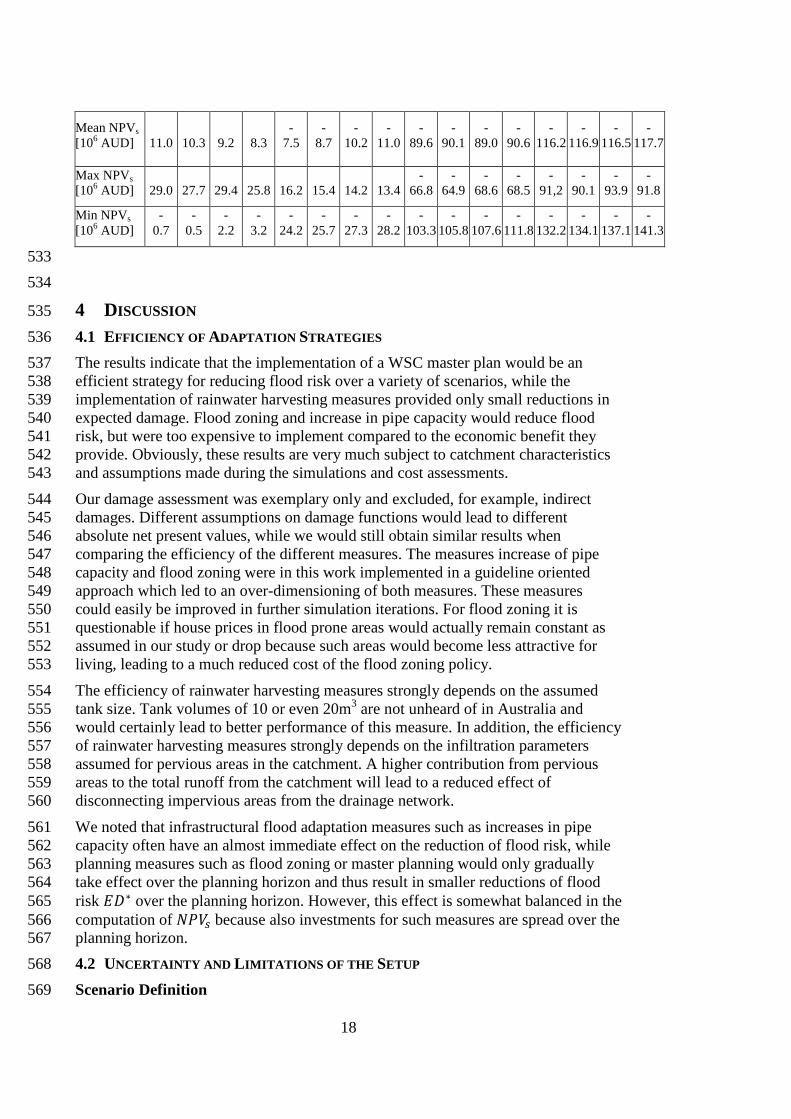
498 3.2 NET PRESENT VALUE FOR DIFFERENT ADAPTATION STRATEGIES 499 Table 3 shows mean, minimum and maximum of 𝑁𝑁𝑉𝑠 derived from the simulation 500 results for the different scenarios of population growth and climate change and 501 depicted for all the combinations of adaptation measures. Considering the investment 502 cost detailed in the supporting material, the implementation of a WSC master plan 503 was the most efficient measure for reducing flood risk, because the investment cost 504 for this measure was considered zero. 505
17
For the other measures, the 𝑁𝑁𝑉𝑠 values were strongly affected by high investment 506 cost. The implementation of RWHT would have a positive 𝑁𝑁𝑉𝑠 in a number of 507 pathways if not combined with any other flood adaptation measures. In this case, 508 rainwater harvesting could exploit its full potential for reducing flood risk. When 509 combined with other flood adaptation measures, the contribution of rainwater 510 harvesting to flood risk reduction was much smaller, while the investment cost were 511 still fully applicable. 512
Increasing the capacity of the pipe system to be able to handle a 10 year storm 513 required investments that strongly exceeded the anticipated reduction of flood risk in 514 many scenarios and thus lead to negative average 𝑁𝑁𝑉𝑠 values. Similarly, flood 515 zoning was very expensive, because it was applied to areas that were at risk of 516 flooding at least once in 100 years. With an assumed property price of AUD 476,600 517 and unit flood damages of AUD 30,000 per property, flood zoning would be 518 economically justified only for properties flooded every 5 to 10 years. 519
Nevertheless, the range of 𝑁𝑁𝑉𝑠 indicated by the minimal and maximal values shown 520 in Table 3 also shows that the performance of adaptation strategies strongly depends 521 on the considered scenario. Strategies such as rainwater harvesting or pipe increase 522 that had negative 𝑁𝑁𝑉𝑠 on average would yield strongly positive 𝑁𝑁𝑉𝑠 in scenarios 523 with strong urban growth and / or climate change, suggesting that strategies should 524 be adapted along the pathway depending on the actual evolution of the drivers of 525 flood risk. 526
Finally, in the worst case, the pathways considering only WSC master planning had a 527 negative 𝑁𝑁𝑉𝑠 of AUD -700,000 despite an investment cost of 0, indicating that 528 changes in flood risk resulting from random variations in urban development also 529 had a significant impact on 𝑁𝑁𝑉𝑠. 530 Table 3. Mean, maximum and minimum of net present value 𝑁𝑁𝑉𝑠 (Eq. 3) derived for the 9 different 531 climate and population growth scenarios for the different adaptation options considered. 532
Master plan BAU
Flood-zoning NO YES
Pipe Increase NO YES NO YES
RWHT rate [%/year] 0 1 3 5 0 1 3 5 0 1 3 5 0 1 3 5
Mean NPVs [106 AUD]
0.0
0.3
- 0.9
- 0.5
- 9.8
- 10.5
- 12.5
- 12.9
- 90.1
- 91.6
- 89.7
- 93.2
-115.8
-117.4
-116.1
-119.9
Max NPVs [106 AUD]
0.0
8.6
5.2
8.2
9.1
8.7
7.1
7.7
- 71.5
- 73.5
- 76.2
- 78.2
- 93.9
- 96.2
- 99.5
- 101.5
Min NPVs [106 AUD]
0.0
- 4.6
- 6.9
- 5.7
- 24.5
- 26.1
- 27.6
- 28.5
- 106.2
- 108.4
-106.3
- 107.9
- 134.8
- 136.3
- 135.4
- 136.6
Master plan WSC
18
Mean NPVs [106 AUD]
11.0
10.3
9.2
8.3
- 7.5
- 8.7
- 10.2
- 11.0
- 89.6
- 90.1
- 89.0
- 90.6
-116.2
-116.9
-116.5
-117.7
Max NPVs [106 AUD]
29.0
27.7
29.4
25.8
16.2
15.4
14.2
13.4
- 66.8
- 64.9
- 68.6
- 68.5
- 91,2
- 90.1
- 93.9
- 91.8
Min NPVs [106 AUD]
- 0.7
- 0.5
- 2.2
- 3.2
- 24.2
- 25.7
- 27.3
- 28.2
- 103.3
- 105.8
- 107.6
- 111.8
- 132.2
- 134.1
- 137.1
- 141.3
533 534
4 DISCUSSION 535 4.1 EFFICIENCY OF ADAPTATION STRATEGIES 536 The results indicate that the implementation of a WSC master plan would be an 537 efficient strategy for reducing flood risk over a variety of scenarios, while the 538 implementation of rainwater harvesting measures provided only small reductions in 539 expected damage. Flood zoning and increase in pipe capacity would reduce flood 540 risk, but were too expensive to implement compared to the economic benefit they 541 provide. Obviously, these results are very much subject to catchment characteristics 542 and assumptions made during the simulations and cost assessments. 543 Our damage assessment was exemplary only and excluded, for example, indirect 544 damages. Different assumptions on damage functions would lead to different 545 absolute net present values, while we would still obtain similar results when 546 comparing the efficiency of the different measures. The measures increase of pipe 547 capacity and flood zoning were in this work implemented in a guideline oriented 548 approach which led to an over-dimensioning of both measures. These measures 549 could easily be improved in further simulation iterations. For flood zoning it is 550 questionable if house prices in flood prone areas would actually remain constant as 551 assumed in our study or drop because such areas would become less attractive for 552 living, leading to a much reduced cost of the flood zoning policy. 553
The efficiency of rainwater harvesting measures strongly depends on the assumed 554 tank size. Tank volumes of 10 or even 20m3 are not unheard of in Australia and 555 would certainly lead to better performance of this measure. In addition, the efficiency 556 of rainwater harvesting measures strongly depends on the infiltration parameters 557 assumed for pervious areas in the catchment. A higher contribution from pervious 558 areas to the total runoff from the catchment will lead to a reduced effect of 559 disconnecting impervious areas from the drainage network. 560
We noted that infrastructural flood adaptation measures such as increases in pipe 561 capacity often have an almost immediate effect on the reduction of flood risk, while 562 planning measures such as flood zoning or master planning would only gradually 563 take effect over the planning horizon and thus result in smaller reductions of flood 564 risk 𝐸𝐷∗ over the planning horizon. However, this effect is somewhat balanced in the 565 computation of 𝑁𝑁𝑉𝑠 because also investments for such measures are spread over the 566 planning horizon. 567 4.2 UNCERTAINTY AND LIMITATIONS OF THE SETUP 568 Scenario Definition 569

19
While the simulation setup coupling DAnCE4Water and MIKEFLOOD aims to 570 support decision makers in evaluating the robustness of different flood adaptation 571 options in uncertain futures, the setup itself is subject to a number of uncertainties. 572 First and foremost, we need to make assumptions about realistic ranges for future 573 developments of climate and city structure. While this goes one step further than 574 simply basing decision making on the assumed most probable future, we cannot 575 explicitly handle uncertainties that we are not aware of (total ignorance in the 576 terminology of (Walker et al., 2013)) or that we cannot quantify (level 5 uncertainty 577 in (Walker et al., 2013)). 578
In our work, we have in all scenarios assumed continued population growth over the 579 next 50 years. However, this assumption may prove wrong, for example, as a result 580 of changes in economic development leading to changes in immigration patterns. In 581 addition, different growth scenarios and developing societal preferences are likely to 582 affect the choice of adaptation measures by, for example, limiting the funds available 583 in the future. As demonstrated by (Lienert et al., 2015), such effects can be 584 considered in the definition of scenarios and can be used to limit the bandwidth of 585 potential developments that need to be considered. 586
Urban Development Modelling 587 The urban development simulations in DAnCE4Water currently focus strongly on 588 the processes of urban densification of Australian cities building on observations 589 over the last decades. However, densification may well lead to the evolution of 590 different urban forms and a more compact city as noted by (Vermeer, 2014) and, 591 other than assumed in our work, land use regulations are unlikely to remain static 592 over the planning horizon and assumptions need to be made on their modification as 593 demonstrated by (Malik et al., 2015). 594
Densification and urban sprawl into rural areas are expected to be affected by 595 elements such as the location of infrastructures and topography. DAnCE4Water 596 allows for the consideration of such elements in the form of, for example, rules for 597 where development should occur, but they were not considered in our case study 598 with a simple catchment, where the focus was on linking hydraulic and urban 599 development modelling. 600
Urban development in different parts of the world would be expected to be subject to 601 different drivers. For example, (Vermeer, 2014) point out the importance of central 602 planning schemes in Beijing and of the development of slums in Mumbai. In Europe, 603 several cities are subject to decreasing populations resulting in de-densification of the 604 areas and re-developments often occur in formerly industrial areas. The consideration 605 of such effects requires an analysis of the local development patterns and the 606 considered effects need to be accepted by the involved stakeholders. 607
Finally, planning paradigms change after extreme flood or drought events. While it is 608 in principle possible to include such effects in our simulation framework, little work 609 was published to consider them in simulations of urban development. 610
Flood Risk Assessment 611 While we assumed that the flood risk assessment based on 1D-2D hydrodynamic 612 simulations is a good approximation of the true flood response in the catchment, this 613 assessment is subject to a number of uncertainties themselves. To name a few 614
20
potential sources, there are effects from the parameters used to describe the coupling 615 between 1D drainage network model and 2D surface models, from simplifications of 616 the model description of drainage network and terrain surface and from uncertain 617 parameters used to describe runoff from pervious areas. In the damage assessment, 618 damage curves used for translating simulated flood hazard into damages are 619 commonly subject to large uncertainty and the methodology used for assessing 620 damages (for example thresholds on water depth where buildings are assumed 621 flooded) will strongly impact the simulated risk. Finally, discount rates for the 622 computation of expected damages depend on the local decision maker’s preference. 623 The impacts of such uncertainties on the preference of adaptation options in urban 624 areas are unknown to date and require a systematic assessment as proposed with the 625 “model chain” by (Apel et al., 2008). 626
Finally, our results showed that random variations in urban development can lead to 627 quite significant differences in the simulated flood damage. For example, urban 628 development could occur in more or less flood prone areas earlier or later along a 629 simulated pathway. Similarly, a property subject to flood zoning measures would be 630 resettled at random time points along a pathway, meaning that in some simulations 631 strong reductions would occur earlier along the pathway than in others. In some 632 cases, such effects had a stronger influence on our simulated expected damages, than 633 the implementation of rainwater harvesting measures. It may well be desirable to 634 include such uncertainties in the assessment, as they provide an idea of the effect of 635 small variations in urban development on the simulated damages. For this purpose, it 636 is important to ensure that the results actually are random, i.e., that different 637 scenarios are based on independent simulations of urban development. 638
639 4.3 SIMULATION TIMES AND EXPERIMENTAL SETUP 640 A main concern with implementing a framework based on an agent-based urban 641 development model and a 1D-2D hydrodynamic model would be the simulation time 642 and the numerical stability. We have performed the urban development and 643 hydrodynamic simulations in separate cluster environments in Australia and 644 Denmark and implemented a file based communication between the models via 645 Dropbox. Simulation times were approximately 30 minutes for a period of 10 years 646 in DAnCE4Water and 1 hour for simulating a single rain event in MIKE FLOOD. 647 With a total of approximately 12,000 simulated rain events in MIKE FLOOD, such a 648 setup is only feasible in a scientific context. Numerical stability is not a problem in 649 DAnCE4Water by design. Performing automated hydrodynamic simulations without 650 failures requires a careful preparation of the hydraulic model but was not a constraint 651 for our work and was also demonstrated feasible in the application of 1D-2D 652 modelling for online flood warning systems (Meneses et al., 2015). 653
The coupled simulation setup was in this work operated in a pathway oriented 654 manner. For each combination of adaptation options and climate change and urban 655 development scenario a separate set of simulations was performed. While this setup 656 seems natural, it is also likely to be inefficient because hydrodynamic simulations 657 were performed multiple times for very similar combinations of rainfall and number 658 of households within a pathway and across different scenarios. The introduction of 659

21
additional dimensions such as coastal flood risk or larger numbers of adaptation 660 options would explode the computational requirements to infeasible levels. 661
On the other hand, our results indicate that the simulated damage values evolve 662 rather smoothly along the dimensions rainfall and number of households in the 663 catchment for a given adaptation approach (see supporting material). It is thus 664 expected the computational effort can be limited with an experimental design where 665 flood damage is only simulated for a few key combinations of rainfall and urban 666 development and otherwise interpolated between the simulated results. 667
668 4.4 OUTLOOK 669 Computational requirements and the complexity of setting up the modelling 670 framework and obtaining required input data are crucial issues for the application of 671 our simulation framework in flood risk management practice. The computational 672 requirements for hydraulic simulation can be reduced by applying simplified models. 673 Approaches which can directly account for modifications of the terrain such as 674 cellular automata (Ghimire et al., 2013; Shao et al., 2015; Viavattene and Ellis, 2013) 675 or conceptual models which can be automatically generated from drainage network 676 and terrain surface (CH2M, 2015; Wolfs et al., 2013) are preferable for this purpose. 677 Similarly, urban development models can be difficult to set up if large amounts of 678 socioeconomic data are required as input to the models. Current research therefore 679 focuses on the development of approaches that can be employed with a minimum of 680 input data (Mikovits et al., 2015b). 681
While our work presented the implementation of a coupled simulation framework, 682 the results of this framework can flexibly be applied in different decision 683 frameworks, assigning for example different probabilities to different scenarios of 684 future developments (Borgomeo et al., 2014) or performing optimization of 685 adaptation options along each pathway (Kwakkel et al., 2015) to identify robust 686 combinations of adaptation. In the latter case, our setup would be used to simulate 687 the effect of different land-use policies and flood adaptation measures on flood risk 688 at a given time point, replacing the simple model applied by (Kwakkel et al., 2015). 689 The computational effort related to such setups can be addressed through 690 implementation in cluster environments as well as the application of surrogate 691 models and experimental setups that minimize the number of simulations, for 692 example, sequential setups described by (Kleijnen, 2015). 693
694
5 CONCLUSIONS 695
We have presented a framework for systematic assessment of flood risk adaptation 696 options under uncertain futures, employing the agent-based urban development 697 model DAnCE4Water and the 1D-2D hydrodynamic model MIKE FLOOD. We 698 applied the setup to evaluate a variety of flood adaptation options in a case study in 699 Melbourne, Australia and draw the following conclusions: 700
1. It is feasible to perform systematic assessment of flood adaptation options in 701 an automated manner applying urban development and hydraulic models with 702 high level of detail. 703
22
2. The computational effort involved in running such a setup is significant. 704 Attempts to reduce it may involve an optimized experimental design where 705 flood damage surfaces are interpolated from selected sample points. 706
3. The new simulation setup provides damage assessments for a variety of 707 combinations of adaptation options in a variety of potential futures. These 708 results can be flexibly coupled to various decision making frameworks for 709 choosing the preferred flood risk adaptation option. 710
4. The performance of adaptation strategies strongly depends on both, the 711 considered climate and adaptation scenarios and on the other adaptation 712 strategies implemented. Strategies that can be adapted to the observed 713 developments along the planning horizon are thus often preferable over large 714 one-off investments. Our setup can support the development of such 715 strategies by simulating the effect of different measures in various scenarios. 716
5. Urban planning policies were an efficient measure to reduce flood risk in our 717 case study. Guideline oriented approaches of increasing the pipe system to 718 handle rain events with fixed return periods of 10 years and buying back 719 properties in areas flooded at least once in 100 year resulted in investment 720 cost which, for many climate and population growth scenarios, were not 721 justified by the reduction in flood risk. Nevertheless, an ad-hoc definition of 722 planning criteria is common practice in many countries. 723
6. The agent-based urban development model evolves the city in a random 724 manner, developing properties at different locations and time points in 725 different scenarios. Such variations can have quite significant influence on 726 simulated flood damages. 727
7. While our setup flexibly assesses adaptation options for a variety of potential 728 futures, we still need to make assumption on realistic ranges and paths for 729 urban development and climate. Modelling thus provides the decision maker 730 with an overview over which options are robust in which situations, but it 731 does not provide a guarantee that a selected design will be functional. 732
8. The data needs for the urban development model are limited to layers of 733 buildings, parcels and households and the setup is thus easy to implement in 734 different cases. This property comes at the cost of excluding social processes 735 from the model. Further, the model is specific for the case of densification of 736 built-up residential areas. The application in other regions requires the 737 implementation of alternative development procedures to model, for example, 738 the redevelopment of city centres. 739
740
6 ACKNOWLEDGEMENTS 741
This research has been financially supported by the Australian Government through 742 the CRC for Water Sensitive Cities. The catchment data were kindly provided by 743 Melbourne Water. Vanessa Wong supported the data preparation and provided 744 important input for the urban development scenarios. 745
746
7 REFERENCES 747
Aerts, J.C.J.H., Botzen, W.J.W., Emanuel, K., Lin, N., Moel, H. De, 2014. 748

23
Evaluating Flood Resilience Strategies for Coastal Megacities. Science 344, 749 473–475. 750
Apel, H., Merz, B., Thieken, A.H., 2008. Quantification of uncertainties in flood risk 751 assessments. International Journal of River Basin Management 6, 149–162. 752
Arnbjerg-Nielsen, K., 2012. Quantification of climate change effects on extreme 753 precipitation used for high resolution hydrologic design. Urban Water Journal 9, 754 57–65. 755
Australia Institution of Engineers, 1987. Australian Rainfall and Runoff - A Guide to 756 Flood Estimation, Revised Edition. Australia. 757
Bach, P.M., Mccarthy, D.T., Deletic, A., 2015. Can we model the implementation of 758 water sensitive urban design in evolving cities? Water Science & Technology 759 71, 149. 760
Bach, P.M., McCarthy, D.T., Urich, C., Sitzenfrei, R., Kleidorfer, M., Rauch, W., 761 Deletic, A., 2013. A planning algorithm for quantifying decentralised water 762 management opportunities in urban environments. Water Science & Technology 763 68, 1857–1865. 764
Barreira González, P., Aguilera-Benavente, F., Gómez-Delgado, M., 2015. Partial 765 validation of cellular automata based model simulations of urban growth: An 766 approach to assessing factor influence using spatial methods. Environmental 767 Modelling & Software 69, 77–89. 768
Batty, M., 2009. Urban Modeling, in: Thrift, N., Kitchin, R. (Eds.), International 769 Encyclopedia of Human Geography. Elsevier, Oxford, United Kingdom, pp. 770 51–58. 771
Borgomeo, E., Hall, J.W., Fung, F., Watts, G., Colquhoun, K., Lambert, C., 2014. 772 Risk-based water resources planning: Incorporating probabilistic nonstationary 773 climate uncertainties. Water Resources Research 50, 6850–6873. 774
CH2M, 2015. Flood Modeller - User Manual. 775
Cohen, B., 2004. Urban Growth in Developing Countries: A Review of Current 776 Trends and a Caution Regarding Existing Forecasts. World Development 32, 777 23–51. 778
Crooks, A., Castle, C., Batty, M., 2008. Key challenges in agent-based modelling for 779 geo-spatial simulation. Computers, Environment and Urban Systems 32, 417–780 430. 781
CSIRO, Bureau of Meteorology, 2015. Climate Change in Australia Technical 782 Report. Australia. 783
DHI, 2013. MIKE FLOOD - 1D-2D Modelling - User Manual. 784
Ehret, U., Götzinger, J., Bárdossy, A., Pegram, G., 2008. Radar based flood 785 forecasting in small catchments, exemplified by the Goldersbach catchment, 786 Germany. International Journal of River Basin Management 6, 323–329. 787
ESRI, 2012. ArcGIS Desktop: Release 10. 788

24
French, R., Jones, M., 2012. Design rainfall temporal patterns in Australian Rainfall 789 and Runoff : Durations exceeding one hour *. Australian Journal of Water 790 Resources 16, 21–28. 791
GDAL Development Team, 2014. GDAL - Geospatial Data Abstraction Library, 792 Version 1.11.0. 793
Gersonius, B., Nasruddin, F., Ashley, R., Jeuken, A., Pathirana, A., Zevenbergen, C., 794 2012. Developing the evidence base for mainstreaming adaptation of 795 stormwater systems to climate change. Water research 46, 6824–35. 796
Ghimire, B., Chen, A.S., Guidolin, M., Keedwell, E.C., Djordjević, S., Savić, D. a., 797 2013. Formulation of a fast 2D urban pluvial flood model using a cellular 798 automata approach. Journal of Hydroinformatics 15, 676. 799
Granger, C.W.J., Jeon, Y., 2007. Long-term forecasting and evaluation. International 800 Journal of Forecasting 23, 539–551. 801
Hall, J., Arheimer, B., Borga, M., Brázdil, R., Claps, P., Kiss, A., Kjeldsen, T.R., 802 Kriaučūnienė, J., Kundzewicz, Z.W., Lang, M., Llasat, M.C., Macdonald, N., 803 McIntyre, N., Mediero, L., Merz, B., Merz, R., Molnar, P., Montanari, A., 804 Neuhold, C., Parajka, J., Perdigão, R.A.P., Plavcová, L., Rogger, M., Salinas, 805 J.L., Sauquet, E., Schär, C., Szolgay, J., Viglione, A., Blöschl, G., 2014. 806 Understanding flood regime changes in Europe: A state-of-the-art assessment. 807 Hydrology and Earth System Sciences 18, 2735–2772. 808
Handmer, J., Read, C., Percovich, O., Reed, C., Percovich, O., 2003. Disaster Loss 809 Assessment Guidelines, Assessment. Dickson, Australia. 810
Henonin, J., Hongtao, M., Zheng-Yu, Y., Hartnack, J., Havnø, K., Gourbesville, P., 811 Mark, O., 2015. Citywide multi-grid urban flood modelling: the July 2012 flood 812 in Beijing. Urban Water Journal 12, 52–66. 813
Hinkel, J., Lincke, D., Vafeidis, A.T., Perrette, M., Nicholls, R.J., Tol, R.S.J., 814 Marzeion, B., Fettweis, X., Ionescu, C., Levermann, A., 2014. Coastal flood 815 damage and adaptation costs under 21st century sea-level rise. Proceedings of 816 the National Academy of Sciences of the United States of America 111, 3292–817 7. 818
Hoymann, J., 2010. Spatial allocation of future residential land use in the Elbe River 819 Basin. Environment and Planning B: Planning and Design 37, 911–928. 820
Huong, H.T.L., Pathirana, A., 2013. Urbanization and climate change impacts on 821 future urban flood risk in Can Tho city, Vietnam. Hydrology and Earth System 822 Sciences 17, 379–394. 823
Kleijnen, J.P.C., 2015. Design and analysis of simulation experiments, 2nd ed. 824 Springer, Tilburg, The Netherlands. 825
Kwakkel, J., Haasnoot, M., Walker, W.E., 2015. Developing dynamic adaptive 826 policy pathways: a computer-assisted approach for developing adaptive 827 strategies for a deeply uncertain world. Climatic Change 132, 373–386. 828
Lienert, J., Scholten, L., Egger, C., Maurer, M., 2015. Structured decision-making 829 for sustainable water infrastructure planning and four future scenarios. EURO 830

25
Journal on Decision Processes 3, 107–140. 831
Madsen, H., Lawrence, D., Lang, M., Martinkova, M., Kjeldsen, T.R., 2014. Review 832 of trend analysis and climate change projections of extreme precipitation and 833 floods in Europe. Journal of Hydrology 519, 3634–3650. 834
Malik, A., Crooks, A., Root, H., Swartz, M., 2015. Exploring creativity and urban 835 development with agent-based modeling. Journal of Artificial Societies and 836 Social Simulation 18, 1–19. 837
Matthews, R.B., Gilbert, N.G., Roach, A., Polhill, J.G., Gotts, N.M., 2007. Agent-838 based land-use models: a review of applications. Landscape Ecology 22, 1447–839 1459. 840
Mendelsohn, R., 2006. Critique of the Stern Report, A. Regulation 42–46. 841
Meneses, E.J., Löwe, R., Brødbæk, D., Courdent, V., Petersen, S.O., 2015. SURFF - 842 Operational Flood Warnings for Cities Based on Hydraulic 1D-2D Simulations 843 and NWP, in: Proceedings of the 10th International Conference on Urban 844 Drainage Modelling (UDM). Québec, Canada. 845
Merz, B., Aerts, J.C.J.H., Arnbjerg-Nielsen, K., Baldi, M., Becker, A., Bichet, A., 846 Blöschl, G., Bouwer, L.M., Brauer, A., Cioffi, F., Delgado, J.M., Gocht, M., 847 Guzzetti, F., Harrigan, S., Hirschboeck, K., Kilsby, C., Kron, W., Kwon, H.H., 848 Lall, U., Merz, R., Nissen, K., Salvatti, P., Swierczynski, T., Ulbrich, U., 849 Viglione, A., Ward, P.J., Weiler, M., Wilhelm, B., Nied, M., 2014. Floods and 850 climate: Emerging perspectives for flood risk assessment and management. 851 Natural Hazards and Earth System Sciences 14, 1921–1942. 852
Merz, B., Hall, J., Disse, M., Schumann, A., 2010. Fluvial flood risk management in 853 a changing world. Natural Hazards and Earth System Sciences 10, 509–527. 854
Merz, B., Vorogushyn, S., Lall, U., Viglione, A., Bloeschl, G., 2015. Charting 855 unknown water - on the role of surprise in flood risk assessment and 856 management. Water Resources Research 51, 6399–6416. 857
Mikovits, C., Rauch, W., Kleidorfer, M., 2015a. A dynamic urban development 858 model designed for purposes in the field of urban water management. Journal of 859 Hydroinformatics 17, 390–403. 860
Mikovits, C., Rauch, W., Kleidorfer, M., 2015b. A dynamic urban development 861 model designed for purposes in the field of urban water management. Journal of 862 Hydroinformatics 17, 390–403. 863
Muis, S., Güneralp, B., Jongman, B., Aerts, J.C.J.H., Ward, P.J., 2015. Flood risk 864 and adaptation strategies under climate change and urban expansion: A 865 probabilistic analysis using global data. The Science of the total environment 866 538, 445–457. 867
Muller, M., 2007. Adapting to climate change: water management for urban 868 resilience. Environment and Urbanization 19, 99–113. 869
Olsen, A.S., Zhou, Q., Linde, J.J., Arnbjerg-Nielsen, K., 2015. Comparing methods 870 of calculating expected annual damage in urban pluvial flood risk assessments. 871 Water 7, 255–270. 872

26
Olsen, J.R., Lambert, J.H., Haimes, Y.Y., 1998. Risk of extreme events under 873 nonstationary conditions. Risk Analysis 18, 497–510. 874
Poelmans, L., Rompaey, A. Van, Ntegeka, V., Willems, P., 2011. The relative impact 875 of climate change and urban expansion on peak flows: A case study in central 876 Belgium. Hydrological Processes 25, 2846–2858. 877
Poelmans, L., Van Rompaey, A., 2010. Complexity and performance of urban 878 expansion models. Computers, Environment and Urban Systems 34, 17–27. 879
Prudhomme, C., Wilby, R.L., Crooks, S., Kay, A.L., Reynard, N.S., 2010. Scenario-880 neutral approach to climate change impact studies: Application to flood risk. 881 Journal of Hydrology 390, 198–209. 882
Russo, B., Sunyer, D., Velasco, M., Djordjević, S., 2015. Analysis of extreme 883 flooding events through a calibrated 1D/2D coupled model: the case of 884 Barcelona (Spain). Journal of Hydroinformatics 17, 473–492. 885
Sekovski, I., Armaroli, C., Calabrese, L., Mancini, F., Stecchi, F., Perini, L., 2015. 886 Coupling scenarios of urban growth and flood hazards along the Emilia-887 Romagna coast (Italy). Natural Hazards and Earth System Sciences 15, 2331–888 2346. 889
Semadeni-Davies, A., Hernebring, C., Svensson, G., Gustafsson, L.G., 2008. The 890 impacts of climate change and urbanisation on drainage in Helsingborg, 891 Sweden: Combined sewer system. Journal of Hydrology 350, 100–113. 892
Shao, Q., Weatherley, D., Huang, L., Baumgartl, T., 2015. RunCA: A cellular 893 automata model for simulating surface runoff at different scales. Journal of 894 Hydrology 529, 816–829. 895
Stedinger, J.R., 1997. Expected Probability and Annual Damage Estimators. Journal 896 of Water Resources Planning and Management 123, 125–135. 897
Stern, N., 2007. The Economics of Climate Change - The Stern Review, 1st ed. 898 Cambridge University Press, Cambridge, United Kingdom. 899
Stern, N., 2016. Current climate models are grossly misleading. Nature 530, 407–900 409. 901
Sun, Y., Solomon, S., Dai, A., Portmann, R.W., 2007. How often will it rain? Journal 902 of Climate 20, 4801–4818. 903
Sunyer, M.A., Rosbjerg, D., Madsen, H., Luchner, J., Arnbjerg-Nielsen, K., 2014. 904 Comparison of different statistical downscaling methods to estimate changes in 905 hourly extreme precipitation using RCM projections from ENSEMBLES. 906 International Journal of Climatology. 907
The State of Victoria - Department of Transport Planning and Local Infrastructure, 908 2014. Plan Melbourne. Melbourne, Australia. 909
Urich, C., Rauch, W., 2014. Exploring critical pathways for urban water 910 management to identify robust strategies under deep uncertainties. Water 911 research 66C, 374–389. 912
USACE, 1989. EAD - Expected Annual Flood Damage Computation - User’s 913

27
Manual. 914
USACE, 1992. Guidelines for Risk and Uncertainty Analysis in Water Resources 915 Planning. Fort Belvoir, VA, United States. 916
Vermeer, D., 2014. Economic and urban growth models. Exeter, United Kingdom. 917
Viavattene, C., Ellis, J.B., 2013. The management of urban surface water flood risks: 918 SUDS performance in flood reduction from extreme events. Water Science and 919 Technology 67, 99–108. 920
Waddell, P., 2002. UrbanSim - Modeling urban development for land use, 921 transportation, and environmental planning. Journal of the American Planning 922 Association 68, 297–314. 923
Walker, W.E., Lempert, R., Kwakkel, J., 2013. Deep Uncertainty. Encyclopedia of 924 Operational Research and Management Science. 925
Walker, W.E., Rahman, S.A., Cave, J., 2001. Adaptive policies, policy analysis, and 926 policy-making. European Journal of Operational Research 128, 282–289. 927
Wolfs, V., Villazon, M.F., Willems, P., 2013. Development of a semi-automated 928 model identification and calibration tool for conceptual modelling of sewer 929 systems. Water Science and Technology 68, 167–175. 930
Wong, V., 2014. An investigation into infrastructure system response to climate 931 change adaptation strategies in the Scotchman’s Creek Catchment. Monash 932 University, Melbourne, Australia. 933
Zhou, Q., Mikkelsen, P.S., Halsnæs, K., Arnbjerg-Nielsen, K., 2012. Framework for 934 economic pluvial flood risk assessment considering climate change effects and 935 adaptation benefits. Journal of Hydrology 414–415, 539–549. 936
Zhu, T., Lund, J.R., Jenkins, M.W., Marques, G.F., Ritzema, R.S., 2007. Climate 937 change, urbanization, and optimal long-term floodplain protection. Water 938 Resources Research 43, 1–11. 939
940
8 FIGURE CAPTIONS 941
942

1
Supporting Material for “Assessment of Urban Pluvial Flood Risk and Efficiency of Adaptation Options Through Simulations – A New Generation of Urban Planning Tools” S1 MODELLING SETUP S1.1 HYDRAULIC FLOOD MODELLING The Scotchman’s Creek catchment is drained through separate pipe systems for stormwater and wastewater. We were provided with a highly detailed model of the stormwater drainage network by Melbourne Water. The model contained a total of 1,300 links with diameters of 0.1m and higher. The catchment area was divided into 1,500 subcatchments for which runoff hydrographs were computed. The hydrographs were then used as input to the nearest manhole in the stormwater pipe system. Impervious area percentages in the subcatchments were computed from building footprints and road polygons provided by the utility company Melbourne Water. Based on an analysis of aerial imagery (Wong, 2014), the impervious roof area within a subcatchment was increased by 15% to account for sealed areas such as terraces or private parking. Rainfall on impervious areas was assumed to be subject to an initial loss of 0.4mm and otherwise to be fully transformed into runoff.
Infiltration from unsealed areas was described using Horton’s equation (Chow et al., 1988). The duplex soil types mostly present in the catchment (The State of Victoria - Department of Economic Development Jobs Transport and Resources, 2016) have a sharp contrast in texture between top and subsoil, typically with less permeable layer in the subsoil. We thus assumed an initial loss of 6mm for runoff from pervious areas and initial and final infiltration capacities corresponding to loamy soils with 36mm/h and 3.6mm/h, respectively.
Digital elevation information was available from Geoscience Australia with a horizontal resolution of 5m (Geoscience Australia, 2015) and used to model surface water flow in MIKE FLOOD using a standard raster-based approach. Design rainfalls were extracted from Australian guidelines (Australia Institution of Engineers, 1987; French and Jones, 2012).
S1.2 URBAN DEVELOPMENT MODELLING DAnCE4Water’s urban and infrastructure development component evolves the urban environment at parcel level detail under different adaptation options. The process is driven by population projections which define the rate at which new households appear in the catchment. As described in the article, urban development is modelled as an interaction between the three actors city council, developers and households. In short, the city council defines zones where certain forms of development occur, developers create new buildings if there is a demand for housing (see (Urich and

2
Rauch, 2014)) and households move into empty residential units. The agents’ actions are manifested in the model using procedural modelling algorithms.
In practice, the user needs to define zoning policies that are implemented as rules in the model and rules for whether developers should preferably develop certain areas of the city, depending on, for example, distance to transport routes, service centres or green areas.
Urban development is then implemented by (re-)developing parcels. New households appear in the catchment on a yearly basis based on the population projection. To satisfy the housing demand, developers select a number of parcels to develop based on their “attractiveness” (Stevens et al., 2007). In zones where infill development occurs, parcels are marked as available for subdivision. Subsequently, procedural algorithms (Vanegas et al., 2012) are applied to split each parcel in such a way, that as many new parcels as possible are generated, while the area of each new parcel remains above a user-defined threshold. Similarly, in zones where apartment blocks should be developed, existing parcels are merged to obtain a minimal parcel size. Existing building footprints are replaced by either template footprints or modelled building footprints (Müller et al., 2006).
For the Scotchman’s Creek case study, we have modelled urban development over a planning horizon of 50 years in 5 year intervals. Parcels were subdivided to a minimum area of 300m2 during parcel splitting, while a minimum parcel size of 1,800m2 was assumed for apartment blocks. Table S 1 summarizes the components included in the urban development model in our case study. Table S 2 summarizes the interactions between the agents and the development parameters applied. Technically, the urban development model is implemented as GIS layers in a SQLITE database. Table S 1. Components of city database model. Components are linked through attributes in the corresponding GIS layers.
Component Abbrev-iation
Links to other com-ponents
Source
Households H U Census data stochastically disaggregated and assigned to U
Residential Units U B Census data stochastically disaggregated and assigned to B
Buildings B P Melbourne Water
Parcels P Cadastral maps
Rainwater Harvesting Tank
RWHT P -
100y flood zone FZ P Melbourne Water

3
Table S 2. Actors and rules used to implement land use policies in the urban development model.
Agent Rule
City Council Impose zoning regulation on parcel. Subdivide parcel according to zoning regulation.
Urban Developer Select parcel with highest “attractiveness” (𝛼𝑝) and build buildings with n residential units according to zoning regulation. Repeat until demand for residential units Δ𝑈𝑡 is fulfilled.
Household If unplaced move into residential unit with highest 𝑎𝑝. Repeat until all Δ𝐻𝑡 are placed or until all residential units are filled.
Parameter Description
Vacancy (%) 𝑣𝑡 = ∑𝑈𝑡∑𝐻𝑡− 1 �= 𝑛𝑛.𝑛𝑜 𝑟𝑟𝑟𝑟𝑟𝑟𝑛𝑡𝑟𝑟𝑟 𝑢𝑛𝑟𝑡𝑟
𝑛𝑛.𝑛𝑜 ℎ𝑛𝑢𝑟𝑟ℎ𝑛𝑟𝑟𝑟− 1�
Demand Residential Units
Δ𝑈𝑡 = (𝑣 − 𝑣𝑡) �𝑈𝑡 𝑣… Target vacancy (3%)
Parcel Attractiveness (m-1)
𝑎𝑝 ~𝑈([0,1]) Uniformly distributed based on (Wong, 2014)
Unplaced Households Δ𝐻𝑡= 𝐻𝑡−1 ⋅ ℎ + 𝐻𝑅,𝑡 ℎ… Household growth rate (0.004, 0.008 or 0.012)
𝐻𝑅 ... Relocated households from flood zone (see Section S3)
Figure S 1 and Figure S 2 illustrate the development zoning implemented in the two considered scenarios. In the BAU scenario, densification through parcel splitting at random locations was implemented in the whole catchment on Medium Density Residential zones. In the WSC scenario, apartment blocks containing 15 residential units each were developed along transport corridors. Parcel splitting was implemented in Medium Density Residential Zones in a limited part of the catchment, while the urban form was assumed unchanged in the remaining part of the catchment. Evidently, for the same population the BAU scenario lead to a significantly more dense development pattern than the WSC scenario.
As discussed in the article, the implemented urban development procedures provide a realistic image of the processes occurring in built-up areas of Australian cities. To apply the model to a different context they require an analysis of the dominant processes in other case studies and an extension of the modelling framework with suitable development rules.

4
Figure S 1. Development zoning and simulated urban development until 2060 in the BAU scenario for a population growth rate of 0.8%/year
Figure S 2. Development zoning and simulated urban development until 2060 in the WSC scenario for a population growth rate of 0.8%/year

5
S2 IMPLEMENTATION OF FLOOD ADAPTATION MEASURES In our article, we have considered a number of structural and non-structural measures that aim at reducing flood risk in the catchment. To illustrate the potential of the coupled software framework, we considered a spectrum of options ranging from the implementation of urban planning policies to classical engineering solutions.
The considered options were:
1. Master plans controlling the form of urban development. As discussed above, two different master plans were implemented by defining different development zonings. The main difference between the two is that a less dense urban development pattern was implemented in the WSC scenario along with the construction of multi-storey buildings along transport corridors.
2. Flood zoning. This strategy focused on reducing the exposure to flood hazards through a buyback of properties. Buildings which were at risk of flooding more often than once in 100 years in the status situation in 2010 would be assigned a chance of 3% to be bought back during any year of the planning horizon. Buildings on the parcel were removed and the parcel converted into a green area in the urban development model. The households were relocated within the catchment.
3. Large scale implementation of rainwater harvesting facilities (RWHT). Due to the positive effects on drinking water consumption, this is an often considered strategy amongst Australian stakeholders to reduce water demand. Tank sizes vary, but typically range between 1 and 10m3 (National Water Commission, 2008). We considered four scenarios, where rainwater tanks were implemented randomly throughout the catchment in the urban development model. The scenarios had different implementation rates of 0, 1, 3 and 5% per year. This means that for each year during the planning horizon any building without rainwater harvesting would have a chance between 0 and 5% to have a rainwater tank implemented. In the modelling setup, DAnCE4Water would randomly select buildings where RWHT should be implemented at different time points. When updating the MIKE FLOOD rainfall-runoff model (MOUSE) based on the simulated building footprints (see Section 2.5 in the paper), the roof area of a building with rainwater tank was considered as pervious area during runoff computation. This approach was easily implemented because the building could simply be neglected in the computation of impervious area percentages for the concerned sub-catchment. It was motivated by the fact that we did not have access to detailed information on typical rain water tank sizes in the area. Total effective rainfall during the considered design storms was typically approximately 25mm smaller for pervious areas than for impervious areas. Approximately 18mm of this reduction occurred in the beginning of the rain event, i.e., before any runoff occurred. Considering a median roof area of 165m2 in the catchment, this reduction in runoff would correspond to a typical effective rainwater tank size of 3 to 4 m3
4. Increase in pipe capacity. In this strategy the dimension of the stormwater pipes was increased until

6
flooding no longer occurred more than once in 10 years anywhere in the catchment in the status situation in 2010. The strategy was implemented in the model simply by replacing the original pipe network by a (manually) modified pipe network in those simulations where an increase of pipe capacity should be considered. This approach is generic and would also allow for the consideration of other modifications in the hydraulic model, i.e., modified models for different adaptation options are developed manually and then inserted into the model as “templates” in combination with various other adaptation measures.
We performed an assessment of the expected investment cost for each adaptation measure, as well as potential benefits each measure could yield in addition to the reduction in flood risk. An overview of the considered cost and benefits is provided in Table S 3.

7
Table S 3. Investment cost and additional benefits considered for the different flood adaptation strategies considered
Flood Adaptation Strategy Investment Cost 𝐼𝑟,𝑡 Additional Benefits 𝐵𝑟,𝑡 1. Master Planning - -
2. Flood Zoning AUD 476,600 per bought back property, corresponding to Melbourne median house price in 2011 (Stapledon, 2012)
-
3. Rainwater Harvesting Installation cost: Tank installation: AUD 2170 Pump installation: AUD 355 replacement of pumps every 10 years, replacement of tanks every 25 years Running cost: 20 AUD/year fixed cost 0.05 AUD/cbm of rainwater usage
(cost taken from (Tam et al., 2010))
AUD 99 /year for each installed rainwater tank, assuming a drinking water price of 3 AUD/cbm (South East Water, 2016) and an annual reduction in drinking water consumption of 33cbm per installed rainwater tank (Moglia et al., 2015)
4. Increase in Pipe Capacity AUD 32,500,000 assumed as a one-off investment in the first year of the planning horizon for modifying 8300m of existing pipes. Considering the cost of breaking up bitumen, trenching and backfilling, installing new pipes and manholes and paving (Rawlinsons, 2011)
-
8
S3 FLOOD DAMAGE EVALUATION The 1D-2D hydrodynamic simulations result in raster layers of water depths simulated in the different pixels for different time points during a rain event. For planning purposes, the simulated water depths should be translated into damage values for each event. A variety of damage assessment frameworks with differing levels of complexity were suggested both internationally (Hammond et al., 2015; Merz et al., 2010; Velasco et al., 2015) and in Australia (Middelmann-Fernandes, 2010; Office of Environment and Heritage, 2007; Smith and Greenaway, 1994; Sturgess, 2000).
The purpose of this article is to illustrate the coupled urban development and hydrodynamic flood modelling framework rather than provide an exact damage assessment. Considering the variety of different damage assessment methods developed in Australia, we therefore resorted to a unit cost approach focusing on direct cost resulting from damages to buildings and roads for illustrative purposes, applying damage values provided in (Handmer et al., 2003) after inflation adjustment from the year 1999 to 2011 (Reserve Bank of Australia, 2016):
• Buildings were assumed to incur a damage of AUD 29,742 if the maximal simulated water level in any pixel next to a building exceeded 0.3m.
• Flooded roads were assumed to incur a damage of AUD 3.63 per sqm of road where the maximal simulated water level exceeded 0.3m. The damage value was derived from the per km road length damages provided in (Handmer et al., 2003) assuming an average width of 7.5m for minor roads and 24m for major roads.
9
S4 VARIATION OF FLOOD DAMAGES AS A FUNCTION OF RAINFALL AND URBAN POPULATION
We have analysed the simulated flood damages in single rain events for different combinations of total rainfall and population in the catchment. The number of households living in the catchment was used to describe the current population in this analysis. The results are shown in Figure S 3 to Figure S 5 for business as usual (BAU) simulations without adaptation options, for simulations where a water sensitive cities (WSC) master plan was implemented as the only adaptation option and for simulations where an increase in pipe capacity was implemented as the only adaptation option. The plots include a surface to indicate the overall trends. The surface was fitted using ordinary kriging in the R-package GSTAT (Pebesma, 2004). A Gaussian variogram structure was assumed and the kriging parameters sill, range and measurement error were estimated for each of the datasets using weighted least squares, while the nugget parameter was set to 0 to obtain a smooth surface (Pebesma, 2004).
It is evident that increasing rainfall and household numbers lead to an increase in the simulated flood damage for the BAU simulations and the simulations involving an increased pipe capacity. If urban development simulations were performed along a WSC master plan, increasing household numbers would not lead to an increase in flood damage, because the increasing number of households in the catchment would be accommodated in apartment blocks. This supports the results of Figure 6 in the article, where 𝐸𝐸𝐷𝑡 was observed to be less sensitive to urban development when implementing a WSC master plan. Increasing the capacity of the drainage network led to a shift of the damage surface, where flood damages were generally lower than in the situation without flood adaptation but increased with the number of households and the rain intensity.
Note that, given a fixed combination of adaptation measures, the damage surfaces evolved rather smoothly along the dimensions rainfall and number of households. This suggests that flood damages for different scenarios could be derived in a more efficient manner by performing a limited number of coupled urban development – hydraulic flood simulations for each adaptation option, and then interpolating damages for other values of rainfall and number of households in between the simulated results.

10
Figure S 3. Simulated flood damages for different combinations of rainfall and population growth on a single event basis in the business as usual scenario (BAU) without implementation of any adaptation options.
Figure S 4. Simulated flood damages for different combinations of rainfall and population growth on a single event basis when implementing a water sensitive city master plan (WSC) focusing on the development on apartment blocks.

11
Figure S 5. Simulated flood damages for different combinations of rainfall and population growth on a single event basis when increasing the pipe diameters in the catchment (pipe increase)

12
S5 REFERENCES Australia Institution of Engineers, 1987. Australian Rainfall and Runoff - A Guide to
Flood Estimation, Revised Edition. Australia.
Chow, V.T., Maidment, D.R., Mays, L.W., 1988. Applied hydrology, 1st ed. McGraw-Hill.
French, R., Jones, M., 2012. Design rainfall temporal patterns in Australian Rainfall and Runoff : Durations exceeding one hour *. Aust. J. Water Resour. 16, 21–28. doi:10.7158/W11-858.2012.16.1
Geoscience Australia, 2015. Digital Elevation Model (DEM) of Australia derived from LiDAR 5 Metre Grid. doi:10.4225/25/5652419862E23
Hammond, M., Chen, A.S., Djordjevic, S., Butler, D., Mark, O., 2015. Urban flood impact assessment: A state-of-the-art review. Urban Water J. 12, 14–29. doi:10.1080/1573062X.2013.857421
Handmer, J., Read, C., Percovich, O., Reed, C., Percovich, O., 2003. Disaster Loss Assessment Guidelines, Assessment. Dickson, Australia.
Merz, B., Kreibich, H., Schwarze, R., Thieken, A., 2010. Review article “assessment of economic flood damage.” Nat. Hazards Earth Syst. Sci. 10, 1697–1724. doi:10.5194/nhess-10-1697-2010
Middelmann-Fernandes, M.H., 2010. Flood damage estimation beyond stage-damage functions: an Australian example. J. Flood Risk Manag. 3, 88–96. doi:10.1111/j.1753-318X.2009.01058.x
Moglia, M., Tjandraatmadja, G., Delbridge, N., Gulizia, E., Sharma, A., Butler, R., Gan, K., Pollard, C., 2015. Survey of savings and conditions of rainwater tanks, Project 10TR4-001. Melbourne, Australia.
Müller, P., Wonka, P., Haegler, S., Ulmer, A., Van Gool, L., 2006. Procedural modeling of buildings. ACM Trans. Graph. 25, 614. doi:10.1145/1141911.1141931
National Water Commission, 2008. Rainwater Tank Design and Installation Handbook.
Office of Environment and Heritage, 2007. Residential Flood Damage and supporting calculation spreadsheet. Sydney, Australia.
Pebesma, E.J., 2004. Multivariable geostatistics in S: the gstat package. Comput. Geosci. 30, 683–691. doi:10.1016/j.cageo.2004.03.012
Rawlinsons, 2011. Australian Construction Handbook, 29th ed. Rawlinsons Publishing, Melbourne, Australia.
Reserve Bank of Australia, 2016. Inflation Calculator [WWW Document]. URL http://www.rba.gov.au/calculator/annualDecimal.html (accessed 5.31.16).
Smith, D.I., Greenaway, M.A., 1994. Tropical Storm Surge, Damage Assessment and Emergency Planning, Resource and Environmental Studies. Canberra, Australia.

13
South East Water, 2016. South East Water - Prices and Charges [WWW Document]. URL http://southeastwater.com.au/Residential/Pages/WaterPricesCharges.aspx (accessed 6.3.16).
Stapledon, N., 2012. Trends and cycles in sydney and melbourne house prices from 1880 to 2011. Aust. Econ. Hist. Rev. 52, 293–317. doi:10.1111/j.1467-8446.2012.00359.x
Stevens, D., Dragicevic, S., Rothley, K., 2007. iCity: A GIS-CA modelling tool for urban planning and decision making. Environ. Model. Softw. 22, 761–773. doi:10.1016/j.envsoft.2006.02.004
Sturgess, R., 2000. Rapid Appraisal Method (RAM) for Floodplain Management. Melbourne, Australia.
Tam, V.W.Y., Tam, L., Zeng, S.X., 2010. Cost effectiveness and tradeoff on the use of rainwater tank: An empirical study in Australian residential decision-making. Resour. Conserv. Recycl. 54, 178–186. doi:10.1016/j.resconrec.2009.07.014
The State of Victoria - Department of Economic Development Jobs Transport and Resources, 2016. Victorian Soil Type Mapping [WWW Document]. URL https://www.data.vic.gov.au/data/dataset/victorian-soil-type-mapping (accessed 2.26.16).
Urich, C., Rauch, W., 2014. Exploring critical pathways for urban water management to identify robust strategies under deep uncertainties. Water Res. 66C, 374–389. doi:10.1016/j.watres.2014.08.020
Vanegas, C. a., Kelly, T., Weber, B., Halatsch, J., Aliaga, D.G., Müller, P., 2012. Procedural Generation of Parcels in Urban Modeling. Comput. Graph. Forum 31, 681–690. doi:10.1111/j.1467-8659.2012.03047.x
Velasco, M., Cabello, À., Russo, B., 2015. Flood damage assessment in urban areas . Application to the Raval district of Barcelona using synthetic depth damage curves. Urban Water J. doi:10.1080/1573062X.2014.994005
Wong, V., 2014. An investigation into infrastructure system response to climate change adaptation strategies in the Scotchman’s Creek Catchment. Monash University, Melbourne, Australia.