evaluation and communication of pluvial flood risks … evaluation and communication of pluvial...
TRANSCRIPT

European Water Association Workshop
“Heavy Rainfalls in the Cities and Flood Risk Management”
Hennef, December 3, 2015
Evaluation and communication of pluvial flood risks in urban areas
Prof. Dr.-Ing. Theo G. Schmitt
22.12.2015 2
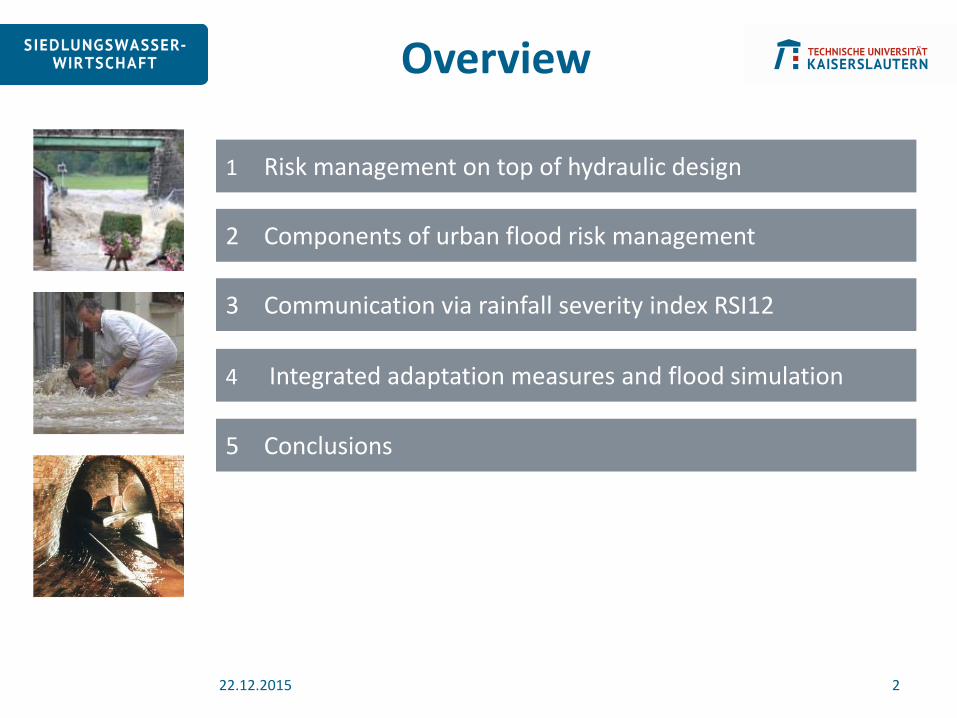
Overview
3 Communication via rainfall severity index RSI12
2 Components of urban flood risk management
1 Risk management on top of hydraulic design
5 Conclusions
4 Integrated adaptation measures and flood simulation

22.12.2015 3
Pluvial Flood Risk Management – a joint community task
rainfall system load – objective
design sewer flow
design storm flood frequency
required extreme rainfall events
urban drainage system incl. backwater valves in private drains
traffic & open space – temporary ponding
loocal object-based flood protection
flood protection flood damage mitigation …
3
the idea …

22.12.2015 4
Tn [a] 1 2 3 5 10 20 30 50 100
D [min] hN hN hN hN hN hN hN hN hN
5 6 8 9 10 12 14 15 17 19
10 9 11 13 15 17 20 21 23 26
15 11 14 16 18 21 24 26 28 31
30 14 18 20 23 27 31 34 37 41
60 17 22 25 29 34 40 43 47 52
120 19 25 28 33 38 44 48 52 58
180 21 27 31 35 41 47 51 55 61
…
1440 38 45 50 56 64 72 76 82 90
Rainfall depths related to rainfall duration D and return period Tn
Interpretation:
set in action according to rainfall statistics
design flow without surface
ponding
protection against flooding
flood damage mitigation
KOST
RA
-DW
D-2
00
0, B
eisp
iel R
aste
rfel
d 2
1/8
2
rainfall events: „design storm“ „heavy rainfall“ „extreme rainfall“
the approach …
22.12.2015 5
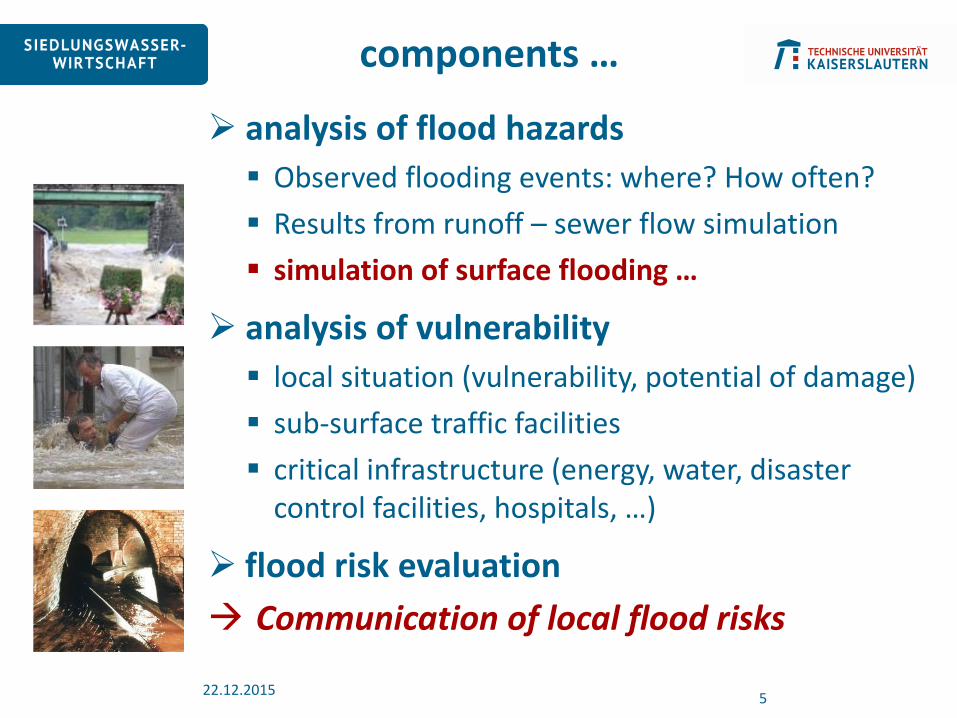
components …
analysis of flood hazards
Observed flooding events: where? How often?
Results from runoff – sewer flow simulation
simulation of surface flooding …
analysis of vulnerability
local situation (vulnerability, potential of damage)
sub-surface traffic facilities
critical infrastructure (energy, water, disaster control facilities, hospitals, …)
flood risk evaluation
Communication of local flood risks
22.12.2015 6
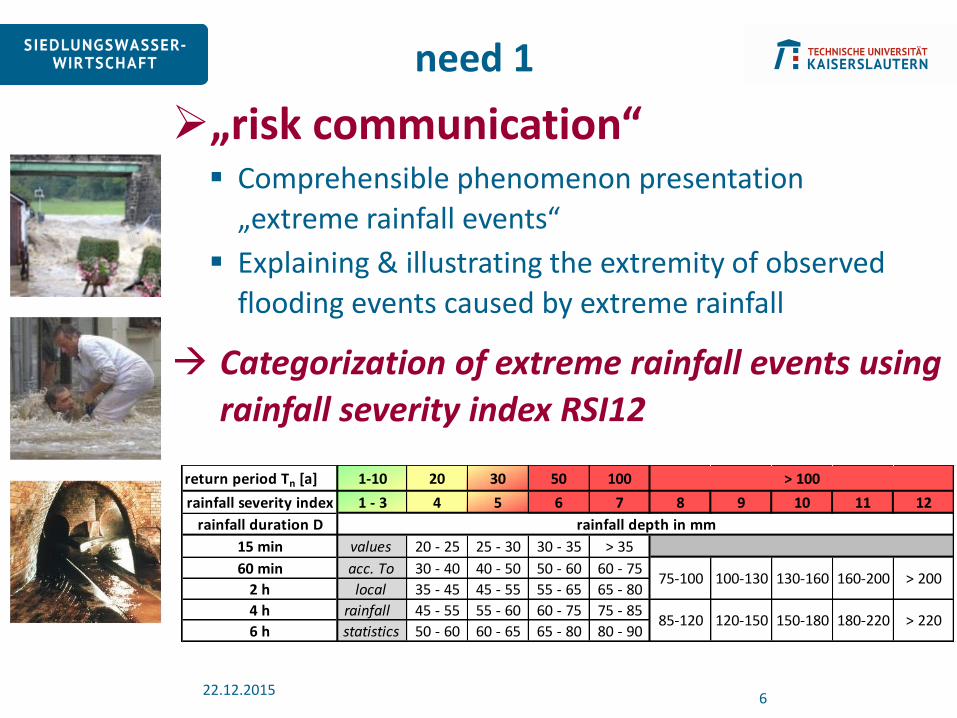
need 1
„risk communication“ Comprehensible phenomenon presentation
„extreme rainfall events“
Explaining & illustrating the extremity of observed
flooding events caused by extreme rainfall
Categorization of extreme rainfall events using
rainfall severity index RSI12
return period Tn [a] 1-10 20 30 50 100
rainfall severity index 1 - 3 4 5 6 7 8 9 10 11 12
rainfall duration D
15 min values 20 - 25 25 - 30 30 - 35 > 35
60 min acc. To 30 - 40 40 - 50 50 - 60 60 - 75
2 h local 35 - 45 45 - 55 55 - 65 65 - 80
4 h rainfall 45 - 55 55 - 60 60 - 75 75 - 85
6 h statistics 50 - 60 60 - 65 65 - 80 80 - 9085-120 120-150 150-180 180-220 > 220
> 100
rainfall depth in mm
75-100 100-130 130-160 160-200 > 200

22.12.2015 7
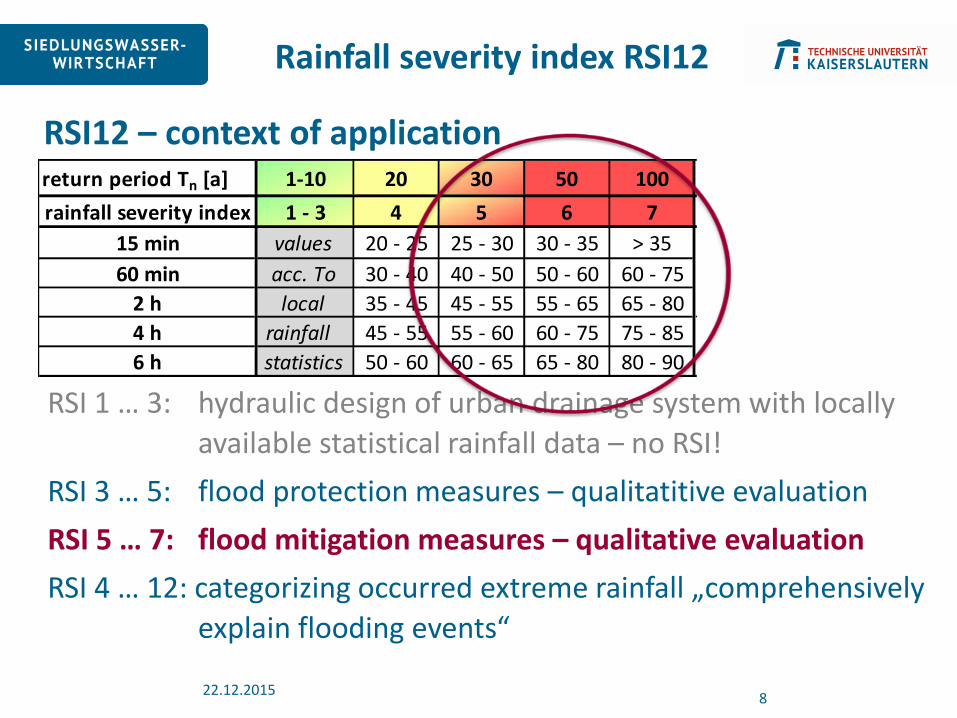
RSI12 – context of application
RSI 1 … 3: hydraulic design of urban drainage system with locally
available statistical rainfall data – no RSI!
RSI 3 … 5: flood protection measures – qualitatitive evaluation
RSI 5 … 7: flood mitigation measures – qualitative evaluation
RSI 4 … 12: categorizing occurred extreme rainfall „comprehensively
explain flooding events“
Rainfall severity index RSI12
return period Tn [a] 1-10 20 30
rainfall severity index 1 - 3 4 5
15 min values 20 - 25 25 - 30
60 min acc. To 30 - 40 40 - 50
2 h local 35 - 45 45 - 55
4 h rainfall 45 - 55 55 - 60
6 h statistics 50 - 60 60 - 65
22.12.2015 8
RSI12 – context of application
RSI 1 … 3: hydraulic design of urban drainage system with locally
available statistical rainfall data – no RSI!
RSI 3 … 5: flood protection measures – qualitatitive evaluation
RSI 5 … 7: flood mitigation measures – qualitative evaluation
RSI 4 … 12: categorizing occurred extreme rainfall „comprehensively
explain flooding events“
Rainfall severity index RSI12
return period Tn [a] 1-10 20 30 50 100
rainfall severity index 1 - 3 4 5 6 7
15 min values 20 - 25 25 - 30 30 - 35 > 35
60 min acc. To 30 - 40 40 - 50 50 - 60 60 - 75
2 h local 35 - 45 45 - 55 55 - 65 65 - 80
4 h rainfall 45 - 55 55 - 60 60 - 75 75 - 85
6 h statistics 50 - 60 60 - 65 65 - 80 80 - 90

22.12.2015 9
RSI12 – context of application
RSI 1 … 3: hydraulic design of urban drainage system with locally
available statistical rainfall data – no RSI!
RSI 3 … 5: flood protection measures – qualitatitive evaluation
RSI 5 … 7: flood mitigation measures – qualitative evaluation
RSI 4 … 12: categorizing occurred extreme rainfall „comprehensively
explain flooding events“
Rainfall severity index RSI12
return period Tn [a] 1-10 20 30 50 100
rainfall severity index 1 - 3 4 5 6 7 8 9 10 11 12
15 min values 20 - 25 25 - 30 30 - 35 > 35
60 min acc. To 30 - 40 40 - 50 50 - 60 60 - 75
2 h local 35 - 45 45 - 55 55 - 65 65 - 80
4 h rainfall 45 - 55 55 - 60 60 - 75 75 - 85
6 h statistics 50 - 60 60 - 65 65 - 80 80 - 9085-120 120-150 150-180 180-220 > 220
> 100
75-100 100-130 130-160 160-200 > 200
„Münster July 2014“ RSI=12
22.12.2015 10
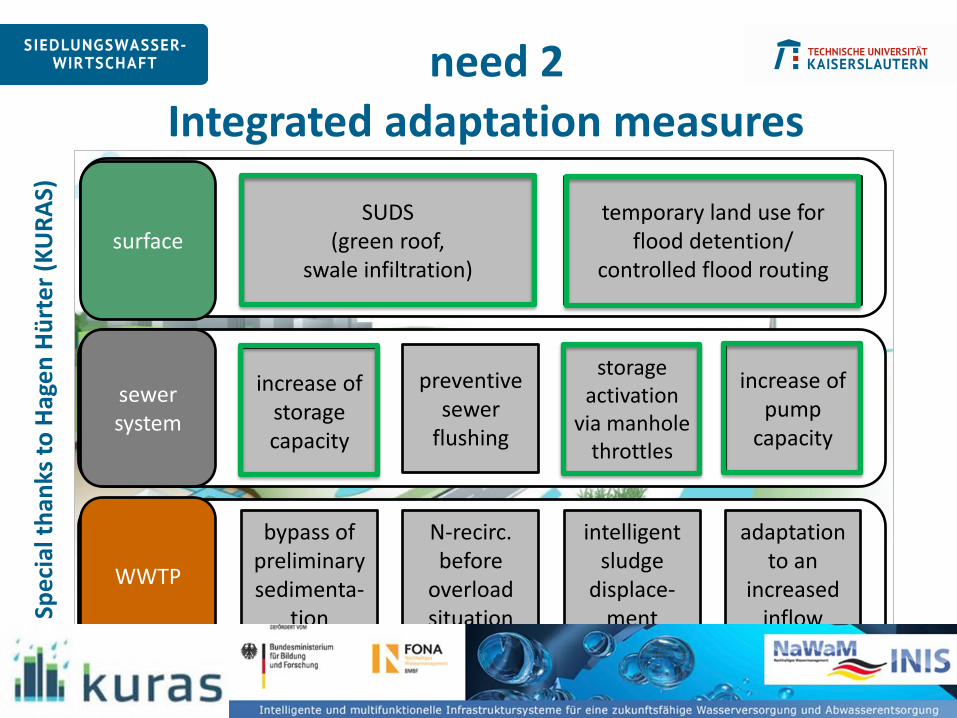
need 2 Integrated adaptation measures
surface SUDS
(green roof, swale infiltration)
temporary land use for flood detention/
controlled flood routing
sewer system
increase of storage capacity
preventive sewer
flushing
storage activation
via manhole throttles
increase of pump
capacity
WWTP
bypass of preliminary sedimenta-
tion
N-recirc. before
overload situation
intelligent sludge
displace-ment
adaptation to an
increased inflow Sp
eci
al t
han
ks t
o H
age
n H
ürt
er
(KU
RA
S)

22.12.2015 11
analysis & evaluation
temporary land use for flood detention/
controlled flood routing
Flood risk analysis and measure effectiveness
topographical flood risk analysis focal areas
1D-2D flood simulation
flood risk analysis and location of adaptation measures
measure evaluation method

topographical analysis
12
Flow Paths
Depressions

Focal Areas
Manhole surcharges (1D-Sim)
Firefighter
Media coverage
Top. analysis
focal area identification …
13 22.12.2015

1D-2D flood simulation
14 22.12.2015
adaptation measure current state
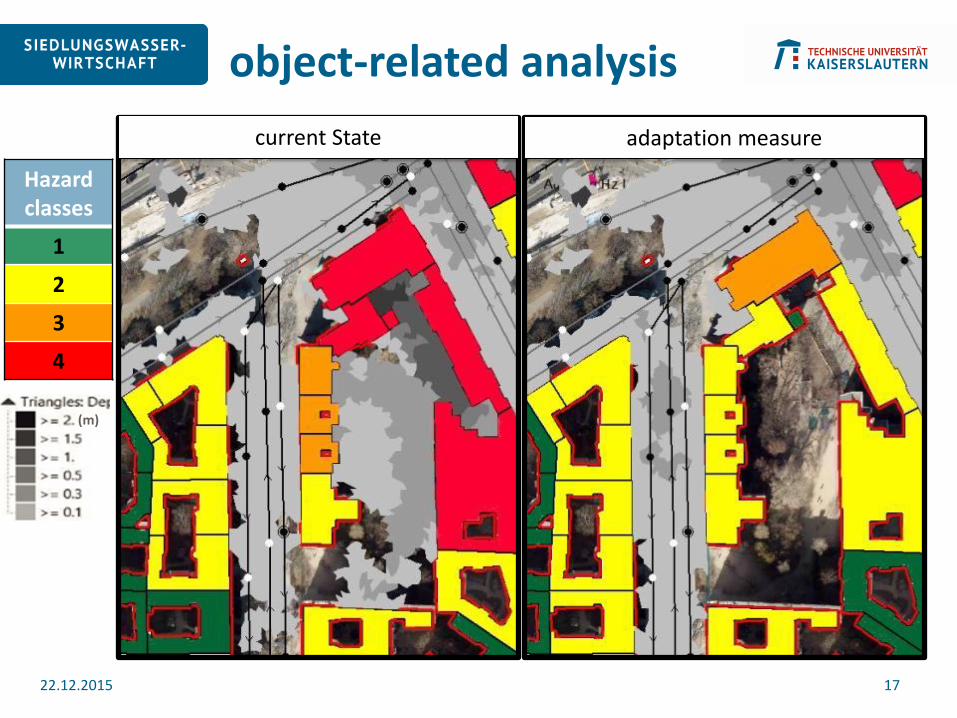
object-related analysis
17 22.12.2015
current State adaptation measure
Hazard classes
1
2
3
4
(m)
22.12.2015 18
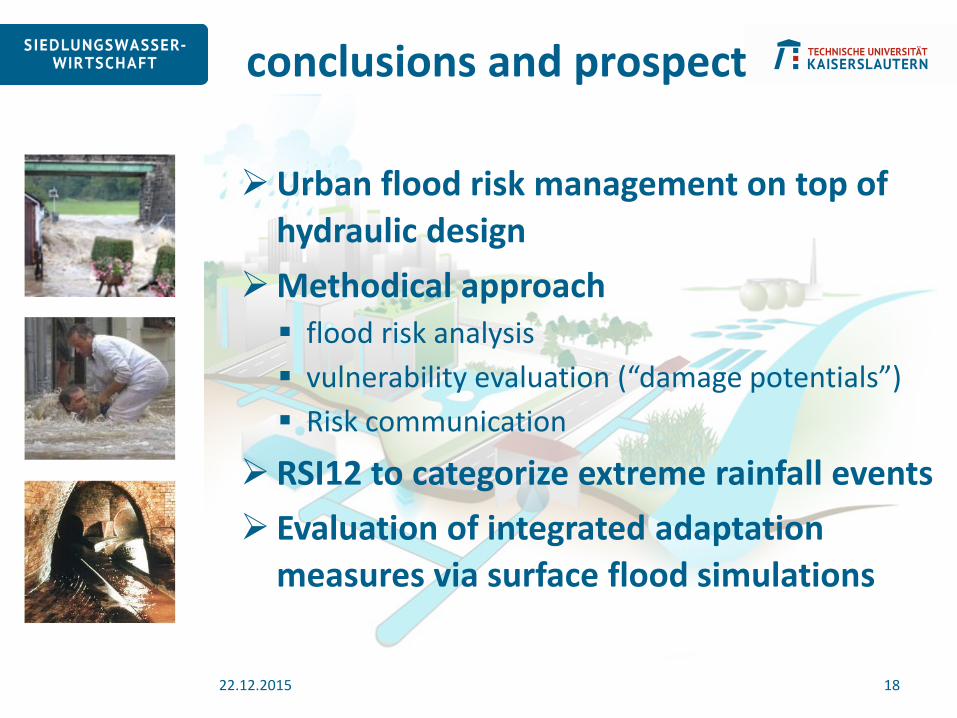
conclusions and prospect
Urban flood risk management on top of
hydraulic design
Methodical approach flood risk analysis
vulnerability evaluation (“damage potentials”)
Risk communication
RSI12 to categorize extreme rainfall events
Evaluation of integrated adaptation
measures via surface flood simulations