assessment of concepts for utilizing lunar resources (1...
TRANSCRIPT

i
Assessment of Concepts for Utilizing Lunar Resources
(1) Solar Power from Space or the Moon
(2) 3He from the Moon for Fusion on Earth
(3) Utilization of Lunar Resources for Space Missions
Donald Rapp
Independent Contractor
February 18, 2007
Front and back cover illustrations are monotype prints by
Zolita Sverdlove (http://www.love-art.com)
ii
Assessment of Concepts for Utilizing Lunar Resources
(1) Solar Power from Space or the Moon
(2) 3He from the Moon for Fusion on Earth
(3) Utilization of Lunar Resources for Space Missions
Donald Rapp
FOREWORD....................................................................................................................................................................... 1 ABOUT THE AUTHOR.................................................................................................................................................... 2 EXECUTIVE SUMMARY................................................................................................................................................ 3
THE NEED FOR NEW ENERGY SOURCES........................................................................................................................... 3 FUTURISTIC CONCEPTS ..................................................................................................................................................... 3 SOLAR POWER SATELLITES .............................................................................................................................................. 3
The Concept .................................................................................................................................................................. 3 Mass of the SPS ............................................................................................................................................................ 4 Launch, Assembly and Orbit Raising.......................................................................................................................... 4 Orbit Raising ................................................................................................................................................................ 5 Conversion to Microwaves and Microwave Transmission........................................................................................ 5 Receiving Microwave Power and Conversion to Electric Power ............................................................................. 6 Environmental Impacts ................................................................................................................................................ 6 Alternate Concepts ....................................................................................................................................................... 6
BEAMED ENERGY FROM THE MOON................................................................................................................................. 6 Concept ......................................................................................................................................................................... 6 Solar Cell Technology.................................................................................................................................................. 7
ENERGY FROM FUSION REACTORS ................................................................................................................................... 8 Fusion Processes .......................................................................................................................................................... 8 Progress in Fusion Technology................................................................................................................................... 8 Extraction of 3He from Lunar Regolith ....................................................................................................................... 9 Conclusions on Fusion................................................................................................................................................. 9
UTILIZATION OF LUNAR RESOURCES TO ENHANCE SPACE MISSIONS.......................................................................... 10 Introduction ................................................................................................................................................................ 10 Ascent Propellants...................................................................................................................................................... 10 Propellants for Descent or Transport to LEO.......................................................................................................... 10 NASA Approach to ISRU ........................................................................................................................................... 11 Conclusions Regarding ISRU .................................................................................................................................... 11
1. INTRODUCTION ........................................................................................................................................................ 12 1.1 THE NEED FOR NEW ENERGY SOURCES IN THE 21ST CENTURY............................................................................. 12 1.2 ANALYSIS OF FUTURISTIC ENERGY CONCEPTS ....................................................................................................... 15
2. SPACE SOLAR POWER............................................................................................................................................ 16 2.1 SOLAR PLATFORMS IN GEOSTATIONARY ORBIT ..................................................................................................... 16 2.2 EVOLUTION OF SPACE SOLAR POWER CONCEPTS ................................................................................................... 19
2.2.1 Baseline 1979 Concept ..................................................................................................................................... 19 2.2.2 "Fresh Look" 1995 Study.................................................................................................................................. 19 2.2.3 Concept Definition Study 1997-98................................................................................................................... 19 2.2.4 SERT Program 1999-2000 ............................................................................................................................... 21

iii
RF Concepts ................................................................................................................................................................................22 RF vs. Laser Power Beaming .....................................................................................................................................................23
2.2.5 SSP Concept and Maturation Program (2001-2) ........................................................................................... 23 2.2.6 NASA-NSF-EPRI Research (2001-2003) ........................................................................................................ 24 2.2.7 NASA Research and Development in SSP & Related Technologies (2004-2005)........................................ 24
2.3 SPACE SOLAR POWER SYSTEMS............................................................................................................................... 24 2.3.1 Launch, Assembly and Orbit raising ............................................................................................................... 24
Launch .........................................................................................................................................................................................24 Frequency of Launches...............................................................................................................................................................25 Assembly .....................................................................................................................................................................................25 Orbit Raising ...............................................................................................................................................................................26
2.3.2 Solar Power Generation ................................................................................................................................... 29 2.3.3 Conversion to Microwave Power..................................................................................................................... 30 2.3.4 Microwave Power Transmission...................................................................................................................... 31
Antenna Array .............................................................................................................................................................................31 Control and Calibration ..............................................................................................................................................................31
2.3.5 Receiving Microwave Power and Conversion to Electric Power.................................................................. 32 2.3.6 Integration of Resultant Power with the Power Grid ..................................................................................... 33 2.3.7 Environmental Impacts ..................................................................................................................................... 33 2.3.8 Overall Efficiency ............................................................................................................................................. 34
2.4 ALTERNATIVE CONCEPTS ......................................................................................................................................... 34 2.4.1 SPS in GEO With Fixed Solar Arrays ............................................................................................................. 34 2.4.2 Super-Synchronous Solar Power satellite ....................................................................................................... 35 2.4.3 Laser Transmission Systems............................................................................................................................. 37
Introduction .................................................................................................................................................................................37 High Power Laser Systems.........................................................................................................................................................37 Transmitting Optics ....................................................................................................................................................................37 Atmospheric Transmission.........................................................................................................................................................38 Receiver Concepts.......................................................................................................................................................................39 Beam Spreading ..........................................................................................................................................................................40 System Chain Efficiencies..........................................................................................................................................................40 System Description .....................................................................................................................................................................41
2.5 LUNAR SOLAR POWER SYSTEMS.............................................................................................................................. 41 2.5.1 Description ........................................................................................................................................................ 41 2.5.2 Solar Cell Technology ...................................................................................................................................... 44 2.5.3 In Situ Production of Solar Cells on the Moon ............................................................................................... 45
Silicon as an Adjunct of Oxygen Production ............................................................................................................................45 Vacuum Evaporation and Deposition of Thin-Film Silicon ....................................................................................................45 Amorphous Silicon Cells............................................................................................................................................................46 Amorphous Silicon Cells via Fluorine Extraction ....................................................................................................................46
2.6 SPACE SOLAR POWER VS. TERRESTRIAL SOLAR POWER ........................................................................................ 49 2.7 ECONOMICS OF SPACE SOLAR POWER ..................................................................................................................... 50
2.7.1 Market Goal for Space Solar Power................................................................................................................ 50 2.7.2 Mass of the SPS................................................................................................................................................. 50 2.7.3 Energy Payback of the SPS .............................................................................................................................. 51 2.7.4 Land Use............................................................................................................................................................ 53 2.7.5 Cost Estimates ................................................................................................................................................... 54
Introduction .................................................................................................................................................................................54 GEO Cost Estimate Using Current Capabilities .......................................................................................................................54 Future Transport and Solar Array Costs....................................................................................................................................55 Cost reduction to make the SPS Competitive ...........................................................................................................................56 Cost Estimates for SPS ...............................................................................................................................................................57
2.7.6 Cost of a Lunar Solar Power System ............................................................................................................... 58 2.7.7 Providing Financing ......................................................................................................................................... 58
2.8 POLITICAL ISSUES AND SPACE LAW......................................................................................................................... 59 2.9 IMPORTANT ISSUES AND CHALLENGES.................................................................................................................... 62
2.9.1 Introduction ....................................................................................................................................................... 62 2.9.2 Launch and Orbit Raising ................................................................................................................................ 62

iv
2.9.3 Assembly ............................................................................................................................................................ 62 2.9.4 Degradation in Space ....................................................................................................................................... 63 2.9.5 Environmental Impacts ..................................................................................................................................... 63 2.9.6 Economic and Political Issues ......................................................................................................................... 63 2.9.7 Other Issues ....................................................................................................................................................... 63
Disposal - Finite Lifetime...........................................................................................................................................................63 Outage for Lunar Eclipse............................................................................................................................................................64 Size of Earth Receiving Stations................................................................................................................................................64
2.10 NASA POSITION ON SPS........................................................................................................................................ 64 2.11 CONCLUSIONS REGARDING BEAMED SOLAR POWER FROM SPACE...................................................................... 67
3. 3HE-BASED FUSION POWER ................................................................................................................................. 68 3.1 INTRODUCTION.......................................................................................................................................................... 68
3.1.1 Fusion vs. Fission ............................................................................................................................................. 68 3.1.2 Fusion Reactions............................................................................................................................................... 68 3.1.3 Fusion Requirements ........................................................................................................................................ 71
3.2 PROGRESS IN FUSION DEVELOPMENT ...................................................................................................................... 71 3.2.1 History of U. S. Support for Fusion R & D ..................................................................................................... 71 3.2.2 Status of Mainstream Fusion Research ........................................................................................................... 74
Deuterium-Tritium Fusion..........................................................................................................................................................74 Fusion Figures of Merit ..............................................................................................................................................................75 Confining the Plasma..................................................................................................................................................................75 Safety and Environment .............................................................................................................................................................76
3.2.3 Fusion Reactor Design ..................................................................................................................................... 77 3.2.4 International Thermonuclear Experimental Reactor ..................................................................................... 78 3.2.5 Inertial Electrostatic Fusion ............................................................................................................................ 78
3.3 EXTRACTION OF 3HE FROM LUNAR REGOLITH........................................................................................................ 80 3.3.1 3He Concentration in Regolith ......................................................................................................................... 80 3.3.2 Release of Solar Wind Imbedded Gases from Regolith .................................................................................. 81 3.3.3 Mining Strategies .............................................................................................................................................. 81
In Situ Mining .............................................................................................................................................................................81 Open Pit Mining Scenario ..........................................................................................................................................................82 Mobile Mining Concept..............................................................................................................................................................83
3.3.4 Processing Regolith .......................................................................................................................................... 85 3.3.5 Gas Processing.................................................................................................................................................. 85 3.3.6 Mass and Energy Requirements....................................................................................................................... 87 3.3.7 System issues ..................................................................................................................................................... 87 3.3.8 Providing 3He for Near-Term Research .......................................................................................................... 88
3.4 CONCLUSIONS REGARDING MINING 3HE ON THE MOON FOR FUSION.................................................................... 89 4. UTILIZATION OF LUNAR RESOURCES TO ENHANCE SPACE MISSIONS ........................................... 91
4.1 INTRODUCTION.......................................................................................................................................................... 91 4.2 POTENTIAL PRODUCTS OF ISRU .............................................................................................................................. 92
4.2.1 Ascent Propellants ............................................................................................................................................ 92 4.2.2 Life Support Consumables................................................................................................................................ 93 4.2.3 Propellants Delivered to LEO.......................................................................................................................... 93 4.2.4 Propellants Delivered to Lunar Orbit for Descent (and Ascent) ................................................................... 94 4.2.5 Regolith for Radiation Shielding...................................................................................................................... 95 4.2.6 Summary of Near-Term Lunar ISRU Benefits - Current ESAS Architecture............................................... 95
4.3 LUNAR RESOURCES .................................................................................................................................................. 95 4.4 EXTRACTION AND PROCESSING................................................................................................................................ 95
4.4.1 Volatile Extraction ............................................................................................................................................ 95 Requirements...............................................................................................................................................................................95 Process .........................................................................................................................................................................................96
4.4.2 Oxygen from Regolith ....................................................................................................................................... 96 Extraction of Oxygen from Lunar Regolith ..............................................................................................................................96 Reduction of FeO Using Hydrogen ...........................................................................................................................................98

v
Molten Salt Electrolysis Processes ............................................................................................................................................98 4.4.3 Utilizing Polar Ice Deposits ............................................................................................................................. 98
Introduction .................................................................................................................................................................................98 Campaign to Utilize Polar Ice Deposits.................................................................................................................................. 100 JSC Campaign Overview......................................................................................................................................................... 101 Cost Analysis for Lunar Water-Based ISRU for Ascent Propellants .................................................................................. 102
4.4.4 Ancillary Technologies ................................................................................................................................... 104 Excavation and Hauling........................................................................................................................................................... 104 Water Electrolysis .................................................................................................................................................................... 105 Cryogenic Tankers ................................................................................................................................................................... 105 Cryogenic Depot ...................................................................................................................................................................... 105
4.5 FUELING LUNAR-BOUND AND MARS-BOUND VEHICLES FROM LUNAR RESOURCES.......................................... 105 4.5.1 Introduction ..................................................................................................................................................... 105 4.5.2 Value of Lunar Water in LEO ........................................................................................................................ 106 4.5.3 Percentage of Water Mined on the Moon Transferred to LEO ................................................................... 106
Transfer via L1 ......................................................................................................................................................................... 107 Dependence on Junction Site .................................................................................................................................................. 111 Lunar Ferry for Descent Propellants....................................................................................................................................... 111
4.6 VISIONARY LUNAR ISRU CONCEPTS .................................................................................................................... 113 4.7 CONCLUSIONS REGARDING LUNAR ISRU ............................................................................................................. 114
COLOR FIGURES......................................................................................................................................................... 115 REFERENCES................................................................................................................................................................ 119
3HE FUSION REFERENCES ............................................................................................................................................. 119 SOLAR REFERENCES...................................................................................................................................................... 120 GENERIC REFERENCES .................................................................................................................................................. 122 ISRU REFERENCES ....................................................................................................................................................... 123
GLOSSARY..................................................................................................................................................................... 124

1
Foreword NASA is currently embarked on an initiative to return humans to the Moon.
Two long-term futuristic approaches have been proposed for using the Moon to benefit mankind and advocated by several prominent scientists. One involves beaming energy acquired from solar energy on the Moon to Earth (in the form of microwaves or laser beams) where it would be converted to electrical power. The other involves mining solar wind deposited 3He for use in putative future fusion power plants. Both of these have the goal to provide mankind with an almost endless supply of energy. They are characterized by immense potential benefits but they face Herculean technical, economic and political challenges. There appears to be a wide divergence of viewpoints between the ardent advocates and the nay-sayers who doubt the feasibility and affordability of such concepts. Perhaps most interesting is the fact that the most vociferous critics of any one futuristic approach seem to be the advocates of alternative futuristic approaches. Because of the difficulty in assessing such formidable concepts of unprecedented scope, cost and societal impact that will undoubtedly take many decades and huge investments to implement, it is important for NASA to gain a better understanding of the potentials and the challenges involved in developing them.
It is impractical to discuss beamed energy from the Moon without referring to the closely allied concepts of beamed energy from solar power satellites (SPS) in geostationary orbit. Furthermore, there is a good deal more literature available on SPS than there is on beamed power from the Moon. Similarly, it is impractical to discuss acquisition and utilization of 3He in fusion reactors without discussing fusion power in general, with or without 3He. As in the case of solar energy, there is considerably more literature on fusion using D-T than there is specifically on fusion using 3He. Therefore the scope of this study was broadened to include the SPS and fusion, with and without 3He. Obviously, a report on such a wide range of technologies prepared by one person presents great challenges. In the process of preparing this document, many references covering a wide range of technologies were utilized. Most of the material in this report was abstracted, excerpted or derived from these references. In many cases, I made minor changes in the wording, but essentially reproduced the material from these references. In such cases, I did not usually use quote marks but I did try to carefully indicate the source of the material.
At the same time, NASA is exploring various alternatives for exploiting in situ lunar resources, more narrowly for the benefit of the space program. Approaches to use lunar resources for the benefit of the space program are being investigated by an In Situ Resource Utilization (ISRU) technology development program led by NASA-JSC. While there is a great deal of enthusiasm and support for lunar ISRU within a certain community, analysis shows that the benefit/cost ratio is dubious.
This report presents an overview of the concepts, a summary of the relevant literature, both pro and con, and an assessment (where appropriate) of the prospects for various approaches. As such, this report is offered as a summary and a source book for these concepts in the hope that it will provide NASA with a single source for gathering information regarding these lunar utilization concepts, in order to make appropriate strategic decisions. However, it is doubtful whether NASA will give these subjects the attention they deserve.
Donald Rapp
February, 2007

2
About the Author
Donald Rapp received his B. S. from Cooper Union in 1955, his M. S. from Princeton in 1956 and his Ph. D. from the University of California (Berkeley) in 1959. He worked for Lockheed-Martin, taught at the Polytechnic Institute of New York and was full professor at the University of Texas. During the period 1960-1979, he published more than 70 publications in refereed journals. He also published the following textbooks: (1) Quantum Mechanics, 672 pages, published 1971 by Holt, Rinehart and Winston, (2) Statistical Mechanics, 330 pages, published in 1972 by Holt, Rinehart and Winston; translated into Japanese 1977, (3) Solar Energy, 516 pages, published in 1981 by Prentice-Hall.
He was elected Fellow of the American Physical Society in 1974, and acted as a Reviewer for the Journal of Chemical Physics, the Physical Review, the American Journal of Physics, the Journal of Physical Chemistry, and other journals on over 300 occasions. One of his articles was chosen as a "Citation Classic" by Citation Abstracts, with over 370 citations. He is listed in: Who's Who in the West, Who's Who in Frontiers of Science and Technology, Who's Who in America, Men of Achievement, International Who's Who of Contemporary Achievement, International Who's Who of Professionals, Personalities of the Americas, Who's Who in Technology Today, Who's Who in Technology, Who's Who in California, Who's Who of Professionals, Two Thousand Notable Americans, Dictionary of International Biography, Strathmore's Who's Who.
He spent the years 1979-2003 at the Jet Propulsion Laboratory where he was Chief Technologist of the Mechanical and Chemical Systems Division providing guidance and oversight to an organization of 700 people including about 90 PhDs.
Over the 1994-1998 period, he was Proposal Manager on the Genesis (formerly Suess-Urey) Discovery Project which won in a field of about 25 competitors in Discovery 5, being funded at ~ $220M. Genesis carried out its mission in space from 2001 to 2004. Subsequently, he acted as Proposal Manager for the Deep Impact Discovery proposal, which won, being funded at $320M. Deep Impact was a spectacular success in 2005. He is known throughout JPL as an expert on mission and technology planning, and is often sought as a consultant in preparing proposals.
Since 2003, he has provided consultation to JPL and NASA as an independent contractor. In the period 2003-2007, he supported more than 40 different groups at JPL in preparing and reviewing proposals for advanced technology and missions, carrying out technical analyses, and mentoring younger engineers. A number of these proposals were funded. He also prepared a Technology Blueprint for NASA HQ.
In the period 2004-2007, he concentrated on planning for Mars and lunar human missions, including (1) assessment, comparison and evaluation of existing "design reference missions," (2) assessment of the potential impact of in situ resource utilization (ISRU) on Mars and lunar missions, (3) review of the whole field of water on Mars and its potential impact on Mars ISRU, (4) requirements, options and characterization of alternatives for transfers from Earth to and from Mars and the Moon and (5) solar energy on the Moon and Mars. He prepared numerous detailed reports on these subjects.
He is presently Associate Editor of the Mars Journal.
During 2006, he completed a lengthy book on all aspects of human missions to Mars and is now seeking a publisher for this.
3
Executive Summary
The Need for New Energy Sources The burgeoning world population will demand more and more energy. And the goal of most of the people in less developed countries seems to be to acquire and burn up fossil fuels as fast as Americans do. Although world energy consumption has increased by a factor of about ten in the last hundred years, 70% of the world’s population is still deprived of the benefits associated with adequate energy provision (for instance, about 33% of the world’s population lives without electricity). UN figures suggest that the current world population of nearly 6 billion will increase to over 10 billion by 2050, with the bulk of that population being in the developing and transitional economies. In this context, even the most constrained economic growth scenarios project an increase of 50% in the energy consumption by 2050 over the values in 1990. In a high growth scenario, this increase becomes three-fold.
There is little doubt that providing the world with energy while preserving the environment will prove to be one of the major challenges of the 21st century. Major dislocations between supply and demand for petroleum will emerge. It is not question of if, but when.
Futuristic Concepts A wide variety of potential "solutions" to future energy problems have been proposed, advocated and even funded to a degree. Unfortunately, none of these stand up to detailed, honest scrutiny. Renewable energy concepts are inadequate to provide the needed large amounts of energy, despite advocacy by popular enthusiasts.
This background has provided the motivation for futuristic thinkers to devise concepts for providing the world with its energy needs without pollution. That the need exists can hardly be denied. Whether such schemes can be made practical is another matter.
Two futuristic possibilities for providing the world with a seemingly endless supply of energy are (1) solar power satellites (SPS) to beam converted solar energy to Earth from
space or the Moon, and (2) fusion reactors, possibly using lunar 3He as a fuel. Both of these concepts are characterized by potentially very high payoff, but the technical feasibility remains in doubt, the costs will be incredibly high, and the whole enterprise will take many decades of investment with no immediate return. At this early stage of evolution, the benefit/cost ratio can best be described as (∞/∞) leading to a quandary as to the merits of further investments in such schemes.
Solar Power Satellites
The Concept Solar energy can be converted to electrical energy in space or on the Moon, and this energy can be beamed down to Earth in the form of microwaves or as laser beams.
The original idea proposed by Glaser in 1968 has been developed (on paper) by a number of individuals and groups over the past 40 years. In this concept, a set of solar power satellites (SPS) are operated in geostationary orbit (GEO) to convert solar energy to microwave energy, and beam this energy down to ground receivers where it is converted to electrical energy and distributed to the electrical grid. Each platform would beam enough power down to Earth to supply something like 1 GW to 5 GW of electric power. It would require several thousand of these to provide the expected world demand for power at mid-century.
The geostationary orbit is located above the Earth's equator at an altitude of 35,786 km above mean sea level, where the period of the orbit is 24 hours. A spacecraft in such an orbit will remain above a single point on the equator.
For a period of about a month centered on the equinoxes, geostationary satellites enter their eclipse season, when they can spend some time near midnight of every day in shadow because the Earth lies in the path of the rays from the Sun. At the equinoxes this maximizes at around 70 minutes each night and fades to zero about 21 days on either side
4
of equinox. However, if there are a great number of SPS in orbit surrounding the Earth, only those in the shadow of the Earth will be without power at any time. With an interconnected grid, this might not be an insuperable problem.
Mass of the SPS The end-to-end efficiency for the power beaming process from GEO has been estimated to be about 7%. This implies that to provide say, 5 GW of power on Earth, 70 GW of solar power must be intercepted by a large solar array. Using the solar intensity at 1 AU (1367 W/m2), this implies that the size of such a solar array is about 50 km2, or 7 km by 7 km. Assuming that the solar array has an efficiency of ~ 13 %, this would imply that it generates about 0.13 x 70 GW = 9 GW of electric power in space. Current solar arrays have specific power of 50 to 80 W/kg. Some optimists have assumed that in the future, this may be increased to say, 400 W/kg using thin film arrays. In that case, a 70 GW array with a conversion efficiency of say 13% would weigh about 9 x 10⁹ (W)/400 (W/kg) ~ 22,500 tonnes. The mass of the associated microwave antenna has been estimated to be about 13,000 tonnes, so the mass of a SPS to deliver 5 GW at Earth is optimistically estimated to be about 35,500 tonnes without contingency allowance. Current costs to deliver mass to GEO are around $40M/tonne, so the cost merely to deliver such a SPS to GEO would be ~ 1400 billion dollars. Most advocates of SPS assume that launch costs will be reduced by factors of up to 100 in the future. If that happened, the cost to deliver such a SPS to GEO might be reduced to ~15 billion dollars. The basis for assuming such reductions in launch costs seems to be a vague general expectation that costs "always" go down as activity increases.
Launch, Assembly and Orbit Raising A number of alternate SPS designs have evolved since the late 1970s. Regardless of the specific design details, the great technical and economic challenges in developing a SPS are launch, assembly and orbit raising. It is generally conjectured that the modular elements of a solar power satellite would be brought up to LEO via multiple launches with
a heavy lift launch vehicle (HLLV) and assembled into a working unit in LEO. Subsequently, either the entire assembled SPS, or a major module of the SPS, would be carried up to GEO by a reusable launch vehicle, possibly using some form of solar electric propulsion. However, one study concluded that assembly in LEO is not feasible due to problems caused by radiation exposure and space debris.
Two problems stand out in regard to launching the materiel for SPS. One is the cost and the other is scheduling the large number of launches that would be required.
The proponents of the SPS have made various optimistic assumptions regarding future launch costs – typically by factors of about 100 compared to present. The basis for such assumption does not appear to be very substantial.
The number of launches required per SPS depends on the mass of one SPS and the assumed lift capability of the launch vehicle. The number of launches per year depends on the above two quantities plus the assumed rate at which SPS systems are deployed) SPS systems per year). We have already noted that an optimistic estimate for the mass of a 5 GW SPS is about 35,500 tonnes. While some studies have assumed that a super HLLV capable of lifting 400-500 tonnes to LEO will be developed, the 125 tonnes-to-LEO HLLV being developed by NASA for human lunar and Mars missions appears to be more realistic. Delivery of one 5 GW SPS would require about 280 launches. It is not clear how frequently such huge launches can be implemented from ground facilities but it seems likely (as a guess) that they might be limited to an extreme upper limit of perhaps one launch per month per launch site. If there were say, three gigantic launch sites capable of sending up HLLVs at the rate of one per month, the entire set of 280 launches for one SPS could be carried out in about 8 years. To send up an entire family of 4,000 such satellites, it would take 32,000 years at this rate. Even with the assumed super HLLV capable of lifting 500 tonnes to LEO, it would require 6,000 years to establish the entire fleet of SPS.
5
Relatively little work has been done on assembly of the SPS in space. One reference briefly examined several scenarios in which assembly was carried out in GEO, or in a lower orbit. One scenario involves rapid transport of thin-film cells to GEO to avoid cell degradation by radiation. When they considered assembly at lower altitudes, they found that assembly at 500 km is undesirable due to debris impacts. The debris problem can be avoided by carrying out assembly at altitudes above 3000 km. However it was concluded that the SPS should not be assembled at any altitude between 3000 km and 11,000 km in order to avoid degradation of the cells due to radiation. Therefore, for non-GEO assembly, the assembly altitude was limited to altitudes above 11,000 km. However, it was concluded that assembly at GEO is preferable. Nevertheless, most other papers on the SPS seem to imply assembly in LEO.
Orbit Raising The requirement for orbit raising from LEO to GEO is a change in velocity of about Δv ~ 3800 m/s. Using LOX/LH2 chemical propulsion with Isp ~ 450 s, it requires about 1.5 mass units of propulsion system and propellants to raise one mass unit from LEO to GEO. Thus, the ratio of initial mass in LEO to payload delivered (one-way) to GEO is about 2.5:1. One of the virtues of using chemical propulsion is the quick transfer that takes place in a single day.
In principle, a reusable solar electric propulsion (SEP) system could be used for orbit raising (and return). The spacecraft is spiraled out from the starting orbit to its destination. This approach minimizes the propellant required for the transfer, at the cost of increased transfer time. With its much higher specific impulse, the amount of propellant required would be greatly reduced. However, there would be a number of issues. These include:
• Degradation of the solar cell performance while passing through the radiation belts.
• A rather gigantic solar array would be required for orbit raising.
• Developing and implementing the high-performance ion thrusters that are needed.
• The slow spiraling out of the SEP vehicle (several months required for transfer) creates time delays and operational scheduling difficulties.
• A fast "personnel taxi" powered by chemical propulsion would be needed to avoid the radiation exposure with SEP.
• The requirement for Xe propellant for SEP would far exceed world production levels.
While most SPS studies have rather glibly assumed that reusable solar-electric orbit transfer vehicles would routinely drag huge masses from LEO to GEO, this approach is problematic. Orbit-raising looms as another major show-stopper for SPS along with launching to LEO.
Conversion to Microwaves and Microwave Transmission Several technologies could be employed for converting electric power to microwave power. All of these require further development but one way or another, conversion to microwaves can probably be accomplished.
A huge phased array antenna with high efficiency must steer the power beam to a small rectenna target on the ground with a precision of 0.0005 degrees. It is expected that the size will be of the order of a 1 or 2 km to transmit 1 to 2 GW at 2.45 GHz. It is typically assumed that the overall DC-RF conversion efficiency, including all losses (e.g. in phase shifters, power circuits, and isolators) will be > 80%.
Various types of antennas on SPS have been considered. The total number of antenna elements could be of the order of several hundred million (this number can be substantially reduced if single klystrons of more than 1 kW output power are used to feed one antenna element). Such a large phased array has neither been developed nor constructed up to now, even on Earth. It is uncertain if simple scaling of already realized arrays is possible or whether it may lead to unexpected problems.
Hence, realizing the SPS system will require overcoming many engineering challenges, such as phased arrays with an RF-DC conversion efficiency higher than 80%, a

6
phase-shifting system with very low root-mean-square errors for accurate beam control, phase synchronization over millions of elements, and very-low-cost mass production of these elements.
Receiving Microwave Power and Conversion to Electric Power The rectenna (located on the Earth) receives the microwave power from the SPS and converts it to DC electrical power. The rectenna is composed of an RF antenna, a low-pass filter, and a rectifier. It is a purely passive system. High efficiency is essential for the rectenna array, with a typical radius of several km. An SPS rectenna sized to generate 5 GW of electricity at the buss-bar at about 34°N latitude (corresponding to Los Angeles) would occupy an elliptical land area extending approximately 13 kilometers north-to-south and 9 kilometers east-to-west. The width of the rectenna area is essentially fixed, but the length, the north-south dimension will vary with latitude. Because the satellite will be in orbit directly above the equator, the circular microwave beam will project an ellipse on the Earth's surface anywhere except at the equator, directly under it. The nominal dimension of a rectenna site including a buffer zone was estimated to be 17 x 13 kilometers.
Environmental Impacts There are many potential environmental impacts from SPS. These include: (1) effects of microwave radiation on the general public and SPS workers and the effects of ionizing radiation on space workers, (2) the effects of SPS launch activities on atmosphere, weather, and climate, and (3) the effects of SPS microwave power transmission on telecommunications.
A list of over 100 environmental impact tasks was provided by NASA, involving work by various NASA Centers, universities, other government laboratories, and a few non-government organizations. Unfortunately this writer has not been able to locate any reports of work accomplished under this program. While many good questions were raised, no answers seem to have been produced.
Alternate Concepts A number of alternative concepts have been proposed, including use of non-tracking solar arrays for SPS in GEO, and locating SPS at the Sun-Earth L2 point. These may offer some benefits but they do not answer the fundamental questions regarding feasibility and affordability of SPS.
Beamed Energy from the Moon
Concept There are many difficulties in the SPS concept, but the need to transport huge masses to GEO appears to be the most formidable impediment. Indeed, for a complete fleet of SPS, the required mass in GEO would exceed 100,000,000 tonnes – and perhaps several times that figure. Transporting that amount of mass to GEO is unimaginable in terms of implied launch facilities and the required frequency of heavy lift launches – not to mention the cost.
To avoid the need to transport all that mass into space, Criswell has advocated locating the solar arrays on the Moon, fabricating solar arrays from indigenous resources on the Moon, and beaming power down to Earth from the surface of the Moon. While that would indeed greatly reduce the mass transported to space from Earth, it introduces a number of other challenges.
In this concept, the Lunar Solar Power (LSP) System, uses 10 to 20 pairs of bases — located on the east and west sides of the lunar hemisphere facing Earth, and a similar number would be on the side facing away from Earth — to collect on the order of 1% of the solar power reaching the lunar surface. The collected sunlight is converted into many low-intensity beams of microwaves and directed to rectennas on Earth. Each rectenna converts the microwave power to electricity that is fed into the local electric grid. Criswell claims that the system could "easily deliver the 20,000 GW or more of electric power required by 10 billion people."
Each lunar power base consists of tens of thousands of "power plots distributed in an elliptical area to form a fully segmented, phased-array radar that is solar-powered.
7
Each power plot consists of four major subsystems: (1) a solar array to generate electrical power, (2) buried electrical wires carry the electric power to microwave generators, (3) microwave generators to convert electric power to microwaves of the correct phase and amplitude and (4) screens that reflect microwave beams toward Earth. Because of the 2-week on/ 2-week off nature of lunar solar availability, such a base would operate on a 2-week on/off cycle. To provide power during the 2-week dark periods, the array of bases on the side of the Moon facing Earth would be augmented by fields of solar converters located on the back side of the Moon, 500 to 1,000 km beyond each visible edge and connected to the Earth-facing power bases by electric transmission lines. Energy storage would be required on Earth for lunar eclipses. However supplying thousands of GW from storage would seem to be a formidable (and very costly) enterprise.
Rectennas located on Earth between 60º N and 60º S can receive power directly from the Moon approximately 8 hours a day. However, power could be received anywhere on Earth via a fleet of relay satellites in high-inclination, eccentric orbits around Earth. This enables each rectenna to receive power 24 hours a day." Criswell claims that the area of the relay stations would be less than 1% of the area of a GEO system, but that seems optimistic.
Kulcinski provided an independent assessment of Criswell's concept. Kulcinski pointed out that due to diffraction, the required product of transmitting and receiving antenna diameters for a lunar SPS is ten times that of a GEO SPS. His estimate of overall efficiency is 0.27%. For a 0.27% overall efficiency, it would require covering 15.3% of the lunar surface with sites to produce 20,000 GW on Earth. Such an enterprise appears more than daunting.
Solar Cell Technology Several references discuss approaches for in situ production of solar cells, as well as other products (aluminum, glass, iron, ...) from lunar regolith.
Because silicon extracted as a byproduct from processes to produce oxygen from regolith is
likely to contain impurities, a proposal was made by one group to produce thin-film silicon on the Moon by vacuum evaporation and deposition. A process is described involving (1) forming a lunar ‘glass’ substrate by melting regolith with concentrated solar heat, (2) depositing polycrystalline silicon solar cells by solar evaporation, (3) interconnecting solar cells serially, and (4) robotic cell fabrication. All of this would be done directly on the lunar regolith using a mechanized solar cell growth facility in which a rover plows ahead across the surface of the Moon and sequentially operates on the exposed regolith below it in a series of steps along the length of the rover, leaving in its wake, a continuous lay-out of solar cells on the lunar surface as far as the eye can see. One may think of this as a sort of Zamboni machine that traverses the lunar surface at about 1 cm per minute, converting regolith into solar cells.
Landis in reviewing this approach, said: "[It has been proposed] that solar cells can be deposited directly onto the lunar surface by melting the regolith (with a solar concentrating mirror) and allowing it to refreeze, and using the refrozen surface as a substrate to deposit silicon cells by vacuum deposition. Since the conversion efficiency of silicon cells on foreign substrates is very sensitive to the substrate composition and surface properties, it is unlikely that melted lunar surface would produce a substrate of the uniformity and quality sufficient to allow solar cells with good conversion efficiency to be produced."
Landis mentions a number of difficulties involved in preparing solar cells on the Moon. A conductor metal will be needed on top of the contact metal. For lunar produced cells, he says that the best choice will be aluminum – but that entails producing aluminum in a useable form on the Moon -– no minor task. For an amorphous silicon cell, a front transparent conductor is typically used rather than connecting directly to the silicon. Typical choices are not abundant on the Moon. Landis then goes on to say that: "Even radiation-tolerant a-Si cells will require at least a thin protection layer, or cover glass, to keep low-energy electrons and protons away. Glass is the best choice." He then points out that aside
8
from the need to produce thin sheets of glass, "the cell is attached to the cover glass with an adhesive layer," and "adhesive technologies require organic materials not easily available from lunar sources." Alternatively, "the front surface radiation protection can be same as superstrate, if the cell is produced by a technology that deposits the silicon directly on glass in an inverted configuration. This production process will have the advantage that the cell will be directly adhered to the glass, eliminating the requirement of adhesive." Landis suggests use of aluminum for interconnects and wiring – which also requires aluminum production and fabrication facilities on the Moon.
Landis described his concept for extraction of silicon and production of solar cells on the Moon using a fluorine process. However, the process requires many steps and involves toxic materials. The practicality of this approach remains doubtful.
Energy from Fusion Reactors The motivation for developing fusion reactors is that in principle they might someday provide the world with unlimited clean energy. However, in practice, this will be very difficult and expensive to develop and implement.
Fusion Processes There are several generations of fusion reactions that are of interest. These processes are distinguished primarily by two main factors:
(1) It is required to maintain the plasma at sufficiently high temperatures (typically 100 - 200 million °C) for a long enough time, in a sufficiently dense configuration, to allow a sufficient number of thermonuclear reactions to occur. The closeness of a plasma to power plant conditions is measured in terms of the triple product P = (n T τ) where n = density, (number of fuel particles per unit volume), T = temperature and τ = confinement time. The requirements for P are lowest for 1st-generation fusion processes (D + T), and increase successively in going to 2nd and 3rd generation fusion processes, making the higher generation processes more difficult to implement. Third-generation processes
typically require the rare isotope of helium: 3He.
(2) The various fusion reactions release their energy as kinetic energy of product nuclei and neutrons. Energetic neutrons are difficult to deal with because they create considerable damage to the structure surrounding the plasma and produce large amounts of radioactivity in the surroundings. The high velocity neutrons impose massive shielding requirements, produce radiation damage and are a source of undesired activation of the reactor structure. First-generation fusion results in 80% of the energy released in the form of neutrons, second-generation fusion reduces this to ~ 35%, and 3rd-generation fusion can be accomplished without production of neutrons.
The advantage of 1st-generation fusion is that it is less difficult to confine the plasma, but the downside is the problems caused by neutron production. Third-generation fusion can eliminate the neutron problem but it is far more difficult to achieve the required P for these processes.
Another issue with 1st-generation fusion is that tritium is one of the reactants, and tritium must be generated and collected in a highly complex breeding blanket surrounding the reactor core.
An important parameter for a fusion based power plant is Q, the ratio of fusion power generated to input auxiliary heating power. While a fusion power plant generating electricity would need Q ≥ 10, an ignited power plant would correspond to Q = ∞, since there is no externally injected heating power in such a device. So far, the best that has been achieved with 1st-generation fusion is Q ~ 1.
Progress in Fusion Technology Reference [H22] provides an analysis of the history of the U. S. magnetic fusion research and development (R&D) program. Total funding over the past 50 years has totaled about $18B. Funding peaked during the early 1980s but has been on a downward trend ever since. Most of the work was done on magnetic confinement of 1st-generation fusion, while more recently some work has been done on inertial confinement approaches. While steady

9
progress has been made in increasing P for D-T fusion, there is still a very long way to go to make such a process practical.
Over the past decade, U. S. policy has reduced funding for fusion development and redefined the program to emphasize fundamental science rather than engineering. This seems to imply a lack of faith that fusion technology is ready for engineering development. This is contrary to the European view that engineering of fusion systems can lead to a prototype 1st-generation demonstration with Q in the range 5 to 10.
A maverick scheme to use electrostatic confinement has some attractive aspects but lack of funding has inhibited exploitation of this approach.
Extraction of 3He from Lunar Regolith While the proponents of 1st-generation fusion claim that the environmental problems due to fast neutrons and tritium can be dealt with effectively, a group at the University of Wisconsin believes that these problems are insuperable, and therefore they have advocated development of 3rd-generation systems utilizing 3He derived from the Moon. There are two major problems with this approach: (1) the difficulty in confining the 3He-3He plasma that requires a value of P about a factor of 100 greater than for 1st-generation fusion, and (2) the difficulty in extracting 3He from lunar regolith considering that its concentration is about 10 parts per billion, and a complex process is needed to separate 3He from other atoms deposited by solar wind.
This group has suggested approaches for extracting 3He on the Moon and transporting it back to Earth. It is not clear at this stage how practical such a system might be.
Conclusions on Fusion The strategic questions that we face include:
• Should the main bulk of fusion research be addressing the 1st-generation D-T reaction (as it presently is) or should it shift over to 3rd-generation 3He–3He based fusion? While confinement in D-T fusion reactors will be much easier to achieve, they will suffer inherently from
radioactive waste problems. This may prevent this technology from ever becoming practical. On the other hand, it is not clear that 3He can be economically acquired from the Moon, and developing a workable reactor for 3He-3He based fusion will be far more difficult to achieve than D–T fusion.
• Should we continue to invest mainly in magnetic confinement schemes, or should emphasis shift to other approaches such as electrostatic confinement?
• Strategically, it is not clear whether the U. S. approach of developing fundamental supporting science, or the European approach of pursuing engineering design of fusion reactors, is the best approach to advance fusion technology.
• What is an appropriate funding level for fusion technology, considering that if a practical fusion reactor can be developed, this could solve the world's energy problems for many years? By contrast, terrestrial solar energy appears very limited and the "hydrogen economy" has been described (properly) as a hoax.1
The above four questions are complex and multi-dimensional. No simple obvious answers jump out immediately. Further review and analysis is needed. Unfortunately, most of the experts in this field are already committed to one point of view, typically that supports their "rice bowls." Bland reviews such as have been conducted by blue ribbon committees, seem to be more concerned with avoiding controversy, and rarely come up with cogent strategies based on deep understanding of the issues. But the energy challenges that we face over the next decades are so potentially severe that it would be height of folly not to devote the effort to weigh the probabilities, uncertain as they may be, and decide on a strategy to maximize chances of success regardless of which ox is gored.
1 "The Hydrogen Hoax," Robert Zubrin, The New Atlantis Winter, 2007.

10
Utilization of Lunar Resources to Enhance Space Missions
Introduction In situ resource utilization (ISRU) is a concept for increasing the efficiency of space missions by utilizing indigenous resources on a planet or moon in order to reduce the amount of materiel that must be brought from Earth. If the cost savings resulting from reduction of resources brought from Earth outweigh the cost of prospecting, developing, testing, validating in situ, and implementing ISRU in missions, it follows that ISRU will have a favorable benefit/cost ratio.
Over the past 3 or 4 decades, there has evolved a community of enthusiasts advocating the development of in situ resource utilization (ISRU) on the Moon (as well as Mars and to a lesser degree, asteroids) to produce products that would then not have to be brought from Earth. Most of the lunar concepts were concerned with extraction of oxygen from lunar regolith, but some have envisaged a longer-term goal of extracting metals, producing silicon solar cells, and introducing the industrial and electronic revolutions to the Moon. More recently, with the tentative identification of hydrogen near the poles, the possibility of extracting water on the Moon has also been discussed. Most of this work has been done on paper, although some limited experiments were conducted.
The potential near-term to mid-term products from ISRU include ascent propellants, life support consumables, propellants delivered to lunar orbit for descent, and propellants delivered to LEO for Earth departure.
Ascent Propellants Production of ascent propellants is the most probable near-term possibility. However, there are several significant impediments. These include the following:
• It is necessary that O2 be used as an ascent propellant. If space storables are used for ascent, there is no value added by ISRU.
• If it is required to have a backup capability for abort to orbit during descent
then one must bring ascent propellants from Earth and again, there is no value added by ISRU.
• Extracting oxygen from regolith requires very high temperature processing with high power inputs. Processes presently under study appear to be impractical.
• Extracting hydrogen and oxygen from putative polar ice deposits will require an extensive campaign of prospecting and validation, driving up the cost. NASA appears to have grossly underestimated the requirements for doing this.
• The actual amount of ascent oxygen required for an outpost is only ~ 8 tonnes per year which does not provide large annual savings compared to the required investment for ISRU.
Propellants for Descent or Transport to LEO Production of propellants for descent would have far greater benefits because the mass of descent propellants is about three times that of ascent propellants. However, the required infrastructure for such a process is daunting.
A more ambitious project would be to deliver water from the Moon to LEO where it could be electrolyzed to produce hydrogen and oxygen propellants for Earth departure. For a typical Mars-bound vehicle in LEO prior to trans-Mars injection, about 60% of the total mass consists of H2 + O2 propellants for trans-Mars injection. If Mars-bound vehicles could be fueled in LEO with H2 and O2 delivered from the Moon, then only the remaining 40% of the total vehicle wet mass would need to be delivered from Earth to LEO. The other 60% would be provided from lunar resources. For example, a Mars-bound vehicle that weighs say, 250 metric tons in LEO, would include about 150 tonnes of propellant for trans-Mars injection. If fueled by hydrogen and oxygen from the Moon, the mass that would have to be lifted from Earth to LEO would only be about 100 tonnes instead of 250 tonnes. This would have a huge beneficial impact on the feasibility of launching very large Mars-bound vehicles. However, when the overall process for transfer of water from the Moon to LEO is examined, it is found that depending on the
11
masses of the tanker spacecraft involved, most (if not all) of the water mined on the Moon is used for propellants to transfer the tankers, and little (if any) water is actually delivered to LEO.
NASA Approach to ISRU A major problem associated with any ISRU scheme to produce propellants is that NASA plans to implement lunar missions (both sorties and outpost) initially without ISRU, and then tack on ISRU as an afterthought rather late in the overall campaign. As a result, all of the vehicles are sized on the basis that ISRU is not used, and these cannot be downsized when ISRU is finally added.
Production of silicon solar cells on the Moon is discussed under the topic of lunar solar power systems.
The NASA human exploration initiative is heavily invested in ISRU. For example, the "ESAS Report" mentions ISRU 110 times. ISRU is typically listed amongst the fundamental reasons for returning to the Moon. The colorful phrase "living off the land" has been promulgated by JSC and NASA. It also appears in numerous JSC publications and presentations. However, the analogy does not work very well. In the case of the Moon, "the land" does not provide a ready "living" and at best, ISRU might conceivably have the potential to make lunar missions more affordable. Even this lesser goal seems very doubtful when the matter is studied objectively.
The treatment of in situ resource utilization (ISRU) in NASA exploration plans is schizophrenic and often misguided. Mission planning for the Moon does not utilize ISRU except as a potential embellishment tacked on a sort of afterthought rather late in the sequence of lunar exploration. On the other hand, JSC ISRU enthusiasts continue to advocate ISRU processes on the Moon that are very problematic and of dubious feasibility, such as high-temperature oxygen recovery from regolith, extraction of solar wind hydrogen/methane volatiles from regolith, and extraction of putative polar ice based on solar energy plus an unattainable number of RTGs. Meanwhile, water is by far the best feedstock for ISRU on Moon and Mars, and there is a
good deal of water on Mars in the near subsurface. Yet NASA has no plans to investigate this resource and determine its accessibility on Mars. Furthermore, analysis shows that the potential impact of water-based propellant and consumable production on Mars missions is far greater than any form of propellant and consumable production on the Moon.
Conclusions Regarding ISRU Lunar ISRU for the purpose of producing ascent propellants is problematic technically and economically. The payoff from such processing is small and the cost is great. More ambitious propellant schemes (descent or transport to LEO) may someday be developed but only in a later generation of missions. Furthermore, any plan to tack on lunar propellant ISRU to lunar missions late in the campaign after all vehicles and systems are designed without ISRU, will minimize the impact of ISRU on mission cost. The current NASA technology program in high-temperature processing of regolith is unlikely to produce any cost savings for the lunar campaign.
The only lunar ISRU research activity that might be worthwhile is exploration of methods to produce silicon solar cells on the Moon for the eventual use in lunar solar power systems. This should be viewed as a very long-term endeavor and research should be conducted on Earth on fundamental processes. Although the challenges are great, the ultimate payoff may also be great.2 Landis' fluorine process may be one candidate to begin with.
By contrast, ISRU for propellant and life support consumable production on Mars (from widespread near-surface water resources) appears to be likely to be technically practical, and can be shown to have significant mission cost benefits. Thus, <ars ISRU should be the main focus of NASA's ISRU technology development program. Presently, none of the ~ $8M/year being expended in this program is aimed at Mars.
2 However, the practicality of lunar power systems remains in doubt.

12
1. Introduction
1.1 The Need for New Energy Sources in the 21st Century Many authors have discussed the trends in world and U.S. energy usage. Driven by an expanding population and an increasingly prosperous life style, energy demand continues to rise despite improvements in efficiency of production and usage. In many cases, the need to control environmental degradation drives up the cost of providing energy to users. During the 20th century, the United States passed through its "Hubbert peak" in oil production, and is now more dependent than ever on imported oil, despite predictions to the contrary.3
Figures 1.1-1 and 1.1-2 show the world's annual consumption of energy with projections for the future made by the Energy Information Administration (EIA).
Figure 1.1-1. World marketed energy consumption: past and predicted by the EIA.
Table 1.1- 1 shows U.S. energy consumption in 2003. The United States consumption amounted to about 23% of world energy usage for about 5% of the world's population.
3 A notable quote: "Space Solar Power Systems could not be expected to constitute a significant part of electricity supply before 2015-25. By that time, the United States will be importing very little foreign oil." [S10]
Figure 1.1-2. World marketed energy by type: past and predicted by the EIA.
Table 1.1-1. United States Energy Consumption – 2003 (Quads).4
Coal 22.3
Natural Gas 19.6
Domestic Oil 12.1
Imported Oil 27.6
Nat. Gas Petroleum Liquids 2.3
Nuclear Power 8.0
Hydro 2.8
Waste 0.9
Geothermal 0.3
Solar 0.1
Wind 0.1
Total 98.2
Table 1.1-2. United States Electric Power – Net Generation by Energy Source in 2005 (109 kWh).
Coal 2,013
Petroleum 123
Natural Gas 758
Other Gases 16
Nuclear 782
Hydroelectric Conventional 270
Other Renewables 94
Hydroelectric Pumped Storage -7
Other 5
Total 4,055
4 1 Quad = 1015 BTU

13
Figure 1.1-3. World electric power usage: past and predicted by the EIA.
United States electric power consumption in 2005 is summarized in Table 1.1-2, and world electric power consumption (past and projected) is provided in Figure 1.1-3 and Table 1.1-3. The United States utilizes roughly 27% of the electric power generated in the world.
The burgeoning world population will demand more and more energy. And the goal of most of the people in less developed countries seems to be to acquire and burn up fossil fuels as fast as Americans do. Criswell [S7] estimates that "20 TW [20,000 GW of installed capacity] of electric power, or 2 kW per person, will be required for a prosperous world of 10 billion people in 2050."
All of this is aided and abetted by the transfer of American manufacturing capabilities to these countries as a result of free trade agreements. The rate of increase of energy usage by these countries is expanding rapidly. There is little doubt that there will soon be a gap between demand and supply of oil and gas, and this will drive up the cost of these fuels further. Coal has a longer horizon but expansion of the use of coal brings with it a host of environmental problems. It seems to be universally agreed by essentially all credible energy analysts that the world in the 21st century faces a severe problem of providing itself with sufficient energy while preserving the environment from further deterioration. It is not a question of if, but rather when will the world economy be subjected to major dislocations due to lack of energy supply?
Kulcinski [H18] discusses the growth in world population and the related increase in world energy usage in the 20th century. He suggests 2050 as a target date when major dislocations between energy supply and demand will occur. Kulcinski and Schmitt [H7] say that "because of expanding populations, increased standard of living, and increased aspirations in the developing nations, ... the Earth energy supplies will have to expand by factors of 3-6 in the next 50-100 years." However, energy problems could get much worse much sooner than that.
Table 1.1-3. World Net Electricity Consumption by Region, 1990-2020 (Billion kWh) [G6]
Region History Projections
1990 1999 2005 2010 2015 2020
Avg. Annual % Change,
1999-2020 Industrialized Countries 6,385 7,517 8,620 9,446 10,281 11,151 1.9
United States 2,817 3,236 3,793 4,170 4,556 4,916 2.0 EE/FSU 1,906 1,452 1,651 1,807 2,006 2,173 1.9 Developing Countries 2,258 3,863 4,912 6,127 7,548 9,082 4.2 Developing Asia 1,259 2,319 3,092 3,900 4,819 5,858 4.5 China 551 1,084 1,523 2,031 2,631 3,349 5.5 India 257 424 537 649 784 923 3.8 South Korea 93 233 309 348 392 429 3.0 Other Developing Asia 357 578 724 872 1,012 1,157 3.4 Central and South America 449 684 788 988 1,249 1,517 3.9
Total World 10,549 12,833 15,182 17,380 19,835 22,407 2.7

14
Reference [H23] says that although world energy consumption has increased by a factor of about ten in the last hundred years, 70% of the world’s population is still deprived of the benefits associated with adequate energy provision (for instance, about 33% of the world’s population lives without electricity). UN figures suggest that the current world population of nearly 6 billion will increase to over 10 billion by 2050, with the bulk of that population being in the developing and transitional economies. In this context, even the most constrained economic growth scenarios project an increase of 50% in the energy consumption by 2050 over the values in 1990. In a high growth scenario, this increase becomes three-fold. The developed economies now live in a period of cheap and abundant energy derived chiefly from fossil fuels—oil, coal and gas: indeed, oil prices are still quite low in spite of the recent spurt in the price of crude. Fossil fuels are not a long term solution to the world energy needs. Predictions on world energy needs indicate a significant shortfall if one uses only conventional sources.
Criswell [S7] points out that "commercial energy production on Earth raises concerns about pollution, safety, reliability of supply, and cost. These concerns grow as the world’s nations begin to expand existing systems to power a more prosperous world. Such growth could exhaust coal, oil, and natural gas reserves in less than a century, while the production and burning of these fossil fuels pollute the biosphere. Expanding nuclear fission power would require breeder reactors, but there is intense political resistance to that idea because of concerns about proliferation, nuclear contamination of the environment, and cost.... Terrestrial renewable systems (hydroelectric, geothermal, ocean thermal, waves, and tides) cannot dependably provide adequate power." A discussion of world energy needs is also given in [S6B]. But one does not have to be an advocate of futuristic energy systems to perceive the impending energy problems that world will face. In fact, significant dislocations due to imbalance between supply and demand of petroleum are likely to occur by 2015-2020.
A wide variety of potential "solutions" to future energy problems have been proposed, advocated and even funded to a degree. Unfortunately, none of these stand up to detailed, honest scrutiny. Reference [S33] examines each of the proposed renewable energy solutions and shows them all to be inadequate to provide large amounts of energy, despite advocacy by popular enthusiasts. There is a modest potential role for terrestrial solar energy, but the intermittent nature of solar energy, and its low year-around average intensity suggest that it will likely be relegated to niches, rather than as a prime energy source providing a significant fraction of our energy needs. Even in a "hydrogen economy" where hydrogen is used as an energy storage medium, the area of solar collectors that would be needed to provide U.S. energy consumption would be far too great to make sense. Fermentation of corn to produce ethanol has been a favorite of the U. S. Congress, but it has been estimated that it takes at least as much energy to produce the ethanol as the energy supplied by the ethanol.5 Wind power is strictly limited in its applicability and introduces a number of environmental and land use issues. The one form of renewable energy that will undoubtedly provide a significant amount of energy (~10% of electrical power needs) is hydroelectric, but oddly enough, hydroelectric power has been disowned by environmental groups who continue to make unfounded and unsupportable prognostications for the future of terrestrial solar energy [S33]. For example, in an article in the Los Angeles Times (January 20, 2007) it is stated that "California's utilities are falling behind schedule in meeting a deadline that 20% of their electricity must come from renewable resources by 2010...." While public agencies may legislate solutions to our energy problems, the reality is not so easy to implement.
This background has provided the motivation for futuristic thinkers to devise concepts for providing the world with its energy needs
5 This issue is still being debated. Robert Zubrin is pro-alcohol fuel. See: "The Hydrogen Hoax," Robert Zubrin, The New Atlantis Winter, 2007.

15
without pollution. That the need exists can hardly be denied. Whether such schemes can be made practical is another matter. Some approaches would hope to provide the world with all its energy needs. A more limited approach would be to provide world electric power needs, leaving non-electric energy needs to other sources. A still more limited approach would be to provide peak electric power needs – when electric power is most expensive. All of this makes economic evaluation of futuristic schemes very complex. Two futuristic energy systems have been proposed that could conceptually supply the world's energy, which have enough positive virtues (at least on paper) that they are worth careful study and evaluation. These are: (1) development of 3He-based fusion power, and (2) space-based (orbit or lunar) solar power systems to beam power down to Earth.
In both instances, for 3He and space solar power, NASA desperately needs system analyses that are free from irrational exuberance, which can dispassionately address the good, the bad and the ugly. This report is an attempt to do that.
1.2 Analysis of Futuristic Energy Concepts Fusion power based on 3He is the ultimate energy source, the holy grail of energy, and the solution to world energy problems (on paper). However, there are two major impediments to implementing such systems: (i) difficulty in obtaining 3He, and (ii) difficulty in developing fusion reactors that utilize 3He. While these impediments pose formidable (and perhaps overwhelming) barriers to development of such systems, the potential payoff is so great that it would be foolish not to investigate this concept – at least to some moderate level of investment.
Unlike 3He fusion, space solar power appears to be technologically feasible. However, the scale of a space solar power system to provide the world's power is so huge, so expensive and so pervasive in its implementation, that it appears to be utterly impractical and unaffordable with current technology. On the other hand, if some rather remarkably optimistic future reductions in mass and cost of the solar power subsystems can be achieved, these systems might one day become competitive with conventional power systems.

16
2. Space Solar Power Solar Power Systems (SPS) can be placed at a number of locations. The classical, or reference, system originally proposed by Glaser operates in geostationary orbit. This has the advantages of placing the satellite in sunlight almost all of the time, and always above the same place on Earth thereby providing a dedicated power supply. The satellites themselves are similar in form to existing solar-powered satellites but with very much larger solar-cell arrays. Major issues specific to geostationary satellites are orbit crowding due to competition for slots such as with telecommunication satellites, limitations on the range of serviceable latitudes from their equatorial vantage point, and dealing with periodic occlusion by the Earth. [S2]
Proposals have also been made to locate SPS in a variety of low to middle Earth orbits, at Earth-Sun L2, and on the Moon. These will be discussed in subsequent sections.
2.1 Solar Platforms in Geostationary Orbit Solar energy from space can be addressed in several different manifestations.
The original idea proposed by Glaser in 1968 [S22] has been developed (on paper) by a number of individuals and groups over the past 40 years. In this concept, a set of large platforms are operated in geostationary orbit (GEO) to convert solar energy to microwave energy, and beam this energy down to ground receivers where it is converted to electrical energy and distributed to the electrical grid.
The geostationary orbit is located above the Earth's equator at an altitude of 35,786 km above mean sea level, where the period of the orbit is 24 hours. The diameter of the Earth is 12,756 km. A spacecraft in such an orbit will remain above a single point on the equator, although some minor station-keeping propulsion will be needed now and again to compensate for second-order effects (see Figure 2.1-1).
In addition, an attitude control system is needed to keep the solar arrays in a fixed
orientation in space as the spacecraft rotates with the Earth. The spacecraft will remain at a fixed angular orientation to any point on the surface of the Earth. Hence an antenna on the Earth pointed at the satellite will remain fixed on the satellite (and vice versa) as the Earth rotates. There are presently about 300 satellites in such orbits – that are mainly used for telecommunications.
Reference [S23] provides a description of solar array performance in geostationary orbit (GEO). The solar arrays on geostationary satellites are subject to a number factors which can result in significant fluctuations in the amount of power available to onboard systems.
The Earth orbit around the Sun is slightly elliptical, resulting in variations in the solar intensity during the course of the year ranging from 97% to 103% of the average solar intensity.
A second effect is that the axis of rotation of the Earth is tilted at ~ 23° with respect to the orbital plane. Therefore the angle of incidence of solar energy received on the solar arrays changes from +23° to –23° during the course of a year, resulting in a solar intensity at the solstices that is 92% of that at the equinoxes. While an array could be manipulated to change its orientation to always be perpendicular to the Sun, it would probably be simpler and cheaper to accept the annual variations.
For a period of about a month centered on the equinoxes, geostationary satellites enter their eclipse season, when they can spend some time near midnight of every day in shadow because the Earth lies in the path of the rays from the Sun. At the equinoxes this maximizes at around 70 minutes each night and fades to zero about 21 days on either side of equinox (See Figure 2.1-2). However, if there are a great number of SPS in orbit surrounding the Earth, only those in the shadow of the Earth (worst case: 70 minutes out of 24 hours ~ 5% of SPS) will be without power at any time. With an interconnected grid, this may not be an insuperable problem.

17
Figure 2.1-1. Solar Power System in GEO.
Reference [S23] also mentions the effects of degradation on the solar cells and their optical coverings due to the space environment. Over a nominal seven-year GEO satellite lifetime, the optical covering degrades about 7% the first year before stabilizing while the solar cells degrade about 3% their first year and 2% each subsequent year. The power levels drop from a high of 99% overall efficiency to a low of 72% after 7 years. Since most concepts for solar power satellites involve 30-year lifetimes, it is not clear how they will cope with degradation of solar cells. It may be possible to use radiation-hardened cells, or to periodically replace the arrays at additional cost.
The overall process is shown in Figure 2.1-3.
Reference [S6] provides estimates for the efficiencies of the various steps in Figure 2.1-3. The solar constant is 1367 W/m2 falling on the solar arrays. The conversion efficiencies are summarized in Table 2.1-1.
According to Reference [S6], if one considers a solar power satellite scaled to replace one conventional power plant that delivers a nominal 1 GW of power, one needs to collect about 14 GW of electric power in space to
deliver 1 GW to the user at Earth. In such a system, about 14 GW of solar power falls on the solar array, the solar array produces ~ 1.8 GW of electric power, the RF power radiated by the antenna is about 1.4 GW, and 1 GW of DC power is generated for the end user. The size of the solar array is ~ 10 km2 in order to intercept 14 GW of power (assuming the array always faces the Sun). The estimate is that 7% of the solar power collected in orbit is delivered as DC power to the end user.
Month
Jan Feb Mar Apr May Jun
Jul Aug Sep Oct Nov Dec
42 days
60
30
70
Figure 2.1-2. Daily duration of eclipses in GEO as a function of the date. [S6B]

18
Solar
EnergySolar Array (convert
solar power to
electrical power)
Convert electric
power to RF and
feed to antenna
Transmit RF to
Rectenna on
Earth
Use super
conducting network
to integrate solar
power and transmit
to RF electronics
Convert RF power
to DC power at
Rectenna on Earth
Figure 2.1-3. Overall process for space solar power.
Table 2.1-1. Conversion efficiencies for step in solar power from space.
Conversion Step Efficiency
Solar power to DC power 13%
DC power to RF power 78%
RF collection at rectenna 87%
RF to DC power (at rectenna) 80%
Overall efficiency ~7%
According to Criswell [S7], "a prosperous world of 10 billion people in 2050" would require 20,000 GW of electric power based on 2 kW per person. This could be satisfied by 20,000 solar power satellites (SPS) of capacity 1 GW, each occupying an area in GEO of > 10 km2 or alternatively, as Criswell indicates, by about 6,000 solar power satellites of capacity 3 to 4 GW each occupying an area in GEO of ~ 40 km2. This would involve one satellite of width ~ 6-7 km for every 0.06° of arc around the GEO so that the distance between adjacent SPS would be a mere 18 km. The GEO would be literally chock full of SPS.
Reference [S10] says: "Deploying SPS would markedly change the visual appearance of the night sky. A set of reference system satellites equally spaced along the Equator would appear as a set of bright stationary 'stars' whose total effect for observers on longitudes near the middle of the set and for all latitudes along these longitude lines would equal the Moon at about quarter phase."
"A completed SPS, even in geosynchronous orbit, would be easily visible to the naked eye" [S10]. Reference [S17] says: "SPS spacecraft ...
would be visible on clear nights. The visible light from each spacecraft (sunlight diffusely reflected from the solar blanket array) would produce about 1/1000 of the light of a full moon; the satellites would be brighter than any object in the night sky except the Moon. They would be brightest near midnight, comparable to Venus, and would become invisible near dawn or sunset since the large solar arrays would be seen "on edge" at these times. If 60 SPSs were positioned uniformly in GEO over the continental United States, the appearance would be that of a chain of bright planet-like objects extending (as viewed from the U.S.) in a nearly straight line from east to west across much of the southern sky. They would be separated slightly less than are the stars in Orion's Belt. In addition, use of 7-power binoculars would clearly show them to be rectangular structures rather than points of light. Light from a large number of SPS satellites would brighten the night sky due to atmospheric scattering, and would be of some concern to astronomers."
Reference [S6B] says: "With a full system of satellites in orbit, satellites would be distributed fairly continuously around the GEO, so that at any radio or optical observatory a band of sky centered on the orbit would be permanently blocked from certain observations at essentially all frequencies. The substantial loss of observable sky resulting from such wideband noise emission would be severely harmful."

19
2.2 Evolution of Space Solar Power Concepts This section is based heavily on Reference [S31].
2.2.1 Baseline 1979 Concept The original 1979 concept for SPS involved up to 60 satellites constructed in LEO and transported to GEO. Each 5 GW system requires ~ 5 km × 10 km collecting area and a 1 km diameter transmitter. RF power is transmitted to Earth at 2.45 GHz. This is illustrated in Figure 2.2-1.
Upon review, it was concluded that on-orbit construction requires a massive construction facility in LEO,6 hundreds of astronauts working continuously over several decades, and the expenditure of > $250 billion (FY96)7 before the 1st kW could be delivered. NRC and OTA concluded that SPS was technically feasible but economically unachievable at the time. NRC recommended continuation of research and a revisit to evaluate viability around 1990.
2.2.2 "Fresh Look" 1995 Study A so-called "Fresh Look Study" was carried out in 1995-97. More than 30 concepts were examined.
Down-selection factors included: investment cost, operations cost, technical risk, public risk, flexibility of service, societal benefits, adaptability, growth capability, and investment opportunity. Six concepts were found to be most promising, as described briefly in Table 2.2-2.
A second phase was added to the Fresh Look study. Two concepts were added in Phase II. The MEO Sun Tower had an operational orbit of ~6,000 km altitude inclined at 30-50°, with multiple satellites used to maintain constant power. A typical transmitter (~ 260 m
6 However, Reference [S6A] discusses in-space assembly and concludes that assembly in LEO is not feasible due to problems from radiation exposure and space debris. 7 This cost estimate is likely to be low by a considerable amount.
diameter) delivers 250 MW at 5.8 GHz, using ± 30 degree electronic beam steering. The ground segment is a 4.5 km diameter rectenna. In this scheme, the solar collectors must rotate as the satellite rolls once per orbit to maintain constant sun-tracking. The second concept utilized a so-called ReflectArray capable of focusing and redirecting the RF power beam. The purpose was to eliminate the complex rotary joints between the tracking solar array and the fixed orientation RF transmitter.
The original Sun Tower concept utilized a 12,000 km equatorial orbit, ± 30° latitude coverage, power levels of ~ 400 MWe, required moderate terrestrial energy storage (level varies depending on platform configuration and specific orbit), and was conceived to provide power for emerging markets: South and Central America, Africa, Asia, India,... It utilized modular systems, self-assembling at high LEO, and assumed aggressive technology for solar arrays, integrated propulsion, and an RF phased array for wireless power transmission (see Figure 2.2-2).
2.2.3 Concept Definition Study 1997-98 A Concept Definition Study was conducted in 1997-98. Several GEO Sun Tower concepts were explored. Deploying the Sun Tower in GEO (rather than MEO) increases end-to-end efficiency and decreases overall mass, and provides 24-hour power delivery for most of the year. However, the ground rectenna must be tilted to face the satellite, and the ground rectenna size must grow (relative to that used for the MEO Sun Tower) to accommodate the longer transmission distances and the associated power beam expansion. Several modifications of the basic Sun Tower configuration were studied (see Figure 2.2-3). In a sandwich configuration, the solar array and the modular RF transmitting antenna form a relatively thin sandwich back-to-back so that electric power generated by the array is immediately available to RF antenna modules without mass and efficiency penalties incurred in transporting electricity through long cables and rotary joints. However, the vectors to the Sun and to Earth are not in the same direction, so a system must be provided
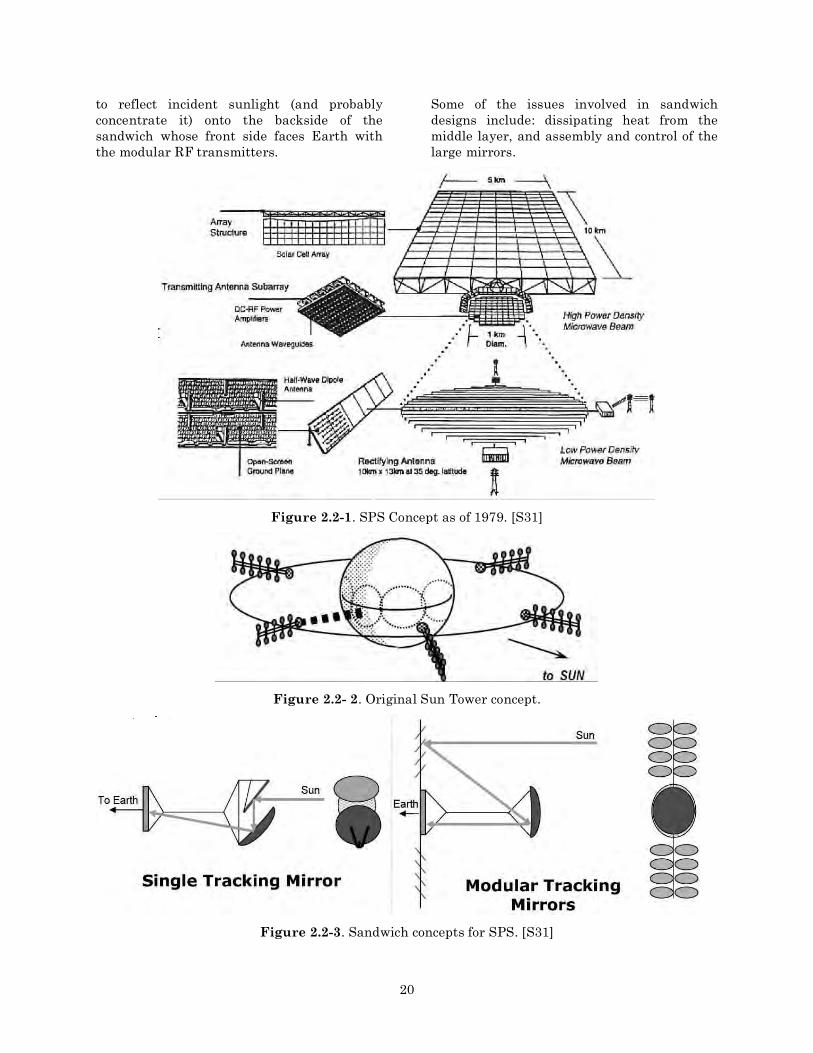
20
to reflect incident sunlight (and probably concentrate it) onto the backside of the sandwich whose front side faces Earth with the modular RF transmitters.
Some of the issues involved in sandwich designs include: dissipating heat from the middle layer, and assembly and control of the large mirrors.
Figure 2.2-1. SPS Concept as of 1979. [S31]
Figure 2.2- 2. Original Sun Tower concept.
Figure 2.2-3. Sandwich concepts for SPS. [S31]

21
Table 2.2-2. Favored Concepts in "Fresh Look" study 1995-7. [S31]
Concept Pros and Cons Diagram
Sun Tower
+ gravity-gradient stabilization + modular and self-assembling − intermittent power implies constellation or multiple ground stations
Solar Disc
+ rotationally stabilized + self- & robotic assembly, incremental construction − massive rotary joints, long cable runs − high technical complexity & investment requirements
GEO Millimeter Wave Dynamic System
+ solar dynamic Brayton cycle + mm-wave leads to reduced aperture − limited power delivery capability − concerns over reliability & maintenance
LEO Sun-synch to MEO Equatorial Relay
+ LEO Sun Tower Xmit to MEO relays − MEO relays require on-board storage & conversion
LEO Sun-synch to GEO Relay
+ LEO Sun Tower Xmit to GEO relays − fewer relays than in MEO but relays are much larger
Planetary Power Web + Extensive distribution & load leveling − mature, large scale network of all of the above elements... NOT a viable first step
N/A
2.2.4 SERT Program 1999-2000 The Space Solar Power (SSP) Exploratory Research and Technology (SERT) program undertaken by NASA in the 1999-2000 time frame was the third in a series that began with the 1995 SSP "Fresh Look" Study, which was followed by the SSP Concept Definition Study in 1998. The goals were to (1) develop alternate SSP configurations that would avoid one of the pitfalls of previous designs: the
need for rotary joints and slip ring assemblies to carry power from the tracking solar collecting elements to the fixed-orientation transmitter, (2) improve the modeling tools to encompass new configurations and technologies, and (3) explore SSP concepts using lasers (instead of RF) to transmit the collected energy to the ground.

22
RF Concepts
Two of the concepts examined in this study are pictured in Figure 2.2-4.
A close-up of the RF Reflector/Abacus Array is shown in Figure 2.2-5. The RF transmitter rotates with the collecting structure and transmits RF energy to a lightweight, Earth-pointing reflector. The modularized reflector tracks the receiving antenna on the ground and redirects the energy to the ground site. The solar collectors always face Sun with very little, if any, shadowing, the solar concentrator uses shifting lens to accommodate seasonal beta-tracking, rotational joints between cells and abacus frame are eliminated, the reflector design eliminates the massive rotary joint and slip rings of the 1979 Reference Concept, the fixed orbital orientation allows continuous anti-Sun viewing for radiators, the Abacus structural frame provides runs for PMAD cabling and permits a “plug and play” solar array approach for assembly and maintenance, the triangular truss structure provides reasonable aspect ratio for abacus, activated links provide reflector tilt for target latitude accessibility, and there is reduced rotational mass since rotating reflector structure can be made much lighter than large planar transmitter array.
In the Integrated Symmetrical Concentrator, sunlight is reflected and concentrated onto the PV arrays by large (Sun-pointing) mirror clamshells and the PV arrays rotate with the Earth-pointing transmitter. The mirror clamshells are made up of inflatable flat segments. The primary concern in this design is the dissipation of heat from the back of the PV array – uneven illumination of PV array may cause thermal as well as power management and distribution (PMAD) problems. In this design, solar collectors always face Sun with very little, if any, shadowing, the sunlight reflector design eliminates massive rotary joint and slip rings of 1979 Reference Concept, the fixed orientation allows continuous anti-transmitter viewing for PV heat rejection, the mirror design minimizes on-platform PMAD mass – claimed to be a dramatic improvement, and there is a reduced rotational mass since the rotating reflectors and structure can be made much lighter than large PV arrays.
According to [S27] power distribution is a general problem with all conventional solar power system designs: as a design scales up to high power levels, the mass of wire required to link the power generation system to the microwave transmitter becomes a showstopper.
Figure 2.2-4. Two concepts studied by SERT. [S31]
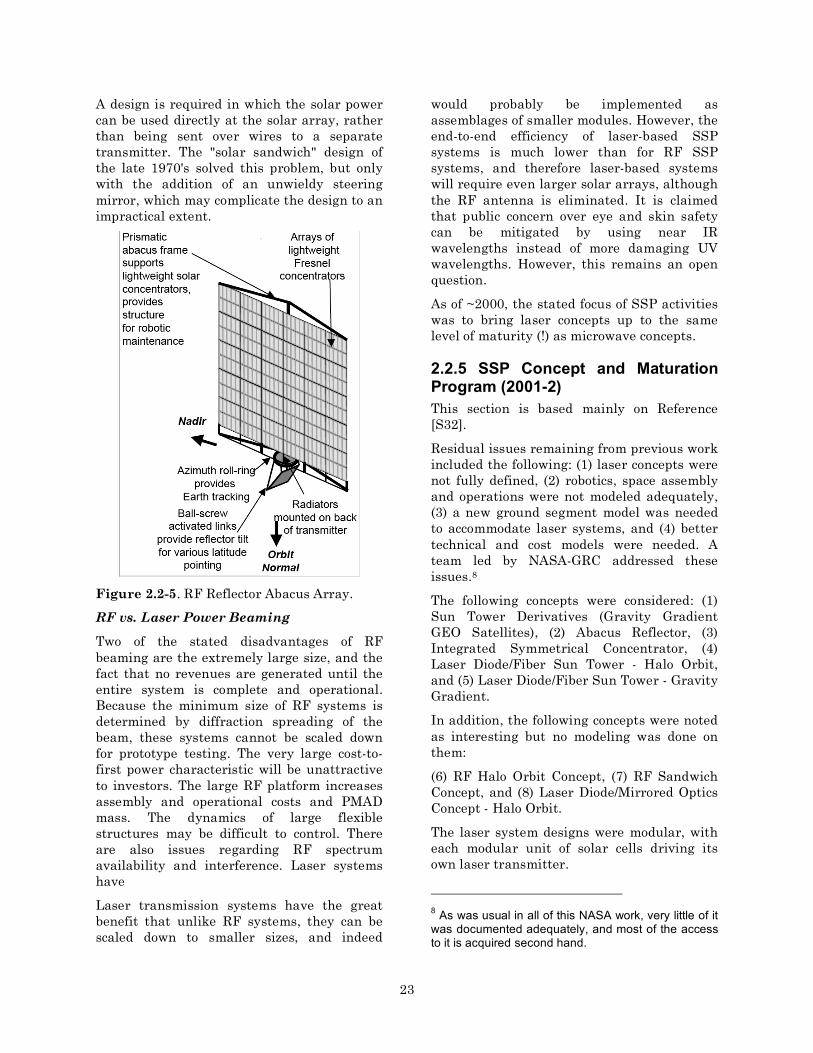
23
A design is required in which the solar power can be used directly at the solar array, rather than being sent over wires to a separate transmitter. The "solar sandwich" design of the late 1970's solved this problem, but only with the addition of an unwieldy steering mirror, which may complicate the design to an impractical extent.
Figure 2.2-5. RF Reflector Abacus Array.
RF vs. Laser Power Beaming
Two of the stated disadvantages of RF beaming are the extremely large size, and the fact that no revenues are generated until the entire system is complete and operational. Because the minimum size of RF systems is determined by diffraction spreading of the beam, these systems cannot be scaled down for prototype testing. The very large cost-to-first power characteristic will be unattractive to investors. The large RF platform increases assembly and operational costs and PMAD mass. The dynamics of large flexible structures may be difficult to control. There are also issues regarding RF spectrum availability and interference. Laser systems have
Laser transmission systems have the great benefit that unlike RF systems, they can be scaled down to smaller sizes, and indeed
would probably be implemented as assemblages of smaller modules. However, the end-to-end efficiency of laser-based SSP systems is much lower than for RF SSP systems, and therefore laser-based systems will require even larger solar arrays, although the RF antenna is eliminated. It is claimed that public concern over eye and skin safety can be mitigated by using near IR wavelengths instead of more damaging UV wavelengths. However, this remains an open question.
As of ~2000, the stated focus of SSP activities was to bring laser concepts up to the same level of maturity (!) as microwave concepts.
2.2.5 SSP Concept and Maturation Program (2001-2) This section is based mainly on Reference [S32].
Residual issues remaining from previous work included the following: (1) laser concepts were not fully defined, (2) robotics, space assembly and operations were not modeled adequately, (3) a new ground segment model was needed to accommodate laser systems, and (4) better technical and cost models were needed. A team led by NASA-GRC addressed these issues.8
The following concepts were considered: (1) Sun Tower Derivatives (Gravity Gradient GEO Satellites), (2) Abacus Reflector, (3) Integrated Symmetrical Concentrator, (4) Laser Diode/Fiber Sun Tower - Halo Orbit, and (5) Laser Diode/Fiber Sun Tower - Gravity Gradient.
In addition, the following concepts were noted as interesting but no modeling was done on them:
(6) RF Halo Orbit Concept, (7) RF Sandwich Concept, and (8) Laser Diode/Mirrored Optics Concept - Halo Orbit.
The laser system designs were modular, with each modular unit of solar cells driving its own laser transmitter.
8 As was usual in all of this NASA work, very little of it was documented adequately, and most of the access to it is acquired second hand.

24
Considerable cost estimation work was carried out. This is discussed in Section 2.7.
2.2.6 NASA-NSF-EPRI Research (2001-2003) Following the completion of an NRC review in 2001 [S4] an inter-Agency partnership including NASA, NSF, and the Electric Power Research Institute (EPRI) was established (NSF-02-098). These three organizations contributed funding and personnel to a broad agency announcement (BAA) with the purpose of supporting research in critical enabling technologies to analyze whether Space Solar Power (SSP) can someday become a viable cost-competitive technology for supplying large-scale base-load electric power worldwide. The solicitation emphasized (but was not restricted to) four special priority areas: (1) wireless power transmission, (2) computational intelligence for tele-autonomous robotic assembly, (3) environmental implications, and (4) power management and distribution. This program—known as Joint Investigation of Enabling Technologies for SSP (JIETSSP)—resulted in about a dozen novel research and technology projects, ranging from intelligent cooperative robots, to the assembly of systems by means of self re-configurable robots, to microwave power beaming and advanced solar cells, to novel approaches using micro-channel cooling to solve SPS thermal management problems. However, it is not clear how to access any of this work, except for the solar cell work by Entech that is on the Internet. In fact, there is no direct evidence available to this writer that indicate what progress, if any, was made.9
2.2.7 NASA Research and Development in SSP & Related Technologies (2004-2005) When President Bush established a new human exploration initiative in January, 2004, a new Exploration Systems Mission Directorate included a substantial investment in new space technologies in its 2005 budget: 9 There seem to have been many NASA programs with large expenditures, for which no documentation was prepared.
the Exploration Systems Research & Technology (ESRT) program. Reference [S6A] asserts that many of the ESRT tasks "naturally encompassed many of the key technologies needed for solar power satellites." However, an examination of those tasks by this author does not confirm this assertion. Be that as it may, most of these tasks were abruptly cancelled a year later in 2006 when Dr. Griffin took over as NASA administrator.
Reference [S6A] said that "through these investments, dramatic progress in a wide variety of the key technical topic areas identified in the 2000 NRC review of NASA’s space solar power plans is being made." This bold claim does not seem to be supported by the facts.
2.3 Space Solar Power Systems
2.3.1 Launch, Assembly and Orbit raising Launch
It is generally conjectured that the modular elements of a solar power satellite would be brought up to LEO via multiple launches with a heavy lift launch vehicle (HLLV) and assembled into a working unit in LEO. Subsequently, either the entire assembled SPS, or a major module of the SPS, would be carried up to GEO by a reusable launch vehicle, possibly using some form of solar electric propulsion.10
Two problems stand out in regard to launching the materiel for SPS. One is the cost and the other is scheduling the large number of launches that would be required.
In regard to cost, the proponents of SSP have made various optimistic assumptions regarding future launch costs. Cost is discussed in Section 2.7.
The number of launches required per SPS depends on the mass of one SPS and the assumed lift capability of the launch vehicle. The number of launches per year depends on the above two quantities plus the assumed 10 However, Reference [S6A] concludes that assembly in LEO is not feasible due to problems caused by radiation exposure and space debris.

25
rate at which SPS systems are deployed (SPS systems per year). Clearly, the mass of a single SPS has an important bearing on the launch rate. The mass of an SPS is discussed in Sec. 2.7.4.
Frequency of Launches
A range of mass estimates for an SPS have been made by various investigators (see Sec. 2.7.4). The 1978 DOE SPS Reference System [S8] estimated the mass of a single 5 GW SPS to be in the range 35,000-50,000 tonnes. However, for a ~ 1 GW SPS using projected thin film photovoltaics, perhaps this could be reduced to 10,000 tonnes.
The 1978 DOE 5 GW SPS Reference System [S8] utilized a conceptual Heavy Lift Launch Vehicle (HLLV) – a two-stage, vertical take-off, horizontal landing (VTOHL), fully reusable winged launch vehicle utilizing CH4/LOX for the first stage and SSME LOX/LH2 engines for the 2nd stage. The gross lift-off weight of the proposed HLLV was 11,400 tonnes with a payload to LEO of 424 tonnes for a 27:1 ratio of take-off weight to payload mass. An air-breather propulsion system (aircraft jet engine) was provided on the booster to provide fly-back capability and simplify the booster operations. There was also a Personnel Launch Vehicle to provide for the transportation of personnel and priority cargo between Earth and LEO. It incorporated a winged liquid propellant fly-back booster.
While the NASA Reference System [S8] conjectured use of a launch vehicle with a payload of 424 tonnes to LEO, and a Japanese study utilized a launch vehicle with a payload to LEO of 500 tonnes, these launch vehicles are so far beyond present capabilities that they tax the credulity of this writer. The HLLV being developed for human missions to the Moon and Mars can lift 125 tonnes to LEO, and this appears to be about as large a launch vehicle as NASA can deal with for at least the next three or four decades.
Hence delivery of elements for one 1 GW SPS to LEO would require at least 80 launches with such a 125 tonne (to LEO) HLLV if the SPS mass can be limited to 10,000 tonnes, and possibly a great deal more than 80 launches if the SPS mass is considerably greater. It is not clear how frequently such huge launches can
be implemented from ground facilities but it seems likely (as a guess) that they might be limited to an extreme upper limit of perhaps one launch per month per launch site. If there were say, three gigantic launch sites capable of sending up HLLVs, the entire set of > 80 launches for one SPS could be carried out in a little over two years. For 5 GW systems, the above figures can be multiplied by 5.
All of the above pertains to one SPS. For an entire family of up to 20,000 satellites, it would take over 40,000 years to launch all the materiel to LEO at the rate of 3 HLLV launches per month.
Assembly
Assembly of an SPS in space has only been discussed briefly by a few papers. The proposed sequences, altitudes, and methodologies for in-space assembly remain vague to this writer.
Reference [S6A] briefly examined several scenarios in which assembly was carried out in GEO, or in a lower orbit. One scenario involved rapid transport of thin-film cells to GEO to avoid cell degradation by radiation. When they considered assembly at lower altitudes, they found that assembly at 500 km is undesirable due to debris impacts. The debris problem can be avoided by assembly at altitudes greater than 3000 km. However it was concluded that the SPS should not be assembled at any altitude between 3000 km and 11,000 km in order to avoid degradation of the cells due to radiation. Therefore, for non-GEO assembly, the assembly altitude was limited to above 11,000 km. It was concluded by Reference [S6A] that assembly at GEO is preferable. However, it appears that most other papers on the SPS seem to imply assembly in LEO.
Reference [S8] says: "construction of the SPS represents a significant technology challenge because the size and operational location have no valid analogies. The number of parameters and options in developing concepts is almost unlimited." Reference [S8] also says that the construction of the SPS structure and the assembly of all the systems is a major consideration in the structural design and in the development of the overall system configuration. A variety of remote

26
manipulators will be needed ranging from short precise ones to space cranes to accomplish tasks at over 100 meters from facility supports. Some tasks include the assembly of automatically fabricated beams into the deep trusses needed for the primary structure, servicing deployment machines, and installing equipment modules. They have suggested some approaches for automation such as the "beam builder." This is construction equipment that takes preprocessed flat strip material, forms the strip into a structural shape for the cap member of a triangular truss, and attaches cross members to the cap to complete the structural truss. An alternative approach is an automatic beam assembler that builds the lightweight truss structure from prefabricated structural elements. The solar cell blankets are to be stretched in membrane fashion between bays of the structural truss. The blankets can be densely packaged in a container that is loaded into construction equipment that performs the deployment. All of the above remains sketchy and seems to be developed only to the PowerPoint level.
Orbit Raising
The requirement for orbit raising from LEO to GEO is a change in velocity of about Δv ~ 3800 m/s. According to the rocket equation, the amount of propellant needed for orbit raising is determined by:
{MPL/(MPL + MPR)} = exp(–Δv/[9.8 × Isp])
where Isp is the specific impulse of the propulsion system that is used, MPL is the payload mass, MPR is the propellant mass, and the mass of the propulsion system has been neglected. Using LOX/LH2 chemical propulsion with Isp ~ 450 s, we find that the propellant mass is > 13,700 tonnes if we assume that the payload mass is > 10,000 tonnes. The propulsion system associated with this amount of propellant has a mass of about 1,400 tonnes. Thus, in addition to the > 10,000 tonne payload for a single SPS, orbit raising would require another 15,100 tonnes for propellant and the propulsion system, requiring an additional ~ 120 launches. The ratio of initial mass in LEO (IMLEO) to payload delivered (one-way) to GEO is about 2.5:1. One of the virtues of using chemical
propulsion is the quick transfer that takes place in a single day.
In principle, a reusable solar electric propulsion system could be used for orbit raising (and return). The spacecraft is spiraled out from the starting orbit to its destination. This approach minimizes the propellant required for the transfer at the cost of increased transfer time. However, in order to maximize power generation, the SEP transfer vehicle must maintain the solar array plane perpendicular to the Sun vector throughout the orbit transfer. When the thrusters are operating, the thrust vector must be as close as possible through the vehicle center of mass. It is not immediately clear how to achieve this for transporting a SPS.
With its much higher specific impulse, the amount of propellant required using SEP would be greatly reduced. However, the mass of the solar array would be a detriment, and there would be a number of other issues introduced. These include:
• Degradation of the solar cell performance while passing through the radiation belts.
• As the specific impulse is raised, the thrust diminishes (at constant power) and to overcome gravity losses and achieve a reasonable trip time, very high power levels are required. Thus, a rather gigantic solar array would be required.
• Developing and implementing the high-performance ion thrusters that are needed.
• The slow spiraling out of the SEP vehicle (several months required for transfer) creates time delays and operational scheduling difficulties.
• Because the SEP vehicle drags the payload slowly through the radiation belts, any personnel required in GEO for assembly or servicing would have to use yet another vehicle, a fast "personnel taxi" powered by chemical propulsion. The impact of radiation on solar arrays would also be severe.
Woodcock [G3] describes a hypothetical SEP system for orbit raising of heavy loads to

27
GEO.11 This reference utilizes a payload of 50 tonnes driven by a 500 kW solar electric propulsion system with a specific impulse of 2000 sec. The trip time (up) is 240 days and (down) is 60 days. The critical parameters of the propulsion system were estimated as shown in Table 2.3-1.
Table 2.3-1. Critical parameters for SEP. [G3]
Parameter Value Thruster specific mass 2 kg/kW Power processing mass 4 kg/kW Array specific power 143 W/kg Array power/area 250 W/m2 Array areal density 1.8 kg/m2
These are ambitious figures that are not currently realized but are not so futuristic that they may not be achievable some day. With these parameters, the masses of various elements are summarized in Table 2.3-2.
The required amount of Xe propellant per transfer is 41.2 tonnes. According to estimates on the Internet, world production of Xe is presently 10 x 106 liters/yr = 53 tonnes/yr. Thus, one transfer would require approximately the present annual world production of Xe. Furthermore, Xe presently costs about $10/liter so the cost of Xe for one orbit transfer could be $100M. While it may be possible to increase world production significantly, recent articles on anesthesiology suggest difficulties. On the other hand, it may be possible to utilize argon as the propellant; argon being far more abundant. However, the lower mass of argon and its higher ionization potential (compared to xenon) reduces the efficiency of an ion thruster – except at extremely high Isp. Based on the analysis presented in [G2] it seems likely that the efficiency with argon might be closer to 50%, whereas for xenon it was estimated by [G3] to be 65% at a specific impulse of 2,000 sec and by [G4] to be 70% at a specific impulse of 3,300 sec.
11 Everything is relative. While a 50 tonne load to GEO is "heavy" by most standards, it is rather puny compared to an SPS.
Table 2.3-2. Estimated masses of SEP orbit-raising system for 50 tonnes payload. [G3]
Up trip time 270 d Return trip time 61 d Array area 2000 m2 Array power 500 kW Array mass 2500 kg Thrust 33.1 N Jet power 325 kW Efficiency 65% Thruster mass 1000 kg Payload accommodation mass 5000 kg PPU & cabling mass 2000 kg Propellant tank mass 2060 kg Structures mass 4483 kg Inert mass 2211 kg Up propellant (Xe) 31,394 kg Return propellant (Xe) 7841 kg Unusable propellant (Xe) 1962 kg Total propellant (Xe) 41,196 kg Total initial mass in LEO 110,451 kg
The viability of the SEP tug concept depends critically on use of a hypothetical high-efficiency lightweight solar array that is likely to be difficult to develop, and lightweight propulsion components. Radiation would gradually diminish the efficiency of the solar arrays with each passage through the radiation belts.
This round-trip SEP orbit raising system cannot be directly compared to a one-way orbit raising system using LOX/LH2 chemical propulsion. The one-way chemical propulsion system had a ratio (IMLEO)/(Payload) ~ 2.5. The round-trip SEP system has a ratio 2.2. Each time that a payload of say 50 tonnes must be delivered to GEO, about 125 tonnes must be delivered to LEO when chemical propulsion is used for orbit raising. However, when SEP is used for orbit raising, assuming that the arrays do not degrade,12 the mass that must be delivered to LEO is only the payload plus the replenishment of used xenon – namely 89.2 tonnes. There is a moderate benefit – again, if the arrays do not degrade.
Reference [G4] analyzed a similar system for transfer of cargo to Earth-Moon L1, which has similar propulsion requirements to orbit raising to GEO. They used ion thrusters with
12 A poor assumption.
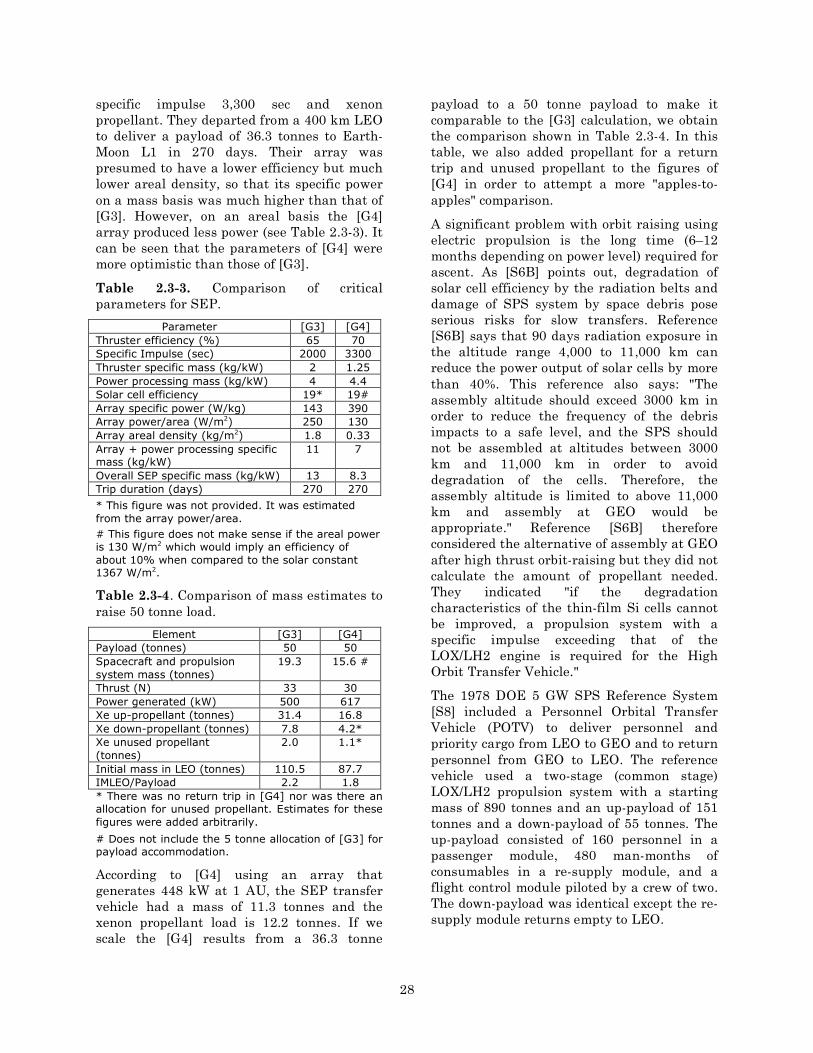
28
specific impulse 3,300 sec and xenon propellant. They departed from a 400 km LEO to deliver a payload of 36.3 tonnes to Earth-Moon L1 in 270 days. Their array was presumed to have a lower efficiency but much lower areal density, so that its specific power on a mass basis was much higher than that of [G3]. However, on an areal basis the [G4] array produced less power (see Table 2.3-3). It can be seen that the parameters of [G4] were more optimistic than those of [G3].
Table 2.3-3. Comparison of critical parameters for SEP.
Parameter [G3] [G4] Thruster efficiency (%) 65 70 Specific Impulse (sec) 2000 3300 Thruster specific mass (kg/kW) 2 1.25 Power processing mass (kg/kW) 4 4.4 Solar cell efficiency 19* 19# Array specific power (W/kg) 143 390 Array power/area (W/m2) 250 130 Array areal density (kg/m2) 1.8 0.33 Array + power processing specific mass (kg/kW)
11 7
Overall SEP specific mass (kg/kW) 13 8.3 Trip duration (days) 270 270
* This figure was not provided. It was estimated from the array power/area. # This figure does not make sense if the areal power is 130 W/m2 which would imply an efficiency of about 10% when compared to the solar constant 1367 W/m2.
Table 2.3-4. Comparison of mass estimates to raise 50 tonne load.
Element [G3] [G4] Payload (tonnes) 50 50 Spacecraft and propulsion system mass (tonnes)
19.3 15.6 #
Thrust (N) 33 30 Power generated (kW) 500 617 Xe up-propellant (tonnes) 31.4 16.8 Xe down-propellant (tonnes) 7.8 4.2* Xe unused propellant (tonnes)
2.0 1.1*
Initial mass in LEO (tonnes) 110.5 87.7 IMLEO/Payload 2.2 1.8 * There was no return trip in [G4] nor was there an allocation for unused propellant. Estimates for these figures were added arbitrarily.
# Does not include the 5 tonne allocation of [G3] for payload accommodation.
According to [G4] using an array that generates 448 kW at 1 AU, the SEP transfer vehicle had a mass of 11.3 tonnes and the xenon propellant load is 12.2 tonnes. If we scale the [G4] results from a 36.3 tonne
payload to a 50 tonne payload to make it comparable to the [G3] calculation, we obtain the comparison shown in Table 2.3-4. In this table, we also added propellant for a return trip and unused propellant to the figures of [G4] in order to attempt a more "apples-to-apples" comparison.
A significant problem with orbit raising using electric propulsion is the long time (6–12 months depending on power level) required for ascent. As [S6B] points out, degradation of solar cell efficiency by the radiation belts and damage of SPS system by space debris pose serious risks for slow transfers. Reference [S6B] says that 90 days radiation exposure in the altitude range 4,000 to 11,000 km can reduce the power output of solar cells by more than 40%. This reference also says: "The assembly altitude should exceed 3000 km in order to reduce the frequency of the debris impacts to a safe level, and the SPS should not be assembled at altitudes between 3000 km and 11,000 km in order to avoid degradation of the cells. Therefore, the assembly altitude is limited to above 11,000 km and assembly at GEO would be appropriate." Reference [S6B] therefore considered the alternative of assembly at GEO after high thrust orbit-raising but they did not calculate the amount of propellant needed. They indicated "if the degradation characteristics of the thin-film Si cells cannot be improved, a propulsion system with a specific impulse exceeding that of the LOX/LH2 engine is required for the High Orbit Transfer Vehicle."
The 1978 DOE 5 GW SPS Reference System [S8] included a Personnel Orbital Transfer Vehicle (POTV) to deliver personnel and priority cargo from LEO to GEO and to return personnel from GEO to LEO. The reference vehicle used a two-stage (common stage) LOX/LH2 propulsion system with a starting mass of 890 tonnes and an up-payload of 151 tonnes and a down-payload of 55 tonnes. The up-payload consisted of 160 personnel in a passenger module, 480 man-months of consumables in a re-supply module, and a flight control module piloted by a crew of two. The down-payload was identical except the re-supply module returns empty to LEO.
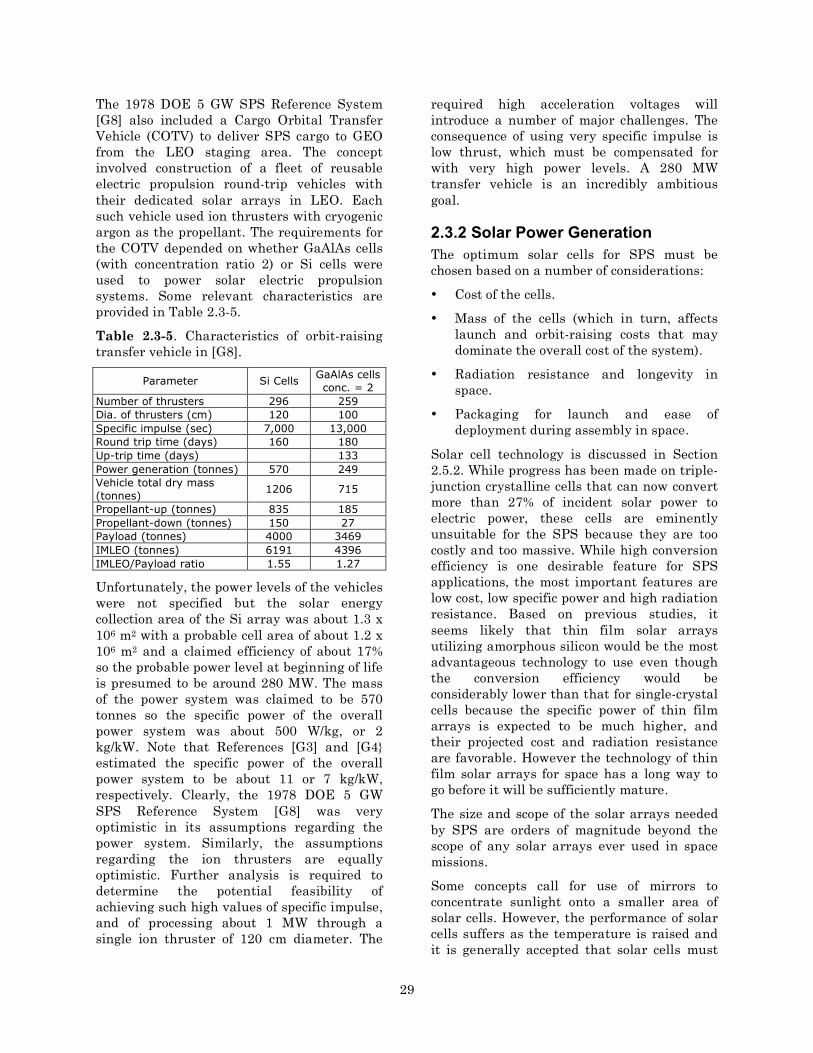
29
The 1978 DOE 5 GW SPS Reference System [G8] also included a Cargo Orbital Transfer Vehicle (COTV) to deliver SPS cargo to GEO from the LEO staging area. The concept involved construction of a fleet of reusable electric propulsion round-trip vehicles with their dedicated solar arrays in LEO. Each such vehicle used ion thrusters with cryogenic argon as the propellant. The requirements for the COTV depended on whether GaAlAs cells (with concentration ratio 2) or Si cells were used to power solar electric propulsion systems. Some relevant characteristics are provided in Table 2.3-5.
Table 2.3-5. Characteristics of orbit-raising transfer vehicle in [G8].
Parameter Si Cells GaAlAs cells conc. = 2
Number of thrusters 296 259 Dia. of thrusters (cm) 120 100 Specific impulse (sec) 7,000 13,000 Round trip time (days) 160 180 Up-trip time (days) 133 Power generation (tonnes) 570 249 Vehicle total dry mass (tonnes)
1206 715
Propellant-up (tonnes) 835 185 Propellant-down (tonnes) 150 27 Payload (tonnes) 4000 3469 IMLEO (tonnes) 6191 4396 IMLEO/Payload ratio 1.55 1.27
Unfortunately, the power levels of the vehicles were not specified but the solar energy collection area of the Si array was about 1.3 x 10⁶ m2 with a probable cell area of about 1.2 x 10⁶ m2 and a claimed efficiency of about 17% so the probable power level at beginning of life is presumed to be around 280 MW. The mass of the power system was claimed to be 570 tonnes so the specific power of the overall power system was about 500 W/kg, or 2 kg/kW. Note that References [G3] and [G4} estimated the specific power of the overall power system to be about 11 or 7 kg/kW, respectively. Clearly, the 1978 DOE 5 GW SPS Reference System [G8] was very optimistic in its assumptions regarding the power system. Similarly, the assumptions regarding the ion thrusters are equally optimistic. Further analysis is required to determine the potential feasibility of achieving such high values of specific impulse, and of processing about 1 MW through a single ion thruster of 120 cm diameter. The
required high acceleration voltages will introduce a number of major challenges. The consequence of using very specific impulse is low thrust, which must be compensated for with very high power levels. A 280 MW transfer vehicle is an incredibly ambitious goal.
2.3.2 Solar Power Generation The optimum solar cells for SPS must be chosen based on a number of considerations:
• Cost of the cells.
• Mass of the cells (which in turn, affects launch and orbit-raising costs that may dominate the overall cost of the system).
• Radiation resistance and longevity in space.
• Packaging for launch and ease of deployment during assembly in space.
Solar cell technology is discussed in Section 2.5.2. While progress has been made on triple-junction crystalline cells that can now convert more than 27% of incident solar power to electric power, these cells are eminently unsuitable for the SPS because they are too costly and too massive. While high conversion efficiency is one desirable feature for SPS applications, the most important features are low cost, low specific power and high radiation resistance. Based on previous studies, it seems likely that thin film solar arrays utilizing amorphous silicon would be the most advantageous technology to use even though the conversion efficiency would be considerably lower than that for single-crystal cells because the specific power of thin film arrays is expected to be much higher, and their projected cost and radiation resistance are favorable. However the technology of thin film solar arrays for space has a long way to go before it will be sufficiently mature.
The size and scope of the solar arrays needed by SPS are orders of magnitude beyond the scope of any solar arrays ever used in space missions.
Some concepts call for use of mirrors to concentrate sunlight onto a smaller area of solar cells. However, the performance of solar cells suffers as the temperature is raised and it is generally accepted that solar cells must

30
operate below about 100°C in space. Even a concentration ratio of 2 will raise the temperature of typical solar cells above 100°C [S6B]. Furthermore, the use of concentrating mirrors will necessitate that they track the position of the Sun, adding complexity and risk. It may be possible to reduce the temperature of solar cells by using filters to eliminate infrared radiation not utilized by the solar cells, but this introduces other problems.
Current space solar array technology provides about 50 W/kg or 200 W/m2. These figures are based on use of crystalline solar cells mounted on a rather heavy support. There is hope in some quarters that someday, so-called thin-film solar cells may be developed that can provide perhaps 200-300 W/kg at about the same areal performance: 200 W/m2. Some analysts have assumed such values (or better) in making their projections.
2.3.3 Conversion to Microwave Power This Section depends mainly on Reference [S6] and [S6B].
Many possibilities have been proposed for the microwave generators, such as microwave vacuum tubes (klystrons, magnetrons, traveling wave tube amplifiers), semiconductor transmitters, and combinations of both technologies. The DC-to-RF conversion efficiency for microwave vacuum tubes can be as high as 65% to 75%; the power of a single tube can be more than 100 kW. For semiconductor transmitters, the best achievable efficiency is 40%, and the power from a single transmitter is below 100 W. But better efficiencies may be possible with new devices.
Compared to semiconductor technologies, a microwave tube has higher efficiency, lower cost, and a higher power/weight ratio (kW/kg), even if one includes the power source, the dc-dc converter, the cooling system, and all the other elements needed to drive the system.
Manufacturability would be one of the important considerations in the implementation of particular technologies for the microwave power transmission system. In any case, thousands of microwave tubes or millions of solid-state amplifiers and
oscillators have to be phased and controlled, which is a significant technical challenge.
The technology employed for generating microwave radiation should be highly efficient, very low noise, and have an acceptable power/weight ratio. Frequencies under consideration are 2.45 GHz or 5.8 GHz in the ISM band (ISM = Industry, Science, and Medical). There are two types of microwave generators and amplifiers, the microwave tube and the semiconductor amplifier. These have contrasting electric characteristics. The microwave power tube (MPT), such as a cooker-type magnetron, can generate and amplify high power microwaves (> kW) with a high voltage (over kV) and it is very economical. The semiconductor amplifier typically generates low power microwaves (below 100 W) with a low voltage (< 15 V). It is currently expensive. The microwave tube has higher efficiency (> 70%) and the semiconductor has lower efficiency (< 50%). The mass of a MPT system is lower than a semiconductor amplifier at the same power output. The following microwave tubes are under consideration:
(1) Phase and Amplitude Controlled Magnetron – The magnetron is widely used in microwave ovens and is a relatively inexpensive oscillator (below $5). However, the cooker-type magnetron cannot be applied to the SPS because it is only a generator and its phase and the amplitude cannot be controlled. As a result, a phased array antenna cannot be constructed with cooker-type magnetrons. An advanced phase-and-amplitude controlled magnetron has been developed at Kyoto University, Japan. They developed a lightweight phase-controlled magnetron called COMET (for Compact Microwave Energy Transmitter) with a specific power of 40 W/kg.
(2) Traveling Wave Tube Amplifier (TWTA) – This is a high-gain microwave amplifier widely used in television broadcasting satellites and communication satellites. The TWTA has a proven track record in space. In 1980, it was not a serious candidate for SPS use because its efficiency was very low, around 30%. However, in recent years, new TWTs have achieved net conversion rates of around 70%. It is estimated that they can
31
provide a specific power of about 60 to 80 W/kg. However, these figures do not include the heat radiation circuit, waveguide, or antenna.
(3) Klystron – The klystron is capable of delivering very high power (tens of kilowatts to a few megawatts). However it requires a ponderous power supply that requires a heavy magnet. The klystron was selected for the NASA-DOE SPS model because of its high conversion efficiency (76% if the device alone was considered), low harmonic emissions, and modest weight. A commercially available klystron can deliver 80 kW of power at 2.45 GHz with a specific power of 10 W/kg. In C band, commercially available klystrons can achieve 25 W/kg. However, applications of the klystron for SPS have not been discussed in the recent SPS research in contrast to magnetrons and semiconductor amplifiers.
(4) Semiconductor Amplifier – In 1980, semiconductor amplifiers were not serious candidates for SPS use because they were too inefficient. However, improvements are being made and they are getting more attention lately. Some reports noted that it may be possible to realize efficiencies in the 50-60% range. Although the cost of semiconductor devices is high, the cost would undoubtedly be reduced through mass production.
2.3.4 Microwave Power Transmission This section is derived from References [S6] and [S6B].
Antenna Array
The main parameters of the microwave-power-transmission (MPT) system for the SPS system are the frequency, the diameter of the transmitting antenna, the output power (beamed to the Earth), the maximum power flux density, and the mass per unit power [S6]. Two frequencies that have been considered are 2.45 GHz or 5.8 GHz.
A huge phased array antenna with high efficiency must be used in the SPS MPT system. The phased array antenna is necessary for steering the power beam to a small rectenna target on the ground with a precision of 0.0005 degrees even though the transmitting antenna of the SPS will always move and fluctuate. It is expected that the
size will be of the order of a 1 or 2 km to transmit 1 to 2 GW at 2.45 GHz. It is typically assumed that the overall DC-RF conversion efficiency, including all losses (e.g. in phase shifters, power circuits, and isolators) will be > 80%.
Various types of antennas on SPS have been considered. NASA-DOE’s SPS adopted a slotted waveguide antenna powered by klystrons. A Japanese experimental SPS called SPS2000 adopted a slot antenna connected to semiconductor amplifiers. Areal densities ranging from 6 to 10 kg/m2 have been claimed. For an area of 1 km2, the mass of an antenna would be 104 tonnes.
The diameter of a transmitting antenna array of a 1 GW SPS system would be roughly 1 km. The average microwave power flux density at the transmitting antenna array of the SPS would then be 1000 W/m2. Depending on the frequency of the microwave power transmission, e.g. 2.45 GHz or 5.8 GHz, the number of antenna elements per square meter would need to be of the order of 100 or 400, where the power delivered by a single element is 10 or 2.5 W, respectively. Thus the total number of elements could be of the order of several hundred million (this number can be substantially reduced if single klystrons of more than 1 kW output power are used to feed one antenna element). Such a large phased array has neither been developed nor constructed up to now, even on Earth. It is uncertain if simple scaling of already realized arrays is possible or whether it may lead to unexpected problems.
Hence, realizing the SPS system will require overcoming many engineering challenges, such as phased arrays with an RF-DC conversion efficiency higher than 80%, a phase-shifting system with very low root-mean-square errors for accurate beam control, phase synchronization over millions of elements, and very-low-cost mass production of these elements.
Control and Calibration
Another important issue concerning the space-based microwave antenna is the necessarily high precision of the control of the beam direction. This is important for two reasons: to maximize the energy transferred to the Earth;

32
and to limit radiation in undesired directions, to avoid adverse effects on existing telecommunication, passive radio-detection systems, and biological systems. In principle, this goal may be achieved with the concept of a retro-directive array in which the rectenna sends a pilot signal to the SPS in order to indicate its position before the power beam is transmitted. This pilot beam is then used to direct the power beam back along exactly the same path as the pilot beam: in the retro-directive direction. The effect of this is to automatically remove perturbations to the direction of the propagating beam, assuming that the perturbing factors along the propagation path do not change during the round-trip transit time. For this to work, retro-directive beam-forming techniques have to be developed in order to suppress side lobes and to maximize the transmission efficiency. In addition, control measures have to take the delay of commands into account, which is a considerable fraction of a second for an SPS in geostationary orbit.
The center of the microwave beam should be confined to a region within 0.0005° of the center of the rectenna. This corresponds to less than one fourth of the 8-arc-seconds half-power beam width of a 1000 m diameter parabolic SPS antenna. Achieving such pointing accuracy and stability poses a major technical challenge. The required beam-control accuracy of the SPS microwave power transmission system might be achieved using a very large number of power transmitting antenna elements, and by limiting the total phase errors over the antenna array to a few degrees.
Emergency procedures should be defined that would be applied when the beam direction is not contained within the predefined angle of 0.0005°. Ordering an interruption of the RF transmission may be a possible solution, but the detrimental effects that could be caused by a sudden interruption of the DC to RF conversion onboard the satellite has to be evaluated, not forgetting that the load to the grid will also need to be managed carefully.
The proposed antennas, both the transmitting antenna and the rectenna, are expected to be so large that testing them in their entirety will pose significant challenges.
2.3.5 Receiving Microwave Power and Conversion to Electric Power The rectenna (located on the Earth) receives the microwave power from the SPS and converts it to DC electrical power. The rectenna is composed of an RF antenna, a low-pass filter, and a rectifier. It is a purely passive system (apart from a low power pilot beam, see Section 2.3.4) and needs no extra power. A low-pass filter is necessary to suppress the microwave radiation that is generated by non-linearities in the rectifier. Most rectifiers use Schottky diodes. Various rectenna schemes have been proposed and the maximum conversion efficiencies anticipated so far are 91.4% at 2.45 GHz and 82% at 5.8 GHz. However, the actual rectenna efficiency will also depend on various other factors, such as the microwave input power intensity and the load impedance.
The single elements of the rectenna can be of many types, such as dipoles, Yagi antennas, microstrip antennas or even parabolic dishes.
High efficiency is essential for the rectenna array, with a typical radius of several km. The efficiency depends on the input power, and the input power flux density is not constant over the entire rectenna site for the SPS system. Further research would be required into rectennas that maintain high efficiency under various input power conditions.
According to Reference [S16], an SPS rectenna sized to generate 5 GW of electricity at the buss-bar at about 34°N latitude (corresponding to Los Angeles) would occupy an elliptical land area extending approximately 13 kilometers north-to-south and 9 kilometers east-to-west. The width of the rectenna area is essentially fixed, but the length, the north-south dimension will vary with latitude. Because the satellite will be in orbit directly above the equator, the circular microwave beam will project an ellipse on the Earth's surface anywhere except at the equator, directly under it. The further away from the equator, i.e., further north within the U.S., the more elongated the ellipse becomes. The land area occupied by the rectenna ellipse itself is approximately 92 km2. A full rectangle of 13 by 9 kilometers will probably be required, at a minimum, to accommodate

33
support facilities. The minimum land area with no buffer zone would therefore be about 120 km2. The nominal dimension of a rectenna site including a buffer zone was estimated to be 17 x 13 kilometers. The land area occupied by the entire installation would be about 200 km2. However, [S16] emphasizes that the required size of the buffer zone depends on the allowable unrestricted exposure level to microwaves.
2.3.6 Integration of Resultant Power with the Power Grid This topic does not seem to be covered very well in the literature.
2.3.7 Environmental Impacts Reference [S13] describes an extensive program "to develop by the end of FY 1980 social and environmental acceptability of the SPS concept." Four fundamental issues related to the SPS construction and operations were defined as:
• Human health, particularly the effects of microwave radiation on the general public and SPS workers and the effects of ionizing radiation on space workers.
• Ecosystems, particularly the effects of launch activities and rectenna operations on ecosystems.
• Atmosphere, particularly the effects of SPS launch activities on atmosphere, weather, and climate.
• Communications, particularly the effects of SPS microwave power transmission on ionospheric-dependent telecommunication systems and the radio frequency interference (RFI)/ electromagnetic interference (EMI) effects of microwave side-lobes on other communications systems.
A list of over 100 individual tasks was provided, involving work by various NASA Centers, universities, other government laboratories, and a few non-government organizations. Reference [S13] provides a one-page summary of each task with an objective and a brief approach.
Some of the many topics covered in this program are listed below:
• Potential hazards to SPS from "spacecraft charging" and hazard to rectenna due to lightning.
• Potential launch complex and funding requirements for facilities, equipment and staff for increased launch activity of a commercial scale SPS.
• Rectenna siting analysis and database for construction of a rectenna in various locations.
• Effects of SPS microwave radiation on atmosphere (ionosphere, magnetosphere)
• Impact of rocket effluent on the atmosphere.
• Potential atmospheric effects of rectenna operations and the impacts on climate and weather.
• Possible inadvertent weather modification resulting from heat and moisture released in the troposphere during HLLV launches.
• Effects of a massive rocket launching campaign on the ionosphere.
• Potential impacts on human health and ecosystems from microwave exposure.
• Effects of microwave radiation on the honeybee and avian species flying though the beam.
• Possible drug-microwaves synergism used in assessing health impact of SPS and the threshold of drug-radiation interaction.
• Hazards of weightlessness for space workers on the SPS.
• Potential impacts on space workers exposed to ionizing radiation.
• Effects of noise levels generated by SPS launches on space center personnel, the surrounding communities, and ecology.
• Estimates of the reflectance, ground illumination, and sky brightness of various SPS vehicles. Effects of reflected light effects on the human eye, biota and optical astronomy.
• Determine which telecommunication systems may be impacted by ionospheric disturbances produced by SPS Reference System operations.

34
Unfortunately this writer has not been able to locate any reports of work accomplished under this program. While many good questions were raised, no answers seem to have been produced.
2.3.8 Overall Efficiency The SPS end-to-end efficiency was estimated by various investigators as shown in Tables 2.3-6, 7 and 8.
Table 2.3-6. SPS efficiencies excluding solar cells. [S6A]
Effect Efficiency Losses due to the atmosphere 0.98 Effect of summer 0.97 Seasonal variation 0.91 Connection efficiency (to commercial power grid)
0.95
RF-DC Conversion efficiency 0.76 DC-RF Conversion efficiency 0.75 Collecting power efficiency 0.93 Total (excluding solar cell) 0.44
Table 2.3-7. Effect of solar cell efficiency on overall system efficiency.
Solar Cell III-V CIS a-Si Sunlight-DC conversion efficiency
0.40 0.15 0.10
Radiation damage (after 30 years)
0.80 0.95 0.95
Total for solar cells 0.32 0.14 0.10 Entire system 0.14 0.06 0.04
Table 2.3-8. Overall SPS efficiency, according to Reference [S6].
Quantity Efficiency solar power to dc power efficiency
13 %
dc power to rf power efficiency 78 % RF collection efficiency 87% RF power to dc power (rectenna) 80 % Total end-to-end efficiency 7 %
2.4 Alternative Concepts The most widely studied (and advocated) space solar power system involves solar power satellites located in GEO. Since these satellites rotate with the Earth, the orientations of the solar arrays are continuously adjusted to remain facing the Sun. These systems are typically designed to provide power to Earth at all times (except for short periods near local midnight at the
solstices when the Earth blocks access to the Sun). However, Landis [S14] has analyzed patterns of electric power usage at a number of power markets and has pointed out the disparity in usage and cost per kWh during a typical day and by season. He suggests that space power systems aimed at providing peak power may be more economically competitive since peak power can be far more expensive than off-peak power. Landis [S14] described three alternate approaches in an effort to reduce complexity and costs: a geosynchronous no-moving parts solar power satellite, a non-tracking geosynchronous solar power satellite with integral phased array, and a solar power satellite at the Earth-Sun L2 point.
2.4.1 SPS in GEO With Fixed Solar Arrays Since power during the peak period is priced at nearly twice the average price, and power at the off-peak has much lower value, it is worth considering whether it might be possible to simplify the power satellite design by eliminating the solar tracking. A flat-plate, non-tracking solar array will produce only 1/π as much energy as a tracking satellite, but in principle could be directed to produce that energy at the most optimum period of the day, when the value of power is roughly double the average value [S14]. If the reduction in cost due to the gain in simplicity of such a satellite is large, this could possibly be a worthwhile trade. In principle, such a system could be used for afternoon peak shaving. However, Landis [S14] claims that the reduction in cost by using fixed (non-tracking) arrays is only about 10% whereas the reduction in energy generated is 64%, and therefore it does not make economic sense. Landis goes on to say that if a "bi-facial" array is used the economics of using a fixed array are even worse.
Landis [S14] then went on to describe a concept involving a tent shaped structure with solar arrays on the outside of the tent and modular microwave transmitters on the inside. The tent has a fixed orientation relative to Earth and does not track the Sun. The tilt can be adjusted to accommodate the demand peaks, as is illustrated for peaks at 8 AM and 4 PM in Figure 2.4-1. Varying the tilt

35
can adjust the peaks to other times similarly spaced – chosen to fit the peak demand. With the addition of tilt, the microwave beam is no longer perpendicular to the solar arrays, which adds complexity. However, the backside of each solar array has a view of the Earth. By placing solid-state microwave transmitters directly on the back of the solar array, power management and distribution, as well as all voltage conversion, is eliminated. By integrating solar array with the microwave transmitter, the transmitter aperture becomes as large as the solar array area. This results in a narrower beam. A narrow beam allows smaller rectenna areas. Landis claims that this design lowers the cost per unit power (at peak power rates) by 45%, and an even larger reduction in cost to first power.
2.4.2 Super-Synchronous Solar Power satellite Landis [S14] proposed locating a SPS in a halo orbit at Earth-sun L2, and this is referred to as a "super-synchronous" solar power satellite (SSPS), since it is located beyond synchronous orbit (see Figure 2.4-2). Only minimal amounts of propellant are needed to maintain a halo orbit. Landis points out that at a distance of point 1.5 million kilometers from the Earth, the SSPS will be forty times further away from the Earth than a satellite placed in geosynchronous orbit. However, he claims that this orbit allows design simplifications to the satellite solar power design that more than compensate for this disadvantage of being further from Earth.
Figure 2.4-1. Landis' non-tracking geosynchronous solar power satellite with integral phased array.
Figure 2.4-2. Location of SSPS at Sun-Earth L2.

36
Landis pointed out that by being located further from the Sun than the Earth, the SSPS beams continuously to the night side of the Earth. By use of a halo orbit, the power system transmitter can be put in a spot where it does not enter the Earth's shadow, and yet still has the advantage of only viewing the night side of the Earth. He then argues that the SSPS could complement a large-scale terrestrial solar power installation, providing the night power that the terrestrial solar installation cannot provide. He argues that this would upgrade the solar energy system to a 24-hour power source with consequent financial benefits. However, several objections to these arguments can be made: (i) the terrestrial system is subject to weather, seasonal effects, etc. and can hardly be described as part of a 24-hour system; (ii) the amount of land required for terrestrial power systems to make a significant contribution to U. S. energy needs is too large to be practical [S33], and (iii) the land availability problem is increased when the land needed for rectennas is considered. Furthermore, Landis points out that in the existing U.S. power market, the maximum power usage is during the day and in the current electrical market, the night delivery of power results in power being sold at the lowest price.
Landis suggested that this system could "beam to three power receivers sequentially, shifting the beam slightly as one rotates out of the line of sight and the new one rotates into line of sight. (For example, three third-world cities of over ten million population located roughly 120° around the globe are Mexico, Cairo, and Shanghai. Each of these cities is power-starved, with expensive, unreliable electrical power and frequent brownouts on the power system, and each of these governments has publicly pledged to erect large-scale fossil fuel power plants to service the growing needs of their burgeoning population.)" However, arranging the international agreements might prove difficult.
According to Landis, "The main design simplification of the SSPS is due to the fact that the Earth and the Sun are located in the same direction. This allows the design to consist of thousands of individual elements,
each separately phased and thus requiring no connection to any other element, and most particularly, requiring no system of power distribution-- the power for each element is generated locally. The design can now incorporate an integrated PV receiver/ microwave transmitter dish. Each individual element can be aimed both at the Sun and at the Earth, and the beams combined by phased-array techniques." Landis assumes that inflatable technology can provide the thousands of individual concentrator/PV/solid-state-transmitter/ parabolic reflector elements (see Figure 2.4-3).
He listed the following advantages of the SSPS compared to Geosynchronous SPS designs:
• Multi-gigawatt electrical cabling eliminated
• Entire system is at low voltage; no arcing
• Rotary joint eliminated
• Rotating electrical feed-through eliminated
• Microwave dish doubles as PV concentrator
• No single element is critical; failure-tolerant design
• Only minor beam scanning required
• Every element is exactly identical
• Mass production of elements yields lower cost
Figure 2.4-3. Landis' inflatable "pillow" module.

37
2.4.3 Laser Transmission Systems Introduction
Reference [S8] discusses the simplistic concept of placing large mirrors in Earth orbit to reflect sunlight down to Earth. For a mirror in geosynchronous orbit, the smallest illuminated "spot" on the Earth would be about 330 km in diameter, governed by optical geometric considerations due to the finite size of the solar disk. Placing large mirrors in lower altitude orbit reduces the size of the illuminated "spot." However, the mirrors would not be stationary with respect to a point on the Earth. Thus, to achieve continuous illumination at a given location, numerous mirrors would have to be placed in low orbit. Therefore, if light is to be transmitted across long distances of space effectively, it must be coherent light via a laser. In addition, cloud cover and weather conditions would have an adverse effect on transmission, precluding consideration of this concept as a primary, baseload electrical power source.
Concepts for converting solar power in space to coherent laser light in the IR, and beaming it to Earth via transmitting optics were developed in the 1970s and early 1980s [S8, S11, S35, S37]. Unfortunately, there does not seem to have been great progress since ~ 1982.
According to [S37] the laser SPS has four significant advantages over the microwave alternative. These are:
(1) smaller land areas are required for the receiving sites;
(2) laser beam almost entirely confined within receiver and stray light causes no health problems
(3) no interference with communications from beam side lobes
(4) a demonstration system can be conducted at a smaller than full scale whereas with microwaves, the demonstration must be at nearly full-scale because of beam spreading.
However, according to [S8], laser power transmission has a significantly lower end-to-end efficiency for long distance power transmission than microwave power transmission. Furthermore, atmospheric
attenuation is substantial compared to microwave frequency transmission. Therefore, this concept was considered by [S8] to be less attractive than the microwave concept for transmitting power from geosynchronous orbit.
Land requirements for the laser SPS are much less than for the microwave system for the same power delivered to the utility buss bar. In the SPS Reference Concept, each rectenna site produces 5 GW. In Sec. 2.7.4 it is estimated that for the microwave SPS, the land area required for a 5 GW power system is about 120 km2 without a buffer zone and about 200 km2 with a buffer zone. In the laser SPS concept, one might use ten 0.5 GW sites, each one requiring about 0.6 km2 [S37] for a total of 6 km2. Thus, a laser uses only ~5% of the land area that is required for a microwave rectenna, [S35]. Laser siting is also more flexible than microwave siting. The scale of the space requirements makes the system topologically less restrictive, large open level plains are not necessary and laser reception sites may be nestled amongst load centers. This is especially significant for Europe where there is little remaining free space of adequate extent for microwave receivers and what does exist is not near load centers, though they are comparatively closer than in the U.S. [S2]
High Power Laser Systems
References [S10] and [S37] discuss high power laser options as of around 1980. At that time, they discussed electric discharge lasers using CO or CO2, direct solar pumped lasers using CF3I, indirect solar pumped lasers using a concentrator with CO2 as the lasant, a free electron laser, and chemical lasers. Heat removal remains a significant challenge in all these systems because energy pumping is always < 100% efficient.
More recent references on high power lasers were difficult to obtain.
Transmitting Optics
Reference [S35] describes three possibilities for transmitting optics (see Figure 2.4-4). Each element marked "laser" is a combination of laser and diverger. "Although the prime-focus system is the simplest of the three configurations, beam spread due to diffraction becomes significant when the diameter of the

38
central obstruction is greater than about 10% of the mirror diameter. The minimum-length, off-axis paraboloid section system cannot be made as short as the on-axis Cassegrain system, but it does circumvent the difficulties associated with beam obscuration. One inherent disadvantage, however, is the difficulty of optical figuring large-area off-axis mirror sectors. From the standpoint of size, optical stability, and diffraction efficiency; the Cassegrain system is the best choice."
Cooling the mirrors, particularly the secondary where light is concentrated, is a challenge. According to [S35], the primary mirror can be radiatively cooled to dissipate the absorbed power associated with a maximum laser power density of 10 W/cm2 (equivalent to about 70 times the solar intensity in space at 1 AU) with very reflective surfaces (IR reflectivity ~ 0.98).13 However, due to the laser power levels involved, considerable heat is generated in the mirror even for these high values of reflectivity. Since designs of interest have higher power densities, so active cooling appears necessary to maintain optical figure control. Because of the very large power densities incident upon the secondary mirror, high-pressure high-flow-rate cooling would be necessary. Oxygen-free, high-conductivity (OFHC) copper mirrors were recommended as the optimum choice under these conditions due to their high damage threshold. The best quoted reflectivity of state-of-the-art diamond turned OFHC Cu mirrors at 10.6 microns was claimed to be 0.993.
Atmospheric Transmission
This section is adopted mainly from [S35].
"The attenuation of laser radiation passing through the Earth's atmosphere is termed linear attenuation if the processes responsible are independent of the beam intensity. In general, molecular scattering, molecular absorption, aerosol scattering, and aerosol absorption contribute to linear attenuation. To calculate the transmittance of any single laser line in propagating from outside the Earth's atmosphere to a terrestrial receptor site, the
13 However, Reference [37] indicates a laser intensity of about 700 Suns, not 70 Suns.
attenuation coefficient due to each of the above processes must be known at a sufficient number of points along the beam path. This implies the necessity for local atmospheric data as well as basic physical parameters related to absorption and scattering."
According to [S10], as in the case of microwave transmission, the fundamental parameter that governs much of laser transmission performance is the frequency (or wavelength). At ultraviolet or visible wavelengths, absorption losses in the atmosphere are higher than for infrared wavelengths. The wavelength also affects the efficiency of the laser power absorption and conversion equipment.
At the wavelengths of CO2 or CO electric discharge lasers (5 to 10 microns), the primary mechanism of beam attenuation is molecular absorption. Scattering by molecules or by aerosols in clear air is relatively unimportant. Attenuation of the beam by aerosols under hazy or cloudy conditions is quite significant and can completely block the beam if the clouds are thick enough. Although it is apparently possible to burn a hole through thin clouds using pulsed beams, the attenuation of energy is appreciable, and because clouds are seldom stationary, the laser would continually encounter new water droplets to vaporize. Transmission of the laser beam through the atmosphere is also affected by a phenomenon called “thermal blooming;”14 For typical CO and CO2 IR lasers, [S35] finds that attenuation via molecular absorption is of primary importance, molecular scattering is negligible, and aerosol scattering and absorption are also generally insignificant attenuation processes in clear air. Under hazy or overcast conditions, aerosol attenuation becomes significant, especially at lower altitudes. There is evidence, however, that multi-megawatt infrared lasers may be capable of "hole-burning" in various types of light clouds or fog.
14 Heating of the atmosphere that causes it to act like a lens and distort the laser beam.
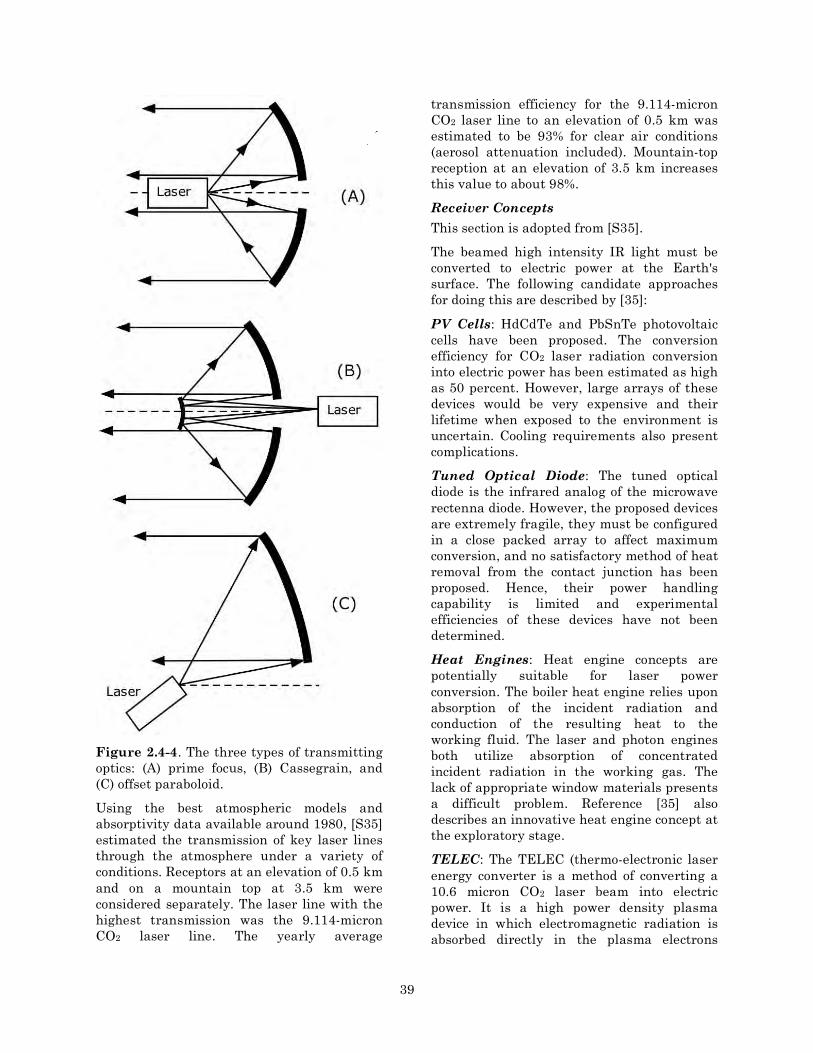
39
Figure 2.4-4. The three types of transmitting optics: (A) prime focus, (B) Cassegrain, and (C) offset paraboloid.
Using the best atmospheric models and absorptivity data available around 1980, [S35] estimated the transmission of key laser lines through the atmosphere under a variety of conditions. Receptors at an elevation of 0.5 km and on a mountain top at 3.5 km were considered separately. The laser line with the highest transmission was the 9.114-micron CO2 laser line. The yearly average
transmission efficiency for the 9.114-micron CO2 laser line to an elevation of 0.5 km was estimated to be 93% for clear air conditions (aerosol attenuation included). Mountain-top reception at an elevation of 3.5 km increases this value to about 98%.
Receiver Concepts
This section is adopted from [S35].
The beamed high intensity IR light must be converted to electric power at the Earth's surface. The following candidate approaches for doing this are described by [35]:
PV Cells: HdCdTe and PbSnTe photovoltaic cells have been proposed. The conversion efficiency for CO2 laser radiation conversion into electric power has been estimated as high as 50 percent. However, large arrays of these devices would be very expensive and their lifetime when exposed to the environment is uncertain. Cooling requirements also present complications.
Tuned Optical Diode: The tuned optical diode is the infrared analog of the microwave rectenna diode. However, the proposed devices are extremely fragile, they must be configured in a close packed array to affect maximum conversion, and no satisfactory method of heat removal from the contact junction has been proposed. Hence, their power handling capability is limited and experimental efficiencies of these devices have not been determined.
Heat Engines: Heat engine concepts are potentially suitable for laser power conversion. The boiler heat engine relies upon absorption of the incident radiation and conduction of the resulting heat to the working fluid. The laser and photon engines both utilize absorption of concentrated incident radiation in the working gas. The lack of appropriate window materials presents a difficult problem. Reference [35] also describes an innovative heat engine concept at the exploratory stage.
TELEC: The TELEC (thermo-electronic laser energy converter is a method of converting a 10.6 micron CO2 laser beam into electric power. It is a high power density plasma device in which electromagnetic radiation is absorbed directly in the plasma electrons

40
producing a high electron temperature. The energetic electrons diffuse out of the plasma striking electrodes which are in contact with the plasma at the boundaries. However this concept remains undeveloped over the past three decades. Window limitations pose a severe problem for this device since the incident laser power density must sustain the plasma and the cell vapor (e.g. Cs) may condense on the surfaces of the cooler optical windows.
In general, since receiver concepts utilize thermal absorption, concentrated laser radiation must be employed to obtain the high temperatures needed for efficient operation. If concentrating optics are to be avoided, then the ground-based laser spot should be reduced to the limitations imposed by diffraction, turbulence, thermal blooming, pointing accuracy, and jitter. Concentrating optics are undesirable from two standpoints. First, environmental degradation of the reflecting surface will cause power losses and a concomitant decrease in system efficiency. Second, large-area precision optics will be expensive, especially if a high mirror figure is required to obtain very large power densities in the conversion device. Another concept for maximizing the absorption of incoming radiation while minimizing thermal losses is the so-called "absorbing sphere." shown in Figure 2.4-5. Re-radiated energy can only escape through the entrance aperture, which purposely subtends a small solid angle. Convective losses due to internal air heating can be minimized by purging with dry air. Most importantly, this concept does not employ high quality optical surfaces and, as such, is not subject to environmental degradation. Hence, the absorbing sphere concept is preferred provided that the focal spot size at the receptor is small enough to obtain the large radiation power density necessary for high-temperature (i.e., high thermal efficiency) operation. High-temperature operation should be possible if the material chosen for the internal wall possesses a large infrared absorptance and is compatible with the working fluid.
Figure 2.4-5. Absorbing Sphere concept.
Beam Spreading
Analytic calculations of laser beam propagation show that beam spreading due to atmospheric turbulence is negligible compared with spreading due to diffraction and pointing inaccuracies at the laser transmitter. Although the angular divergence attributed to turbulence is much larger than the divergence due to diffraction and pointing inaccuracy, the turbulence induced spreading only occurs during the final 30 km of beam path, whereas the diffraction and pointing spreading occurs along the entire path (42,700 km). It was estimated that the beam spread of a Gaussian beam from a point source (including the effects of diffraction, pointing error, and turbulence) are such that a 50-m diameter receptor will intercept approximately 99% of the available power at the ground site.
System Chain Efficiencies
Aspects of the elements that contribute to the overall chain efficiency for laser systems were discussed by [S11] and [S35]. However, the details are not clear. These references (as well as [S8]) agree that laser systems have lower end-to-end efficiencies than microwave systems, but it is difficult to pin this down quantitatively. Reference [S37] mentions that the overall efficiency of the Lockheed concept (described in a subsequent section) is less than 3%. However, [S37] indicated that the efficiency could be increased by switching from a CO2 laser to a CO laser. Reference [S37] does point out however that "the Lockheed concept does have problem areas" and that at least one of the claimed efficiencies "appears unrealistically high."
41
System Description
According to [S11], an SPS system using lasers would likely employ many smaller power transmission links to ground receivers with diameters on the order of 100 meters; therefore, the use of lasers would greatly reduce any rectenna siting problems. According to [S10], laser satellites would not benefit nearly as much as microwave SPS by large scale because the mass of the transmitter for microwave is determined by beam spreading. Thus, microwave transmission systems cannot be scaled down for prototyping but laser systems can be made much smaller. It is claimed that the resulting smaller systems would improve the flexibility of terrestrial power demand matching, provide high degrees of redundancy, and permit a smaller and therefore less costly system demonstration project. The small size of the receiving station would make it possible to employ multiple locations close to the points of use, thereby simplifying the entire ground distribution and transmission system. It would also open up the possibility of re-powering existing power-plants, regardless of their size, simply by replacing their steam generating units with laser-heated boilers and/or superheaters.
The most important technical disadvantages of laser-power transmission are the very low efficiencies of present laser-generation and power-conversion methods, low efficiency of laser transmission through clouds and moisture, and the relatively undeveloped status of laser power-system technology in general. Defense work on high-power, high-efficiency laser systems may have made great progress on high powered lasers but much of this work is secret.
However, none of the advocates of this system seem to have discussed the problem of available airspace when there are hundreds or indeed thousands of laser beams descending from space onto the geography of America. The intensity in the laser beam passing through the Earth's atmosphere is expected to be hundreds of times the solar intensity in space at 1 AU. How are airplanes routed through this maze? And what about birds and other wildlife?
With laser transmission, rather than microwave transmission, the use of low Sun-synchronous orbit15 rather than high geostationary orbits for the massive space power conversion subsystem might be possible. In this system, the laser would beam its power up to low mass laser mirror relays in geostationary orbit for reflection down to the Earth receiver, an arrangement that might considerably reduce the cost of transportation, since the bulk of the system mass is in LEO rather than in GEO. However, system complexity would be increased due to the need for relay satellites. [S10]
Reference [S37] describes several laser SPS system concepts that were proposed around 1980.
The Lockheed concept utilized a power satellite in a sun-synchronous orbit of altitude > 900 km to avoid lifting heavy masses to GEO. A less-massive mirror relay in GEO is used to direct the ultimate beam to Earth. For power conversion of solar energy to electric energy, a 2.8 km diameter focusing mirror is used to direct intensified sunlight through a 13 m diameter concave window into a solar cavity where liquid potassium is vaporized at 3400 K. The potassium vapor is used to drive a heat engine that drives an electric generator. The Lockheed system used 20 CO2 electric discharge lasers that were phase locked by a complex optical system, and sent to transmitting optics to beam the laser light to the relay station. It is claimed that over the entire transit from the satellite to the mirror relay, the beam only spreads to about 40 m due to jitter and diffraction. The power in the beam as it leaves the GEO relay is stated to be 1 MW/m2, which is equivalent to about 750 times the solar intensity in space at 1 AU.
2.5 Lunar Solar Power Systems
2.5.1 Description Criswell [S7] argues that in order to make space solar power from GEO competitive, the cost to develop "components of the power
15 A Sun-synchronous orbit is a near-polar low orbit around the Earth that keeps the satellite in full sunlight all the time while the Earth rotates beneath it.

42
satellites, ship them into space, assemble and maintain them, decommission the satellites, and finance all aspects of the space operations would have to be lowered by a factor of 10,000. Power prosperity would require a fleet of approximately 6,000 huge, solar power satellites. The fleet would have more than 330,000 km2 of solar arrays on-orbit and a mass exceeding 300 million tonnes. By comparison, the several hundred satellite payloads and rocket bodies now in Earth geosynchronous orbit have a collective surface area of about 0.1 km2. The mass launch rate for a fleet of power satellites would have to be 40,000 times that achieved during the Apollo era by both the United States and the Soviet Union."
He uses this as a basis for advocating that space solar power systems be located on the Moon. In his concept, the Lunar Solar Power (LSP) System, uses "10 to 20 pairs of bases—one of each pair on the eastern edge and the other on the western edge of the Moon, as seen from Earth—to collect on the order of 1% of the solar power reaching the lunar surface. The collected sunlight is converted to many low-intensity beams of microwaves and directed to rectennas on Earth. Each rectenna converts the microwave power to electricity
that is fed into the local electric grid." He claims that the system could "easily deliver the 20 TW or more of electric power required by 10 billion people."
Each lunar power base consists of tens of thousands of "power plots distributed in an elliptical area to form a fully segmented, phased-array radar that is solar-powered. Each power plot consists of four major subsystems: (1) a solar array to generate electrical power, (2) buried electrical wires carry the electric power to microwave generators, (3) microwave generators to convert electric power to microwaves of the correct phase and amplitude and (4) screens that reflect microwave beams toward Earth (see Figure 2.5-1).
In this particular design, 67% of the surface area is used for solar power collection. The microwave power amplifier operates at ~ 1.3 kWRF. The ridges are thermally glazed regolith with amorphous silicon PV deposited. The ridged design was originally suggested by Landis to even out the variations in solar output as the Sun moves across the sky in the lunar-day (14 Earth days). In Kulcinski's scheme, about 50 × 106 power plots would constitute a "site" producing about 50 GW.
Figure 2.5-1. Power plot as described by Kulcinski [S24].

43
A number of sites would be located on the east and west sides of the lunar hemisphere facing Earth, and a similar number would be on the side facing away from Earth.
Criswell [S7] does not discuss this, but because of the 2-week on/ 2-week off nature of lunar solar availability, such a base would operate on a 2-week on/off cycle. To provide power during the 2-week dark periods, Criswell conjectures that this array of bases on the side of the Moon facing Earth "would be augmented by fields of solar converters located on the back side of the Moon, 500 to 1,000 km beyond each visible edge and connected to the Earth-facing power bases by electric transmission lines." He also points out that the "Moon receives sunlight continuously except during a full lunar eclipse, which occurs approximately once a year and lasts for less than three hours." He suggests that "energy stored on Earth as hydrogen, synthetic gas, dammed water, and other forms could be released during a short eclipse" but supplying up to 20 TW from storage would seem to be a formidable (and very costly) enterprise.
Criswell [S7] says that "rectennas located on Earth between 60º N and 60º S can receive power directly from the Moon approximately 8 hours a day. Power could be received anywhere on Earth via a fleet of relay satellites in high-inclination, eccentric orbits around Earth [see Figure 2.5-2 in color figures section].... This enables each rectenna to receive power 24 hours a day." Criswell claims that the area of the relay stations would be less than 1% of the area of a GEO system, but that seems optimistic.
If all the materiel needed for lunar power beaming were brought from Earth, the cost would likely be unaffordable. However, Criswell conjectures that most of the required systems on the Moon could be fabricated from indigenous resources. He believes that that 90% or more of the materials needed can be made on the Moon from lunar materials, including silicon, aluminum, and iron. Trace elements can be brought from Earth for doping solar cells.
Kulcinski [S24] provided an independent assessment of Criswell's concept. He
presented the design shown in Figure 2.5-1, taken from earlier work by Woodcock. The performance of triangular solar arrays is described by Rapp [S25]. In order to deal with the relative orientations of Earth, the Sun and the Moon to provide 24-hour power to Earth, he suggests microwave reflectors in lunar orbit as well as in Earth orbit. He compared lunar SPS with GEO SPS and pointed out that lunar SPS require considerably more solar array area:
• Factor of 2 for day/night cycle
• Factor of 2 for triangular fixed arrays with oblique solar angle
• Factor of 3 because Si photovoltaics are far less efficient than triple junction GaAs-based cells.
However, it seems very unlikely that GEO arrays would use GaAs triple junction cells, and instead would probably also use thin-film silicon so the third bullet appears to be irrelevant.
Kulcinski also pointed out that due to diffraction, the required product of transmitting and receiving antenna diameters for a lunar SPS is ten times that of a GEO SPS. His estimate of overall efficiency is given in Table 2.5-1. In this table, the first row (illumination of one cell) is derived from the fact that the solar "day" allows solar collection 50% of the time, and using the triangular arrangement described in Figure 2.5-1, the solar rays strike the collectors at oblique angles that vary with time during the lunar "day." Rapp [S25] quotes analysis by Landis that calculates that for a 60° triangle, the cosine effects reduce the 50% availability to about 25%. Thus, Kulcinski's estimate of 32% appears to be overly generous. The fill factor (2nd line) refers to the fact that over a site containing many "power plots" only about 20% of the site area is covered by solar cells. All the other rows in the table are self explanatory. For a 0.27% overall efficiency, it would require covering 15.3% of the lunar surface with sites to produce 20,000 GW on Earth. Such an enterprise appears very daunting.
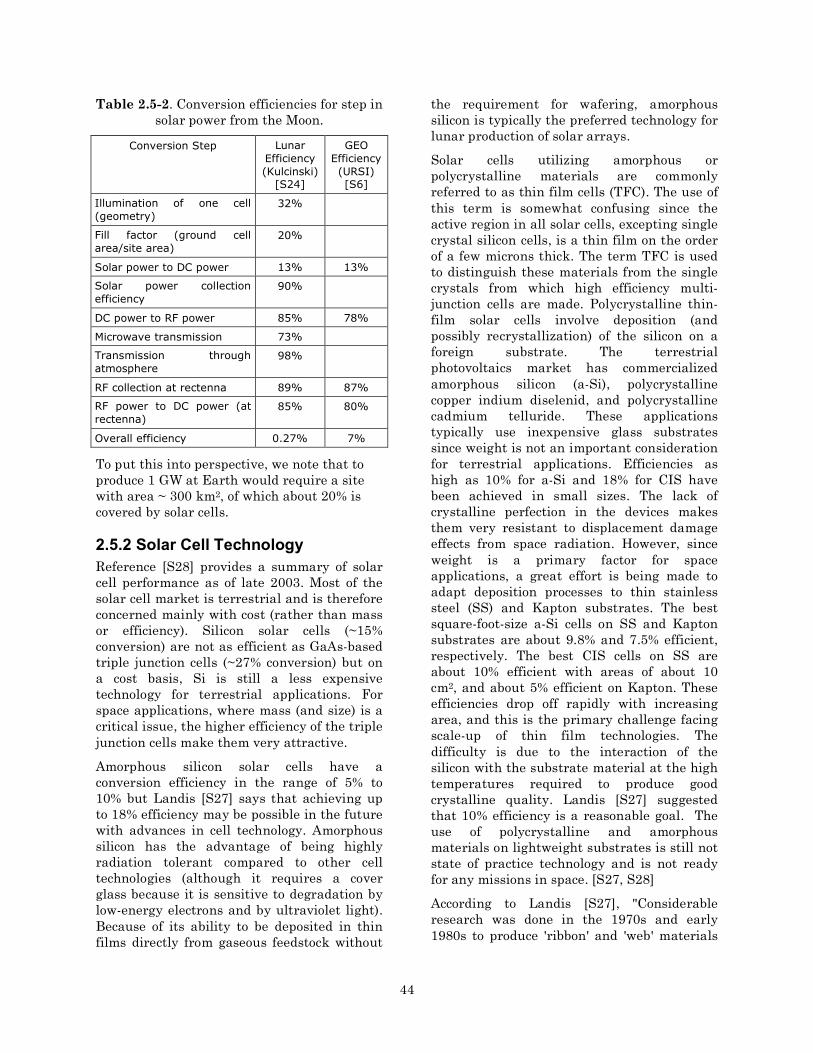
44
Table 2.5-2. Conversion efficiencies for step in solar power from the Moon.
Conversion Step Lunar Efficiency (Kulcinski)
[S24]
GEO Efficiency (URSI) [S6]
Illumination of one cell (geometry)
32%
Fill factor (ground cell area/site area)
20%
Solar power to DC power 13% 13%
Solar power collection efficiency
90%
DC power to RF power 85% 78%
Microwave transmission 73%
Transmission through atmosphere
98%
RF collection at rectenna 89% 87%
RF power to DC power (at rectenna)
85% 80%
Overall efficiency 0.27% 7%
To put this into perspective, we note that to produce 1 GW at Earth would require a site with area ~ 300 km2, of which about 20% is covered by solar cells.
2.5.2 Solar Cell Technology Reference [S28] provides a summary of solar cell performance as of late 2003. Most of the solar cell market is terrestrial and is therefore concerned mainly with cost (rather than mass or efficiency). Silicon solar cells (~15% conversion) are not as efficient as GaAs-based triple junction cells (~27% conversion) but on a cost basis, Si is still a less expensive technology for terrestrial applications. For space applications, where mass (and size) is a critical issue, the higher efficiency of the triple junction cells make them very attractive.
Amorphous silicon solar cells have a conversion efficiency in the range of 5% to 10% but Landis [S27] says that achieving up to 18% efficiency may be possible in the future with advances in cell technology. Amorphous silicon has the advantage of being highly radiation tolerant compared to other cell technologies (although it requires a cover glass because it is sensitive to degradation by low-energy electrons and by ultraviolet light). Because of its ability to be deposited in thin films directly from gaseous feedstock without
the requirement for wafering, amorphous silicon is typically the preferred technology for lunar production of solar arrays.
Solar cells utilizing amorphous or polycrystalline materials are commonly referred to as thin film cells (TFC). The use of this term is somewhat confusing since the active region in all solar cells, excepting single crystal silicon cells, is a thin film on the order of a few microns thick. The term TFC is used to distinguish these materials from the single crystals from which high efficiency multi-junction cells are made. Polycrystalline thin-film solar cells involve deposition (and possibly recrystallization) of the silicon on a foreign substrate. The terrestrial photovoltaics market has commercialized amorphous silicon (a-Si), polycrystalline copper indium diselenid, and polycrystalline cadmium telluride. These applications typically use inexpensive glass substrates since weight is not an important consideration for terrestrial applications. Efficiencies as high as 10% for a-Si and 18% for CIS have been achieved in small sizes. The lack of crystalline perfection in the devices makes them very resistant to displacement damage effects from space radiation. However, since weight is a primary factor for space applications, a great effort is being made to adapt deposition processes to thin stainless steel (SS) and Kapton substrates. The best square-foot-size a-Si cells on SS and Kapton substrates are about 9.8% and 7.5% efficient, respectively. The best CIS cells on SS are about 10% efficient with areas of about 10 cm2, and about 5% efficient on Kapton. These efficiencies drop off rapidly with increasing area, and this is the primary challenge facing scale-up of thin film technologies. The difficulty is due to the interaction of the silicon with the substrate material at the high temperatures required to produce good crystalline quality. Landis [S27] suggested that 10% efficiency is a reasonable goal. The use of polycrystalline and amorphous materials on lightweight substrates is still not state of practice technology and is not ready for any missions in space. [S27, S28]
According to Landis [S27], "Considerable research was done in the 1970s and early 1980s to produce 'ribbon' and 'web' materials

45
for silicon. These processes were designed to pull a flat sheet of silicon out of a melt without the requirements for wafering. While none of the ribbon or web productions processes went into large-scale commercial production, it may be possible in the future to revive these processes to avoid the slicing and polishing requirements. The requirement for a 1410 °C silicon melt, however, means that the technology is both energy-intensive and may require frequent replacement of crucibles."
Landis [S27] says: "Because of the added difficulty and mass of wafer production machinery, the single- and multi-crystalline technologies are considered less desirable for lunar production. Direct ribbon technologies, although they do not require wafering, have the difficulties of being comparatively less well developed, requiring high mass machinery, and requiring an intermediate high-temperature silicon melt to produce solar substrates. For these reasons, it is suggested that either amorphous silicon, or polycrystalline Si on a foreign substrate, will be preferable technologies. Both of these technologies do not require an intermediate melt, but can be deposited directly from the gas phase. The slightly lower resulting efficiency will be an acceptable trade-off for the increased simplicity."
Solar cells involve a good deal more than the actual photovoltaic solar-to-electric converter. A solar cell includes a top electrode to carry away current generated, an anti-reflection coating to reduce reflection losses, typically a glass cover plate shield the cells from radiation, n-type Si and p-type Si doped layers, a bottom electrode to complete the circuit, and a substrate to provide structural support. Solar arrays place large numbers of cells onto a structural framework that can be deployed for actual use. The mass per unit area of arrays is typically a good deal larger than the mass per unit area of cells.
2.5.3 In Situ Production of Solar Cells on the Moon Silicon as an Adjunct of Oxygen Production
Several references discuss approaches for in situ production of solar cells, as well as other
products (aluminum, glass, iron,...) from lunar regolith [S18, S26, S27].
Reference [S26] mentions that past interest in regolith processing has been concerned with oxygen production, but "moderate quality" silicon as a "waste product" could also be produced. According to [S26] the extracted silicon from such processes is likely to contain "several hundred to several thousand parts per million impurity levels," and the "extracted silicon is much poorer than electronics-grade (doubtful for solar cell fabrication)." Therefore, they sought another approach for producing silicon of sufficient purity for solar cells.
Vacuum Evaporation and Deposition of Thin-Film Silicon
Reference [S26] advocated a process involving (1) forming a lunar ‘glass’ substrate by melting regolith with concentrated solar heat, (2) depositing polycrystalline silicon solar cells by solar evaporation, (3) interconnecting solar cells serially, and (4) robotic cell fabrication. All of this would be done directly on the lunar regolith using a mechanized solar cell growth facility in which a rover plows ahead across the surface of the Moon and sequentially operates on the exposed regolith below it in a series of steps along the length of the rover, leaving in its wake, a continuous lay-out of solar cells on the lunar surface as far as the eye can see. One may think of this as a sort of Zamboni machine that traverses the lunar surface at about 1 cm per minute, converting regolith into solar cells (see Figure 2.5-3 in color figures section). This rover utilizes a ~ 150-200 kg-plow in front to smooth the regolith, and multiple parabolic trough solar collectors that are slow tracking as the vehicle moves in the east-west direction. The vehicle leaves behind it a roadbed covered with silicon solar cells.
As can be seen from Figure 2.5-3 in color figures section, the first step is formation of a 'glass" substrate on the lunar surface by melting a 1-2 mm thickness of regolith with the first solar concentrator. It is not exactly clear to this writer how the bottom electrode is formed above this substrate. The second solar concentrator is claimed to evaporate a 10-40 micron thickness of silicon, although again, neither this process, nor the ensuing n- and p-

46
doping steps are understandable to this writer. This is followed by steps to apply a metalized front electrode and an anti-reflection coating, which as before, are mysterious to this writer. Their formulation for solar cells made on the Moon is illustrated in Figure 2.5-4 in color figures section.
Landis [S27] in reviewing this approach, said: "[It has been proposed] that solar cells can be deposited directly onto the lunar surface by melting the regolith (with a solar concentrating mirror) and allowing it to refreeze, and using the refrozen surface as a substrate to deposit silicon cells by vacuum deposition. Since the conversion efficiency of silicon cells on foreign substrates is very sensitive to the substrate composition and surface properties, it is unlikely that melted lunar surface would produce a substrate of the uniformity and quality sufficient to allow solar cells with good conversion efficiency to be produced." More recent work [S29, S30] might prove helpful. Meanwhile, this scheme appears to be at best, highly speculative.
Amorphous Silicon Cells
Landis [S27] has provided an extensive and useful discussion of solar cell options, and solar cell production on the Moon. In discussing superstrates and substrates for a-Si solar cells manufactured on the Moon, Landis suggested that "for a substrate, a lunar-derived glass or ceramic can be used." However, he goes on to say that: "For a superstrate, the glass will have to be transparent. Note that it is a significantly more difficult task to produce transparent glass than it is to simply produce glass.... For both approaches, it is highly desirable that the thermal expansion coefficient of the superstrate or substrate should be close to that of the silicon." He also says: "a-Si solar cells have also been made with a stainless-steel substrate. This may be relatively simple to make on the Moon, since iron and nickel are deposited into the lunar soil in reduced form from the impact of nickel-iron meteoroids. A metallic substrate will require use of an insulator between the semiconductor and the metal if the commonly used monolithic-interconnection process is used to integrally connect individual sub-cells into a series string to increase the voltage." On the other
hand, what is "simple" may depend on the eye of the beholder. Producing stainless steel substrates on the Moon may not be as simple as suggested.
Landis mentions a number of difficulties involved in preparing solar cells on the Moon. A conductor metal will be needed on top of the cell to make electrical contact. For lunar produced cells, he says that the best choice will be aluminum – but that entails producing aluminum in a useable form on the Moon -– no minor task. For an amorphous silicon cell, a front transparent conductor is typically used rather than connecting directly to the silicon. Typical choices (ZnO, SnO2, In2O3 and CdS) are not abundant on the Moon. If a-Si is chosen, Landis suggests that "a microcrystalline silicon front layer, with an Al or TiSi contact layer could substitute for the transparent conductor" – again this appears as a daunting task to this writer. Landis then goes on to say that: "Even radiation-tolerant a-Si cells will require at least a thin protection layer, or cover glass, to keep low-energy electrons and protons away. Glass is the best choice." He then points out that aside from the need to produce thin sheets of glass, "the cell is attached to the cover glass with an adhesive layer," and "adhesive technologies require organic materials not easily available from lunar sources." Alternatively, "the front surface radiation protection can be same as superstrate, if the cell is produced by a technology that deposits the silicon directly on glass in an inverted configuration. This production process will have the advantage that the cell will be directly adhered to the glass, eliminating the requirement of adhesive." Landis suggests use of aluminum for interconnects and wiring – which again requires aluminum production and fabrication facilities on the Moon.
Amorphous Silicon Cells via Fluorine Extraction
Landis described his concept for extraction of silicon and production of solar cells on the Moon [S27]. He points out that extraction of silicon from the lunar regolith cannot be done using processes currently in use on Earth because lunar regolith is primarily igneous silicates whereas terrestrial silicon production uses carbon reduction of high-silica sand with

47
coal. He also argues that many of the processes proposed for extraction of oxygen from regolith do not produce silicon.
He selected a process on the bases that: (1) the silicon should be produced in a form that would allow easy purification, (2) the process should be suitable for use on a variety of lunar regoliths at most locations, and (3) for simplicity in materials handling, the process should not require pre-processing or beneficiation to concentrate particular mineral compositions in the soil.
This led him to choose a fluorine process for silicon production. In his view, this has the advantage that the silicon is produced in the form of tetrafluorosilane, which can be easily purified of contaminating traces of the other metals by distillation. Fluorine is brought to the moon in the form of potassium fluoride (KF). The KF is electrolyzed to produce potassium and fluorine. The potassium and the fluorine are both used as reactants in the process. The overall process requires many steps as described below:
(1) Fluorine is brought to the Moon in the form of a fluoride mixture.
(2) Potassium fluoride is electrolyzed from eutectic salt to form free fluorine and metallic potassium at 676°C.
(3) The fluorine is reacted with heated lunar regolith to form SiF4, oxygen, and metal fluorides at 500°C.
(4) Gaseous SiF4 is separated from oxygen by condensation at a temperature of 178 K.
(5) SiF4 is reacted in a plasma to form silicon at a temperature of 300°C.
(6) Potassium metal is added to metal fluorides to produce metallic aluminum, titanium, and iron at 500°C.
(7) Oxygen is added to mixture of potassium metal with calcium fluoride to produce potassium fluoride and calcium oxide at 520°C.
(8) The KF is returned to step 2 to electrolyze potassium fluoride back to fluorine gas and metallic potassium.
The block diagram for the process is shown in Figure 2.5-5. Landis appears to be quite optimistic that this process is feasible. For example he says:
"It has the advantage that the silicon is produced in the form of tetrafluorosilane, which can be easily purified of contaminating traces of the other metals by distillation. In fact, the process can be adapted in a straightforward manner to production of other relatively pure products, including titanium, aluminum, and iron."
"It might be argued that fluorine is extremely reactive, and it will be difficult to find materials in which to do the initial electrolysis. However, electrolysis of molten fluoride salts is a high-throughput industrial process, used in the production of many materials. The most well-known fluoride electrolysis process is the Hall process for production of aluminum, in which molten sodium-aluminum fluoride (cryolite) is electrolyzed at 1000°C."
The implication of these remarks (and others) seems to suggest that these processes can be carried out easily on the Moon. This writer remains very skeptical.
In addition to extraction of Si, Landis also discusses aluminum production for wiring and glass for use as a substrate or superstrate. Whereas he apparently believes that aluminum production is straightforward, he discusses a number of difficulties in producing a suitable transparent glass, but after proposing several approaches for dealing with these problems, concludes that "there seems to be no real barrier to production of glass from lunar materials." As before, this writer remains skeptical.

48
Figure 2.5-5. Block diagram of Landis' process for Si extraction from regolith with oxygen as a byproduct.

49
2.6 Space Solar Power vs. Terrestrial Solar Power Landis [14] claims that analyses of space solar power often assume that ground solar power is a competing technology, and attempt to show that space solar power is a preferable technology on the basis of rate of return on investment. However, Landis asserted that "space solar power and ground solar power are complementary technologies, not competing technologies." He says that "low-cost ground solar power is a necessary precursor to space solar power: space solar power requires low cost, high production and high efficiency solar arrays, and these technologies will make ground solar attractive for many markets. The ground solar power market, in turn, will serve to develop technology and the high-volume production readiness for space solar power. Since ground solar is a necessary precursor to space solar power, an analysis of space solar power should consider how it interfaces with the ground-based solar infrastructure that will be developing on a faster scale than the space infrastructure." He suggests two ways that this interface could be implemented:
"1. Integrate solar and microwave receivers on ground. This will allow the space solar power to use the pre-existing land that has already been amortized by ground solar power receivers, and tie in to power conditioning and distribution networks that are already in place.
2. Use solar power satellites to beam to receivers when ground solar is unavailable. By 'filling in' power when ground solar is unavailable, space solar power will serve as the complement to solar. This requires an analysis of the match between solar availability, power demand, and power availability from space."
Landis' suggestions here are logical; however they presuppose that very large-scale terrestrial solar power will become competitive and widespread. If "low-cost ground solar power is a necessary precursor to space solar power," and if very large-scale terrestrial solar power never becomes competitive, in that case space solar power would face severe obstacles.
Reference [S33] presents arguments why it is unlikely that use of terrestrial solar power will expand to provide a significant portion of our power needs. It has been argued by some that the cost of solar cells will plummet in the future as production rises. There are arguments pro and con on this issue. However, when the costs of encapsulation, support structure, wiring and interconnects, installation, land, cleaning and servicing, etc. are factored in, the total cost of a terrestrial installation is still unlikely to plummet. More importantly, the intermittent nature of terrestrial solar energy and the huge areas needed to generate significant power levels auger against the use of terrestrial solar power except for local niches, special applications and localized peak shaving. However, more optimistic projections also abound, particularly when funded by NREL (e.g. Reference [S34]).
Reference [S21] says: "... SSP cannot compete with solar power based on Earth. The advantage of SSP is a large and constant solar flux. This is about five times higher than the average flux on a sun-tracking surface in sunny areas on the Earth’s surface, such as the American southwest. The larger solar flux in space cannot compensate, however, for the cost of placing systems in space and transmitting the electricity back to Earth."
His argument is based on a simple model of considering only the solar arrays. The cost for a space system is taken as the cost of the arrays plus the launch cost. The cost of a terrestrial system is taken as just the array cost. He assumes that a unit area of array in space generates five times as much power as a similar array area on Earth. Hence he sets the requirement that space solar power be less expensive than terrestrial solar power as:
CPVS + CLM < 5 CPVT
or
CLM < 5 CPVT - CPVS
where CPVT = cost per unit area of terrestrial arrays, CPVS = cost per unit area of space arrays, M = mass per unit area of space arrays, and CL is the cost to transport unit area of space arrays to GEO. He also includes an efficiency factor, but it is difficult to follow

50
his logic on this so it is omitted here. In addition to the fuzziness of argument regarding efficiency, there is a logical error in [S21] because it treats the array costs as per unit power output (rather than per unit area), in which case the factor of five would not be included. The remainder of his logic remains difficult to follow. Suffice it to say that he concludes that "even a very optimistic analysis requires that launch costs fall by a factor of 20 to 50 simply to allow SSP to break even with terrestrial solar power." However, he only included launch costs to LEO. Had he included orbit raising to GEO, that would have introduced a multiplier of about 4, so "20 to 50" would have increased to "80 to 200." If we put aside the details, what he is saying is that even taking into account the lower performance of terrestrial arrays, the launch costs still drive the total cost of a space array well above that of a terrestrial array per unit power generated. Of course, terrestrial solar power is highly variable whereas space solar power can be steady.
2.7 Economics of Space Solar Power
2.7.1 Market Goal for Space Solar Power Many future scenarios can be envisaged for an ultimate space solar power system in the distant future. These could range from an all-out supply of the world's energy needs for all purposes at one end of the scale, to localized peak-shaving augmentations of regional electric power systems in some areas of the United States at the other end of the scale.
Criswell [S7] estimates that "20 TW [20,000 GW of installed capacity] of electric power, or 2 kW per person, will be required for a prosperous world of 10 billion people in 2050."
If almost unlimited electric power became available from space, that might dictate how we choose to utilize energy in society.
The scale of solar power satellites is huge, and it seems intuitive that if society makes the huge investment that is needed to build one SPS, it would be very advantageous economically to establish a very large overall
system. It is difficult to imagine sufficient payoff from investing in a limited system.
2.7.2 Mass of the SPS It is widely agreed that costs for launch and orbit-raising to GEO or the Moon will constitute a major part of the total cost of any SPS. These transportation costs depend directly on the mass that must be transported to space. Hence, the mass of a SPS is a critical factor in estimating the cost, which in turn, affects the conceptual viability of any of these concepts. Several SPS concepts have been put forward, but most of the detailed analysis of SPS was done on early concepts in the late 1970s. Furthermore, it is difficult to project the mass of systems that lie so far in the future. Therefore it is not clear that we have credible rough mass estimates.
Table 2.7-1. 5-GW SPS Reference System mass estimate (millions of kg) [S8]
Subsystem Mass GaAlAs cells
Si cells
Solar Array Primary Structure 4.17 3.39 Secondary Structure 0.58 0.44 Solar Blankets 6.70 22.05 Concentrators 0.96 N/A Power Distribution & Conditioning 1.14 1.13
Information Management & Control 0.05 0.05
Attitude Control & Station keeping 0.20 0.20
Subtotal 13.80 27.26 Antenna Primary Structure 0.25 0.25 Secondary Structure 0.79 0.79 Transmitter Sub-arrays 7.18 7.18 Power Distribution & Conditioning 2.19 2.19
Thermal Control 2.22 2.22 Information Management & Control 0.63 0.63
Attitude Control 0.13 0.13 Subtotal 13.38 13.38
Array/Antenna interfaces Primary Structure 0.09 0.09 Secondary Structure 0.00 0.00 Mechanisms 0.03 0.03 Power Distribution 0.02 0.02
Subtotal 0.14 0.14 Total before contingency 27.33 40.79
Contingency (25%) 6.83 10.20 TOTAL 34.16 50.98

51
In some SPS analysis, rather conventional solar cells were contemplated. In other work, it was assumed that ultra-lightweight thin-film cells will someday be available with reasonable efficiency. In most cases, the details on assumptions regarding solar cells are not discussed. An estimate for the mass of the 1978 DOE Reference System SPS is given in Table 2.7-1. The projected use of GaAlAs cells would halve the mass of the required solar array, using a concentration ratio of 2, as compared to use of silicon cells.
Assuming an overall end-to-end efficiency of about 7% [S6], the 5 GW power system described in Table 2.7-1 is estimated to have a cell area of about:
5 × 10⁹ W/ (0.07 × 1367 W/m2) = 5 × 10⁷ m2
and if the mass of the (silicon) array is 22 × 106 kg, the implied areal density of the cells in Table 2.7-1 is 0.44 kg/m2 and the specific power of the cells is 0.13 × 1367 W/m2/(0.44 kg/m2) = 404 W/kg. That is a very optimistic figure. Currently available solar arrays have specific power of 50-80 W/kg. Clearly, there is an implicit (if unstated) assumption here that thin-film photovoltaics will be available in the future.
The overall specific power ratio:
SPR = (Power to grid)/(Mass of SPS in space)
is estimated to be (5 x 10⁹ W)/(50 x 106 kg) = 100 W/kg.
Reference [S6A] summarizes a Japanese model that estimates a total mass of the 1.3 GW space power satellite to be 9,700 tonnes with the solar panel estimated at 1,200 tonnes. The power received by the solar panel is claimed to be 10.7 GW, and the power generated is 1.8 GW, implying a cell efficiency of about 17% and an overall end-to-end system efficiency of 12%. The solar array in this model has an area of (10.7 x 10⁹/1367) = 7.8 x 10⁶ m2. If its mass is 1,200 tonnes, the areal density is 0.15 kg/m2 and the specific power is (0.17 x 1367/0.15) = 1550 W/kg which is more than optimistic; it is rather incredible.
The overall SPR is estimated to be (1.3 x 10⁹ W)/(9.7 x 106 kg) = 130 W/kg.
Reference [S10] estimated the mass of a laser-based SPS delivering 0.5 GW to the grid as
shown in Table 2.7-2.
Table 2.7-2. 500 GW laser power system mass estimate. [S10]
Element Effic. (%)
Power in (GW)
Power out
(GW)
Mass (tonnes)
Solar reflector 85 7.9 6.7 243 Solar cavity 86 6.7 5.8 518 Heat engine 74 5.8 4.3 1330 Power generation 93 4.3 4.0 718 Laser 23 4.0 0.91 1810 Spacecraft 129 Transmitter 98 Overall SPS unit 11.5 7.9 0.90 4850 Space transmission 95 0.90 0.85 -- Space relay 99 0.85 0.85 105 Atmos. transmiss. 85 0.85 0.72 -- Ground receiver 96 0.72 0.69 -- Heat engine 76 0.69 0.51 -- Power gen. 98 0.51 0.50 --
The SPR for this system is estimated to be (0.5 x 10⁹ W)/(4.9 x 106 kg) = 100 W/kg.
Thus, the estimates made by several groups seem to lie in the general range of SPR ~ 100 W/kg, which implies for example, that for a 2 GW SPS, the mass on orbit is roughly 20,000 tonnes.
As a calibration point, Robert Zubrin [G5] estimates that the present cost to launch and transfer 1 tonne of payload to GEO is about $40M. For a single SPS of mass in the range 10,000 to 50,000 tonnes, the cost to deliver a single SPS to GEO would be ~ $400B to $2,000B with today's technology.
2.7.3 Energy Payback of the SPS One "sanity check" on any system that provides energy is a comparison of the energy ultimately received from the system with the energy required to produce and operate the system. The net energy ratio (NER) is the net output of an energy production system over its lifetime divided by the energy required to implement the process (from scratch). There are some complicating issues that arise in such calculations because various forms of energy have different qualities; in particular electric energy vs. heat. There are also issues of timing; is energy 20 years from now worth more or less than energy today?
Typically, several groups have estimated the "energy payback" time – the number of years

52
that it takes to recoup the energy invested in building and installing the system.
Reference [S16] provides a detailed discussion of methods for comparing the amount of energy used to create an SPS vs. the energy received from the SPS. Although the report was written in 1978, and therefore is somewhat out of date, it includes many valuable insights. Reference [S16] claimed that the energy "cost" of a 5 GW SPS was 440 x 1012 BTU = 1.28 x 10¹¹ kWh, leading to a 3-year "payback" of energy invested. However, this study has a line item: "aircraft" but no line items for launch vehicles, orbit raising, or launch facilities, raising questions about the validity of the estimate. In a later study, concerning 10 GW satellites constructed at the rate of about 2-4 per year for a total of 112 satellites, the NER was estimated to be somewhere between 0.5 and 4 if electrical energy and heat are treated as interchangeable, and somewhere between 2 and 12 if electrical energy is multiplied by three to put it on a par with heat energy [S16]. The wide range of estimates is due to the uncertainty in several important aspects of the SPS at an early stage of conception. At an NER less than 1, the payback period is infinite. At NER ~ 12, the payback period is about 2.5 years assuming a lifetime of 30 years.
A 1978 JPL study assumed that all electricity used in the development of the SPS should be multiplied by a factor of four to arrive at the thermal energy content of fossil fuels consumed. A similar reverse adjustment is made in comparing the electrical output to the thermal input. Thus, their NER was calculated entirely on an equivalent thermal-in/thermal-out basis. They concluded that the energy payback period of an SPS is in the range 1-2 years.
Reference [S16] appears to conclude that considerably more work is needed to refine methodologies for estimating NER for SPS. They point out that there are timing consequences of the SPS program where even though each individual plant may have a high positive energy ratio, high initial energy requirements create a protracted energy drain during the initial years of development, installation and operation. Equally important
are the uncertainties in energy-intensity estimates and SPS requirements.
Reference [S20] provides a more recent view of energy payback. They claim that the energy payback time of terrestrial and space-based solar power systems are far below their operational lifetimes. Space-based solar power system energy payback times were estimated to be of the order of ~1 year. However their definition of payback time was not clear. It seems likely that they mean a dollar payback, rather than an energy payback because they also discuss "net energy balance" separately. Unfortunately, this encouraging conclusion appears to derive from various very optimistic assumptions. The space transportation system is admitted to "dominate the overall energy balance of space based solar power systems." However, they assumed a hypothetical launch vehicle that can deliver 350 tonnes to GEO using 14 tonnes of propellant per tonne of payload. By contrast, The launch vehicle assumed in the NASA "Fresh Look Study" had 11.3 tonnes of payload capacity to GEO with 71 tonnes of propellants per ton of payload. [S20] For calibration, note that the heavy lift launch vehicle (HLLV) planned by NASA for lunar and Mars missions delivers ~ 125 tonnes to LEO with more than 20 tonnes of propellant and launch vehicle per tonne of payload to LEO. As shown in Sec. 2.3.1, the propellant requirement to lift 1 tonne from LEO to GEO is about 1.4 tonne, and the sum of the masses of the propulsion system and propellants is about 1.5 tonne (using LOX/LH2 propulsion for orbit raising). Therefore, using NASA HLLV technology, only 40% of the mass lifted to LEO is actually payload that can reach GEO. Hence, it requires more than 20 x 2.5 = 50 tonnes on the launch pad to deliver 1 tonne from Earth to GEO. The assumption that this can be done with only 14 tonnes of propellant appears to be too low by a factor of ~ 4. In addition, the launch vehicle that delivers 350 tonnes to GEO would be capable of delivering 875 tonnes to LEO; it would be 7 times as big as the NASA HLLV currently under development for human missions to Mars and the Moon, which is already a huge launch vehicle. Such a launch vehicle is difficult to imagine.

53
Reference [S15] estimated that the energy payback period for terrestrial solar thermal power plants is less than 2 years including hydrogen storage. They claim that the energy for terrestrial solar power systems is dominated by the storage systems (hydrogen as well as pumped hydro storage). However, they admit that "storage requirements are implied by an 'artificial' scenario design which is far off reality. Storage requirements of this size are only likely in off-grid or so-called 'island' applications."
Reference [S6A] estimated the energy payback to be 0.89 year as shown in Table 2.7-3. However, as the saying goes, "the devil is in the details" and the details are difficult to unravel.
Table 2.7-3. Estimate of energy payback by [S6A]. All energies are in kWh.
Energy invested to manufacture the space segment
1,622
Energy invested to lift it into space
2,151
Energy invested to manufacture the ground segment
548
Energy to keep the space segment operating per year
113
Energy to keep the ground segment operating per year
5
Total invested energy 7,762 Total Energy Investment Return on Investment
262,800
Energy Investment Return on Investment
33.86
Energy Payback Time (years) 0.89
Clearly, the issue of energy payback requires further study.
2.7.4 Land Use Land use is discussed at length in Reference [S16]. As an illustration, this reference uses an SPS rectenna sized to generate 5 GW of electricity at the buss-bar at about 34°N latitude (corresponding to Los Angeles). It would occupy an elliptical land area extending approximately 13 kilometers north-to-south and 9 kilometers east-to-west. The width of the rectenna area is essentially fixed, but the length, the north-south dimension will vary with latitude. Because the satellite will be in orbit directly above the equator, the circular microwave beam will project an ellipse on the
Earth's surface anywhere except at the equator, directly under it. The further away from the equator, i.e., further north within the U.S., the more elongated the ellipse becomes.
The land area occupied by the rectenna ellipse itself is approximately 92 km2. A full rectangle of 13 by 9 kilometers will probably be required, at a minimum, to accommodate support facilities. The minimum land area with no buffer zone would therefore be about 120 km2.
Because of the intensity of microwave radiation at the edge of the rectenna, it is critical that there be a secure fenced buffer zone beyond the edge of the rectenna. The nominal dimension of a rectenna site including a buffer zone was estimated to be 17 x 13 kilometers. The land area occupied by the entire installation would be about 200 km2. However, the report emphasizes that the required size of the buffer zone depends on the allowable unrestricted exposure level to microwaves. The above estimate was made on the basis that this limit is 10 mW/cm2, whereas if it were set as low as 0.01 mW/cm2, the buffer zone would extend more than 15 km from the edge of the main ellipse, with a total site area of ~ 1,700 km2.
Reference [S16] hypothesizes an ensemble of 60 of these installations across the United States providing a total of 300 GW of electric power capability. However, as of the end of 2004, the U. S. electric power generation amounted to 3,953,407 GW-hrs for an average rate of usage of ~ 450 GW, although peak usage was higher. Installed electric generation capacity was 1,050 GW. By about 2050, it is logical to suppose that U. S. average and peak electric power usage may easily more than double. Hence the 300 GW system analyzed in [S16] appears to provide only about ¼ of future U. S. power needs. Based on 300 GW, the required total area for 60 5-GW installations is something like 60 x 1,700 ~ 105 km2 (an area 300 km x 300 km).16 If a capacity four times that is required, the area would rise to ~ 4 x 10⁵ km2 (an area 450 km x 450 km).
16 However [S10] and [S12] estimate an area of about 1/10 this estimate due to use of smaller buffer zones.

54
Stated in the simplest possible terms, the objective of any land use/siting study is to answer the question, "Where can we put rectenna sites?" or its corollary: "Are there 60 sites in the continental U.S. where rectennas can be located?" Several studies were carried out in the 1970s regarding these questions. Reference [S16] says "Preliminary analysis suggested ... that rectenna distribution on land could not correspond to electrical energy usage distribution without major disruptive impacts. Electrical consumption is concentrated east of the Mississippi while most land is west of the Mississippi." However, the demographics have changed since the 1970s. There has been a shift of population to the "sun belts" and California in particular, and these regions require large amounts of electricity, particularly for air conditioning. Meanwhile, our government has permitted and facilitated the transfer of most of U. S. manufacturing capabilities in the northeast to foreign countries, thus reducing the requirements for power in that region. Not all land areas are appropriate for siting rectennas because of topography, terrain, intense weather, drainage, flooding, location relative to population centers, seismic activity, communications interference, airline corridors, recreational needs, national forests and parks, bird flyways, etc.
The terrestrial land area required for a SPS system to provide terrestrial power can be compared with (i) the land area required for a terrestrial solar power system to provide the same number of kWh, or (ii) the land area for all the systems that provide our present electrical power system including coal mines, railroads, power stations, waste dumps, etc.
Reference [S2] claims that land use for the SPS would be "1/10 to 1/100 that of terrestrial stations converting solar flux with comparable capacity." Reference [S15] says the SPS would require "considerably less land area than terrestrially-based solar power systems." Reference [S2] claims that "Criswell proposes the clever solution of placing rectennas over existing energy infrastructure land-mass such as strip mines," although this does not appear to be in Criswell's paper [S7]. Reference [S7] says that "offshore rectennas are an option, however they will have a “very high capital
cost and a significant impact on shipping lanes.” A Japanese proposal for a planned city under a suspended rectenna, may be difficult to assuage fears of radiation enough for such a plan to viable.
2.7.5 Cost Estimates Introduction
It is well known that it is difficult to estimate the cost of a small space mission (say, $1B or less). As the years go by, NASA has found that all cost estimates are typically low, and all projects overrun. To compensate, NASA requires that after preparing detailed cost estimates, mission proposals must tack on additional cost reserves to account for unforeseen factors that will inevitably drive up the mission cost. These cost reserves have been creeping up with time. A recent JPL proposal effort required a 43% cost reserve on top of prepared estimates. Such small space missions typically utilize mainly proven technology. We can then imagine how difficult it must be to estimate the cost of a futuristic enterprise, 100,000 times (or more) greater in scope (and 1,000 times (or more) the cost) than a small space mission, that utilizes many new, unprecedented technologies and systems.
Two critical aspects of the SPS cost are (1) future launch and orbit-raising costs per tonne, and (2) mass of future solar arrays per kW generated in GEO. If one utilizes current data for these factors, the cost of an SPS is huge. Therefore, a number of investigators have made various optimistic assumptions regarding future reductions in these quantities – and even then, the projected cost of an SPS is very high, although some have argued that under those assumed conditions it can become cost-effective.
GEO Cost Estimate Using Current Capabilities
Robert Zubrin has argued against the cost effectiveness of the SPS using current technology capabilities [G5]. Based on a ~ 50% transmission coefficient from solar power in space to power at the buss bar we can estimate that the power generated by the solar array for a 2 GW SPS must be ~ 4 GW. Current solar array technology can produce about 50 W/kg; therefore the mass of the solar
55
array is estimated to be ~ 8 x 10⁴ tonnes. If the remainder of the system is neglected, and only the solar array is included, the cost of delivering the solar array to GEO becomes the determining factor in the SPS cost. Zubrin estimated the current cost to deliver a tonne of payload to GEO at $40M. Thus the cost to deliver the entire array to GEO is 8 x 10⁴ tonnes x $40 x 106/tonne = $3.2 x 10¹² (3.2 trillion dollars).17 Zubrin suggested that the total cost of the entire SPS system (when all the other subsystems are included) might be about double this value or roughly 6 trillion dollars. He then went on to show that the cost of the SPS is several thousand times the cost of conventional power plants, and the annual interest alone on a ~ 3 trillion dollar investment would be totally unaffordable. The fact that terrestrial power plants require fuel would not affect the argument substantially. The bottom-line cost of electric power to the consumer would be over a thousand times the cost from conventional sources.
Future Transport and Solar Array Costs
It has been shown that the two critical issues regarding the high cost of the GEO SPS are (1) future launch and orbit-raising costs per tonne, and (2) mass of future solar arrays per kW generated in GEO. Advocates of the SPS concept have projected significant reductions in both quantities in the future. For example, Reference [S6] says: "The published SPS cost estimates are based on a launch cost of $150/kg.... These estimates remain controversial. For example, present-day launch and space assembly costs are greater than two orders of magnitude higher than the desired $150/kg. While NASA expects the launch costs to decrease by a factor of 100 by 2025 and by a factor of 1000 by 2040, ESA is less optimistic.18 In a corresponding ESA report ... [they assumed] transportation costs of $1500/kg.... In the same report it was stated
17 These figures are slightly different than Zubrin's. 18 The reference that predicts huge reductions in future launch costs is: H. Cikanek, "Innovative Aerospace Propulsion Systems and Technologies," NASA Glenn Research Center, 2-4 April 2000, Report No. 216-433-6196:
http://www.aerospace. nasa.gov/events/home&home/glenn/invasp/sld003.htm
that transportation costs may be reduced to $200/kg in the future."
Fetter [S21] says: "Launch costs therefore must be less than $200 to $460 per kg. For comparison, the current cost to low-Earth orbit is about $10,000 per kg. Thus, even the most optimistic analysis requires that launch costs fall by a factor of 20 to 50 simply to allow SSP to break even with terrestrial solar power." Criswell [S7] suggests that launch costs would have to be reduced by "a factor of 10,000" to make SPS competitive.19 Reference [S4] says: "It appears to the [NRC] committee that many of these goals for launch costs and for system mass and cost must be significantly lower than those currently being used by the NASA team if the system is to produce competitive terrestrial power." Reference [S6A] says: "Launch costs are the single most important parameter in assessing the economic viability of solar power satellites."
The NASA treatment of launch costs has been primarily optimistic. Reference [S15] says: "No concept-unique Earth-to-orbit transportation system is required, beyond that necessary to achieve extremely low launch costs (on the order of $200 to $400 per kg), with payloads of greater than 10 tonnes; this is consistent with Highly Reusable Space Transportation." The tone here seems to imply that this is within reasonable expectation.20
Non-NASA papers are also typically optimistic. Reference [S19] says "Orbit-capable scramjet/ rocket hybrids appear feasible at launch costs of $200 to $400/kg." Reference [20] treated the launch cost as a parameter. However, they say that "today’s launch costs are assumed with 10,000 EUR/kg payload at current transport mass capacities of 100 tonnes per year. This represents the lower end of the current range of space transportation costs of 10 - 20,000 EUR/kg payload. The learning curves based on the assumed learning effect of cost reduction for payload transportation of 20% with each doubling of mass capacity. This learning curve
19 That estimate appears to be excessive. 20 The attitude prevailing in these studies seems to be: "its just a simple matter of reducing launch costs by a factor of 50. No problem."

56
was agreed by the various parties involved and is not based on historical experience. An analysis on the viability of the assumed learning parameter values was not in the scope of the study, yet is critical to the overall viability of SPS scenarios discussed therein." In their analyses they consider launch costs as low as 323 EUR/kg.21
Reference [S19] says that all non-fossil energy options appear to be more expensive than they will eventually prove to be. It suggests that Moore’s-Law-like22 reductions occur in many technology classes from learning-by-doing and research, and that innovation can change the game entirely. "There’s a real danger that overly conservative approaches based on extrapolated economics, as opposed to inventions and system based on physics, will miss potential solutions. A potentially fatal failure for any high-tech civilization faced with existential threats is 'failure of imagination.' Good reasons to revisit solar PV from a fresh perspective." Reference [19] also presents a figure prepared by Ivan Bekey23 showing launch costs dropping from $20,000/kg to $2/kg from 2010 to 2030 based on Moore's law and learning curves.
The point of controversy here is that the optimists would argue that as the business of frequent heavy-lift launching expands, there will be a "learning curve" and through mass production, unit costs will diminish with time. Some of this is undoubtedly true. However, it must be remembered that much of the cost savings in microelectronics resulted from placing more features per unit area on a chip, 21 The idea behind a "learning curve" is that as production of some product increases, ways and methods are inevitably found to reduce the unit cost. It is conventional to believe that with each doubling of production, the unit cost will drop by some percentage – in this case chosen as 20%. For example, if the production rate increased by a factor of 1024, this would imply a cost decrease to (0.8)10 = 0.107. 22 Moore's law is a prognostication made in 1965 by Gordon Moore, co-founder of Intel, that the number of transistors per square inch on integrated circuits will double every year after the integrated circuit was invented. It has been extended to imply that "learning curves" will drive down costs of almost anything as production increases. 23 A well-known optimist amongst optimists.
rather than by reducing the innate cost of producing a chip. No such parallel exists for launching and orbit raising. While indeed it is likely to be overly pessimistic to use current launch costs in projections for a mega-program like the SPS some half a century hence, estimates of a few hundred dollars per kg to LEO range seem to be unlikely. Bekey's estimate of $2 per kg to LEO seems to be ridiculous.
Cost reduction to make the SPS Competitive
The simple estimate of solar array mass and cost to deliver unit mass to GEO (based on current technology) that was given previously suggests that the product of these two factors must be reduced by a factor of over 1000 to bring down the cost of the SPS so that it can provide electric power at rates competitive with conventional schemes. Zubrin [G5] supports this viewpoint. However, a number of analyses have been carried out by various investigators that claim that the required reduction in launch cost is less than this. A complete economic analysis of a hypothetical SPS, and its comparison with conventional power plants, is a complex topic requiring a great deal of effort. Typically, the bottom line figure is the cost per kWh of electric power which presently is of the order of ~ $0.05 per kWh.
Reference [S6] quotes several ESA studies. One ESA study claims that the power generation cost would be $0.20/kWh if the "transportation cost"24 was reduced to $1500/kg and the specific power of the array was 200 W/kg. This would suggest that a factor of 4 reduction in array mass, and a factor of 7 reduction in launch cost would bring SPS electric power costs down to about 4 times that of conventional power – thus implying that an overall reduction of a factor of 4 x 7 x 4 = 56 would make the SPS competitive. Based on Zubrin's arguments, this appears to be optimistic.
Reference [S21] compares the SPS to terrestrial solar power. That is not necessarily a concern here, since the issue is to compare the SPS with conventional electric power, but
24 It is not specified whether this is to LEO or to GEO.
57
some insights are provided by the analysis. The following is modified from [S21]. It is argued that it is "widely agreed" that terrestrial solar power will only be competitive with conventional power if the installed cost per kW is less than about $1,000. Hence the cost of delivering an element of an SPS that produces 1 kW at the Earth buss bar must be less than $1000 in order to be competitive. The current state of the art for solar arrays is about 50 W/kg, but [S21] is willing to assume this can be increased to 200 W/kg. With an overall transmission coefficient of 50%, the mass of solar array needed to generate 1 kW at the Earth buss bar is 5 kg. The cost of transporting this 5 kg from the Earth to GEO must be less than ~ $1,000 to match the $1,000 cost per kW of a terrestrial system. Of course, when the remainder of the system (other than the solar array) is taken into account, this would likely drop to $500. Thus, the transportation cost from Earth to GEO would have to drop from $40,000 to 100 to 200 $/kg25 to make the SPS competitive according to this method.26 Based on fuel costs, [S21] concludes that the minimum conceivable cost for delivery to 1000 km orbit is ~$250/kg, while [G5] concludes that the minimal conceivable cost to deliver payload to GEO is of the order of 300 to 400 $/kg. But these estimates are rather far-fetched.
There is no greater critic of one futuristic energy technology than an advocate of another futuristic technology. Thus, [S7] says: "To achieve this margin, launch and fabrication costs would have to be lowered by a factor of 10,000."
Cost Estimates for SPS
In the opinion of this writer, we have no credible cost estimates for an SPS, and furthermore, it may be close to impossible to estimate the cost of such a system at this early date.
According to [S10]: "Current overall cost estimates for the SPS and its major components are highly uncertain. The 25 Compared to current costs of about $40,000/kg to GEO. 26 Reference [21] estimated the range to be 200 to 460 $/kg.
assessments of up-front costs range from $40 billion to $100 billion. The most detailed estimates have been made by NASA based on the reference design. These call for a 22-year investment of $102.4 billion (1977 dollars) (including transportation and factory investment costs) to produce the first 5-GW satellite, with each additional satellite costing $11.3 billion."
On general principles, it is expected that such estimates will be low, more likely, very low. Reference [S10] goes on to say: "Opponents argue that the present cost estimates are unrealistically low. They expect that like other aerospace projects and the Alaskan pipeline, the cost of SPS would significantly increase as SPS is developed. Furthermore, the U.S. taxpayers would be required to support this increase and to maintain an ongoing commitment to SPS above and beyond the RD&D costs, just as they have for the nuclear industry. The National Taxpayers Union, in particular, sees SPS as a giant boondoggle that will allow the aerospace industry to feed its voracious appetite from the federal trough.... Most opponents also do not believe that SPS will be cost competitive and argue that the amount of energy produced by SPS would not justify its large investment cost."
Landis [S14] "reinvented" the SPS as a system at Lagrange point L2 because of technical and economic difficulties with the GEO SPS concepts. He argued that "even with extremely optimistic assumptions of system cost, solar cell efficiency, and launch cost, each design [of the 'Fresh Look' study] ... results in a cost which is either immediately too expensive, or else yields a cost marginally competitive (but not significantly better) than terrestrial power technologies, with an internal rate of return too low for investment to make money. Only if an 'externality surcharge' is added to non-space power sources to account for the economic impact of fossil-fuels did space solar power options make economic sense. While 'externality' factors are quite real, and represent a true cost impact of fossil-fuel generation, it is unlikely that the world community will artificially impose such charges merely to make space solar power economically feasible."
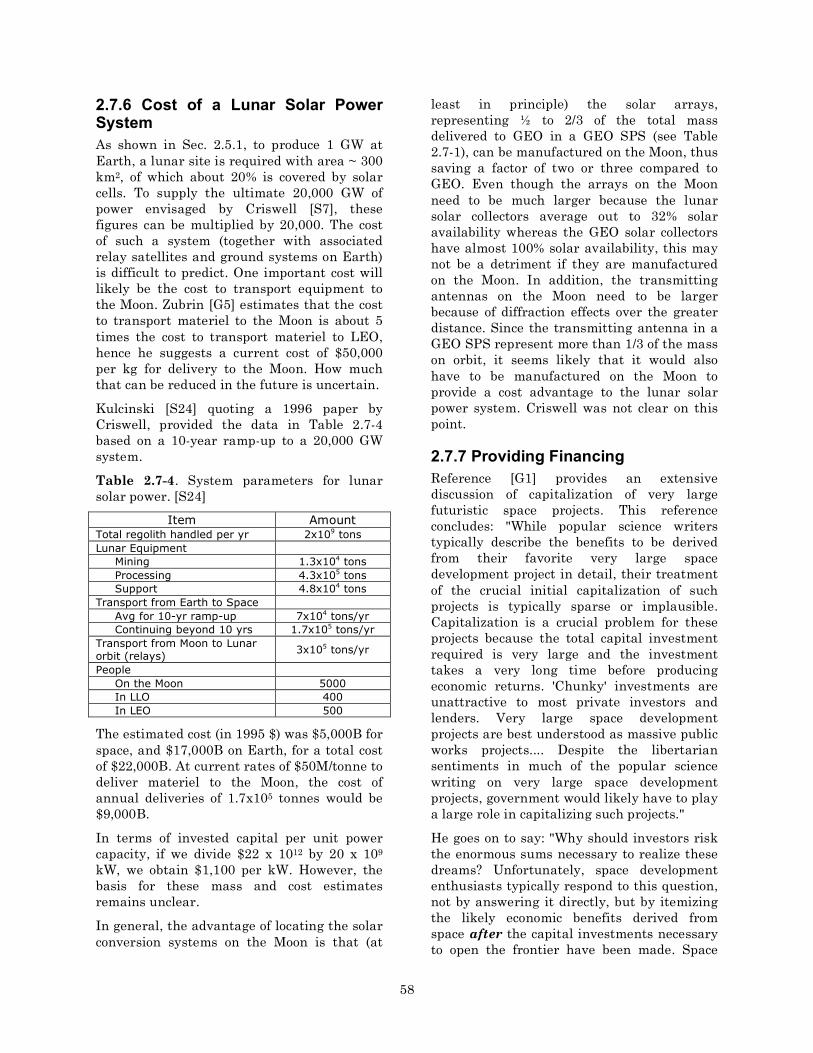
58
2.7.6 Cost of a Lunar Solar Power System As shown in Sec. 2.5.1, to produce 1 GW at Earth, a lunar site is required with area ~ 300 km2, of which about 20% is covered by solar cells. To supply the ultimate 20,000 GW of power envisaged by Criswell [S7], these figures can be multiplied by 20,000. The cost of such a system (together with associated relay satellites and ground systems on Earth) is difficult to predict. One important cost will likely be the cost to transport equipment to the Moon. Zubrin [G5] estimates that the cost to transport materiel to the Moon is about 5 times the cost to transport materiel to LEO, hence he suggests a current cost of $50,000 per kg for delivery to the Moon. How much that can be reduced in the future is uncertain.
Kulcinski [S24] quoting a 1996 paper by Criswell, provided the data in Table 2.7-4 based on a 10-year ramp-up to a 20,000 GW system.
Table 2.7-4. System parameters for lunar solar power. [S24]
Item Amount Total regolith handled per yr 2x10⁹ tons Lunar Equipment
Mining 1.3x10⁴ tons Processing 4.3x10⁵ tons Support 4.8x10⁴ tons
Transport from Earth to Space Avg for 10-yr ramp-up 7x10⁴ tons/yr Continuing beyond 10 yrs 1.7x10⁵ tons/yr
Transport from Moon to Lunar orbit (relays)
3x10⁵ tons/yr
People On the Moon 5000 In LLO 400 In LEO 500
The estimated cost (in 1995 $) was $5,000B for space, and $17,000B on Earth, for a total cost of $22,000B. At current rates of $50M/tonne to deliver materiel to the Moon, the cost of annual deliveries of 1.7x10⁵ tonnes would be $9,000B.
In terms of invested capital per unit power capacity, if we divide $22 x 1012 by 20 x 109 kW, we obtain $1,100 per kW. However, the basis for these mass and cost estimates remains unclear.
In general, the advantage of locating the solar conversion systems on the Moon is that (at
least in principle) the solar arrays, representing ½ to 2/3 of the total mass delivered to GEO in a GEO SPS (see Table 2.7-1), can be manufactured on the Moon, thus saving a factor of two or three compared to GEO. Even though the arrays on the Moon need to be much larger because the lunar solar collectors average out to 32% solar availability whereas the GEO solar collectors have almost 100% solar availability, this may not be a detriment if they are manufactured on the Moon. In addition, the transmitting antennas on the Moon need to be larger because of diffraction effects over the greater distance. Since the transmitting antenna in a GEO SPS represent more than 1/3 of the mass on orbit, it seems likely that it would also have to be manufactured on the Moon to provide a cost advantage to the lunar solar power system. Criswell was not clear on this point.
2.7.7 Providing Financing Reference [G1] provides an extensive discussion of capitalization of very large futuristic space projects. This reference concludes: "While popular science writers typically describe the benefits to be derived from their favorite very large space development project in detail, their treatment of the crucial initial capitalization of such projects is typically sparse or implausible. Capitalization is a crucial problem for these projects because the total capital investment required is very large and the investment takes a very long time before producing economic returns. 'Chunky' investments are unattractive to most private investors and lenders. Very large space development projects are best understood as massive public works projects.... Despite the libertarian sentiments in much of the popular science writing on very large space development projects, government would likely have to play a large role in capitalizing such projects."
He goes on to say: "Why should investors risk the enormous sums necessary to realize these dreams? Unfortunately, space development enthusiasts typically respond to this question, not by answering it directly, but by itemizing the likely economic benefits derived from space after the capital investments necessary to open the frontier have been made. Space
59
development enthusiasts are also given to lamenting that annual public and private spending on space development compares unfavorably with annual consumer spending on beer and pizza, and to discounting the present value of public and private spending on space against what humanity will gain over the long term from that spending. Granting the truth of all of these arguments, the fact remains that the technology and personnel for very large space projects are less in doubt than is the necessary capital investment.27 Capital is the essential missing ingredient. The voluntarism evident in so much of the popular science writing about space development is a liability when it prevents recognition of this crucial problem."
Reference [G1] concludes that "very large space development projects are probably too unattractive as investments for private investors and lenders."...
An OTA report [S10] discussed difficulties with private involvement. The following is excerpted from this report. An initial investment of $40 billion to $100 billion over 22 years – with additional much larger investments to build a complete system – would be unprecedented for private-sector financing of a single project. Especially in the first years, borrowed funds would be available, if at all, only at prohibitively high interest rates. Stocks and bonds would be unlikely to attract large investors when profitability lies some 30 years in the future. Both institutional investors and large corporations allocate only a small proportion of their funds for high-risk long-term projects; in some cases, such as pension funds, there are legal limitations on high-risk investments. An SPS system will require a great deal of political support both locally, nationally, and internationally: land-use conflicts, monopoly considerations, environmental standards, tax incentives, and radio frequency allocations are a few of the political issues that SPS will need to confront. The OTA report [S10] also discusses difficulties with federal involvement in such a large long-term project, suggesting that financial and management problems are likely 27 However, for the SPS and 3He, this may not be the case.
to ensue. These include: (1) lacking a profit motive and the discipline of responsibility to owners and stockholders, there is less incentive to reduce costs, (2) civil service regulations can interfere with hiring and firing and limit salary ranges, decreasing flexibility and making it difficult to retain personnel, (3) annual government funding produces uncertainties and leaves programs vulnerable to political pressures and pork-barrel compromises, as well as several other factors listed in [S10].
2.8 Political Issues and Space Law This section is mainly excerpted from Reference [G6]. Some of the fundamental questions are:
• Who owns space?
• Who regulates what is placed in GEO?
• Who owns the Moon?
Space Solar Power (SSP) will be a world project having vast international and national legal ramifications. Success of a SSP program will depend on the skill with which a legal framework is established for SSP construction and operation. Thus it is necessary to examine the SSP in light of current international political and legal matters, including specifically international space law and national space legislation. However, such a study is rendered somewhat futile because (1) SSP will absolutely require new laws and treaties and (2) dealing only with space law is inadequate since SSP will deeply engage all aspects of the great seamless web of human law.
In 1959, by resolution 1472 (XIV), the United Nations General Assembly established as a permanent body the Committee on the Peaceful Uses of Outer Space (COPUOS), which today has 64 member states. COUPUOS launched the five major international law instruments -- the Outer Space Treaty, Rescue Agreement, Liability Convention, Registration Convention, and the ill-fated Moon Treaty -- that govern space activities. In addition to COPUOS, important decisions on frequency allocations and orbital positioning are made by the International Tele-communications Union (ITU), a

60
specialized U. N. agency. Furthermore, a private international institution with a scientific focus is the Committee on Space Research (COSPAR) of the International Council of Scientific Unions (ICSU).
The United Nations has been instrumental in the preparation of three international agreements that bear directly on the uses of space or the Moon by SSP. These are:
• Treaty on the Principles Governing the Activities of States in the Exploration and Use of Outer Space, including the Moon and Other Celestial Bodies, entered into force October, 1967 (the "Outer Space Treaty") establishes a framework for international space law; provides that space shall not be subject to national appropriation and that exploration and use of space shall be for the benefit of all countries ("province of all mankind"); limits military use of space and provides that space shall be used for peaceful purposes. (Ratified by U.S.)
• Convention on International Liability for Damage Caused by Space Objects, 1971 (the "Liability Convention"), provides that the launching State is liable for damage caused by its space objects on the Earth's surface or to aircraft in flight and also to space objects of another State or persons or property onboard such objects. (Ratified by U.S.)
• Agreement Governing the Activities of States on the Moon and Other Celestial Bodies, 1979 (the "Moon Agreement") elaborates on the Outer Space Treaty; provides that the Moon and its natural resources are "the common heritage of mankind" and that an international regime should be established to govern the exploitation of such resources when such exploitation is about to become feasible. (Not signed or ratified by U. S.)
The United States is a party to the 1967 and 1972 agreements, which have entered into force. As a chief proponent of these two major international legal instruments, the United States has sought to assure the full and free use of the space environment for all peaceful purposes. Thus, the space environment is open for the use of all who are able to use it. It
cannot become an area subject to the sovereignty of a nation state.
The Liability Convention is intended to prevent against misuse of the space environment. It provides that monetary damages will compensate for misuse.
Neither the United States nor any space-faring nation has become a party to the Moon Treaty. Most space legal experts believe it should be either amended or abolished. The Moon Treaty applies to "other celestial bodies within the solar system."
Since all space-faring states have freely used solar energy in space by equipping solar panels onto satellites or on the ISS without any objection from other states, the utilization of space solar energy is internationally and customarily legal, even under the Moon Treaty.
The outstanding international legal issues that might affect SPS development include: (1) jurisdiction over the placement of satellites in GEO, (2) provisions against environmental disturbances, (3) military uses of space, as well as other aspects. In recent years a number of states located on the Equator have claimed jurisdiction over the geosynchronous orbit on the grounds that it is not part of “outer space” but is determined by the Earth’s gravitation, and is a limited natural resource requiring national control. In December 1976 eight equatorial countries issued the Bogota Declaration asserting their position and laying claim to the orbital segments lying over their respective territories. The equatorial states’ claims have been rejected by the majority of other nations including the Soviet Union, the United States, as legally and scientifically untenable. Control over the orbit by a few states would prevent free and equitable access to a crucial position by space-capable countries. Nevertheless, there still remain problems of allocating positions and of deciding competing claims to scarce orbital slots. The question here is part technical and part legal: How much space is there, and what constitutes infringement? This is dependent on the state of technology, since “infringement” is not so much a problem of two or more objects trying to occupy the same place as of electromagnetic interference
61
between nearby satellites. SPS satellites would not only be very large but would, especially if using microwaves, radiate a great deal of energy at radio frequencies. Each SPS would have to be allocated a position and frequency to minimize interference with a rapidly growing number of satellites. Many spectrum users have worried that SPS operation would disrupt communications and sensing tasks, others that the initial SPS installations would use up the available electromagnetic space, preventing exploitation by late-comers. Since the acceptable limits vary with the size and type of SPS used, the size and type of future communications satellites, and advances in transmission technology, it is impossible to say at this time how many SPS could be built without unacceptable interference. Allocation of frequencies and positions has to date been the province of the ITU, whose 1973 convention states that stations "must be established and operated in such manner as not to cause harmful interference of other members, or of recognized private operating agencies, or other duly authorized operating agencies which carry on radio services, and which operate in accordance with the provisions of the Radio Regulations." Whether the ITU would have jurisdiction over non-communications satellites such as SPS is unclear.
The International Telecommunications Union (ITU) makes allocations of radio frequencies in the context of the geostationary orbital position. It remains to be seen whether the U. N., the ITU, or a new international entity will be given the principal responsibility for protecting national and international interests on the efficient, economic, and equitable use of SSP.
In November 1979, at the ITU’s World Administrative Radio Conference, the United States raised the question of allocating a frequency position for future SPS testing; the proposal was referred to a specialized study group for evaluation and future decision. Allocation decisions by the ITU have been characterized by debate over the first-come first-served tradition, whereby first users have priority in the use of frequencies and orbital slots. Newly space-capable states as
well as least developed countries (LDCs) and others who intend to develop such capabilities in the future have urged, since 1971, that all states have “equal rights” to frequencies and positions, and the ITU has called both the radio spectrum and the geostationary orbit “limited natural resources” that “should be most effectively and economically used.” A number of LDCs have proposed that space be reserved for their future use. Since there is no legal basis for permanent utilization or ownership of positions, the possibility of future reallocation clearly has considerable support among have-not states. Established users such as the United States remain opposed to a priori assignment of slots and frequencies. Again, the ITU debate is part of LDC attempts to gain leverage. SPS development could be affected by attempts of disaffected states to block development by denying frequency allocations, or by making consent contingent on concessions by states with the most interest in SPS.
International law has not established international microwave exposure standards. Nonetheless, the Liability Convention has established international tort law rules. If microwave transmissions of energy from geostationary levels were to cause harm to plants, animals, and tangible items, the Convention would cover the subject.
It is difficult to summarize the legal and political aspects of beamed solar power. Clearly, there are serious issues involved in allocating space in GEO or on the Moon to specific projects and countries, but perhaps more vexing problems would be caused by filling up the air above us with microwave or laser beams through which birds and airplanes would have to fly. The ramifications if there is a system failure, or an act of terrorism are difficult to imagine. It is perhaps not an exaggeration to suppose that the political and legal aspects may be as challenging as technical and economic aspects.

62
2.9 Important Issues and Challenges A multitude of issues hang over the SPS concept.
2.9.1 Introduction If Criswell [S7] is right that "a prosperous world of 10 billion people in 2050" would require 20,000 GW of electric power, this could be satisfied by about 6,000 solar power satellites of capacity 3 to 4 GW, each occupying an area in GEO of ~ 40 km2. This would involve one satellite of width ~ 6-7 km for every 0.06° of arc around the GEO so that the distance between adjacent SPS would be a mere 18 km. The GEO would be literally chock full of SPS. Light from a large number of SPS satellites would brighten the night sky due to atmospheric scattering, and would be harmful to astronomers.
Aside from the technical and economic challenges, which would be enormous, the political and legal challenges would also be very great.
2.9.2 Launch and Orbit Raising The greatest technical and economic challenge of the SPS concept is the problem of transporting huge amounts of mass to GEO. Two problems stand out in regard to launching the materiel for SPS. One is the cost and the other is scheduling the large number of launches that would be required. Delivery of elements for one SPS to LEO would require at least 80 launches with a 125 tonne (to LEO) HLLV if the SPS mass can be limited to 10,000 tonnes, and possibly a great deal more than 80 launches if (as seems likely) the SPS mass is considerably greater. If there were say, three gigantic launch sites capable of sending up HLLVs, the entire set of > 80 launches for one SPS could be carried out in a little over two years. All of the above pertains to one SPS. For an entire family of up to 20,000 satellites, it would take over 40,000 years to launch all the materiel to LEO at the rate of 3 HLLV launches per month.
Orbit-raising from LEO to GEO is another major challenge for SPS. Use of reusable solar electric propulsion (SEP) vehicles has been
proposed for this purpose, but this approach has significant problems.
The benefit of SEP is that with its much high specific impulse, the amount of propellant required with SEP would be greatly reduced compared to use of chemical propulsion. However, the mass of the solar array used for SEP would be a detriment, and there would be a number of other issues introduced. These include:
• Degradation of SEP solar cell performance while passing through the radiation belts.
• Very high power levels are required. Thus, a rather gigantic solar array would be required.
• Developing and implementing the high-performance ion thrusters that are needed.
• The slow spiraling out of the SEP vehicle (many months required for transfer) creates time delays and operational scheduling difficulties.
• Any personnel required in GEO for assembly or servicing would have to use yet another vehicle, a fast "personnel taxi" powered by chemical propulsion.
• Requirements for Xe propellant for SEP would far exceed world supply.
The size and scope of the solar arrays needed by SPS are orders of magnitude beyond the scope of any solar arrays ever used in space missions. The viability of the SEP tug concept depends critically on use of hypothetical high-efficiency lightweight solar arrays that are likely to be difficult to develop, and lightweight propulsion components. Radiation would gradually diminish the efficiency of the solar arrays with each passage through the radiation belts.
2.9.3 Assembly Assembly on-orbit is another major challenge. On-orbit construction requires a massive construction facility in involving hundreds of astronauts working continuously over several decades. While most concept papers assume assembly in LEO and transport of the assembled SPS to GEO via SEP, Reference [S6A] found that assembly at 500 km is

63
undesirable due to debris impacts. The debris problem can be avoided by carrying out assembly at altitudes greater than 3000 km. However it was concluded that the SPS should not be assembled at any altitude between 3000 km and 11,000 km in order to avoid degradation of the cells by radiation. Therefore, for non-GEO assembly, the assembly altitude was limited to above 11,000 km. It was concluded by Reference [S6A] that assembly at GEO is preferable. Transporting the assembly crew to GEO would pose significant problems.
2.9.4 Degradation in Space Reference [S23] discusses the effects of degradation on the solar cells and their optical coverings due to the space environment. Experience with communications satellites shows that over a nominal seven-year GEO satellite lifetime, the optical covering degrades about 7% the first year before stabilizing while the solar cells degrade about 3% their first year and 2% each subsequent year. The power level drops to 72% after 7 years. Since most concepts for solar power satellites involve 30-year lifetimes, it is not clear how they will cope with degradation of solar cells. It may be possible to use radiation-hardened cells, or to periodically replace the arrays at additional cost.
As discussed previously, depending on the scenario for assembly on orbit, space debris and radiation could pose significant risks even before the SPS is completely assembled and transported to GEO.
2.9.5 Environmental Impacts Reference [S13] describes an extensive program "to develop by the end of FY 1980 social and environmental acceptability of the SPS concept." Four fundamental issues were defined as:
• Effects of microwave radiation on the general public and SPS workers and the effects of ionizing radiation on space workers.
• Effects of launch activities and rectenna operations on ecosystems.
• Effects of SPS launch activities on atmosphere, weather, and climate.
• Effect of SPS on communications.
A list of over 100 individual tasks dealing with environmental issues was provided, involving work by various NASA Centers, universities, other government laboratories, and a few non-government organizations. A one-page summary of each task was provided at the outset with an objective and a brief approach. Unfortunately this writer has not been able to locate any reports of work accomplished under this program. While many good questions were raised, no answers seem to have been produced.
2.9.6 Economic and Political Issues Two critical aspects of the SPS cost are (1) future launch and orbit-raising costs per tonne, and (2) mass of future solar arrays per kW generated in GEO. If one utilizes current data for these factors, the cost of an SPS is huge. Therefore, a number of investigators have made various optimistic assumptions regarding future reductions in these quantities – and even then, the projected cost of an SPS is very high, although some have argued that under those conditions it can become cost-effective. However, no cost estimates for power from SPS can be trusted at this early date. History suggests that the actual cost will be far greater than most estimates.
Of equal importance is the fact that no revenues are generated until the entire system is complete and operational. The very large cost-to-first power characteristic will be unattractive to investors.
The outstanding international legal issues that might affect SPS development include: (1) jurisdiction over the placement of satellites in GEO, (2) provisions against environmental disturbances, (3) military uses of space, as well as other aspects.
2.9.7 Other Issues Disposal - Finite Lifetime
If there is a finite lifetime to an SPS (~ 30 years), how do we deal with disposal, replacement, refurbishment, or whatever after 30 years?

64
Outage for Lunar Eclipse
For a period of about a month centered on the equinoxes, geostationary satellites enter their eclipse season, when they can spend some time near midnight of every day in shadow because the Earth lies in the path of the rays from the Sun. However, if there are a great number of SPS in orbit surrounding the Earth, only those in the shadow of the Earth will be without power at any time. With an interconnected grid, this might not be an insuperable problem.
Size of Earth Receiving Stations
The nominal dimension of a rectenna site including a buffer zone was estimated to be 17 x 13 kilometers. The land area occupied by the entire installation would be about 200 km2. The above estimate was made on the basis that this limit is 10 mW/cm2, whereas if it were set as low as 0.01 mW/cm2, the buffer zone would extend more than 15 km from the edge of the main ellipse, with a total site area of ~ 1,700 km2.
Hence the 300 GW system of SPS providing about ¼ of future U. S. power needs would require a ground area of ~ 105 km2 (an area 300 km x 300 km).28
2.10 NASA Position on SPS It is difficult to discern any current specific policy, strategy or approach to SPS at NASA in 2007.
The last semi-official statement regarding NASA's approach to SPS seems to have been made by John Mankins in a roundtable discussion with the NRC leading to a press release on 2/28/2001 [S36].29
In this press release, Mr. Mankins claimed that ongoing and recent NASA-funded
28 However [S10] and [S12] estimate an area of about 1/10 this estimate due to use of smaller buffer zones. 29 “Strategic Research and Technology Road Map.” Briefing by John Mankins and Joe Howell, National Aeronautics and Space Administration, to the Committee for the Assessment of NASA’s Space Solar Power Investment Strategy, National Research Council, Washington, D.C., December 14, 2000. This writer does not know how to obtain a copy of this - although it probably isn't worth much effort.
technology advances have narrowed many of the technology gaps, but he admitted "major technical, regulatory and conceptual hurdles continue to exist." He said that: "A strategic research and technology roadmap has been developed that lays out potential paths for achieving all needed advances – albeit over several decades. This roadmap was presented for review to the National Research Council. The results of that review are still pending." The NRC report [S4] mentions the word "roadmap" 55 times but does not provide much information. However, it does present two figures from the Mankins and Howell presentation (see Figures 2.10-1 and 2.10-2). The roadmap in Figure 2.10-2 provides a series of steps that Mankins believed could lead to the following goal: "By the 2025-2035 time frame, the technologies needed for a full-scale in-space SSP platform producing 1-2 GW [at Earth] could be demonstrated at the system prototype level.... This time frame is consistent with current plans for the development of very-low-cost Earth-to-orbit space transportation systems (e.g., in the $100-$200 per kilogram30 recurring cost range)."
With such exaggerated optimism, that roadmap should better be filed under science fiction, rather than science. As long as engineering is carried out within PowerPoint, almost any number can play. But ultimately, reality will win out. It is to NASA's credit that this roadmap appears to have been discarded.
Be that as it may, NASA should formulate an attitude toward SPS. To simply let it slip through the cracks and undergo a sort of "pocket veto" does not seem appropriate. NASA should either develop a strategy for further development, or develop a statement as to why it does not choose to pursue this area for now.
30 It is not clear whether this cost is for transfer to LEO or GEO. Either way, it is unattainable.

65
Figure 2.10-1. NASA strategic approach to SPS technology. [S36]

66
Figure 2.10-2. NASA Roadmap for SRP development. [36]

67
2.11 Conclusions Regarding Beamed Solar Power from Space The problem with evaluating the prospects for SPS is that the benefit/cost ratio (for all practical purposes) is (∞/∞). While a number of authors have made specific cost estimates for SPS, these estimates tend to be extremely optimistic, rather thinly developed, and lacking in depth and veracity. A number of investigators have adopted extremely assumptions about future costs, particularly launch costs, based on a vague notion that expanded activity will lower costs by factors of up to 100. While some analysts have warned us against being overly conservative in predicting future progress, and indeed that is a danger, there has to be a greater basis for optimistic expectations than mere hand-waving. A system that could potentially provide the world with almost unlimited power is too important to be treated with brief, simplistic evaluations that lack depth and substance.
On the other hand, the problems associated with the SPS concept for deployment in GEO appear to be so great as to cast great doubt on the whole enterprise. Chief among these are the requirements to lift huge masses to GEO, as well as the problems in scheduling heavy-lift launches. But there are other problems as well: environmental, political, technical and economic. The need for making unprecedented large investments for many years with no return on investment looms as a potential show-stopper.
Based on what we know at this point, the SPS in GEO concept does not appear to be affordable or practical. That does not necessarily mean that further study is not useful, but it does cast a shadow of doubt on the concept.
Beaming power from the Moon has the huge potential advantage that the solar arrays could possibly be fabricated on the Moon from indigenous resources. Nevertheless, lunar solar power concepts suffer from many of the difficulties associated with SPS in GEO. Furthermore, lunar solar power has not received the attention, analysis and evaluation given to SPS in GEO. The fact is that lunar solar power requires a great deal more study. But elimination of the need to lift solar arrays from Earth appears to be an important tipping point in favor of the lunar approach, and based on the very incomplete analyses available today, it appears likely that the only form of beamed power that has even a small chance of becoming practical half a century from now is lunar solar power.
Unfortunately, NASA does not seem to have a strategy for pursuing and evaluating these proposed schemes, and lunar solar power has been denigrated to one entry in a table of things NASA could conceivably do on the Moon. NASA is expending a considerable amount of funding on lunar ISRU for oxygen production, which has a rather meager payoff, requires a significant investment, and has low mission impact. These funds could be better directed into processes for production of solar cells, perhaps using the fluorine process advocated by Landis.

68
3. 3He-based Fusion Power
3.1 Introduction
3.1.1 Fusion vs. Fission In a fission reaction, an impinging slow neutron splits a very heavy nucleus into fast fragments, and in the process other neutrons that can have energies higher than that required for sustaining the chain reaction are ejected. Therefore these neutrons have to be slowed down by having a reactor core of sufficient dimensions, embedded in some suitable moderator. Thus, if the mass of the fissile material is large enough, a self-sustaining chain reaction can occur. This reaction can be controlled in a fission reactor, which is a thermal machine where the hot source is the fissile material itself. [H23]
In a typical fusion reaction, two light nuclei combine to form a fast, heavier nucleus and an even faster nucleon, i.e. a neutron or a proton. For such a reaction to occur, the fusion fuel has to have a temperature high enough for all its atoms to be dissociated (ionized) into free nuclei and electrons. Most importantly, conditions must allow at least a few of the nuclei to gain enough kinetic energy to overcome the repulsive electrostatic barrier between any two of them, to undergo a fusion reaction. Within the achievable range, the higher the temperature, the more nuclei react; hence the name ‘thermonuclear’ fusion. Since none of the particles resulting from a fusion reaction give rise to another fusion reaction, no chain reaction is possible. The process can be self-sustaining, however, because, a part of the kinetic energy of the particles can be used to maintain the fuel at the very high temperatures required for other fusion reactions to occur. [H23]
3.1.2 Fusion Reactions Kulcinski and Schmitt [H18] provide an excellent introduction to fusion processes. The first several pages of their report are summarized here.
Fission based reactors depend on the process:
{1} Fissionable isotope + neutron ⇒ two fissionable products (FP) + ~ 2.5 neutrons
235U + 0n ⇒ 2 FP + ~2.5 0n (~ 1 MeV)
The main problems with these systems are: (1) the requirement to store fission waste for hundreds or thousands of years, (2) the possibility of malfunctions with consequent release of radioactive material to the environment, (3) the possibility of production of weapons grade material and the dangers involved, and (4) the problems, risks and costs involved in decommissioning plants as they age.
There was hope some 50 years ago that fusion reactors might solve the safety and societal problems associated with fission reactors. In the early 1950s, scientists began to investigate the use of the first-generation D-T fuel cycle to release energy via the reaction described in Equation 2.
{2} deuterium + tritium ⇒ neutron + helium
2H + 3H ⇒ 0n (14.1 MeV) + 4He (3.5 MeV)
Figure 3.1-1. D-T Fusion. [H23]
Development work on this system was carried out from the 1960s to the 1980s. However it was found that converting the kinetic energy of the 14.7 MeV neutron (which constitutes ~80% of the total energy released) into a form that could make electricity was difficult because high-energy neutrons cause considerable damage to the structure surrounding the plasma and produce large amounts of radioactivity in the surroundings.

69
Another potential first-generation fuel involves the fusion of deuterium alone:
{3} 2 deuterium ⇒ neutron + helium-3 (50%)
⇒ proton + tritium (50%)
D + D ⇒ 0n (2.5 MeV) + 3He (0.8 MeV)
⇒ 1H (3 MeV) + 3H (1 MeV)
In this reaction, approximately 35% of the energy is released as neutrons and there is only approximately 7 MeV of energy released per neutron.
Fortunately, other fusion fuel cycles do not release as many neutrons as the two first-generation fuels described in Equations 2 and 3. The so-called second-generation fusion fuel based on the D–3He cycle (Equation 4) emits no neutrons directly, but some of the D ions do react with each other to produce a few neutrons via Equation 3.
{4} deuterium + helium-3 ⇒ proton + helium-4
D + 3He ⇒ p (14.7 MeV) + 4He (3.7 MeV)
Depending on the type of fusion confinement approach used, the neutrons constitute approximately 1-5% of the total energy released.
The third-generation fusion fuel cycle described in Equation 5 is even better.
{5} Two helium-3 ⇒ two protons + helium-4
3He + 3He ⇒ 1H + 1H + 4He (total = 12.9 MeV)
This 3He–3He reaction produces no neutrons. There are no side reactions and neither the fuel nor its direct reaction products are radioactive. In a sense, it is (as Kulcinski and Schmitt say) "the perfect nuclear reaction!"
Kulcinski and Schmitt [H18] summarize the typical percentage of energy released in neutrons:
D-T: 80%
D-D: 35%
D-3He: 1-5%
3He-3He: 0%
Since the amount of radioactivity and radiation damage is directly proportional to the energy released in neutrons, the second-
and third-generation fusion fuel cycles are much more attractive from the point of view of safety.
A more detailed description is given in [H13] where the dependence of energy residing in neutrons is plotted vs. plasma temperature and 3He/D ratio, as shown in Figure 3.1-2.
Figure 3.1-2. Percent of fusion power in neutrons. [H13]
In addition to these fusion reactions involving isotopes of hydrogen and helium, other fusion reactions are possible. These include:
1H + 11B ⇒ 3 (4He) (total = 8.68 MeV)
p + 6Li ⇒ 4He (1.7 MeV) + 3He (2.3 MeV)
Neither of these processes produces neutrons.
Kulcinski and Schmitt [H18] pose the question:
If 3He–3He fusion is such a good idea, why hasn't it been done before?
They provide the two main reasons that second- and third-generation fusion fuels have not been studied extensively in the past:
1. Initiating and maintaining a fusion reaction with these fuels is much more difficult than with first-generation fuels. Figure 3.1-3 in color figures section shows the reactivity

70
plotted as a function of the energy of particles as they collide with each other.
It is clear that the D-T reaction is the most reactive at the lowest energy and that is where practically all of the world's research is now currently directed. The D–3He reaction requires approximately three times more energy to initiate and to operate in a power mode. The 3He-3He reaction requires another factor of ten more energy to operate. These would likely require a different confinement concept. While Kulcinski and Schmitt [H18] were proud of their achievement of 3 x 10⁶ fusions per second in an IEC reactor, this corresponds to a power level of ~ 0.00001 W. It is clear that this technology is still in its infancy.
2. Even if the second- and third-generation fuels could be used, there was no large resource of 3He known before 1986. It has been estimated that while there are very limited resources of 3He on Earth, the Moon contains as much as a million tonnes of this isotope implanted in the lunar regolith by the solar wind. According to Kulcinski and Schmitt [H18], it would require only about 150 tonnes of 3He in working fusion reactors to supply the entire electrical needs of the world in the year 2000. However, the putative 3He on the Moon is dispersed at the level of 10-20 ppb, requiring processing very large amounts of regolith to acquire reasonable amounts of 3He. The practicality of any scheme to acquire 3He on the Moon and transport it to Earth remains highly questionable.
Enthusiasts for 3He have emphasized the environmental problems in using the D–T fusion process. Even D–T advocates agree that there are two important environmental issues: that 80% of the energy is carried out by high energy neutrons and that tritium must be generated inside the reactor. The high velocity neutrons impose massive shielding requirements, produce radiation damage and are a source of undesired activation of the reactor structure. To generate tritium, a highly complex breeding blanket must surround the reactor core. They agree that other reactions having a highly reduced or completely absent neutron output and utilizing fuels that do not require tritium breeding are appealing. Nevertheless, D–T
advocates point out the many difficulties in using fusion fuels dependent on 3He. For example, because of their lower fusion reactivity, the power density in the plasma for a given plasma pressure would be 50–100 times smaller for any other fusion fuel than for D–T and the required confinement time would be 25–50 times larger. This would require either operation at much higher temperatures in order to achieve a comparable power density, or a much larger plasma volume, in order to achieve the same power output. Another point is that the neutrons from D–T fusion carry 80% of the fusion energy through the first wall to be deposited over the volume behind it, leaving at most 20% of the fusion energy to be transferred as heat to the first wall. On the other hand, as much as 100% of the fusion energy must be transferred as heat to the first wall of a reactor with neutron-free fuels, which makes it technically a more complex task. For the first generation of fusion reactors, the fuel will certainly be D–T, and it is claimed that the neutron problems will be tackled by using low activation structural materials, presently under development. Advanced fuels are therefore typically relegated to a next-generation option. [H23]
However, one must agree with Kulcinski and Schmitt [H18] that IF 3He could be economically extracted and brought to the Earth, and IF suitable fusion reactors can be developed and operated at the very stringent conditions required, our energy needs would be satisfied for perhaps a thousand years or more. Clearly, 3He-3He based fusion would be the ideal energy source for the future of the world. Certainly, this concept is worth serious study and analysis.
Another question arises. Should the main bulk of fusion research be addressing the D-T reaction (as it presently is) or should it shift over to 3He–3He based fusion? While workable D-T fusion reactors will be easier to achieve, they will suffer inherently from radioactive waste problems. This may prevent this technology from ever becoming practical. On the other hand, it is not clear that 3He can be economically acquired from the Moon, and developing a workable reactor for 3He-3He

71
based fusion will be far more difficult to achieve than D–T fusion.
Strategically, it is not clear whether the U. S. approach of developing fundamental supporting science, or the European approach of pursuing engineering design of fusion reactors, is the best approach to advance fusion technology.
Finally, it should be emphasized that if a practical fusion reactor can be developed, this could, in one fell swoop, solve the world's energy problems for many years.
3.1.3 Fusion Requirements As shown in previous sections, the requirements to initiate a single fusion event are that the two reacting nuclei must collide at a high relative velocity, corresponding to an energy typically of several to many tens of keV, depending on the fusion reaction involved (see Figure 3.1-2). Consider the case of the D–T fusion process. If the D and T particles are accelerated to an energy of say, 10 keV, and a fusion event occurs, 17.6 MeV of energy is released in the fusion products (a neutron and 4He). Thus the fusion process acts like an energy amplifier. An investment of 10 keV is made and a return of 17.6 MeV is obtained (amplification factor = 1760). If only 1% of the accelerated D and T particles accomplished fusion, the energy amplification would still be 17.6. If only one of out of 1,760 of the accelerated D and T particles accomplished fusion the process would just break even energetically. One method to accelerate D and T particles to ~ 10 keV is to heat a mass of D and T to a very high temperature in the range of about 200,000,000°C. Another way would be to accelerate ionized D and T electrostatically to about 10 keV. Most of the work on fusion done to date has used the high-temperature approach.
The second requirement is to maintain contact between the fast moving D and T particles long enough that the probability of the fusion reaction is significant. Matter at 200,000,000°C tends to expand rapidly, making confinement of the plasma a significant challenge if thermal heating is used.
The number of fusion events needed in a power plant can be estimated by noting that 1 MeV = 4.44 × 10⁻²⁰ kWh. Each D–T fusion event generates 17.6 MeV of energy. Making the very generous assumption that all of this is converted to electrical energy, to generate say 1 GW of continuous power for one hour will require 1 × 10⁶ kWh/4.44 × 10-20 kWh = 2.2 × 1025 fusion events per hour, or 6.1 × 10²¹ fusion events per second. While some experiments claim to have produced neutrons at the rate of millions per second, it can be seen that this falls short of the requirement for a full scale power plant by about 1015. For any hope of a practical power plant, not only must the particles impact one another at high speed, but the density must be high enough to draw off sufficient power to be useful.
3.2 Progress in Fusion Development
3.2.1 History of U. S. Support for Fusion R & D This section is excerpted mainly from [H22].
Reference [H22] provides an analysis of the 42-year history of the U. S. magnetic fusion research and development (R&D) program as of the end of 1999.
The fusion program began under the auspices of the AEC31 in 1951 as a classified program, and it was declassified in 1957. It was transferred to ERDA32 in 1975. In 1978 it was absorbed into the DOE where it has remained ever since. It appears that in the early days of fusion research, the potential for practical realization of a fusion energy was greatly oversold – as indeed all futuristic mega-project seem to be always oversold and underestimated.33 Funding was quite modest in the 1950s and 1960s. Congress became
31 Atomic Energy Commission. 32 Energy Research and Development Agency. 33 For example, the Joint Committee on Atomic Energy (JCAE) stated its belief in the Magnetic Energy Fusion Engineering Act of 1980, that the feasibility of fusion could be demonstrated within 10 to 11 years, in line with a target date set by the AEC for itself. [H22]
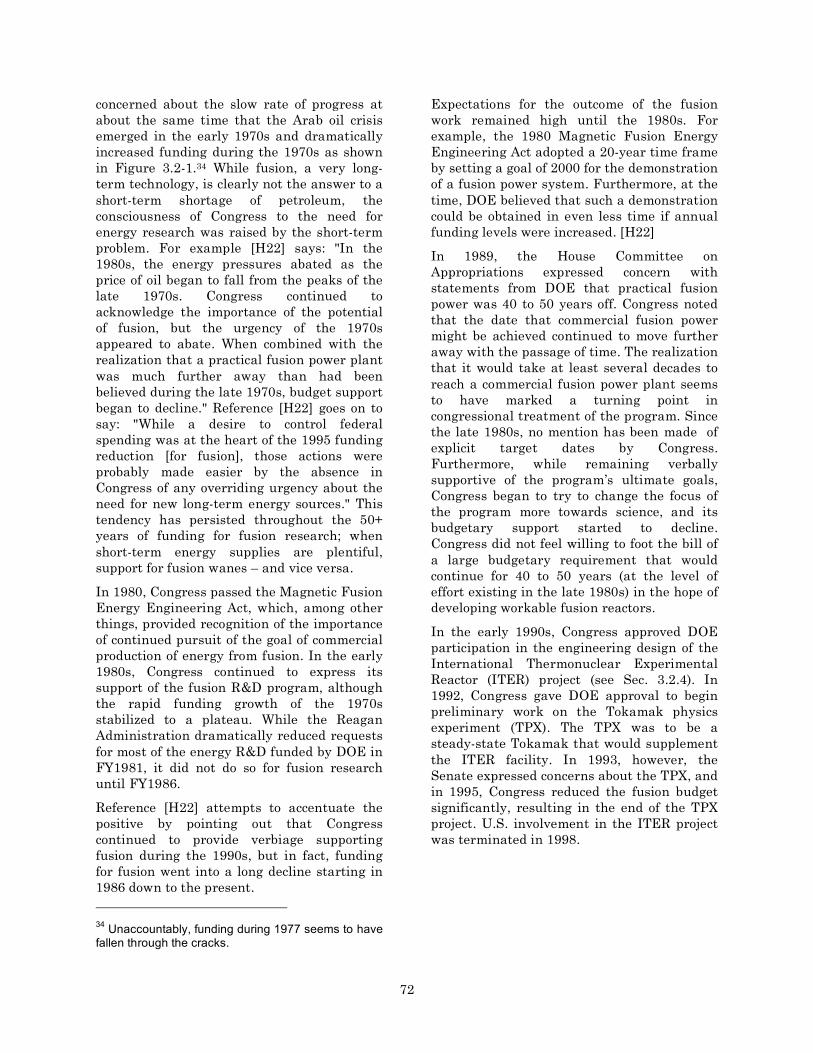
72
concerned about the slow rate of progress at about the same time that the Arab oil crisis emerged in the early 1970s and dramatically increased funding during the 1970s as shown in Figure 3.2-1.34 While fusion, a very long-term technology, is clearly not the answer to a short-term shortage of petroleum, the consciousness of Congress to the need for energy research was raised by the short-term problem. For example [H22] says: "In the 1980s, the energy pressures abated as the price of oil began to fall from the peaks of the late 1970s. Congress continued to acknowledge the importance of the potential of fusion, but the urgency of the 1970s appeared to abate. When combined with the realization that a practical fusion power plant was much further away than had been believed during the late 1970s, budget support began to decline." Reference [H22] goes on to say: "While a desire to control federal spending was at the heart of the 1995 funding reduction [for fusion], those actions were probably made easier by the absence in Congress of any overriding urgency about the need for new long-term energy sources." This tendency has persisted throughout the 50+ years of funding for fusion research; when short-term energy supplies are plentiful, support for fusion wanes – and vice versa.
In 1980, Congress passed the Magnetic Fusion Energy Engineering Act, which, among other things, provided recognition of the importance of continued pursuit of the goal of commercial production of energy from fusion. In the early 1980s, Congress continued to express its support of the fusion R&D program, although the rapid funding growth of the 1970s stabilized to a plateau. While the Reagan Administration dramatically reduced requests for most of the energy R&D funded by DOE in FY1981, it did not do so for fusion research until FY1986.
Reference [H22] attempts to accentuate the positive by pointing out that Congress continued to provide verbiage supporting fusion during the 1990s, but in fact, funding for fusion went into a long decline starting in 1986 down to the present. 34 Unaccountably, funding during 1977 seems to have fallen through the cracks.
Expectations for the outcome of the fusion work remained high until the 1980s. For example, the 1980 Magnetic Fusion Energy Engineering Act adopted a 20-year time frame by setting a goal of 2000 for the demonstration of a fusion power system. Furthermore, at the time, DOE believed that such a demonstration could be obtained in even less time if annual funding levels were increased. [H22]
In 1989, the House Committee on Appropriations expressed concern with statements from DOE that practical fusion power was 40 to 50 years off. Congress noted that the date that commercial fusion power might be achieved continued to move further away with the passage of time. The realization that it would take at least several decades to reach a commercial fusion power plant seems to have marked a turning point in congressional treatment of the program. Since the late 1980s, no mention has been made of explicit target dates by Congress. Furthermore, while remaining verbally supportive of the program’s ultimate goals, Congress began to try to change the focus of the program more towards science, and its budgetary support started to decline. Congress did not feel willing to foot the bill of a large budgetary requirement that would continue for 40 to 50 years (at the level of effort existing in the late 1980s) in the hope of developing workable fusion reactors.
In the early 1990s, Congress approved DOE participation in the engineering design of the International Thermonuclear Experimental Reactor (ITER) project (see Sec. 3.2.4). In 1992, Congress gave DOE approval to begin preliminary work on the Tokamak physics experiment (TPX). The TPX was to be a steady-state Tokamak that would supplement the ITER facility. In 1993, however, the Senate expressed concerns about the TPX, and in 1995, Congress reduced the fusion budget significantly, resulting in the end of the TPX project. U.S. involvement in the ITER project was terminated in 1998.
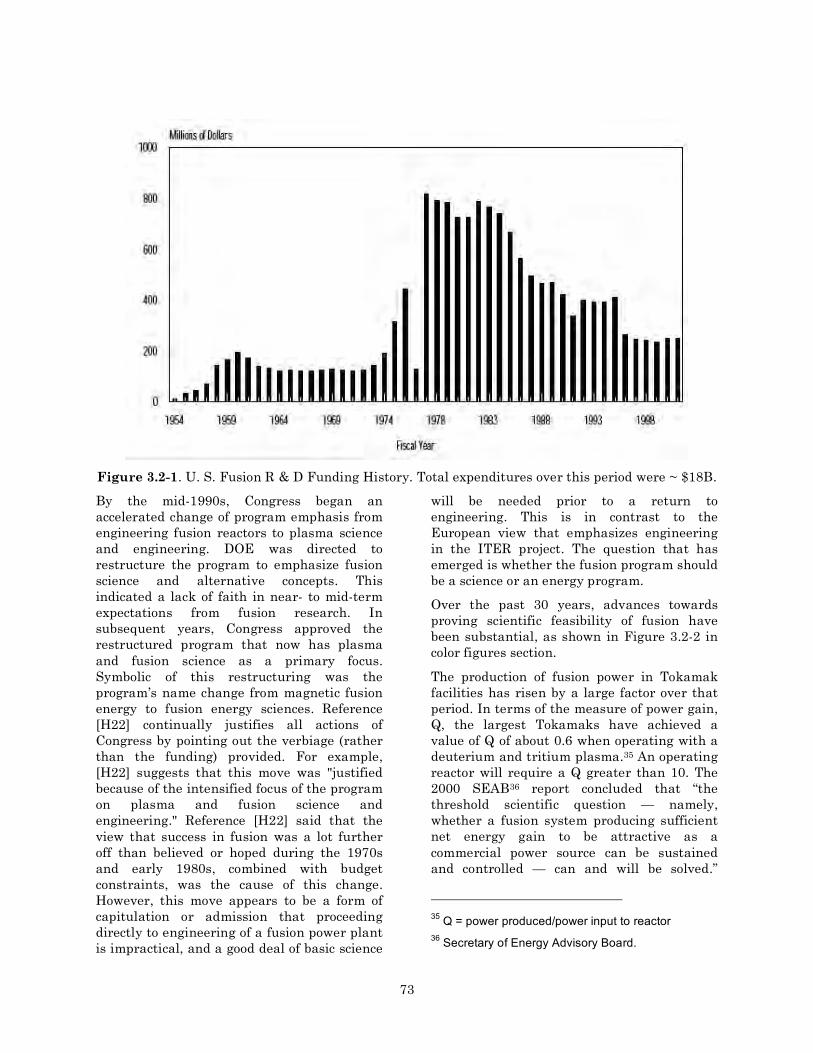
73
Figure 3.2-1. U. S. Fusion R & D Funding History. Total expenditures over this period were ~ $18B.
By the mid-1990s, Congress began an accelerated change of program emphasis from engineering fusion reactors to plasma science and engineering. DOE was directed to restructure the program to emphasize fusion science and alternative concepts. This indicated a lack of faith in near- to mid-term expectations from fusion research. In subsequent years, Congress approved the restructured program that now has plasma and fusion science as a primary focus. Symbolic of this restructuring was the program’s name change from magnetic fusion energy to fusion energy sciences. Reference [H22] continually justifies all actions of Congress by pointing out the verbiage (rather than the funding) provided. For example, [H22] suggests that this move was "justified because of the intensified focus of the program on plasma and fusion science and engineering." Reference [H22] said that the view that success in fusion was a lot further off than believed or hoped during the 1970s and early 1980s, combined with budget constraints, was the cause of this change. However, this move appears to be a form of capitulation or admission that proceeding directly to engineering of a fusion power plant is impractical, and a good deal of basic science
will be needed prior to a return to engineering. This is in contrast to the European view that emphasizes engineering in the ITER project. The question that has emerged is whether the fusion program should be a science or an energy program.
Over the past 30 years, advances towards proving scientific feasibility of fusion have been substantial, as shown in Figure 3.2-2 in color figures section.
The production of fusion power in Tokamak facilities has risen by a large factor over that period. In terms of the measure of power gain, Q, the largest Tokamaks have achieved a value of Q of about 0.6 when operating with a deuterium and tritium plasma.35 An operating reactor will require a Q greater than 10. The 2000 SEAB36 report concluded that “the threshold scientific question — namely, whether a fusion system producing sufficient net energy gain to be attractive as a commercial power source can be sustained and controlled — can and will be solved.”
35 Q = power produced/power input to reactor 36 Secretary of Energy Advisory Board.

74
However, Reference [H22] points out that "demonstration of scientific feasibility, however, is only the first step towards a practical fusion reactor. Beyond that point lie a range of engineering challenges including conversion of fusion energy to electricity, fueling the fusion reaction, removing plasma ash from the reactor, and a host of other problems that must be solved to make an economic power reactor.... Therefore, a long period — possibly several decades — is likely to be required before a definitive answer about a fusion power plant is available. Such a long period means that a substantial total funding commitment would be needed even if yearly funding levels were about the same as those currently provided."
Reference [H22] defends congressional policy toward fusion, saying that "Congress will continue support for an extended period if progress is apparent and specific and realistic goals and target dates are provided and adhered to. Because budget stringency is likely to continue for an indefinite period, however, it appears unlikely that significant, annual budget increases will be available any time soon, if ever. Therefore, the program will likely have to evolve toward fusion energy development within relatively constrained budgets. It is important to note, in this context, that DOE does not have a target date for achieving commercial fusion power. Currently, its policy is to advance plasma and fusion science and engineering on a broad front and allow those developments to set the pace of the program. There have been some estimates that it could take as long as 50 years to reach the point that a commercial plant was possible within existing budget levels, but it is also possible that breakthroughs in one or more of the concepts now under investigation by DOE could shorten the time to success, but it is still likely to be long without significantly higher funding."
The logic of these arguments is difficult to understand. If the SEAB is correct that the technical basis for a fusion reactor "can and will" be established, and considering the future U.S. and world needs for energy and the finite fossil fuel resources, development of fusion "within relatively constrained budgets"
would seem to be the height of folly. On the other hand, if successful implementation of fusion reactors is appraised as a highly speculative, very uncertain outcome, such constrained funding may possibly be justified. But there may be a "chicken and egg" situation working here. Considering that the total 2006 DOE R&D annual budget is over $8B, the allocation of a mere $291M (3.6%)37 seems to be inappropriately small. Considering the funds being poured into the "hydrogen hoax," this is a travesty.38
3.2.2 Status of Mainstream Fusion Research This section is mainly excerpted from [H23].
Deuterium-Tritium Fusion
The fusion reaction involving heavy isotopes of hydrogen (deuterium and tritium) requires temperatures of several hundred million degrees. Producing such high temperature plasmas in the laboratory and confining them for a sufficiently long time away from material walls to produce controlled fusion poses a huge scientific and technological challenge. This makes the task of developing fusion as a new source of energy, in a form acceptable from the economic, safety and environmental points of view, formidable. [H23]
It is noteworthy that whereas the 3He advocates are quick to point out the problems associated with neutrons in current fusion development of D-T fusion, the D-T advocates appear to think that these problems can easily be overcome. For example, [H23] says: "fusion has the potential of becoming the long term replacement source because of its (1) virtually inexhaustible and universally available fuel source; (2) intrinsically safe nature (no chain reaction); (3) right energy density for large scale production of electricity and (4) acceptable environmental impact from the operational and waste points of view."
According to [H23]: "deuterium is found naturally in sea water (abundance 1 part in
37 Source: http://www.aaas.org/spp/rd/doe06p.pdf 38 "The Hydrogen Hoax," Robert Zubrin, The New Atlantis Winter, 2007.
75
6000) and tritium may be readily39 bred from the vast deposits of lithium which exist in the earth’s crust and the oceans; the basic fuel for D–T fusion is thus virtually inexhaustible."
Fusion Figures of Merit
For a fusion power plant, the critical requirement is to maintain the plasma at sufficiently high temperatures (typically 100 - 200 million °C) for a long enough time, in a sufficiently dense configuration, to allow a sufficient number of thermonuclear reactions to occur. The closeness of a plasma to power plant conditions is measured in terms of the triple product P = (n T τ) where n = density, (number of fuel particles per unit volume), T = temperature and τ = confinement time. For a 50–50 D–T plasma at about 200,000,000°C (~ 20 keV), to achieve ignition condition in a power plant, (i.e. when the fusion reaction is self-sustained through alpha particle heating), one would need this triple product to have the value P > 6 × 10²¹ (keV-s/m3). Another important parameter for a fusion based power plant is Q, the ratio of fusion power generated to input auxiliary heating power. While a fusion power plant generating electricity would need Q ≥ 10, an ignited power plant would correspond to Q = ∞, since there is no externally injected heating power in such a device. Fusion may be attempted in the laboratory by the magnetic confinement approach or the inertial confinement approach. In magnetic confinement, one uses external and self-generated magnetic fields to hold the plasma at relatively low densities away from material walls for time periods of the order of a few seconds. In the inertial fusion approach, one relies on achieving the triple product relevant to ignition by compressing a solid fusion pellet to much higher densities using an inertial fusion driver (like lasers, heavy ion beams, ...) and then relying on the inertia of the pellet to produce an acceptable fusion output before the pellet disassembles by expansion. Present day fusion experiments have brought the triple product to within a factor of ~4 of its final required value for a D-T plasma and have already exceeded conditions equivalent to Q =
39 The word "readily" here may reflect a certain spirit of optimism.
1. The most significant achievements have been in Tokamak based magnetic confinement fusion. In Tokamak experiments, the fusion triple product P has reached a record value of 1.5 × 10²¹ keV-s/m3and Q has reached 1.25. A record of 16 MW of fusion power has been produced for several seconds.
Confining the Plasma
There are two mainstream approaches to the goal of keeping hot plasmas away from material walls for as long as required by the triple product criterion: magnetic confinement and inertial confinement. The magnetic confinement approach aims at obtaining fusion power in steady-state plasmas. The inertial confinement approach aims at obtaining fusion energy in a pulsed fashion, from thermonuclear micro-explosions repeated at high rate.
Magnetic confinement fusion relies on the fact that plasma is a collection of charged particles so that it can be influenced and controlled by magnetic fields. Magnetic confinement fusion exploits the ability of a steady magnetic field to dramatically restrain the motion of the charged particles in a plasma across the magnetic lines of force while allowing them to move freely along the lines of force. Attempts to confine the charged particles of a plasma along the lines of force have given rise to different confinement configurations. Reference [H23] describes the leading magnetic configurations: the Tokamak and the Stellarator in some detail.
The Tokamak was invented in the 1950s in the Soviet Union. This device is a torus, a donut surrounded by a magnetic field to confine the plasma within it. In 1968, the Russians announced they had achieved electron temperatures over 1 keV in their Tokamak, resulting in most fusion researchers thereafter focusing on Tokamaks.40 Reference [H24] points out that you need a thousand collisions before you get a fusion event. Each time you get a collision, it tends to head towards the walls of the torus. To minimize ions hitting the wall, Tokamak magnetic
40 [H24] quips: "Some people speculate that the Russians "gave" us Tokamaks, to make sure that we never achieved practical fusion!"

76
confinement tubes are several meters in diameter. Shielding is provided by using hundreds of tons of molten 6Li from which tritium must be recovered. Outside of all of this, is the superconducting magnetics.
The result is what [H24] calls "a superconducting cathedral." The ITER European fusion research project plans to build a 500 MW Tokamak fueled by deuterium-tritium plasma. While it is 24 meters high and 30 meters wide (see Figure 3.2-3 in color figures section); it is expected that a practical plant would be at least 50% larger, i.e. 36 meters high and 45 meters wide.41 [H24]
Inertial fusion is a completely different approach to a fusion reactor. If a pellet of solid fusion fuel is compressed to very high densities and a portion of it is heated to the temperatures required for ignition, it is hoped to generate net fusion power before the pellet blows itself apart. In this approach confinement is not achieved by external fields, but by the inertia of the hot fuel that keeps it assembled for a finite time (hence the name inertial confinement). Compression is accomplished by heating just the surface of the spherical hollow shell target uniformly from all sides, whereby the intense heating of the surface creates an inward implosion of the fuel as the surface layer explodes outward. The driver of the compression process can be either a giant laser or heavy ion beams from a particle accelerator. As [H23] discusses, compression of the DT fuel pellet to very high densities (about 200–400 g/cm3, or 1000–2000 times the normal solid density of D–T) will likely be required. The four important phases associated with a pellet implosion are as follows: (1) as the driver energy impinges on the initially solid matter of the capsule, this material is transformed into a plasma; (2) the capsule is ablated and the heated plasma expands outward with a velocity of 100–1000 km/s; (3) as a reaction, the remaining portion of the spherical capsule is accelerated to 300–
41 Reference [H24] quotes a top fusion researcher as saying, "We have spent $15B studying Tokamaks, and all we know about them is that they're no damn good! However, while they may never be economical, they are really good science!"
500 km/s inward towards the center, compressing and heating (via mechanical work) the thermonuclear fuel; (4) if, at the culmination of the implosion, specific conditions associated with the compressed fuel configuration are attained, thermonuclear ignition at the center and subsequent propagation to the whole fuel will occur, leading to a large burn up. A crucial requirement for the generation of the central hot spot is a high degree of symmetry of the spherical implosion, which demands uniform irradiation and control of certain hydrodynamic instabilities. A new concept called the fast ignitor was also proposed in the mid-1990s, based on the generation of the ignition spark by a ultra-intense laser pulse at the surface of a pre-compressed fuel. Although rather speculative, and based on complex, non-linear and relativistic plasma physics effects, the scheme is of interest because it requires a lesser degree of symmetry, and would allow for ignition at lower energy, or for higher gain at the given driver energy, than the standard inertial fusion approach. A new concept in inertial fusion systems, which has been quite active during the last decade, is the heavy-ion accelerator driven inertial fusion system. In this concept the laser driver is replaced by a heavy-ion beam, which can be produced with a much higher electrical efficiency and is also excellent at heating solid density plasmas by classical Coulomb collisions. Another direction that has emerged in recent years is that of the efficient generation of soft x-ray pulses using wire array implosions.
Section 3.2.5 describes a maverick approach using electrostatic confinement.
Safety and Environment
Reference [H21] claims that extensive studies have shown that fusion is inherently safe and environmentally friendly. It is claimed that even though a fusion reactor contains significant amounts of tritium the worst in-plant generated accident would result in limited hazards to the public. Similarly it is claimed that the consequences of accidents caused by external events, such as a large earthquake, would be far less severe than those resulting from the event itself.

77
Reference [H23] discusses emissions during normal operation. Besides tritium, the other source of the radioactivity in the plant is the intense flux of fusion neutrons penetrating the material surrounding the plasma and causing 'activation.' Small fractions of radioactive materials are released during normal operation. According to one study, the expected doses to the most exposed individual of the public would stay well below the internationally recommended limits and amount to less than 1% of the naturally occurring dose rate.
The fusion reactions produce neutron-induced radio-activation of the inner reactor walls. It is claimed however that almost all of the activated materials can be disposed of as inert waste, recycled, or given shallow-land disposal about 100 years after the end of operation. It is noteworthy that the proponents of 3He may not agree with this.
According to [H23], an EFDA42 study has concluded that even during severe internal accident scenarios, the expected dose to the most exposed individuals of the public would stay within the range of annually occurring natural radiation. The same study has also concluded that in the case of severe external hazards, such as an airplane crash or worst case weather conditions, only a very small area, most likely within the perimeter of the site, would have to be evacuated. Detailed analysis of the amount and composition of the fusion power waste by JAERI43 and EFDA studies shows that a rapid decrease in radio-toxicity occurs once the plant is shut down and that the radio-toxicity becomes comparable to a coal based thermal station within a couple of hundred years. If these claims are correct, the basis for seeking 3He on the Moon would appear to be significantly weakened. However, the pro-3He group argues that D-T fusion has severe environmental problems due to the fact that most of the energy generated by the fusion reaction ends up in the product neutrons that are difficult to
42 European Fusion Development Agreement http://www.efda.org/ 43 Japan Atomic Energy Research Institute http://www.jaeri.go.jp/english/
contain and produce radioactivity in their surroundings. The need to breed tritium is another problem. The high velocity neutrons impose massive shielding requirements, produce radiation damage and are a source of undesired activation of the reactor structure. To generate tritium, a highly complex breeding blanket must surround the reactor core.
3.2.3 Fusion Reactor Design This section is excerpted from [H23].
The neutrons produced in the D–T reaction carry 80% of the released energy out of the plasma into a stopping region or blanket, where they are slowed down, thereby heating the blanket. Heat transfer fluids circulating within the blanket transfer heat out of the reactor area to produce steam to generate power in a conventional way (Figure 3.2-4 in color figures section).
So in the case of a D–T fusion reactor, the heat is not extracted from the thermonuclear burning fuel, but from the blanket and the first wall. The blanket also serves another essential purpose in a D–T reactor: producing, or ‘breeding’ the tritium fuel required by the reactor. The D–T reaction is self-sustained—i.e. the plasma is ignited—when the alpha particles, which carry the remaining fifth of the energy released per reaction, remain confined long enough within the plasma to transfer their kinetic energy to other confined nuclei through collisions, and the energy confinement of the plasma is sufficiently good that heating by these alpha particles can maintain the plasma at the required burn temperature. This fraction of the energy eventually impinges as radiation and energetic particles on the first solid wall facing the plasma. As stated previously, in order to achieve ignition in a 50–50 D–T plasma, a temperature between about 100 and 200 million degrees centigrade is needed and the condition on the triple product is P > 6 × 10²¹ (m−3 keV s). In a reactor, of course, more power has to be produced by the thermonuclear reactions (fusion power) than is spent in maintaining the conditions in which these reactions occur (input power).
In an ignited D–T reactor, the power necessary to sustain the nuclear reactions

78
comes entirely from within the plasma itself, through alpha particle heating. In that case, once ignition is achieved, no external input power is needed, and Q = ∞. It is however quite possible to operate a reactor without achieving ignition. In that case, the alpha particles do not provide all the heating for the D–T mixture, and extra power must be applied at all times to heat the plasma. This means feeding back some of the reactor power to heat the plasma: Q has then a finite value, and the reactor is said to operate in a ‘driven’ regime.
3.2.4 International Thermonuclear Experimental Reactor The key flagship experiment for the international fusion community in the immediate future is the ITER experiment (formerly known as The International Thermonuclear Experimental Reactor). Work on ITER will be accompanied by the design and implementation of facilities like the International Fusion Materials Irradiation Facility (IFMIF). It is also intended to follow this up with a commercial demonstration of a plant actually delivering energy from fusion into the electricity grid, namely DEMO. [H23]
ITER has the basic goal of achieving burning fusion plasmas with a Q ≥ 10. For this purpose the baseline operation mode will be the so-called ELMy H-mode that has been extensively studied in many present experiments. The key physics issue to be addressed in ITER is whether the replacement of externally injected auxiliary heating power by the heating produced by an isotropic population of fusion alphas produces some unusual response. Another major area of investigation for ITER will be that of plasma–wall interaction in steady-state plasmas. A third major issue for ITER is that of power removal and tritium breeding; for this purpose several test blanket modules with different design concepts will be introduced into ITER and data will be collected. [H23]
At the beginning of the 1990s, the conceptual design activity for ITER had already been completed and the engineering design activity (EDA) had started. The results of the six years of technical work, completed in mid–1998 were encapsulated in the "ITER Final Design
Report, Cost Review and Safety Analysis’" which, with its supporting detailed documentation, was widely accepted as providing the first comprehensive design of a fusion reactor based on well-established physics and technology. However, towards the end of the EDA it was recognized by the international parties to it, that due to financial constraints, it was difficult to procure a financial commitment towards the construction of ITER. Hence new technical guidelines for minimizing costs by reducing goals, but still retaining the overall program objectives of the ITER were established.
The physics guidelines were the following:
(1) Achieve extended burn in an inductively driven plasma with Q ≥ 10 for a range of operating scenarios with a pulse duration sufficient to achieve stationary conditions with respect to all characteristic plasma time scales.
(2) Demonstrate steady-state operation using a non-inductive current drive with Q > 5.
(3) Explore the possibility of achieving controlled ignition.
For engineering performance, the guidelines were the following:
(1) Demonstrate availability and integration of essential fusion technologies.
(2) Test components for a fusion reactor.
(3) Test tritium breeding module concepts.
Several models of a reduced cost ITER were quickly developed which finally culminated in the ITER-FEAT—the finally accepted design of ITER. This is now ready for construction and it is intended that it will start operating within 10 years of a formal positive decision.44 [H23]
3.2.5 Inertial Electrostatic Fusion A team that calls itself "Energy Matter Conversion Corporation (EMC2)" has been working on a maverick electrostatic approach to fusion confinement for more than a decade. The following description is excerpted from References [H24, H25, H26].
44 Details of the project can be found on the ITER website: http://www.iter.org

79
This work was supported by the DOD for a number of years but it appears that funding was terminated at the end of FY2006 and the project is presently "treading water" with no current funding.
The concept involved here is called inertial electrostatic confinement, and it relies on accelerating ions in a spherical electric field that converges strongly at the center, causing fusion to take place at the core of the sphere. In the original concept, a negatively charged inner spherical grid was used to establish an electric field relative to an outer grid, and an electron gun fired electrons into the sphere within the inner grid. Ions formed from collisions of electrons with background gas would be accelerated toward the core and be trapped in the potential well. Ions would rattle around with occasional collisions, and less occasional fusion events. However, the number of ion collisions with the grid far outnumbered the number of fusion events, and the method proved ineffective. This led to a change in design in which the negative potential well is created by space charge of dense electrons trapped by magnetic fields and no grids are employed. This eliminates the problem of losses due to the grids, and replaces it with the problem of the rate at which electrons transport themselves across the magnetic fields and hit the walls of the magnets. Low energy electrons and ions are heated by incoming high energy electrons in microsecond time scales and become part of the circulating system. Fusion products escape to the system walls. This device is primed by using a quasi-spherical magnetic fields to trap energetic electrons to build up a spherical negative potential well.
Ions that drop over the edge of the well begin to accumulate in the middle, becoming focused at the spherical core and oscillate back and forth across the core, acting like a spherical colliding beam machine. The fuel gas input at the potential well edge is neutral ions that are ionized by the incoming electrons. As more ions are added, they form a quasi-central anode, that is slightly ion rich.
The fundamental problem in constructing this device is making a good quasi-spherical magnetic field in which no magnetic field lines intersect metal surfaces – which would
provide a viaduct to lose electrons. Early devices built in this program had nearly spherical magnetic fields but there were cusps where field lines leaked out to metal walls leading to electron loss. (See Figures 3.2-5 and 3.2-6 in color figures section).
In these systems electron loss phenomena are such that essentially NO metal surfaces can be allowed unshielded by magnetic fields, and no magnetic field lines can be allowed to intersect any such surfaces of the internal machine.
It is claimed that there is only one configuration that works, and that is the one that EMC2 patented. It is a configuration that is a polyhedron where the coils are all on the edges of the polyhedron, and the polyhedron has the property that there are an even number of faces around every vertex so that alternate faces are north, south, north, south, north, south.
It is claimed that the failings of small test devices were due to lack of funds: "We have always known how to make coil conductors that could work properly. These require triple layer shells and internal insulation, and very expensive and large-scale tooling, and can be used only in machines much larger than anything we could ever have afforded to build (i.e. 1.5 – 2 m radius and up). And, at these sizes, superconductors make better coils, anyway."
A number of test devices were built and tested during the past decade. Reference [H24] provides details. However, they were severely limited by lack of funding. That is why the last machine they tested, WB-6, was designed as an uncooled machine, with its magnets able to run only for a few seconds at high field, and why it had to be driven with almost uncontrollable big capacitors, to reach the e-drive currents that are needed (several hundred to a few thousand amps); which are not obtainable from available power supplies.
The group claims however that they "now know, finally, exactly how to build a net power machine and system" and that "when driven properly, [they] DO work, and that we actually do understand how they work, and thus can design and build larger ones that will work, as well."

80
The group claims that further small scale tests will provide limited progress, and only a full scale demo is worth doing at this point to achieve net power – at a cost of $ 200M over five years. This is a direct result of the physics and engineering design scaling laws that show that the fusion power output scales as a high power of the. Such extreme scaling means that building anything less than the full-scale size is of little value.
3.3 Extraction of 3He from Lunar Regolith Reference [H19] presents a broad picture of options for extraction of 3He from lunar regolith. This section is based mainly on Reference [H19].
3.3.1 3He Concentration in Regolith The energy of the solar wind particles is sufficient to implant them only a few meters into the surface. Measurements on Apollo samples indicate that finer grains with their high surface-to-volume ratios have higher concentrations of trapped particles. The fine regolith in the maria extends to an average depth of ~ 3 to 10 m and grains containing solar wind particles have been retrieved from core samples up to 2 m deep. Reference [H12] says "because the mare regolith samples collected to date show a high degree of homogeneity, it is assumed that these concentrations are consistent to at least a 3-m depth." This reference also says: "... further sampling would be required to provide a stronger basis for estimates of 3He concentration in specific sites on the lunar surface and at various depths in the mare regolith." It appears that regolith high in titanium content tends to have high helium content, presumably because ilmenite (FeTiO3) retains helium much better than other major lunar minerals. High titanium regoliths are mostly derived from maria basalts (see Figure 3.3-1). From an operational point of view, mining and processing maria regolith is relatively easier than dealing with rocks or the highland areas. Therefore, it is presumed that mining operations would be confined, at least initially to high-titanium mare regions. [H19]
Figure 3.3-1. Relationship between He content and TiO2 in lunar regolith [H10].
Reference [H19] analyzes Apollo data and shows that for typical mare soils the particles of size < 50 microns, which constitute only 47 wt% of the soil, yield ~75% of the He, and particles less than 100 microns, which constitute 63 wt% of the soil, contain ~86% of the He. In addition, they noted that the He content of the unsieved soil was ~30% higher than that obtained by the summation of the grain-size fractions. Apparently during the sieving process, nearly 30% of the He was lost as a result of either agitation of the particles or as fine particles that may have become airborne. If this beneficiation system were enclosed in a gas-tight chamber, as it might be on the lunar surface, then this lost He could be captured and accounted for in the inventory of the smallest grain size. Based upon these observations, they estimated that the soil should be beneficiated to retain particles < ~ 50 microns, which would constitute ~45 wt% of the soil, but yield ~80% of the He contained in the bulk soil. Alternatively, the regolith could be beneficiated to concentrate ilmenite particles, which constitute 10% to 30% of the regolith on Mare Tranquillitatis because selected samples containing high ilmenite fractions were reported to contain up to 180 ppm of He.45 If the ilmenite were distributed uniformly in the soil, it might be more efficient to separate the ilmenite fraction; however, the local
45 Typical total helium content is about 50 ppm, so this would be more than triple the normal content.
81
distribution of ilmenite is unknown. For this reason Reference [H19] assumed that beneficiation would retain the small particles of all mineral types.
Schmitt [H2] presents data that indicate 3He concentrations measured by Apollo ranged from typically 4 to 18 parts per billion (ppb) with a 4He/3He ratio ranging from 3360 to 4500. There is some evidence that crushing regolith releases some of the loosely held helium. Schmitt suggests mining to a depth of ~ 3 m and processing the ~ 50% of the regolith constituting fines (less than 100 micron particles) that have higher 3He concentrations. However, the vertical distribution of imbedded helium in the lunar regolith is not well understood. Schmitt claims that ~ 75 kg per year of 3He would be required by a putative fusion reactor generating 1 GW of power.
Zubrin [G5] assumed a concentration of 3He in the upper strata of lunar regolith of about 4 parts per billion (ppb) which seems to be overly conservative.
Reference [H19] indicates that the expected yield of 3He from titanium-rich mare sources when heated to 700°C is about 14 ppb based on original regolith, and about 31 ppb based on beneficiated regolith (45% of regolith for particle sizes < 50 microns). This seems to be a reasonable figure to adopt here.
3.3.2 Release of Solar Wind Imbedded Gases from Regolith According to [H19], qualitative mass spectrographic analyses of the gases evolved during continuous heating of the Apollo 11 soils indicated H2 and He evolution began at ~200°C and was nearly complete by 800°C; CO and N2 evolution began at ~600°C and continued to 1200°C; CO2 was evolved between 700°C and 1300°C; and H2S and SO2 evolution was initiated between 800°C and 900°C. See Figure 3.3-2 in color figures section.
Evolution of H2O and N2 below 200°C was attributed to adsorbed terrestrial impurities. These soils contain no H2O molecules; however, release of the embedded hydrogen atoms during heating apparently reduced some of the oxides yielding water that may
constitute ~5% of the H2 evolved above 200°C. The appearance of methane has not been confirmed but may constitute 5% of the total carbon. Condensation of the sulfur compounds SO2 and H2S from the evolved gas were observed to contaminate the vacuum system with resinous products that were difficult to remove. For this reason, the proposed maximum heating temperature for the mining scenario was limited to the range of 700°C to 750°C, so that the sulfur compounds would not vaporize. The fraction of 3He released on heating to 700°C was estimated to be 86%. This was estimated by [H19] to be about 14 ppb based on original regolith, and about 31 ppb based on beneficiated regolith, as stated previously.
3.3.3 Mining Strategies Three strategic options for lunar surface mining and processing of regolith were considered by [H19], namely:
(1) in situ volatilization of gases,
(2) open-pit mining with central plant processing, and
(3) mobile excavation-beneficiation-evolution followed by centralized volatile/isotopic separation.
In Situ Mining
In situ mining would extract embedded volatiles without excavating the regolith. This system would consist of a mobile vehicle and an apparatus to direct thermal radiation or microwave energy onto the surface of the regolith. The escaping gas molecules would be collected in an enclosed gas-tight hood and pumped to a storage receiver. However, [H19] showed that the rate of heat penetration through poorly conducting regolith makes the use of concentrated solar power impractical. Even if the temperature of the surface were maintained at a constant 1000°C, it would take ~ 5 hours to raise the temperature to 600°C at a depth of 1 cm. Penetration of heat can be enhanced by using microwave radiation. However, upon analysis, this also turns out to be very inefficient. Only the top layers of the regolith are heated sufficiently to release trapped volatiles and large amounts of energy are wasted on heating of the deeper regolith; consequently, the energy efficiency is
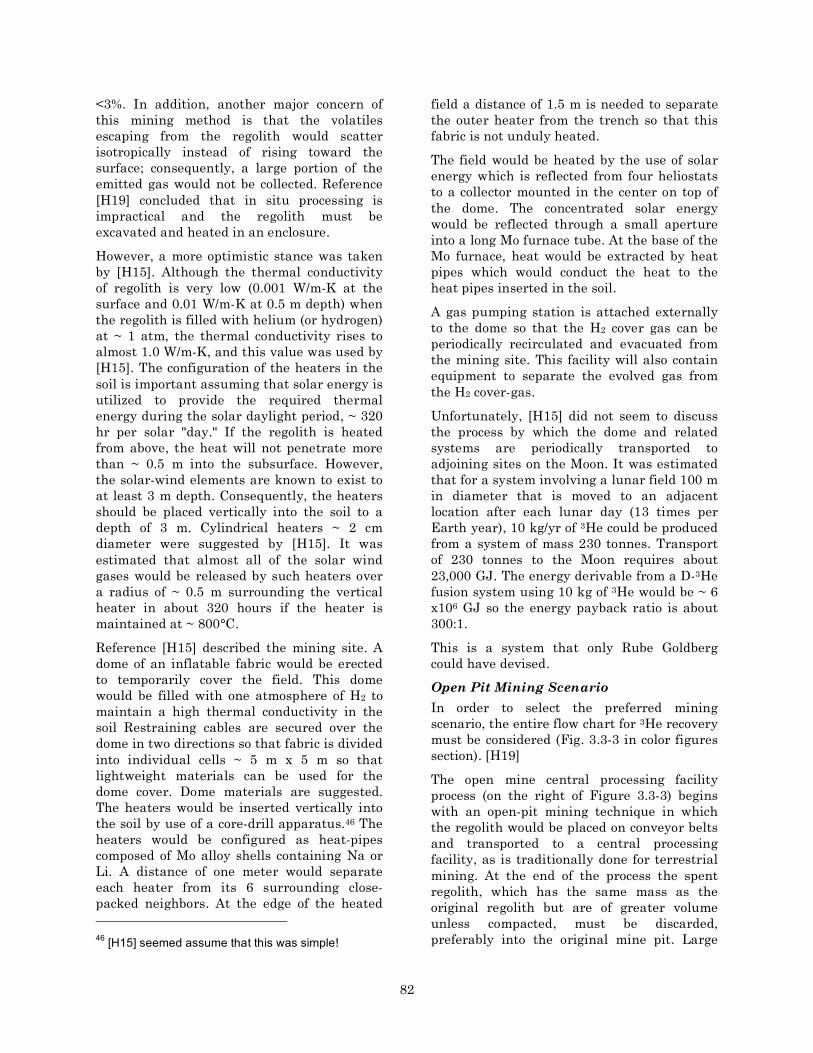
82
<3%. In addition, another major concern of this mining method is that the volatiles escaping from the regolith would scatter isotropically instead of rising toward the surface; consequently, a large portion of the emitted gas would not be collected. Reference [H19] concluded that in situ processing is impractical and the regolith must be excavated and heated in an enclosure.
However, a more optimistic stance was taken by [H15]. Although the thermal conductivity of regolith is very low (0.001 W/m-K at the surface and 0.01 W/m-K at 0.5 m depth) when the regolith is filled with helium (or hydrogen) at ~ 1 atm, the thermal conductivity rises to almost 1.0 W/m-K, and this value was used by [H15]. The configuration of the heaters in the soil is important assuming that solar energy is utilized to provide the required thermal energy during the solar daylight period, ~ 320 hr per solar "day." If the regolith is heated from above, the heat will not penetrate more than ~ 0.5 m into the subsurface. However, the solar-wind elements are known to exist to at least 3 m depth. Consequently, the heaters should be placed vertically into the soil to a depth of 3 m. Cylindrical heaters ~ 2 cm diameter were suggested by [H15]. It was estimated that almost all of the solar wind gases would be released by such heaters over a radius of ~ 0.5 m surrounding the vertical heater in about 320 hours if the heater is maintained at ~ 800°C.
Reference [H15] described the mining site. A dome of an inflatable fabric would be erected to temporarily cover the field. This dome would be filled with one atmosphere of H2 to maintain a high thermal conductivity in the soil Restraining cables are secured over the dome in two directions so that fabric is divided into individual cells ~ 5 m x 5 m so that lightweight materials can be used for the dome cover. Dome materials are suggested. The heaters would be inserted vertically into the soil by use of a core-drill apparatus.46 The heaters would be configured as heat-pipes composed of Mo alloy shells containing Na or Li. A distance of one meter would separate each heater from its 6 surrounding close-packed neighbors. At the edge of the heated 46 [H15] seemed assume that this was simple!
field a distance of 1.5 m is needed to separate the outer heater from the trench so that this fabric is not unduly heated.
The field would be heated by the use of solar energy which is reflected from four heliostats to a collector mounted in the center on top of the dome. The concentrated solar energy would be reflected through a small aperture into a long Mo furnace tube. At the base of the Mo furnace, heat would be extracted by heat pipes which would conduct the heat to the heat pipes inserted in the soil.
A gas pumping station is attached externally to the dome so that the H2 cover gas can be periodically recirculated and evacuated from the mining site. This facility will also contain equipment to separate the evolved gas from the H2 cover-gas.
Unfortunately, [H15] did not seem to discuss the process by which the dome and related systems are periodically transported to adjoining sites on the Moon. It was estimated that for a system involving a lunar field 100 m in diameter that is moved to an adjacent location after each lunar day (13 times per Earth year), 10 kg/yr of 3He could be produced from a system of mass 230 tonnes. Transport of 230 tonnes to the Moon requires about 23,000 GJ. The energy derivable from a D-3He fusion system using 10 kg of 3He would be ~ 6 x10⁶ GJ so the energy payback ratio is about 300:1.
This is a system that only Rube Goldberg could have devised.
Open Pit Mining Scenario
In order to select the preferred mining scenario, the entire flow chart for 3He recovery must be considered (Fig. 3.3-3 in color figures section). [H19]
The open mine central processing facility process (on the right of Figure 3.3-3) begins with an open-pit mining technique in which the regolith would be placed on conveyor belts and transported to a central processing facility, as is traditionally done for terrestrial mining. At the end of the process the spent regolith, which has the same mass as the original regolith but are of greater volume unless compacted, must be discarded, preferably into the original mine pit. Large
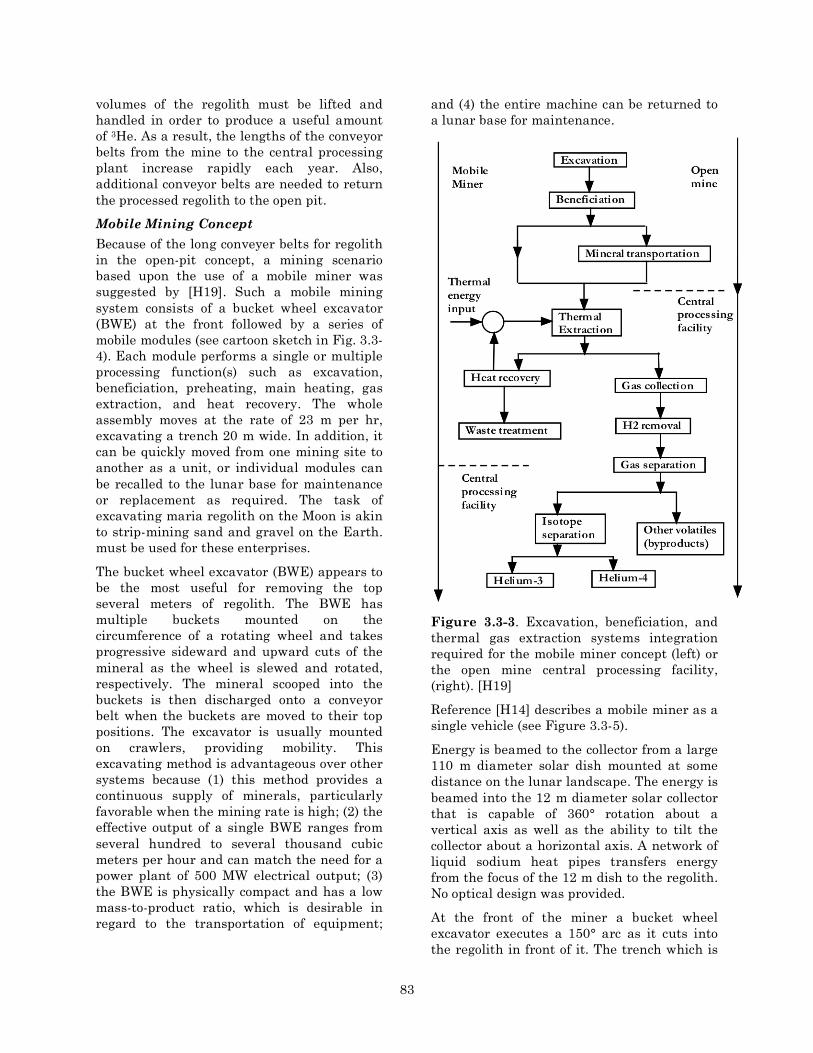
83
volumes of the regolith must be lifted and handled in order to produce a useful amount of 3He. As a result, the lengths of the conveyor belts from the mine to the central processing plant increase rapidly each year. Also, additional conveyor belts are needed to return the processed regolith to the open pit.
Mobile Mining Concept
Because of the long conveyer belts for regolith in the open-pit concept, a mining scenario based upon the use of a mobile miner was suggested by [H19]. Such a mobile mining system consists of a bucket wheel excavator (BWE) at the front followed by a series of mobile modules (see cartoon sketch in Fig. 3.3-4). Each module performs a single or multiple processing function(s) such as excavation, beneficiation, preheating, main heating, gas extraction, and heat recovery. The whole assembly moves at the rate of 23 m per hr, excavating a trench 20 m wide. In addition, it can be quickly moved from one mining site to another as a unit, or individual modules can be recalled to the lunar base for maintenance or replacement as required. The task of excavating maria regolith on the Moon is akin to strip-mining sand and gravel on the Earth. must be used for these enterprises.
The bucket wheel excavator (BWE) appears to be the most useful for removing the top several meters of regolith. The BWE has multiple buckets mounted on the circumference of a rotating wheel and takes progressive sideward and upward cuts of the mineral as the wheel is slewed and rotated, respectively. The mineral scooped into the buckets is then discharged onto a conveyor belt when the buckets are moved to their top positions. The excavator is usually mounted on crawlers, providing mobility. This excavating method is advantageous over other systems because (1) this method provides a continuous supply of minerals, particularly favorable when the mining rate is high; (2) the effective output of a single BWE ranges from several hundred to several thousand cubic meters per hour and can match the need for a power plant of 500 MW electrical output; (3) the BWE is physically compact and has a low mass-to-product ratio, which is desirable in regard to the transportation of equipment;
and (4) the entire machine can be returned to a lunar base for maintenance.
Figure 3.3-3. Excavation, beneficiation, and thermal gas extraction systems integration required for the mobile miner concept (left) or the open mine central processing facility, (right). [H19]
Reference [H14] describes a mobile miner as a single vehicle (see Figure 3.3-5).
Energy is beamed to the collector from a large 110 m diameter solar dish mounted at some distance on the lunar landscape. The energy is beamed into the 12 m diameter solar collector that is capable of 360° rotation about a vertical axis as well as the ability to tilt the collector about a horizontal axis. A network of liquid sodium heat pipes transfers energy from the focus of the 12 m dish to the regolith. No optical design was provided.
At the front of the miner a bucket wheel excavator executes a 150° arc as it cuts into the regolith in front of it. The trench which is
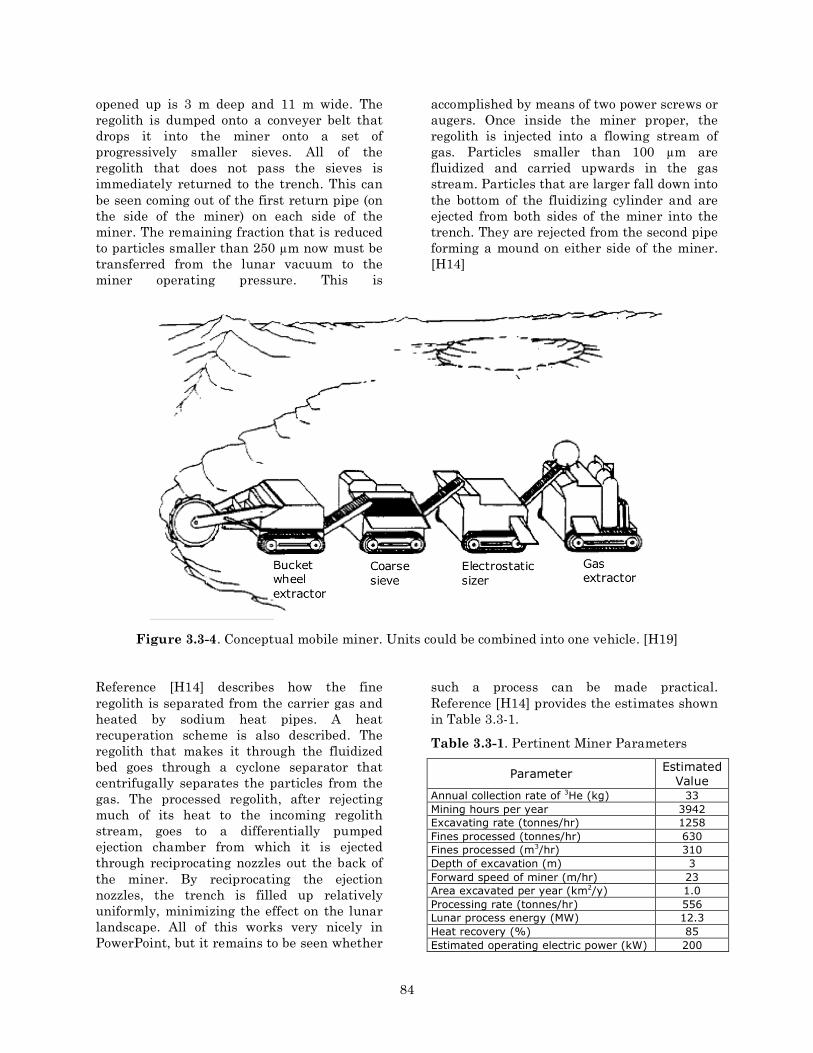
84
opened up is 3 m deep and 11 m wide. The regolith is dumped onto a conveyer belt that drops it into the miner onto a set of progressively smaller sieves. All of the regolith that does not pass the sieves is immediately returned to the trench. This can be seen coming out of the first return pipe (on the side of the miner) on each side of the miner. The remaining fraction that is reduced to particles smaller than 250 µm now must be transferred from the lunar vacuum to the miner operating pressure. This is
accomplished by means of two power screws or augers. Once inside the miner proper, the regolith is injected into a flowing stream of gas. Particles smaller than 100 µm are fluidized and carried upwards in the gas stream. Particles that are larger fall down into the bottom of the fluidizing cylinder and are ejected from both sides of the miner into the trench. They are rejected from the second pipe forming a mound on either side of the miner. [H14]
Figure 3.3-4. Conceptual mobile miner. Units could be combined into one vehicle. [H19]
Reference [H14] describes how the fine regolith is separated from the carrier gas and heated by sodium heat pipes. A heat recuperation scheme is also described. The regolith that makes it through the fluidized bed goes through a cyclone separator that centrifugally separates the particles from the gas. The processed regolith, after rejecting much of its heat to the incoming regolith stream, goes to a differentially pumped ejection chamber from which it is ejected through reciprocating nozzles out the back of the miner. By reciprocating the ejection nozzles, the trench is filled up relatively uniformly, minimizing the effect on the lunar landscape. All of this works very nicely in PowerPoint, but it remains to be seen whether
such a process can be made practical. Reference [H14] provides the estimates shown in Table 3.3-1.
Table 3.3-1. Pertinent Miner Parameters
Parameter Estimated Value
Annual collection rate of 3He (kg) 33 Mining hours per year 3942 Excavating rate (tonnes/hr) 1258 Fines processed (tonnes/hr) 630 Fines processed (m3/hr) 310 Depth of excavation (m) 3 Forward speed of miner (m/hr) 23 Area excavated per year (km2/y) 1.0 Processing rate (tonnes/hr) 556 Lunar process energy (MW) 12.3 Heat recovery (%) 85 Estimated operating electric power (kW) 200
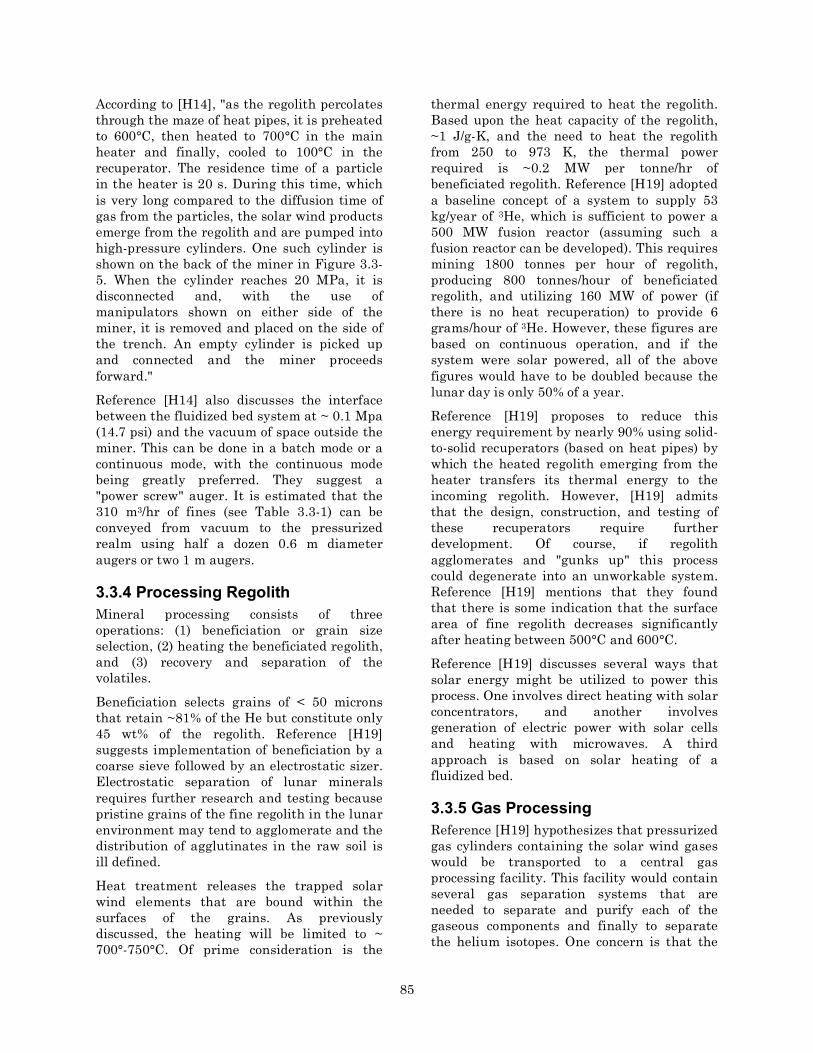
85
According to [H14], "as the regolith percolates through the maze of heat pipes, it is preheated to 600°C, then heated to 700°C in the main heater and finally, cooled to 100°C in the recuperator. The residence time of a particle in the heater is 20 s. During this time, which is very long compared to the diffusion time of gas from the particles, the solar wind products emerge from the regolith and are pumped into high-pressure cylinders. One such cylinder is shown on the back of the miner in Figure 3.3-5. When the cylinder reaches 20 MPa, it is disconnected and, with the use of manipulators shown on either side of the miner, it is removed and placed on the side of the trench. An empty cylinder is picked up and connected and the miner proceeds forward."
Reference [H14] also discusses the interface between the fluidized bed system at ~ 0.1 Mpa (14.7 psi) and the vacuum of space outside the miner. This can be done in a batch mode or a continuous mode, with the continuous mode being greatly preferred. They suggest a "power screw" auger. It is estimated that the 310 m3/hr of fines (see Table 3.3-1) can be conveyed from vacuum to the pressurized realm using half a dozen 0.6 m diameter augers or two 1 m augers.
3.3.4 Processing Regolith Mineral processing consists of three operations: (1) beneficiation or grain size selection, (2) heating the beneficiated regolith, and (3) recovery and separation of the volatiles.
Beneficiation selects grains of < 50 microns that retain ~81% of the He but constitute only 45 wt% of the regolith. Reference [H19] suggests implementation of beneficiation by a coarse sieve followed by an electrostatic sizer. Electrostatic separation of lunar minerals requires further research and testing because pristine grains of the fine regolith in the lunar environment may tend to agglomerate and the distribution of agglutinates in the raw soil is ill defined.
Heat treatment releases the trapped solar wind elements that are bound within the surfaces of the grains. As previously discussed, the heating will be limited to ~ 700°-750°C. Of prime consideration is the
thermal energy required to heat the regolith. Based upon the heat capacity of the regolith, ~1 J/g-K, and the need to heat the regolith from 250 to 973 K, the thermal power required is ~0.2 MW per tonne/hr of beneficiated regolith. Reference [H19] adopted a baseline concept of a system to supply 53 kg/year of 3He, which is sufficient to power a 500 MW fusion reactor (assuming such a fusion reactor can be developed). This requires mining 1800 tonnes per hour of regolith, producing 800 tonnes/hour of beneficiated regolith, and utilizing 160 MW of power (if there is no heat recuperation) to provide 6 grams/hour of 3He. However, these figures are based on continuous operation, and if the system were solar powered, all of the above figures would have to be doubled because the lunar day is only 50% of a year.
Reference [H19] proposes to reduce this energy requirement by nearly 90% using solid-to-solid recuperators (based on heat pipes) by which the heated regolith emerging from the heater transfers its thermal energy to the incoming regolith. However, [H19] admits that the design, construction, and testing of these recuperators require further development. Of course, if regolith agglomerates and "gunks up" this process could degenerate into an unworkable system. Reference [H19] mentions that they found that there is some indication that the surface area of fine regolith decreases significantly after heating between 500°C and 600°C.
Reference [H19] discusses several ways that solar energy might be utilized to power this process. One involves direct heating with solar concentrators, and another involves generation of electric power with solar cells and heating with microwaves. A third approach is based on solar heating of a fluidized bed.
3.3.5 Gas Processing Reference [H19] hypothesizes that pressurized gas cylinders containing the solar wind gases would be transported to a central gas processing facility. This facility would contain several gas separation systems that are needed to separate and purify each of the gaseous components and finally to separate the helium isotopes. One concern is that the
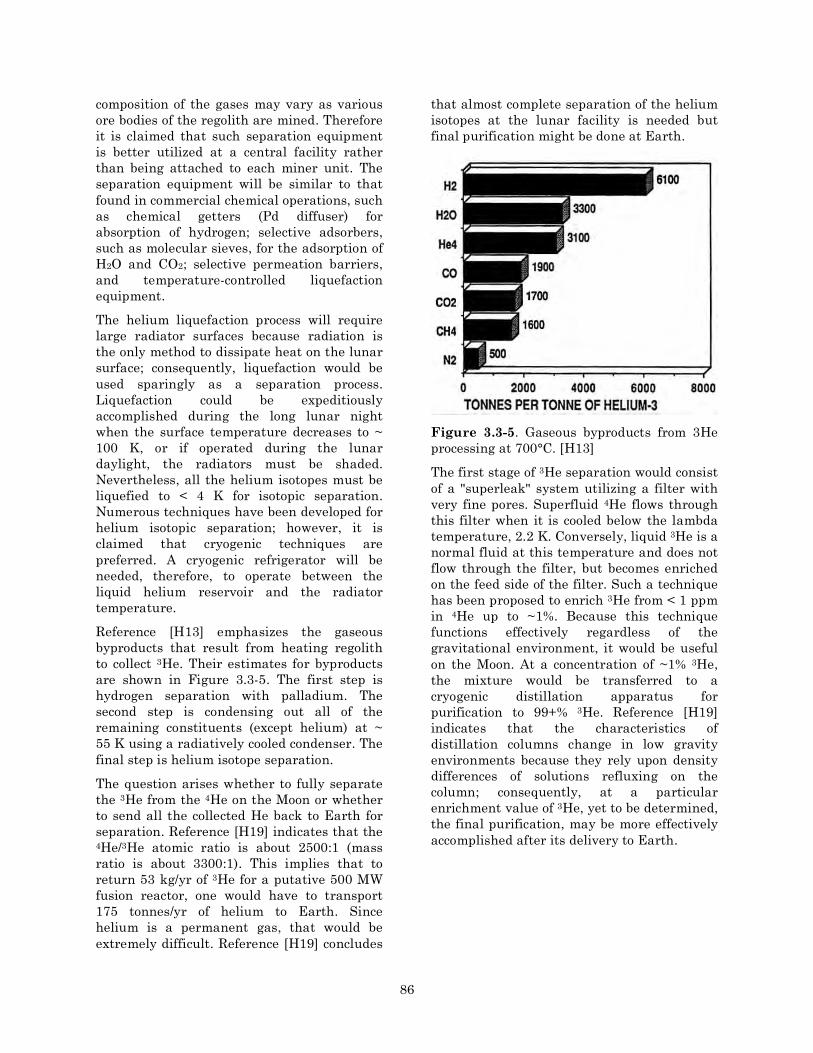
86
composition of the gases may vary as various ore bodies of the regolith are mined. Therefore it is claimed that such separation equipment is better utilized at a central facility rather than being attached to each miner unit. The separation equipment will be similar to that found in commercial chemical operations, such as chemical getters (Pd diffuser) for absorption of hydrogen; selective adsorbers, such as molecular sieves, for the adsorption of H2O and CO2; selective permeation barriers, and temperature-controlled liquefaction equipment.
The helium liquefaction process will require large radiator surfaces because radiation is the only method to dissipate heat on the lunar surface; consequently, liquefaction would be used sparingly as a separation process. Liquefaction could be expeditiously accomplished during the long lunar night when the surface temperature decreases to ~ 100 K, or if operated during the lunar daylight, the radiators must be shaded. Nevertheless, all the helium isotopes must be liquefied to < 4 K for isotopic separation. Numerous techniques have been developed for helium isotopic separation; however, it is claimed that cryogenic techniques are preferred. A cryogenic refrigerator will be needed, therefore, to operate between the liquid helium reservoir and the radiator temperature.
Reference [H13] emphasizes the gaseous byproducts that result from heating regolith to collect 3He. Their estimates for byproducts are shown in Figure 3.3-5. The first step is hydrogen separation with palladium. The second step is condensing out all of the remaining constituents (except helium) at ~ 55 K using a radiatively cooled condenser. The final step is helium isotope separation.
The question arises whether to fully separate the 3He from the 4He on the Moon or whether to send all the collected He back to Earth for separation. Reference [H19] indicates that the 4He/3He atomic ratio is about 2500:1 (mass ratio is about 3300:1). This implies that to return 53 kg/yr of 3He for a putative 500 MW fusion reactor, one would have to transport 175 tonnes/yr of helium to Earth. Since helium is a permanent gas, that would be extremely difficult. Reference [H19] concludes
that almost complete separation of the helium isotopes at the lunar facility is needed but final purification might be done at Earth.
Figure 3.3-5. Gaseous byproducts from 3He processing at 700°C. [H13]
The first stage of 3He separation would consist of a "superleak" system utilizing a filter with very fine pores. Superfluid 4He flows through this filter when it is cooled below the lambda temperature, 2.2 K. Conversely, liquid 3He is a normal fluid at this temperature and does not flow through the filter, but becomes enriched on the feed side of the filter. Such a technique has been proposed to enrich 3He from < 1 ppm in 4He up to ~1%. Because this technique functions effectively regardless of the gravitational environment, it would be useful on the Moon. At a concentration of ~1% 3He, the mixture would be transferred to a cryogenic distillation apparatus for purification to 99+% 3He. Reference [H19] indicates that the characteristics of distillation columns change in low gravity environments because they rely upon density differences of solutions refluxing on the column; consequently, at a particular enrichment value of 3He, yet to be determined, the final purification, may be more effectively accomplished after its delivery to Earth.

87
3.3.6 Mass and Energy Requirements All the following were taken from [H13]:
There are five main areas where major energy investments are required to procure 3He
• Transportation - Carrying all the equipment needed to mine, separate, and store the 3He.
• Incremental Base Camp Supply - Life support and living quarters for the personnel responsible for the maintenance of the mining equipment.
• Mobile Miner - Power to transport, extract. and compress lunar volatiles.
• Radiator/Condenser - Condensation of water, nitrogen and carbonaceous gases. and
• Isotopic Separator - Separation of 3He from 4He (at a ~3100-to-1 4He/3He ratio); it is not energetically favorable to do isotopic separation on the Earth).
The amount of equipment mass required to produce a tonne of 3He per year was calculated by [H13] as shown in Table 3.3-2.
Table 3.3-2. Mass of system elements per tonne of 3He per year returned to Earth. [H13]
System Element Mass (tonnes) Mobile Miner 27 Incremental base camp 13 Solar mirrors 12 Radiator/Condenser 9 Isotope Separator 4 3He transporter 1 Total Mass 66
The crew of ten is rotated once per year. Reference [H13] says that the life of all components on the Moon is 20 years. However, this reference also says that over 20 years, more than 1300 tonnes would have to be brought to the Moon would be 20 x 66 ~ 1300 tonnes. But if the equipment lasts 20 years, it doesn't seem logical that it must be replenished every year so the logic of this is difficult to comprehend.
The energy required to transport mass from the Earth to the Moon using current space transportation technology was estimated by [H13] to be approximately 100 GJ per kg delivered to the Moon. However, Reference
[H13] projects that this may be reduced in the future to 30 GJ/kg although no basis for this claim is provided.
An important number to consider is the energy payback to obtain a kg of 3He on Earth. Ignoring the energy investment in a ground support crew, the construction of a fusion reactor, and not taking credit for the use of the byproduct lunar volatiles, [H13] claims that a total investment of ~ 2250 GJ47 is needed for space transportation per kg of 3He. The energy requirement to deliver the mining system to the Moon is obtained by multiplying the transportation figure 30 GJ/kg by the ratio of 66:1 from Table 3.3-1 (30 x 66 = 1980 GJ/kg). The energy requirement to deliver the round-trip vehicle to the Moon is not included in this. it is not clear how [H13] arrived at 2250 GJ/kg. Nor is it clear how the figure 1,750 GJ/kg was derived. As before, the logic of all this is difficult to comprehend. If the lifetime of the equipment is the stated 20 years, why must the full 66 kg be replenished every year? It would seem logical that the energy requirement is 6600/20 = 330 GJ per kg of 3He (assuming the 100 GJ figure rather than 30 GJ to deliver 1 kg to the Moon), although this would have to be increased by about 20% to account for yearly crew transfers and replenishment of life support and the round-trip vehicle must also be accounted for. Regardless of the details, when this is compared to the energy theoretically obtainable from 3He fusion with 1 kg of 3He in a 3He-D fusion machine (600,000 GJ) the energy payback ratio is several hundred.
It was therefore concluded that, given the potential inventory of 3He on the surface of the Moon, it should be energetically favorable to extract this fuel for the benefit of mankind on Earth and in space.
3.3.7 System issues Reference [H19] recommends a mobile mining scheme using a bucket-wheel excavator for excavating the regolith, several mechanical and electrostatic separators for beneficiation of the regolith, a fast-moving fluidized bed
47 However, in another paragraph of [H13] this figure is cited to be 1,750 GJ/kg.

88
reactor to heat the particles, and a centralized 3He separation process for evolved solar wind gases. For larger scale production of 3He they recommend the utilization of multiple-miners rather than increasing their size. Multiple miners permit operations at more sites and provide redundancy in case of equipment failure.
Reference [H12] discusses advantages and disadvantages of each mining concept. These are reproduced below.
Advantages of the Mobile Miner
• Minimal alteration of lunar surface.
• High degree of automation possible.
• No tear-down/set-up requirements for mining different areas far from central base.
• Multiple miners can cover a very large surface area - can expand with increasing demand.
• Operates fairly independently of other lunar base operations.
• Has a lower mass per kg of 3He obtained than centralized concept.
Disadvantages of the Mobile Miner
• Predicted 3He demands would require over 100 mobile miner systems by the year 2050.
• Limitation to sue of solar energy limits operation to only during the lunar day, which reduces potential 3He production rates.
• Because maintenance of several mobile miners, some many kilometers from the central base, is very resource intensive, systems within the miner, must have minimal complexity (or maximum reliability).
Advantages of Centralized Mining
• Much of the required hardware could be utilized by a lunar base for oxygen production and other mining activities.
• Because the solar wind gas extraction system in the centralized concept is in one central location, a nuclear reactor could be used to deliver required thermal power,
enabling gas extraction to occur in the lunar day and night. .
• Since many of the gas removal/collection systems are centrally located, servicing/ maintenance is less costly than in mobile systems and may be designed with higher levels of complexity using SOA technologies.
Disadvantages of Centralized Mining
• Has a higher yield than mobile.
• Moving the mining operation to another location would be very resource intensive.
• Because more systems are located in the central facility than with the mobile miner, there will be more significant impacts on the lunar base infrastructure.
• Since large quantities of regolith need to be delivered to the central for processing, problems of accumulation of processed regolith stockpiles may arise.
Reference [H12] also discusses the overlap between mining 3He and other aspects of establishing a lunar base.
3.3.8 Providing 3He for Near-Term Research Aside from the long-term question of providing adequate 3He to fuel putative future fusion reactors, there is also a need in the short term for supplies of 3He for near-term test reactors. Reference [H4] says that the answer lies within the terrestrial resources of 3He. Unfortunately, most of the primordial 3He present in the Earth at its creation has long since diffused from the Earth and has been lost through the atmosphere to outer space. What is left in any retrievable form is contained in the underground natural gas reserves. Underground U. S. strategic He storage caverns contain some 30 kg of 3He. If one were to process the entire U.S. resources of natural gas, another 200 kg might be obtained, but the cost and side effects of such a project make it very unlikely that this could be accomplished. Another potential source of 3He on Earth is from the decay of tritium (t1/2
= 12.3 yr). When T decays, it produces a 3He atom and a β particle. Reference [H4] claimed in 1992 that the inventory of tritium in U. S.

89
thermonuclear weapons show that if the 3He were collected, some 300 kg would be available by the year 2000, and that presumably about the same amount of 3He would be available from the Russian weapons stockpile. The equilibrium production of 3He (assuming no future change in weapons stockpiles) is around 15 kg per year in each country. It may seem strange to rely on a by-product from weapons for a civilian application, but 3He is commercially available today from just such a process. One can purchase up to 1.38 kg of 3He per year directly from the U.S. government (10,000 liters at STP), all of which comes from T decay. Reference [H4] suggests an "equilibrium" 3He production rate of 10 to 20 kg/yr.
One could also obtain smaller amounts of 3He from the T produced in the heavy water coolants of Canadian CANDU reactors [H4]. This could be generated at a rate of ~2 kg per year thereafter. It is claimed that 1 kg of 3He, when burned with 0.67 kg of D, produces approximately 19 MW-yr of energy. With several hundred kilograms of 3He at our disposal, the potential exists for several thousand MW-yr of power production in demonstration plants. This could be done without ever having to leave the Earth for fuel.
3.4 Conclusions Regarding Mining 3He on the Moon for Fusion The proposal to extract 3He on the Moon for use in fusion reactors on Earth can only be judged in the context of fusion energy in general. The most easily confined fusion reaction is that between D and T. The United States has expended about $18B over five decades, mainly utilizing magnetic confinement, and has increased the critical confinement triple product (P) by a large factor, although it still remains below that necessary for ignition (a self-sustaining fusion process). Further development might raise this to the point where ignition occurs. The Europeans seem more optimistic on this point, while the U. S. has denigrated its program by redefining it as basic science rather than engineering development. This issue lies within the jurisdiction of the U. S. Department of Energy, not NASA.
The pro-3He group argues that D-T fusion has severe environmental problems due to the fact that most of the energy generated by the fusion reaction ends up in the product neutrons that are difficult to contain and produce radioactivity in their surroundings. The need to breed tritium is another problem. The high velocity neutrons impose massive shielding requirements, produce radiation damage and are a source of undesired activation of the reactor structure. To generate tritium, a highly complex breeding blanket must surround the reactor core. Nevertheless, D–T advocates point out the many difficulties in using fusion fuels dependent on 3He. For the first generation of fusion reactors, the fuel will certainly be D–T, and it is claimed (by advocates) that the neutron problems will be tackled by using low activation structural materials, presently under development. However, one must agree with Kulcinski and Schmitt that IF 3He could be economically extracted and brought to the Earth, and IF suitable fusion reactors can be developed and operated at the very stringent conditions required, our energy needs would be satisfied for perhaps a thousand years or more. Clearly, 3He-3He based fusion would be the ideal energy source for the future of the world. But those are both huge IFs. If it is deemed worthwhile to pursue extraction of 3He on the Moon, then not only DOE but also NASA will play an important role.
To complicate matters, there are other groups that argue that the Tokamaks have been developed about as far as they can go, and there is little hope of reaching ignition with this form of containment. Confinement by laser impact on a pellet is one possibility. Inertial electrostatic confinement also has ardent advocates.
The strategic questions that we face include:
• Should the main bulk of fusion research be addressing the D-T reaction (as it presently is) or should it shift over to 3He–3He based fusion? While confinement in D-T fusion reactors will be much easier to achieve, they will suffer inherently from radioactive waste problems. This may prevent this technology from ever becoming practical. On the other hand, it is not clear that 3He can be economically

90
acquired from the Moon, and developing a workable reactor for 3He-3He based fusion will be far more difficult to achieve than D–T fusion.
• Should we continue to invest mainly in magnetic confinement schemes, or should emphasis shift to other approaches such as electrostatic confinement?
• Strategically, it is not clear whether the U. S. approach of developing fundamental supporting science, or the European approach of pursuing engineering design of fusion reactors, is the best approach to advance fusion technology.
• What is an appropriate funding level for fusion technology, considering that if a practical fusion reactor can be developed, this could, in one fell swoop, solve the world's energy problems for many years? By contrast, terrestrial solar energy appears very limited and the "hydrogen economy" has been described (properly) as a hoax.48
The above four questions are complex and multi-dimensional. No simple obvious answers jump out immediately. Further review and analysis is needed. Unfortunately, most of the experts in this field are already committed to one point of view, typically that supports their "rice bowls." Bland reviews such as have been conducted by blue ribbon committees, seem to be more concerned with avoiding controversy, and rarely come up with cogent strategies based on deep understanding of the issues. But the energy challenges that we face over the next decades are so potentially severe that it would be height of folly not to devote the effort to weigh the probabilities, uncertain as they may be, and decide on a strategy to maximize chances of success regardless of which ox is gored.
48 "The Hydrogen Hoax," Robert Zubrin, The New Atlantis Winter, 2007.

91
4. Utilization of Lunar Resources to Enhance Space Missions
4.1 Introduction In situ resource utilization (ISRU) is a concept for increasing the efficiency of space missions by utilizing indigenous resources on a planet or moon in order to reduce the amount of materiel that must be brought from Earth. If the savings resulting from reduction of resources brought from Earth outweigh the cost of prospecting, developing, testing, validating in situ, and implementing ISRU in missions, it follows that ISRU will have a favorable benefit/cost ratio.
Over the past 3 or 4 decades, there has evolved a community of enthusiasts advocating the development of in situ resource utilization (ISRU) on the Moon (as well as Mars and to a lesser degree, asteroids) to produce products that would then not have to be brought from Earth. Most of the lunar concepts were concerned with extraction of oxygen from lunar regolith, but some have envisaged a longer term goal of extracting metals, producing silicon solar cells, and introducing the industrial and electronic revolutions to the Moon. More recently, with the tentative identification of hydrogen near the poles, the possibility of extracting water on the Moon has also been discussed. Most of this work has been done on paper, although some limited experiments were conducted.
In late 2004, prior to Mr. Griffin coming aboard NASA, the Exploration Systems arm of NASA attempted to prepare a roadmap for exploration by appointing a number of teams to produce roadmaps for developing capabilities and strategic mission planning in several chosen areas. One of the capability teams (ISRU Capability Roadmap Team) was assigned the technology area of ISRU.
The ISRU Capability Roadmap Team developed a notional architecture [I2] that included:
• 9 robotic ISRU missions to the Moon prior to 2022 • 4 human ISRU missions to the Moon prior to 2022 • 5 robotic ISRU missions to Mars prior to 2022 including 3 prior to 2014 • Polar lunar ISRU demonstrated in 2010 even without in situ prospecting!
• Lunar O2 extraction demonstrated in 2011 with no defined process • Demonstration of in situ production of solar cells and utilization on the Moon by 2013 • Water acquisition on Mars in 2013 with no in situ prospecting • ISRU robotic hopper demonstrated on Mars 2018 • Full scale O2 plant on Moon 2018 • Fabrication and construction on Moon in 2020 • ISRU sample return from Mars 2022 • Phobos ISRU 2025 • Metal/Si extraction on Mars 2025 • Deep drill for water on Mars 2028
These plans for implementing ISRU were excessive compared to any credible rate of progress. Nevertheless, this led to establishment by NASA in 2006 of a multi-year program led by JSC to develop lunar ISRU, with funding at ~ $80M.
While some ISRU advocates seem to take it on faith that the benefit/cost ratio is always favorable for ISRU, analysis indicates that this is not always so. Whereas a stronger case can be made for use of ISRU on human missions to Mars, the case for lunar ISRU in the current ESAS architecture does not stand up well to scrutiny. Nevertheless, the belief in the virtues of ISRU has been proclaimed so many times by NASA that in an Orwellian sense, it appears to be widely accepted – at least within a certain community. The recent NASA exploration architecture analysis for lunar exploration (popularly known as the "ESAS Report") mentions the term "ISRU" 110 times. The ESAS Report [G7] repeats the standard mantra:
"ISRU: Technologies for 'living off the land' are needed to support a long-term strategy for human exploration." (p. 89 of [G7])
However, NASA's approach to lunar mission analysis and its connection to ISRU is often disjointed. For example, the ESAS Report says: "The lander’s ascent stage uses LOX/methane propulsion to carry the crew back into lunar orbit to rendezvous with the waiting CEV. The lander’s propulsion system is chosen to make it compatible with ISRU-produced propellants and common with the CEV SM propulsion system." (p.27 of [G7])
92
However a later modification of the architecture eliminated use of oxygen propellants for ascent, making the architecture incompatible with ISRU.
If NASA does not develop an oxygen-based ascent propulsion system then lunar ISRU would be moot.
According to the JSC ISRU Technology Development Plan: "the key to fulfilling the goal of sustained and affordable human and robotic exploration will be the ability to use resources that are available at the site of exploration to 'live off the land' instead of bringing everything from Earth, known as In-Situ Resource Utilization (ISRU)." [I1]
Another related NASA document (ISRU Capability Roadmap Team Report [I2]) says:
"Four major areas of ISRU that have been shown to have great benefits to future robotic and human exploration architectures are:
• Mission consumable production (propellants, fuel cell reagents, life support consumables, and feedstock for manufacturing and construction)
• Surface construction (radiation shields, landing pads, walls, habitats, etc.)
• Manufacturing and repair with in-situ resources (spare parts, wires, trusses, integrated systems etc.)
• Space utilities and power from space resources.
Numerous studies have shown that producing propellants in-situ can significantly reduce mission mass and cost, and also enable new mission capabilities, such as permanent manned presence and surface hoppers."
Unfortunately, no references are given to the "numerous studies" and "great benefits" referred to in these quotations are speculative. Studies conducted by this writer lead to diametrically opposite conclusions – at least for lunar ISRU.
4.2 Potential Products of ISRU Most discussions of lunar ISRU seem to assume that resources are readily available, and they proceed to emphasize processing, while minimizing logistics (excavating,
regolith transport, deposition and removal of regolith from reactor, dumping waste regolith, etc.) and side-stepping prospecting (locating resources, validating existence and accessibility, and determining requirements for excavation and utilization). However, the quantity and composition of end products provides the entire basis for value added by ISRU, as well as for setting the requirements for ISRU systems. Therefore, we begin here with the potential end products.
4.2.1 Ascent Propellants In the initial NASA ESAS architecture, the propulsion system for ascent from the Moon was based on CH4 + O2 propellants in order that ISRU-generated oxygen from the Moon could be utilized. Although methane had to be brought from Earth, it provided an implicit connection to future Mars ISRU that is likely to be based on CH4 + O2. Later, when the realities of cost and schedule to develop CH4 + O2 propulsion systems became clearer, this ascent propulsion system was dropped in favor of space-storable hypergolic propellants (NTO/MMH) that are incompatible with lunar ISRU. However, the entire architecture is being re-engineered. If the final architecture returns to use of oxygen as an ascent propellant, that oxygen can potentially be provided by lunar ISRU. In the original architecture, the plan was to have two ascents per year from the outpost, each requiring about 4 metric tons (tonnes) of oxygen as oxidizer, for an annual need of roughly 8 tonnes of oxygen. It is not clear what fuel would be used in conjunction with the oxygen. If it is methane, it will have to be brought from Earth. If it is hydrogen, it could conceivably be produced from putative polar ice (but not from equatorial regolith).
Since the "gear ratio" (mass in LEO)/(payload mass delivered to lunar surface) for polar outposts is about 4:1, the potential mass saving in LEO is ~ 16 tonnes per launch based on 4 tonnes saved on the lunar surface. However, because the launch vehicles are designed without ISRU, they will remain unaffected by ISRU. Hence the benefit of ISRU will be an ability to deliver extra cargo payloads (~ 4 tonnes) to the lunar polar outpost with each launch (but rather late in the campaign – probably beginning in the late

93
2020s). Even this minor benefit disappears if NASA persists in its present plan to use space storable propellants (NTO/MMH) for ascent, thus eliminating oxygen as an ascent propellant. The "value" of the ~ 4 tonnes increase in payload delivery per launch using ISRU can be estimated because over a period of years, with continual cargo deliveries to the outpost, an entire cargo delivery launch every few years might be replaced by small incremental increases in each launch along the way.
In addition, if NASA insists on an "abort-to-orbit" capability during descent, then ascent propellants will have to be available in lunar orbit prior to descent and the applicability of ISRU to ascent propellants becomes moot.
4.2.2 Life Support Consumables Oxygen requirements for life support depend on crew activity but an average value is about 1 kg per crew-member (CM) per day.49
Water requirements for life support have been estimated by JSC to be about 27.5 kg/CM-day.
To support a crew of 4 during one year, we therefore require 4 × 1 × 365 = 1460 kg ~ 1.5 tonnes of O2, and 4 × 27.5 × 365 kg ~ 40 tonnes of water.
It is likely that an Environmental Control and Life Support System (ECLSS) will be used to recycle these resources, thus greatly reducing mass requirements. JSC has estimated the mass of ECLSS systems. Using ISS experience as a basis, JSC estimated the mass and power requirements of ECLSS systems for a crew of six on Mars for 600 days. We can scale this to a crew of 4 for 365 days to estimate the mass of an ECLSS system for the Moon. For each resource (oxygen or water) there is a system mass and backup cache mass to replenish losses. The results for a lunar ECLSS are:
Oxygen ECLSS:
Physical plant mass = 510 kg
Backup cache mass = 380 kg
Total mass = 890 kg
49 D. Rapp, Mars Life Support Systems, Mars Journal 2, 72-82, 2006.
Water ECLSS:
Physical plant mass = 4500 kg
Backup cache mass = 2700 kg
Total mass = 7200 kg
Even though ISRU might supply the required amounts of oxygen and water, environmental control will still be required. An oxygen-only ISRU system would save very little mass from the ECLSS and is probably not worth integrating to ECLSS. An ISRU system that produces water and oxygen would provide greater benefits but it is likely that the reduction in ECLSS mass would be only a few tonnes, whereas the ISRU system would have to supply the full required 40 tonnes of H2O per year. Exactly how a water-based ISRU system would be integrated to an ECLSS remains to be determined. There might be some mass benefits, but they appear to be modest at best. If the ECLSS works as well as NASA hopes, there may not be much benefit to joining the ISRU and ECLSS systems. Use of ISRU to produce life support consumables on the Moon is unlikely to have net value.
4.2.3 Propellants Delivered to LEO For a typical Mars-bound vehicle in LEO prior to trans-Mars injection, about 60% of the total mass consists of H2 + O2 propellants for trans-Mars injection. If Mars-bound vehicles could be fueled in LEO with H2 and O2 delivered from the Moon, then only the remaining 40% of the total vehicle wet mass would need to be delivered from Earth to LEO. The other 60% would be provided from lunar resources. For example, a Mars-bound vehicle that weighs say, 250 metric tons in LEO, would include about 150 tonnes of propellant for trans-Mars injection. If fueled by hydrogen and oxygen from the Moon, the mass that would have to be lifted from Earth to LEO would only be about 100 tonnes instead of 250 tonnes. This would have a huge beneficial impact on the feasibility of launching very large Mars-bound vehicles.
The question that we must deal with is: how feasible is it to transfer water from the Moon to LEO? If this process is efficient, the scheme of supplying propellants to LEO from the Moon may be less costly than launching H2 + O2 (for Earth departure) from Earth. If the
94
transfer process from the Moon is very inefficient, it is likely to be less costly to simply deliver propellants to LEO from Earth.
It is implicitly assumed here that accessible water ice can be exploited on the Moon. If that is not the case, this entire concept becomes moot. Furthermore, the process may become untenable if the masses of the transfer vehicles are too high. If the transfer vehicles are too heavy, all the water excavated on the Moon would be used to produce H2 + O2 to deliver the vehicles and ultimately no net transfer of water to LEO would be feasible. Therefore, it is necessary to examine the details of the transfer process and estimate what percentage of water excavated on the Moon can be transferred to LEO.
The figure of merit is the net percentage of water mined on the Moon that can be transported to LEO for use by Mars-bound vehicles. As this percentage increases, the cost of transporting water to LEO from the Moon becomes more favorable. Details on this process are presented in Sec. 4.5.
4.2.4 Propellants Delivered to Lunar Orbit for Descent (and Ascent) Whereas the amount of oxygen required for ascent from the Moon to lunar orbit is a rather puny ~ 4 tonnes, the amount of oxygen required for descent from lunar orbit to the surface is over 20 tonnes. If oxygen (and less importantly hydrogen as well) can be delivered to lunar orbit for fueling Moon-bound descent vehicles, the potential payoff from ISRU would be much higher than if ISRU were used only for ascent propellants. The gear ratio for delivery of mass to lunar orbit from LEO is roughly 2.5 so use of ISRU to generate descent propellants would save > 50 tonnes in LEO. The combination of ISRU-provided ascent and descent propellants would save about 70 tonnes in LEO, and this is likely to increase if vehicle masses increase (as they always do) in the forthcoming revised Constellation architecture.
The concept would then be as follows.
NASA would begin by establishing an outpost in a shadowed polar crater of the Moon to excavate regolith, extract water, and electrolyze water and store hydrogen and
oxygen. Is this feasible? That is difficult to know.
NASA would design and implement a tanker system for transferring water from the surface of the Moon to lunar orbit, and establish a "filling station" in lunar orbit to electrolyze water and fill propellant tanks on incoming vehicles with hydrogen and oxygen. This tanker system would act like a shuttle to move back and forth between the lunar surface and lunar orbit, carrying full tanks on the way up and empty tanks on the way down. Estimates of the percentage of water mined on the Moon that can be transferred to lunar orbit are given in Table 4.5-10.
Incoming Lunar Surface Access Module (LSAM) vehicles on their way to the surface of the Moon would carry empty ascent and descent tanks, and would be fueled in lunar orbit prior to descent. In case of an unexpected problem, the crew could return to Earth from lunar orbit in the CEV and never descend in the LSAM.
This system works (at least on paper) after it is established, but how does it get established? If NASA must send crew members to the surface to establish the outpost and set up the tanker/refill system, then we are back to "square one" because NASA must send the LSAM with full descent and ascent tanks prior to the establishment of the outpost and the tanker/refill system. The potential equivalent mass saving in LEO is ~ 70 tonnes per launch. However, as in the case of ISRU providing only ascent propellants, this ~ 70 tonnes reduction will not be realized in terms of reduced launch vehicle capability if ISRU is adopted as an afterthought late in the campaign.
Since propellants for ascent and descent are brought to lunar orbit, this scheme is not vitiated by a need for abort-to-orbit capability.
95
4.2.5 Regolith for Radiation Shielding Use of regolith for radiation shielding50 is probably a legitimate use of in situ resources, at least in principle, but the requirements and benefits require further study. However, it is not at all clear whether habitat designs and emplacements allow use of regolith to be piled on top of them. All habitat designs and surface plans51 generated so far appear to be incompatible with use of regolith as shielding.
4.2.6 Summary of Near-Term Lunar ISRU Benefits - Current ESAS Architecture The main near-term benefit of lunar ISRU according to the current lunar campaign definition is replacement of about 8 tonnes/yr of oxygen for ascent propulsion from a polar outpost beginning rather late in the campaign (late 2020s). It is not immediately obvious how this reduction in mass requirements would be utilized by the exploration enterprise. Since sortie missions will manifestly be designed to function without ISRU, the lunar enterprise will have to develop a launch vehicle (LV) and a LSAM based on no use of ISRU. When, at a later date, outposts are set up, the same LV and LSAM will be employed. They will not be reduced in size or capacity.
At some point in the late 2020s, if ISRU is tacked on to this exploration scheme, the LV and LSAM may not have to carry ascent oxygen (and possibly some life support consumables) and thus they can deliver higher cargo payloads (about 4 tonnes per launch) to the outpost than if ISRU were not used. However, as mentioned previously, if abort-to-orbit is required during descent, even this benefit disappears.
4.3 Lunar Resources There are basically four potential lunar resources:
50 Radiation effects and shielding requirements in human missions to the moon and Mars, Donald Rapp, Mars Journal 2, 46-71, 2006 51 See: http://www.mars-lunar.net
• Silicates in regolith containing typically > 40% oxygen.
• FeO in regolith that varies from about 5% FeO in highlands up to perhaps 14% in some mare areas.
• Imbedded atoms in regolith from solar wind (typically parts per million).
• Water ice in regolith pores in permanently shadowed craters near the poles (unknown percentage but possibly a few percent in some locations – vertical and horizontal distributions are not known).
The imbedded atoms from the solar wind appear to be far too dilute to be a practical source of resources for space mission enhancement, although some ISRU enthusiasts conjecture processing ~ 100,000 tons of regolith to recover 1 ton of product.
That leaves regolith silicates and FeO and polar ice as the remaining potential feedstocks for ISRU.
4.4 Extraction and Processing
4.4.1 Volatile Extraction Requirements
Reference [I3] describes an approach known as "volatile extraction" with an object to produce hydrogen (as a propellant for ascent) and nitrogen (as a diluent for breathing air) by extracting atoms deposited in the regolith by solar wind. The stated requirements are for ~8000 kg/yr of hydrogen and ~1500 kg/yr of nitrogen. The hydrogen requirement was assumed to be the driver for the sizing of the system. However, further analysis reveals that these requirements need to be changed.
The rule of thumb for life support is that the need for breathing oxygen is 1 kg/day per crew member or 4 × 365 × 1 = 1,460 kg of O2 per year for a crew of 4. Another rough rule of thumb is to use 1 part O2 to 3 parts N2 for breathing so the N2 requirement amounts to 3 × 1,460 = 4,380 kg per yr. Therefore it appears that the estimate of 1,500 kg/yr for N2 seems low.
In considering a requirement for hydrogen, the first thing to remember is that hydrogen, by itself, has no value as a propellant unless it

96
is coupled to a commensurate amount of oxygen. The typical mixture ratio is about 1 part hydrogen to 6 to 6.5 parts oxygen. So, whatever mass of hydrogen you choose, needs to be associated with perhaps 6.5 times as much oxygen.
The presently planned ascent propellants from the Moon for the LSAM are 1300 kg of methane + 4000 kg of oxygen per ascent. On a yearly basis with two ascents, those amounts are doubled. If hydrogen is substituted for methane, the amount of hydrogen needed is 565 kg to go along with 3675 kg of O2 per ascent, or 1,130 kg of H2 and 7,350 kg of O2 per year.
The quantity 8000 kg (or even 2000 kg) of hydrogen is a gross overestimate of what could be used on the Moon. There is no conceivable application for 8000 kg/yr of hydrogen on the Moon. If you had 8000 kg/yr of H2 you would need about 52,000 kg/yr of oxygen to go along with it in a propulsion system. That amount of propellant would take you to Mars orbit, not lunar orbit. Furthermore, producing just H2 without the commensurate required amount of O2 doesn’t get you one meter off the surface of the Moon.
Thus, contrary to the write-up, it is the N2, not the H2 that determines the size of the volatile extraction system.
Assuming that requirements are driven by a need for 4,380 kg/yr of N2, we will proceed.
Process
It was assumed that one can obtain 150 ppm of solar wind deposited atoms from regolith. However, this appears to be wildly optimistic, and we use 75 ppm here, which is still optimistic.
Solar energy availability on the Moon is generally 50%. However, at the top of pointy peaks near the poles it can theoretically reach 100% if unimpeded by surrounding terrain, and more likely, at best, can achieve ~70%. It is thoroughly impractical to assume that 70% can be achieved in a real system. For volatile extraction on the (required) flat terrain, 50% is the most that can be hoped for. With a duty cycle of say, 80%, the system runs perhaps 40% of the time.
Evolved N2 is captured by a cryocooler. What happens if other condensibles are present and mix in with the N2? Evolved H2 is captured by a hydride bed. Hydride beds are notorious for being easily poisoned by impurities requiring extremely pure H2 to operate. These systems may not work. Further study is recommended.
Based on 75 ppm and 40% solar availability, the results shown in Table 4.4-1 are shown.
The power requirement can be estimated based on the need is to heat 21,000 kg/hr of regolith from 200 K to 800 K.
Heat = (21,000 kg) (0.00023 kWh/kg-K) (600 K) = 2900 kWh per hr or a steady rate of 2900 kW just for heating the regolith.
Other power requirements are not included. Even though some heat may be recoverable from the product regolith, such a power rate would clearly be prohibitive.
Table 4.4-1. Quantities of interest in volatile extraction process.
units H2,
1130 kg/yr
N2, 4380 kg/yr
Regolith processed m3/yr 10,000 39,200
Regolith processed kg/yr 15x106 58x106
Regolith processed @ 40% of time m3/hr 2.9 11.1
Regolith processed @ 40% of time kg/hr 4300 16,700
4.4.2 Oxygen from Regolith Extraction of Oxygen from Lunar Regolith
Extraction of oxygen from lunar regolith has two positive aspects:
(1) Regolith is typically > 40% oxygen.
(2) Regolith is available everywhere and solar energy may be feasible for processing.
Unfortunately, the oxygen in regolith is tied up in silicate bonds that are amongst the strongest chemical bonds that are known, and breaking these bonds inevitably requires very high temperature processing.
A number of high-temperature processes have been proposed for oxygen extraction. Two processes of current interest in the JSC-led

97
lunar ISRU development program are (1) hydrogen reduction, and (2) the so-called carbothermal process. In addition, molten salt electrolysis has been mentioned as a possibility in various JSC presentations. We note that according to JSC correspondence, "multiple molten salt electrolysis efforts have been funded for ISRU by NASA and one major development effort is planned for the upcoming years."
The carbothermal process is based upon a direct energy processing technique to produce oxygen, silicon, iron, and ceramic materials from lunar regolith via carbonaceous high-temperature reduction using carbon as a reducing agent at ~ 2600 K. To prevent destruction of the container, heat is applied to a localized region of regolith and the surrounding regolith acts as an insulative barrier to protect the support structures. The plan is to use a set of solar concentrators to beam concentrated solar energy for direct heating of the regolith in the carbothermal reduction cells. Methane gas is injected into the reduction chamber. According to JSC [I3]:
"The lunar regolith will absorb the solar energy and form a small region of molten regolith. A layer of unmelted regolith underneath the molten region will insulate the processing tray from the solar energy. Methane gas in the reduction chamber will crack on the surface of the molten regolith producing carbon and hydrogen. The carbon will diffuse into the molten regolith and reduce the oxides in the melt while the hydrogen gas is released into the chamber. Some hydrogen may reduce the iron oxides in the regolith to form water, which will be recovered by the carbothermal system. A moveable solar concentrator will allow heating in the form of a concentrated beam on the regolith surface. A system of fiber optic cables will distribute the concentrated solar power to small cavities formed by reflector cups that concentrate and refocus any reflected energy. Solidified slag melts are removed from the regolith bed by a rake system. Slag waste and incoming fresh regolith are moved out or into the chamber through a double airlock system to minimize the loss of reactive gases."
This ambitious scheme would be a nightmare on Earth. On the Moon, it is unimaginable.
While JSC continues to remain optimistic about such processes for extracting oxygen from regolith, preliminary testing has not produced any encouraging results. The probability that a practical process for autonomous lunar operation will come from any of this research appears to be very low.
It is also noteworthy that JSC admits that
"to date no testing has come close to 35% oxygen yield (although definitely better than 2% has been demonstrated), a significant quantity of the oxygen produced is not in the form of oxygen but in the form of CO and CO2, the anode materials attempted to date have been consumed by the electrolysis process (the source of the carbon), and there stands an excellent chance that we will not be able to recover all of the salt per batch."
Despite the great challenges involved in extracting oxygen from regolith, JSC remains optimistic that they will succeed. It is difficult not to admire the tenacity of these stalwarts, for whom no engineering challenge is too great or too impractical, who are willing to work on technologies requiring reactors at incredibly high temperatures that must take in lunar regolith and discharge spent regolith or slag, and recuperate heat from heat exchangers with flowing solids on both sides. However, the probability that a practical and affordable process for autonomous lunar operation will come from any of this research appears to be very small. Furthermore, there do not seem to be any benefit/cost analyses accompanying the technical work. The program seems to be aimed strictly at producing oxygen, whatever the cost or complexity. It is noteworthy that JSC references described the goals of the NASA ISRU technology development program entirely in terms of technical feasibility, and little mention (if any) is made of benefit/cost ratio.
In the unlikely case that a high-temperature processor for oxygen from regolith on the Moon can be made technically feasible, one would still be faced with the challenges (and costs) for development and demonstration of autonomous ISRU systems for excavation of regolith, delivery of regolith to the high-temperature processor, operation of the high-temperature processor with free flow of

98
regolith through it (with no caking, agglomeration and "gunking up" of regolith), and removal of spent regolith from the high-temperature processor to a waste dump.
Reduction of FeO Using Hydrogen
Hydrogen reduction of FeO in regolith is proposed as an alternate means of extracting oxygen from regolith. This process depends on the reaction of hydrogen with the FeO in the regolith to produce iron and oxygen. The remainder of the regolith does not enter into the reaction (but it must be heated to 1300 K). The water (steam) produced in the reactor (at ~ 1300 K) is condensed and electrolyzed, and the oxygen is saved while the hydrogen is recirculated. Some make-up hydrogen is needed, as the process is not 100% efficient. Because of the relatively low oxygen content of regolith (as FeO) this process requires heating a great amount of regolith with consequent high energy requirements. The concentration of FeO in lunar regolith varies from about 5% to 14%., depending on location Since oxygen constitutes 16/72 of the mass of FeO, the recoverable oxygen content varies from 1.1% to 3.1%. To produce 10 tonnes of oxygen per year requires processing about 1,000 tonnes of regolith with ~ 40 kW of power. Furthermore, yields from early experiments have not been encouraging.
The energy requirement to process X kg of regolith is the energy to heat the regolith from 200 K to 1300 K assuming 100% conversion of FeO to water. The claim is made in [I3] that the system can recuperate 50% of heat in heat exchangers and heat losses are estimated at 10%. This would imply (if taken at face value) that the heat requirement for X kg of regolith is:
Heat = (X kg) (0.00023 kWh/kg-K) (1100 K) (0.5 + 0.1)= (0.152 X) kWh.
This power requirement may be feasible using solar energy but significant challenges remain in making the process practical. Low conversion efficiency remains a problem. This process appears to be more feasible than the carbothermal process but it also suffers from the need for delivery of regolith to the high-temperature processor, operation of the high-temperature processor with free flow of regolith through it (with no caking,
agglomeration and "gunking up" of regolith), and removal of spent regolith from the high-temperature processor to a waste dump.
Table 4.4-2. Power requirements to heat regolith for hydrogen extraction of oxygen from FeO.
Mare High-lands
Annual Oxygen Production Rate (tonnes) 10 10
Annual regolith rate (tonnes)
336 947
Annual regolith rate (kg) 336,134 947,287
kWh 51,000 143,727
Hours (40% operation) 3,500 3,500
kW to heat regolith 14.4 40.6
Molten Salt Electrolysis Processes
Molten salt electrolysis of regolith has been studied by a MIT group led by D. R. Sadoway. This process occurs at some 1800 K, producing oxygen at the anode and iron at the cathode. As a laboratory curiosity it is interesting, but as a process for implementation on the Moon, it appears to be quite impractical.
4.4.3 Utilizing Polar Ice Deposits Introduction
The other alternative is to hope for accessible ground ice in permanently shadowed craters near the poles. This approach has the great advantage that removal of water from regolith is a physical (rather than a chemical) process and requires far less energy and much lower temperatures. However, on the negative side, (1) it will take a considerable investment to locate the best deposits of ground ice (if indeed they are accessible), (2) the percentage of water ice in the regolith is likely to be low, necessitating an extensive prospecting program, ultimately requiring processing a great deal of regolith, (3) excavating ice-filled regolith may prove difficult, (4) the logistics of autonomous regolith delivery, water extraction, and regolith removal from a reactor may prove difficult, and (5) and a significant part of the process must be carried out in dark permanently shadowed craters at perhaps 60 K, necessitating use of nuclear power (or some cockamamie scheme for beaming solar power from a distant site).

99
Observations from orbit with a neutron spectrometer provide a horizontal resolution of many tens of km. Locating the best sites within such regions will require a series of prospecting missions. Initially, long-range rovers equipped with neutron spectrometers would be best used to locate the most favorable sites. At these sites, follow-on missions would take subsurface samples to validate neutron spectrometer indications, and make measurements of soil strength. This campaign to locate and validate accessible water ice resources is likely to require at least four and possibly as many as six in-situ landed missions with long distance mobility, at a probable cost of > $1B each. If sorties with human crews are used for the final missions in this series, the cost will go up considerably. The NASA Robotic Lunar Exploration Program (RLEP) seems to have grossly underestimated the requirements and costs of prospecting, the need for mobility on such precursor missions, the requirements for taking subsurface samples with preservation of volatiles, and the extent of the overall campaign to locate the best putative ice deposits.
The JSC concept is that regolith would be excavated to a depth of ~ 0.75 m from a field about 100 m distant from a "water extraction unit," and delivered to this unit by autonomous rovers. The spent regolith would be hauled to a dumping field about 100 m distant in a different direction. All of this takes place in the dark at very low temperatures (~ 60 K). The extracted water is hauled by rover to the crater rim some 8 km distant, where solar energy is presumed to be available atop the rim. Here, the water is electrolyzed to hydrogen and oxygen and the gases are liquefied and stored.52 The landing pad where the oxygen so produced would be used would be about 1 km distant from the crater rim. The power requirements to produce 8 tonnes of oxygen per year projected by [I3] are given in Table 4.4-3. However, an independent estimate of the power requirement for the water extraction step
52 However it is much easier to liquefy and store the gases inside the crater where it is very cold, not on the rim.
leads to a very different result. Assuming about 1.5% water content in regolith below a shallow desiccated layer, the power required to distill water from the regolith (requires heating from 40 K to 380 K) is estimated to be 14 kW based on 3500 hours per year of operation.
Table 4.4-3. Power Requirements for Polar Ice Extraction and Processing. (kW)
Process Step JSC [I3] estimate
My estimate
Excavation & hauling 52.8 Water extraction 1.8 14 Water transport 1.3
Water electrolysis 7.7 Liquid O2 transport 1.1 Liquid H2 transport 1.2 Cryogenic Depot 229.6
Total 295.2
The total amount of power needed in the shadowed region of the crater for excavation, hauling and water extraction is > 60 kW. There is no way to provide such power without a dedicated nuclear reactor.
Development and demonstration of autonomous ISRU systems for excavation of regolith, delivery of regolith to a water extraction unit, operation of the water extraction unit with free flow of regolith through it (with no caking, agglomeration and "gunking up" of regolith), and removal of spent regolith to a waste dump will require quite a few more billion dollars. It is noteworthy that there is no evidence that NASA is planning to provide funds to develop the nuclear reactor power systems needed for operation in the cold darkness of polar craters. Instead, JSC appears to be planning to use radioisotope thermal generators (RTGs) for power within the crater and solar energy on the crater rim. However there are not enough RTGs in the universe, nor is it likely that enough plutonium will be available to produce the needed RTGs, nor is it likely that NASA and DOE would be able to produce the RTGs even if sufficient Pu could be found. JSC also contemplates dragging the extracted water across perhaps 8 km of crater up the crater wall, and using solar energy for electrolysis. It is not clear whether this is done under human supervision or robotically, but either way, it is a nightmare.

100
The power requirements for extracting hydrogen and oxygen from putative polar ice include the power needed to (1) heat the regolith from ~ 40 K to 380 K to drive off water vapor, (2) electric power to electrolyze water, and (3) power to operate excavators, rovers and ancillary equipment. Assuming about 1.5% water content in the excavated regolith, the energy required to heat regolith from 40 K to 380 K (neglecting heat recuperation and heat losses) is about 18 kW (of heat) to produce 10 tonnes of oxygen per year based on a 40% duty cycle. The power requirement to electrolyze 11.3 tonnes of water per year is about 27 kW (electric).
Overall, the required investment to do prospecting and validation of resources, and development and demonstration of regolith excavation and transport, and operation of a water extraction system, appears to be many billions of dollars. The benefit/cost ratio remains uncertain but it may take many years to "break even" on the investment.
Any scenario that we develop for any step (whether that be prospecting or demonstration) should be elements of an overall campaign. A scenario for an individual step only has value as part of that campaign to the degree that it contributes to the campaign because the overall campaign produces the end result.
Campaign to Utilize Polar Ice Deposits
Unfortunately, NASA has not adequately defined the campaign for prospecting, demonstrating and implementing lunar ISRU. Note: in the present context "lunar ISRU" means oxygen (and possibly hydrogen) production, mainly for ascent propellants. While futurists have plans for manufacturing spare parts on the Moon, producing silicon solar cells on the Moon from regolith, and extracting parts per million of solar-wind deposited atoms, such work is not yet funded even though it is included in JSC project plans.
Both JSC and NASA appear to have simplistic notions about what it will take to prospect for polar ice resources and demonstrate ISRU systems, that will not hold up to any serious scrutiny. In addition, the RLEP Program is
very badly under-funded, under-scoped, and grossly inadequate to do the necessary job.
A campaign is an end-to-end sequence of missions and programs to accomplish a goal. Our view of the first five steps of the required campaign for developing lunar ISRU based on polar ice is as follows:
[1] The Lunar Reconnaissance Orbiter (LRO) will use a neutron spectrometer (NS) to locate hydrogen signals in horizontal spatial pixels of dimension ~ 5-10. These can be analyzed along with a 100 m grid of digital terrain along with thermal mapping that will produce 200 m pixels with 4-5 K sensitivity. These are likely to encompass several subordinate craters within the south polar region, that should point the way to which of these extended areas are the best for further investigation in situ.53
[2] Although neither JSC nor NASA seem intent on doing this, what is required next is to send several long-distance rovers equipped with dynamic active NS to several of these craters, to cover a few tens of km in each one to determine: (a) whether the hydrogen signals and interpretations of them from LRO are substantiated by the more reliable ground measurements, (b) how the hydrogen signal is distributed within each crater to ~ 1 m pixel size (is the distribution fairly uniform or some kind of checkerboard?), and (c) a much better estimate of the vertical distribution of the hydrogen signal to a depth of perhaps 1 to 1.5 m, and in particular the depth of any desiccated upper layer.
[3] From the results of [2], a decision can be made as to which specific site (or sites) will be selected for more detailed measurement and verification. It is presumed that if for example, the LRO data indicate an average of 1% water-equivalent content across ~ 50 km, there are bound to be stretches of a few km in extent with essentially constant water-equivalent content that are higher than average. Therefore, for purposes of very early planning it might be assumed that a several-km area has been located with at least 2% water-equivalent content. When actual data are available, this can be made more specific. 53 Information supplied by Jim Garvin, NASA.

101
The required areal extent of the ice field depends upon the water ice content and the cumulative need. If the outpost requirement is to produce ~ 24 kg/day of O2,54 this requires 27 kg/day of water (with no losses) and maybe 30 kg/day of water with losses. If we can roughly assume perhaps 2% water content in 70% of the top 1 m, then each square meter excavated yields about 1500 kg x 0.7 x 0.02 ~ 20 kg of water. Hence the full-scale outpost ISRU system requires excavating about 1.5 sq. meters [down to 1 m depth] per day, processing about 2250 kg of regolith per day, and extracting about 30 kg of water per day. In one year, an area of about 1100 sq. meters is excavated. Over five years, an area of about 5500 sq. meters (~75 meters by ~75 meters) is needed.
[4] We would then send a short-range rover system to the selected site(s) to (a) map out the site with NS in great detail, (2) take subsurface samples to validate rover-mounted dynamic active NS measurements of water-equivalent content, (3) determine the actual form of hydrogen-containing compounds - which are almost surely dominated by water ice, (4) extract water ice from some samples and determine the water purity and the potential need for purification, and (5) determine the soil strength and requirements for excavation of the site. In some studies, this step would be implemented with support of a human crew who land in the Lunar Surface Access Module (LSAM).
[5] Develop a ~1/10 scale ISRU demonstration system for use at this site, deliver it with human oversight, get it started, and leave it to operate autonomously. In this task, several factors will be challenging:
a. Even at 1/10 scale, there is a need to excavate 225 kg of regolith per day, transport it to the water extraction unit (WEU), heat the regolith to over 380 K to drive off water vapor, remove spent regolith from the WEU, dispose of the spent regolith and any dry regolith layer that may lie atop the ice-containing layer, and purify and store 3 kg/day of water produced. If the water is to be electrolyzed and the hydrogen and oxygen
54 This corresponds to 8 tonnes.yr.
stored, that needs to be designed into the system. All of this takes place in the dark at very low temperatures, or alternatively requires long distance transport across a dark crater and up the crater wall to a sun lit area.
b. Definition of autonomous operations, including disposal of waste regolith, methods of excavation, and vehicles for transporting regolith to and from the WEU will require a great deal of study and analysis.
c. Power is likely to be a major show-stopper at every stage of this enterprise. If the demonstration must run autonomously after the crew leaves, how is it going to get sufficient power? It seems highly unlikely that enough RTGs will be available. Will NASA develop a nuclear reactor? There is no evidence that it will.
It seems clear that neither JSC, nor NASA have given adequate thought to the big picture of lunar ISRU, its requirements and its benefit/cost ratio for the whole campaign. A sober assessment of the requirements for developing and implementing lunar ISRU compared to the "value" of mass saved, creates significant doubt as to the value of lunar ISRU.
JSC Campaign Overview
In contrast to the campaign laid out above, the JSC/NASA Plan appears to provide only two lunar demonstrations prior to human sortie missions:
[A] "... a lunar polar resource characterization mission requiring hardware to be at TRL 6 by FY09 for a notional launch in FY12. In order to meet the requirement of polar volatile resource characterization, collection and separation an experiment to determine the form and concentration of the volatiles will be required. The RLEP 2 mission will carry this experiment and the ISRU Project will dedicate a significant portion of it’s funding to design and develop this experiment package to TRL 6."
[B] "... a lunar oxygen extraction demonstration requiring hardware to be at TRL 6 by FY11 for a notional launch in FY14." The RLEP 3 mission would carry this experiment. While it is not explicitly stated as such, there is a strong implication that this

102
would be an equatorial landing with oxygen extraction from regolith via a high-temperature process.
The JSC plan also says: "RLEP payload mass and power requirements are unknown at this time. However, notionally, payloads should be between 10 and 100 kg and not exceed 100 Watts of average power."
Note that neither NASA nor JSC have any plan or expectation to rove around the various craters that LRO identifies from space (via the neutron spectrometer (NS)) as containing hydrogen to locate (a) the best local crater, and (b) the best site within the best local crater. The JSC/ESAS/NASA viewpoint has always been, and seems to remain, that they can just plop down anywhere in the region to "characterize, collect and separate volatiles."
The subject of lunar volatiles often seems confused. There are two sources of volatiles on the Moon. One is the impact of energetic ions from the solar wind on the lunar surface that mirrors the composition of the Sun: mainly H, then less He, then lesser amounts of higher elements. Such deposits were found at the surface by Apollo and they appear to amount to 1 to 50 parts per million (ppm) depending on species and location. While some futurists have proposed tapping these resources, the amount of regolith that needs to be processed appears to be too excessive to be practical – although the value of 3He might some day be so high as to justify such a process. The other source of volatiles is repeated impacts of comets on the Moon over the eons. It is well known to those who know it that comets typically contain a great deal of water (and possibly CO2, NH3, and other small molecules in lesser amounts). (In fact, a recent paper suggests that 250,000 tons of water were released in the Deep Impact mission). As these comets crash into the Moon, some of the water may be retained, and the theory is that these water molecules will slowly migrate to the coldest spots on the Moon where they will be trapped. Such deposits, unlike solar wind deposited hydrogen, can lead to macroscopic amounts of water (in the percent range rather than ppm). This is presumably what Lunar Prospector detected. There may be other volatiles included and we ought to find that out, but there is every reason to believe that
water is the dominant constituent. Any practical plan to exploit lunar polar resources needs water, not "volatiles." Yet the JSC/NASA Plan keeps alive the notion that "volatiles" are all worth collecting, regardless of whether they are at the parts per million level or the percent level. No distinction seems to be made between solar wind deposition vs. accumulation of cometary volatiles at the poles.
The JSC/NASA plan appears to be bottom-heavy with significant activity after sorties begin, and is woefully lacking in precursors to the sorties.
In addition to these two RLEP payloads, the JSC Plan calls for developing "technologies to support human Sortie mission objectives of performing demonstrations and mission applications of ISRU subsystems and systems on the Moon." Requirements are stated as:
• "Demonstrations should be notionally 1/5th scale of early Outpost mission needs and no smaller than 1/10th scale in excavation/ production rate."
• "Payloads should be ~ 250 to 500 kg in mass since total instrument payload is ~2000 kg. Power requirements should be self-contained on ISRU demonstrations with recharging/ refueling from the Lander as an option to be considered." However, preliminary estimates suggest that 250-500 kg will not be close to adequate for a 1/5-scale demonstration. Power remains a major question mark. While it is conceivable (though not necessarily likely) that the LSAM could recharge batteries on rovers and processors in a small demonstration unit for a limited number of days while the crew is present, there does not seem to be enough RTG production or plutonium to power them, to provide "self-contained" power after the LSAM departs.
Cost Analysis for Lunar Water-Based ISRU for Ascent Propellants
In this section, we compare costs of an outpost with and without ISRU. The following basic assumptions are adopted:
• Costs to develop various vehicles (CEV, LSAM, ... ) are borne by Constellation and do not enter the ISRU vs. non-ISRU comparison.

103
• The various vehicles used for sorties (CEV, LSAM, ... ) are also used for outpost deliveries and returns.
• The outpost is operated for 10 years with two exchanges of crew per year.
• A cargo delivery of 32 tonnes to the lunar surface is made once/year to deliver infrastructure at a cost of $1.2B for launch and launch ops.
• LOX-Methane propulsion is developed for ascent propulsion whether ISRU is used or not.
• Ascent from the Moon requires 4 tonnes of oxygen propellant.
• The "gear ratio" (mass in LEO/payload landed on the Moon) for cargo deliveries to the pole is around ~ 4.
• The benefit of ISRU is elimination of 4 tonnes of oxygen ascent propellant, twice per year.
Whether ISRU is used or not, there will be two crew deliveries and two crew returns per year. The same vehicles are used whether ISRU is used or not. The only difference is that in the ISRU case, the LSAM can be landed with empty oxygen ascent tanks. Simplistically, it would appear that in the ISRU case, an extra 4 tonnes of payload can be carried to the lunar surface with each crew delivery (8 tonnes per year). The increased payload to the lunar surface would acquire value if we assume (as stated in the assumptions above) that periodic (maybe once a year) cargo deliveries are made to the Moon in which no CEV is used and no return is made. It is likely that such a cargo delivery system could deliver perhaps 32 tonnes to the lunar surface, assuming its IMLEO is about 4 x 32 ~ 128 tonnes. In that case, using ISRU with its annual increase of 8 tonnes of cargo to the lunar surface in crew deliveries, every 4th cargo delivery would be eliminated by supplying extra payload with each crew delivery. The net saving from use of ISRU is one cargo delivery every four years. If the cost of launching a cargo delivery mission is say, $1.2B, the annual saving from use of ISRU is $300M.
However, it is unlikely that the ISRU system would last for 10 years for a number of reasons. One is that with each passing year, the local ice field adjacent to the processing unit tends to get depleted and the rovers transporting regolith to and from the processor must travel greater distances. Another is that these working rovers are constantly excavating and transporting regolith, and are likely to need periodic replacement. Other components are likely to need periodic replacement or upgrade. Hence, part of the assumed increase in cargo delivery capability with ISRU would have to be used for ISRU deliveries. Nevertheless, we will neglect this effect and optimistically assume that the benefit from use of ISRU is $300M/yr.
The cost of an ISRU system includes the following items (not a complete list):
Development:
• Development of processing technology. This includes a system that can receive regolith, heat it to drive off water vapor, condense and collect the water, and release spent regolith.
• Development of excavation and regolith transport technology. This includes autonomous systems to excavate regolith, transfer it to a processor, and dispose of spent regolith.
• Simulation and test of systems on Earth. This may involve very large, cold evacuated chambers where simulated field operations can be tested on Earth prior to test on the Moon.
• A nuclear reactor power system must be developed that would not be used except for the fact that the location is in the dark near the South Pole.
The development cost for the ISRU components is difficult to estimate. The JSC ISRU Technology Development Plan says: "Limited funding, especially in first four (4) years of development will limit the scope and number of concepts that can be evaluated. Also, funding constraints may require early down-select before adequate characterization and mission studies have been performed." However funding for the first five years of this program totals up to over $60M, and it is

104
limited to laboratory type systems and preparation of payloads for RLEP-2 and RLEP-3. The cost of developing 1/5-scale or 1/10-scale demonstrations for sorties will be much higher. A rough guess is that the development cost for ISRU components will be $800M. In addition, a wild guess for the cost to develop a nuclear reactor is $5B.
Prospecting:
Prospecting will likely involve the following stages:
• LRO observation from orbit: $460M
• Ground truth long distance rovers equipped with NS to locate sites (4 missions at ~ $800M each)
• Ground truth local mission to validate selected site with subsurface access (1 mission at ~ $1.2B)
Total cost for prospecting ~ $5B.
In Situ Test and Validation:
Beginning with a 1/10-scale system, and extending this to a larger scale "dress rehearsal," two significant installations for autonomous ISRU operations need to be developed, delivered, installed, debugged and set to operating on the lunar surface. Since each of these involve sorties operated by human crews, the cost is roughly estimated to be $8B for the two demonstrations.
Total Cost for ISRU:
The total cost to implement ISRU is estimated to be:
Development $6B
Prospecting $5B
In Situ Test and Validation $8B
TOTAL $19B
Saving $300M per year would require >60 years to break even, and it would be much worse if a net present value estimate is made to account for the fact that ISRU investment is up front whereas return on investment is delayed many years.
4.4.4 Ancillary Technologies Ancillary technologies required for lunar ISRU include:
• Excavation and hauling
• Water electrolysis
• Cryogenic tankers
• Cryogenic depot
• Power systems
Excavation and Hauling
The excavation system will excavate the regolith and deliver it to the processing plant. It will also receive the spent regolith from the plant and either dump it in a designated location away from activity or dump it near the landing pad to be used as a protective berm (for example).
Reference [I3] has conjectured an excavation system that can excavate and deliver up to 7,500 tonnes of regolith per year. The excavator that provides regolith to an oxygen processing plant has a digging tool that either moves the regolith into a bin on the same vehicle or into a separate hauler. The excavator that supports the lunar polar water extraction is also required to first remove the top layer of dry regolith (assumed by [I3] to be 10 cm) before excavating the icy regolith. This is accomplished either by digging up the dry top layer and moving it to another location before excavating the "wet" regolith with the same technique, or by mounting a blade on the end opposite the digging tool to push aside the top layer of dry regolith.
The concept in [I3] uses a bucket-wheel excavator that delivers regolith into a bin on the same vehicle. It is assumed that the excavation tools, regolith bin, digging tool motors, etc. are mounted on one of a set of common mobile chasses. A single bucket concept which delivers the regolith into a bin on the same vehicle has also been studied. It is assumed that each vehicle will have its own power source, which is assumed to be repeatedly recharged from the base power supply. For the polar excavator, [I3] assumes that an RTG power supply will be utilized. However, the power requirements are so great
105
that there is no way that enough RTGs could be provided to supply this power.
There are two concepts for transferring the excavated regolith into the processing plant’s reactor. One concept is for an entire load of regolith to be transferred directly into the reactor, either by dumping into a hopper and then using gravity feed through multiple valves, or with some type of auger or conveyor system. In this concept, the delivery rate of the hauler needs to match up exactly with the batch processing rate of the reactor. In addition, in the case of the auger or conveyor feed, the hauler needs to wait while the load is transferred. In the second concept, the hauler dumps each load into a holding bin, and there is some type of mechanism to transfer the regolith from the holding bin into the reactor at the required rate. In this concept, the delivery rate of the hauler does not need to match the reactor’s batch processing rate. The excavator will still need to meet a total delivery rate, but this requirement can be matched more loosely as a rate per day, per week, etc. It should also be mentioned that reactor temperatures (depending on the process used) could be as high as 2600 K, and that most estimates of energy requirements made by [I3] assume significant heat recuperation from the waste regolith, thus greatly complicating the regolith feed system.
Finally, [I3] points out that the behavior of lunar soils is not completely understood. While some data exists from Apollo, it is incomplete. Some aspects of soil behavior that will affect excavation include soil compaction, cohesion, and angle of repose.
Water Electrolysis
Water electrolysis is a mature technology, although there some issues for application on the lunar surface where environmental conditions are severe and the purity of input water must be determined. Nevertheless, this does not seem to be a major obstacle to lunar ISRU.
Cryogenic Tankers
There are two tankers described by [I3]. The liquid O2 tanker performs liquefaction, storage, and delivery of the gaseous oxygen produced by either (1) oxygen extraction from regolith (presumably in equatorial or mid-
latitude regions), or (2) polar water extraction. The liquid H2 tanker performs the same functions, but only for polar water extraction.
Each system uses radiators for pre-cooling, and cryocoolers for liquefaction and storage (boil-off control). The tanker is insulated with multi-layer insulation to minimize heat loss after liquefaction. Cryogenic pumps are used to transfer the liquid cryogens.
Since [I3] conjectures use of only solar energy to generate needed electric power (except for operations within a crater) it is not clear how these systems will function (or go into hibernation) during solar outages. Power requirements for liquefaction are significant.
Cryogenic Depot
The Cryogenic Depot would serve as the interface between the consumable supply source (ISRU system and/or Earth based supply chain) and the end user site (mainly the ascent vehicle, but possibly the habitation module). The depot would provide capability to store cryogenic liquids in a zero loss configuration. It would consist of cryogenic storage tanks, a cryogenic refrigeration system, a heat rejection system, distribution/ disconnect hardware, and instrumentation and controls .
4.5 Fueling Lunar-Bound and Mars-Bound Vehicles from Lunar Resources
4.5.1 Introduction If Mars-bound vehicles could be fueled in LEO with H2 and O2 from the Moon, the required mass of Mars-bound vehicles to be delivered from Earth to LEO would be reduced to about 40% of the mass if propellants were brought from Earth.
Using an extension of a model developed previously55 the percentage of putative water mined on the Moon that can be transferred
55 "Space Resource Economic Analysis Toolkit: The Case For Commercial Lunar Ice Mining," Brad R. Blair, Javier Diaz, Michael B. Duke, Elisabeth Lamassoure, Robert Easter, Mark Oderman and Marc Vaucher, Final Report to the NASA Exploration Team, December 20, 2002.
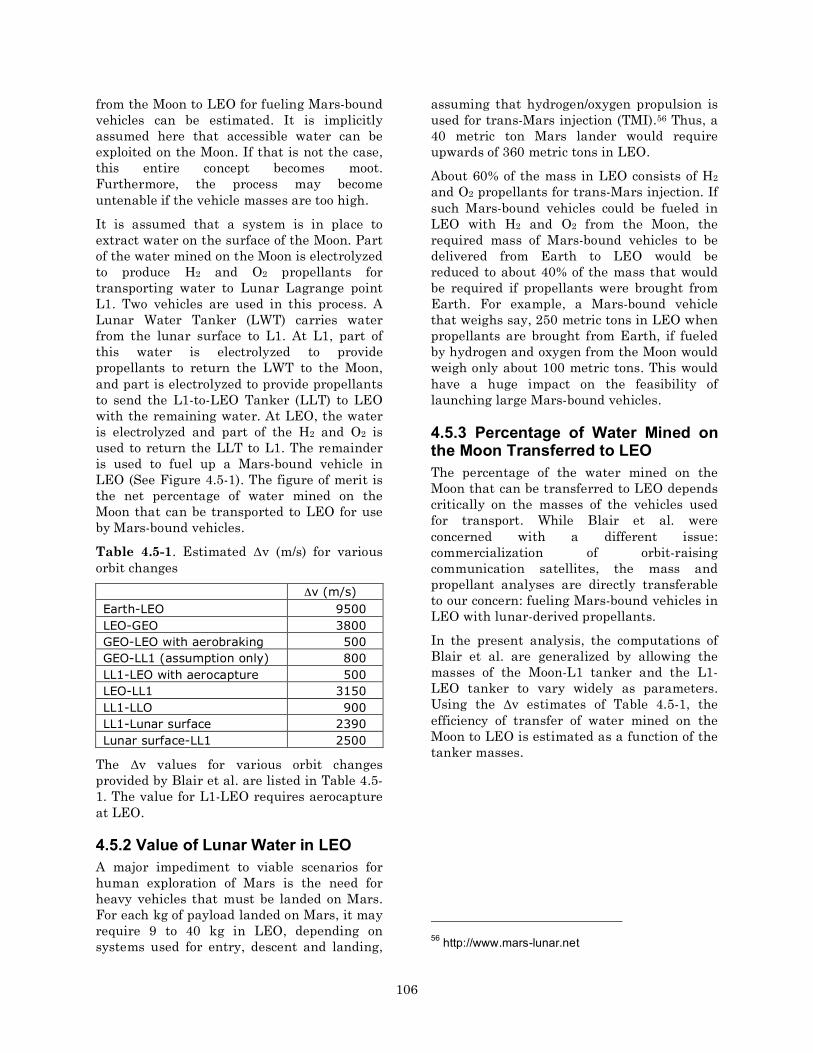
106
from the Moon to LEO for fueling Mars-bound vehicles can be estimated. It is implicitly assumed here that accessible water can be exploited on the Moon. If that is not the case, this entire concept becomes moot. Furthermore, the process may become untenable if the vehicle masses are too high.
It is assumed that a system is in place to extract water on the surface of the Moon. Part of the water mined on the Moon is electrolyzed to produce H2 and O2 propellants for transporting water to Lunar Lagrange point L1. Two vehicles are used in this process. A Lunar Water Tanker (LWT) carries water from the lunar surface to L1. At L1, part of this water is electrolyzed to provide propellants to return the LWT to the Moon, and part is electrolyzed to provide propellants to send the L1-to-LEO Tanker (LLT) to LEO with the remaining water. At LEO, the water is electrolyzed and part of the H2 and O2 is used to return the LLT to L1. The remainder is used to fuel up a Mars-bound vehicle in LEO (See Figure 4.5-1). The figure of merit is the net percentage of water mined on the Moon that can be transported to LEO for use by Mars-bound vehicles.
Table 4.5-1. Estimated Δv (m/s) for various orbit changes
Δv (m/s) Earth-LEO 9500 LEO-GEO 3800 GEO-LEO with aerobraking 500 GEO-LL1 (assumption only) 800 LL1-LEO with aerocapture 500 LEO-LL1 3150 LL1-LLO 900 LL1-Lunar surface 2390 Lunar surface-LL1 2500
The Δv values for various orbit changes provided by Blair et al. are listed in Table 4.5-1. The value for L1-LEO requires aerocapture at LEO.
4.5.2 Value of Lunar Water in LEO A major impediment to viable scenarios for human exploration of Mars is the need for heavy vehicles that must be landed on Mars. For each kg of payload landed on Mars, it may require 9 to 40 kg in LEO, depending on systems used for entry, descent and landing,
assuming that hydrogen/oxygen propulsion is used for trans-Mars injection (TMI).56 Thus, a 40 metric ton Mars lander would require upwards of 360 metric tons in LEO.
About 60% of the mass in LEO consists of H2 and O2 propellants for trans-Mars injection. If such Mars-bound vehicles could be fueled in LEO with H2 and O2 from the Moon, the required mass of Mars-bound vehicles to be delivered from Earth to LEO would be reduced to about 40% of the mass that would be required if propellants were brought from Earth. For example, a Mars-bound vehicle that weighs say, 250 metric tons in LEO when propellants are brought from Earth, if fueled by hydrogen and oxygen from the Moon would weigh only about 100 metric tons. This would have a huge impact on the feasibility of launching large Mars-bound vehicles.
4.5.3 Percentage of Water Mined on the Moon Transferred to LEO The percentage of the water mined on the Moon that can be transferred to LEO depends critically on the masses of the vehicles used for transport. While Blair et al. were concerned with a different issue: commercialization of orbit-raising communication satellites, the mass and propellant analyses are directly transferable to our concern: fueling Mars-bound vehicles in LEO with lunar-derived propellants.
In the present analysis, the computations of Blair et al. are generalized by allowing the masses of the Moon-L1 tanker and the L1-LEO tanker to vary widely as parameters. Using the Δv estimates of Table 4.5-1, the efficiency of transfer of water mined on the Moon to LEO is estimated as a function of the tanker masses.
56 http://www.mars-lunar.net

107
Figure 4.5-1. Outline of process for transporting water from Moon to LEO
Transfer via L1
First, a rough estimation of masses is made here. Electrolysis produces 8 kg of O2 for every kg of H2. Since the optimum mixture ratio for H2/O2 propulsion is assumed to be 6.5, 1.5 kg of excess O2 will be produced per kg of H2 that is produced. This O2 would likely be vented, although O2 in LEO might be useful for human life support. This indicates that per kg of water electrolyzed, only 7.5/9 = 0.833 kg of useful propellants are produced.
The mass of either vehicle (LLT or LWT) is represented as a sum of three masses:
Mp = propellant mass
Mi = inert mass (including the structure, an aeroshell for the vehicle that goes to LEO, a landing system for the vehicle that goes to the lunar surface, the water tank, the propulsion stage, and the avionics).
Mw = water mass carried by the vehicle to the next destination
Mt = total mass = Mp + Mi + Mw
The inert masses of the LWT and LLT tankers are of critical importance in this scheme. We shall assume that the inert mass is some fraction of the total mass:
For each vehicle, it is assumed that the inert mass is given by:
Mi = K (Mt)
where K is an adjustable parameter, and we define K1 for the LWT and K2 for the LLT independently.
The calculation is begun by assuming that one can extract enough water on the Moon to send 25 tonnes of water to L1. The calculation will then work backwards to estimate how much water would have to be extracted on the Moon in order to provide propellants to send 25 tonnes of water to L1. The results can be scaled to any arbitrary amount of water transferred to L1.
The rocket equation provides that
Mp/(Mi+Mw) = R-1
Mt/(Mw+Mi) = (Mp+Mw+Mi)/(Mw+Mi) = R
Mt/Mp = R/(R-1)
For transfer from the lunar surface to L1, we have
R = exp (Δv/(9.8*ISP) = exp(2500/(9.8 x 450)) = 1.763

108
where the specific impulse for H2/O2 propulsion is assumed to be 450 sec. The total mass on the lunar surface is
Mt = Mp + Mi + Mw
Mt = Mt (R-1)/R + K Mt + Mw
Mw = Mt [1 - (R-1)/R - K]
Mt = Mw/[1 - (R-1)/R - K]
Since we have specified Mw = 25 tonnes, Mt can be calculated. From this, all the other quantities can immediately be calculated. Table 4.5-2 shows the calculations for the transfer from the Moon to L1.
The next step is returning the empty LLT from L1 to the Moon. The spreadsheet for doing this is shown in Table 4.5-3. Negative values for water remaining indicate that for sufficiently high values of K1, no water can be transferred.
The next step is transfer of water from L1 to LEO. Here, a trial-and-error procedure is used. We guess how much water can be transferred and the propellant requirements are calculated for this load, assuming some value of K2. The amount of water that must be electrolyzed at L1 is subtracted from the water remaining at L1 (after sending the LLT back to the Moon) and the net amount of water is compared to the guessed value. The guessed value is varied until it agrees with the calculated value. A typical spreadsheet is shown in Table 4.5-4 for an assumed value of K2. Each row corresponds to the K1 values from Table 4.5-3. This process can be repeated for various values of K2.
Finally, we estimate the requirements for sending the empty LWT back to L1 from LEO as shown in Table 4.5-5.
The results of these calculations are summarized in Tables 4.5-6 and 4.5-7.
The crux of this calculation then comes down to estimates for K1 for the LLT and K2 for the LWT.
For the LLT, the inert mass includes the landing structure, the spacecraft structure, the water tank, and the propulsion stage. The propulsion stage for H2-O2 propulsion is typically taken as roughly 12% of the propellant mass, and since the propellant mass is likely to be about 42% of the total mass leaving the lunar surface (from calculations), the propulsion stage is perhaps 5% of the total mass leaving the lunar surface. The water mass is likely to be about 40% of the total mass leaving the lunar surface, and if the water tanks weighs, say 10% of the water mass, the tank mass would be about 4% of the total mass. The spacecraft and landing structures are difficult to estimate. A wild guess is 12% of the total mass. Thus, a crude estimate for K1 for the lunar tanker is:
0.05 + 0.04 + 0.12 ~ 0.21.
The LEO tanker does not require the landing system of the lunar tanker so the spacecraft mass is estimated as 7% of the total mass of this vehicle. The water transported by the LLT is about 55% of the total mass, so the water tank is estimated as 5.5% of the total mass. In addition, an aeroshell is needed that is estimated at 30% of the mass injected into LEO, which is likely to be about 90% of the mass that departs from L1 toward LEO, so this is roughly 27% of the total mass leaving L1. Thus K2 for the LEO tanker is roughly estimated as 0.33 for the LEO tanker. These are only rough "guesstimates."
If K1 ~ 0.21 and K2 ~ 0.33, only about 5% of the water extracted on the Moon is transferred to LEO. However, approximately 12% of the water lifted from the Moon is transferred to LEO.

109
Table 4.5-2. Sample spreadsheet for calculating requirements to transfer 25 tonnes of water to LL1. C D E F G H I J K L
Total mass
Inert mass
Propellant mass
Water electro-lyzed
Excess O2
Water trans-ferred
Water mined
on Moon
Rocket equation factors
3 Tonnes Mi Mp Mel Mxs O2
Mw M (mined)
R R-1 K1
4 =H5/(1-
LA5-(K5/J5))
=L5*C5 =CA5-DA5-H5
=1.2*E5 =FA5-
E5 =H5+F5
=JA5-1
5 53.50 5.35 23.15 27.78 4.63 25.00 52.78 1.763 0.763 0.10 6 58.51 8.19 25.32 30.38 5.06 25.00 55.38 1.763 0.763 0.14 7 64.55 11.62 27.93 33.52 5.59 25.00 58.52 1.763 0.763 0.18 8 71.99 15.84 31.15 37.38 6.23 25.00 62.38 1.763 0.763 0.22 9 81.36 21.15 35.20 42.25 7.04 25.00 67.25 1.763 0.763 0.26 10 93.53 28.06 40.47 48.57 8.09 25.00 73.57 1.763 0.763 0.30 11 109.99 37.40 47.60 57.12 9.52 25.00 82.12 1.763 0.763 0.34 12 133.49 50.72 57.76 69.31 11.55 25.00 94.31 1.763 0.763 0.38 13 169.74 71.29 73.45 88.14 14.69 25.00 113.14 1.763 0.763 0.42
Table 4.5-3. Sample spreadsheet for calculating requirements to return LLT from LL1 to the Moon. C D E F G H J K L
Total mass
Inert mass
Propellant mass
Water electro-lyzed
Excess O2
Water remain-
ing
Rocket equation factors
Tonnes Mi Mp Mel Mxs O2 Mw R R-1 K1 =D17+E17 =D5 =D17*K17 =1.2*E17 =F17-E17 =2A5-F17 =J17-1
17 9.20 5.35 3.85 4.62 0.77 20.38 1.719 0.719 0.10 18 14.08 8.19 5.89 7.07 1.18 17.93 1.719 0.719 0.14 19 19.98 11.62 8.36 10.03 1.67 14.97 1.719 0.719 0.18 20 27.23 15.84 11.39 13.67 2.28 11.33 1.719 0.719 0.22 21 36.37 21.15 15.22 18.26 3.04 6.74 1.719 0.719 0.26 22 48.25 28.06 20.19 24.22 4.04 0.78 1.719 0.719 0.30 23 64.30 37.40 26.90 32.28 5.38 -7.28 1.719 0.719 0.34 24 87.21 50.72 36.49 43.79 7.30 -18.79 1.719 0.719 0.38 25 122.57 71.29 51.28 61.54 10.26 -36.54 1.719 0.719 0.42
Table 4.5-4. Sample spreadsheet for calculating requirements to transfer water from LL1 to LEO. K2 is constant at 0.1, and the values of K1 correspond to those in Table A5-3.
C D E F G H I J K L
Total mass
Inert mass
Propell-ant
mass
Water electro-lyzed
Excess O2
Water trans-ferred
Water trans-ferred
Rocket equation factors
Tonnes Mi Mp Mel MxsO2
Mw (guess)
Mw (check) R R-1 K2
=H29/(1-L29- (K29/J29))
=L29*C29
=C29-D29-H29
=1.2*E29
=F29-E29
=H17-F29
=J29-1
29 22.12 2.21 2.37 2.85 0.47 17.54 17.54 1.12 0.12 0.1 30 19.46 1.95 2.09 2.50 0.42 15.43 15.43 1.12 0.12 0.1 31 15.26 1.53 1.64 1.96 0.33 12.10 13.01 1.12 0.12 0.1 32 12.29 1.23 1.32 1.58 0.26 9.74 9.75 1.12 0.12 0.1 33 7.30 0.73 0.78 0.94 0.16 5.79 5.80 1.12 0.12 0.1 34 0.83 0.08 0.09 0.11 0.02 0.66 0.67 1.12 0.12 0.1 35 0.13 0.01 0.01 0.02 0.00 0.10 -7.30 1.12 0.12 0.1 36 0.13 0.01 0.01 0.02 0.00 0.10 -18.80 1.12 0.12 0.1 37 0.13 0.01 0.01 0.02 0.00 0.10 -36.56 1.12 0.12 0.1
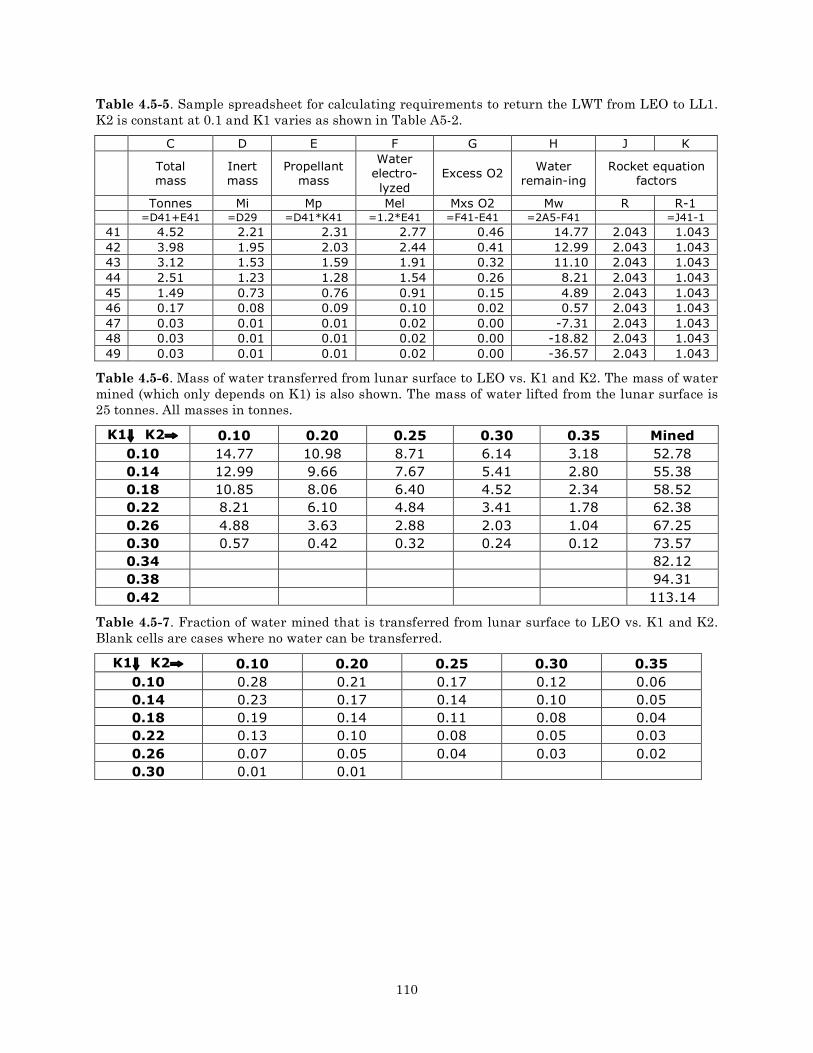
110
Table 4.5-5. Sample spreadsheet for calculating requirements to return the LWT from LEO to LL1. K2 is constant at 0.1 and K1 varies as shown in Table A5-2.
C D E F G H J K
Total mass
Inert mass
Propellant mass
Water electro-lyzed
Excess O2 Water remain-ing
Rocket equation factors
Tonnes Mi Mp Mel Mxs O2 Mw R R-1 =D41+E41 =D29 =D41*K41 =1.2*E41 =F41-E41 =2A5-F41 =J41-1
41 4.52 2.21 2.31 2.77 0.46 14.77 2.043 1.043 42 3.98 1.95 2.03 2.44 0.41 12.99 2.043 1.043 43 3.12 1.53 1.59 1.91 0.32 11.10 2.043 1.043 44 2.51 1.23 1.28 1.54 0.26 8.21 2.043 1.043 45 1.49 0.73 0.76 0.91 0.15 4.89 2.043 1.043 46 0.17 0.08 0.09 0.10 0.02 0.57 2.043 1.043 47 0.03 0.01 0.01 0.02 0.00 -7.31 2.043 1.043 48 0.03 0.01 0.01 0.02 0.00 -18.82 2.043 1.043 49 0.03 0.01 0.01 0.02 0.00 -36.57 2.043 1.043
Table 4.5-6. Mass of water transferred from lunar surface to LEO vs. K1 and K2. The mass of water mined (which only depends on K1) is also shown. The mass of water lifted from the lunar surface is 25 tonnes. All masses in tonnes.
K1⇓ K2⇒ 0.10 0.20 0.25 0.30 0.35 Mined 0.10 14.77 10.98 8.71 6.14 3.18 52.78 0.14 12.99 9.66 7.67 5.41 2.80 55.38 0.18 10.85 8.06 6.40 4.52 2.34 58.52 0.22 8.21 6.10 4.84 3.41 1.78 62.38 0.26 4.88 3.63 2.88 2.03 1.04 67.25 0.30 0.57 0.42 0.32 0.24 0.12 73.57 0.34 82.12 0.38 94.31 0.42 113.14
Table 4.5-7. Fraction of water mined that is transferred from lunar surface to LEO vs. K1 and K2. Blank cells are cases where no water can be transferred.
K1⇓ K2⇒ 0.10 0.20 0.25 0.30 0.35 0.10 0.28 0.21 0.17 0.12 0.06 0.14 0.23 0.17 0.14 0.10 0.05 0.18 0.19 0.14 0.11 0.08 0.04 0.22 0.13 0.10 0.08 0.05 0.03 0.26 0.07 0.05 0.04 0.03 0.02 0.30 0.01 0.01

111
Dependence on Junction Site
In this section, a brief comparison is made of delivery of water from the Moon to LEO with the junction site being either L1 or low lunar orbit (LLO). The procedure is essentially the same as that given in the previous section, except that the Δv values of each step are those that either involve L1 as the junction point. In doing this, values of Δv were taken from the textbook: Human Spaceflight: Mission Analysis and Design. For the L1 case, these values are slightly different than those used in the previous section. Table 4.5-8 lists these values.
Table 4.5-8. Values of Δv (m/s) used to compare transfer via LLO and via L1.
Transfer step Δv based on LL1
Δv based on LLO
Lunar surface to LLO or Ll1
2520 1870
LLO or LL1 to lunar surface
2520 1870
LLO or LL1 to LEO 770 1310 LEO to LLO or Ll1 3770 4040
Table 4.5-9. Fraction of mass of water mined on the Moon that is transferred to LEO as a function of K1 and K2.
Based on transfer via LL1 K1⇓/ K2⇒ 0.10 0.20 0.25 0.30
0.10 0.23 0.14 0.09 0.03 0.14 0.19 0.12 0.07 0.02 0.18 0.15 0.09 0.06 0.02 0.22 0.10 0.06 0.04 0.01 0.26 0.05 0.03 0.02 0.01 0.30 0.34 0.38 0.42
Based on transfer via LLO K1⇓/ K2⇒ 0.10 0.20 0.25
0.10 0.25 0.11 0.03 0.14 0.22 0.10 0.02 0.18 0.20 0.09 0.02 0.22 0.17 0.07 0.02 0.26 0.14 0.06 0.02 0.30 0.10 0.05 0.01 0.34 0.09 0.04 0.01 0.38 0.03 0.02 0.42
Transfer via L1 involves a higher Δv for transfers to and from the lunar surface,
whereas transfer via LLO involves higher Δv for transfers to and from LEO. Therefore, transfer via L1 is expected to be more sensitive to the value of K1 and transfer via LLO is expected to be more sensitive to the value of K2. This is the case, as illustrated by the results shown in Table 4.5-9.
Lunar Ferry for Descent Propellants
Current (2006) NASA plans call for ascent propulsion based on space storable NTO-MMH. If NASA does not replace this with an oxygen-based ascent propulsion system, then even the meager potential benefits from ISRU in the current ISRU architecture (providing ascent LOX) will disappear, and lunar ISRU would have essentially no mission value.
Given that ISRU does not mesh with the current NASA lunar architecture, alternative architectures must be considered – either that or eliminate ISRU entirely from the current architecture.
This leaves us with significant mass challenges. We may conclude that the requirements to justify retention of ISRU in lunar mission plans include:
• Cryogenic propulsion utilizing LOX and possibly LH2 must be used throughout descent and ascent from the Moon.
• A high-leverage user of ISRU products must be found in addition to ascent propellants. The only obvious choice is descent propellants.
• Significant reductions in IMLEO must result from use of ISRU.
• A very significant potential target is descent propellants – totaling about 20 to 25 tonnes of propellants.
Furthermore, in order for ISRU to significantly impact the lunar exploration campaign, the following conditions must be fulfilled:
ISRU must be built into the very fabric of the lunar campaign so that all space and launch vehicles are designed and sized to use ISRU from the beginning. (This is opposed to the ESAS approach of only using ISRU rather late in the campaign as an add-on to a system that is sized without the benefit of ISRU).

112
In order for (a) above to be possible, an extended robotic campaign must precede the human campaign, to prospect for resources and establish a working ISRU plant as a fundamental asset for the first human sorties. This would undoubtedly delay return of humans to the Moon by several years.
• Lunar polar ice must be the ISRU feedstock of choice because it is the only choice with any small probability of developing a workable system.
• Oxygen must be retained as an ascent propellant. It would also be useful to use hydrogen for ascent as well.
• Utilization of ISRU products must be expanded to include descent propellants as well as ascent propellants.
• The requirement for abort to orbit during descent must be eliminated.
Although the benefit/cost ratio for this approach is still not favorable, it is far superior to that based on ISRU generation of only ascent propellants.
A tanker ferry concept can be hypothesized for fueling incoming vehicles prior to landing on the Moon. In this concept, a permanent depot is established in lunar orbit with capability to:
• Rendezvous with incoming vehicles.
• Electrolyze water delivered to it.
• Store LH2 and LOX.
• Transfer LH2 and LOX to tanks on attached vehicles.
• A long-term outpost is established in a lunar polar crater to:
• Produce water continuously.
• Convert some water to LH2 and LOX for ascent.
• Act as a launch pad and receiver for the tanker ferry.
• A tanker ferry vehicle shuttles back and forth between the outpost and the depot, delivering water for conversion to LOX and LH2.
• Some of the water produced at the outpost is converted to LOX + LH2 for ascent of the tanker ferry.
• Some of the water delivered to the depot is converted to LOX+LH2 for the tanker ferry to return to the outpost.
• Incoming vehicles bound for the lunar surface (and ascent) are fueled at the depot prior to descent with propellants for both descent and ascent.
The efficiency with which one can transfer water from the lunar surface to lunar orbit can be derived from Table 4.5-3. Only the Moon-lunar orbit transfer is considered. From Table 4.5-3 Table 4.5-10 can be derived.
Table 4.5-10. Percentage of water mined on the Moon that can be transferred to lunar orbit. K1 is a parameter that determines the tanker mass (the inert mass is K1 times the total mass).
K1 Mass of water mined
Net mass of water
transferred to lunar orbit
net % water
transferred
0.10 52.8 20.4 38.6
0.14 55.4 17.9 32.4
0.18 58.5 15.0 25.6
0.22 62.4 11.3 18.2
0.26 67.2 6.7 10.0
0.30 73.6 0.8 1.1
If the tanker vehicle masses can be kept to a minimum, and water mined on the Moon can be effectively transported to lunar orbit, the potential mass saving in IMLEO for luanr missions can be estimated. If ~ 22 tonnes of descent propellants and ~5 tonnes of ascent propellants are supplied from the Moon, we can multiply these masses by "gear ratios" for transfer from LEO to lunar orbit or the polar lunar surface (2.5 and 4.0, respectively) to obtain equivalent values of IMLEO. When the reduced mass of Earth departure propulsion systems are also taken into account, the overall reduction in IMLEO from supplying descent and ascent propellants from the Moon is about 80 tonnes. The great stumbling block is: How to establish the Outpost without requiring crew on the surface? The huge reductions in IMLEO only occur AFTER this system is in place. If the crew must land (without ISRU) to establish the Outpost, the full CEV/LSAM with heavy lift is needed to establish the Outpost and we are back to "square one."

113
4.6 Visionary Lunar ISRU Concepts Lunar ISRU enthusiasts run the gamut from those who would merely produce propellants in the short run to visionaries who would bring the industrial and electronic revolutions to the Moon and engage in many aspects of producing metals and plastics, manufacturing products and doing construction on the surface. We have already seen (Sec. 2.5.3) several proposals for large scale production of solar cells from lunar resources.
Reference [I2] provides a brief description of some visionary ideas. This reference describes "surface manufacturing with in situ resources" as "a set of capabilities that enable repair, production of parts and integrated systems on the Moon and beyond using in situ resources." Six subcategories are defined: "additive manufacturing which includes processes such free form rapid prototyping from powders, composite formation, and chemical vapor deposition; subtractive manufacturing which includes formation by machine tools, e-beam and lasers; formative manufacturing which includes casting, extrusion, sintering and combustion synthesis; locally integrated energy systems including the manufacturing of photovoltaic arrays, solar concentrators and beaming and storing of in situ derived power; locally integrated systems where parts of the other elements are joined into working systems, and manufacturing support systems which entails the methods of measuring and evaluating the fitness of in situ manufactured products.... Surface manufacturing produces space parts and repair services for all surface operations and will deliver expandable power for in situ resource extraction, processing, surface construction, manufacturing and the external exploration community."
In Reference [I2], the benefits of manufacturing with in situ resources are stated to be: "in situ repair and spare parts manufacturing, on site industrial plant capability that can manufacture critical products with masses orders of magnitude greater than the mass of the manufacturing facility, manufacturing of in situ energy systems.... All of these capabilities enable credible large scale space commercialization
and development and low cost human exploration."
Surface construction is another element described in [I2] that has six sub-capabilities: "site planning, surface and subsurface preparation, structure and habitat fabrication, radiation and micrometeoroid debris shielding, structure and site maintenance, and landing and launch site construction."
Reference [S27] points out that silicon, aluminum, and glass are the primary raw materials that will be required for production of solar arrays on the moon. This reference proposes a process sequence for producing these materials from lunar regolith, consisting of separating the required materials from lunar rock with fluorine. "The fluorine is brought to the Moon in the form of potassium fluoride, and is liberated from the salt by electrolysis in a eutectic salt melt. Tetrafluorosilane produced by this process is reduced to silicon by a plasma reduction stage; the fluorine salts are reduced to metals by reaction with metallic potassium. Fluorine is recovered from residual MgF and CaF2 by reaction with K2O." Landis concludes: "There seems to be no insurmountable barriers to producing the main raw materials required for solar array manufacture on the moon, including both the primary semiconductor material and the structural materials required to manufacture arrays."
Table 4.6-1. Milestones for ISRU in [I2].
Event Date Demo: 2010 Lunar Polar Water/Hydrogen
Extraction From Regolith Pilot: 2017 Demo: 2012
Lunar O2 production and storage Pilot: 2017
Propellant production (full scale) 2024 Commercial demo: 2013
In situ surface power generation and storage
Pilot: 2020 Demo: 2018 Metal/Silicon extraction from
regolith Pilot: 2022 Demos:
2010-2014 In situ surface manufacture and repair
Pilot: 2020
One unfortunate aspect of some ISRU discussions, is that very ambitious projects seem to get grouped with simpler ones as if manufacturing on the Moon is in the same category of challenge as producing propellants. For example, in Reference [I2]
114
some of the milestones in the roadmap that was generated are shown in Table 4.6-1.
4.7 Conclusions Regarding Lunar ISRU The NASA human exploration initiative is heavily invested in ISRU. For example, the ESAS Report [G7] mentions ISRU 110 times. ISRU is typically listed amongst the fundamental reasons for returning to the Moon. The colorful phrase "living off the land" was introduced by Robert Zubrin by analogy to pioneers moving across the western United States. This phrase has been promulgated by JSC and NASA. For example this phrase is used by the ESAS Report, by JSC Mars Design Reference Mission-1 and by Reference [I2]. It also appears in numerous JSC publications and presentations. However, the analogy does not work very well. In the case of the Moon, "the land" does not provide a ready "living" and at best, ISRU might conceivably have the potential to make lunar missions more affordable. Even this lesser goal seems very doubtful when the matter is studied objectively.
The problems in using ISRU within the current lunar architecture include:
• Lunar sorties must be fully capable of landing, ascending and returning without utilizing ISRU.
• ISRU is tacked on as an afterthought to lunar missions well after outposts are set up.
• Required capabilities for landing, ascending and returning from the Moon that must be developed in the beginning without ISRU are not mitigated by later use of ISRU.
• Of all the many masses that must be sent to the Moon, ascent propellants (to lunar orbit) represent only one rather small element (~4 metric tons).
• If ISRU is used only to supply propellants for ascent to orbit, the mass benefits are modest - resulting in modest equivalent cost benefits.
• The investment needed for prospecting, validation of resources, validation of
regolith excavation and handling, and validation of the lunar polar ISRU end-to-end system is large.
• If we ignore mass savings from ISRU, and concentrate on return on investment in ISRU, lunar polar ISRU does not pay back the initial investment in the current ESAS architecture.
• This implies that setting up an outpost near the pole has no justification.
• This, in turn casts doubt on the entire basis for the enterprise of returning to the Moon.
The treatment of in situ resource utilization (ISRU) in NASA exploration plans is schizophrenic and often misguided. On the one hand, the JSC mission planners seem to push ISRU into the future with phrases such as "support a long-term strategy for human exploration" implying that ISRU would only be employed after initial missions are carried out without use of ISRU. Mission planning for the Moon does not utilize ISRU except as a potential embellishment tacked on a sort of afterthought rather late in the sequence of lunar exploration. It is difficult to be certain exactly what NASA has in mind for Mars, but the latest releases imply that similarly, ISRU would not be utilized on initial Mars missions. On the other hand, JSC ISRU enthusiasts continue to advocate ISRU processes on the Moon that are very problematic and of dubious feasibility, such as high-temperature oxygen recovery from regolith, extraction of solar wind hydrogen/methane volatiles from regolith, and extraction of putative polar ice based on solar energy plus an unattainable number of RTGs. ISRU is also conceived as going far beyond the immediate and obvious applications of producing ascent propellants and life-support consumables, to include far-fetched ideas such as developing the industrial and electronic revolutions on extraterrestrial bodies. Meanwhile, water is by far the best feedstock for ISRU on Moon and Mars, and there is a good deal of water on Mars in the near subsurface. Yet NASA has no plans to investigate this resource and determine its accessibility on Mars.
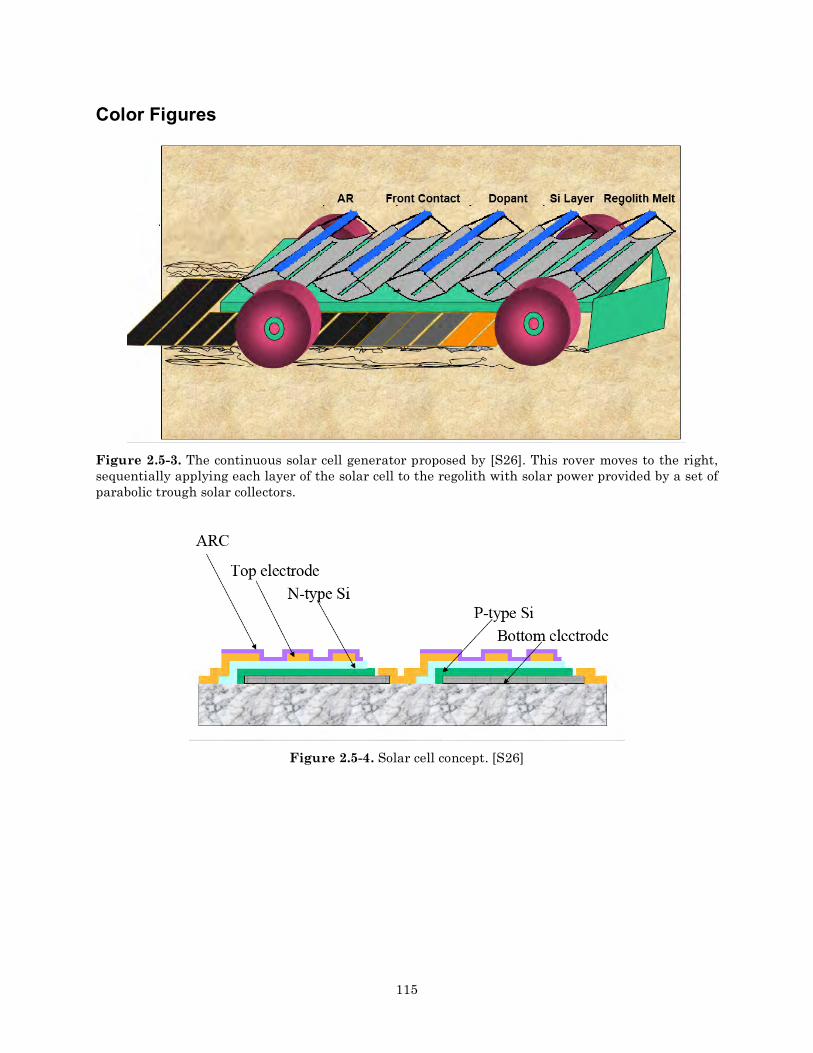
115
Color Figures
Figure 2.5-3. The continuous solar cell generator proposed by [S26]. This rover moves to the right, sequentially applying each layer of the solar cell to the regolith with solar power provided by a set of parabolic trough solar collectors.
Figure 2.5-4. Solar cell concept. [S26]

116
Figure 3.2-4. Schematic of a fusion power plant. [H23]
Figure 3.3-5. Unitized mobile miner concept. [H14]
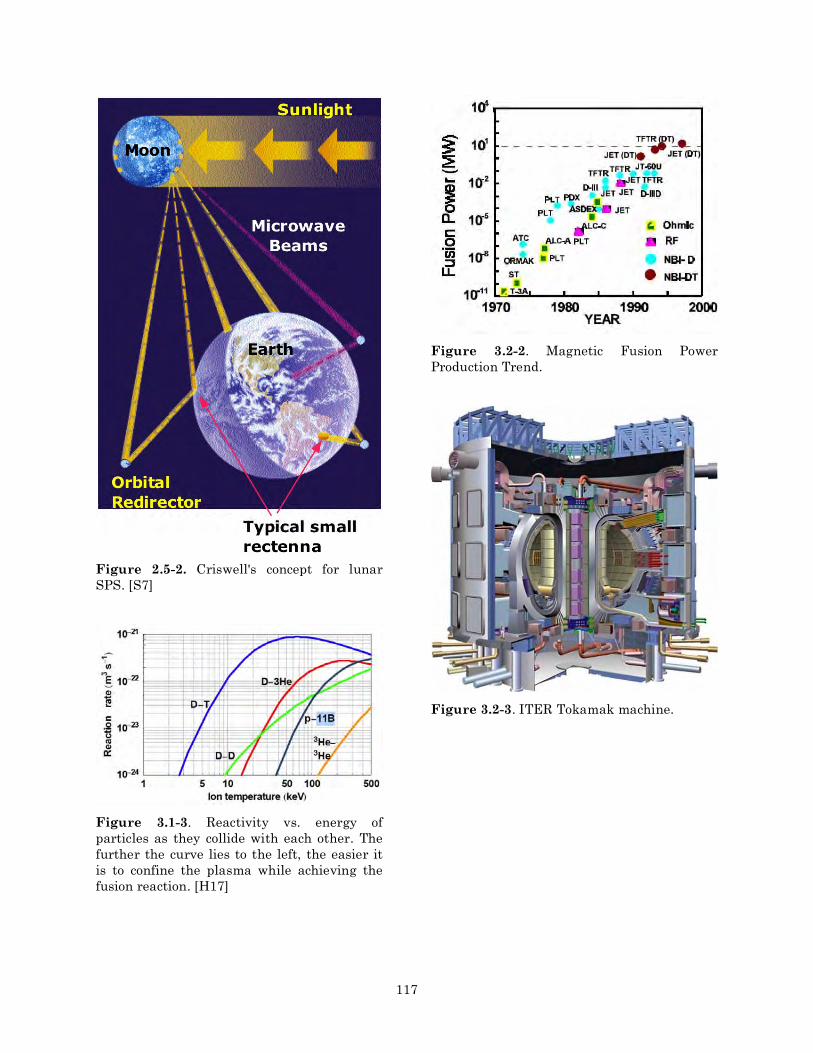
117
Figure 2.5-2. Criswell's concept for lunar SPS. [S7]
Figure 3.1-3. Reactivity vs. energy of particles as they collide with each other. The further the curve lies to the left, the easier it is to confine the plasma while achieving the fusion reaction. [H17]
Figure 3.2-2. Magnetic Fusion Power Production Trend.
Figure 3.2-3. ITER Tokamak machine.
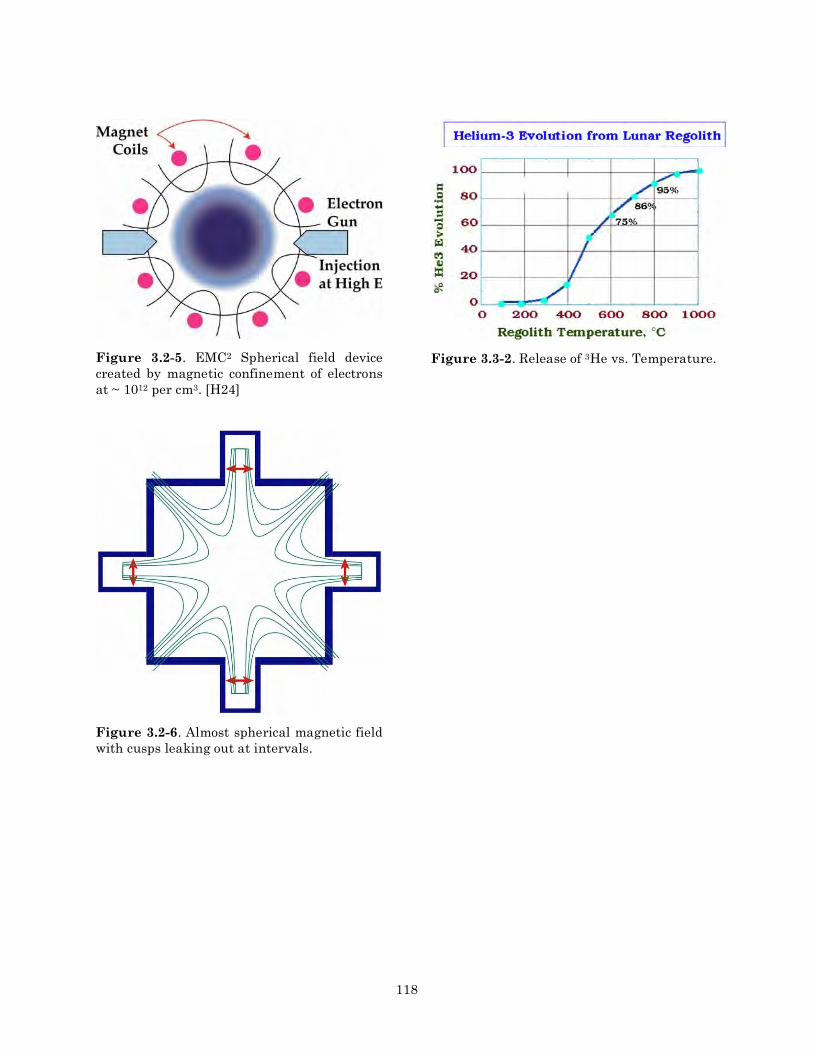
118
Figure 3.2-5. EMC2 Spherical field device created by magnetic confinement of electrons at ~ 1012 per cm3. [H24]
Figure 3.2-6. Almost spherical magnetic field with cusps leaking out at intervals.
Figure 3.3-2. Release of 3He vs. Temperature.
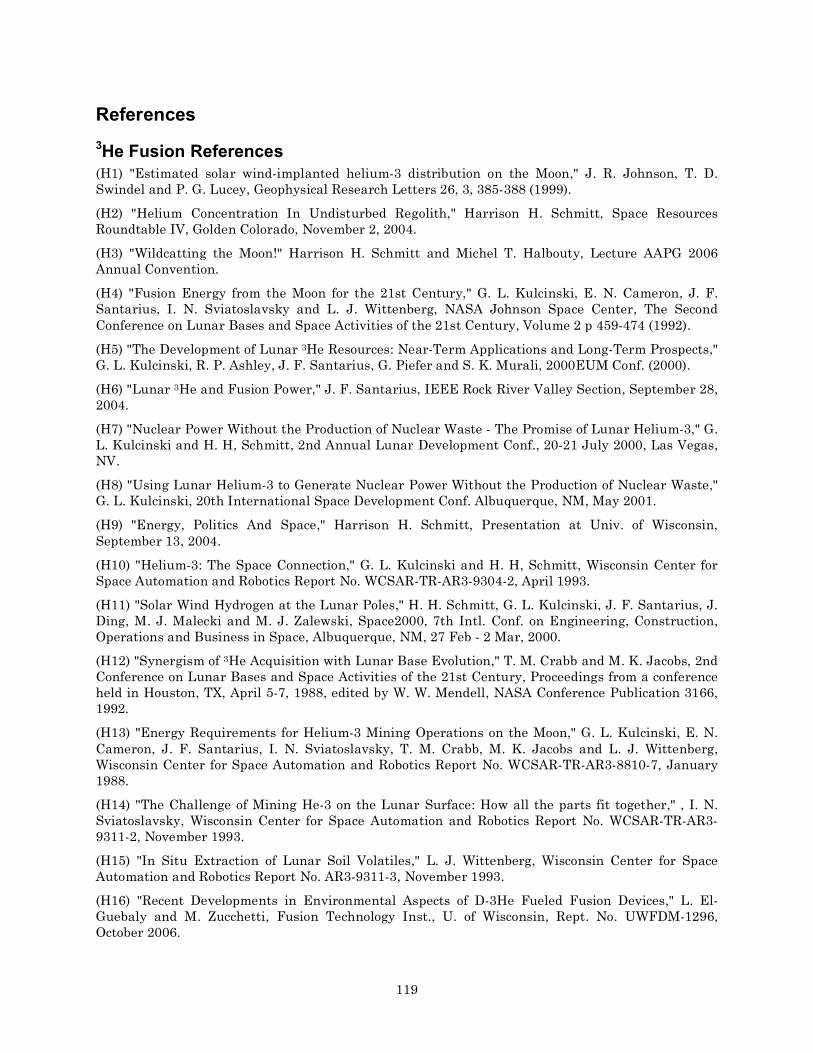
119
References 3He Fusion References (H1) "Estimated solar wind-implanted helium-3 distribution on the Moon," J. R. Johnson, T. D. Swindel and P. G. Lucey, Geophysical Research Letters 26, 3, 385-388 (1999).
(H2) "Helium Concentration In Undisturbed Regolith," Harrison H. Schmitt, Space Resources Roundtable IV, Golden Colorado, November 2, 2004.
(H3) "Wildcatting the Moon!" Harrison H. Schmitt and Michel T. Halbouty, Lecture AAPG 2006 Annual Convention.
(H4) "Fusion Energy from the Moon for the 21st Century," G. L. Kulcinski, E. N. Cameron, J. F. Santarius, I. N. Sviatoslavsky and L. J. Wittenberg, NASA Johnson Space Center, The Second Conference on Lunar Bases and Space Activities of the 21st Century, Volume 2 p 459-474 (1992).
(H5) "The Development of Lunar 3He Resources: Near-Term Applications and Long-Term Prospects," G. L. Kulcinski, R. P. Ashley, J. F. Santarius, G. Piefer and S. K. Murali, 2000EUM Conf. (2000).
(H6) "Lunar 3He and Fusion Power," J. F. Santarius, IEEE Rock River Valley Section, September 28, 2004.
(H7) "Nuclear Power Without the Production of Nuclear Waste - The Promise of Lunar Helium-3," G. L. Kulcinski and H. H, Schmitt, 2nd Annual Lunar Development Conf., 20-21 July 2000, Las Vegas, NV.
(H8) "Using Lunar Helium-3 to Generate Nuclear Power Without the Production of Nuclear Waste," G. L. Kulcinski, 20th International Space Development Conf. Albuquerque, NM, May 2001.
(H9) "Energy, Politics And Space," Harrison H. Schmitt, Presentation at Univ. of Wisconsin, September 13, 2004.
(H10) "Helium-3: The Space Connection," G. L. Kulcinski and H. H, Schmitt, Wisconsin Center for Space Automation and Robotics Report No. WCSAR-TR-AR3-9304-2, April 1993.
(H11) "Solar Wind Hydrogen at the Lunar Poles," H. H. Schmitt, G. L. Kulcinski, J. F. Santarius, J. Ding, M. J. Malecki and M. J. Zalewski, Space2000, 7th Intl. Conf. on Engineering, Construction, Operations and Business in Space, Albuquerque, NM, 27 Feb - 2 Mar, 2000.
(H12) "Synergism of 3He Acquisition with Lunar Base Evolution," T. M. Crabb and M. K. Jacobs, 2nd Conference on Lunar Bases and Space Activities of the 21st Century, Proceedings from a conference held in Houston, TX, April 5-7, 1988, edited by W. W. Mendell, NASA Conference Publication 3166, 1992.
(H13) "Energy Requirements for Helium-3 Mining Operations on the Moon," G. L. Kulcinski, E. N. Cameron, J. F. Santarius, I. N. Sviatoslavsky, T. M. Crabb, M. K. Jacobs and L. J. Wittenberg, Wisconsin Center for Space Automation and Robotics Report No. WCSAR-TR-AR3-8810-7, January 1988.
(H14) "The Challenge of Mining He-3 on the Lunar Surface: How all the parts fit together," , I. N. Sviatoslavsky, Wisconsin Center for Space Automation and Robotics Report No. WCSAR-TR-AR3-9311-2, November 1993.
(H15) "In Situ Extraction of Lunar Soil Volatiles," L. J. Wittenberg, Wisconsin Center for Space Automation and Robotics Report No. AR3-9311-3, November 1993.
(H16) "Recent Developments in Environmental Aspects of D-3He Fueled Fusion Devices," L. El-Guebaly and M. Zucchetti, Fusion Technology Inst., U. of Wisconsin, Rept. No. UWFDM-1296, October 2006.

120
(H17) "D-3He Physics and Fusion Energy Prospects," G. L. Kulcinski and J. F. Santarius, Innovative Confinement Concepts Workshop, Madison WI, May 25-28 (2004).
(H18) "He-3 Fusion Reactors - A Clean and Safe Source of Energy in the 21st Century," G. L. Kulcinski, Wisconsin Center for Space Automation and Robotics Report No. WCSAR-TR-AR3-9304-1, April 1993
(H19) "Lunar Surface Mining For Automated Acquisition Of Helium-3: Methods, Processes, And Equipment," Y. T. Li and L. J. Wittenberg, 2nd Conf. on lunar bases and space activities of the 21st century, Houston, TX, 5-7 Apr. 1988.
(H20) Issues for magnetic and inertial fusion energy development, A J Wootton and L John Perkins, Plasma Phys. Control. Fusion 42 (2000) B125–B141.
(H21) Controlled Thermonuclear Fusion, 26th Report covering 2003, Federal Office for Education and Science, International Research Organisations, Hallwylstrasse 4, 3003 Bern (March 2004).
(H22) Congress and the Fusion Energy Sciences Program: A Historical Analysis, R. E. Rowberg, Congress Research Service, Libary of Congress, January 31, 2000.
(H23) Status Report on Fusion Research, International Fusion Research Council (IFRC), Nucl. Fusion 45 (2005) A1–A28.
(H24) "Should Google go Nuclear?" video presentation by Robert W. Bussard, http://video.google.com/videoplay?docid=1996321846673788606
(H25) "The World's Simplest Fusion Reactor Revisited," Tom Ligon, working draft, January 11, 2007, personal communication.
(H26) "A Summary of Results, Conclusions, Prospects and Needs For the Achievement of Clean Nuclear Fusion and Fusion-Electric Power Systems," EMC2-0206-02b, Robert W. Bussard, 14 February 2006, personal communication.
Solar References S1. "Space Solar Power for Earth from Earth Orbits and the Moon," P. E. Glaser, International Institute for Sustainable Future, 2000.
S2. "Extraplanetary Solar Power - The Most Promising Sustainable Energy Option You Never Heard of," Jerrad Pierce, http://pthbb.org/natural/11_371-XPS.pdf
S3. "Efficient Direct Conversion of Sunlight to Coherent Light at High Average Power in Space," Richard L. Fork, Rustin L. Laycock, Dane J. Phillips, Wesley W. Walker, Spencer T. Cole, Sean D. Moultrie and John C. Reinhardt, NASA Institute for Advanced Concepts – Phase I Report, March 16, 2005.
S4. "Laying the Foundation for, Space Solar Power, An Assessment of NASA’s Space Solar Power Investment Strategy," Committee for the Assessment of NASA’s Space, Solar Power Investment Strategy, Aeronautics and Space Engineering Board, Division on Engineering and Physical Sciences, National Research Council, 2001.
S5. "Lunar Solar Power Generation," V. Lalith Kumar, http://www.acm.org/ubiquity/views/v7i28_kumar.html
S6. URSI White Paper on Solar Power Satellite (SPS) Systems, International Union Of Radio Science, September 2006. http://ursi.ca/SPS-2006sept.pdf
S6A. Appendices to URSI White Paper, 65 pp.
S6B. Supporting Document to URSI White Paper, July, 2006, 60 pp.

121
S6C. URSI Special Edition on SPS, No. 311, December 2004, 125 pp.
S7. "Solar Power via the Moon," David R. Criswell, The Industrial Physicist, April/May 2002; also "Lunar Solar Power System for Energy Prosperity Within the 21st Century," at: http://www.worldenergy.org/wec-geis/publications/default/tech_papers/17th_congress/4_1_33.asp
S8. Satellite Power System, Concept Development and Evaluation Program, Reference System Report, DOE/ER-O023, NASA TM-80413, October, 1978, 322 pp.
S9. "Handbook of Lunar Materials," NASA Reference Document 1057, February, 1980, 138 pp.
S10. "Solar Power Satellites," OTA Report E-144, August 1981, 297 pp.
S11. "Satellite Power System: Concept Development and Evaluation Program, Vol. III Power Transmission and Reception, Technology Summary and Assessment," R. H. Dietz, G. D. Arndt, J. W. Seyl, L. Leopold and J. S. Kelley, NASA Reference Pub. 1076, July, 1981.
S12. Economic and Demographic Issues Related to Deployment of the Satellite Power System: SPS, T. E. Baldwin, L. G. Hill, D. J. Santini and E. J. Stenehjem, DOE/NASA Report ANL/EES-TM-23, October, 1978, 71 pp.
S13. Satellite Power System, FY79 Program Summary, DOE/ER-0037, January, 1980, 201 pp.
S14. "Reinventing the Solar Power Satellite," G. A. Landis, NASA/TM—2004-212743, February, 2004.
S15. "A Fresh Look at Space Solar Power: New Architectures, Concepts and Technologies," John C. Mankins, IAF-97-R.2.03, 38th International Astronautical Federation, 1997.
S16. "Satellite Power System (SPS) Resource Requirements (Critical Materials, Energy, and Land)," Allan D. Kotin, DOE/NASA Report HCP/R-4024-02, October, 1978, 129 pp.
S17. "Some Questions and Answers About the Satellite Power System (SPS)," DOE Report ER-0049-1, January, 1980.
S18. The Artemis Project - Private Enterprise On The Moon, Solar Power from the Moon, G. A. Landis, http://www.asi.org/adb/02/08/solar-cell-production.html
S19. "Solar PV on Earth and in Space: A New Perspective for Energy," Marty Hoffert, http://www.climatetechnology.gov/stratplan/comments/Hoffert-3.pdf
S20. "Earth and Space-Based Power Generation Systems – A Comparison Study," Martin Zerta, Volker Blandow, Patrick Collins, Joëlle Guillet, Thomas Nordmann, Patrick Schmidt, Werner Weindorf and Werner Zittel, 4th International Conference on Solar Power from Space – SPS '04, 30 June – 2 July 2004, Granada, Spain.
S21. "Space Solar Power: An Idea Whose Time Will Never Come?" Steve Fetter, Forum On Physics & Society of The American Physical Society, January 2004 http://www.publicpolicy.umd.edu/Fetter/2004-P&S-SSP.pdf
S22. "Power from the Sun: Its Future," P. Glaser, Science, 162, 857-861 (1968, November 22).
S23. T. S. Kelso, http://celestrak.com/columns/v04n09/
S24. "Lunar Solar Power Station," G. L. Kulcinski, lecture 35, November 26, 2001. http://fti.neep.wisc.edu/neep602/FALL97/LEC35/0slide.html
S25. "Human Missions to Mars: A Reality or a Fantasy?" Appendix I, Solar Energy on the Moon, Donald Rapp, http://www.mars-lunar.net/Reality.or.Fantasy/Appendices.1%262.solar.pdf.
S26. "Production of Solar Cells on the Surface of the Moon from Lunar Regolith." A. Ignatiev, A. Freundlich, M. Duke and S. Rosenberg, NSF/NASA Workshop on Space Solar Power, April 5-7, 2000; also: “The Fabrication of Silicon Solar Cells on the Moon using In-Situ Resources,” Ignatiev, A.,

122
Freundlich, A., Duke, M.B., and Rosenberg, S.D., paper AIAA 2002–0465, 40th AIAA Aerospace Sciences Meeting and Exhibit, 14–17 January 2002, Reno NV.
S27. "Materials Refining for Solar Array Production on the Moon," G. A. Landis, NASA/TM—2005-214014, December, 2005.
S28. "Solar Cell and Array Technology for Future Space Science Missions," S. Surampudi and D. Rapp, editors, JPL Report D-24454 (Rev. A), December, 2003.
S29. "Investigation into Uses for Lunar Regolith," C. Horton, C. Gramajo, L. Williams, A. Alemu, A. Freundlich and A. Ignatiev, Space Technology and Applications International Forum, STAIF 2003, AIP Conference Proceedings 654, ed. by M. S. El-Genk, p. 1103
S30. "First Demonstration of Photovoltaic Diodes on Lunar Regolith-Based Substrate," C. Horton, C. Gramajo, A. Alemu, L. Williams, A. Ignatiev and A. Freundlich, Acta Astronautica 56, 537 (2005).
S31. "Space Solar Power: Concept Evolution," Monica Doyle, SCTM Technical Interchange Meeting #1, Ohio Aerospace Institute, Cleveland, OH September 10, 2002.
S32. Space Solar Power (SSP) Concept and Technology Maturation (SCTM) Program, Systems Integration, Analysis and Modeling: Status and Plans, Harvey Feingold, SCTM Technical Interchange Meeting #1, Ohio Aerospace Institute, Cleveland, OH September 10, 2002.
S33. "The Solar Fraud," Howard C. Hayden, 2nd edition, 2004,Vales Lake Publishing Co.
S34. "Assessment of Parabolic Trough and Power Tower Solar Technology Cost and Performance Forecasts," NREL/SR-550-34440, October, 2003.
S35. "Satellite Power Systems (SPS) Laser Studies," Volume I: Laser Environmental Impact Study R. E. Beverly III NASA CR 3346-1, November, 1980; Volume II: Meteorological Effects on Laser Beam Propagation and Direct Solar Pumped Lasers for the SPS R. E. Beverly III NASA CR 3346-2, November, 1980.
S36. Statement on Solar Power Satellites Before the Space Roundtable, by John Mankins, NASA Office of Space Flight, February 28, 2001, source: NASA HQ.
S37. "Laser Satellite Power Systems - Concepts and Issues," E. W. Walbridge, Space Solar Power Review 3, 45-71 (1982).
Generic References G1. "The Political Economy of Very Large Space Projects," John Hickman, Journal of Evolution and Technology, Volume 4, November 1999.
G2. "Effect of Use of C60 as a Propellant in Ion Thrusters," D. Rapp and S. Leifer, JPL Report D-10169, October, 1992.
G3. "Controllability Of Large SEP For Earth Orbit Raising," Gordon Woodcock, 40th AIAA/ASME/ SAE/ASEE Joint Propulsion Conference and Exhibit, 11-14 July 2004, Fort Lauderdale, Florida, AIAA 2004-3643.
G4. "Solar Electric Propulsion Vehicle Design Study, for Cargo Transfer to Earth-Moon L1," Timothy R. Sarver-Verhey, Thomas W. Kerslake, Vincent K. Rawlin, Robert D. Falck,, Leonard J. Dudzinski, and Steven R. Oleson, NASA/TM—2002-211970, October 2002, AIAA–2002–3971.
G5. "Entering Space - Creating a Spacefaring Nation," Robert Zubrin, Penguin-Putnam, Inc., 1999.
G6. Legal Regulation Of Space Solar Power, Arthur M. Dula, 3106 Beauchamp Street, Houston, Texas 77009, USAhttp://space-power.grc.nasa.gov/ppo/publications/sctm/docs/A_DULA_SSP_Paper_9_9_2002.pdf

123
G7. Anonymous (2005), Exploration Systems Architecture Study (ESAS), NASA-TM-2005-214062, www.sti.nasa.gov, November 2005.
ISRU References I1. ISRU Technology Development Program Plan, informal draft report, mid-2006, G. B. Sanders.
I2. "ISRU Capability Roadmap Team Final Report" Informal report edited by J. Sanders (JSC) and M. Duke (Colorado School of Mines) March 2005. http://www.sop.usra.edu/rasc-al/forum_2006/CRMResourceProcessing.pdf
I3. ISRU Scenarios and Baseball Cards, JSC informal draft report, 10/10/06.
I4. "Oxygen Production from regolith," W. Larson and T. Simon, presentation, October, 2006.
124
Glossary
CEV Crew Exploration Vehicle – carries crew from LEO to lunar orbit and return. CM Crew member COPUOS Committee on the Peaceful Uses of Outer Space DOE Department of Energy ECLSS Environmental control & life support system (The system that controls the human environment in a habitat and recycles resources). EDA Engineering design activity EDS Earth departure system (Propulsion system for departure from LEO to go toward the Moon or Mars). EIA Energy Information Administration ESAS Exploration systems architecture study (2005 study of architecture for human return to Moon). GEO Geostationary Earth orbit HLLV Heavy lift launch vehicle IMLEO Initial mass in low earth orbit (Total mass that must be transported to LEO from Earth to implement a space mission). ISRU In situ resource utilization (Production of useful products (e.g. ascent propellants) on Moon or Mars from indigenous resources). ISS International Space Station ITER International Thermonuclear Experimental Reactor (ITER) project ITU International Tele-communications Union JPL Jet Propulsion Laboratory (NASA) JSC Johnson Space Center (NASA) LDC Least developed country LEO Low earth orbit (Typically a circular orbit with altitude in the range 200 to 400 km). LH2 Liquid hydrogen LLO Low lunar orbit (Typically a circular orbit of altitude 100 km). LOR Lunar orbit rendezvous (Process of transfer of crew from ascent vehicle to Earth return vehicle in lunar orbit). LOX Liquid oxygen LRO Lunar Reconnaissance Orbiter (Space mission to observe the Moon from orbit). LSAM Lunar surface access module (Transports crew from lunar orbit to lunar surface and return). LSP Lunar solar power LV Launch vehicle MMH Mono-methyl hydrazine (space storable propellant). tonnes Metric tons MEO Middle Earth orbit NER Net energy ratio NRC National Research Council NREL National Renewable Energy Laboratory NS Neutron spectrometer (detects H) NTO Nitrogen tetroxide (Space storable oxidant for rockets). OTA Office of Technology Assessment

125
PMAD Power management and distribution PV Photovoltaic RF Radiofrequency RLEP Robotic lunar exploration program (NASA program to utilize robotic precursors to gain information prior to human landings on Moon). RTG Radioisotope thermal generator (Device to convert heat from radioisotopes into electric power on spacecraft). SPS Solar Power Satellite SSP Space Solar Power SSPS Supersynchronous solar power satellite TLI Trans-lunar injection (The process of using propulsion to depart from LEO and head toward the Moon). TMI Trans-Mars injection (The process of using propulsion to depart from LEO and head toward Mars). WEU Water extraction unit (Conceptual system to remove water from putative ice-containing regolith on Moon).