asia pac weekly etf market review · markets research asia synthetic equity & index strategy...
TRANSCRIPT

Deutsche Bank Markets Research
Asia
Synthetic Equity & Index Strategy
Asia Pac Weekly ETF Market Review
Date
17 June 2015
China focused ETFs Record $4.5bn Outflows
Data in this report is as of 12th June 2015
________________________________________________________________________________________________________________
Deutsche Bank AG/Hong Kong
Deutsche Bank does and seeks to do business with companies covered in its research reports. Thus, investors should be aware that the firm may have a conflict of interest that could affect the objectivity of this report. Investors should consider this report as only a single factor in making their investment decision. DISCLOSURES AND ANALYST CERTIFICATIONS ARE LOCATED IN APPENDIX 1.MCI (P) 124/04/2015.
Author
Shan Lan
Strategist
(+852) 22036716
Team Contacts
Ari Rajendra
Strategist
(+44) 20 754-52282
Sebastian Mercado
Strategist
(+1) 212 250-8690
Weekly Market Review Last week, Asia-Pacific region had mixed markets. Compared to the week before, from north to south:
Japan (Nikkei 225) -0.26% South Korea (KOSPI2) -1.29% China (CSI 300) +2.00% Taiwan (TWSE) -0.41% Hong Kong (HSI) +0.07% India (Sensex) -1.28% Singapore (FSSTI) +0.61% Australia (S&P/ASX 200) +0.85%
New Product Launch Review Seven new ETFs were launched in Asia-Pacific ETP market during last week. ANZ Asset Management listed one commodity ETF (ZGOL AU) and one equity ETF (ZYUS AU) on the Australia Stock Exchange providing exposure to physical gold and high yielding US stocks respectively. Mirae Asset MAPS Global Investments launched an equity ETF (217780 KS) on the Korea Stock Exchange tracking CSI 300 Index. BNP Paribas and Huatai-PineBridge Fund Management Co each launched an equity ETF providing exposure to CSI 500 Index. These ETFs were listed on the Korea Stock Exchange (220130 KS) and Shanghai Stock Exchange (512510 CH) respectively. KB Asset Management listed a commodity ETF (219390 KS) on the Korea Stock Exchange tracking S&P Oil & Gas Exploration & Production Select Industry Index. Samsung Asset Management listed an equity ETF (219480 KS) on the Korea Stock Exchange tracking S&P 500 Futures TR Index.
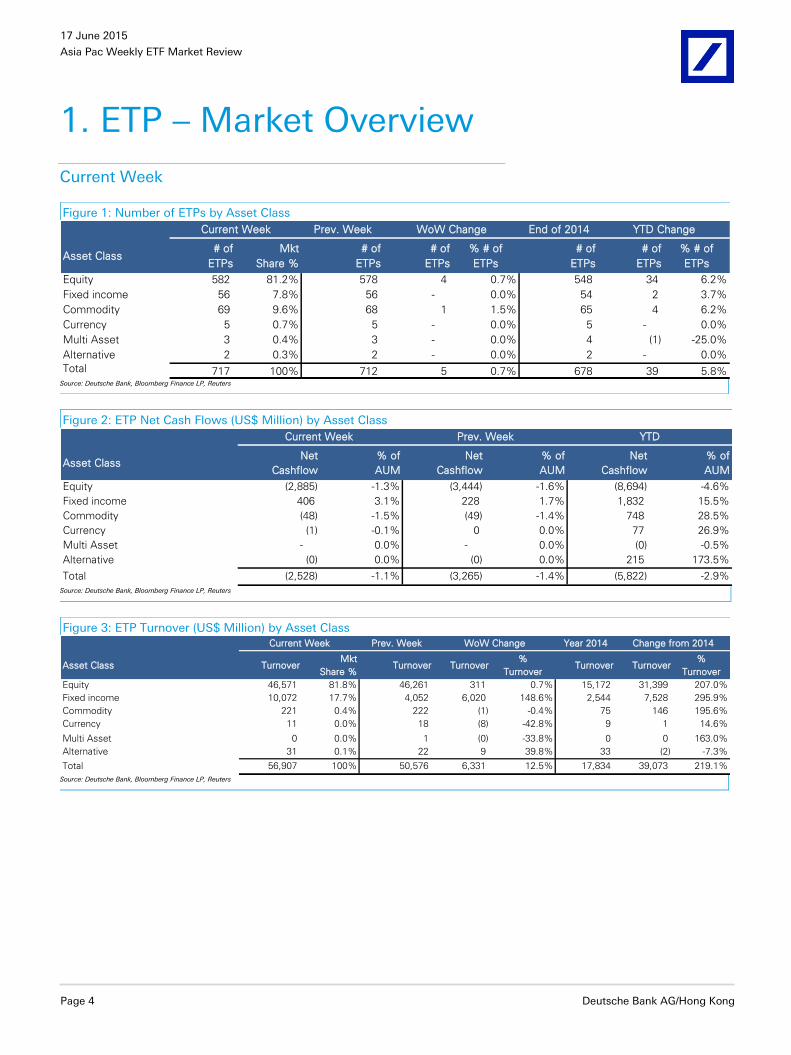
ETP Weekly Flows – China and South Korea saw outflows, Taiwan and Japan registered inflows Asia-Pacific ETP market experienced outflows for the second consecutive week recording -$2.5bn worth of redemptions last week (-$3.3bn in the previous week), bringing YTD weekly flows average to -$248mn (-$5.8bn in YTD flows). China and South Korea focused ETFs experienced outflows of -$4.5bn and -$0.6bn respectively, while Taiwan and Japan focused ETFs registered inflows of +$0.7bn and +$0.7bn respectively. Among others, leveraged long strategy and money market ETFs saw major flows activity recording +$817mn and +$348mn of net flows respectively over the last week.
Winners and losers: At ETP level, China 50 ETF (510050 CH), Next Funds Nikkei 225 Leveraged Index ETF (1570 JP) and Yuanta/P-Shares MSCI Taiwan ETF (006203 TT) were the largest flows receivers of the week collecting +$1.2bn, +$760mn, and +$696mn respectively. Biggest outflows were experienced by Huatai-Pinebridge CSI 300 ETF (510300 CH), Harvest Shanghai and Shenzhen 300 Index ETF (159919 CH) and CSOP FTSE China A50 ETF (82822 HK) recording -$3.2bn, -$601mn and -$386mn of outflows respectively.
Turnover Review – Week-on-week floor activity up by 13% Asia-Pacific ETP turnover totaled $56.9bn for the last week, 12.5% up from the previous week’s total. On a country level, stock exchanges in China topped the

17 June 2015
Asia Pac Weekly ETF Market Review
Page 2 Deutsche Bank AG/Hong Kong
turnover ranking with aggregate turnover of $35.4bn, 11.5% up as compared to previous week, followed by Japan ($9.3bn, +47.7%), Hong Kong ($8bn, +4%), and South Korea ($3bn, -9%). At ETP level, China 50 ETF (510050 CH), Next Funds Nikkei 225 Leveraged Index ETF (1570 JP) and Huatai-Pinebridge CSI 300 ETF (510300 CH) were the most traded products of the week recording total turnover of $6.6bn, $6.3bn and $5.6bn respectively.
Assets under Management Review – Assets remains flat Asia-Pac ETP AUM remains flat and ended the week at $232.7bn. On a year-to-date basis, Asia-Pac ETP market is up by $30.5bn or 15% above last year’s closing.

17 June 2015
Asia Pac Weekly ETF Market Review
Deutsche Bank AG/Hong Kong Page 3
Table Of Contents
1. ETP – Market Overview ................................................... 4 Current Week ..................................................................................................... 4 Country Breakdown ............................................................................................ 6 Issuer Rankings .................................................................................................. 7
2. ETP – Net Cash Flows ................................................... 14 Investment Focus ............................................................................................. 14 Sub Segment .................................................................................................... 15 Issuer ................................................................................................................ 18 Index Provider ................................................................................................... 19 Underlying Index/Security................................................................................. 20 Top ETPs ........................................................................................................... 21
3. ETP – Turnover .............................................................. 22 Investment Focus ............................................................................................. 22 Sub Segment .................................................................................................... 23 Exchange .......................................................................................................... 25 Issuer ................................................................................................................ 26 Index Provider ................................................................................................... 27 Underlying Index/Security................................................................................. 27 Top ETPs ........................................................................................................... 28
4. ETP – Assets under Management ................................. 29 Investment Focus ............................................................................................. 29 Sub Segment .................................................................................................... 30 Issuer ................................................................................................................ 32 Index Provider ................................................................................................... 33 Underlying Index/Security................................................................................. 33 Top ETPs ........................................................................................................... 34
Appendix A: Useful Information ........................................ 36
Appendix B: Glossary ........................................................ 37
Appendix C: How we define ETPs ..................................... 38
17 June 2015
Asia Pac Weekly ETF Market Review
Page 4 Deutsche Bank AG/Hong Kong
1. ETP – Market Overview
Current Week
Figure 1: Number of ETPs by Asset Class
Prev. Week End of 2014
Asset Class# of
ETPs
Mkt
Share %
# of
ETPs
# of
ETPs
% # of
ETPs
# of
ETPs
# of
ETPs
% # of
ETPs
Equity 582 81.2% 578 4 0.7% 548 34 6.2%
Fixed income 56 7.8% 56 - 0.0% 54 2 3.7%
Commodity 69 9.6% 68 1 1.5% 65 4 6.2%
Currency 5 0.7% 5 - 0.0% 5 - 0.0%
Multi Asset 3 0.4% 3 - 0.0% 4 (1) -25.0%
Alternative 2 0.3% 2 - 0.0% 2 - 0.0%
Total 717 100% 712 5 0.7% 678 39 5.8%
Current Week WoW Change YTD Change
Source: Deutsche Bank, Bloomberg Finance LP, Reuters
Figure 2: ETP Net Cash Flows (US$ Million) by Asset Class
Asset ClassNet
Cashflow
% of
AUM
Net
Cashflow
% of
AUM
Net
Cashflow
% of
AUM
Equity (2,885) -1.3% (3,444) -1.6% (8,694) -4.6%
Fixed income 406 3.1% 228 1.7% 1,832 15.5%
Commodity (48) -1.5% (49) -1.4% 748 28.5%
Currency (1) -0.1% 0 0.0% 77 26.9%
Multi Asset - 0.0% - 0.0% (0) -0.5%
Alternative (0) 0.0% (0) 0.0% 215 173.5%
Total (2,528) -1.1% (3,265) -1.4% (5,822) -2.9%
Prev. Week YTDCurrent Week
Source: Deutsche Bank, Bloomberg Finance LP, Reuters
Figure 3: ETP Turnover (US$ Million) by Asset Class Prev. Week Year 2014
Asset Class TurnoverMkt
Share %Turnover Turnover
%
TurnoverTurnover Turnover
%
Turnover
Equity 46,571 81.8% 46,261 311 0.7% 15,172 31,399 207.0%
Fixed income 10,072 17.7% 4,052 6,020 148.6% 2,544 7,528 295.9%
Commodity 221 0.4% 222 (1) -0.4% 75 146 195.6%
Currency 11 0.0% 18 (8) -42.8% 9 1 14.6%
Multi Asset 0 0.0% 1 (0) -33.8% 0 0 163.0%
Alternative 31 0.1% 22 9 39.8% 33 (2) -7.3%
Total 56,907 100% 50,576 6,331 12.5% 17,834 39,073 219.1%
Current Week WoW Change Change from 2014
Source: Deutsche Bank, Bloomberg Finance LP, Reuters

17 June 2015
Asia Pac Weekly ETF Market Review
Deutsche Bank AG/Hong Kong Page 5
Figure 4: ETP AUM (US$ Million) by Asset Class
Prev. Week End of 2014
Asset Class AUMMkt
Share %AUM AUM % AUM AUM AUM % AUM
Equity 215,484 92.6% 216,029 (546) -0.3% 187,338 28,146 15.0%
Fixed income 13,308 5.7% 12,902 406 3.1% 11,810 1,498 12.7%
Commodity 3,307 1.4% 3,302 4 0.1% 2,621 685 26.1%
Currency 359 0.2% 359 (0) 0.0% 286 73 25.6%
Multi Asset 32 0.0% 32 (0) -1.1% 32 (0) -1.2%
Alternative 233 0.1% 248 (14) -5.8% 124 109 87.9%
Total 232,722 100% 232,872 (150) -0.1% 202,211 30,510 15.1%
Current Week WoW Change YTD Change
Source: Deutsche Bank, Bloomberg Finance LP, Reuters
Figure 5: New ETF launches
ETP Name IssuerAsset Class
& StructureExchange TER
Bloom-
berg
Reuters
Code
ANZ ETFS Physical Gold ETF ANZ Asset Management Commodity ETF ASX 0.40% ZGOL AU ZGOL.AX
Mirae Asset Tiger Synth-China A Inverse ETF Mirae Asset MAPS Global Investments Equity ETF KSE 0.59% 217780 KS 217780.KS
ANZ ETFS S&P 500 High Yield Low Volatility ETF ANZ Asset Management Equity ETF ASX 0.35% ZYUS AU ZYUS.AX
Shinhan BNPP Smart Synth CSI500 ETF H BNP Paribas Equity ETF KSE 0.60% 220130 KS 220130.KS
KB KStar Synth-US Oil&Gas E&P Company ETF-H KB Asset Management Commodity ETF KSE 0.25% 219390 KS 219390.KS
Samsung Kodex S&P500 Futures ETF H Samsung Asset Management Equity ETF KSE 0.25% 219480 KS 219480.KS
Huatai-PB CSI 500 ETF Huatai-PineBridge Fund Management Co Equity ETF Shanghai 0.00% 512510 CH 512510.SS Source: Deutsche Bank, Bloomberg Finance LP, Reuters

17 June 2015
Asia Pac Weekly ETF Market Review
Page 6 Deutsche Bank AG/Hong Kong
Country Breakdown
Figure 6: ETF Summary by listing country
Country #ETFs #Listings CF (US$m) Mkt Share (CF) TO (US$m) Mkt Share (TO) AUM (US$m) Mkt Share (AUM)
Australia 84 106 (33) 1.3% 215 0.4% 8,646 3.7%
China 110 110 (3,465) 137.1% 35,400 62.2% 34,577 14.9%
Hong Kong 91 151 (799) 31.6% 7,988 14.0% 46,025 19.8%
India 47 47 (3) 0.1% 60 0.1% 2,309 1.0%
Indonesia 7 7 16 -0.6% 0 0.0% 118 0.1%
Japan 138 183 1,455 -57.5% 9,258 16.3% 116,355 50.0%
Philippines 1 1 1 0.0% 0 0.0% 30 0.0%
Korea 172 172 (333) 13.2% 3,039 5.3% 16,281 7.0%
Malaysia 7 7 - 0.0% 0 0.0% 287 0.1%
New Zealand 5 5 - 0.0% 2 0.0% 293 0.1%
Singapore 9 94 0 0.0% 28 0.1% 1,593 0.7%
Vietnam 1 1 - 0.0% 0 0.0% 9 0.0%
Taiwan 24 27 635 -25.1% 914 1.6% 6,048 2.6%
Thailand 21 21 (0) 0.0% 2 0.0% 152 0.1%
Total 717 932 (2,528) 100.0% 56,907 100.0% 232,722 100.0%
Source: Deutsche Bank, Bloomberg Finance LP, Reuters
Figure 7: ETF Product Breakdown and Asset Class Market Share by Country – AUM US$ Million
Country Country Regional Sector Size Style Strategy ThematicEquity
Total
Fixed
IncomeComdty Other Equity Total Fixed Income Comdty
Australia 4,080 320 889 157 1,088 142 13 6,688 1,207 423 328 80.4% 14.5% 5.1%
China 26,292 - 2,859 265 1,097 66 547 31,127 3,376 74 - 90.0% 9.8% 0.2%
Hong Kong 41,068 108 203 25 223 92 20 41,740 4,159 126 - 90.7% 9.0% 0.3%
India 243 - 28 13 2 4 656 947 83 1,278 - 41.0% 3.6% 55.4%
Indonesia 48 - 27 - - - 43 118 - - - 100.0% 0.0% 0.0%
Japan 106,339 224 3,657 138 386 4,246 42 115,031 99 992 233 99.1% 0.1% 0.9%
Philippines 30 - - - - - - 30 - - - 100.0% 0.0% 0.0%
Korea 7,773 79 695 45 266 2,331 1,035 12,224 3,657 337 62 75.4% 22.6% 2.1%
Malaysia 6 1 - - - - 86 93 194 - - 32.5% 67.5% 0.0%
New Zealand 255 - - 38 - - - 293 - - - 100.0% 0.0% 0.0%
Singapore 998 45 - - 18 - - 1,061 533 - - 66.6% 33.4% 0.0%
Vietnam 9 - - - - - - 9 - - - 100.0% 0.0% 0.0%
Taiwan 4,961 - 100 - 146 779 25 6,011 - 37 - 99.4% 0.0% 0.6%
Thailand 88 2 15 6 2 - - 113 - 39 - 74.5% 0.0% 25.5%
Total 192,191 779 8,472 687 3,229 7,660 2,467 215,484 13,308 3,307 624 92.8% 5.7% 1.4%
Equity Product Type Asset Class Mkt Share by country
Source: Deutsche Bank, Bloomberg Finance LP, Reuters

17 June 2015
Asia Pac Weekly ETF Market Review
Deutsche Bank AG/Hong Kong Page 7
Figure 8: ETF Turnover (US$ Million) by Country
Figure 9: ETF AUM (US$ Million) by Country
- 5,000 10,000 15,000 20,000 25,000 30,000 35,000 40,000
Indonesia
Vietnam
Malaysia
Philippines
New Zealand
Thailand
Singapore
India
Australia
Taiwan
Korea
Hong Kong
Japan
China
TO (US$ Million)
- 20,000 40,000 60,000 80,000 100,000 120,000
Vietnam
Philippines
Indonesia
Thailand
Malaysia
New Zealand
Singapore
India
Taiwan
Australia
Korea
China
Hong Kong
Japan
AUM (US$ Million)
Source: Deutsche Bank, Bloomberg Finance LP, Reuters
Issuer Rankings
Net Cash Flows\
Figure 10: ETP inflows (US$ Million) by Issuer – Top 10
Issuer Equity Fixed Commo- Other Total YTD Total
Nomura Asset Management 1,125 - (18) - 1,107 5,692
Yuanta Securities Inv trust Co Ltd. 682 - - - 682 (59)
China Asset Management 667 - - - 667 (2,606)
Yinhua Fund Management (1) 230 - - 229 1,010
Nikko Asset Management 180 - - - 180 3,474
Daiwa Asset Management 164 - - - 164 1,474
State Street 68 5 - - 73 1,672
Mirae Asset MAPS Global Investments (15) 77 (8) - 54 179
Hang Seng Investment Management 44 - - - 44 4,472
NZAM 18 - - - 18 66
Total Top 10 (Inflows) 2,932 311 (26) - 3,218 15,374
Current Week inflows (US$ Million)
Source: Deutsche Bank, Bloomberg Finance LP, Reuters
Figure 11: ETP outflows (US$ Million) by Issuer – Top 10
Issuer Equity Fixed Commo- Other Total YTD Total
Huatai-PineBridge Fund Management Co (3,100) - - - (3,100) (5,245)
Harvest Fund Management Co (617) (0) - - (617) (4,689)
China Southern Fund Management Co Ltd (395) - - - (395) (1,074)
CSOP Asset Management (374) 24 - - (349) (2,459)
E Fund Management (331) - 2 - (329) (543)
BlackRock (259) 9 - - (250) (4,806)
Samsung Asset Management (292) 82 2 - (209) (1,576)
Korea Investment Trust Mg (120) 17 - - (103) (328)
China Universal Asset Management Co (68) - - - (68) 337
Huaan Fund Management (55) - 5 - (50) (2,474)
Total Top 10 (Outflows) (5,610) 132 8 - (5,470) (22,857)
Current Week outflows (US$ Million)
Source: Deutsche Bank, Bloomberg Finance LP, Reuters

17 June 2015
Asia Pac Weekly ETF Market Review
Page 8 Deutsche Bank AG/Hong Kong
Turnover
Turnover information
Weekly Turnover definition: The turnover figure reported in this publication corresponds to the aggregated dollar value traded turnover (in US$) over a 1-week span. It is calculated by multiplying the on exchange daily volume in shares by the end of day price for the ETP, for each day within a certain week, after which the daily turnover is aggregated for all the days within the week generating the total weekly turnover figure.
Note on Turnover The liquidity of an ETF is not fully captured by its exchange turnover as exchange turnover does not reflect over-the-counter (OTC) trades or trades done at net asset value (NAV). The presence of a market marker is mandatory in most exchanges. The market marker is legally obliged to provide continuous price quotes for an ETF even when the ETF is not being actively traded.
Figure 12: ETP Turnover (US$ Million) by Issuer – Top 40
Issuer EquityFixed
Income
Commo-
dityOther Total
Mkt
Share %
China Asset Management 9,692.4 - - - 9,692.4 17.0%
Nomura Asset Management 7,912.6 - 32.2 - 7,944.7 14.0%
E Fund Management 4,814.8 2,924.8 4.6 - 7,744.2 13.6%
Huatai-PineBridge Fund Management Co 5,704.7 - - - 5,704.7 10.0%
China Southern Fund Management Co Ltd 439.7 3,201.0 - - 3,640.6 6.4%
BlackRock 2,322.6 4.8 - - 2,327.4 4.1%
CSOP Asset Management 2,218.5 0.7 - - 2,219.3 3.9%
Samsung Asset Management 2,100.8 29.5 4.1 - 2,134.3 3.8%
Guotai Asset Management Co Ltd 964.5 1,101.7 21.6 - 2,087.9 3.7%
Yinhua Fund Management 1.1 2,083.4 - - 2,084.5 3.7%
State Street 1,730.3 1.9 8.0 - 1,740.2 3.1%
Huaan Fund Management 1,407.3 - 36.4 - 1,443.7 2.5%
Hang Seng Investment Management 1,095.7 - - - 1,095.7 1.9%
Harvest Fund Management Co 1,002.1 0.2 - - 1,002.3 1.8%
Simplex Asset Management Co Ltd 649.1 - 42.8 - 691.9 1.2%
Mirae Asset MAPS Global Investments 505.3 1.0 43.4 - 549.7 1.0%
Lion Fund Management Co Ltd 487.9 - - - 487.9 0.9%
China Merchants Fund Management Co 44.8 441.9 - - 486.7 0.9%
GF Fund Management Co Ltd 480.2 - - - 480.2 0.8%
Fubon Securities Investment Trust Co 469.6 - - - 469.6 0.8%
Yuanta Securities Inv trust Co Ltd. 335.4 - 7.3 - 342.7 0.6%
Invesco Great Wall Fund Management Co. Ltd 279.2 - - - 279.2 0.5%
Daiwa Asset Management 270.1 - - - 270.1 0.5%
Nikko Asset Management 226.9 1.5 - - 228.4 0.4%
GTJA Allianze Fund Management Co 186.5 - - - 186.5 0.3%
Woori Asset Management 6.5 159.8 - 2.0 168.4 0.3%
Bosera Fund Management Co Ltd 134.5 0.2 0.1 - 134.9 0.2%
ICBC Credit Suisse Asset Management 125.7 - - - 125.7 0.2%
BOCOM Schroders 123.5 - - - 123.5 0.2%
BOCI - Prudential Asset Man Ltd 110.5 - - - 110.5 0.2%
Korea Investment Trust Mg 107.5 0.6 - - 108.1 0.2%
China Universal Asset Management Co 24.5 62.5 - - 87.0 0.2%
Cathay Securities Investment Trust 65.7 - - - 65.7 0.1%
Mitsubishi UFJ Asset Mg 61.8 - - - 61.8 0.1%
Fortune SGAM Fund Management 55.2 - - - 55.2 0.1%
Goldman Sachs 18.4 32.9 3.7 - 55.1 0.1%
KB Asset Management 50.8 3.5 0.0 0.4 54.8 0.1%
HFT Investment Management Co Ltd 49.7 0.1 - - 49.8 0.1%
BetaShares Capital Ltd 21.9 15.3 1.2 8.5 46.9 0.1%
Dacheng Fund Management Co Ltd 42.3 - - - 42.3 0.1%
Total (Top 40) 46,341 10,067 205 11 56,625 99.5%
Current Week Turnover (US$ Million)
Source: Deutsche Bank, Bloomberg Finance LP, Reuters
17 June 2015
Asia Pac Weekly ETF Market Review
Deutsche Bank AG/Hong Kong Page 9
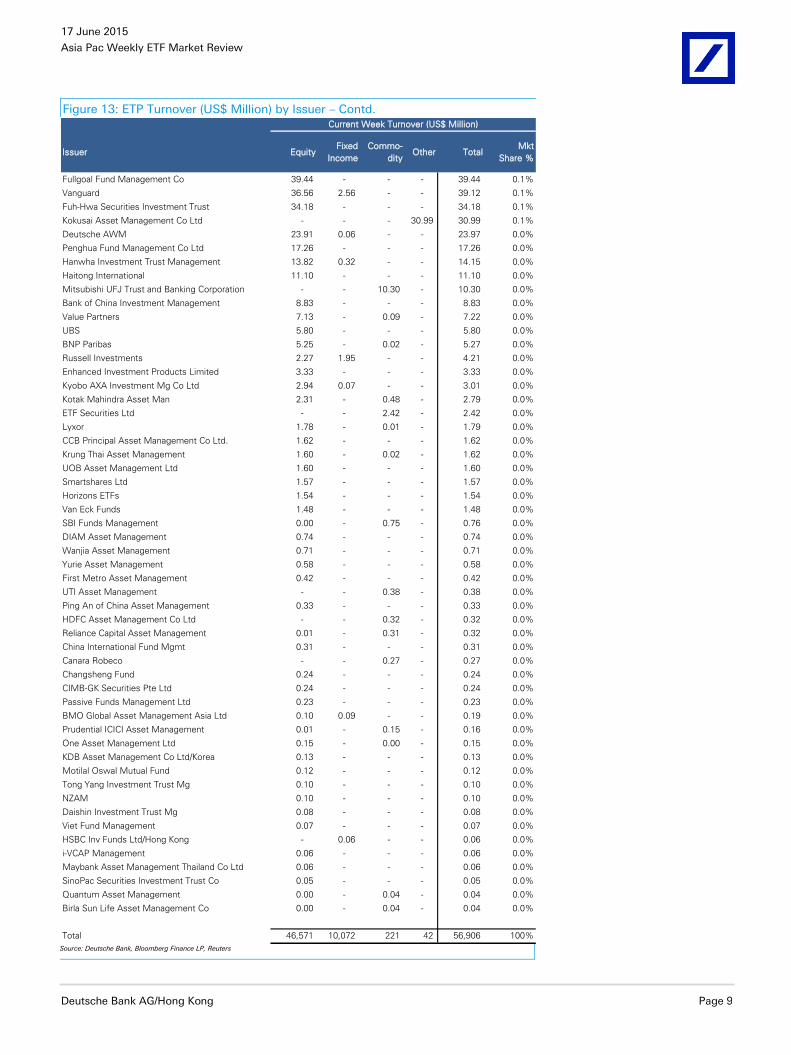
Figure 13: ETP Turnover (US$ Million) by Issuer – Contd.
Issuer EquityFixed
Income
Commo-
dityOther Total
Mkt
Share %
Fullgoal Fund Management Co 39.44 - - - 39.44 0.1%
Vanguard 36.56 2.56 - - 39.12 0.1%
Fuh-Hwa Securities Investment Trust 34.18 - - - 34.18 0.1%
Kokusai Asset Management Co Ltd - - - 30.99 30.99 0.1%
Deutsche AWM 23.91 0.06 - - 23.97 0.0%
Penghua Fund Management Co Ltd 17.26 - - - 17.26 0.0%
Hanwha Investment Trust Management 13.82 0.32 - - 14.15 0.0%
Haitong International 11.10 - - - 11.10 0.0%
Mitsubishi UFJ Trust and Banking Corporation - - 10.30 - 10.30 0.0%
Bank of China Investment Management 8.83 - - - 8.83 0.0%
Value Partners 7.13 - 0.09 - 7.22 0.0%
UBS 5.80 - - - 5.80 0.0%
BNP Paribas 5.25 - 0.02 - 5.27 0.0%
Russell Investments 2.27 1.95 - - 4.21 0.0%
Enhanced Investment Products Limited 3.33 - - - 3.33 0.0%
Kyobo AXA Investment Mg Co Ltd 2.94 0.07 - - 3.01 0.0%
Kotak Mahindra Asset Man 2.31 - 0.48 - 2.79 0.0%
ETF Securities Ltd - - 2.42 - 2.42 0.0%
Lyxor 1.78 - 0.01 - 1.79 0.0%
CCB Principal Asset Management Co Ltd. 1.62 - - - 1.62 0.0%
Krung Thai Asset Management 1.60 - 0.02 - 1.62 0.0%
UOB Asset Management Ltd 1.60 - - - 1.60 0.0%
Smartshares Ltd 1.57 - - - 1.57 0.0%
Horizons ETFs 1.54 - - - 1.54 0.0%
Van Eck Funds 1.48 - - - 1.48 0.0%
SBI Funds Management 0.00 - 0.75 - 0.76 0.0%
DIAM Asset Management 0.74 - - - 0.74 0.0%
Wanjia Asset Management 0.71 - - - 0.71 0.0%
Yurie Asset Management 0.58 - - - 0.58 0.0%
First Metro Asset Management 0.42 - - - 0.42 0.0%
UTI Asset Management - - 0.38 - 0.38 0.0%
Ping An of China Asset Management 0.33 - - - 0.33 0.0%
HDFC Asset Management Co Ltd - - 0.32 - 0.32 0.0%
Reliance Capital Asset Management 0.01 - 0.31 - 0.32 0.0%
China International Fund Mgmt 0.31 - - - 0.31 0.0%
Canara Robeco - - 0.27 - 0.27 0.0%
Changsheng Fund 0.24 - - - 0.24 0.0%
CIMB-GK Securities Pte Ltd 0.24 - - - 0.24 0.0%
Passive Funds Management Ltd 0.23 - - - 0.23 0.0%
BMO Global Asset Management Asia Ltd 0.10 0.09 - - 0.19 0.0%
Prudential ICICI Asset Management 0.01 - 0.15 - 0.16 0.0%
One Asset Management Ltd 0.15 - 0.00 - 0.15 0.0%
KDB Asset Management Co Ltd/Korea 0.13 - - - 0.13 0.0%
Motilal Oswal Mutual Fund 0.12 - - - 0.12 0.0%
Tong Yang Investment Trust Mg 0.10 - - - 0.10 0.0%
NZAM 0.10 - - - 0.10 0.0%
Daishin Investment Trust Mg 0.08 - - - 0.08 0.0%
Viet Fund Management 0.07 - - - 0.07 0.0%
HSBC Inv Funds Ltd/Hong Kong - 0.06 - - 0.06 0.0%
i-VCAP Management 0.06 - - - 0.06 0.0%
Maybank Asset Management Thailand Co Ltd 0.06 - - - 0.06 0.0%
SinoPac Securities Investment Trust Co 0.05 - - - 0.05 0.0%
Quantum Asset Management 0.00 - 0.04 - 0.04 0.0%
Birla Sun Life Asset Management Co 0.00 - 0.04 - 0.04 0.0%
Total 46,571 10,072 221 42 56,906 100%
Current Week Turnover (US$ Million)
Source: Deutsche Bank, Bloomberg Finance LP, Reuters
17 June 2015
Asia Pac Weekly ETF Market Review
Page 10 Deutsche Bank AG/Hong Kong
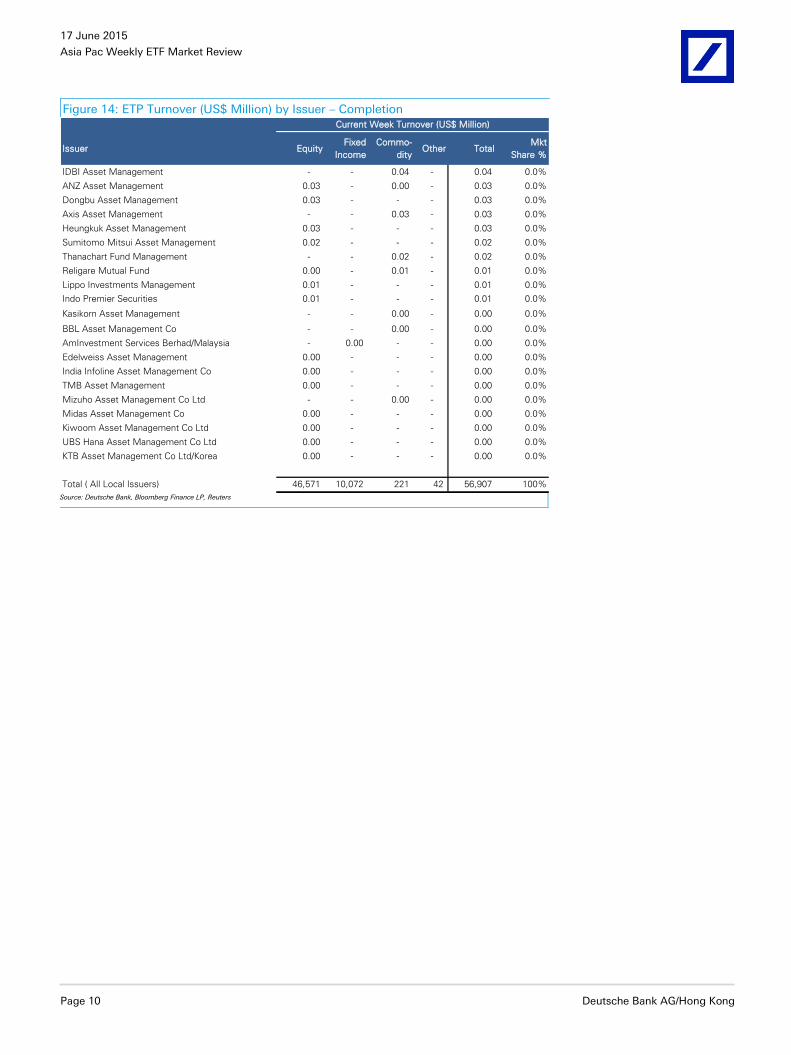
Figure 14: ETP Turnover (US$ Million) by Issuer – Completion
Issuer EquityFixed
Income
Commo-
dityOther Total
Mkt
Share %
IDBI Asset Management - - 0.04 - 0.04 0.0%
ANZ Asset Management 0.03 - 0.00 - 0.03 0.0%
Dongbu Asset Management 0.03 - - - 0.03 0.0%
Axis Asset Management - - 0.03 - 0.03 0.0%
Heungkuk Asset Management 0.03 - - - 0.03 0.0%
Sumitomo Mitsui Asset Management 0.02 - - - 0.02 0.0%
Thanachart Fund Management - - 0.02 - 0.02 0.0%
Religare Mutual Fund 0.00 - 0.01 - 0.01 0.0%
Lippo Investments Management 0.01 - - - 0.01 0.0%
Indo Premier Securities 0.01 - - - 0.01 0.0%
Kasikorn Asset Management - - 0.00 - 0.00 0.0%
BBL Asset Management Co - - 0.00 - 0.00 0.0%
AmInvestment Services Berhad/Malaysia - 0.00 - - 0.00 0.0%
Edelweiss Asset Management 0.00 - - - 0.00 0.0%
India Infoline Asset Management Co 0.00 - - - 0.00 0.0%
TMB Asset Management 0.00 - - - 0.00 0.0%
Mizuho Asset Management Co Ltd - - 0.00 - 0.00 0.0%
Midas Asset Management Co 0.00 - - - 0.00 0.0%
Kiwoom Asset Management Co Ltd 0.00 - - - 0.00 0.0%
UBS Hana Asset Management Co Ltd 0.00 - - - 0.00 0.0%
KTB Asset Management Co Ltd/Korea 0.00 - - - 0.00 0.0%
Total ( All Local Issuers) 46,571 10,072 221 42 56,907 100%
Current Week Turnover (US$ Million)
Source: Deutsche Bank, Bloomberg Finance LP, Reuters

17 June 2015
Asia Pac Weekly ETF Market Review
Deutsche Bank AG/Hong Kong Page 11
AUM
AUM information
Assets Under Management (AUM): Calculated as NAV times Number of Shares Outstanding or Price times Number of Shares Outstanding.
AUM Universe The Assets Under Management (AUM) of the ETFs that have been cross-listed in Asia is not taken in account in this report. Please refer to Figure 18 for details on Foreign Issuers’ AUMs.
Figure 15: ETP AUM (US$ Million) ranking by Local Issuer – Top 40
Issuer EquityFixed
Income
Commo-
dityOther Total
Mkt
Share %
Nomura Asset Management 54,836 - 309 - 55,145 23.7%
Nikko Asset Management 23,490 504 - - 23,994 10.3%
Daiwa Asset Management 22,785 - - - 22,785 9.8%
State Street 14,629 3,133 - - 17,762 7.6%
Hang Seng Investment Management 14,138 - 9 - 14,148 6.1%
China Asset Management 12,684 - - - 12,684 5.5%
BlackRock 11,738 335 - - 12,073 5.2%
Mitsubishi UFJ Asset Mg 9,392 - - - 9,392 4.0%
Samsung Asset Management 6,517 1,565 72 - 8,154 3.5%
Harvest Fund Management Co 6,219 4 - - 6,223 2.7%
E Fund Management 4,424 288 11 - 4,723 2.0%
Yuanta Securities Inv trust Co Ltd. 4,298 - 37 - 4,335 1.9%
CSOP Asset Management 3,747 473 - - 4,219 1.8%
Mirae Asset MAPS Global Investments 2,625 733 255 - 3,614 1.6%
Huatai-PineBridge Fund Management Co 2,993 - - - 2,993 1.3%
China Southern Fund Management Co Ltd 2,467 177 - - 2,644 1.1%
Vanguard 1,760 192 - - 1,952 0.8%
Yinhua Fund Management 26 1,724 - - 1,750 0.8%
BetaShares Capital Ltd 516 546 49 328 1,439 0.6%
Goldman Sachs 825 83 408 - 1,316 0.6%
Fubon Securities Investment Trust Co 1,249 - - - 1,249 0.5%
GF Fund Management Co Ltd 1,232 - - - 1,232 0.5%
BOCI - Prudential Asset Man Ltd 1,057 - - - 1,057 0.5%
KB Asset Management 569 443 9 32 1,053 0.5%
Korea Investment Trust Mg 925 122 - - 1,047 0.4%
HFT Investment Management Co Ltd 34 1,002 - - 1,036 0.4%
Simplex Asset Management Co Ltd 717 - 316 - 1,033 0.4%
Huaan Fund Management 898 - 52 - 949 0.4%
DIAM Asset Management 909 - - - 909 0.4%
Hanwha Investment Trust Management 525 319 - - 844 0.4%
Kyobo AXA Investment Mg Co Ltd 647 144 - - 791 0.3%
NZAM 782 - - - 782 0.3%
China Universal Asset Management Co 623 60 - - 683 0.3%
Woori Asset Management 268 331 - 30 630 0.3%
Russell Investments 231 261 - - 493 0.2%
Guotai Asset Management Co Ltd 379 69 11 - 458 0.2%
Sumitomo Mitsui Asset Management 429 - - - 429 0.2%
Reliance Capital Asset Management 13 - 398 - 411 0.2%
ETF Securities Ltd - - 389 - 389 0.2%
HSBC Inv Funds Ltd/Hong Kong - 388 - - 388 0.2%
Total (Top 40) 211,592 12,897 2,326 390 227,206 97.6%
Current Week AUM (US$ Million)
Source: Deutsche Bank, Bloomberg Finance LP, Reuters

17 June 2015
Asia Pac Weekly ETF Market Review
Page 12 Deutsche Bank AG/Hong Kong
Figure 16: ETP AUM (US$ Million) ranking by Local Issuer – Contd.
Issuer EquityFixed
Income
Commo-
dityOther Total
Mkt
Share %
Mitsubishi UFJ Trust and Banking Corporation - - 367 - 367 0.2%
UBS 356 - - - 356 0.2%
China Merchants Fund Management Co 85 169 - - 255 0.1%
Fuh-Hwa Securities Investment Trust 243 - - - 243 0.1%
BOCOM Schroders 241 - - - 241 0.1%
Kokusai Asset Management Co Ltd - - - 233 233 0.1%
Bosera Fund Management Co Ltd 193 36 1 - 229 0.1%
Smartshares Ltd 228 - - - 228 0.1%
Cathay Securities Investment Trust 210 - - - 210 0.1%
Horizons ETFs 197 - - - 197 0.1%
AmInvestment Services Berhad/Malaysia 1 194 - - 195 0.1%
Kotak Mahindra Asset Man 35 - 150 - 185 0.1%
Value Partners 71 - 101 - 172 0.1%
Invesco Great Wall Fund Management Co. Ltd 170 - - - 170 0.1%
ICBC Credit Suisse Asset Management 163 - - - 163 0.1%
Indo Premier Securities 118 - - - 118 0.1%
Haitong International 116 - - - 116 0.0%
Van Eck Funds 111 - - - 111 0.0%
HDFC Asset Management Co Ltd - - 99 - 99 0.0%
Fortune SGAM Fund Management 93 - - - 93 0.0%
Enhanced Investment Products Limited 92 - - - 92 0.0%
Dacheng Fund Management Co Ltd 91 - - - 91 0.0%
UTI Asset Management - - 90 - 90 0.0%
i-VCAP Management 86 - - - 86 0.0%
One Asset Management Ltd 76 - 3 - 78 0.0%
CIMB-GK Securities Pte Ltd 68 - - - 68 0.0%
Passive Funds Management Ltd 65 - - - 65 0.0%
Yurie Asset Management 56 - - - 56 0.0%
Penghua Fund Management Co Ltd 56 - - - 56 0.0%
CCB Principal Asset Management Co Ltd. 55 - - - 55 0.0%
Prudential ICICI Asset Management 35 - 19 - 54 0.0%
UOB Asset Management Ltd 51 - - - 51 0.0%
Lion Fund Management Co Ltd 49 - - - 49 0.0%
GTJA Allianze Fund Management Co 48 - - - 48 0.0%
BMO Global Asset Management Asia Ltd 36 12 - - 48 0.0%
Fullgoal Fund Management Co 42 - - - 42 0.0%
BNP Paribas 38 - - - 38 0.0%
Krung Thai Asset Management 26 - 11 - 37 0.0%
SBI Funds Management 3 - 33 - 37 0.0%
Motilal Oswal Mutual Fund 29 - 8 - 36 0.0%
Axis Asset Management - - 36 - 36 0.0%
Ping An of China Asset Management 31 - - - 31 0.0%
Midas Asset Management Co 31 - - - 31 0.0%
Dongbu Asset Management 31 - - - 31 0.0%
First Metro Asset Management 30 - - - 30 0.0%
IDBI Asset Management - - 15 - 15 0.0%
UBS Hana Asset Management Co Ltd 12 - - - 12 0.0%
Birla Sun Life Asset Management Co 3 - 9 - 12 0.0%
Lippo Investments Management 12 - - - 12 0.0%
Bank of China Investment Management 11 - - - 11 0.0%
Total 215,386 13,308 3,267 624 232,585 100%
Current Week AUM (US$ Million)
Source: Deutsche Bank, Bloomberg Finance LP, Reuters

17 June 2015
Asia Pac Weekly ETF Market Review
Deutsche Bank AG/Hong Kong Page 13
Figure 17: ETP AUM (US$ Million) ranking by Local Issuer – Completion
Issuer EquityFixed
Income
Commo-
dityOther Total
Mkt
Share %
Tong Yang Investment Trust Mg 11 - - - 11 0.0%
Daishin Investment Trust Mg 11 - - - 11 0.0%
SinoPac Securities Investment Trust Co 11 - - - 11 0.0%
BBL Asset Management Co - - 10 - 10 0.0%
Kiwoom Asset Management Co Ltd 10 - - - 10 0.0%
KTB Asset Management Co Ltd/Korea 10 - - - 10 0.0%
Maybank Asset Management Thailand Co Ltd 9 - - - 9 0.0%
Viet Fund Management 9 - - - 9 0.0%
Kasikorn Asset Management - - 8 - 8 0.0%
Heungkuk Asset Management 8 - - - 8 0.0%
Thanachart Fund Management - - 7 - 7 0.0%
Religare Mutual Fund 1 - 6 - 7 0.0%
Quantum Asset Management 0 - 6 - 6 0.0%
KDB Asset Management Co Ltd/Korea 5 - - - 5 0.0%
Changsheng Fund 4 - - - 4 0.0%
China International Fund Mgmt 4 - - - 4 0.0%
TMB Asset Management 2 - - - 2 0.0%
Edelweiss Asset Management 2 - - - 2 0.0%
Canara Robeco - - 2 - 2 0.0%
Wanjia Asset Management 1 - - - 1 0.0%
India Infoline Asset Management Co 1 - - - 1 0.0%
Mizuho Asset Management Co Ltd - - 1 - 1 0.0%
Total ( All Local Issuers) 215,484 13,308 3,307 624 232,722 100%
Current Week AUM (US$ Million)
Source: Deutsche Bank, Bloomberg Finance LP, Reuters
Figure 18: ETP AUM (US$ Million) ranking by Foreign Issuer
Issuer EquityFixed
IncomeCommodity Other Total
Mkt
Share %
BlackRock 308,489 - - - 308,489 47.3%
State Street 189,739 - 26,765 - 216,505 33.2%
Vanguard 71,485 - - - 71,485 11.0%
Deutsche AWM 25,607 2,223 528 - 28,357 4.3%
Lyxor 9,360 - 1,169 - 10,529 1.6%
UBS 8,189 - - 214 8,403 1.3%
ETF Securities Ltd - - 7,944 - 7,944 1.2%
BNP Paribas - - 315 - 315 0.0%
Total ( All Foreign Issuers) 612,869 2,223 36,721 214 652,026 100%
Current Week AUM (US$ Million)
Source: Deutsche Bank, Bloomberg Finance LP, Reuters
The Foreign Issuer AUM
ranking includes the AUM of
all products cross listed in the
Asia-Pacific Region, with a
domicile region outside Asia-
Pacific (e.g. the US or Europe)

17 June 2015
Asia Pac Weekly ETF Market Review
Page 14 Deutsche Bank AG/Hong Kong
2. ETP – Net Cash Flows
Investment Focus
Figure 19: ETP Net Cash Flows (US$ Million) by Investment Focus – Equity
Investment Focus - EquityNet
Cashflow
% of
AUM
Net
Cashflow
% of
AUM
Net
Cashflow
% of
AUM
Developed Markets 775 0.6% (197) -0.2% 15,071 15.2%
Emerging Markets (4,304) -6.4% (3,267) -4.9% (23,882) -34.8%
Global Markets - 0.0% - 0.0% 22 15.3%
Sectors 31 0.4% (116) -1.4% 1,215 19.8%
Capitalization (13) -1.9% (2) -0.4% (187) -24.8%
Strategy 732 10.7% 64 0.9% (883) -11.8%
Style (67) -2.1% 124 4.0% (154) -5.6%
Thematic (39) -1.5% (49) -1.9% 104 4.8%
Total (2,885) -1.3% (3,444) -1.6% (8,694) -4.6%
Current Week Prev. Week YTD
Source: Deutsche Bank, Bloomberg Finance LP, Reuters
Figure 20: ETP Net Cash Flows (US$ Million) by Investment Focus – Fixed Income
Investment Focus - Fixed IncomeNet
Cashflow
% of
AUM
Net
Cashflow
% of
AUM
Net
Cashflow
% of
AUM
Sovereign 57 0.8% (0) 0.0% 366 5.2%
Corporates - 0.0% - 0.0% (75) -6.5%
Money Market 348 8.5% 227 5.6% 1,486 46.5%
Overall 0 0.1% 1 0.2% 54 15.2%
Total 406 3.1% 228 1.7% 1,832 15.5%
Current Week Prev. Week YTD
Source: Deutsche Bank, Bloomberg Finance LP, Reuters
Figure 21: ETP Net Cash Flows (US$ Million) by Investment Focus – Commodity
Investment Focus - CommodityNet
Cashflow
% of
AUM
Net
Cashflow
% of
AUM
Net
Cashflow
% of
AUM
Precious Metals (4.8) -0.2% 0.3 0.0% 179.7 7.3%
Energy (43.1) -5.2% (49.3) -5.7% 558.6 435.0%
Agriculture - 0.0% 0.0 0.1% 7.4 27.5%
Industrial Metals - 0.0% - 0.0% 0.5 3.2%
Total (48) -1.5% (49) -1.4% 748 28.5%
YTDPrev. WeekCurrent Week
Source: Deutsche Bank, Bloomberg Finance LP, Reuters

17 June 2015
Asia Pac Weekly ETF Market Review
Deutsche Bank AG/Hong Kong Page 15
Sub Segment
Figure 22: ETP Net Cash Flows (US$ Million) by Investment Focus Sub Segment – Equity – Developed Markets
Investment Focus
Developed Markets - Equity
Net
Cashflow
% of
AUM
Net
Cashflow
% of
AUM
Net
Cashflow
% of
AUM
Australia 12 0.3% 49 1.2% 364 9.3%
Hong Kong 76 0.4% 108 0.6% 1,854 13.8%
Japan 676 0.7% (352) -0.3% 12,900 16.0%
New Zealand - 0.0% - 0.0% 3 2.0%
Singapore - 0.0% - 0.0% (93) -22.3%
Asia Pacific 765 0.6% (196) -0.2% 15,027 15.3%
Germany (2) -3.0% (1) -1.6% (75) -51.8%
US - 0.0% (0) -0.1% (3) -1.5%
Global broad indices 13 2.7% (0) 0.0% 122 35.6%
DM Total 775 0.6% (197) -0.2% 15,071 15.2%
Current Week Prev. Week YTD
Source: Deutsche Bank, Bloomberg Finance LP, Reuters
Figure 23: ETP Net Cash Flows (US$ Million) by Investment Focus Sub Segment – Equity – Emerging Markets
Investment Focus
Emerging Markets - Equity
Net
Cashflow
% of
AUM
Net
Cashflow
% of
AUM
Net
Cashflow
% of
AUM
China (4,499) -8.1% (3,068) -5.6% (22,597) -40.7%
India 1 0.1% (0) 0.0% 29 2.6%
Indonesia 14 31.2% - 0.0% 33 120.0%
Malaysia - 0.0% - 0.0% 2 19.2%
Philippines 1 3.3% (0) 0.0% 9 42.2%
South Korea (561) -7.1% (98) -1.1% (1,701) -18.4%
Taiwan 740 33.6% (97) -4.0% 359 14.4%
Thailand - 0.0% (4) -4.5% (5) -4.7%
Vietnam - 0.0% - 0.0% - 0.0%
Asia Pacific broad - 0.0% - 0.0% - 0.0%
Asia Pacific (4,304) -6.4% (3,267) -4.9% (23,871) -34.8%
Brazil 0 0.0% 0 0.0% 3 6.9%
LATAM broad - 0.0% - 0.0% - 0.0%
Latin America 0 0.0% 0 0.0% 3 6.3%
Russia (0) 0.0% (0) 0.0% (2) -9.7%
South Africa 0 0.1% 0 0.0% (10) -55.5%
Global broad indices - 0.0% - 0.0% (2) -1.7%
EM Total (4,304) -6.4% (3,267) -4.9% (23,882) -34.8%
Current Week Prev. Week YTD
Source: Deutsche Bank, Bloomberg Finance LP, Reuters

17 June 2015
Asia Pac Weekly ETF Market Review
Page 16 Deutsche Bank AG/Hong Kong
Figure 24: ETP Net Cash Flows (US$ Million) by Investment Focus Sub Segment – Equity - Others
Investment Focus
Sub segments - Equity
Net
Cashflow
% of
AUM
Net
Cashflow
% of
AUM
Net
Cashflow
% of
AUM
Consumer Discretionary (11) -2.2% (19) -3.9% 151 61.5%
Consumer Staples (42) -5.0% (70) -8.0% 420 212.1%
Energy (0) -0.1% (1) -2.0% (11) -20.6%
Financials 96 1.8% (51) -0.9% 905 19.9%
Healthcare 17 4.0% 19 4.9% (138) -33.6%
Industrials (12) -7.4% (6) -4.3% (29) -45.1%
Information Technology 29 7.8% 22 6.7% 102 45.5%
Materials (46) -16.6% (7) -2.4% (94) -44.1%
Telecommunication Services - 0.0% - 0.0% (0) -8.4%
Utilities (0) 0.0% - 0.0% (0) -0.2%
Overall (0) -0.2% (3) -1.9% (91) -55.2%
Sector 31 0.4% (116) -1.4% 1,215 19.8%
Large Cap (7) -1.9% 4 1.1% (120) -29.2%
Mid Cap (6) -3.5% (6) -3.9% (80) -41.2%
Small Cap - 0.0% (0) -0.1% 14 9.2%
Capitalization (13) -1.9% (2) -0.4% (187) -24.8%
Short (47) -3.1% (32) -2.0% 912 114.2%
Leveraged 817 21.4% 82 2.2% (2,623) -44.7%
Leveraged Short (36) -3.5% 14 1.4% 901 293.6%
Quantitative (0) -0.1% 1 0.5% (10) -3.7%
Fundamental (1) -0.6% (2) -0.7% (63) -25.0%
Strategy 732 10.7% 64 0.9% (883) -11.8%
Growth (30) -3.4% 144 21.8% 21 5.4%
Value (1) -0.5% (3) -1.4% (104) -36.0%
Dividend (37) -1.7% (16) -0.7% (71) -3.5%
Style (67) -2.1% 124 4.0% (154) -5.6%
Sustainability (1) -1.4% (1) -1.5% (42) -45.3%
Commodities (1) -0.9% (2) -4.6% (19) -37.0%
Other Theme (37) -1.5% (46) -1.9% 164 8.0%
Thematic (39) -1.5% (49) -1.9% 104 4.8%
Total 645 3.0% 20 0.1% 95 0.5%
Current Week Prev. Week YTD
Source: Deutsche Bank, Bloomberg Finance LP, Reuters
17 June 2015
Asia Pac Weekly ETF Market Review
Deutsche Bank AG/Hong Kong Page 17
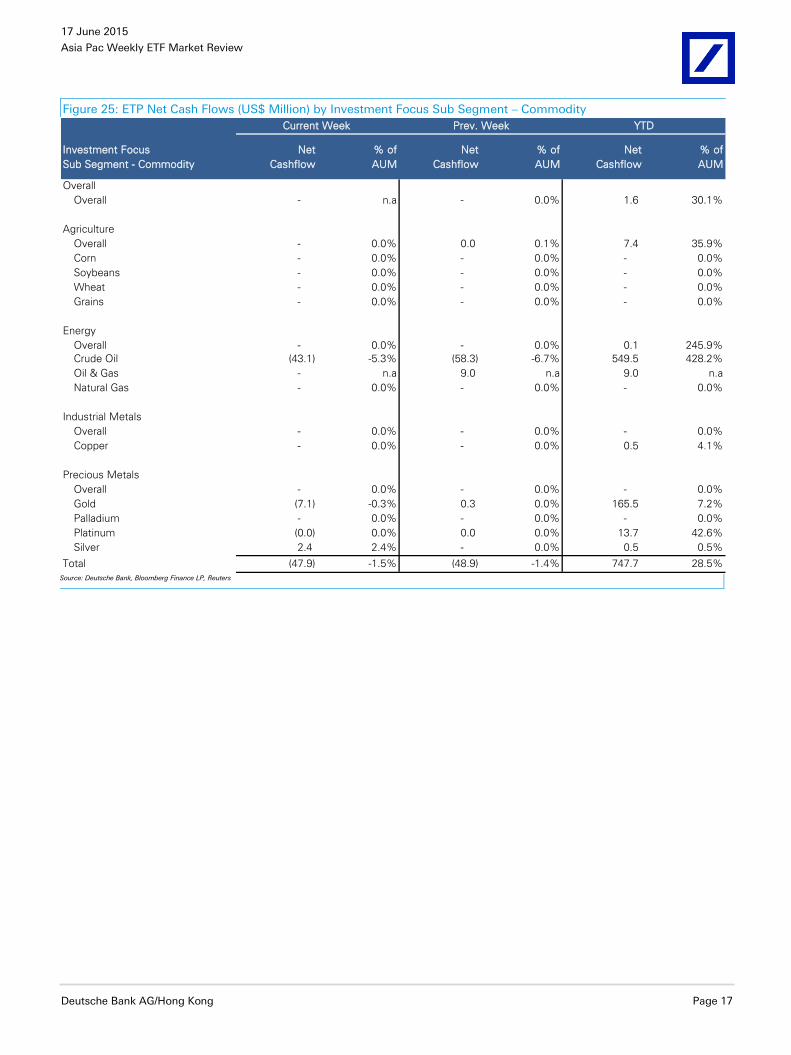
Figure 25: ETP Net Cash Flows (US$ Million) by Investment Focus Sub Segment – Commodity
Investment Focus
Sub Segment - Commodity
Net
Cashflow
% of
AUM
Net
Cashflow
% of
AUM
Net
Cashflow
% of
AUM
Overall
Overall - n.a - 0.0% 1.6 30.1%
Agriculture
Overall - 0.0% 0.0 0.1% 7.4 35.9%
Corn - 0.0% - 0.0% - 0.0%
Soybeans - 0.0% - 0.0% - 0.0%
Wheat - 0.0% - 0.0% - 0.0%
Grains - 0.0% - 0.0% - 0.0%
Energy
Overall - 0.0% - 0.0% 0.1 245.9%
Crude Oil (43.1) -5.3% (58.3) -6.7% 549.5 428.2%
Oil & Gas - n.a 9.0 n.a 9.0 n.a
Natural Gas - 0.0% - 0.0% - 0.0%
Industrial Metals
Overall - 0.0% - 0.0% - 0.0%
Copper - 0.0% - 0.0% 0.5 4.1%
Precious Metals
Overall - 0.0% - 0.0% - 0.0%
Gold (7.1) -0.3% 0.3 0.0% 165.5 7.2%
Palladium - 0.0% - 0.0% - 0.0%
Platinum (0.0) 0.0% 0.0 0.0% 13.7 42.6%
Silver 2.4 2.4% - 0.0% 0.5 0.5%
Total (47.9) -1.5% (48.9) -1.4% 747.7 28.5%
Prev. WeekCurrent Week YTD
Source: Deutsche Bank, Bloomberg Finance LP, Reuters
17 June 2015
Asia Pac Weekly ETF Market Review
Page 18 Deutsche Bank AG/Hong Kong
Issuer
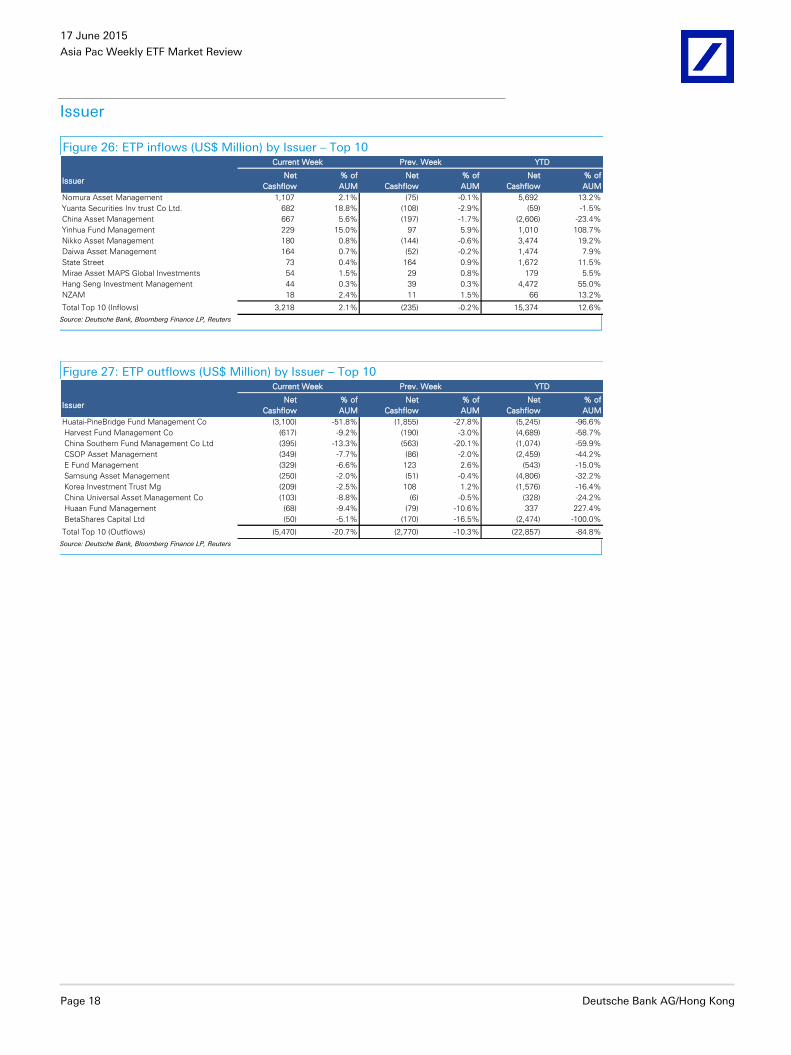
Figure 26: ETP inflows (US$ Million) by Issuer – Top 10
IssuerNet
Cashflow
% of
AUM
Net
Cashflow
% of
AUM
Net
Cashflow
% of
AUM
Nomura Asset Management 1,107 2.1% (75) -0.1% 5,692 13.2%
Yuanta Securities Inv trust Co Ltd. 682 18.8% (108) -2.9% (59) -1.5%
China Asset Management 667 5.6% (197) -1.7% (2,606) -23.4%
Yinhua Fund Management 229 15.0% 97 5.9% 1,010 108.7%
Nikko Asset Management 180 0.8% (144) -0.6% 3,474 19.2%
Daiwa Asset Management 164 0.7% (52) -0.2% 1,474 7.9%
State Street 73 0.4% 164 0.9% 1,672 11.5%
Mirae Asset MAPS Global Investments 54 1.5% 29 0.8% 179 5.5%
Hang Seng Investment Management 44 0.3% 39 0.3% 4,472 55.0%
NZAM 18 2.4% 11 1.5% 66 13.2%
Total Top 10 (Inflows) 3,218 2.1% (235) -0.2% 15,374 12.6%
Current Week Prev. Week YTD
Source: Deutsche Bank, Bloomberg Finance LP, Reuters
Figure 27: ETP outflows (US$ Million) by Issuer – Top 10
IssuerNet
Cashflow
% of
AUM
Net
Cashflow
% of
AUM
Net
Cashflow
% of
AUM
Huatai-PineBridge Fund Management Co (3,100) -51.8% (1,855) -27.8% (5,245) -96.6%
Harvest Fund Management Co (617) -9.2% (190) -3.0% (4,689) -58.7%
China Southern Fund Management Co Ltd (395) -13.3% (563) -20.1% (1,074) -59.9%
CSOP Asset Management (349) -7.7% (86) -2.0% (2,459) -44.2%
E Fund Management (329) -6.6% 123 2.6% (543) -15.0%
Samsung Asset Management (250) -2.0% (51) -0.4% (4,806) -32.2%
Korea Investment Trust Mg (209) -2.5% 108 1.2% (1,576) -16.4%
China Universal Asset Management Co (103) -8.8% (6) -0.5% (328) -24.2%
Huaan Fund Management (68) -9.4% (79) -10.6% 337 227.4%
BetaShares Capital Ltd (50) -5.1% (170) -16.5% (2,474) -100.0%
Total Top 10 (Outflows) (5,470) -20.7% (2,770) -10.3% (22,857) -84.8%
Current Week Prev. Week YTD
Source: Deutsche Bank, Bloomberg Finance LP, Reuters

17 June 2015
Asia Pac Weekly ETF Market Review
Deutsche Bank AG/Hong Kong Page 19
Index Provider
Figure 28: ETP Net Cash Flows (US$ Million) by Index Provider – Equity
(5,000) (4,000) (3,000) (2,000) (1,000) - 1,000 2,000
CSI
FTSE
KRX
Other
Maekyung FnGuide
Deutsche Borse
IISL
S&P Dow Jones
STOXX
HSIL
Topix
MSCI
SSE
Nikkei
Net Cashflow (US$ Million)
Figure 29: ETP Net Cash Flows (US$ Million) by Index Provider – Fixed Income
(50) - 50 100 150 200 250 300 350 400 450
Maekyung FnGuide
KRX
CSI
Markit iBoxx
UBS
Other
Net Cashflow (US$ Million)
Figure 30: ETP Net Cash Flows (US$ Million) by Index Provider – Commodity
(20) (18) (16) (14) (12) (10) (8) (6) (4) (2) -
Other
UBS
Commodity
S&P Dow Jones
Nikkei
Net Cashflow (US$ Million)
Source: Deutsche Bank, Bloomberg Finance LP, Reuters

17 June 2015
Asia Pac Weekly ETF Market Review
Page 20 Deutsche Bank AG/Hong Kong
Underlying Index/Security
Figure 31: ETP inflows (US$ Million) by Underlying Index
– Equity (Top 10)
Figure 32: ETP outflows (US$ Million) by Underlying Index
– Equity (Top 10)
0 500 1,000 1,500
FnGuide China Consumer Index
TSEC Taiwan 50 Index
TOPIX Banks Index
Hang Seng Index
JPX Nikkei Index 400
TOPIX
Nikkei 225
MSCI Taiwan
Nikkei 225 Leveraged Index
SSE 50 Index
Inflow (US$ Million)
-5000 -4000 -3000 -2000 -1000 0
CSI Southern Well-off Industry Index
GEM Index
CSI Consumer Staples Index
SSE180 Index
CSI 500 Index
Shenzhen SME Index
SI100 Index
KOSPI 200 Index
FTSE China A50 Index
CSI 300 Index
Outflow (US$ Million)
Figure 33: ETP inflows (US$ Million) by Underlying Index
– Fixed Income (Top 10)
Figure 34: ETP outflows (US$ Million) by Underlying Index
– Fixed Income
- 50 100 150 200 250
J.P. Morgan USD Asia Credit Bond Index
iBoxx ABF Pan-Asia Index
UBS Composite Bond Index
KIS MSB Short Term Index
China Bond 5-year Treasurey Bond Index
KIS MSB 5M Index
KIS MSB 3M Index
KRW Cash Plus Index
Other
Inflow (US$ Million)
-60 -50 -40 -30 -20 -10 0
CSI Gilt -Edged Medium Term Treasury Bond
Index
KRW Cash Index TR
MK Korea Monetary Stabilization Index
MaeKyung Money Market TR Index
30 day Bank Bill Swap Rate
Outflow (US$ Million)
Figure 35: ETP inflows (US$ Million) by Underlying
Index/Security – Commodity
Figure 36: ETP outflows (US$ Million) by Underlying
Index/Security – Commodity
0.00 0.50 1.00 1.50 2.00 2.50
S&P GSCI Gold Index
Commodity Silver
Inflow (US$ Million)
(20) (16) (12) (8) (4) -
Nikkei-TOCOM Platinum Index
S&P GSCI Crude Oil Enhanced Index
Commodity Gold
UBS Bloomberg Constant Maturity Commodity
Index
Nomura Crude Oil Long Index
Outflow (US$ Million)
Source: Deutsche Bank, Bloomberg Finance LP, Reuters
17 June 2015
Asia Pac Weekly ETF Market Review
Deutsche Bank AG/Hong Kong Page 21
Top ETPs
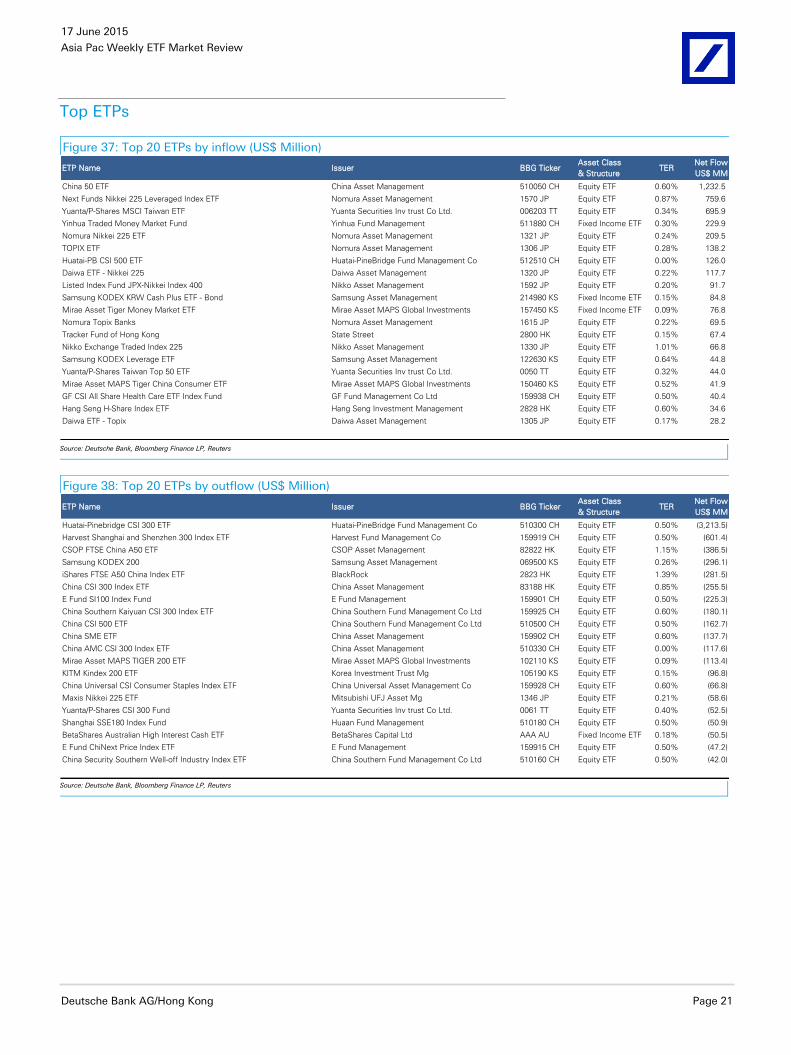
Figure 37: Top 20 ETPs by inflow (US$ Million)
ETP Name Issuer BBG TickerAsset Class
& StructureTER
Net Flow
US$ MM
China 50 ETF China Asset Management 510050 CH Equity ETF 0.60% 1,232.5
Next Funds Nikkei 225 Leveraged Index ETF Nomura Asset Management 1570 JP Equity ETF 0.87% 759.6
Yuanta/P-Shares MSCI Taiwan ETF Yuanta Securities Inv trust Co Ltd. 006203 TT Equity ETF 0.34% 695.9
Yinhua Traded Money Market Fund Yinhua Fund Management 511880 CH Fixed Income ETF 0.30% 229.9
Nomura Nikkei 225 ETF Nomura Asset Management 1321 JP Equity ETF 0.24% 209.5
TOPIX ETF Nomura Asset Management 1306 JP Equity ETF 0.28% 138.2
Huatai-PB CSI 500 ETF Huatai-PineBridge Fund Management Co 512510 CH Equity ETF 0.00% 126.0
Daiwa ETF - Nikkei 225 Daiwa Asset Management 1320 JP Equity ETF 0.22% 117.7
Listed Index Fund JPX-Nikkei Index 400 Nikko Asset Management 1592 JP Equity ETF 0.20% 91.7
Samsung KODEX KRW Cash Plus ETF - Bond Samsung Asset Management 214980 KS Fixed Income ETF 0.15% 84.8
Mirae Asset Tiger Money Market ETF Mirae Asset MAPS Global Investments 157450 KS Fixed Income ETF 0.09% 76.8
Nomura Topix Banks Nomura Asset Management 1615 JP Equity ETF 0.22% 69.5
Tracker Fund of Hong Kong State Street 2800 HK Equity ETF 0.15% 67.4
Nikko Exchange Traded Index 225 Nikko Asset Management 1330 JP Equity ETF 1.01% 66.8
Samsung KODEX Leverage ETF Samsung Asset Management 122630 KS Equity ETF 0.64% 44.8
Yuanta/P-Shares Taiwan Top 50 ETF Yuanta Securities Inv trust Co Ltd. 0050 TT Equity ETF 0.32% 44.0
Mirae Asset MAPS Tiger China Consumer ETF Mirae Asset MAPS Global Investments 150460 KS Equity ETF 0.52% 41.9
GF CSI All Share Health Care ETF Index Fund GF Fund Management Co Ltd 159938 CH Equity ETF 0.50% 40.4
Hang Seng H-Share Index ETF Hang Seng Investment Management 2828 HK Equity ETF 0.60% 34.6
Daiwa ETF - Topix Daiwa Asset Management 1305 JP Equity ETF 0.17% 28.2
Source: Deutsche Bank, Bloomberg Finance LP, Reuters
Figure 38: Top 20 ETPs by outflow (US$ Million)
ETP Name Issuer BBG TickerAsset Class
& StructureTER
Net Flow
US$ MM
Huatai-Pinebridge CSI 300 ETF Huatai-PineBridge Fund Management Co 510300 CH Equity ETF 0.50% (3,213.5)
Harvest Shanghai and Shenzhen 300 Index ETF Harvest Fund Management Co 159919 CH Equity ETF 0.50% (601.4)
CSOP FTSE China A50 ETF CSOP Asset Management 82822 HK Equity ETF 1.15% (386.5)
Samsung KODEX 200 Samsung Asset Management 069500 KS Equity ETF 0.26% (296.1)
iShares FTSE A50 China Index ETF BlackRock 2823 HK Equity ETF 1.39% (281.5)
China CSI 300 Index ETF China Asset Management 83188 HK Equity ETF 0.85% (255.5)
E Fund SI100 Index Fund E Fund Management 159901 CH Equity ETF 0.50% (225.3)
China Southern Kaiyuan CSI 300 Index ETF China Southern Fund Management Co Ltd 159925 CH Equity ETF 0.60% (180.1)
China CSI 500 ETF China Southern Fund Management Co Ltd 510500 CH Equity ETF 0.50% (162.7)
China SME ETF China Asset Management 159902 CH Equity ETF 0.60% (137.7)
China AMC CSI 300 Index ETF China Asset Management 510330 CH Equity ETF 0.00% (117.6)
Mirae Asset MAPS TIGER 200 ETF Mirae Asset MAPS Global Investments 102110 KS Equity ETF 0.09% (113.4)
KITM Kindex 200 ETF Korea Investment Trust Mg 105190 KS Equity ETF 0.15% (96.8)
China Universal CSI Consumer Staples Index ETF China Universal Asset Management Co 159928 CH Equity ETF 0.60% (66.8)
Maxis Nikkei 225 ETF Mitsubishi UFJ Asset Mg 1346 JP Equity ETF 0.21% (58.6)
Yuanta/P-Shares CSI 300 Fund Yuanta Securities Inv trust Co Ltd. 0061 TT Equity ETF 0.40% (52.5)
Shanghai SSE180 Index Fund Huaan Fund Management 510180 CH Equity ETF 0.50% (50.9)
BetaShares Australian High Interest Cash ETF BetaShares Capital Ltd AAA AU Fixed Income ETF 0.18% (50.5)
E Fund ChiNext Price Index ETF E Fund Management 159915 CH Equity ETF 0.50% (47.2)
China Security Southern Well-off Industry Index ETF China Southern Fund Management Co Ltd 510160 CH Equity ETF 0.50% (42.0)
Source: Deutsche Bank, Bloomberg Finance LP, Reuters

17 June 2015
Asia Pac Weekly ETF Market Review
Page 22 Deutsche Bank AG/Hong Kong
3. ETP – Turnover
Turnover information
Weekly Turnover definition: The turnover figure reported in this publication corresponds to the aggregated dollar value traded turnover (in US$) over a 1-week span. It is calculated by multiplying the on exchange daily volume in shares by the end of day price for the ETP, for each day within a certain week, after which the daily turnover is aggregated for all the days within the week generating the total weekly turnover figure.
Note on Turnover The liquidity of an ETF is not fully captured by its exchange turnover as exchange turnover does not reflect over-the-counter (OTC) trades or trades done at net asset value (NAV). The presence of a market marker is mandatory in most exchanges. The market marker is legally obliged to provide continuous price quotes for an ETF even when the ETF is not being actively traded.
Investment Focus
Figure 39: ETP Weekly Turnover (US$ Million) by Investment Focus – Equity Prev. Week Year 2014
Investment Focus - Equity TurnoverMkt
Share %Turnover Turnover
%
TurnoverTurnover Turnover
%
Turnover
Size 403 0.9% 519 (116) -22.4% 39 364 935.2%
Regional 62 0.1% 56 6 10.7% 43 18 43.0%
Style 2,523 5.4% 2,970 (447) -15.1% 244 2,278 932.6%
Sector 1,664 3.6% 1,718 (54) -3.1% 333 1,331 399.7%
Country 31,394 67.4% 32,111 (717) -2.2% 8,594 22,799 265.3%
Strategy 9,768 21.0% 7,523 2,245 29.8% 5,873 3,895 66.3%
Thematic 759 1.6% 1,364 (606) -44.4% 46 713 1559.4%
Total 46,571 100% 46,261 311 0.7% 15,172 31,399 207.0%
Change from 2014Current Week WoW Change
Source: Deutsche Bank, Bloomberg Finance LP.
Figure 40: ETP Weekly Turnover (US$ Million) by Investment Focus – Fixed Income Prev. Week Year 2014
Investment Focus - Fixed Income TurnoverMkt
Share %Turnover Turnover
%
TurnoverTurnover Turnover
%
Turnover
Sovereign 1,141 11.3% 864 277 32.1% 535 606 113.3%
Corporates 2 0.0% 2 (1) -27.4% 7 (5) -75.2%
Money Market 8,926 88.6% 3,180 5,746 180.7% 1,999 6,927 346.6%
Overall 4 0.0% 6 (2) -32.0% 3 1 19.7%
Total 10,072 100% 4,052 6,020 148.6% 2,544 7,528 295.9%
Change from 2014WoW ChangeCurrent Week
Source: Deutsche Bank, Bloomberg Finance LP.
Figure 41: ETP Weekly Turnover (US$ Million) by Investment Focus – Commodity Prev. Week Year 2014
Investment Focus - Commodity TurnoverMkt
Share %Turnover Turnover
%
TurnoverTurnover Turnover
%
Turnover
Precious Metals 101.7 46.0% 88.9 12.7 14.3% 68.2 33.5 49.1%
Overall 0.2 0.1% 0.2 (0.0) -1.9% 0.2 (0.0) -4.8%
Energy 108.5 49.1% 129.8 (21.3) -16.4% 5.1 103.4 2026.9%
Agriculture 10.7 4.8% 3.0 7.6 251.8% 1.1 9.6 895.8%
Industrial Metals 0.1 0.0% 0.1 0.0 27.1% 0.2 (0.1) -60.7%
Total 221 100% 222 (1) -0.4% 75 146 195.6%
Current Week Change from 2014WoW Change
Source: Deutsche Bank, Bloomberg Finance LP.

17 June 2015
Asia Pac Weekly ETF Market Review
Deutsche Bank AG/Hong Kong Page 23
Sub Segment
Figure 42: ETP Weekly Turnover (US$ Million) by Investment Focus Sub Segment – Equity Prev. Week Year 2014
Investment Focus
Sub Segment - EquityTurnover
Mkt
Share %Turnover Turnover
%
TurnoverTurnover Turnover
%
Turnover
Country
Asia Pac Developed 3,047 6.5% 2,236 811 36.3% 1,822 1,225 67.3%
Developed non-Asia Pac 251 0.5% 235 16 6.9% 14 237 1713.2%
Emerging Country 28,095 60.3% 29,639 (1,544) -5.2% 6,759 21,337 315.7%
Regional
Asia Pacific 3 0.0% 4 (1) -29.9% 3 (1) -18.0%
Asia Pacific ex-Japan 8 0.0% 0 8 2197.0% 2 6 390.8%
Emerging Markets 8 0.0% 9 (1) -14.3% 10 (2) -15.9%
Eurozone 0 0.0% 0 0 114% - 0 n.a
Europe 16 0.0% 17 (2) -9.0% 6 9 145.7%
Global 27 0.1% 24 2 9.6% 22 5 21.0%
Greater China 0 0.0% 0 (0) -38.2% 0 (0) -13.5%
Sector
Global 4 0.0% 6 (3) -40.9% 4 0 4.7%
Other Sector 130 0.3% 149 (19) -12.7% 21 110 521.5%
Asian Country 1,530 3.3% 1,562 (32) -2.1% 308 1,221 396.0%
Size
Large Cap 147 0.3% 210 (63) -30.1% 34 113 331.4%
Mid Cap 255 0.5% 286 (31) -10.9% 2 253 10808.1%
Small Cap 1 0.0% 23 (22) -94.1% 3 (1) -45.9%
Style
Growth 2,311 5.0% 2,829 (518) -18.3% 172 2,139 1243.0%
Value 61 0.1% 36 25 69.1% 31 30 98.2%
Dividend 150 0.3% 105 46 43.4% 41 109 263.7%
Strategy
Short 707 1.5% 836 (129) -15.5% 634 73 11.4%
Leveraged 8,160 17.5% 6,172 1,988 32.2% 5,123 3,037 59.3%
Leveraged Short 888 1.9% 507 382 75.4% 107 781 731.2%
Quantitative 5 0.0% 4 2 43.3% 5 0 3.7%
Fundamental 7 0.0% 4 3 75.1% 4 4 97.9%
Thematic
Sustainability 1 0.0% 1 0 82.2% 0 1 288.3%
Commodities 187 0.4% 156 31 19.9% 9 178 2041.4%
Other Theme 571 1.2% 1,208 (637) -52.7% 37 534 1453.3%
Total 46,571 100% 46,261 311 0.7% 15,172 31,399 207.0%
WoW ChangeCurrent Week Change from 2014
Source: Deutsche Bank, Bloomberg Finance LP.

17 June 2015
Asia Pac Weekly ETF Market Review
Page 24 Deutsche Bank AG/Hong Kong
Figure 43: ETP Weekly Turnover (US$ Million) by Investment Focus Sub Segment – Commodity Prev. Week Year 2014
Investment Focus
Sub Segment - CommodityTurnover
Mkt
Share %Turnover Turnover
%
TurnoverTurnover Turnover
%
Turnover
Overall
Overall 0.24 0.1% 0.24 (0.00) -1.7% 0.18 0.06 33.3%
Overall ex Energy - 0.0% 0.00 (0.00) -100.0% 0.06 (0.06) -100.0%
Overall Light Energy - 0.0% 0.00 (0.00) -100.0% 0.01 (0.01) -100.0%
Agriculture
Overall 10.46 4.7% 2.81 7.65 272.0% 0.72 9.74 1344.5%
Corn 0.01 0.0% 0.00 0.01 296.6% 0.03 (0.02) -68.0%
Soybeans 0.10 0.0% 0.12 (0.02) -16.9% 0.23 (0.12) -54.1%
Wheat 0.10 0.0% 0.09 0.00 4.6% 0.07 0.03 39.0%
Grains 0.01 0.0% 0.00 0.00 93.8% 0.02 (0.02) -70.2%
Cotton - 0.0% - - n.a - - n.a
Energy
Overall - 0.0% - - n.a. 0.00 (0.00) -100.0%
Crude Oil 108.45 49.1% 129.57 (21.12) -16.3% 5.00 103.45 2067.0%
Gasoline 0.00 0.0% 0.03 (0.02) -94.3% 0.00 0.00 680.8%
Oil & Gas 0.01 0.0% 0.08 (0.07) -83.6% - 0.01 n.a
Natural Gas 0.02 0.0% 0.08 (0.06) -75.5% 0.10 (0.08) -79.4%
Heating Oil - 0.0% - - n.a. - - n.a
Industrial Metals
Overall 0.01 0.0% 0.01 0.00 59.9% 0.03 (0.02) -63.3%
Aluminium - 0.0% - - n.a 0.00 (0.00) -100.0%
Nickel - 0.0% - - n.a. 0.00 (0.00) -100.0%
Lead - 0.0% - - n.a - - n.a
Precious Metals
Overall 0.11 0.1% 0.07 0.04 52.4% 0.06 0.05 82.9%
Gold 96.68 43.8% 84.49 12.19 14.4% 63.17 33.51 53.0%
Palladium 0.22 0.1% 0.09 0.12 136.1% 0.33 (0.11) -34.5%
Platinum 0.86 0.4% 0.93 (0.07) -7.3% 0.88 (0.02) -2.4%
Silver 3.79 1.7% 3.33 0.46 13.8% 3.72 0.07 1.7%
Total 221 100% 222 (1) -0.4% 75 146 195.6%
Change from 2014WoW ChangeCurrent Week
Source: Deutsche Bank, Bloomberg Finance LP.
17 June 2015
Asia Pac Weekly ETF Market Review
Deutsche Bank AG/Hong Kong Page 25
Exchange
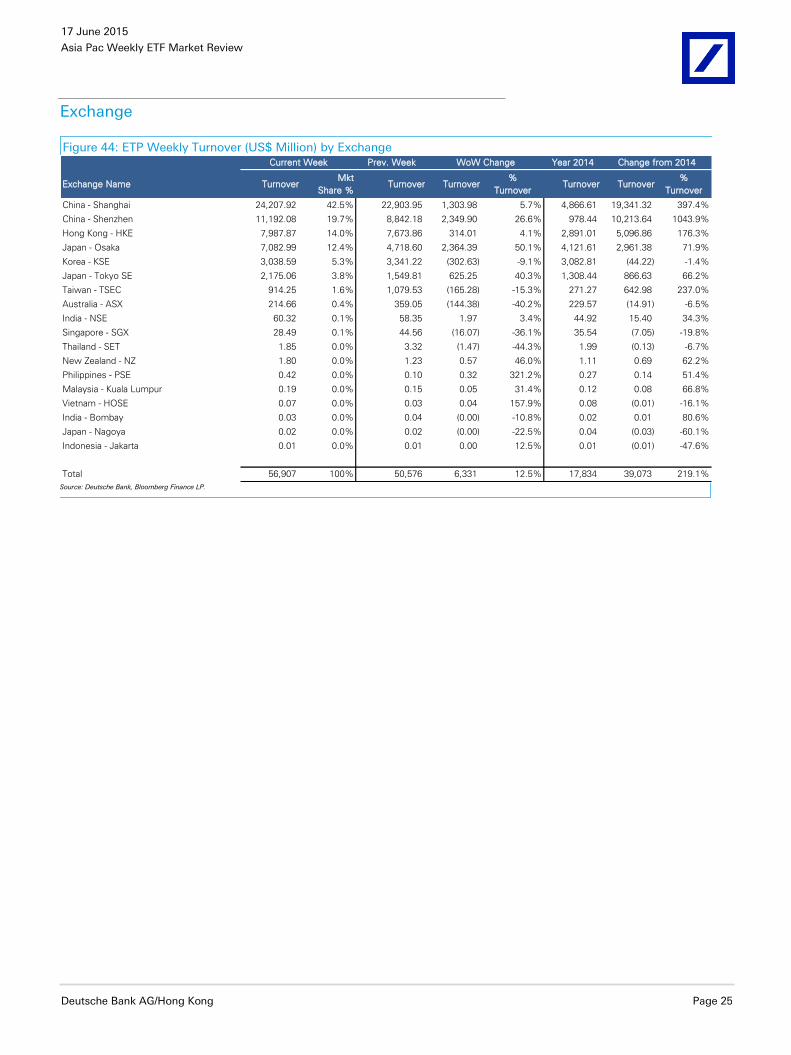
Figure 44: ETP Weekly Turnover (US$ Million) by Exchange Prev. Week Year 2014
Exchange Name TurnoverMkt
Share %Turnover Turnover
%
TurnoverTurnover Turnover
%
Turnover
China - Shanghai 24,207.92 42.5% 22,903.95 1,303.98 5.7% 4,866.61 19,341.32 397.4%
China - Shenzhen 11,192.08 19.7% 8,842.18 2,349.90 26.6% 978.44 10,213.64 1043.9%
Hong Kong - HKE 7,987.87 14.0% 7,673.86 314.01 4.1% 2,891.01 5,096.86 176.3%
Japan - Osaka 7,082.99 12.4% 4,718.60 2,364.39 50.1% 4,121.61 2,961.38 71.9%
Korea - KSE 3,038.59 5.3% 3,341.22 (302.63) -9.1% 3,082.81 (44.22) -1.4%
Japan - Tokyo SE 2,175.06 3.8% 1,549.81 625.25 40.3% 1,308.44 866.63 66.2%
Taiwan - TSEC 914.25 1.6% 1,079.53 (165.28) -15.3% 271.27 642.98 237.0%
Australia - ASX 214.66 0.4% 359.05 (144.38) -40.2% 229.57 (14.91) -6.5%
India - NSE 60.32 0.1% 58.35 1.97 3.4% 44.92 15.40 34.3%
Singapore - SGX 28.49 0.1% 44.56 (16.07) -36.1% 35.54 (7.05) -19.8%
Thailand - SET 1.85 0.0% 3.32 (1.47) -44.3% 1.99 (0.13) -6.7%
New Zealand - NZ 1.80 0.0% 1.23 0.57 46.0% 1.11 0.69 62.2%
Philippines - PSE 0.42 0.0% 0.10 0.32 321.2% 0.27 0.14 51.4%
Malaysia - Kuala Lumpur 0.19 0.0% 0.15 0.05 31.4% 0.12 0.08 66.8%
Vietnam - HOSE 0.07 0.0% 0.03 0.04 157.9% 0.08 (0.01) -16.1%
India - Bombay 0.03 0.0% 0.04 (0.00) -10.8% 0.02 0.01 80.6%
Japan - Nagoya 0.02 0.0% 0.02 (0.00) -22.5% 0.04 (0.03) -60.1%
Indonesia - Jakarta 0.01 0.0% 0.01 0.00 12.5% 0.01 (0.01) -47.6%
Total 56,907 100% 50,576 6,331 12.5% 17,834 39,073 219.1%
Current Week WoW Change Change from 2014
Source: Deutsche Bank, Bloomberg Finance LP.
17 June 2015
Asia Pac Weekly ETF Market Review
Page 26 Deutsche Bank AG/Hong Kong
Issuer
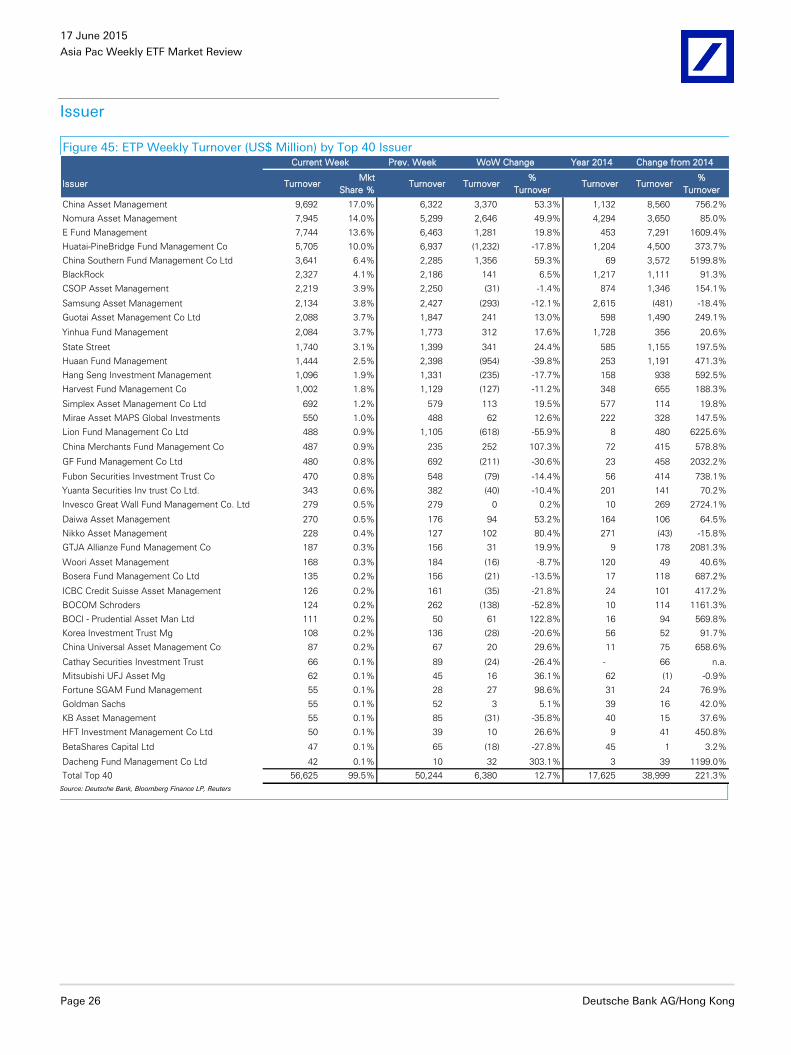
Figure 45: ETP Weekly Turnover (US$ Million) by Top 40 Issuer Prev. Week Year 2014
Issuer TurnoverMkt
Share %Turnover Turnover
%
TurnoverTurnover Turnover
%
Turnover
China Asset Management 9,692 17.0% 6,322 3,370 53.3% 1,132 8,560 756.2%
Nomura Asset Management 7,945 14.0% 5,299 2,646 49.9% 4,294 3,650 85.0%
E Fund Management 7,744 13.6% 6,463 1,281 19.8% 453 7,291 1609.4%
Huatai-PineBridge Fund Management Co 5,705 10.0% 6,937 (1,232) -17.8% 1,204 4,500 373.7%
China Southern Fund Management Co Ltd 3,641 6.4% 2,285 1,356 59.3% 69 3,572 5199.8%
BlackRock 2,327 4.1% 2,186 141 6.5% 1,217 1,111 91.3%
CSOP Asset Management 2,219 3.9% 2,250 (31) -1.4% 874 1,346 154.1%
Samsung Asset Management 2,134 3.8% 2,427 (293) -12.1% 2,615 (481) -18.4%
Guotai Asset Management Co Ltd 2,088 3.7% 1,847 241 13.0% 598 1,490 249.1%
Yinhua Fund Management 2,084 3.7% 1,773 312 17.6% 1,728 356 20.6%
State Street 1,740 3.1% 1,399 341 24.4% 585 1,155 197.5%
Huaan Fund Management 1,444 2.5% 2,398 (954) -39.8% 253 1,191 471.3%
Hang Seng Investment Management 1,096 1.9% 1,331 (235) -17.7% 158 938 592.5%
Harvest Fund Management Co 1,002 1.8% 1,129 (127) -11.2% 348 655 188.3%
Simplex Asset Management Co Ltd 692 1.2% 579 113 19.5% 577 114 19.8%
Mirae Asset MAPS Global Investments 550 1.0% 488 62 12.6% 222 328 147.5%
Lion Fund Management Co Ltd 488 0.9% 1,105 (618) -55.9% 8 480 6225.6%
China Merchants Fund Management Co 487 0.9% 235 252 107.3% 72 415 578.8%
GF Fund Management Co Ltd 480 0.8% 692 (211) -30.6% 23 458 2032.2%
Fubon Securities Investment Trust Co 470 0.8% 548 (79) -14.4% 56 414 738.1%
Yuanta Securities Inv trust Co Ltd. 343 0.6% 382 (40) -10.4% 201 141 70.2%
Invesco Great Wall Fund Management Co. Ltd 279 0.5% 279 0 0.2% 10 269 2724.1%
Daiwa Asset Management 270 0.5% 176 94 53.2% 164 106 64.5%
Nikko Asset Management 228 0.4% 127 102 80.4% 271 (43) -15.8%
GTJA Allianze Fund Management Co 187 0.3% 156 31 19.9% 9 178 2081.3%
Woori Asset Management 168 0.3% 184 (16) -8.7% 120 49 40.6%
Bosera Fund Management Co Ltd 135 0.2% 156 (21) -13.5% 17 118 687.2%
ICBC Credit Suisse Asset Management 126 0.2% 161 (35) -21.8% 24 101 417.2%
BOCOM Schroders 124 0.2% 262 (138) -52.8% 10 114 1161.3%
BOCI - Prudential Asset Man Ltd 111 0.2% 50 61 122.8% 16 94 569.8%
Korea Investment Trust Mg 108 0.2% 136 (28) -20.6% 56 52 91.7%
China Universal Asset Management Co 87 0.2% 67 20 29.6% 11 75 658.6%
Cathay Securities Investment Trust 66 0.1% 89 (24) -26.4% - 66 n.a.
Mitsubishi UFJ Asset Mg 62 0.1% 45 16 36.1% 62 (1) -0.9%
Fortune SGAM Fund Management 55 0.1% 28 27 98.6% 31 24 76.9%
Goldman Sachs 55 0.1% 52 3 5.1% 39 16 42.0%
KB Asset Management 55 0.1% 85 (31) -35.8% 40 15 37.6%
HFT Investment Management Co Ltd 50 0.1% 39 10 26.6% 9 41 450.8%
BetaShares Capital Ltd 47 0.1% 65 (18) -27.8% 45 1 3.2%
Dacheng Fund Management Co Ltd 42 0.1% 10 32 303.1% 3 39 1199.0%
Total Top 40 56,625 99.5% 50,244 6,380 12.7% 17,625 38,999 221.3%
Current Week WoW Change Change from 2014
Source: Deutsche Bank, Bloomberg Finance LP, Reuters
17 June 2015
Asia Pac Weekly ETF Market Review
Deutsche Bank AG/Hong Kong Page 27
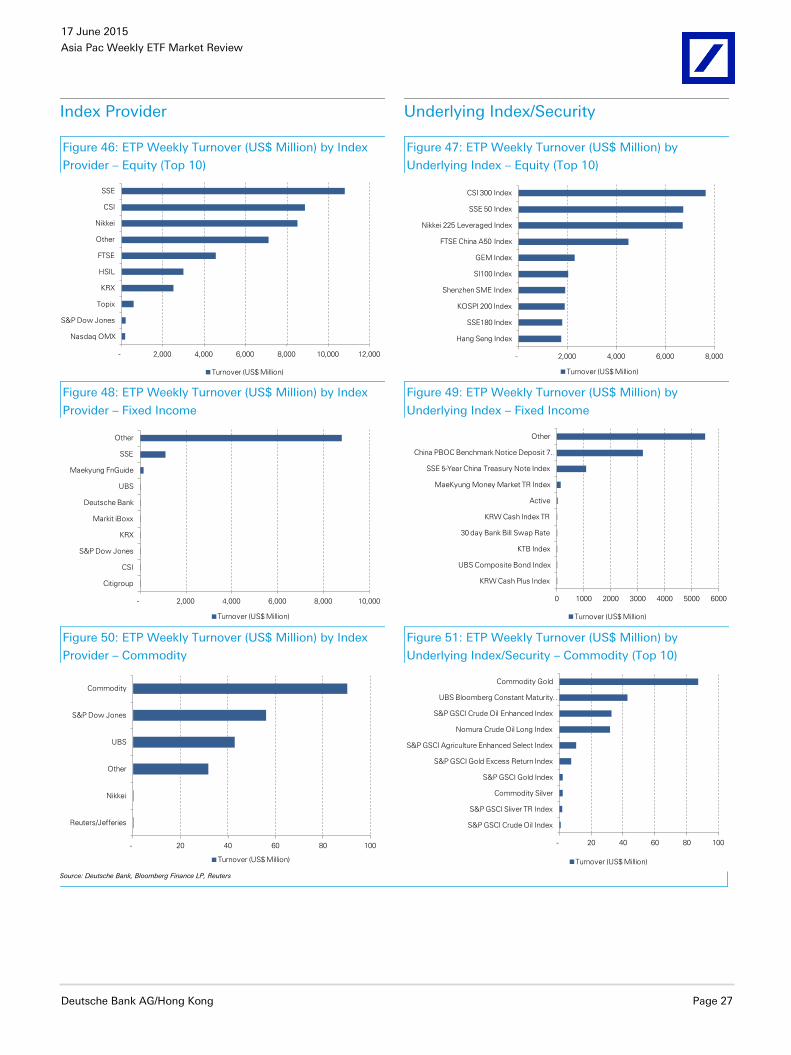
Index Provider Underlying Index/Security
Figure 46: ETP Weekly Turnover (US$ Million) by Index
Provider – Equity (Top 10)
Figure 47: ETP Weekly Turnover (US$ Million) by
Underlying Index – Equity (Top 10)
- 2,000 4,000 6,000 8,000 10,000 12,000
Nasdaq OMX
S&P Dow Jones
Topix
KRX
HSIL
FTSE
Other
Nikkei
CSI
SSE
Turnover (US$ Million)
- 2,000 4,000 6,000 8,000
Hang Seng Index
SSE180 Index
KOSPI 200 Index
Shenzhen SME Index
SI100 Index
GEM Index
FTSE China A50 Index
Nikkei 225 Leveraged Index
SSE 50 Index
CSI 300 Index
Turnover (US$ Million)
Figure 48: ETP Weekly Turnover (US$ Million) by Index
Provider – Fixed Income
Figure 49: ETP Weekly Turnover (US$ Million) by
Underlying Index – Fixed Income
- 2,000 4,000 6,000 8,000 10,000
Citigroup
CSI
S&P Dow Jones
KRX
Markit iBoxx
Deutsche Bank
UBS
Maekyung FnGuide
SSE
Other
Turnover (US$ Million)
0 1000 2000 3000 4000 5000 6000
KRW Cash Plus Index
UBS Composite Bond Index
KTB Index
30 day Bank Bill Swap Rate
KRW Cash Index TR
Active
MaeKyung Money Market TR Index
SSE 5-Year China Treasury Note Index
China PBOC Benchmark Notice Deposit 7 …
Other
Turnover (US$ Million)
Figure 50: ETP Weekly Turnover (US$ Million) by Index
Provider – Commodity
Figure 51: ETP Weekly Turnover (US$ Million) by
Underlying Index/Security – Commodity (Top 10)
- 20 40 60 80 100
Reuters/Jefferies
Nikkei
Other
UBS
S&P Dow Jones
Commodity
Turnover (US$ Million)
- 20 40 60 80 100
S&P GSCI Crude Oil Index
S&P GSCI Sliver TR Index
Commodity Silver
S&P GSCI Gold Index
S&P GSCI Gold Excess Return Index
S&P GSCI Agriculture Enhanced Select Index
Nomura Crude Oil Long Index
S&P GSCI Crude Oil Enhanced Index
UBS Bloomberg Constant Maturity …
Commodity Gold
Turnover (US$ Million)
Source: Deutsche Bank, Bloomberg Finance LP, Reuters
17 June 2015
Asia Pac Weekly ETF Market Review
Page 28 Deutsche Bank AG/Hong Kong
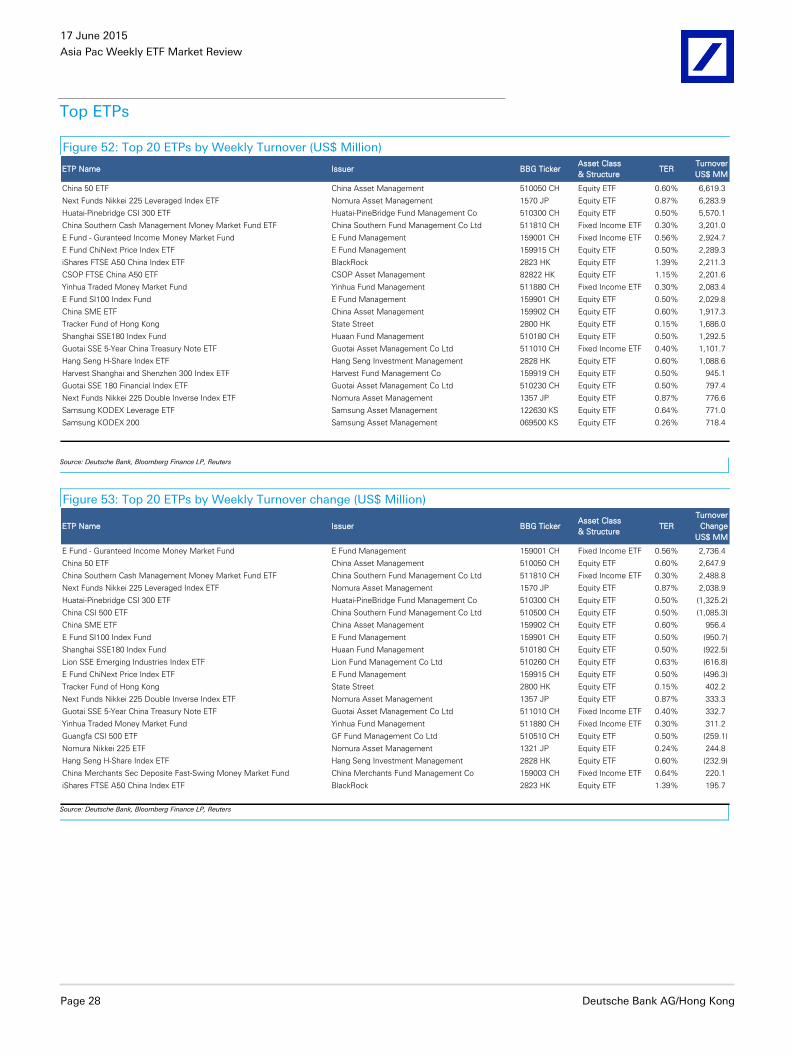
Top ETPs
Figure 52: Top 20 ETPs by Weekly Turnover (US$ Million)
ETP Name Issuer BBG TickerAsset Class
& StructureTER
Turnover
US$ MM
China 50 ETF China Asset Management 510050 CH Equity ETF 0.60% 6,619.3
Next Funds Nikkei 225 Leveraged Index ETF Nomura Asset Management 1570 JP Equity ETF 0.87% 6,283.9
Huatai-Pinebridge CSI 300 ETF Huatai-PineBridge Fund Management Co 510300 CH Equity ETF 0.50% 5,570.1
China Southern Cash Management Money Market Fund ETF China Southern Fund Management Co Ltd 511810 CH Fixed Income ETF 0.30% 3,201.0
E Fund - Guranteed Income Money Market Fund E Fund Management 159001 CH Fixed Income ETF 0.56% 2,924.7
E Fund ChiNext Price Index ETF E Fund Management 159915 CH Equity ETF 0.50% 2,289.3
iShares FTSE A50 China Index ETF BlackRock 2823 HK Equity ETF 1.39% 2,211.3
CSOP FTSE China A50 ETF CSOP Asset Management 82822 HK Equity ETF 1.15% 2,201.6
Yinhua Traded Money Market Fund Yinhua Fund Management 511880 CH Fixed Income ETF 0.30% 2,083.4
E Fund SI100 Index Fund E Fund Management 159901 CH Equity ETF 0.50% 2,029.8
China SME ETF China Asset Management 159902 CH Equity ETF 0.60% 1,917.3
Tracker Fund of Hong Kong State Street 2800 HK Equity ETF 0.15% 1,686.0
Shanghai SSE180 Index Fund Huaan Fund Management 510180 CH Equity ETF 0.50% 1,292.5
Guotai SSE 5-Year China Treasury Note ETF Guotai Asset Management Co Ltd 511010 CH Fixed Income ETF 0.40% 1,101.7
Hang Seng H-Share Index ETF Hang Seng Investment Management 2828 HK Equity ETF 0.60% 1,088.6
Harvest Shanghai and Shenzhen 300 Index ETF Harvest Fund Management Co 159919 CH Equity ETF 0.50% 945.1
Guotai SSE 180 Financial Index ETF Guotai Asset Management Co Ltd 510230 CH Equity ETF 0.50% 797.4
Next Funds Nikkei 225 Double Inverse Index ETF Nomura Asset Management 1357 JP Equity ETF 0.87% 776.6
Samsung KODEX Leverage ETF Samsung Asset Management 122630 KS Equity ETF 0.64% 771.0
Samsung KODEX 200 Samsung Asset Management 069500 KS Equity ETF 0.26% 718.4
Source: Deutsche Bank, Bloomberg Finance LP, Reuters
Figure 53: Top 20 ETPs by Weekly Turnover change (US$ Million)
ETP Name Issuer BBG TickerAsset Class
& StructureTER
Turnover
Change
US$ MM
E Fund - Guranteed Income Money Market Fund E Fund Management 159001 CH Fixed Income ETF 0.56% 2,736.4
China 50 ETF China Asset Management 510050 CH Equity ETF 0.60% 2,647.9
China Southern Cash Management Money Market Fund ETF China Southern Fund Management Co Ltd 511810 CH Fixed Income ETF 0.30% 2,488.8
Next Funds Nikkei 225 Leveraged Index ETF Nomura Asset Management 1570 JP Equity ETF 0.87% 2,038.9
Huatai-Pinebridge CSI 300 ETF Huatai-PineBridge Fund Management Co 510300 CH Equity ETF 0.50% (1,325.2)
China CSI 500 ETF China Southern Fund Management Co Ltd 510500 CH Equity ETF 0.50% (1,085.3)
China SME ETF China Asset Management 159902 CH Equity ETF 0.60% 956.4
E Fund SI100 Index Fund E Fund Management 159901 CH Equity ETF 0.50% (950.7)
Shanghai SSE180 Index Fund Huaan Fund Management 510180 CH Equity ETF 0.50% (922.5)
Lion SSE Emerging Industries Index ETF Lion Fund Management Co Ltd 510260 CH Equity ETF 0.63% (616.8)
E Fund ChiNext Price Index ETF E Fund Management 159915 CH Equity ETF 0.50% (496.3)
Tracker Fund of Hong Kong State Street 2800 HK Equity ETF 0.15% 402.2
Next Funds Nikkei 225 Double Inverse Index ETF Nomura Asset Management 1357 JP Equity ETF 0.87% 333.3
Guotai SSE 5-Year China Treasury Note ETF Guotai Asset Management Co Ltd 511010 CH Fixed Income ETF 0.40% 332.7
Yinhua Traded Money Market Fund Yinhua Fund Management 511880 CH Fixed Income ETF 0.30% 311.2
Guangfa CSI 500 ETF GF Fund Management Co Ltd 510510 CH Equity ETF 0.50% (259.1)
Nomura Nikkei 225 ETF Nomura Asset Management 1321 JP Equity ETF 0.24% 244.8
Hang Seng H-Share Index ETF Hang Seng Investment Management 2828 HK Equity ETF 0.60% (232.9)
China Merchants Sec Deposite Fast-Swing Money Market Fund China Merchants Fund Management Co 159003 CH Fixed Income ETF 0.64% 220.1
iShares FTSE A50 China Index ETF BlackRock 2823 HK Equity ETF 1.39% 195.7
Source: Deutsche Bank, Bloomberg Finance LP, Reuters

17 June 2015
Asia Pac Weekly ETF Market Review
Deutsche Bank AG/Hong Kong Page 29
4. ETP – Assets under Management
AUM information
Assets Under Management (AUM): Calculated as NAV times Number of Shares Outstanding or Price times Number of Shares Outstanding.
AUM Universe The Assets Under Management (AUM) of the ETFs that have been cross-listed in Asia is not taken in account in this report. Please refer to Figure 18 for details on Foreign Issuers’ AUMs.
Investment Focus
Figure 54: ETP AUM (US$ Million) by Investment Focus – Equity
Prev. Week End of 2014
Investment Focus - Equity AUMMkt
Share %AUM AUM % AUM AUM AUM % AUM
Size 687 0.3% 690 (4) -0.5% 755 (68) -9.0%
Regional 779 0.4% 762 17 2.2% 608 171 28.1%
Style 3,229 1.5% 3,260 (32) -1.0% 2,742 487 17.7%
Sector 8,472 3.9% 8,285 188 2.3% 6,137 2,335 38.1%
Country 192,191 89.2% 193,614 (1,423) -0.7% 167,421 24,769 14.8%
Strategy 7,660 3.6% 6,869 791 11.5% 7,493 167 2.2%
Thematic 2,467 1.1% 2,549 (82) -3.2% 2,182 285 13.1%
Total 215,484 100% 216,029 (546) -0.3% 187,338 28,146 15.0%
Current Week WoW Change YTD Change
Source: Deutsche Bank, Bloomberg Finance LP.
Figure 55: ETP AUM (US$ Million) by Investment Focus – Fixed Income
Prev. Week End of 2014
Investment Focus - Fixed
IncomeAUM
Mkt
Share %AUM AUM % AUM AUM AUM % AUM
Sovereign 7,292 54.8% 7,242 49 0.7% 7,100 192 2.7%
Corporates 1,148 8.6% 1,147 1 0.1% 1,159 (11) -0.9%
Money Market 4,443 33.4% 4,089 353 8.6% 3,193 1,249 39.1%
Overall 426 3.2% 423 2 0.6% 358 68 18.9%
Total 13,308 100% 12,902 406 3.1% 11,810 1,498 12.7%
YTD ChangeCurrent Week WoW Change
Source: Deutsche Bank, Bloomberg Finance LP.
Figure 56: ETP AUM (US$ Million) by Investment Focus – Commodity
Prev. Week End of 2014
Investment Focus - Commodity AUMMkt
Share %AUM AUM % AUM AUM AUM % AUM
Precious Metals 2,432 73.5% 2,427 5 0.2% 2,446 (14) -0.6%
Overall 6 0.2% 6 0 3.1% 5 1 -96.4%
Energy 821 24.8% 821 (0) 0.0% 128 693 539.5%
Agriculture 33 1.0% 33 (1) -2.0% 27 6 20.5%
Industrial Metals 15 0.4% 15 (0) -0.8% 15 (1) -3.6%
Total 3,307 100% 3,302 4 0.1% 2,621 685 26.1%
Current Week WoW Change YTD Change
Source: Deutsche Bank, Bloomberg Finance LP.
17 June 2015
Asia Pac Weekly ETF Market Review
Page 30 Deutsche Bank AG/Hong Kong
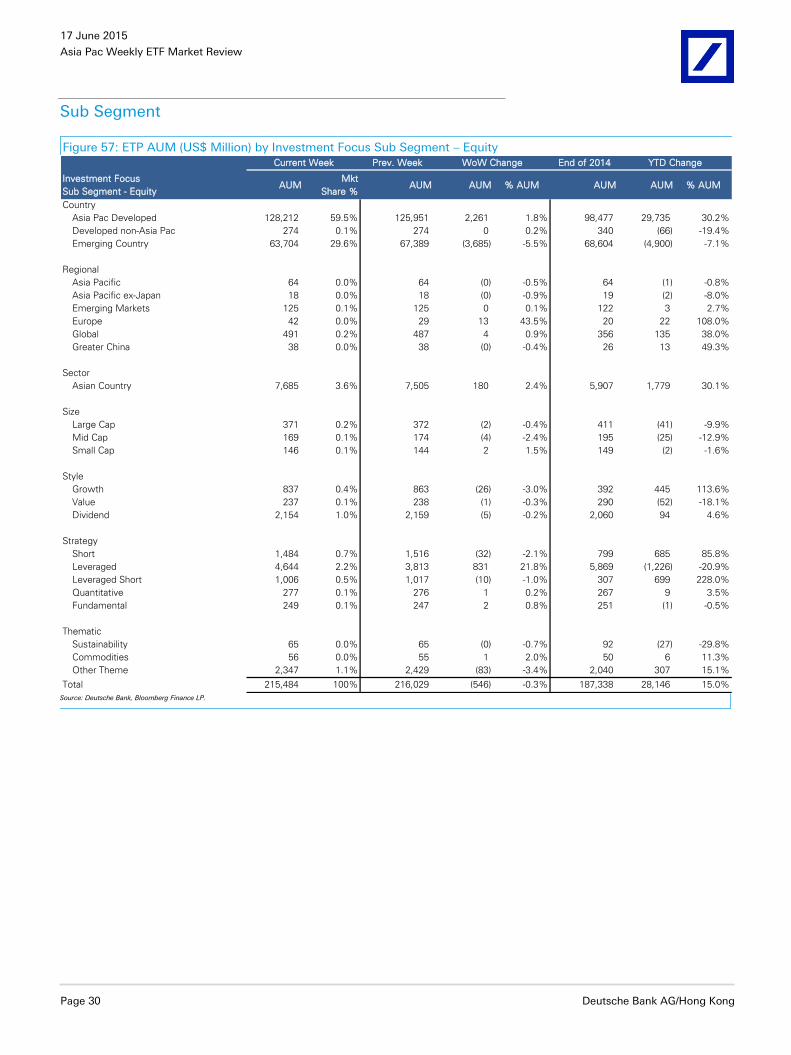
Sub Segment
Figure 57: ETP AUM (US$ Million) by Investment Focus Sub Segment – Equity Prev. Week End of 2014
Investment Focus
Sub Segment - EquityAUM
Mkt
Share %AUM AUM % AUM AUM AUM % AUM
Country
Asia Pac Developed 128,212 59.5% 125,951 2,261 1.8% 98,477 29,735 30.2%
Developed non-Asia Pac 274 0.1% 274 0 0.2% 340 (66) -19.4%
Emerging Country 63,704 29.6% 67,389 (3,685) -5.5% 68,604 (4,900) -7.1%
Regional
Asia Pacific 64 0.0% 64 (0) -0.5% 64 (1) -0.8%
Asia Pacific ex-Japan 18 0.0% 18 (0) -0.9% 19 (2) -8.0%
Emerging Markets 125 0.1% 125 0 0.1% 122 3 2.7%
Europe 42 0.0% 29 13 43.5% 20 22 108.0%
Global 491 0.2% 487 4 0.9% 356 135 38.0%
Greater China 38 0.0% 38 (0) -0.4% 26 13 49.3%
Sector
Asian Country 7,685 3.6% 7,505 180 2.4% 5,907 1,779 30.1%
Size
Large Cap 371 0.2% 372 (2) -0.4% 411 (41) -9.9%
Mid Cap 169 0.1% 174 (4) -2.4% 195 (25) -12.9%
Small Cap 146 0.1% 144 2 1.5% 149 (2) -1.6%
Style
Growth 837 0.4% 863 (26) -3.0% 392 445 113.6%
Value 237 0.1% 238 (1) -0.3% 290 (52) -18.1%
Dividend 2,154 1.0% 2,159 (5) -0.2% 2,060 94 4.6%
Strategy
Short 1,484 0.7% 1,516 (32) -2.1% 799 685 85.8%
Leveraged 4,644 2.2% 3,813 831 21.8% 5,869 (1,226) -20.9%
Leveraged Short 1,006 0.5% 1,017 (10) -1.0% 307 699 228.0%
Quantitative 277 0.1% 276 1 0.2% 267 9 3.5%
Fundamental 249 0.1% 247 2 0.8% 251 (1) -0.5%
Thematic
Sustainability 65 0.0% 65 (0) -0.7% 92 (27) -29.8%
Commodities 56 0.0% 55 1 2.0% 50 6 11.3%
Other Theme 2,347 1.1% 2,429 (83) -3.4% 2,040 307 15.1%
Total 215,484 100% 216,029 (546) -0.3% 187,338 28,146 15.0%
YTD ChangeCurrent Week WoW Change
Source: Deutsche Bank, Bloomberg Finance LP.

17 June 2015
Asia Pac Weekly ETF Market Review
Deutsche Bank AG/Hong Kong Page 31
Figure 58: ETP AUM (US$ Million) by Investment Focus Sub Segment – Commodity Prev. Week End of 2014
Investment Focus
Sub Segment - CommodityAUM
Mkt
Share %AUM AUM % AUM AUM AUM % AUM
Overall
Overall 6 0.2% 6 0 n.a 5 1 18.9%
Agriculture
Overall 27 0.8% 28 (1) -2.1% 21 6 30.8%
Corn 0 0.0% 0 (0) -3.8% 0 (0) -10.5%
Soybeans 5 0.1% 5 (0) -1.5% 5 (1) -13.1%
Wheat 0 0.0% 0 (0) -2.5% 0 (0) -14.6%
Grains 1 0.0% 1 (0) -1.9% 1 (0) -13.7%
Energy
Overall 0 0.0% 0 0 2.7% 0 0 239.5%
Crude Oil 812 24.6% 812 (0) 0.0% 128 684 532.8%
Oil & Gas 9 0.3% 9 0 1.7% - 9 n.a
Natural Gas 0 0.0% 0 0 6.2% 0 (0) -11.3%
Industrial Metals
Overall 3 0.1% 3 (0) -0.4% 3 (0) -9.1%
Copper 12 0.4% 12 (0) -0.9% 12 (0) -2.1%
Precious Metals
Overall 8 0.2% 8 0 0.1% 8 (0) -2.5%
Gold 2,274 68.9% 2,270 3 0.2% 2,297 (23) -1.0%
Palladium 6 0.2% 6 (0) -0.7% 7 (1) -8.6%
Platinum 42 1.3% 42 1 1.2% 32 10 31.2%
Silver 102 3.1% 101 1 1.4% 102 0 0.1%
Total 3,307 100% 3,302 4 0.1% 2,621 685 26.1%
Current Week WoW Change YTD Change
Source: Deutsche Bank, Bloomberg Finance LP.

17 June 2015
Asia Pac Weekly ETF Market Review
Page 32 Deutsche Bank AG/Hong Kong
Issuer
Figure 59: ETP AUM (US$ Million) by Top 40 Local Issuer Prev. Week End of 2014
Issuer AUMMkt
Share %AUM AUM % AUM AUM AUM % AUM
Nomura Asset Management 55,145 23.7% 53,315 1,830 3.4% 43,106 12,039 27.9%
Nikko Asset Management 23,994 10.3% 23,500 494 2.1% 18,050 5,944 32.9%
Daiwa Asset Management 22,785 9.8% 22,329 455 2.0% 18,581 4,204 22.6%
State Street 17,762 7.6% 17,610 153 0.9% 14,585 3,177 21.8%
Hang Seng Investment Management 14,148 6.1% 14,049 99 0.7% 8,138 6,010 73.9%
China Asset Management 12,684 5.5% 11,842 842 7.1% 11,132 1,552 13.9%
BlackRock 12,073 5.2% 12,237 (164) -1.3% 14,910 (2,837) -19.0%
Mitsubishi UFJ Asset Mg 9,392 4.0% 9,287 106 1.1% 6,574 2,818 42.9%
Samsung Asset Management 8,154 3.5% 8,488 (335) -3.9% 9,601 (1,448) -15.1%
Harvest Fund Management Co 6,223 2.7% 6,719 (495) -7.4% 7,985 (1,762) -22.1%
E Fund Management 4,723 2.0% 4,995 (272) -5.4% 3,623 1,100 30.4%
Yuanta Securities Inv trust Co Ltd. 4,335 1.9% 3,623 712 19.6% 3,889 447 11.5%
CSOP Asset Management 4,219 1.8% 4,538 (319) -7.0% 5,568 (1,349) -24.2%
Mirae Asset MAPS Global Investments 3,614 1.6% 3,570 43 1.2% 3,226 388 12.0%
Huatai-PineBridge Fund Management Co 2,993 1.3% 5,979 (2,987) -49.9% 5,430 (2,438) -44.9%
China Southern Fund Management Co Ltd 2,644 1.1% 2,971 (326) -11.0% 1,792 852 47.6%
Vanguard 1,952 0.8% 1,912 40 2.1% 1,568 384 24.5%
Yinhua Fund Management 1,750 0.8% 1,522 228 15.0% 929 821 88.4%
BetaShares Capital Ltd 1,439 0.6% 1,467 (28) -1.9% 1,298 141 10.9%
Goldman Sachs 1,316 0.6% 1,333 (17) -1.3% 1,367 (51) -3.7%
Fubon Securities Investment Trust Co 1,249 0.5% 1,246 3 0.3% 1,011 238 23.6%
GF Fund Management Co Ltd 1,232 0.5% 1,192 39 3.3% 426 805 188.8%
BOCI - Prudential Asset Man Ltd 1,057 0.5% 1,068 (12) -1.1% 1,274 (217) -17.0%
KB Asset Management 1,053 0.5% 1,055 (2) -0.2% 1,080 (27) -2.5%
Korea Investment Trust Mg 1,047 0.4% 1,162 (115) -9.9% 1,353 (306) -22.6%
HFT Investment Management Co Ltd 1,036 0.4% 1,039 (3) -0.3% 1,074 (38) -3.5%
Simplex Asset Management Co Ltd 1,033 0.4% 1,029 4 0.4% 745 288 38.6%
Huaan Fund Management 949 0.4% 983 (33) -3.4% 2,473 (1,524) -61.6%
DIAM Asset Management 909 0.4% 877 31 3.6% - 909 n.a.
Hanwha Investment Trust Management 844 0.4% 877 (33) -3.8% 817 27 3.3%
Kyobo AXA Investment Mg Co Ltd 791 0.3% 844 (53) -6.3% 971 (180) -18.5%
NZAM 782 0.3% 754 28 3.7% 500 282 56.3%
China Universal Asset Management Co 683 0.3% 720 (37) -5.1% 148 534 360.5%
Woori Asset Management 630 0.3% 655 (25) -3.8% 601 28 4.7%
Russell Investments 493 0.2% 482 10 2.1% 471 22 4.6%
Guotai Asset Management Co Ltd 458 0.2% 439 20 4.5% 492 (34) -6.8%
Sumitomo Mitsui Asset Management 429 0.2% 412 17 4.1% 17 412 2458.6%
Reliance Capital Asset Management 411 0.2% 412 (1) -0.1% 423 (12) -2.7%
ETF Securities Ltd 389 0.2% 382 7 1.8% 415 (27) -6.5%
HSBC Inv Funds Ltd/Hong Kong 388 0.2% 388 (1) -0.2% 388 (1) -0.2%
Total Top 40 227,206 97.6% 227,302 (96) 0.0% 196,032 31,174 15.9%
WoW Change YTD ChangeCurrent Week
Source: Deutsche Bank, Bloomberg Finance LP.

17 June 2015
Asia Pac Weekly ETF Market Review
Deutsche Bank AG/Hong Kong Page 33
Index Provider Underlying Index/Security
Figure 60: ETP AUM (US$ Million) by Index Provider –
Equity (Top 10)
Figure 61: ETP AUM (US$ Million) by Underlying Index –
Equity (Top 10)
- 10,000 20,000 30,000 40,000 50,000 60,000 70,000
MSCI
S&P …
KRX
SSE
Other
FTSE
CSI
HSIL
Topix
Nikkei
AUM (US$ Million)
- 15,000 30,000 45,000 60,000
CSI 500 Index
JPX Nikkei Index 400
SSE 50 Index
KOSPI 200 Index
Hang Seng China Enterprise Index
FTSE China A50 Index
CSI 300 Index
Hang Seng Index
TOPIX
Nikkei 225
AUM (US$ Million)
Figure 62: ETP AUM (US$ Million) by Index Provider –
Fixed Income
Figure 63: ETP AUM (US$ Million) by Underlying Index –
Fixed Income (Top 10)
- 1,000 2,000 3,000 4,000 5,000 6,000 7,000 8,000 9,000
CSI
S&P Dow Jones
Citigroup
SSE
KRX
Maekyung FnGuide
Deutsche Bank
UBS
Markit iBoxx
Other
AUM (US$ Million)
- 1,000 2,000 3,000 4,000
China Bond 5-year Treasurey Bond Index
iBoxx ABF Hong Kong Index
iBoxx ABF Singapore Bond Index
KTB Index
30 day Bank Bill Swap Rate
KIS MSB 3M Index
Pledgeable urban Investment Bond Index
KRW Cash Index TR
Other
iBoxx ABF Pan-Asia Index
AUM (US$ Million)
Figure 64: ETP AUM (US$ Million) by Index Provider –
Commodity
Figure 65: ETP AUM (US$ Million) by Underlying
Index/Security – Commodity (Top 10)
- 500 1,000 1,500 2,000 2,500
Nikkei
Other
UBS
S&P Dow Jones
Commodity
AUM (US$ Million)
- 500 1,000 1,500 2,000 2,500
S&P GSCI Sliver TR Index
S&P GSCI Agriculture Enhanced Select …
S&P GSCI Gold Excess Return Index
Commodity Platinum
S&P GSCI Gold Index
Commodity Silver
S&P GSCI Crude Oil Enhanced Index
Nomura Crude Oil Long Index
UBS Bloomberg Constant Maturity …
Commodity Gold
AUM (US$ Million) Source: Deutsche Bank, Bloomberg Finance LP, Reuters

17 June 2015
Asia Pac Weekly ETF Market Review
Page 34 Deutsche Bank AG/Hong Kong
Top ETPs
Figure 66: Top 20 ETPs by AUM (US$ Million)
ETP Name Issuer BBG TickerAsset Class
& StructureTER
AUM
US$ MM
Nomura Nikkei 225 ETF Nomura Asset Management 1321 JP Equity ETF 0.24% 24,748.2
TOPIX ETF Nomura Asset Management 1306 JP Equity ETF 0.28% 21,978.9
Nikko Exchange Traded Index 225 Nikko Asset Management 1330 JP Equity ETF 1.01% 11,549.2
Daiwa ETF - Nikkei 225 Daiwa Asset Management 1320 JP Equity ETF 0.22% 11,148.0
Tracker Fund of Hong Kong State Street 2800 HK Equity ETF 0.15% 11,012.3
Daiwa ETF - Topix Daiwa Asset Management 1305 JP Equity ETF 0.17% 10,729.3
Nikko ETF Topix Nikko Asset Management 1308 JP Equity ETF 0.81% 10,023.9
Hang Seng H-Share Index ETF Hang Seng Investment Management 2828 HK Equity ETF 0.60% 7,766.8
iShares FTSE A50 China Index ETF BlackRock 2823 HK Equity ETF 1.39% 7,687.9
Hang Seng Index ETF Hang Seng Investment Management 2833 HK Equity ETF 0.13% 6,259.5
China 50 ETF China Asset Management 510050 CH Equity ETF 0.60% 5,903.3
Harvest Shanghai and Shenzhen 300 Index ETF Harvest Fund Management Co 159919 CH Equity ETF 0.50% 5,772.7
Maxis Nikkei 225 ETF Mitsubishi UFJ Asset Mg 1346 JP Equity ETF 0.21% 5,190.3
CSOP FTSE China A50 ETF CSOP Asset Management 82822 HK Equity ETF 1.15% 3,658.1
Samsung KODEX 200 Samsung Asset Management 069500 KS Equity ETF 0.26% 3,441.3
ABF Pan-Asia Bond Index Fund State Street 2821 HK Fixed Income ETF 0.19% 3,117.3
MAXIS TOPIX ETF Mitsubishi UFJ Asset Mg 1348 JP Equity ETF 0.12% 3,080.6
China AMC CSI 300 Index ETF China Asset Management 510330 CH Equity ETF 0.00% 2,985.6
Huatai-Pinebridge CSI 300 ETF Huatai-PineBridge Fund Management Co 510300 CH Equity ETF 0.50% 2,699.5
Yuanta/P-Shares Taiwan Top 50 ETF Yuanta Securities Inv trust Co Ltd. 0050 TT Equity ETF 0.32% 2,173.5
Source: Deutsche Bank, Bloomberg Finance LP, Reuters
Figure 67: Top 20 ETPs by AUM change(US$ Million)
ETP Name Issuer BBG TickerAsset Class
& StructureTER
AUM
Change
US$ MM
Huatai-Pinebridge CSI 300 ETF Huatai-PineBridge Fund Management Co 510300 CH Equity ETF 0.50% (3,107.7)
China 50 ETF China Asset Management 510050 CH Equity ETF 0.60% 1,270.0
Next Funds Nikkei 225 Leveraged Index ETF Nomura Asset Management 1570 JP Equity ETF 0.87% 778.4
Yuanta/P-Shares MSCI Taiwan ETF Yuanta Securities Inv trust Co Ltd. 006203 TT Equity ETF 0.34% 697.3
Nomura Nikkei 225 ETF Nomura Asset Management 1321 JP Equity ETF 0.24% 607.8
Harvest Shanghai and Shenzhen 300 Index ETF Harvest Fund Management Co 159919 CH Equity ETF 0.50% (493.5)
CSOP FTSE China A50 ETF CSOP Asset Management 82822 HK Equity ETF 1.15% (356.5)
Samsung KODEX 200 Samsung Asset Management 069500 KS Equity ETF 0.26% (356.1)
TOPIX ETF Nomura Asset Management 1306 JP Equity ETF 0.28% 346.2
Daiwa ETF - Nikkei 225 Daiwa Asset Management 1320 JP Equity ETF 0.22% 296.5
Nikko Exchange Traded Index 225 Nikko Asset Management 1330 JP Equity ETF 1.01% 253.2
Yinhua Traded Money Market Fund Yinhua Fund Management 511880 CH Fixed Income ETF 0.30% 229.6
iShares FTSE A50 China Index ETF BlackRock 2823 HK Equity ETF 1.39% (223.7)
China CSI 300 Index ETF China Asset Management 83188 HK Equity ETF 0.85% (209.4)
E Fund SI100 Index Fund E Fund Management 159901 CH Equity ETF 0.50% (198.7)
China Southern Kaiyuan CSI 300 Index ETF China Southern Fund Management Co Ltd 159925 CH Equity ETF 0.60% (173.4)
Mirae Asset MAPS TIGER 200 ETF Mirae Asset MAPS Global Investments 102110 KS Equity ETF 0.09% (134.0)
China SME ETF China Asset Management 159902 CH Equity ETF 0.60% (131.1)
Daiwa ETF - Topix Daiwa Asset Management 1305 JP Equity ETF 0.17% 129.9
Huatai-PB CSI 500 ETF Huatai-PineBridge Fund Management Co 512510 CH Equity ETF 0.00% 126.0
Source: Deutsche Bank, Bloomberg Finance LP, Reuters
17 June 2015
Asia Pac Weekly ETF Market Review
Deutsche Bank AG/Hong Kong Page 35
The authors of this report wish to acknowledge the contribution made by Vibhor Mahalwala and Varun Sachdeva,
employees of Evalueserve, a third party provider to Deutsche Bank of offshore research support services.

17 June 2015
Asia Pac Weekly ETF Market Review
Page 36 Deutsche Bank AG/Hong Kong
Appendix A: Useful Information
ETF Exchanges
Exchanges Website
Australia ASX www.asx.com.au
China Shenzhen www.szse.cn
China Shanghai www.sse.com.cn
Hong Kong HKE www.hkex.com.hk
India NSE www.nseindia.com
India Bombay www.bseindia.com
Indonesia Jakarta www.idx.co.id
Japan Osaka www.ose.or.jp
Japan Tokyo SE www.tse.or.jp
Japan Nagoya www.nse.or.jp
Korea SE KSE www.kse.or.kr
New Zealand NZ www.nzx.com
Philippines PSE www.pse.com.ph
Singapore SE SGX www.sgx.com
Taiwan SE TSEC www.twse.com.tw
Thailand SET www.set.or.th/en/
Malaysia BURSA www.bursamalaysia.com
Vietnam HOSE www.hsx.vn/

17 June 2015
Asia Pac Weekly ETF Market Review
Deutsche Bank AG/Hong Kong Page 37
Appendix B: Glossary
ETF Glossary
Term Definition
Cross Listing A Cross Listing is an additional listing of a previously existing ETF on a trading venue different from the ETF’s Primary Listing Exchange. A Cross Listing is a symbol of the number of investment options available in the local market.
Primary Listing ETFs may trade on multiple exchanges but they always have one primary exchange. The listing on the primary exchange is referred as the primary listing, which usually corresponds also to the first/oldest listing. A primary listing offers access to a new product which was not available for trading before. The number of primary listings is a symbol of the distinct investment options available across different markets.
TER Total Expense Ratio or TER is the overall cost borne by a fund’s share holder for a 1 year ownership period. It usually includes the management fee and other expenses paid by the fund. TER is, in general, expressed as a percentage of the amount invested and it is proportionally discounted according to the actual holding period.

17 June 2015
Asia Pac Weekly ETF Market Review
Page 38 Deutsche Bank AG/Hong Kong
Appendix C: How we define ETPs
Exchange-Traded Products (ETPs)
We define an exchange-traded product (ETP) as a secure (funded or collateralized) open-ended delta-one exchange-
traded equity or debt instrument with no embedded optionality and market-wide appeal to investors. This includes
exchange traded funds, exchange-traded commodities (Europe) and exchange-traded vehicles (US).
Figure below gives a summary of our current coverage universe by region and structure type as on 31 December 2014.
The vast majority of instruments are ETFs (97%, 3,906 products, $2,641bn) with the remainder being ETCs (0.7%, 451
products, $20.4bn) in Europe and ETVs (2.1%, 70 products, $56.7bn) in the US.
Figure 68: ETP Coverage Universe Summary
Region Products US$ Mil. % Products US$ Mil. % Products US$ Mil. %
US 1,450 1,979,179 72.7% 1,380 1,922,462 70.6% 70 56,717 2.1%
Europe 1,869 459,225 16.9% 1,418 438,870 16.1% 451 20,355 0.7%
Asia Pacific 674 201,756 7.4% 659 201,354 7.4% 15 405 0.0%
RoW 454 81,059 3.0% 449 77,846 2.9% 5 3,213 0.1%
Global 4,447 2,721,220 100.0% 3,906 2,640,532 97.0% 541 80,691 3.0%
ETPs ETFs ETC/Vs
Source: Deutsche Bank, Bloomberg Finance LP, Reuters.
Exchange-Traded Funds (ETFs, 97%)
US (71%): Fund structures that issue shares that are traded on an exchange much the same way as equities. ETFs
indexed to equity and fixed income benchmarks are registered under the investment company act of 1940. Only
physical index replication techniques are permissible by this legislation while synthetic replication is not allowed.
Europe (16%): Fund structures that issue units or shares that are traded on an exchange much the same way as
equities. The vast majorities of European ETFs are UCITS III compliant and are primarily domiciled in Dublin and
Luxemburg. The Undertakings for Collective Investment in Transferable Securities (UCITS) are a set of European Union
directives that aim to allow collective investment schemes to operate freely throughout the EU on the basis of a single
authorization from one member state. Both physical and synthetic index replication is permissible by UCITS and funds
are allowed to track equity, fixed income as well as diversified commodity indices.
Asia (7%): Both European and US ETFs are cross sold into the Asian market.
Exchange-Traded Collateralized Instruments (3%)
Exchange-Traded Commodities (ETCs, 1%)
In Europe as UCITS III does not permit the creation of funds tracking non diversified commodity indices (for example
wheat or oil), exchange-traded products that track single commodity profiles are issued under the EU Prospectus
Directive in two structures that have become widely known as exchange-traded commodities (ETCs). ETCs can either
be physically backed or they can be issued through a bankruptcy remote special purpose vehicle (SPV). Both forms
utilize offshore domiciles, such as Jersey, and are classed as debt instruments. Physically-backed ETCs are fully backed
with securities that closely resemble the composition of a product’s benchmark index. SPV structures are collateralized
by assets which could bear no resemblance to those of their respective benchmark index and ensure replication of their
index return through a total return swap structure or by holding other derivative instruments such as futures. In the vast
majority of cases, both types of ETCs are fully collateralized with secure assets such as money market instruments,
government bonds and gold. For more information, please refer to our research report issued on March 11 2010 titled
‘The race for assets in the European Exchange-Traded Products Market”.
Exchange-traded vehicles (ETVs, 2%)
This terminology typically refers to grantor trusts that exist in the US market. These instruments track primarily
commodity benchmarks. They differ from ETFs in that they are registered under the Securities Act of 1933 and not the
investment Company Act of 1940, hence they are not classed as funds. Vehicles that replicate commodity benchmarks,
more often known as pools, and funds targeting alternative index returns are formed under the Commodities Exchange
Act and are listed under the 33 Securities Act, and report under 34 Corporate Act.

17 June 2015
Asia Pac Weekly ETF Market Review
Deutsche Bank AG/Hong Kong Page 39
Appendix 1
Important Disclosures
Additional information available upon request
*Prices are current as of the end of the previous trading session unless otherwise indicated and are sourced from local exchanges via Reuters, Bloomberg and other vendors . Other information is sourced from Deutsche Bank, subject companies, and other sources. For disclosures pertaining to recommendations or estimates made on securities other than the primary subject of this research, please see the most recently published company report or visit our global disclosure look-up page on our website at http://gm.db.com/ger/disclosure/DisclosureDirectory.eqsr
Analyst Certification
The views expressed in this report accurately reflect the personal views of the undersigned lead analyst(s). In addition, the undersigned lead analyst(s) has not and will not receive any compensation for providing a specific recommendation or view in this report. Shan Lan
Equity rating key Equity rating dispersion and banking relationships
Buy: Based on a current 12- month view of total share-holder return (TSR = percentage change in share price from current price to projected target price plus pro-jected dividend yield ) , we recommend that investors buy the stock. Sell: Based on a current 12-month view of total share-holder return, we recommend that investors sell the stock Hold: We take a neutral view on the stock 12-months out and, based on this time horizon, do not recommend either a Buy or Sell. Notes:
1. Newly issued research recommendations and target prices always supersede previously published research. 2. Ratings definitions prior to 27 January, 2007 were:
Buy: Expected total return (including dividends) of 10% or more over a 12-month period Hold: Expected total return (including dividends) between -10% and 10% over a 12-month period Sell: Expected total return (including dividends) of -10% or worse over a 12-month period
52 %
38 %
10 %23 %19 % 17 %
0
50
100
150
200
250
300
350
400
450
Buy Hold Sell
Asia-Pacific Universe
Companies Covered Cos. w/ Banking Relationship
17 June 2015
Asia Pac Weekly ETF Market Review
Page 40 Deutsche Bank AG/Hong Kong
Regulatory Disclosures
1.Additional Information
Information on ETFs is provided strictly for illustrative purposes and should not be deemed an offer to sell or a
solicitation of an offer to buy shares of any fund that is described in this document. Consider carefully any fund's
investment objectives, risk factors, and charges and expenses before investing. This and other information can be found
in the fund's prospectus. Prospectuses about db X-trackers funds and Powershares DB funds can be obtained by calling
1-877-369-4617 or by visiting www.DBXUS.com. Read prospectuses carefully before investing. Past performance is not
necessarily indicative of future results. Investing involves risk, including possible loss of principal. To better understand
the similarities and differences between investments, including investment objectives, risks, fees and expenses, it is
important to read the products' prospectuses. Shares of ETFs may be sold throughout the day on an exchange through
any brokerage account. However, shares may only be redeemed directly from an ETF by authorized participants, in very
large creation/redemption units. Transactions in shares of ETFs will result in brokerage commissions and will generate
tax consequences. ETFs are obliged to distribute portfolio gains to shareholders. Deutsche Bank may be an issuer,
advisor, manager, distributor or administrator of, or provide other services to, an ETF included in this report, for which it
receives compensation. db X-trackers and Powershares DB funds are distributed by ALPS Distributors, Inc. The opinions
expressed are those of the authors and do not necessarily reflect the views of DB, ALPS or their affiliates.
Aside from within this report, important conflict disclosures can also be found at https://gm.db.com/equities under the
"Disclosures Lookup" and "Legal" tabs. Investors are strongly encouraged to review this information before investing.
2. Short-Term Trade Ideas
Deutsche Bank equity research analysts sometimes have shorter-term trade ideas (known as SOLAR ideas) that are
consistent or inconsistent with Deutsche Bank's existing longer term ratings. These trade ideas can be found at the
SOLAR link at http://gm.db.com.
17 June 2015
Asia Pac Weekly ETF Market Review
Deutsche Bank AG/Hong Kong Page 41
Additional Information
The information and opinions in this report were prepared by Deutsche Bank AG or one of its affiliates (collectively
"Deutsche Bank"). Though the information herein is believed to be reliable and has been obtained from public sources
believed to be reliable, Deutsche Bank makes no representation as to its accuracy or completeness.
Deutsche Bank may consider this report in deciding to trade as principal. It may also engage in transactions, for its own
account or with customers, in a manner inconsistent with the views taken in this research report. Others within
Deutsche Bank, including strategists, sales staff and other analysts, may take views that are inconsistent with those
taken in this research report. Deutsche Bank issues a variety of research products, including fundamental analysis,
equity-linked analysis, quantitative analysis and trade ideas. Recommendations contained in one type of communication
may differ from recommendations contained in others, whether as a result of differing time horizons, methodologies or
otherwise. Deutsche Bank and/or its affiliates may also be holding debt securities of the issuers it writes on.
Analysts are paid in part based on the profitability of Deutsche Bank AG and its affiliates, which includes investment
banking revenues.
Opinions, estimates and projections constitute the current judgment of the author as of the date of this report. They do
not necessarily reflect the opinions of Deutsche Bank and are subject to change without notice. Deutsche Bank has no
obligation to update, modify or amend this report or to otherwise notify a recipient thereof if any opinion, forecast or
estimate contained herein changes or subsequently becomes inaccurate. This report is provided for informational
purposes only. It is not an offer or a solicitation of an offer to buy or sell any financial instruments or to participate in any
particular trading strategy. Target prices are inherently imprecise and a product of the analyst’s judgment. The financial
instruments discussed in this report may not be suitable for all investors and investors must make their own informed
investment decisions. Prices and availability of financial instruments are subject to change without notice and
investment transactions can lead to losses as a result of price fluctuations and other factors. If a financial instrument is
denominated in a currency other than an investor's currency, a change in exchange rates may adversely affect the
investment. Past performance is not necessarily indicative of future results. Unless otherwise indicated, prices are
current as of the end of the previous trading session, and are sourced from local exchanges via Reuters, Bloomberg and
other vendors. Data is sourced from Deutsche Bank, subject companies, and in some cases, other parties.
Macroeconomic fluctuations often account for most of the risks associated with exposures to instruments that promise
to pay fixed or variable interest rates. For an investor who is long fixed rate instruments (thus receiving these cash
flows), increases in interest rates naturally lift the discount factors applied to the expected cash flows and thus cause a
loss. The longer the maturity of a certain cash flow and the higher the move in the discount factor, the higher will be the
loss. Upside surprises in inflation, fiscal funding needs, and FX depreciation rates are among the most common adverse
macroeconomic shocks to receivers. But counterparty exposure, issuer creditworthiness, client segmentation, regulation
(including changes in assets holding limits for different types of investors), changes in tax policies, currency
convertibility (which may constrain currency conversion, repatriation of profits and/or the liquidation of positions), and
settlement issues related to local clearing houses are also important risk factors to be considered. The sensitivity of fixed
income instruments to macroeconomic shocks may be mitigated by indexing the contracted cash flows to inflation, to
FX depreciation, or to specified interest rates – these are common in emerging markets. It is important to note that the
index fixings may -- by construction -- lag or mis-measure the actual move in the underlying variables they are intended
to track. The choice of the proper fixing (or metric) is particularly important in swaps markets, where floating coupon
rates (i.e., coupons indexed to a typically short-dated interest rate reference index) are exchanged for fixed coupons. It is
also important to acknowledge that funding in a currency that differs from the currency in which coupons are
denominated carries FX risk. Naturally, options on swaps (swaptions) also bear the risks typical to options in addition to
the risks related to rates movements.
Derivative transactions involve numerous risks including, among others, market, counterparty default and illiquidity risk.
The appropriateness or otherwise of these products for use by investors is dependent on the investors' own
circumstances including their tax position, their regulatory environment and the nature of their other assets and
liabilities, and as such, investors should take expert legal and financial advice before entering into any transaction similar

17 June 2015
Asia Pac Weekly ETF Market Review
Page 42 Deutsche Bank AG/Hong Kong
to or inspired by the contents of this publication. The risk of loss in futures trading and options, foreign or domestic, can
be substantial. As a result of the high degree of leverage obtainable in futures and options trading, losses may be
incurred that are greater than the amount of funds initially deposited. Trading in options involves risk and is not suitable
for all investors. Prior to buying or selling an option investors must review the "Characteristics and Risks of Standardized
Options”, at http://www.optionsclearing.com/about/publications/character-risks.jsp. If you are unable to access the
website please contact your Deutsche Bank representative for a copy of this important document.
Participants in foreign exchange transactions may incur risks arising from several factors, including the following: ( i)
exchange rates can be volatile and are subject to large fluctuations; ( ii) the value of currencies may be affected by
numerous market factors, including world and national economic, political and regulatory events, events in equity and
debt markets and changes in interest rates; and (iii) currencies may be subject to devaluation or government imposed
exchange controls which could affect the value of the currency. Investors in securities such as ADRs, whose values are
affected by the currency of an underlying security, effectively assume currency risk.
Unless governing law provides otherwise, all transactions should be executed through the Deutsche Bank entity in the
investor's home jurisdiction.
United States: Approved and/or distributed by Deutsche Bank Securities Incorporated, a member of FINRA, NFA and
SIPC. Non-U.S. analysts may not be associated persons of Deutsche Bank Securities Incorporated and therefore may not
be subject to FINRA regulations concerning communications with subject company, public appearances and securities
held by the analysts.
Germany: Approved and/or distributed by Deutsche Bank AG, a joint stock corporation with limited liability incorporated
in the Federal Republic of Germany with its principal office in Frankfurt am Main. Deutsche Bank AG is authorized under
German Banking Law (competent authority: European Central Bank) and is subject to supervision by the European
Central Bank and by BaFin, Germany’s Federal Financial Supervisory Authority.
United Kingdom: Approved and/or distributed by Deutsche Bank AG acting through its London Branch at Winchester
House, 1 Great Winchester Street, London EC2N 2DB. Deutsche Bank AG in the United Kingdom is authorised by the
Prudential Regulation Authority and is subject to limited regulation by the Prudential Regulation Authority and Financial
Conduct Authority. Details about the extent of our authorisation and regulation are available on request.
Hong Kong: Distributed by Deutsche Bank AG, Hong Kong Branch.
Korea: Distributed by Deutsche Securities Korea Co.
South Africa: Deutsche Bank AG Johannesburg is incorporated in the Federal Republic of Germany (Branch Register
Number in South Africa: 1998/003298/10).
Singapore: by Deutsche Bank AG, Singapore Branch or Deutsche Securities Asia Limited, Singapore Branch (One Raffles
Quay #18-00 South Tower Singapore 048583, +65 6423 8001), which may be contacted in respect of any matters
arising from, or in connection with, this report. Where this report is issued or promulgated in Singapore to a person who
is not an accredited investor, expert investor or institutional investor (as defined in the applicable Singapore laws and
regulations), they accept legal responsibility to such person for its contents.
Japan: Approved and/or distributed by Deutsche Securities Inc.(DSI). Registration number - Registered as a financial
instruments dealer by the Head of the Kanto Local Finance Bureau (Kinsho) No. 117. Member of associations: JSDA,
Type II Financial Instruments Firms Association, The Financial Futures Association of Japan, and Japan Investment
Advisers Association. Commissions and risks involved in stock transactions - for stock transactions, we charge stock
commissions and consumption tax by multiplying the transaction amount by the commission rate agreed with each
customer. Stock transactions can lead to losses as a result of share price fluctuations and other factors. Transactions in
foreign stocks can lead to additional losses stemming from foreign exchange fluctuations. We may also charge
commissions and fees for certain categories of investment advice, products and services. Recommended investment
strategies, products and services carry the risk of losses to principal and other losses as a result of changes in market
and/or economic trends, and/or fluctuations in market value. Before deciding on the purchase of financial products
and/or services, customers should carefully read the relevant disclosures, prospectuses and other documentation.
17 June 2015
Asia Pac Weekly ETF Market Review
Deutsche Bank AG/Hong Kong Page 43
"Moody's", "Standard & Poor's", and "Fitch" mentioned in this report are not registered credit rating agencies in Japan
unless Japan or "Nippon" is specifically designated in the name of the entity. Reports on Japanese listed companies not
written by analysts of DSI are written by Deutsche Bank Group's analysts with the coverage companies specified by DSI.
Some of the foreign securities stated on this report are not disclosed according to the Financial Instruments and
Exchange Law of Japan.
Malaysia: Deutsche Bank AG and/or its affiliate(s) may maintain positions in the securities referred to herein and may
from time to time offer those securities for purchase or may have an interest to purchase such securities. Deutsche Bank
may engage in transactions in a manner inconsistent with the views discussed herein.
Qatar: Deutsche Bank AG in the Qatar Financial Centre (registered no. 00032) is regulated by the Qatar Financial Centre
Regulatory Authority. Deutsche Bank AG - QFC Branch may only undertake the financial services activities that fall
within the scope of its existing QFCRA license. Principal place of business in the QFC: Qatar Financial Centre, Tower,
West Bay, Level 5, PO Box 14928, Doha, Qatar. This information has been distributed by Deutsche Bank AG. Related
financial products or services are only available to Business Customers, as defined by the Qatar Financial Centre
Regulatory Authority.
Russia: This information, interpretation and opinions submitted herein are not in the context of, and do not constitute,
any appraisal or evaluation activity requiring a license in the Russian Federation.
Kingdom of Saudi Arabia: Deutsche Securities Saudi Arabia LLC Company, (registered no. 07073-37) is regulated by the
Capital Market Authority. Deutsche Securities Saudi Arabia may only undertake the financial services activities that fall
within the scope of its existing CMA license. Principal place of business in Saudi Arabia: King Fahad Road, Al Olaya
District, P.O. Box 301809, Faisaliah Tower - 17th Floor, 11372 Riyadh, Saudi Arabia.
United Arab Emirates: Deutsche Bank AG in the Dubai International Financial Centre (registered no. 00045) is regulated
by the Dubai Financial Services Authority. Deutsche Bank AG - DIFC Branch may only undertake the financial services
activities that fall within the scope of its existing DFSA license. Principal place of business in the DIFC: Dubai
International Financial Centre, The Gate Village, Building 5, PO Box 504902, Dubai, U.A.E. This information has been
distributed by Deutsche Bank AG. Related financial products or services are only available to Professional Clients, as
defined by the Dubai Financial Services Authority.
Australia: Retail clients should obtain a copy of a Product Disclosure Statement (PDS) relating to any financial product
referred to in this report and consider the PDS before making any decision about whether to acquire the product. Please
refer to Australian specific research disclosures and related information at
https://australia.db.com/australia/content/research-information.html
Australia and New Zealand: This research, and any access to it, is intended only for "wholesale clients" within the
meaning of the Australian Corporations Act and New Zealand Financial Advisors Act respectively.
Additional information relative to securities, other financial products or issuers discussed in this report is available upon
request. This report may not be reproduced, distributed or published by any person for any purpose without Deutsche
Bank's prior written consent. Please cite source when quoting.
Copyright © 2015 Deutsche Bank AG
David Folkerts-Landau Group Chief Economist
Member of the Group Executive Committee
Raj Hindocha Global Chief Operating Officer
Research
Marcel Cassard Global Head
FICC Research & Global Macro Economics
Steve Pollard Global Head
Equity Research
Michael Spencer Regional Head
Asia Pacific Research
Ralf Hoffmann Regional Head
Deutsche Bank Research, Germany
Andreas Neubauer Regional Head
Equity Research, Germany
International Locations
Deutsche Bank AG
Deutsche Bank Place
Level 16
Corner of Hunter & Phillip Streets
Sydney, NSW 2000
Australia
Tel: (61) 2 8258 1234
Deutsche Bank AG
Große Gallusstraße 10-14
60272 Frankfurt am Main
Germany
Tel: (49) 69 910 00
Deutsche Bank AG
Filiale Hongkong
International Commerce Centre,
1 Austin Road West,Kowloon,
Hong Kong
Tel: (852) 2203 8888
Deutsche Securities Inc.
2-11-1 Nagatacho
Sanno Park Tower
Chiyoda-ku, Tokyo 100-6171
Japan
Tel: (81) 3 5156 6770
Deutsche Bank AG London
1 Great Winchester Street
London EC2N 2EQ
United Kingdom
Tel: (44) 20 7545 8000
Deutsche Bank Securities Inc.
60 Wall Street
New York, NY 10005
United States of America
Tel: (1) 212 250 2500