asia-pac telecom tracker -...
TRANSCRIPT
Deutsche Bank Markets Research
Asia
Telecommunications
Industry
Asia-Pac Telecom tracker
Date
31 March 2016
Periodical
Fears eroding, value remains
New entrant and regulatory fear easing, time to buy GARPy telcos
________________________________________________________________________________________________________________
Deutsche Bank AG/Hong Kong
Deutsche Bank does and seeks to do business with companies covered in its research reports. Thus, investors should be aware that the firm may have a conflict of interest that could affect the objectivity of this report. Investors should consider this report as only a single factor in making their investment decision. DISCLOSURES AND ANALYST CERTIFICATIONS ARE LOCATED IN APPENDIX 1. MCI (P) 124/04/2015.
Peter Milliken, CFA
Research Analyst
(+852 ) 2203 6190
Top picks
China Telecom Corp (0728.HK),HKD4.05 Buy
Bharti Airtel Limited (BRTI.BO),INR354.90 Buy
SK Telecom (017670.KS),KRW209,500.00 Buy
PLDT (TEL.PS),PHP1,979.00 Buy
SoftBank (9984.T),¥5,436 Buy
Source: Deutsche Bank
This is the second of our Tracker reports, which provide a snapshot on valuation, street positioning, momentum, and business trends. We conclude that the fears that have held back many telco stocks are fading, which should allow the attractive valuations of these generally higher growth telcos to now attract attention. We believe GARP is underpriced currently, and suggest investors skew positions towards BRTI, IDEA, CT and CM, CITIC Tel, DTAC, LGU, PLDT, SKT and to an extent Softbank.
December quarter trends Consensus earnings have generally declined since our last Tracker, but fears over new entrants, spectrum costs, and price controls have eased, allowing the telco index to rise 2% since our last Tracker, following recent gains. Better performers have been in more competitive markets that showed profit improvement, such as XL, ISAT, NTT, Docomo and HKT.
Key themes to pursue and consider We prefer the following themes: 1) Profit convergence – with high profit markets (MY, TH, SG, AU) coming under competitive and regulatory pressure, and low profit markets being repaired (ID, IN, KR, CH fixed). 2) Restructuring preferred (CT, CU, PLDT, DTAC, SKT), 3) Growth over dividends – as growth is cheaper and in our view, 4) Data monetization. We expect telcos to get through 4G build-out pain, and achieve data monetization. Bharti, CT, ISAT, LGU, SKT, PLDT and XL appear to have a solid combination of network in place and operating leverage to add value from this trend And 5) Valuation lift, as falling risk-free rates mean that DY less the local 10-year bonds are at sharply higher levels than pre-GFC – as highlighted in our March 10 sector report, To Infinity and Beyond.
Fears fade Fear has ruled the sector. We have been discussing the risks of new entrants and government involvement for 18 months, specifically in our Rate Risk and New Alpha Champions FITT reports. We believe these fears are now more than in the price, and we have seen new entrant risk drop in TH and PH, and government price controls ease as a fear in China and Japan. We believe data monetization is starting to come through – and that hype on IoT, digital content and e-commerce will build. We expect the sector to rise 40%+ to prior peaks on data monetization, digital services belief, and IoT. Our top picks are Bharti, CT, PLDT, SKT and Softbank. We suggest investors reduce exposure to high-payout names, which tend to be at historically high multiples.
Valuation and risks We value the telecoms on DCF, and the holdcos on SOTP. Our WACCs are typically based on local 10-year bonds, with risk premiums of 4.5%-5.5%, and terminal growth rates of 0%-2%. Key downside risks include: 1) Interest rates rebounding, cutting sector value, 2) Competition worsening, 3) Risk of spectrum pricing rising on competitive or regulatory change. Key upside risks include: 1) Hype on IoT, e-commerce, and data monetization driving earnings estimates and multiples, and 2) Low, and even negative, interest rates leading to an upward squeeze in valuations.

31 March 2016
Telecommunications
Asia-Pac Telecom tracker
Page 2 Deutsche Bank AG/Hong Kong
Key issues by market
Generally positive
The market is currently fixated on the negatives in each country. Our
discussions tend to be on why investors should be interested in the various
telcos we’re recommending, despite commonly held concerns. This to us
indicates the market is overly-pessimistic, and opportunity exists.
Figure 1: Key debates
Market Key issue Opportunity Our take
。Rising competition 。Optus network better, TLS worse
。TLS network outages 。TLS reinvestment 。TLS under pressure to invest NBN cash well
TLS DPS at risk in LT, but supportive ST
。Govt. price setting 。Lighter touch in 2016 / data monetization
。CT & CU cooperation 。CT & CU to catch up on CM, take share slowly
Bundling/CU co-operation, position CT well
。OTT & HKBN-led 。HKT to avoid BB price war, but under pressure
。Mobile repricing 。Mobile profits to step up
HKT integrating CSL well, but mobile preferred
。Jio launch 。Consolidation 。Jio a force for consolidation
。Data-led growth 。Data-led profit growth expected
Oligopoly developing, Bharti well placed
。Interconnect change 。Rising pricing 。IC not a big issue, sector profitability improving
。Network sharing 。XL and ISAT narrowing quality gap to Tsel
Profit focus encourages, but ISAT, XL have run up
。Govt. price setting 。Above average earnings risk
。Bond to equity switch 。More yield compression due
Could squeeze up in NIRP world to 30x P/Es
。ARPU stickiness 。Sector becoming more profit focused
。Content 。Content monetization to show through ahead
Shareholder alignment bubbling under. Add
。Rising competition 。N/A 。#4 becoming credible threat
。Spectrum 。Spectrum to be auctioned
Avoid mobile sector. TM strongly preferred
。New entrant 。Low legacy revenues/ mkt to grow > share loss
。PLDT digital pivot 。PLDT well positioned off low earnings
PLDT's US$0.5bn 2016 NPAT, low vs. peers. BUY
。New entrant 。Mobile pressure, but in the price
。N/A 。New entrant to struggle, but destabilize
BUY Singtel, but for EM and Oz opportunity
。New entrants next move 。Price rises 。$499 plans hurting mobile and fixed BB volume
。$499 plans deflationary 。Consolidation 。Price rise due by May
Yield compression play, but weak earnings
。AIS and DTAC losing 。JVs with TOT & CAT 。AIS and DTAC resolving issues
。JAS and True weakened 。JAS weakened, True over-invested
DTAC upside high on spectrum/infra solution
Australia
China
HK
India
Indonesia
Japan
Phils
Singapore
Taiwan
Thailand
Malaysia
Korea
Source: Deutsche Bank
31 March 2016
Telecommunications
Asia-Pac Telecom tracker
Deutsche Bank AG/Hong Kong Page 3
Model portfolio
Figure 2: Model portfolio (25 March 2016)
Weighted
DB model Prior return
weight weight Local At inclusion Local USD USD
Australia Telstra Corporation 0.0% 5.0% 5.25 5.44 -3% 0% 0.0%
China China Mobile 5.0% 5.0% 83.30 94.20 -12% -12% -0.6%
China China Telecom 10.0% 10.0% 3.94 4.03 -2% -2% -0.2%
Hong Kong CITIC Telecom 2.5% 2.5% 3.02 3.02 0% 0% 0.0%
India Bharti Airtel Limited 15.0% 15.0% 350.25 350.95 0% -3% -0.4%
India Idea Cellular 5.0% 0.0% 105.45 105.45 0% 0% 0.0%
Indonesia XL Axiata 2.5% 2.5% 3,860 3,240 19% 21% 0.5%
Indonesia Indosat 2.5% 2.5% 6,400 4,005 60% 63% 1.6%
Indonesia Telkom 5.0% 5.0% 3,305 2,680 23% 26% 1.3%
Japan Softbank 7.5% 0.0% 5,502 5,502 0% 0% 0.0%
Japan NTT Docomo 7.5% 7.5% 2,704 2,152 26% 32% 2.4%
Japan KDDI Corp 0.0% 7.5% 3,149 2,671 18% 24% 1.8%
Korea KT Corp 5.0% 5.0% 29,450 30,400 -3% -6% -0.3%
Korea LG Uplus 5.0% 5.0% 10,800 11,850 -9% -12% -0.6%
Korea SK Telecom 5.0% 5.0% 210,500 258,000 -18% -21% -1.1%
Philippines PLDT 10.0% 5.0% 1,953 2,260 -14% -14% -0.7%
Singapore M1 2.5% 2.5% 2.60 2.88 -10% -9% -0.2%
Singapore Singapore Telecom 7.5% 7.5% 3.82 3.94 -3% -2% -0.2%
Thailand TAC 2.5% 2.5% 42.25 58.00 -27% -27% -0.7%
Cash 0.0% 5.0%
Total 100.0% 100.0% 2.7%
Return since last rebalance 2.7%
DB model portfolio since inception (16 Oct 2015) 2.7%
MSCI Asia Pac Telco Index (MXAP0TC) 2.3%
DB outperformance since inception (16 Oct 2015) 0.4%
Red numbers are weight reductions
Blue numbers are weight inclusions
ReturnPrice
Note - we select stocks based on: 1) Upside to target price, 2) Stock recommendation, 3) USD return potential, 4) Free float,
5) Relative value vs. regional telcos, 6) Short-term catalysts, 7) Sector thematics. We target quarterly rebalancing and
average holding period of > 1 year Source: Deutsche Bank, Bloomberg Financial LLP
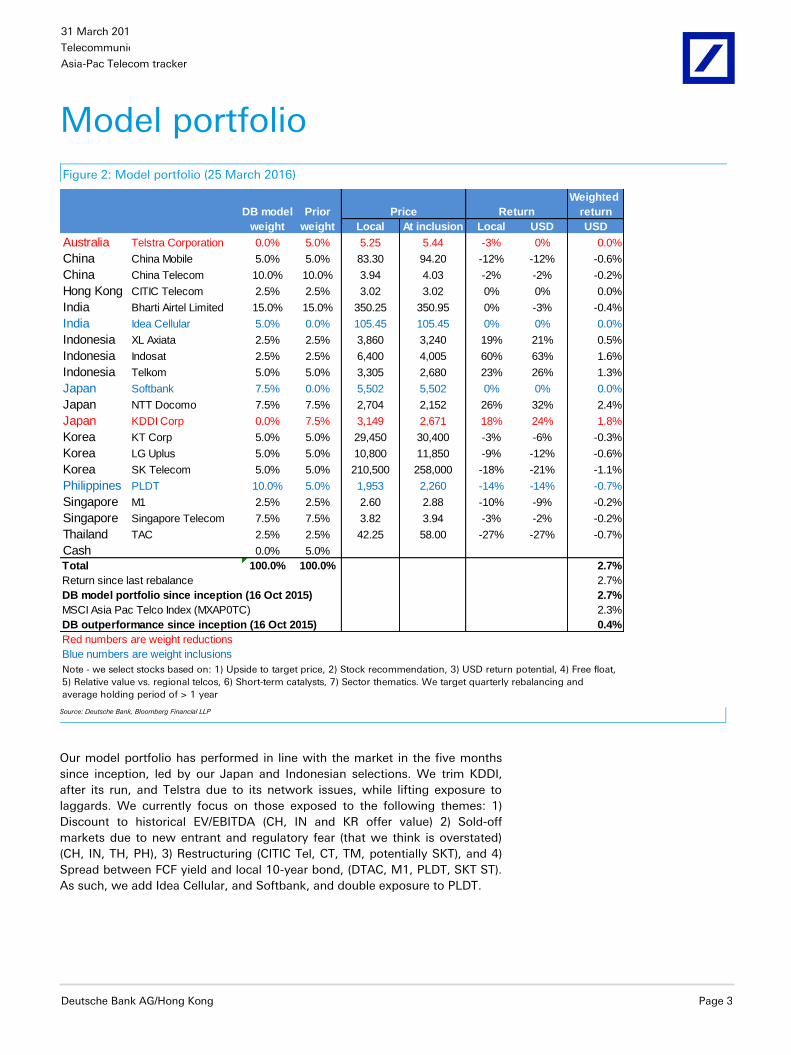
Our model portfolio has performed in line with the market in the five months
since inception, led by our Japan and Indonesian selections. We trim KDDI,
after its run, and Telstra due to its network issues, while lifting exposure to
laggards. We currently focus on those exposed to the following themes: 1)
Discount to historical EV/EBITDA (CH, IN and KR offer value) 2) Sold-off
markets due to new entrant and regulatory fear (that we think is overstated)
(CH, IN, TH, PH), 3) Restructuring (CITIC Tel, CT, TM, potentially SKT), and 4)
Spread between FCF yield and local 10-year bond, (DTAC, M1, PLDT, SKT ST).
As such, we add Idea Cellular, and Softbank, and double exposure to PLDT.

31 March 2016
Telecommunications
Asia-Pac Telecom tracker
Page 4 Deutsche Bank AG/Hong Kong
Top picks
Our sector thoughts were outlined in To Infinity and Beyond, published March
10tth, which highlighted how the telco sector value is increasing, along with
falling risk-free-rates. Valuation multiples should be higher in this cycle,
because of the lower WACCs, so we believe new highs can be made in the
telco index, offering 40%+ upside. Generally, high pay-out telcos are richly
priced vs. history, but lower pay-out, higher growth offers value. We expect
that value to be realized when investors see signs of earnings improving, as
data monetization comes through. We recommend to buy GARP, such as the
five stocks below, while among small caps, we are very keen on CITIC Tel.
Bharti Airtel
We expect Jio to be a force for consolidation, driving the sector towards more
of an oligopoly than the more perfect competition of today. Bharti’s relatively
strong spectrum position, and superior franchise, positions it to succeed
despite Jio’s likely pricing pressure. In USD market cap, and EV/EBITDA it is
coming off multi-year lows.
China Telecom
One standard deviation cheap on EV/EBITDA, and not far from the 3x multiple
it has bounced strongly off in the past. The cooperation with Unicom should
lift its competitive positioning, and we expect it and Unicom to benefit from
the triple driver of TowerCo, MNP and our expectation of a full merger, which
we believe can add 50-60% in value combined in the medium-term.
PLDT
2016 earnings are likely to be a low, as the company’s efforts to rebuild to
become the premium network and content provider pay-off. At 5%+ DY on just
a 75% pay-out ratio, and likely trough earnings, we like the company. The
Philippines also looks better insulated to a China slowdown, than most.
SK Telecom
A value play, with its DY yield premium to government bonds trading 1 s.d.
cheap. SK Telecom can benefit from content and video-led ARPU growth, from
the sector effort to lift profitability, which started with the Handset Distribution
Bill, and from improving its corporate structure, which is a consideration.
Softbank
We believe it will benefit from two technical drivers, the ¥500bn buy-back,
which should soak up around 7-8% of shares, and May’s MSCI rebalance,
which should drive up key asset, Alibaba, with we estimate 11 days buying
required. The caveat to this is that the stock’s discount to SOTP has narrowed
to below average levels, making this more a short-term top pick.

31 March 2016
Telecommunications
Asia-Pac Telecom tracker
Deutsche Bank AG/Hong Kong Page 5
Street Positioning
The Street sees most upside in Chinese, Korean and Indian telcos, and least in
Malaysia, Taiwan and Indonesia. This may partly reflect that TW and ID telcos
have performed well, while CH, KR and IN telcos have been weak.
Figure 3: Companies Vs Consensus Rec Score
0
1
2
3
4
5
6
Ch M
ob
HK
T
SK
T
KT C
orp
NTT
CIT
IC
TLK
M
Sin
gte
l
LG
U
Ch T
el
XL
Indosat
KD
DI
Ch U
ni
AIS
Bharti
Docom
o
Glo
be
Idea
FE
T
Tw
n M
ob
M1
Chunghw
a
Axia
ta
Tel M
al
PLD
T
DTA
C
Tels
tra
Rel C
om
Sta
rhub
Jasm
ine
Source: Deutsche Bank, Bloomberg Financial LLP
Figure 4: Street recommendations
0%
10%
20%
30%
40%
50%
60%
70%
80%
90%
100%
Ch M
ob
HK
T
CIT
IC
SK
T
KT C
orp
TLK
M
NTT
M1
Ch T
el
XL
LG
U
DTA
C
Bharti
KD
DI
Ch U
ni
Indosat
PLD
T
Idea
Sta
rhub
Docom
o
Chunghw
a
Sin
gte
l
FE
T
Jasm
ine
AIS
Axia
ta
Tels
tra
Rel C
om
Glo
be
Maxis
Tel M
al
Tw
n M
ob
Sell
Hold
Buy
Source: Deutsche Bank, , Bloomberg Financial LLP
Figure 5: TP upside/downside
-15%
-10%
-5%
0%
5%
10%
15%
20%
25%
30%
35%
SK
T
Ch M
ob
Idea
Rel C
om
CIT
IC
Ch U
ni
Ch te
l
KT C
orp
NTT
LG
U
XL
KD
DI
Sin
gte
l
HK
T
TLK
M
Docom
o
M1
Bharti
Axia
ta
Tels
tra
Sta
rhub
Jasm
ine
Tel M
al
Tw
n M
ob
AIS
FE
T
Glo
be
Indosat
PLD
T
Chunghw
a
DTA
C
Maxis
Source: Deutsche Bank, Bloomberg Financial LLP
The sector is generally well
loved by the Street – but
TWM and TM lacking buyers
– and telcos in AU, MY, TH
and TW failing to generate
much interest
The sector remains well loved
by the Street – We are
generally in line with the
Street - but are more bullish
on DTAC, PLDT and TM, and
less bullish on HKT and KT
Street appears to be expecting valuation
multiples to both normalize and
converge, rising in China, while most
other telcos track earnings growth

31 March 2016
Telecommunications
Asia-Pac Telecom tracker
Page 6 Deutsche Bank AG/Hong Kong
Earnings beats and misses
Figure 6: Prior quarter EBITDA vs consensus Figure 7: Prior quarter revenue vs. consensus
0%
20%
40%
60%
80%
100%
120%
AIS
Chunghw
a
DTA
C
Sin
gte
l
KT C
orp
Maxis
Sta
rhub
Rel C
om
Tels
tra
M1
PLD
T
DiG
i
Ch M
ob
CIT
IC
SK
T
Ch T
el
HK
T
LG
U
Tw
n M
ob
Axia
ta
Bharti
Indosat
Docom
o
NTT
Tel m
al
KD
DI
TLK
M
Glo
be
SoftB
ank
XL
FE
T
Idea
Jasm
ine
80%
85%
90%
95%
100%
105%
KD
DI
Sin
gte
l
DTA
C
AIS
KT c
orp
Chunghw
a
Rel C
om
Maxis
FE
T
LG
U
SK
T
Docom
o
TW
n M
ob
Bharti
Indosat
XL
TLK
M
Idea
Source: Deutsche Bank, , Bloomberg Financial LLP
Source: Deutsche Bank, , Bloomberg Financial LLP
Interestingly, Japanese telcos, which have been consistently
delivering, have started to slightly miss consensus, while operators
undergoing sector or corporate repair, such as the Indian operators,
Maxis, KT and Indosat beat consensus.
Chinese telcos disappointed the market, but were generally on our
forecasts, with CM stronger than we expected, we have been
consistently arguing that 4G ramp up costs would be a much bigger
drag that the market anticipated.
Stocks that have consistently been favorite of ours (but not the Street),
CITIC and Docomo have seen EPS forecasts lifted most – while mature
fixed line operators are also defying the general EPS cuts across the
sector. PLDT had the most disappointing earnings season, given its
2016 guidance for an 18% earnings drop– before rebounding on
Telstra’s decision to not invest in the third operator. AIS and DTAC
have seen their EPS forecasts cut sharply following the spectrum
auction debacle, which now seems to be turning up. LGU had sharply
higher earnings growth baked, in, which was always going to difficult
to deliver on.
Figure 8: 3M consensus EPS change
-35%-30%-25%-20%-15%-10%
-5%0%5%
10%
CIT
IC
Docom
o
KT C
orp
NTT
HK
T
Chunghw
a
TLK
M
KD
DI
Sin
gte
l
Tels
tra
Tw
n M
ob
Axia
ta
M1
Maxis
FE
T
Sta
rhub
Glo
be
Tel M
al
Ch U
ni
XL
Ch M
ob
Bharti
Idea
Indosat
Rel C
om
LG
U
PLD
T
SK
T
Ch T
el
AIS
DTA
C
Source: Deutsche Bank, Bloomberg Financial LLP
The unloved mature market
fixed-line focused operators
– the only operators to see
EPS lifts in the quarter

31 March 2016
Telecommunications
Asia-Pac Telecom tracker
Deutsche Bank AG/Hong Kong Page 7
Sector valuation
Figure 9: MSCI Asia Pac ex Japan Telecom P/E Figure 10: MSCI Asia Pac Telecom P/E
0
5
10
15
20
25
Mar-
06
Mar-
07
Mar-
08
Mar-
09
Mar-
10
Mar-
11
Mar-
12
Mar-
13
Mar-
14
Mar-
15
Mar-
16
0
5
10
15
20
25
Mar-
06
Mar-
07
Mar-
08
Mar-
09
Mar-
10
Mar-
11
Mar-
12
Mar-
13
Mar-
14
Mar-
15
Mar-
16
Source: Deutsche Bank, Bloomberg Finance LP
Source: Deutsche Bank, Bloomberg Finance LP
Sector valuation is half a standard deviation above average, but ex the GFC-
through-EFC, valuations are below average, and we remind investors that 2G,
ADSL, and 3G/iPhone excitement led to much higher index levels in prior
cycles that we expect to be revisited in the medium-term as IoT, digital
content, e-commerce and 4G data monetization become a sector focus. While
Japan has had a strong run, Asia-Pac ex Japan telcos have generally not
moved much in recent years. We note that the telco DY premium to utilities is
the narrowest in several years, so telcos are relatively expensive vs. utilities vs.
their history – but this may reflect utility capex and opex rises ahead as they
move to less-polluting plant.
The telco stand out globally has been Japan, which now looks relatively
expensive, but buy-backs and negative rates should be supportive.
Figure 11: Fwd DY of Asian telcos vs. utilities and REITs Figure 12: Telecom prices of Asia vs. EU vs. US vs. JPN
0%
1%
2%
3%
4%
5%
6%
Oct-
12
Feb-1
3
Jun-1
3
Oct-
13
Feb-1
4
Jun-1
4
Oct-
14
Feb-1
5
Jun-1
5
Oct-
15
Feb-1
6
REITS
Telcos
Utilities
60
110
160
210
260
310
Oct-
12
Feb-1
3
Jun-1
3
Oct-
13
Feb-1
4
Jun-1
4
Oct-
14
Feb-1
5
Jun-1
5
Oct-
15
Feb-1
6
JPN
Asia
EU
US
Source: Deutsche Bank, Bloomberg Financial LLP
Source: Deutsche Bank, Bloomberg Financial LLP
Valuation fair – and we expect it to
cycle up on 4G/ IoT excitement
31 March 2016
Telecommunications
Asia-Pac Telecom tracker
Page 8 Deutsche Bank AG/Hong Kong
Sector relative valuation
Figure 13: P/E point premium to local market – five year range and current
-20
-10
0
10
20
30
40
Softb
ank
SK
T
LG
U
KTC
orp
FE
T
Ch M
ob
CIT
IC
Ch T
el
NTT
M1
KD
DI
PLD
T
Tels
tra
Sin
gTel
Glo
be
Sta
rhub
Rel C
om
AIS
Jasm
ine
Docom
o
TLK
M
Chunghw
a
HK
T
Idea
Ch U
ni
Tw
n M
ob
Axia
ta
Bharti
DTA
C
MA
XIS
Indosat
Tel M
al
Low
High
Current
Spread
Source: Deutsche Bank, Bloomberg Financial LLP
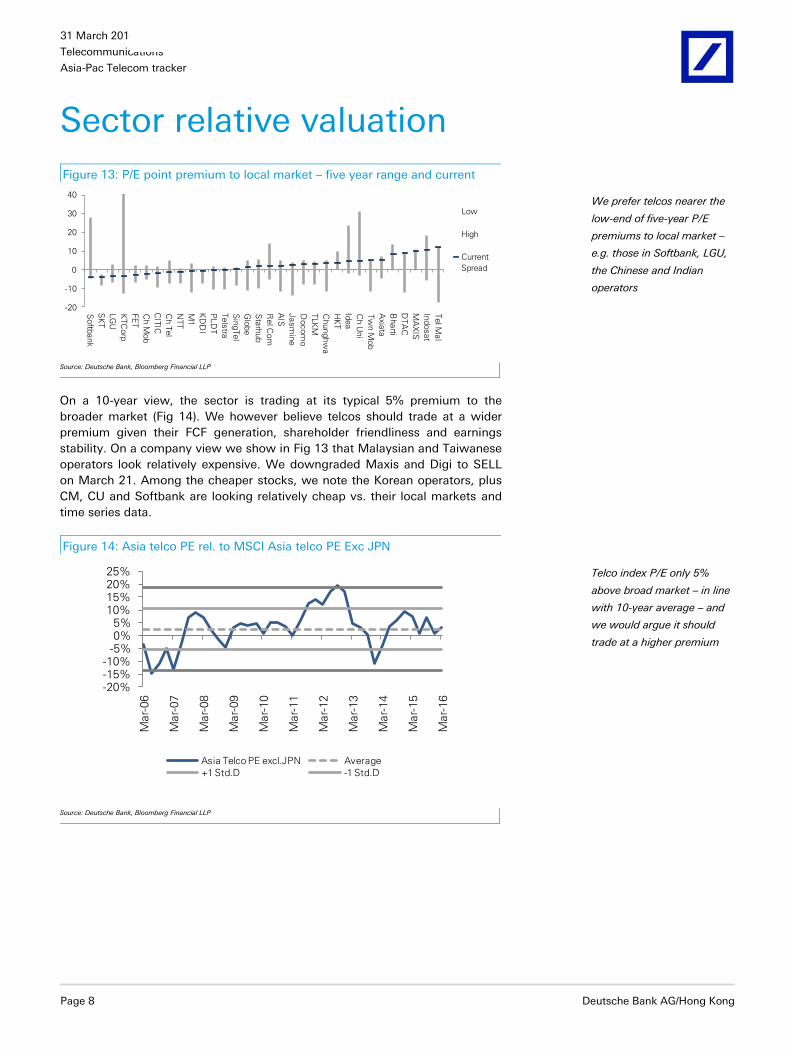
On a 10-year view, the sector is trading at its typical 5% premium to the
broader market (Fig 14). We however believe telcos should trade at a wider
premium given their FCF generation, shareholder friendliness and earnings
stability. On a company view we show in Fig 13 that Malaysian and Taiwanese
operators look relatively expensive. We downgraded Maxis and Digi to SELL
on March 21. Among the cheaper stocks, we note the Korean operators, plus
CM, CU and Softbank are looking relatively cheap vs. their local markets and
time series data.
Figure 14: Asia telco PE rel. to MSCI Asia telco PE Exc JPN
-20%-15%-10%
-5%0%5%
10%15%20%25%
Mar-
06
Mar-
07
Mar-
08
Mar-
09
Mar-
10
Mar-
11
Mar-
12
Mar-
13
Mar-
14
Mar-
15
Mar-
16
Asia Telco PE excl.JPN Average
+1 Std.D -1 Std.D
Source: Deutsche Bank, Bloomberg Financial LLP
We prefer telcos nearer the
low-end of five-year P/E
premiums to local market –
e.g. those in Softbank, LGU,
the Chinese and Indian
operators
Telco index P/E only 5%
above broad market – in line
with 10-year average – and
we would argue it should
trade at a higher premium
31 March 2016
Telecommunications
Asia-Pac Telecom tracker
Deutsche Bank AG/Hong Kong Page 9
Five-year valuation range
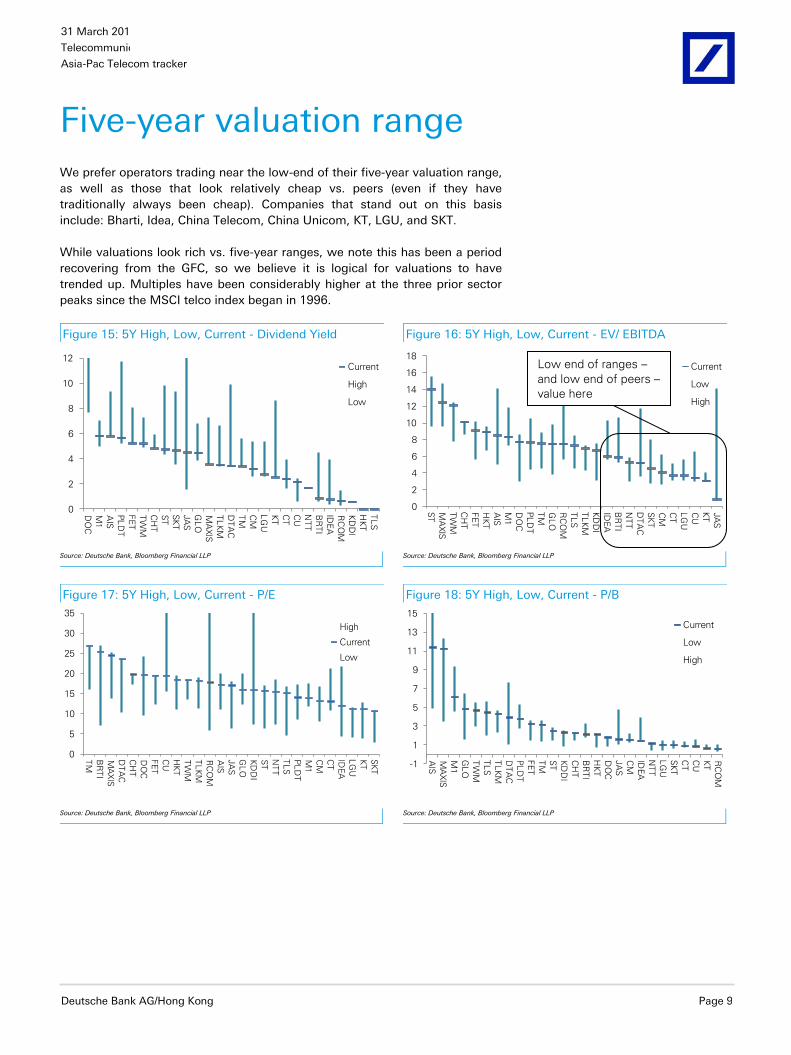
We prefer operators trading near the low-end of their five-year valuation range,
as well as those that look relatively cheap vs. peers (even if they have
traditionally always been cheap). Companies that stand out on this basis
include: Bharti, Idea, China Telecom, China Unicom, KT, LGU, and SKT.
While valuations look rich vs. five-year ranges, we note this has been a period
recovering from the GFC, so we believe it is logical for valuations to have
trended up. Multiples have been considerably higher at the three prior sector
peaks since the MSCI telco index began in 1996.
Figure 15: 5Y High, Low, Current - Dividend Yield Figure 16: 5Y High, Low, Current - EV/ EBITDA
0
2
4
6
8
10
12
DO
C
M1
AIS
PL
DT
FE
T
TW
M
CH
T
ST
SK
T
JA
S
GL
O
MA
XIS
TL
KM
DT
AC
TM
CM
LG
U
KT
CT
CU
NT
T
BR
TI
IDE
A
RC
OM
KD
DI
HK
T
TL
S
Current
High
Low
0
2
4
6
8
10
12
14
16
18S
T
MA
XIS
TW
M
CH
T
FE
T
HK
T
AIS
M1
DO
C
PL
DT
TM
GL
O
RC
OM
TL
S
TL
KM
KD
DI
IDE
A
BR
TI
NT
T
DT
AC
SK
T
CM
CT
LG
U
CU
KT
JA
S
Current
Low
High
Source: Deutsche Bank, Bloomberg Financial LLP
Source: Deutsche Bank, Bloomberg Financial LLP
Figure 17: 5Y High, Low, Current - P/E Figure 18: 5Y High, Low, Current - P/B
0
5
10
15
20
25
30
35
TM
BR
TI
MA
XIS
DT
AC
CH
T
DO
C
FE
T
CU
HK
T
TW
M
TL
KM
RC
OM
AIS
JA
S
GL
O
KD
DI
ST
NT
T
TL
S
PL
DT
M1
CM
CT
IDE
A
LG
U
KT
SK
T
High
Current
Low
-1
1
3
5
7
9
11
13
15
AIS
MA
XIS
M1
GL
O
TW
M
TL
S
TL
KM
DT
AC
PL
DT
FE
T
TM
ST
KD
DI
CH
T
BR
TI
HK
T
DO
C
JA
S
CM
IDE
A
NT
T
LG
U
SK
T
CT
CU
KT
RC
OM
Current
Low
High
Source: Deutsche Bank, Bloomberg Financial LLP
Source: Deutsche Bank, Bloomberg Financial LLP
Low end of ranges –
and low end of peers –
value here

31 March 2016
Telecommunications
Asia-Pac Telecom tracker
Page 10 Deutsche Bank AG/Hong Kong
Sector performance
Upside and downside to prior highs and lows
We prefer telcos that have potential to rise sharply back to prior highs, rather
than those high in unchartered territory. The Chinese, Indian, Korean and
Philippine operators have greater upside to 52-week highs, while the Japanese
operators, Indosat and XL are stretched by recent standards. As can be seen
from Fig 20, the high-payout telcos in HK, TW and JP, are testing 10-year
highs.
Figure 19: Upside and downside to 52 week high and low
-100%
-80%
-60%
-40%
-20%
0%
20%
40%
60%
DTA
C
Idea
Rel C
om
Jasm
ine
Ch T
el
Ch U
ni
PLD
T
CIT
IC
Ch M
ob
SK
T
AIS
Glo
be
Bharti
Tels
tra
Axia
ta
LG
U
Sin
gte
l
Tel M
al
Maxis
XL
KT C
orp
NTT
Docom
o
KD
DI
HK
T
Tw
n M
ob
TLK
M
FE
T
Chunghw
a
Indosat
Upside Downside
Source: Deutsche Bank, Bloomberg Financial LLP
Figure 20: Upside and downside to 10-year high and low
-100%
-50%
0%
50%
100%
150%
200%
250%
300%
350%
400%
Rel C
om
DTA
C
Idea
Jasm
ine
XL
Ch T
el
PLD
T
Ch U
ni
Bharti
AIS
Ch M
ob
CIT
IC
KT C
orp
SK
T
Indosat
Glo
be
LG
U
Axia
ta
Tels
tra
Sin
gte
l
Maxis
Tel M
al
Docom
o
NTT
KD
DI
HK
T
TLK
M
FE
T
Tw
n M
ob
Chunghw
a
Upside Downside
Source: Deutsche Bank, Bloomberg Financial LLP
More upside to prior highs Substantially rerated
31 March 2016
Telecommunications
Asia-Pac Telecom tracker
Deutsche Bank AG/Hong Kong Page 11
Sector Balance
Figure 21: Market Cap breakdown country-wise Figure 22: Profit share breakdown country-wise
TLS
CM
HK
T
BH
TI
TLK
M
NTT
SK
T
PLD
T
STE
L
CH
T
AIS
MA
X
OP
T
CT
HT
IDE
A
XL
DO
C
KT G
LO
STH
TW
M
TR
U
DIG
CU
SM
T
VO
D
ISAT
KD
DI
LG
U
M1
FE
T
TA
C
AX
RCOTH
SB
APT JASTM
0%
10%
20%
30%
40%
50%
60%
70%
80%
90%
100%
AUS CHN HKG IND IDN JPN KOR PHP SGP TWN THL MLY
TLS
CM
HK
T
BH
TI TLK
M
NTT
SK
T
PLD
T
STE
L
CH
T
AIS
MA
X
OP
T
CT
HT
IDE
A
XL
DO
C
KT
GLO
STH
TW
M TRU
DIG
CUSMT
VOD
ISAT
KDDI LGU
M1
FET TAC
AX
RCOM
OTH
SB
APT
JAS TMOTH
-40%
-20%
0%
20%
40%
60%
80%
100%
AUS CHN HKG IND IDN JPN KOR PHP SGP TWN THL MLY
Source: Deutsche Bank
Source: Deutsche Bank
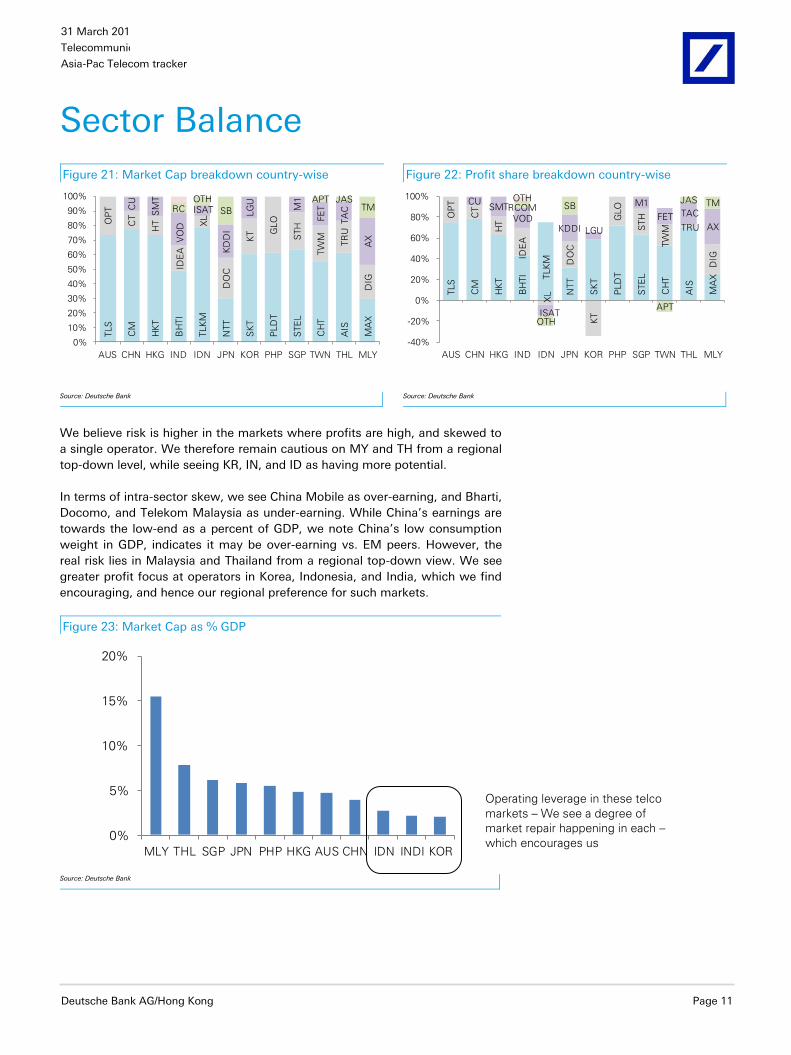
We believe risk is higher in the markets where profits are high, and skewed to
a single operator. We therefore remain cautious on MY and TH from a regional
top-down level, while seeing KR, IN, and ID as having more potential.
In terms of intra-sector skew, we see China Mobile as over-earning, and Bharti,
Docomo, and Telekom Malaysia as under-earning. While China’s earnings are
towards the low-end as a percent of GDP, we note China’s low consumption
weight in GDP, indicates it may be over-earning vs. EM peers. However, the
real risk lies in Malaysia and Thailand from a regional top-down view. We see
greater profit focus at operators in Korea, Indonesia, and India, which we find
encouraging, and hence our regional preference for such markets.
Figure 23: Market Cap as % GDP
0%
5%
10%
15%
20%
MLY THL SGP JPN PHP HKG AUS CHN IDN INDI KOR
Source: Deutsche Bank
Operating leverage in these telco
markets – We see a degree of
market repair happening in each –
which encourages us

31 March 2016
Telecommunications
Asia-Pac Telecom tracker
Page 12 Deutsche Bank AG/Hong Kong
Dividends
Figure 24: DY(bubble) vs. Real Yld(X) vs. Payout(Y) in DM Figure 25: DY(bubble) vs. Real Yld(X) vs. Payout(Y) in EM
-1.0
-0.5
0.0
0.5
1.0
1.5
2.0
-2.0% -1.0% 0.0% 1.0% 2.0% 3.0% 4.0% 5.0% 6.0%
Payout
ratio
Premium over local 10Y
HKT
TWM
FET
TLS
CHT
ST
SKT
DOC
NTT
KT
KDDI
LGU
-0.5
0.0
0.5
1.0
1.5
2.0
2.5
-8.0% -5.0% -2.0% 1.0% 4.0% 7.0% 10.0%
Payout
Ratio
Premium over local 10Y
AIS
PLDT
GLO
CM
DTAC
TLKM
CT
CU
BRTI
IDEA
RCOM
Source: Deutsche Bank, Bloomberg Financial LLP
Source: Deutsche Bank, Bloomberg Financial LLP
We prefer operators that have high dividend yield premiums to the local 10-
year bonds, but room to lift payouts further. Docomo, PLDT, Singtel, SK
Telecom all look good to us on such measures.
We also note that growth tends to be picking up, which may lead to valuation
multiples rising - as valuation is basically price/(WACC-growth). We believe
telcos have been caught out by OTT, and priced data too low. We believe that
operators are now generally trying to monetize investments more aggressively,
and that earnings growth should follow, encouraging investors to pay higher
valuation multiples ahead, and driving more yield compression.
Figure 26: DY spread vs. DPS 3 yr CAGR Figure 27: EY spread vs. EPS 3 yr Backward CAGR
-8%-6%-4%-2%0%2%4%6%8%
10%
Oct-1
2
Feb-1
3
Jun-1
3
Oct-1
3
Feb-1
4
Jun-1
4
Oct-1
4
Feb-1
5
Jun-1
5
Oct-1
5
Feb-1
6
DY Spread DPS 3yr CAGR
-6%
-4%
-2%
0%
2%
4%
6%
8%
10%
Oct-1
2
Feb-1
3
Jun-1
3
Oct-1
3
Feb-1
4
Jun-1
4
Oct-1
4
Feb-1
5
Jun-1
5
Oct-1
5
Feb-1
6
EY Spread EPS 3yr CAGR
Source: Deutsche Bank, Bloomberg Financial LLP
Source: Deutsche Bank, Bloomberg Financial LLP
Growth momentum turning up, which may
encourage investors to lift earnings yields
31 March 2016
Telecommunications
Asia-Pac Telecom tracker
Deutsche Bank AG/Hong Kong Page 13
Drivers
Figure 28: Mobile ARPU (US$/month) Figure 29: Data as % of mobile service revenue
0.0
10.0
20.0
30.0
40.0
50.0
60.0
70.0
Dec-1
2
Mar-
13
Jun-1
3
Sep-1
3
Dec-1
3
Mar-
14
Jun-1
4
Sep-1
4
Dec-1
4
Mar-
15
Jun-1
5
Sep-1
5
Dec-1
5
SKT US$
SingTel US$
Docomo US$
SmarTone US$
FET US$
Celcom US$
China Mobile US$
AIS US$
Bharti US$
Telkomsel US$
PLDT US$
0%
20%
40%
60%
80%
100%
120%
140%
160%
Ch T
el
Docom
o
Optu
s
XL
Sin
gTel
DIG
I
Bharti
Indosat
Source: Deutsche Bank, Company data
Source: Deutsche Bank, Company data
Figure 32: Mobile ARPU YoY 4Q15 –
-70%
-60%
-50%
-40%
-30%
-20%
-10%
0%
10%
20%
30%
KD
DI
AIS
TLK
M
DTA
C
Maxi
s
Ch U
ni
Docom
o
Chunghw
a
SK
T
Sta
rHub
TW
M
KTC
Soft
bank
Sin
gTel
Idea
FE
T
PLD
T
Celc
om
Bhart
i
DIG
I
LG
U
Indosat
Ch M
ob
Ch T
el
Glo
be
M1
TR
UE
Source: Deutsche Bank, Company data
Figure 30: Mobile net adds YoY (last reported quarter) Figure 31: Mobile net add breakdown (last quarter)
-4%
-2%
0%
2%
4%
6%
KO
R
IDN
AU
S
TW
N
IND
MLY
PH
P
HK
G
JP
N
SG
P
TH
L
CH
N
.
Optus CM Bharti Excl
Doc
KTDigi GLO M1
CHTAIS
Telstra
CT BSNLISAT
KDDI
LGU
Maxis
SmartSTEL
FET
DTAC
CU
Idea
Others
Softbank
SK Tel
STH
TWM
TRUE
Others
RCOM
-100%
-80%
-60%
-40%
-20%
0%
20%
40%
60%
80%
100%
AU
S
CH
N
IND
I
IDN
JP
N
KO
R
MLY
PH
P
SG
P
TW
N
TH
L
Source: Deutsche Bank, Company data
Source: Deutsche Bank, Company data

31 March 2016
Telecommunications
Asia-Pac Telecom tracker
Page 14 Deutsche Bank AG/Hong Kong
EBITDA margin trends
Figure 53: Australia Figure 54: China Figure 55: Hong Kong
0%
10%
20%
30%
40%
50%
4Q
09
2Q
10
4Q
10
2Q
11
4Q
11
2Q
12
4Q
12
2Q
13
4Q
13
2Q
14
4Q
14
2Q
15
4Q
15
Telstra
0%
10%
20%
30%
40%
50%
60%
4Q
09
2Q
10
4Q
10
2Q
11
4Q
11
2Q
12
4Q
12
2Q
13
4Q
13
2Q
14
4Q
14
2Q
15
4Q
15
China Mobile China Telecom China Unicom
0%
10%
20%
30%
40%
4Q
09
2Q
10
4Q
10
2Q
11
4Q
11
2Q
12
4Q
12
2Q
13
4Q
13
2Q
14
4Q
14
2Q
15
4Q
15
HKT
Source: Deutsche Bank
Source: Deutsche Bank
Source: Deutsche Bank
Figure 56: India Figure 57: Indonesia Figure 58: Japan
0%
10%
20%
30%
40%
50%
60%
4Q
09
2Q
10
4Q
10
2Q
11
4Q
11
2Q
12
4Q
12
2Q
13
4Q
13
2Q
14
4Q
14
2Q
15
4Q
15
Bharti Airtel Idea Cellular RCOM
0%
10%
20%
30%
40%
50%
60%
70%
4Q
09
2Q
10
4Q
10
2Q
11
4Q
11
2Q
12
4Q
12
2Q
13
4Q
13
2Q
14
4Q
14
2Q
15
4Q
15
XL Axiata Telkom
0%
20%
40%
60%
80%
100%
4Q
09
2Q
10
4Q
10
2Q
11
4Q
11
2Q
12
4Q
12
2Q
13
4Q
13
2Q
14
4Q
14
2Q
15
4Q
15
SoftBank NTT (fixed) NTT DoCoMo KDDI
Source: Deutsche Bank
Source: Deutsche Bank
Source: Deutsche Bank
Figure 59: Korea Figure 60: Malaysia Figure 61: Philippines
-50%
0%
50%
100%
150%
200%
250%
300%
4Q
10
2Q
11
4Q
11
2Q
12
4Q
12
2Q
13
4Q
13
2Q
14
4Q
14
2Q
15
4Q
15
KT Corporation LG Uplus SK Telecom
0%
10%
20%
30%
40%
50%
60%
4Q
09
2Q
10
4Q
10
2Q
11
4Q
11
2Q
12
4Q
12
2Q
13
4Q
13
2Q
14
4Q
14
2Q
15
4Q
15
DiGi.Com Maxis
Telekom Malaysia Celcom
0%
10%
20%
30%
40%
50%
60%
70%
4Q
09
2Q
10
4Q
10
2Q
11
4Q
11
2Q
12
4Q
12
2Q
13
4Q
13
2Q
14
4Q
14
2Q
15
4Q
15
Globe Telecom PLDT
Source: Deutsche Bank
Source: Deutsche Bank
Source: Deutsche Bank
Figure 62: Singapore Figure 63: Taiwan Figure 64: Thailand
0%
10%
20%
30%
40%
50%
4Q
09
2Q
10
4Q
10
2Q
11
4Q
11
2Q
12
4Q
12
2Q
13
4Q
13
2Q
14
4Q
14
2Q
15
4Q
15
M1 Singtel Domestic Starhub
0%
10%
20%
30%
40%
50%
60%
4Q
09
2Q
10
4Q
10
2Q
11
4Q
11
2Q
12
4Q
12
2Q
13
4Q
13
2Q
14
4Q
14
2Q
15
4Q
15
CHT Far EasTone TWM
0%
10%
20%
30%
40%
50%
60%
4Q
09
2Q
10
4Q
10
2Q
11
4Q
11
2Q
12
4Q
12
2Q
13
4Q
13
2Q
14
4Q
14
2Q
15
4Q
15
AIS DTAC True Corp
Source: Deutsche Bank
Source: Deutsche Bank
Source: Deutsche Bank

31 March 2016
Telecommunications
Asia-Pac Telecom tracker
Deutsche Bank AG/Hong Kong Page 15
EBITDA by Country (in local currency billion)
Markets appearing to see margins improving, or near cyclical lows, include
China, Malaysia, Philippines and Thailand, while those appearing set to slow or
near margin peaks include India, Indonesia, Japan and Taiwan.
Figure 33: China Figure 34: India
-15%
-10%
-5%
0%
5%
10%
15%
0
20
40
60
80
100
120
4Q
11
2Q
12
4Q
12
2Q
13
4Q
13
2Q
14
4Q
14
2Q
15
4Q
15
CT
CU
CM
Total
-30%
-20%
-10%
0%
10%
20%
30%
0
20
40
60
80
100
120
140
4Q
11
2Q
12
4Q
12
2Q
13
4Q
13
2Q
14
4Q
14
2Q
15
4Q
15
RCOM
IDEA
BHRT
Total
Source: Deutsche Bank
Source: Deutsche Bank
Figure 35: Indonesia Figure 36: Japan
-15%
-10%
-5%
0%
5%
10%
15%
20%
25%
30%
0
5,000
10,000
15,000
20,000
4Q
11
2Q
12
4Q
12
2Q
13
4Q
13
2Q
14
4Q
14
2Q
15
4Q
15
XL
ISAT
TLKM
Total
-10%
-5%
0%
5%
10%
15%
20%
25%
0
500
1,000
1,500
2,000
4Q
11
2Q
12
4Q
12
2Q
13
4Q
13
2Q
14
4Q
14
2Q
15
4Q
15
KDDI
DOC
NTT
(fixed)SB
Total
Source: Deutsche Bank
Source: Deutsche Bank
Figure 37: Korea Figure 38: Malaysia (Change TKOM to TM, D Gi to DIGI)
-60%
-40%
-20%
0%
20%
40%
60%
80%
-500
0
500
1,000
1,500
2,000
2,500
3,000
3,500
4Q
11
2Q
12
4Q
12
2Q
13
4Q
13
2Q
14
4Q
14
2Q
15
4Q
15
LGU
KT
SKT
Total
-6%
-4%
-2%
0%
2%
4%
6%
8%
0
1
2
3
4
4Q
11
2Q
12
4Q
12
2Q
13
4Q
13
2Q
14
4Q
14
2Q
15
4Q
15
DIGI
CEL
TM
MAX
Total
Source: Deutsche Bank
Source: Deutsche Bank

31 March 2016
Telecommunications
Asia-Pac Telecom tracker
Page 16 Deutsche Bank AG/Hong Kong
Figure 39: Philippines Figure 40: Singapore
-10%
-5%
0%
5%
10%
15%
0
5
10
15
20
25
30
35
4Q
11
2Q
12
4Q
12
2Q
13
4Q
13
2Q
14
4Q
14
2Q
15
4Q
15
GLO
PLDT
Total
-10%
-8%
-6%
-4%
-2%
0%
2%
4%
6%
8%
0.0
0.2
0.4
0.6
0.8
1.0
4Q
11
2Q
12
4Q
12
2Q
13
4Q
13
2Q
14
4Q
14
2Q
15
4Q
15
M1
STH
ST
dom
Total
Source: Deutsche Bank
Source: Deutsche Bank
Figure 41: Taiwan Figure 42: Thailand
-10%
-5%
0%
5%
10%
15%
0
5
10
15
20
25
30
35
40
4Q
11
2Q
12
4Q
12
2Q
13
4Q
13
2Q
14
4Q
14
2Q
15
4Q
15
TWM
FET
CHT
Total
-10%
-5%
0%
5%
10%
15%
0
5
10
15
20
25
30
35
4Q
11
2Q
12
4Q
12
2Q
13
4Q
13
2Q
14
4Q
14
2Q
15
4Q
15
TRUE
DTAC
AIS
Total
Source: Deutsche Bank
Source: Deutsche Bank
31 March 2016
Telecommunications
Asia-Pac Telecom tracker
Deutsche Bank AG/Hong Kong Page 17
Recent quarter’s YoY growth
Figure 43: Service revenue YoY
-15%
-10%
-5%
0%
5%
10%
15%
20%
25%
HK
T
Tel M
al
TLK
M
Glo
be
Ch T
el
Ch U
ni
Idea
TR
UE
Axia
ta
Bharti
Tels
tra
Ch M
ob
NTT
Docom
o
Optu
s
Maxis
Tw
n M
ob
KD
DI
Chunghw
a
XL
LG
U
Sin
gTel
AIS
FE
T
M1
Sta
rhub
SK
T
DiG
i
PLD
T
Rel C
om
DTA
C
SoftB
ank
Celc
om
Source: Deutsche Bank, Bloomberg Financial LLP
Figure 44: EBITDA YoY
-30%
-20%
-10%
0%
10%
20%
30%
40%
KTC
SoftB
ank
Glo
be
Maxis
Bharti
Axia
ta
FE
T
TR
UE
Ch M
ob
Idea
Ch T
el
DoC
oM
o
TLK
M
HK
T
CH
T
KD
DI
NTT
Tw
n M
ob
Optu
s
M1
Tels
tra
XL
Sin
gTel
Ch U
ni
AIS
Rel C
om
Celc
om
SK
T
DTA
C
Tel M
al
LG
U
DiG
Sta
rhub
PLD
T
Source: Deutsche Bank, Bloomberg Financial LLP
Figure 45: Net Profit YoY
-100%
-80%
-60%
-40%
-20%
0%
20%
40%
60%
80%
100%
Ch U
ni
XL
Ch T
el
NTT
Bharti
Docom
o
Tel M
al
Maxis
Celc
om
Ch M
ob
Rel C
om
Tw
n M
ob
Tels
tra
AIS
Optu
s
Sin
gTel
DiG
i
KD
DI
M1
Idea
Dia
log
TLK
m
Robi
DTA
C
Axia
ta
CH
T
SK
T
FE
T
TR
UE
Glo
be
SoftB
ank
LG
U
PLD
T
KTC
Source: Deutsche Bank, Bloomberg Financial LLP
31 March 2016
Telecommunications
Asia-Pac Telecom tracker
Page 18 Deutsche Bank AG/Hong Kong
Sector price performance
Figure 46: 1M Price performance –
-30%
-25%
-20%
-15%
-10%
-5%
0%
5%
10%
15%
Idea
Rel C
om
Maxis
SK
T
M1
LG
U
Axia
ta
Bharti
Ch M
ob
CIT
IC
Sta
rhub
KTC
orp
KD
DI
Sin
gTel
Tel M
al
Jasm
ine
Ch M
ob
Ch T
el
Indosat
Tels
tra
Tw
n M
ob
Glo
be
XL
Chunghw
a
FE
T
DO
CO
MO
HK
T
NTT
PLD
T
DTA
C
AIS
Source: Deutsche Bank, Bloomberg Financial LLP
Figure 47: 3M Price performance
-60%
-50%
-40%
-30%
-20%
-10%
0%
10%
20%
30%
40%
DTA
C
Jasm
ine
AIS
Idea
SK
T
LG
U
M1
Glo
be
Bharti
CIT
IC
Rel C
om
KTC
orp
Maxis
Sin
gTel
Ch T
el
Ch M
ob
Axia
ta
Ch M
ob
Sta
rhub
FE
T
Tw
n M
ob
Tel M
al
Chunghw
a
PLD
T
KD
DI
Tels
tra
DO
CO
MO
HK
T
NTT
XL
Indosat
Source: Deutsche Bank, Bloomberg Financial LLP
Figure 48: 12M Price performance
-80%
-60%
-40%
-20%
0%
20%
40%
60%
DTA
C
Jasm
ine
M1
Idea
AIS
SK
T
LG
U
Ch M
ob
PLD
T
XL
Bharti
Axia
ta
Ch T
el
Maxis
Sta
rhub
Rel C
om
Ch M
ob
Sin
gTel
KTC
orp
Tels
tra
FE
T
Tw
n M
ob
Tel M
al
HK
T
Chunghw
a
Glo
be
KD
DI
CIT
IC
DO
CO
MO
Indosat
NTT
Source: Deutsche Bank, Bloomberg Financial LLP
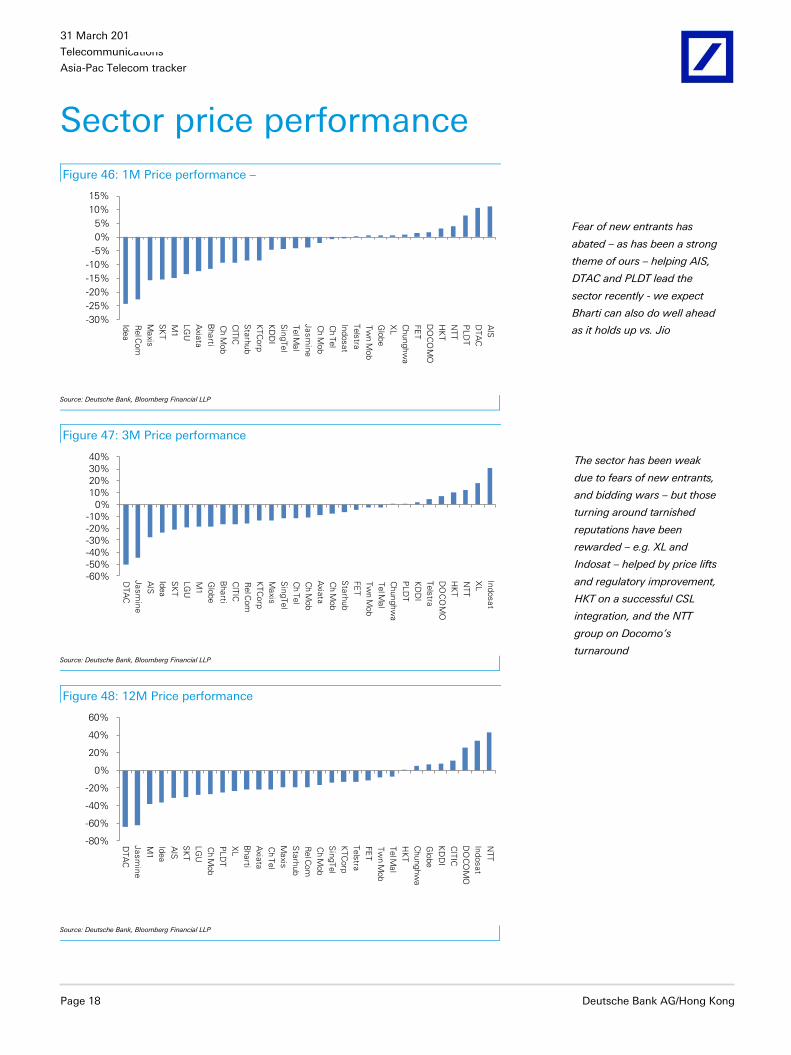
Fear of new entrants has
abated – as has been a strong
theme of ours – helping AIS,
DTAC and PLDT lead the
sector recently - we expect
Bharti can also do well ahead
as it holds up vs. Jio
The sector has been weak
due to fears of new entrants,
and bidding wars – but those
turning around tarnished
reputations have been
rewarded – e.g. XL and
Indosat – helped by price lifts
and regulatory improvement,
HKT on a successful CSL
integration, and the NTT
group on Docomo’s
turnaround
31 March 2016
Telecommunications
Asia-Pac Telecom tracker
Deutsche Bank AG/Hong Kong Page 19
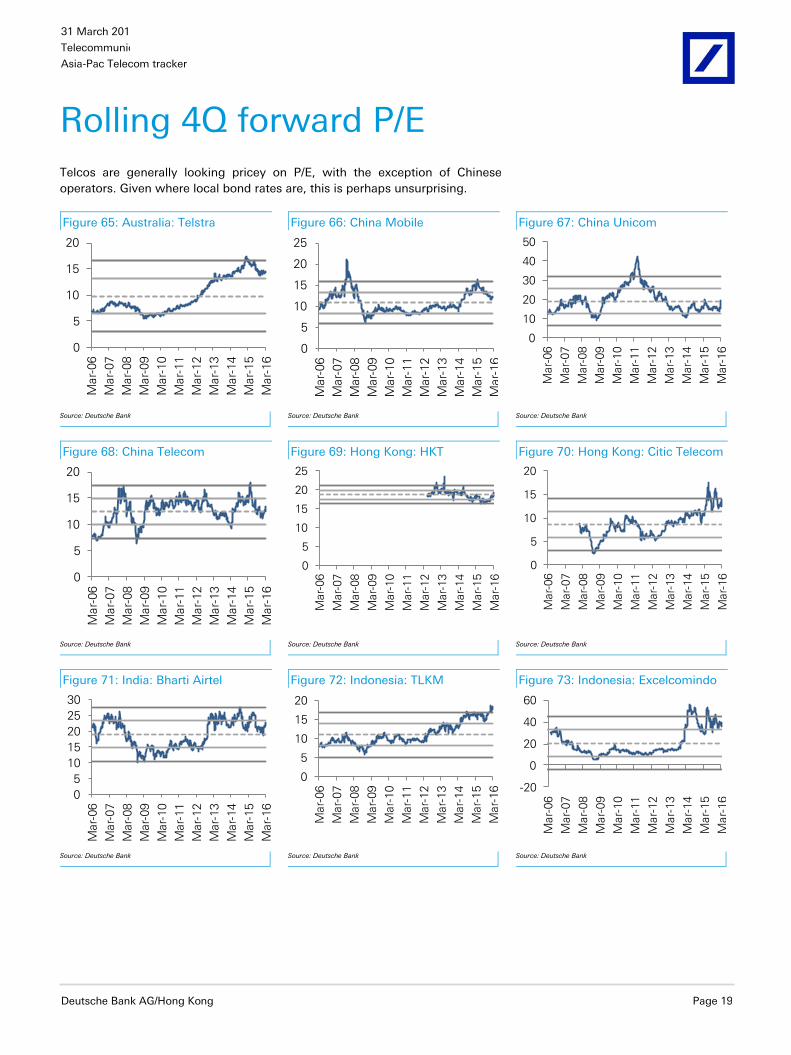
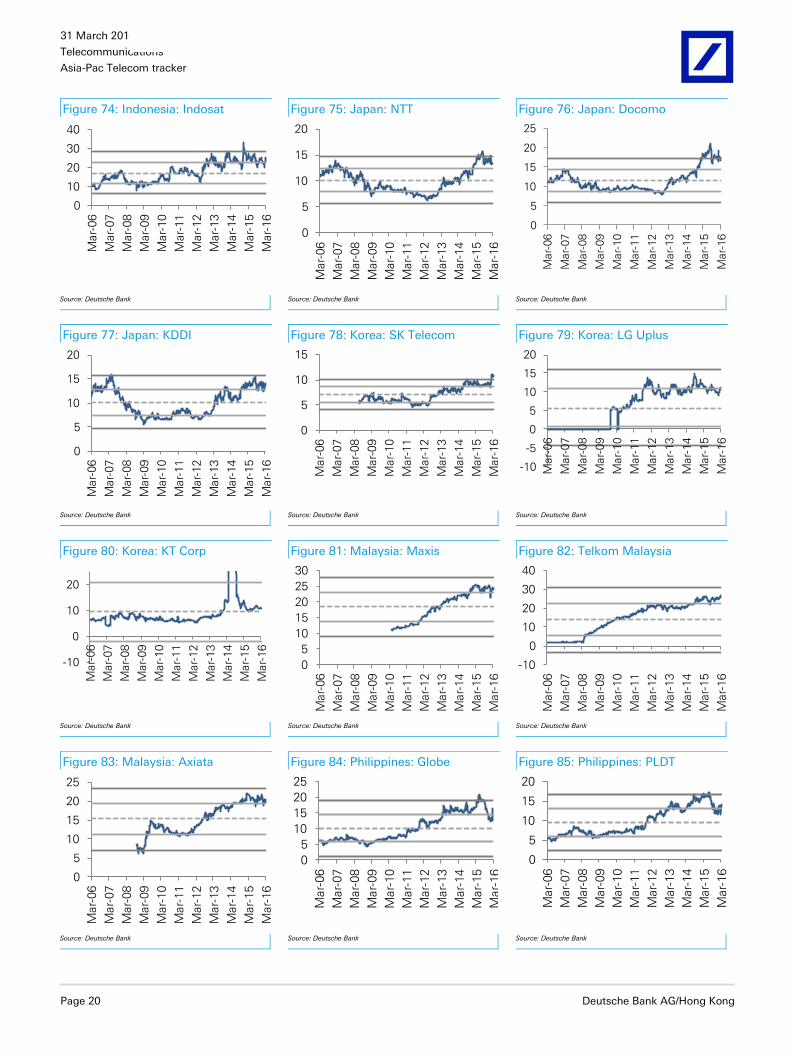
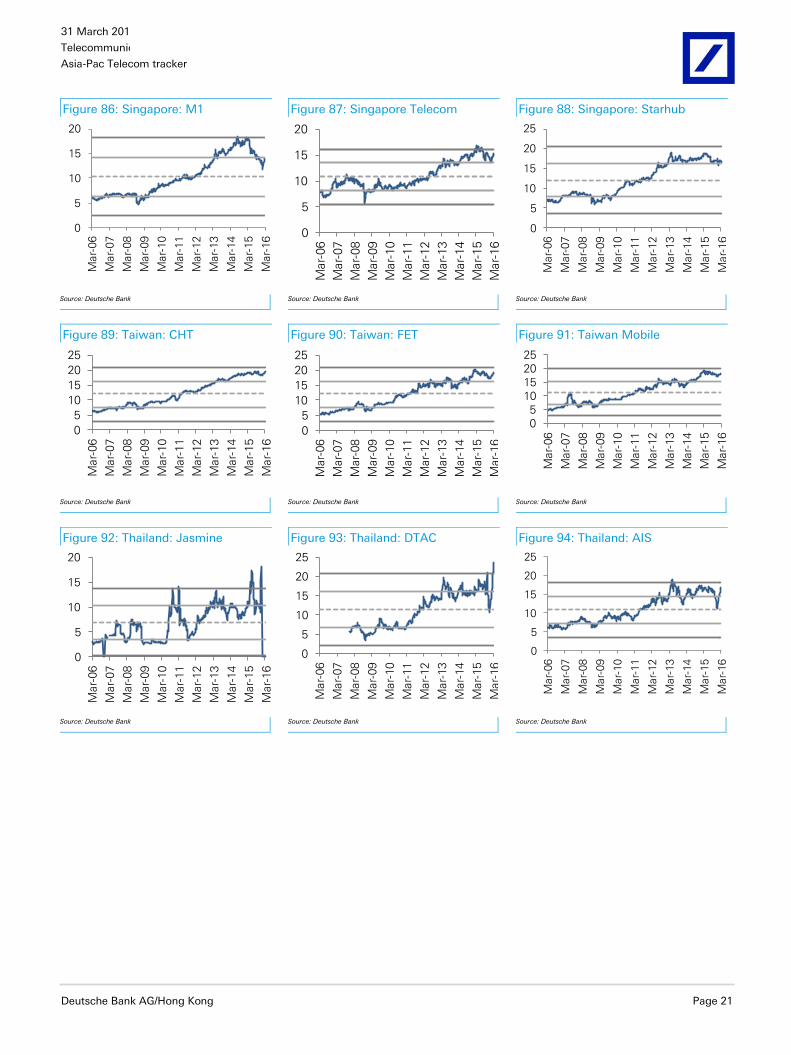
Rolling 4Q forward P/E
Telcos are generally looking pricey on P/E, with the exception of Chinese
operators. Given where local bond rates are, this is perhaps unsurprising.
Figure 65: Australia: Telstra Figure 66: China Mobile Figure 67: China Unicom
0
5
10
15
20
Mar-
06
Mar-
07
Mar-
08
Mar-
09
Mar-
10
Mar-
11
Mar-
12
Mar-
13
Mar-
14
Mar-
15
Mar-
16
0
5
10
15
20
25
Mar-
06
Mar-
07
Mar-
08
Mar-
09
Mar-
10
Mar-
11
Mar-
12
Mar-
13
Mar-
14
Mar-
15
Mar-
16
0
10
20
30
40
50
Mar-
06
Mar-
07
Mar-
08
Mar-
09
Mar-
10
Mar-
11
Mar-
12
Mar-
13
Mar-
14
Mar-
15
Mar-
16
Source: Deutsche Bank
Source: Deutsche Bank
Source: Deutsche Bank
Figure 68: China Telecom Figure 69: Hong Kong: HKT Figure 70: Hong Kong: Citic Telecom
0
5
10
15
20
Mar-
06
Mar-
07
Mar-
08
Mar-
09
Mar-
10
Mar-
11
Mar-
12
Mar-
13
Mar-
14
Mar-
15
Mar-
16
0
5
10
15
20
25
Mar-
06
Mar-
07
Mar-
08
Mar-
09
Mar-
10
Mar-
11
Mar-
12
Mar-
13
Mar-
14
Mar-
15
Mar-
16
0
5
10
15
20
Mar-
06
Mar-
07
Mar-
08
Mar-
09
Mar-
10
Mar-
11
Mar-
12
Mar-
13
Mar-
14
Mar-
15
Mar-
16
Source: Deutsche Bank
Source: Deutsche Bank
Source: Deutsche Bank
Figure 71: India: Bharti Airtel Figure 72: Indonesia: TLKM Figure 73: Indonesia: Excelcomindo
0
5
10
15
20
25
30
Mar-
06
Mar-
07
Mar-
08
Mar-
09
Mar-
10
Mar-
11
Mar-
12
Mar-
13
Mar-
14
Mar-
15
Mar-
16
0
5
10
15
20
Mar-
06
Mar-
07
Mar-
08
Mar-
09
Mar-
10
Mar-
11
Mar-
12
Mar-
13
Mar-
14
Mar-
15
Mar-
16
-20
0
20
40
60
Mar-
06
Mar-
07
Mar-
08
Mar-
09
Mar-
10
Mar-
11
Mar-
12
Mar-
13
Mar-
14
Mar-
15
Mar-
16
Source: Deutsche Bank
Source: Deutsche Bank
Source: Deutsche Bank
31 March 2016
Telecommunications
Asia-Pac Telecom tracker
Page 20 Deutsche Bank AG/Hong Kong
Figure 74: Indonesia: Indosat Figure 75: Japan: NTT Figure 76: Japan: Docomo
0
10
20
30
40
Mar-
06
Mar-
07
Mar-
08
Mar-
09
Mar-
10
Mar-
11
Mar-
12
Mar-
13
Mar-
14
Mar-
15
Mar-
16
0
5
10
15
20
Mar-
06
Mar-
07
Mar-
08
Mar-
09
Mar-
10
Mar-
11
Mar-
12
Mar-
13
Mar-
14
Mar-
15
Mar-
16
0
5
10
15
20
25
Mar-
06
Mar-
07
Mar-
08
Mar-
09
Mar-
10
Mar-
11
Mar-
12
Mar-
13
Mar-
14
Mar-
15
Mar-
16
Source: Deutsche Bank
Source: Deutsche Bank
Source: Deutsche Bank
Figure 77: Japan: KDDI Figure 78: Korea: SK Telecom Figure 79: Korea: LG Uplus
0
5
10
15
20
Mar-
06
Mar-
07
Mar-
08
Mar-
09
Mar-
10
Mar-
11
Mar-
12
Mar-
13
Mar-
14
Mar-
15
Mar-
16
0
5
10
15
Mar-
06
Mar-
07
Mar-
08
Mar-
09
Mar-
10
Mar-
11
Mar-
12
Mar-
13
Mar-
14
Mar-
15
Mar-
16
-10
-5
0
5
10
15
20
Mar-
06
Mar-
07
Mar-
08
Mar-
09
Mar-
10
Mar-
11
Mar-
12
Mar-
13
Mar-
14
Mar-
15
Mar-
16
Source: Deutsche Bank
Source: Deutsche Bank
Source: Deutsche Bank
Figure 80: Korea: KT Corp Figure 81: Malaysia: Maxis Figure 82: Telkom Malaysia
-10
0
10
20
Mar-
06
Mar-
07
Mar-
08
Mar-
09
Mar-
10
Mar-
11
Mar-
12
Mar-
13
Mar-
14
Mar-
15
Mar-
16
0
5
10
15
20
25
30
Mar-
06
Mar-
07
Mar-
08
Mar-
09
Mar-
10
Mar-
11
Mar-
12
Mar-
13
Mar-
14
Mar-
15
Mar-
16
-10
0
10
20
30
40
Mar-
06
Mar-
07
Mar-
08
Mar-
09
Mar-
10
Mar-
11
Mar-
12
Mar-
13
Mar-
14
Mar-
15
Mar-
16
Source: Deutsche Bank
Source: Deutsche Bank
Source: Deutsche Bank
Figure 83: Malaysia: Axiata Figure 84: Philippines: Globe Figure 85: Philippines: PLDT
0
5
10
15
20
25
Mar-
06
Mar-
07
Mar-
08
Mar-
09
Mar-
10
Mar-
11
Mar-
12
Mar-
13
Mar-
14
Mar-
15
Mar-
16
0
5
10
15
20
25
Mar-
06
Mar-
07
Mar-
08
Mar-
09
Mar-
10
Mar-
11
Mar-
12
Mar-
13
Mar-
14
Mar-
15
Mar-
16
0
5
10
15
20
Mar-
06
Mar-
07
Mar-
08
Mar-
09
Mar-
10
Mar-
11
Mar-
12
Mar-
13
Mar-
14
Mar-
15
Mar-
16
Source: Deutsche Bank
Source: Deutsche Bank
Source: Deutsche Bank
31 March 2016
Telecommunications
Asia-Pac Telecom tracker
Deutsche Bank AG/Hong Kong Page 21
Figure 86: Singapore: M1 Figure 87: Singapore Telecom Figure 88: Singapore: Starhub
0
5
10
15
20
Mar-
06
Mar-
07
Mar-
08
Mar-
09
Mar-
10
Mar-
11
Mar-
12
Mar-
13
Mar-
14
Mar-
15
Mar-
16
0
5
10
15
20
Mar-
06
Mar-
07
Mar-
08
Mar-
09
Mar-
10
Mar-
11
Mar-
12
Mar-
13
Mar-
14
Mar-
15
Mar-
16
0
5
10
15
20
25
Mar-
06
Mar-
07
Mar-
08
Mar-
09
Mar-
10
Mar-
11
Mar-
12
Mar-
13
Mar-
14
Mar-
15
Mar-
16
Source: Deutsche Bank
Source: Deutsche Bank
Source: Deutsche Bank
Figure 89: Taiwan: CHT Figure 90: Taiwan: FET Figure 91: Taiwan Mobile
0
5
10
15
20
25
Mar-
06
Mar-
07
Mar-
08
Mar-
09
Mar-
10
Mar-
11
Mar-
12
Mar-
13
Mar-
14
Mar-
15
Mar-
16
0
5
10
15
20
25
Mar-
06
Mar-
07
Mar-
08
Mar-
09
Mar-
10
Mar-
11
Mar-
12
Mar-
13
Mar-
14
Mar-
15
Mar-
16
0
5
10
15
20
25
Mar-
06
Mar-
07
Mar-
08
Mar-
09
Mar-
10
Mar-
11
Mar-
12
Mar-
13
Mar-
14
Mar-
15
Mar-
16
Source: Deutsche Bank
Source: Deutsche Bank
Source: Deutsche Bank
Figure 92: Thailand: Jasmine Figure 93: Thailand: DTAC Figure 94: Thailand: AIS
0
5
10
15
20
Mar-
06
Mar-
07
Mar-
08
Mar-
09
Mar-
10
Mar-
11
Mar-
12
Mar-
13
Mar-
14
Mar-
15
Mar-
16
0
5
10
15
20
25
Mar-
06
Mar-
07
Mar-
08
Mar-
09
Mar-
10
Mar-
11
Mar-
12
Mar-
13
Mar-
14
Mar-
15
Mar-
16
0
5
10
15
20
25M
ar-
06
Mar-
07
Mar-
08
Mar-
09
Mar-
10
Mar-
11
Mar-
12
Mar-
13
Mar-
14
Mar-
15
Mar-
16
Source: Deutsche Bank
Source: Deutsche Bank
Source: Deutsche Bank
31 March 2016
Telecommunications
Asia-Pac Telecom tracker
Page 22 Deutsche Bank AG/Hong Kong
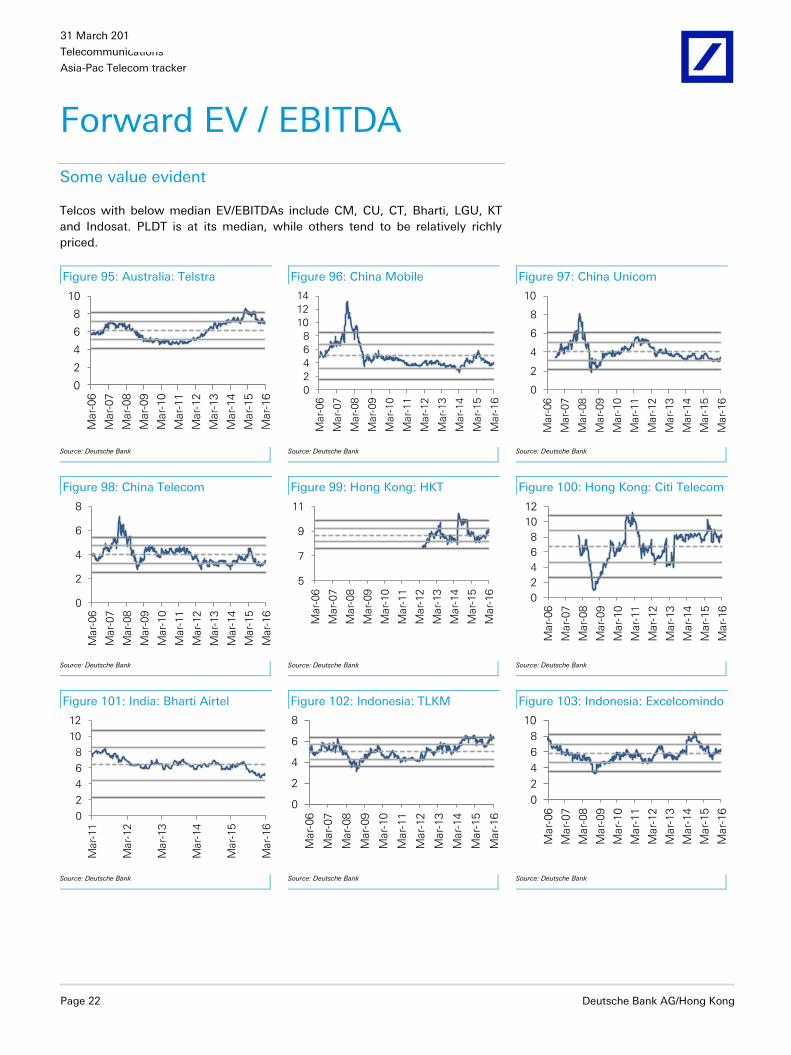
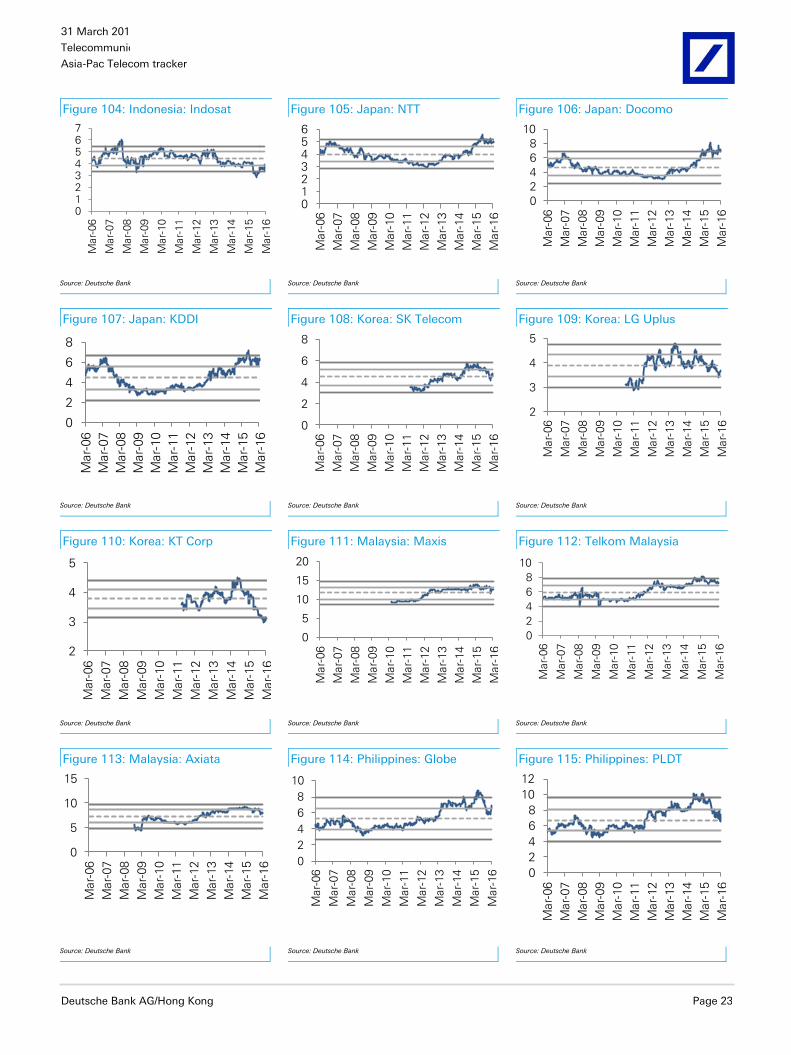
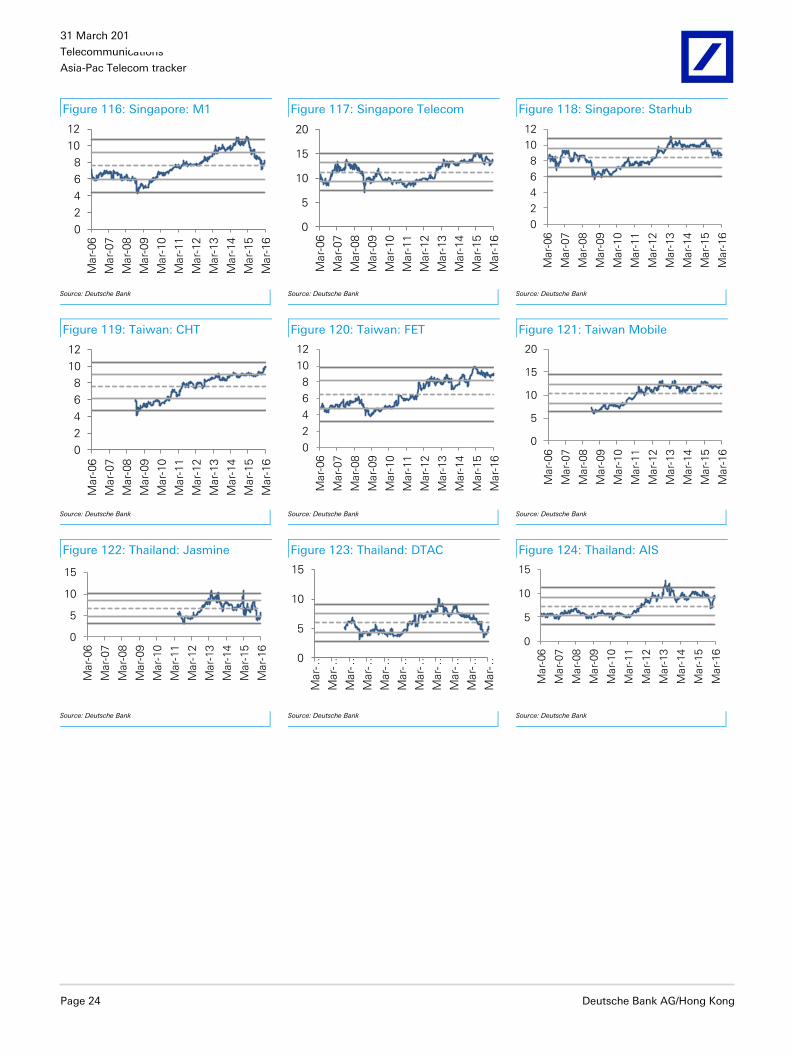
Forward EV / EBITDA
Some value evident
Telcos with below median EV/EBITDAs include CM, CU, CT, Bharti, LGU, KT
and Indosat. PLDT is at its median, while others tend to be relatively richly
priced.
Figure 95: Australia: Telstra Figure 96: China Mobile Figure 97: China Unicom
0
2
4
6
8
10
Mar-
06
Mar-
07
Mar-
08
Mar-
09
Mar-
10
Mar-
11
Mar-
12
Mar-
13
Mar-
14
Mar-
15
Mar-
16
0
2
4
6
8
10
12
14
Mar-
06
Mar-
07
Mar-
08
Mar-
09
Mar-
10
Mar-
11
Mar-
12
Mar-
13
Mar-
14
Mar-
15
Mar-
16
0
2
4
6
8
10
Mar-
06
Mar-
07
Mar-
08
Mar-
09
Mar-
10
Mar-
11
Mar-
12
Mar-
13
Mar-
14
Mar-
15
Mar-
16
Source: Deutsche Bank
Source: Deutsche Bank
Source: Deutsche Bank
Figure 98: China Telecom Figure 99: Hong Kong: HKT Figure 100: Hong Kong: Citi Telecom
0
2
4
6
8
Mar-
06
Mar-
07
Mar-
08
Mar-
09
Mar-
10
Mar-
11
Mar-
12
Mar-
13
Mar-
14
Mar-
15
Mar-
16
5
7
9
11
Mar-
06
Mar-
07
Mar-
08
Mar-
09
Mar-
10
Mar-
11
Mar-
12
Mar-
13
Mar-
14
Mar-
15
Mar-
16
0
2
4
6
8
10
12
Mar-
06
Mar-
07
Mar-
08
Mar-
09
Mar-
10
Mar-
11
Mar-
12
Mar-
13
Mar-
14
Mar-
15
Mar-
16
Source: Deutsche Bank
Source: Deutsche Bank
Source: Deutsche Bank
Figure 101: India: Bharti Airtel Figure 102: Indonesia: TLKM Figure 103: Indonesia: Excelcomindo
0
2
4
6
8
10
12
Mar-
11
Mar-
12
Mar-
13
Mar-
14
Mar-
15
Mar-
16
0
2
4
6
8
Mar-
06
Mar-
07
Mar-
08
Mar-
09
Mar-
10
Mar-
11
Mar-
12
Mar-
13
Mar-
14
Mar-
15
Mar-
16
0
2
4
6
8
10
Mar-
06
Mar-
07
Mar-
08
Mar-
09
Mar-
10
Mar-
11
Mar-
12
Mar-
13
Mar-
14
Mar-
15
Mar-
16
Source: Deutsche Bank
Source: Deutsche Bank
Source: Deutsche Bank
31 March 2016
Telecommunications
Asia-Pac Telecom tracker
Deutsche Bank AG/Hong Kong Page 23
Figure 104: Indonesia: Indosat Figure 105: Japan: NTT Figure 106: Japan: Docomo
01234567
Mar-
06
Mar-
07
Mar-
08
Mar-
09
Mar-
10
Mar-
11
Mar-
12
Mar-
13
Mar-
14
Mar-
15
Mar-
16
0123456
Mar-
06
Mar-
07
Mar-
08
Mar-
09
Mar-
10
Mar-
11
Mar-
12
Mar-
13
Mar-
14
Mar-
15
Mar-
16
0
2
4
6
8
10
Mar-
06
Mar-
07
Mar-
08
Mar-
09
Mar-
10
Mar-
11
Mar-
12
Mar-
13
Mar-
14
Mar-
15
Mar-
16
Source: Deutsche Bank
Source: Deutsche Bank
Source: Deutsche Bank
Figure 107: Japan: KDDI Figure 108: Korea: SK Telecom Figure 109: Korea: LG Uplus
0
2
4
6
8
Mar-
06
Mar-
07
Mar-
08
Mar-
09
Mar-
10
Mar-
11
Mar-
12
Mar-
13
Mar-
14
Mar-
15
Mar-
16
0
2
4
6
8
Mar-
06
Mar-
07
Mar-
08
Mar-
09
Mar-
10
Mar-
11
Mar-
12
Mar-
13
Mar-
14
Mar-
15
Mar-
16
2
3
4
5
Mar-
06
Mar-
07
Mar-
08
Mar-
09
Mar-
10
Mar-
11
Mar-
12
Mar-
13
Mar-
14
Mar-
15
Mar-
16
Source: Deutsche Bank
Source: Deutsche Bank
Source: Deutsche Bank
Figure 110: Korea: KT Corp Figure 111: Malaysia: Maxis Figure 112: Telkom Malaysia
2
3
4
5
Mar-
06
Mar-
07
Mar-
08
Mar-
09
Mar-
10
Mar-
11
Mar-
12
Mar-
13
Mar-
14
Mar-
15
Mar-
16
0
5
10
15
20
Mar-
06
Mar-
07
Mar-
08
Mar-
09
Mar-
10
Mar-
11
Mar-
12
Mar-
13
Mar-
14
Mar-
15
Mar-
16
0
2
4
6
8
10
Mar-
06
Mar-
07
Mar-
08
Mar-
09
Mar-
10
Mar-
11
Mar-
12
Mar-
13
Mar-
14
Mar-
15
Mar-
16
Source: Deutsche Bank
Source: Deutsche Bank
Source: Deutsche Bank
Figure 113: Malaysia: Axiata Figure 114: Philippines: Globe Figure 115: Philippines: PLDT
0
5
10
15
Mar-
06
Mar-
07
Mar-
08
Mar-
09
Mar-
10
Mar-
11
Mar-
12
Mar-
13
Mar-
14
Mar-
15
Mar-
16
0
2
4
6
8
10
Mar-
06
Mar-
07
Mar-
08
Mar-
09
Mar-
10
Mar-
11
Mar-
12
Mar-
13
Mar-
14
Mar-
15
Mar-
16
0
2
4
6
8
10
12
Mar-
06
Mar-
07
Mar-
08
Mar-
09
Mar-
10
Mar-
11
Mar-
12
Mar-
13
Mar-
14
Mar-
15
Mar-
16
Source: Deutsche Bank
Source: Deutsche Bank
Source: Deutsche Bank
31 March 2016
Telecommunications
Asia-Pac Telecom tracker
Page 24 Deutsche Bank AG/Hong Kong
Figure 116: Singapore: M1 Figure 117: Singapore Telecom Figure 118: Singapore: Starhub
0
2
4
6
8
10
12
Mar-
06
Mar-
07
Mar-
08
Mar-
09
Mar-
10
Mar-
11
Mar-
12
Mar-
13
Mar-
14
Mar-
15
Mar-
16
0
5
10
15
20
Mar-
06
Mar-
07
Mar-
08
Mar-
09
Mar-
10
Mar-
11
Mar-
12
Mar-
13
Mar-
14
Mar-
15
Mar-
16
0
2
4
6
8
10
12
Mar-
06
Mar-
07
Mar-
08
Mar-
09
Mar-
10
Mar-
11
Mar-
12
Mar-
13
Mar-
14
Mar-
15
Mar-
16
Source: Deutsche Bank
Source: Deutsche Bank
Source: Deutsche Bank
Figure 119: Taiwan: CHT Figure 120: Taiwan: FET Figure 121: Taiwan Mobile
0
2
4
6
8
10
12
Mar-
06
Mar-
07
Mar-
08
Mar-
09
Mar-
10
Mar-
11
Mar-
12
Mar-
13
Mar-
14
Mar-
15
Mar-
16
0
2
4
6
8
10
12
Mar-
06
Mar-
07
Mar-
08
Mar-
09
Mar-
10
Mar-
11
Mar-
12
Mar-
13
Mar-
14
Mar-
15
Mar-
16
0
5
10
15
20
Mar-
06
Mar-
07
Mar-
08
Mar-
09
Mar-
10
Mar-
11
Mar-
12
Mar-
13
Mar-
14
Mar-
15
Mar-
16
Source: Deutsche Bank
Source: Deutsche Bank
Source: Deutsche Bank
Figure 122: Thailand: Jasmine Figure 123: Thailand: DTAC Figure 124: Thailand: AIS
0
5
10
15
Mar-
06
Mar-
07
Mar-
08
Mar-
09
Mar-
10
Mar-
11
Mar-
12
Mar-
13
Mar-
14
Mar-
15
Mar-
16
0
5
10
15
Mar-…
Mar-…
Mar-…
Mar-…
Mar-…
Mar-…
Mar-…
Mar-…
Mar-…
Mar-…
Mar-…
0
5
10
15
Mar-
06
Mar-
07
Mar-
08
Mar-
09
Mar-
10
Mar-
11
Mar-
12
Mar-
13
Mar-
14
Mar-
15
Mar-
16
Source: Deutsche Bank
Source: Deutsche Bank
Source: Deutsche Bank
Asia
-Pac T
ele
com
tracker
Tele
co
mm
un
icatio
ns
31
Marc
h 2
01
6
Deu
tsch
e B
an
k A
G/H
on
g K
on
g
Pag
e 2
5
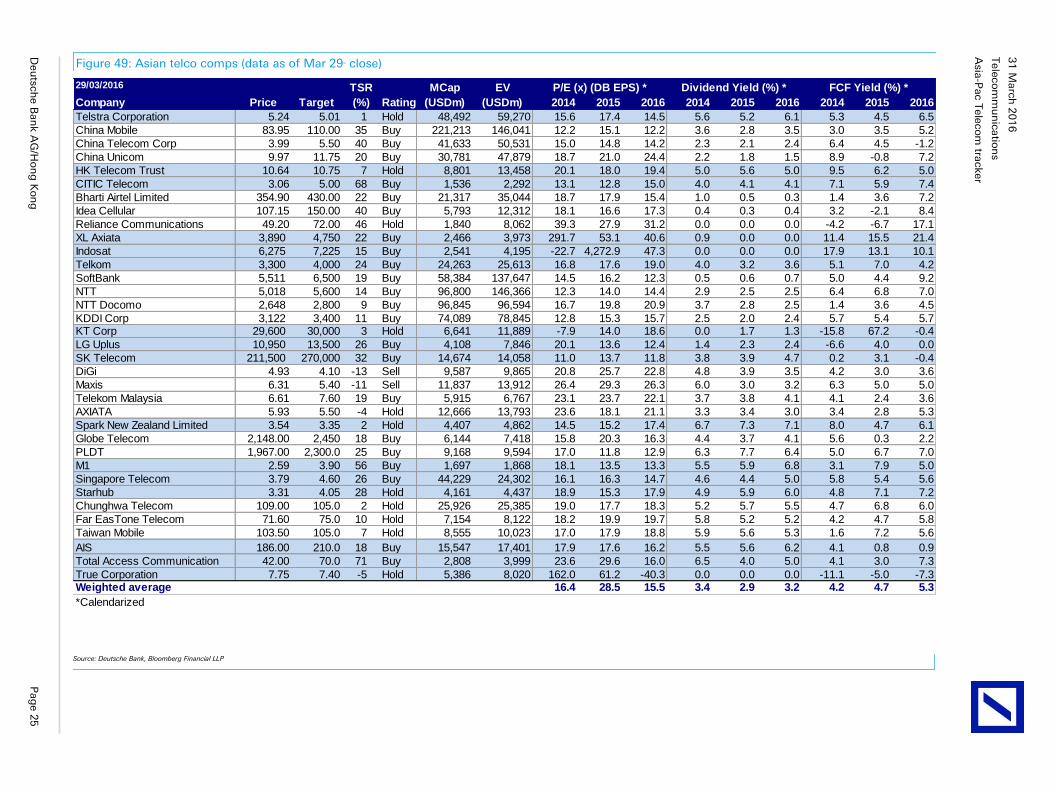
Figure 49: Asian telco comps (data as of Mar 29th close)
29/03/2016 TSR MCap EV
Company Price Target (%) Rating (USDm) (USDm) 2014 2015 2016 2014 2015 2016 2014 2015 2016
Telstra Corporation 5.24 5.01 1 Hold 48,492 59,270 15.6 17.4 14.5 5.6 5.2 6.1 5.3 4.5 6.5
China Mobile 83.95 110.00 35 Buy 221,213 146,041 12.2 15.1 12.2 3.6 2.8 3.5 3.0 3.5 5.2
China Telecom Corp 3.99 5.50 40 Buy 41,633 50,531 15.0 14.8 14.2 2.3 2.1 2.4 6.4 4.5 -1.2
China Unicom 9.97 11.75 20 Buy 30,781 47,879 18.7 21.0 24.4 2.2 1.8 1.5 8.9 -0.8 7.2
HK Telecom Trust 10.64 10.75 7 Hold 8,801 13,458 20.1 18.0 19.4 5.0 5.6 5.0 9.5 6.2 5.0
CITIC Telecom 3.06 5.00 68 Buy 1,536 2,292 13.1 12.8 15.0 4.0 4.1 4.1 7.1 5.9 7.4
Bharti Airtel Limited 354.90 430.00 22 Buy 21,317 35,044 18.7 17.9 15.4 1.0 0.5 0.3 1.4 3.6 7.2
Idea Cellular 107.15 150.00 40 Buy 5,793 12,312 18.1 16.6 17.3 0.4 0.3 0.4 3.2 -2.1 8.4
Reliance Communications 49.20 72.00 46 Hold 1,840 8,062 39.3 27.9 31.2 0.0 0.0 0.0 -4.2 -6.7 17.1
XL Axiata 3,890 4,750 22 Buy 2,466 3,973 291.7 53.1 40.6 0.9 0.0 0.0 11.4 15.5 21.4
Indosat 6,275 7,225 15 Buy 2,541 4,195 -22.7 4,272.9 47.3 0.0 0.0 0.0 17.9 13.1 10.1
Telkom 3,300 4,000 24 Buy 24,263 25,613 16.8 17.6 19.0 4.0 3.2 3.6 5.1 7.0 4.2
SoftBank 5,511 6,500 19 Buy 58,384 137,647 14.5 16.2 12.3 0.5 0.6 0.7 5.0 4.4 9.2
NTT 5,018 5,600 14 Buy 96,800 146,366 12.3 14.0 14.4 2.9 2.5 2.5 6.4 6.8 7.0
NTT Docomo 2,648 2,800 9 Buy 96,845 96,594 16.7 19.8 20.9 3.7 2.8 2.5 1.4 3.6 4.5
KDDI Corp 3,122 3,400 11 Buy 74,089 78,845 12.8 15.3 15.7 2.5 2.0 2.4 5.7 5.4 5.7KT Corp 29,600 30,000 3 Hold 6,641 11,889 -7.9 14.0 18.6 0.0 1.7 1.3 -15.8 67.2 -0.4
LG Uplus 10,950 13,500 26 Buy 4,108 7,846 20.1 13.6 12.4 1.4 2.3 2.4 -6.6 4.0 0.0
SK Telecom 211,500 270,000 32 Buy 14,674 14,058 11.0 13.7 11.8 3.8 3.9 4.7 0.2 3.1 -0.4
DiGi 4.93 4.10 -13 Sell 9,587 9,865 20.8 25.7 22.8 4.8 3.9 3.5 4.2 3.0 3.6
Maxis 6.31 5.40 -11 Sell 11,837 13,912 26.4 29.3 26.3 6.0 3.0 3.2 6.3 5.0 5.0
Telekom Malaysia 6.61 7.60 19 Buy 5,915 6,767 23.1 23.7 22.1 3.7 3.8 4.1 4.1 2.4 3.6
AXIATA 5.93 5.50 -4 Hold 12,666 13,793 23.6 18.1 21.1 3.3 3.4 3.0 3.4 2.8 5.3
Spark New Zealand Limited 3.54 3.35 2 Hold 4,407 4,862 14.5 15.2 17.4 6.7 7.3 7.1 8.0 4.7 6.1
Globe Telecom 2,148.00 2,450 18 Buy 6,144 7,418 15.8 20.3 16.3 4.4 3.7 4.1 5.6 0.3 2.2
PLDT 1,967.00 2,300.0 25 Buy 9,168 9,594 17.0 11.8 12.9 6.3 7.7 6.4 5.0 6.7 7.0
M1 2.59 3.90 56 Buy 1,697 1,868 18.1 13.5 13.3 5.5 5.9 6.8 3.1 7.9 5.0
Singapore Telecom 3.79 4.60 26 Buy 44,229 24,302 16.1 16.3 14.7 4.6 4.4 5.0 5.8 5.4 5.6
Starhub 3.31 4.05 28 Hold 4,161 4,437 18.9 15.3 17.9 4.9 5.9 6.0 4.8 7.1 7.2
Chunghwa Telecom 109.00 105.0 2 Hold 25,926 25,385 19.0 17.7 18.3 5.2 5.7 5.5 4.7 6.8 6.0
Far EasTone Telecom 71.60 75.0 10 Hold 7,154 8,122 18.2 19.9 19.7 5.8 5.2 5.2 4.2 4.7 5.8
Taiwan Mobile 103.50 105.0 7 Hold 8,555 10,023 17.0 17.9 18.8 5.9 5.6 5.3 1.6 7.2 5.6
AIS 186.00 210.0 18 Buy 15,547 17,401 17.9 17.6 16.2 5.5 5.6 6.2 4.1 0.8 0.9
Total Access Communication 42.00 70.0 71 Buy 2,808 3,999 23.6 29.6 16.0 6.5 4.0 5.0 4.1 3.0 7.3
True Corporation 7.75 7.40 -5 Hold 5,386 8,020 162.0 61.2 -40.3 0.0 0.0 0.0 -11.1 -5.0 -7.3Weighted average 16.4 28.5 15.5 3.4 2.9 3.2 4.2 4.7 5.3
*Calendarized
P/E (x) (DB EPS) * Dividend Yield (%) * FCF Yield (%) *
Source: Deutsche Bank, Bloomberg Financial LLP
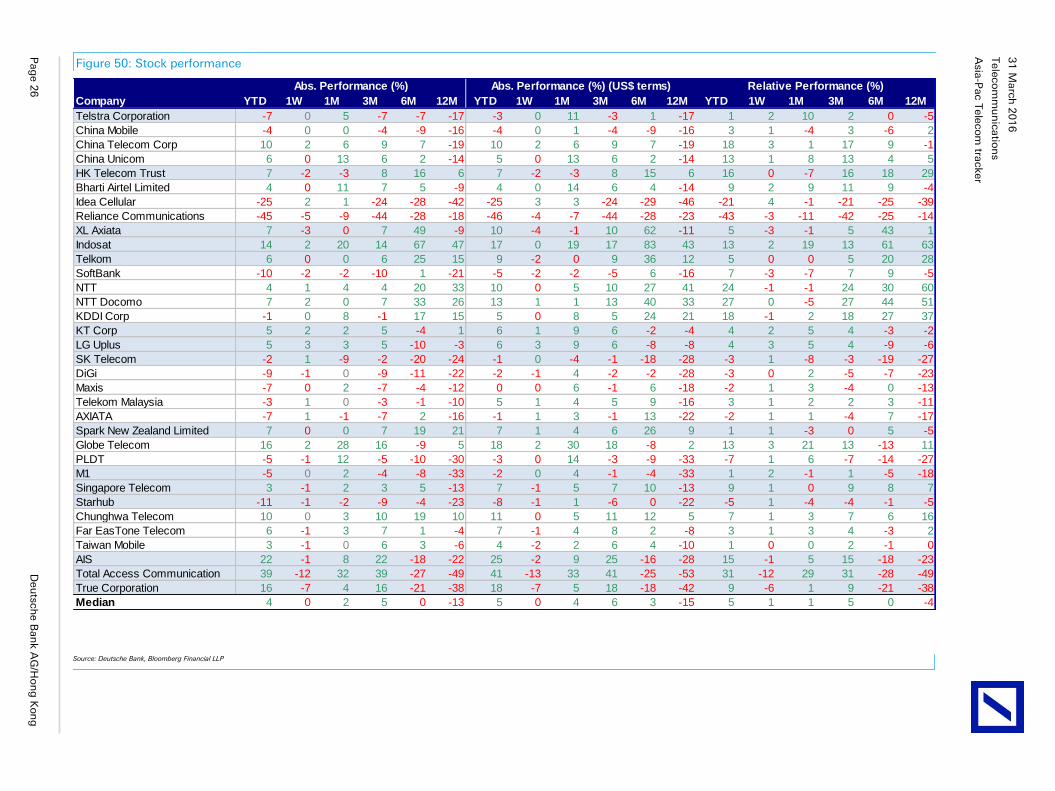
Asia
-Pac T
ele
com
tracker
Tele
co
mm
un
icatio
ns
31
Marc
h 2
01
6
Pag
e 2
6
Deu
tsch
e B
an
k A
G/H
on
g K
on
g
Figure 50: Stock performance
Company YTD 1W 1M 3M 6M 12M YTD 1W 1M 3M 6M 12M YTD 1W 1M 3M 6M 12M
Telstra Corporation -7 0 5 -7 -7 -17 -3 0 11 -3 1 -17 1 2 10 2 0 -5
China Mobile -4 0 0 -4 -9 -16 -4 0 1 -4 -9 -16 3 1 -4 3 -6 2
China Telecom Corp 10 2 6 9 7 -19 10 2 6 9 7 -19 18 3 1 17 9 -1
China Unicom 6 0 13 6 2 -14 5 0 13 6 2 -14 13 1 8 13 4 5
HK Telecom Trust 7 -2 -3 8 16 6 7 -2 -3 8 15 6 16 0 -7 16 18 29
Bharti Airtel Limited 4 0 11 7 5 -9 4 0 14 6 4 -14 9 2 9 11 9 -4
Idea Cellular -25 2 1 -24 -28 -42 -25 3 3 -24 -29 -46 -21 4 -1 -21 -25 -39
Reliance Communications -45 -5 -9 -44 -28 -18 -46 -4 -7 -44 -28 -23 -43 -3 -11 -42 -25 -14
XL Axiata 7 -3 0 7 49 -9 10 -4 -1 10 62 -11 5 -3 -1 5 43 1
Indosat 14 2 20 14 67 47 17 0 19 17 83 43 13 2 19 13 61 63
Telkom 6 0 0 6 25 15 9 -2 0 9 36 12 5 0 0 5 20 28
SoftBank -10 -2 -2 -10 1 -21 -5 -2 -2 -5 6 -16 7 -3 -7 7 9 -5
NTT 4 1 4 4 20 33 10 0 5 10 27 41 24 -1 -1 24 30 60
NTT Docomo 7 2 0 7 33 26 13 1 1 13 40 33 27 0 -5 27 44 51
KDDI Corp -1 0 8 -1 17 15 5 0 8 5 24 21 18 -1 2 18 27 37
KT Corp 5 2 2 5 -4 1 6 1 9 6 -2 -4 4 2 5 4 -3 -2
LG Uplus 5 3 3 5 -10 -3 6 3 9 6 -8 -8 4 3 5 4 -9 -6
SK Telecom -2 1 -9 -2 -20 -24 -1 0 -4 -1 -18 -28 -3 1 -8 -3 -19 -27
DiGi -9 -1 0 -9 -11 -22 -2 -1 4 -2 -2 -28 -3 0 2 -5 -7 -23
Maxis -7 0 2 -7 -4 -12 0 0 6 -1 6 -18 -2 1 3 -4 0 -13
Telekom Malaysia -3 1 0 -3 -1 -10 5 1 4 5 9 -16 3 1 2 2 3 -11
AXIATA -7 1 -1 -7 2 -16 -1 1 3 -1 13 -22 -2 1 1 -4 7 -17
Spark New Zealand Limited 7 0 0 7 19 21 7 1 4 6 26 9 1 1 -3 0 5 -5
Globe Telecom 16 2 28 16 -9 5 18 2 30 18 -8 2 13 3 21 13 -13 11
PLDT -5 -1 12 -5 -10 -30 -3 0 14 -3 -9 -33 -7 1 6 -7 -14 -27
M1 -5 0 2 -4 -8 -33 -2 0 4 -1 -4 -33 1 2 -1 1 -5 -18
Singapore Telecom 3 -1 2 3 5 -13 7 -1 5 7 10 -13 9 1 0 9 8 7
Starhub -11 -1 -2 -9 -4 -23 -8 -1 1 -6 0 -22 -5 1 -4 -4 -1 -5
Chunghwa Telecom 10 0 3 10 19 10 11 0 5 11 12 5 7 1 3 7 6 16
Far EasTone Telecom 6 -1 3 7 1 -4 7 -1 4 8 2 -8 3 1 3 4 -3 2
Taiwan Mobile 3 -1 0 6 3 -6 4 -2 2 6 4 -10 1 0 0 2 -1 0
AIS 22 -1 8 22 -18 -22 25 -2 9 25 -16 -28 15 -1 5 15 -18 -23
Total Access Communication 39 -12 32 39 -27 -49 41 -13 33 41 -25 -53 31 -12 29 31 -28 -49
True Corporation 16 -7 4 16 -21 -38 18 -7 5 18 -18 -42 9 -6 1 9 -21 -38
Median 4 0 2 5 0 -13 5 0 4 6 3 -15 5 1 1 5 0 -4
Abs. Performance (%) Abs. Performance (%) (US$ terms) Relative Performance (%)
Source: Deutsche Bank, Bloomberg Financial LLP

31 March 2016
Telecommunications
Asia-Pac Telecom tracker
Deutsche Bank AG/Hong Kong Page 27
Appendix 1
Important Disclosures
Additional information available upon request
*Prices are current as of the end of the previous trading session unless otherwise indicated and are sourced from local exchanges via Reuters, Bloomberg and other vendors . Other information is sourced from Deutsche Bank, subject companies, and other sources. For disclosures pertaining to recommendations or estimates made on securities other than the primary subject of this research, please see the most recently published company report or visit our global disclosure look-up page on our website at http://gm.db.com/ger/disclosure/DisclosureDirectory.eqsr
Analyst Certification
The views expressed in this report accurately reflect the personal views of the undersigned lead analyst about the subject issuers and the securities of those issuers. In addition, the undersigned lead analyst has not and will not receive any compensation for providing a specific recommendation or view in this report. Peter Milliken
Equity rating key Equity rating dispersion and banking relationships
Buy: Based on a current 12- month view of total share-holder return (TSR = percentage change in share price from current price to projected target price plus pro-jected dividend yield ) , we recommend that investors buy the stock.
Sell: Based on a current 12-month view of total share-holder return, we recommend that investors sell the stock
Hold: We take a neutral view on the stock 12-months out and, based on this time horizon, do not recommend either a Buy or Sell.
Newly issued research recommendations and target prices supersede previously published research.
54 %
35 %
11 %19 %16 % 17 %
050
100150200250300350400450500
Buy Hold Sell
Asia-Pacific Universe
Companies Covered Cos. w/ Banking Relationship
Regulatory Disclosures
1.Important Additional Conflict Disclosures
Aside from within this report, important conflict disclosures can also be found at https://gm.db.com/equities under the
"Disclosures Lookup" and "Legal" tabs. Investors are strongly encouraged to review this information before investing.
2.Short-Term Trade Ideas
Deutsche Bank equity research analysts sometimes have shorter-term trade ideas (known as SOLAR ideas) that are
consistent or inconsistent with Deutsche Bank's existing longer term ratings. These trade ideas can be found at the
SOLAR link at http://gm.db.com.
31 March 2016
Telecommunications
Asia-Pac Telecom tracker
Page 28 Deutsche Bank AG/Hong Kong
Additional Information
The information and opinions in this report were prepared by Deutsche Bank AG or one of its affiliates (collectively
"Deutsche Bank"). Though the information herein is believed to be reliable and has been obtained from public sources
believed to be reliable, Deutsche Bank makes no representation as to its accuracy or completeness.
If you use the services of Deutsche Bank in connection with a purchase or sale of a security that is discussed in this
report, or is included or discussed in another communication (oral or written) from a Deutsche Bank analyst, Deutsche
Bank may act as principal for its own account or as agent for another person.
Deutsche Bank may consider this report in deciding to trade as principal. It may also engage in transactions, for its own
account or with customers, in a manner inconsistent with the views taken in this research report. Others within
Deutsche Bank, including strategists, sales staff and other analysts, may take views that are inconsistent with those
taken in this research report. Deutsche Bank issues a variety of research products, including fundamental analysis,
equity-linked analysis, quantitative analysis and trade ideas. Recommendations contained in one type of communication
may differ from recommendations contained in others, whether as a result of differing time horizons, methodologies or
otherwise. Deutsche Bank and/or its affiliates may also be holding debt securities of the issuers it writes on.
Analysts are paid in part based on the profitability of Deutsche Bank AG and its affiliates, which includes investment
banking revenues.
Opinions, estimates and projections constitute the current judgment of the author as of the date of this report. They do
not necessarily reflect the opinions of Deutsche Bank and are subject to change without notice. Deutsche Bank has no
obligation to update, modify or amend this report or to otherwise notify a recipient thereof if any opinion, forecast or
estimate contained herein changes or subsequently becomes inaccurate. This report is provided for informational
purposes only. It is not an offer or a solicitation of an offer to buy or sell any financial instruments or to participate in any
particular trading strategy. Target prices are inherently imprecise and a product of the analyst’s judgment. The financial
instruments discussed in this report may not be suitable for all investors and investors must make their own informed
investment decisions. Prices and availability of financial instruments are subject to change without notice and
investment transactions can lead to losses as a result of price fluctuations and other factors. If a financial instrument is
denominated in a currency other than an investor's currency, a change in exchange rates may adversely affect the
investment. Past performance is not necessarily indicative of future results. Unless otherwise indicated, prices are
current as of the end of the previous trading session, and are sourced from local exchanges via Reuters, Bloomberg and
other vendors. Data is sourced from Deutsche Bank, subject companies, and in some cases, other parties.
Macroeconomic fluctuations often account for most of the risks associated with exposures to instruments that promise
to pay fixed or variable interest rates. For an investor who is long fixed rate instruments (thus receiving these cash
flows), increases in interest rates naturally lift the discount factors applied to the expected cash flows and thus cause a
loss. The longer the maturity of a certain cash flow and the higher the move in the discount factor, the higher will be the
loss. Upside surprises in inflation, fiscal funding needs, and FX depreciation rates are among the most common adverse
macroeconomic shocks to receivers. But counterparty exposure, issuer creditworthiness, client segmentation, regulation
(including changes in assets holding limits for different types of investors), changes in tax policies, currency
convertibility (which may constrain currency conversion, repatriation of profits and/or the liquidation of positions), and
settlement issues related to local clearing houses are also important risk factors to be considered. The sensitivity of fixed
income instruments to macroeconomic shocks may be mitigated by indexing the contracted cash flows to inflation, to
FX depreciation, or to specified interest rates – these are common in emerging markets. It is important to note that the
index fixings may -- by construction -- lag or mis-measure the actual move in the underlying variables they are intended
to track. The choice of the proper fixing (or metric) is particularly important in swaps markets, where floating coupon
rates (i.e., coupons indexed to a typically short-dated interest rate reference index) are exchanged for fixed coupons. It is
also important to acknowledge that funding in a currency that differs from the currency in which coupons are
denominated carries FX risk. Naturally, options on swaps (swaptions) also bear the risks typical to options in addition to
the risks related to rates movements.
31 March 2016
Telecommunications
Asia-Pac Telecom tracker
Deutsche Bank AG/Hong Kong Page 29
Derivative transactions involve numerous risks including, among others, market, counterparty default and illiquidity risk.
The appropriateness or otherwise of these products for use by investors is dependent on the investors' own
circumstances including their tax position, their regulatory environment and the nature of their other assets and
liabilities, and as such, investors should take expert legal and financial advice before entering into any transaction similar
to or inspired by the contents of this publication. The risk of loss in futures trading and options, foreign or domestic, can
be substantial. As a result of the high degree of leverage obtainable in futures and options trading, losses may be
incurred that are greater than the amount of funds initially deposited. Trading in options involves risk and is not suitable
for all investors. Prior to buying or selling an option investors must review the "Characteristics and Risks of Standardized
Options”, at http://www.optionsclearing.com/about/publications/character-risks.jsp. If you are unable to access the
website please contact your Deutsche Bank representative for a copy of this important document.
Participants in foreign exchange transactions may incur risks arising from several factors, including the following: ( i)
exchange rates can be volatile and are subject to large fluctuations; ( ii) the value of currencies may be affected by
numerous market factors, including world and national economic, political and regulatory events, events in equity and
debt markets and changes in interest rates; and (iii) currencies may be subject to devaluation or government imposed
exchange controls which could affect the value of the currency. Investors in securities such as ADRs, whose values are
affected by the currency of an underlying security, effectively assume currency risk.
Unless governing law provides otherwise, all transactions should be executed through the Deutsche Bank entity in the
investor's home jurisdiction.
United States: Approved and/or distributed by Deutsche Bank Securities Incorporated, a member of FINRA, NFA and
SIPC. Analysts employed by non-US affiliates may not be associated persons of Deutsche Bank Securities Incorporated
and therefore not subject to FINRA regulations concerning communications with subject companies, public appearances
and securities held by analysts.
Germany: Approved and/or distributed by Deutsche Bank AG, a joint stock corporation with limited liability incorporated
in the Federal Republic of Germany with its principal office in Frankfurt am Main. Deutsche Bank AG is authorized under
German Banking Law (competent authority: European Central Bank) and is subject to supervision by the European
Central Bank and by BaFin, Germany’s Federal Financial Supervisory Authority.
United Kingdom: Approved and/or distributed by Deutsche Bank AG acting through its London Branch at Winchester
House, 1 Great Winchester Street, London EC2N 2DB. Deutsche Bank AG in the United Kingdom is authorised by the
Prudential Regulation Authority and is subject to limited regulation by the Prudential Regulation Authority and Financial
Conduct Authority. Details about the extent of our authorisation and regulation are available on request.
Hong Kong: Distributed by Deutsche Bank AG, Hong Kong Branch.
India: Prepared by Deutsche Equities Private Ltd, which is registered by the Securities and Exchange Board of India
(SEBI) as a stock broker. Research Analyst SEBI Registration Number is INH000001741. DEIPL may have received
administrative warnings from the SEBI for breaches of Indian regulations.
Japan: Approved and/or distributed by Deutsche Securities Inc.(DSI). Registration number - Registered as a financial
instruments dealer by the Head of the Kanto Local Finance Bureau (Kinsho) No. 117. Member of associations: JSDA,
Type II Financial Instruments Firms Association and The Financial Futures Association of Japan. Commissions and risks
involved in stock transactions - for stock transactions, we charge stock commissions and consumption tax by
multiplying the transaction amount by the commission rate agreed with each customer. Stock transactions can lead to
losses as a result of share price fluctuations and other factors. Transactions in foreign stocks can lead to additional
losses stemming from foreign exchange fluctuations. We may also charge commissions and fees for certain categories
of investment advice, products and services. Recommended investment strategies, products and services carry the risk
of losses to principal and other losses as a result of changes in market and/or economic trends, and/or fluctuations in
market value. Before deciding on the purchase of financial products and/or services, customers should carefully read the
relevant disclosures, prospectuses and other documentation. "Moody's", "Standard & Poor's", and "Fitch" mentioned in
this report are not registered credit rating agencies in Japan unless Japan or "Nippon" is specifically designated in the
name of the entity. Reports on Japanese listed companies not written by analysts of DSI are written by Deutsche Bank
31 March 2016
Telecommunications
Asia-Pac Telecom tracker
Page 30 Deutsche Bank AG/Hong Kong
Group's analysts with the coverage companies specified by DSI. Some of the foreign securities stated on this report are
not disclosed according to the Financial Instruments and Exchange Law of Japan.
Korea: Distributed by Deutsche Securities Korea Co.
South Africa: Deutsche Bank AG Johannesburg is incorporated in the Federal Republic of Germany (Branch Register
Number in South Africa: 1998/003298/10).
Singapore: by Deutsche Bank AG, Singapore Branch or Deutsche Securities Asia Limited, Singapore Branch (One Raffles
Quay #18-00 South Tower Singapore 048583, +65 6423 8001), which may be contacted in respect of any matters
arising from, or in connection with, this report. Where this report is issued or promulgated in Singapore to a person who
is not an accredited investor, expert investor or institutional investor (as defined in the applicable Singapore laws and
regulations), they accept legal responsibility to such person for its contents.
Qatar: Deutsche Bank AG in the Qatar Financial Centre (registered no. 00032) is regulated by the Qatar Financial Centre
Regulatory Authority. Deutsche Bank AG - QFC Branch may only undertake the financial services activities that fall
within the scope of its existing QFCRA license. Principal place of business in the QFC: Qatar Financial Centre, Tower,
West Bay, Level 5, PO Box 14928, Doha, Qatar. This information has been distributed by Deutsche Bank AG. Related
financial products or services are only available to Business Customers, as defined by the Qatar Financial Centre
Regulatory Authority.
Russia: This information, interpretation and opinions submitted herein are not in the context of, and do not constitute,
any appraisal or evaluation activity requiring a license in the Russian Federation.
Kingdom of Saudi Arabia: Deutsche Securities Saudi Arabia LLC Company, (registered no. 07073-37) is regulated by the
Capital Market Authority. Deutsche Securities Saudi Arabia may only undertake the financial services activities that fall
within the scope of its existing CMA license. Principal place of business in Saudi Arabia: King Fahad Road, Al Olaya
District, P.O. Box 301809, Faisaliah Tower - 17th Floor, 11372 Riyadh, Saudi Arabia.
United Arab Emirates: Deutsche Bank AG in the Dubai International Financial Centre (registered no. 00045) is regulated
by the Dubai Financial Services Authority. Deutsche Bank AG - DIFC Branch may only undertake the financial services
activities that fall within the scope of its existing DFSA license. Principal place of business in the DIFC: Dubai
International Financial Centre, The Gate Village, Building 5, PO Box 504902, Dubai, U.A.E. This information has been
distributed by Deutsche Bank AG. Related financial products or services are only available to Professional Clients, as
defined by the Dubai Financial Services Authority.
Australia: Retail clients should obtain a copy of a Product Disclosure Statement (PDS) relating to any financial product
referred to in this report and consider the PDS before making any decision about whether to acquire the product. Please
refer to Australian specific research disclosures and related information at
https://australia.db.com/australia/content/research-information.html
Australia and New Zealand: This research, and any access to it, is intended only for "wholesale clients" within the
meaning of the Australian Corporations Act and New Zealand Financial Advisors Act respectively.
Additional information relative to securities, other financial products or issuers discussed in this report is available upon
request. This report may not be reproduced, distributed or published by any person for any purpose without Deutsche
Bank's prior written consent. Please cite source when quoting.
Copyright © 2016 Deutsche Bank AG
David Folkerts-Landau Chief Economist and Global Head of Research
Raj Hindocha Global Chief Operating Officer
Research
Marcel Cassard Global Head
FICC Research & Global Macro Economics
Steve Pollard Global Head
Equity Research
Michael Spencer Regional Head
Asia Pacific Research
Ralf Hoffmann Regional Head
Deutsche Bank Research, Germany
Andreas Neubauer Regional Head
Equity Research, Germany
International locations
Deutsche Bank AG
Deutsche Bank Place
Level 16
Corner of Hunter & Phillip Streets
Sydney, NSW 2000
Australia
Tel: (61) 2 8258 1234
Deutsche Bank AG
Große Gallusstraße 10-14
60272 Frankfurt am Main
Germany
Tel: (49) 69 910 00
Deutsche Bank AG
Filiale Hongkong
International Commerce Centre,
1 Austin Road West,Kowloon,
Hong Kong
Tel: (852) 2203 8888
Deutsche Securities Inc.
2-11-1 Nagatacho
Sanno Park Tower
Chiyoda-ku, Tokyo 100-6171
Japan
Tel: (81) 3 5156 6770
Deutsche Bank AG London
1 Great Winchester Street
London EC2N 2EQ
United Kingdom
Tel: (44) 20 7545 8000
Deutsche Bank Securities Inc.
60 Wall Street
New York, NY 10005
United States of America
Tel: (1) 212 250 2500